Article

Protection Effect and Vacancy of the Ecological Protection Redline: A Case Study in Guangdong–Hong Kong–Macao Greater Bay Area, China

1
The Ministry of Environmental Ecology, South China Institute of Environmental Sciences, Guangzhou 510655, China
2
National Key Laboratory of Urban Ecological Environment Simulation and Protection, Guangzhou 510655, China
3
Department of Environmental Science and Policy, University of California, Davis, CA 95616, USA
*
Author to whom correspondence should be addressed.
Remote Sens. 2021, 13(24), 5171; https://doi.org/10.3390/rs13245171
Submission received: 12 November 2021 / Revised: 16 December 2021 / Accepted: 17 December 2021 / Published: 20 December 2021

Abstract

:
The Ecological Protection Redline (EPR) is an innovative measure implemented in China to maintain the structural stability and functional security of the ecosystem. By prohibiting large-scale urban and industrial construction activities, EPR is regarded as the “lifeline” to ensure national ecological security. It is of great practical significance to scientifically evaluate the protection effect of EPR and identify the protection vacancies. However, current research has focused only on the protection effects of the EPR on ecosystem services (ESs), and the protection effect of the EPR on ecological connectivity remains poorly understood. Based on an evaluation of ES importance, the circuit model, and hotspot analysis, this paper identified the ecological security pattern in Guangdong–Hong Kong–Macao Greater Bay Area (GBA), analyzed the role of EPR in maintaining ES and ecological connectivity, and identified protection gaps. The results were as follows: (1) The ecological sources were mainly distributed in mountainous areas of the GBA. The ecological sources and ecological corridors constitute a circular ecological shelter surrounding the urban agglomeration of the GBA. (2) The EPR effectively protected water conservation, soil conservation, and biodiversity maintenance services, but the protection efficiency of carbon sequestration service and ecological connectivity were low. In particularly, EPR failed to continuously protect regional large-scale ecological corridors and some important stepping stones. (3) The protection gaps of carbon sequestration service and ecological connectivity in the study area reached 1099.80 km2 and 2175.77 km2, respectively, mainly distributed in Qingyuan, Yunfu, and Huizhou. In future EPR adjustments, important areas for carbon sequestration service and ecological connectivity maintenance should be included. This study provides a comprehensive understanding of the protection effects of EPR on ecological structure and function, and it has produced significant insights into improvements of the EPR policy. In addition, this paper proposes that the scope of resistance surface should be extended, which would improve the rationality of the ecological corridor simulation.

1. Introduction

Rapid urbanization has introduced serious problems, such as fragmentation of landscapes and biodiversity loss, which have directly affected regional landscape patterns and sustainable development [1]. Under the threats to ecological security caused by rapid urbanization, the Chinese government proposed carrying out delineation of the EPR in 2013, and in 2015, the EPR policy was incorporated into the newly revised “Environmental Protection Law”. In 2018, the designation of the EPR was initially completed, and detailed adjustments are currently in progress, which are expected to be implemented within the next two years. EPR refers to protected areas designated by the government, including areas that provide important ecosystem services, and ecologically sensitive or fragile areas. By prohibiting large-scale urban and industrial construction activities, EPR is regarded as the “lifeline” to ensure national ecological security [2]. Therefore, it is of great practical significance to study whether the EPR designated by the government truly guarantees the structural stability and functional safety of the ecosystem, and to identify whether there are protection vacancies.
Ecosystem services (ESs) are the benefits that human beings directly or indirectly receive from the ecosystem [3], which can reflect the ecosystem functions. Ecological connectivity refers to the degree to which the landscape facilitates or impedes movement among source patches, which is a vital element of ecological structure and crucial to ecological processes [4]. Current research focusing on the protective effects of EPR on one or more ESs (values) showed that EPR has protected ESs effectively [2,5,6,7]. However, these studies did not consider the effect of the EPR in maintaining ecological connectivity. With the deepening of the understanding of habitat fragmentation, the evaluation and optimization of ecological connectivity have attracted more and more attention. The effects and impacts of measures, projects, and policies on ecological connectivity have been studied, by using the methods of ecological corridor simulation model, landscape index, and morphological spatial pattern analysis (MSPA). Research showed that a wind power project resulted in an increase in the length of the ecological corridors and a decrease in corridor patency and landscape connectivity [8]. Hydrological connectivity was cut off due to an ecological restoration project [9], and the impact could be mitigated by optimizing the landscape configuration [10]. The protection effect of the basic ecological control line policy on ecological connectivity was analyzed by simulating ecological flow [11]. However, the protective effect of EPR on ecological connectivity remains unknown.
The ecological security pattern (ESP) can be used to evaluate the protective effects of the EPR on the structure and function of the ecosystem by evaluating whether the EPR protects key high-value ES areas (ecological sources) and important areas for connectivity (ecological corridors). Based on the optimization and allocation of key elements such as nodes, patches, and corridors, the ESP can maintain the integrity of landscape patterns and the continuity of ecological processes, thereby efficiently guaranteeing ecological security within a limited land area [12,13,14,15]. To date, research on ESP has developed the research paradigm of “source identification–resistance surface construction–corridor identification” [16,17]. Ecological source identification has evolved from the simple selection of natural reserves, natural scenic areas, and habitats for key species [18,19] to quantitatively evaluating the importance of various ecosystem services, ecological sensitivity, stability, connectivity, and so on [20,21]. The resistance surface reflects the migration difficulty among the ecological sources in different habitats [22,23]. Studies have shown that the protection of the surrounding landscape of the protected area is very important for promoting ecological processes [24]. However, current research has not considered the heterogeneity of the outer landscape when constructing the resistance surfaces, so the identified ecological corridors were all located in the study area, which must be improved in future ESP research. In terms of corridor simulations, as the shortcomings of the minimum cumulative resistance model (MCR) (which ignores the characteristics of the random walks of species) are increasingly recognized, the circuit theory model has gradually become the mainstream method for corridor simulations, improving the rationality of corridor simulation.
The Guangdong–Hong Kong–Macao Greater Bay Area (GBA) is the emerging fourth-largest bay area in the world. It is one of the areas with the fastest economic development and urbanization in China. From 2000 to 2020, construction land in the GBA has increased from 4435.45 to 8090.32 km2, triggering problems such as fragmentation of landscapes and degradation of ecological lands [25,26]. As the most stringent policy in China, EPR should assume the role of maintaining and improving the structural stability and functional safety of the ecosystem, especially in urban agglomeration areas with fragmented habitats. Unlike previous studies, the present study considered the connectivity of the surrounding landscape of the study area and extended the resistance surface to construct ESP, aiming to assess whether the EPR of the study area effectively protects the ecological structure and functions. In detail, this study was intended to: (1) identify ecological sources, ecological corridors, and regional ESP to provide a yardstick for assessment of EPR’s protection effect; (2) assess the extent to which the EPR policy maintains regional ecosystem services and ecological connectivity; and (3) identify whether there are other important areas that are not included in the EPR, including ecological sources that play key roles in maintaining ecosystem services and ecological corridors that are fundamental in the protection of connectivity, in order to provide a reference for implementing and adjusting the EPR policy.

2. Study Area and Data Sources

2.1. Study Area

The GBA (21°34′–24°34′N and 111°21′–115°23′E) is located on the southeast coast of China and includes the Hong Kong and Macau Special Administrative Regions, as well as Guangzhou, Shenzhen, Foshan, Dongguan, Zhuhai, Zhongshan, Jiangmen, Zhaoqing, and Huizhou, with a total land area of 56,000 km2. The topography of the GBA is generally high in the north and low in the south, with elevations ranging from −5 to 1595 m. The landform of the GBA includes delta plains, alluvial plains, low mountains, hills, and valleys, with a dense river network. The GBA is influenced by a tropical and subtropical monsoon climate, with good hydrothermal conditions. The average annual temperature in the GBA is 21.8 °C, annual relative humidity is 75–85%, and average annual rainfall is 1789.3 mm. Due to the southeast coastal typhoon, the rainfall gradually increases from northwest to southeast in the area.
The main research area of this paper is the Guangdong–Hong Kong–Macao Greater Bay Area. Since natural ecological processes can be connected through the internal corridors of the study area or through areas outside the study area, the resistance surface range had to be extended [27]. Therefore, this paper used the GBA as its research area for source identification and the 50 km buffer zone of the GBA as the study area for resistance surface construction and the identification of protection vacancy (Figure 1).

2.2. Data Sources

The data used in this article include: (1) 2020 land use data, obtained from the Resource and Environmental Science Data Center of the Chinese Academy of Sciences, having a spatial resolution of 100 m and providing 6 first-level categories and 22 secondary categories; (2) multi-year cumulative annual rainfall and rainfall erosivity data, provided by the China National Earth System Science Data Center; (3) multi-year potential evapotranspiration raster data, obtained from the National Aeronautics and Space Administration MOD16A2 data; (4) multi-year vegetation net primary productivity data, obtained from NASA mod17A3 products; (5) soil texture data, obtained from the Data Center of Science in Cold and Arid Regions China Soil Data Set; (6) elevation data, obtained from the Geospatial Data Cloud; (7) the scope of the EPR in Guangdong Province, obtained from the Department of Ecological Environment of Guangdong Province (the version submitted to the State Council in 2018); (8) nature reserve data of Hong Kong, including country parks, areas with special scientific value, nature conservation areas, and restricted areas, obtained from the “Hong Kong Biodiversity Strategy and Action Plan 2016–2021” (the ecological reserve in Macao was vectorized by using a map); (9) night-light data, obtained from the International Organization for Earth Observation.

3. Methodology

The overall technical roadmap of this study can be seen in Figure 2, which outlines three primary steps. The first step was to build an ecological security pattern, which was mainly realized by evaluating the importance of ES, constructing resistance surfaces, and employing the circuit theory method. The second step was to evaluate the protection effect of the EPR, by evaluating the protection contribution (proportion) and protection efficiency (ES and ecological flow per unit area) of the EPR to ES and ecological flow. The third step was to identify protection vacancies by identifying the hotspots of ES and ecological flow loss, as well as the key area for maintaining the patency of the large-scale corridors. In addition, suggestions for ecological protection of the GBA and the adjustment and implementation of the EPR were proposed.

3.1. Construction of Ecological Security Patterns

3.1.1. Identification of Ecological Sources

Ecological sources are key ecological patches that promote ecological processes and provide ecosystem services [28,29]. Four ecosystem services were selected for ecological source identification: water conservation, soil conservation, biodiversity maintenance, and carbon sequestration [30]. By using the natural break method, the ESs were divided into five levels, and the areas with the top 20% ESs were then superimposed to form the ecological sources [30].
Here, the water balance method was used to calculate the importance of water conservation service. The calculation formula is as follows [31]:
Y x = P x × ( 1 A E T x P x ) D x
where Y x represents the annual water conservation on cell x, the scale of one cell in this study was 100 m, P x represents the annual precipitation on cell x, A E T x represents the actual annual evapotranspiration of grid cell x, and D x j represents the surface runoff, which is obtained by multiplying the annual precipitation in cell x and the surface runoff coefficient of the corresponding ecosystem type.
The soil conservation module in the InVEST model was used to calculate the importance of water conservation service [31,32] according to the following equation:
A x = R x × K x × L S x × ( 1 C x × P x )
where A x is the amount of soil conservation, R x is the rainfall erosivity, K x is the soil erodibility, L S x is the slope length factor, C x is the vegetation coverage factor, and P x is the soil conservation measure factor.
The habitat quality module in the InVEST model was used to calculate the importance of biodiversity maintenance service according to the following equation [31]:
Q x , j = H j × ( 1 D x , j D x , j + k )
where Q x , j is the habitat quality of grid x in land use and land cover j, H j is the habitat suitability of habitat type j, D x , j is the habitat stress of habitat type j grid x level, and k is the half-saturation constant.
Since the carbon storage module in the InVEST model cannot describe the spatial differences of carbon sequestration service caused by meteorological factors (e.g., temperature, precipitation, and sunlight conditions) under the same land type, we used the average value of the vegetation net primary productivity (NPP) over many years in the study area to evaluate carbon sequestration service.

3.1.2. Construction of the Resistance Surface

In the process of species migration and diffusion, a certain amount of “resistance” needs to be traversed. By setting the minimum resistance value for diffusion from the ecological source to other landscape units, the accessibility and connectivity of each landscape unit to the ecological source can be evaluated [33]. The resistance surface reflects the degree of hindrance of species migration in the landscape, which is mainly affected by the heterogeneity of the landscape [22,34]. Based on the land-use type, we used night light data, terrain data, and distance from construction land to revise the resistance surface [27,35]. The revised resistance value is as follows:
R i = R i × ( 1 + N L i ( N L m a x N L m i n ) ) × S i × D i
where R i is the revised resistance value, R i is the resistance value of the land-use type to which grid i belongs, N L i is the night light index of grid i, N L m a x and N L m i n are the maximum and minimum night light indexes of the study area, S i is the slope resistance coefficient of grid i, and D i is the distance resistance coefficient of grid i. The resistance values and resistance coefficients are shown in the supplementary data.

3.1.3. Identification of Potential Ecological Corridors

Ecological corridors are connected carriers for the flow of matter and energies between ecological sources, which can enhance the connection and protection functions and provide an indispensable channel for species migration [16,36,37]. The circuit model was used to identify the ecological corridors in this paper. In the circuit model, the ecological sources were regarded as circuit nodes, and non-ecological land as resistors with different resistance values; the random flow of electrons in circuits was used to simulate the migration and diffusion processes of species in the landscape [38]. In this model, the current reflects the net migration probability of the wanderer through the corresponding node or path before reaching the target habitat [39]. Therefore, the ecological corridors identified by the circuit model are areas where the ecological processes are more likely to be realized, rather than the only channels with the least resistance. In circuit theory, the relationship between voltage, resistance, and current is expressed by Ohm’s law:
I = V R e f f
where I is the current passing through the conductor, V is the voltage measured across the conductor, and R e f f is the effective resistance of the conductor. In this study, the pairwise mode of the Circuitscape tool was used to calculate the current density. In the calculation, one of the ecological sources is arbitrarily connected to 1 A of power, and the other sources are grounded (set as the species that remain at the source and do not continue to spread). The resistance was then calculated iteratively for all the paired sources, and the current density map was generated after the calculation.

3.2. EPR’s Protective Effect on ES and Ecological Connectivity

The protection contribution of the EPR policy was studied by analyzing the protection rate of ES and the ecological flow (current) maintained in the EPR, and the protection efficiency of the EPR was analyzed by comparing the ES and ecological flow per unit area in the ecological source, the ecological corridor, and the EPR [7]. These works were realized by using the Overlap and Zonal statistics tools in ArcGIS 10.5. Under the one-country-two-systems policy, Hong Kong and Macau have not implemented the EPR policy, but they have also established similar policies. Hong Kong has established relatively strict regulations on protected areas (country parks, areas with special scientific value, natural conservation areas, and restricted areas), while Macau has implemented limited open management of the Cotai Nature Reserve, which we thus consider as EPR areas for research purposes.

3.3. Identification of Ecological Protection Vacancies

The ecological security pattern provides an ideal ecological protection model. Indeed, only areas delineated within the EPR have strict development restrictions, while areas outside the EPR are at risk of occupation and interference. However, bringing all ecological sources and ecological corridors into the EPR would significantly increase the scope of the EPR, which is not in line with the principle of realizing the optimal ecological protection effect within the minimum ecological land. Therefore, it is necessary to identify the most important areas outside the EPR for ES and ecological connectivity maintenance. In this study, the protection vacancies for ES maintenance were identified as the ES loss hotspots caused by the occupation of the area outside the EPR, and the vacancies for ecological connectivity protection were identified as areas with ecological flow loss hotspots and important areas for maintaining the patency of the large-scale corridors [30].
Hotspot analysis has been widely used in socio-economic and ecological environmental assessments [40,41]. In this study, hotspot analysis was used to identify high-value clusters of ES and ecological flow losses. The ArcGIS platform provides a hotspot analysis tool based on the Getis-Ord G i * statistical index (Z score). When the Z score is a significantly positive number, the area is a high-value clustering area; if the Z score is a significantly negative number, the area is a low-value clustering area. When the Z score is 0, the spatial clustering feature is not significant. The calculation formula is as follows [42]:
G i * = j = 1 n w i j x i j X ¯ j = 1 n w i j [ ( n j = 1 n w i j 2 j = 1 n w i j ) 2 ] n 1 s
X ¯ = j = 1 n x j n
S = j = 1 n x j 2 n 1 ( X ¯ ) 2
where G i * represents the Z score, x j   is the attribute value of patch j, w i j is the spatial weight matrix between patch i and patch j, X ¯ represents the average value of all x j , S represents the value of all x j (standard deviation), and n is the total number of patches.

4. Results

4.1. Construction of Ecological Security Patterns

4.1.1. Identification of Ecological Sources

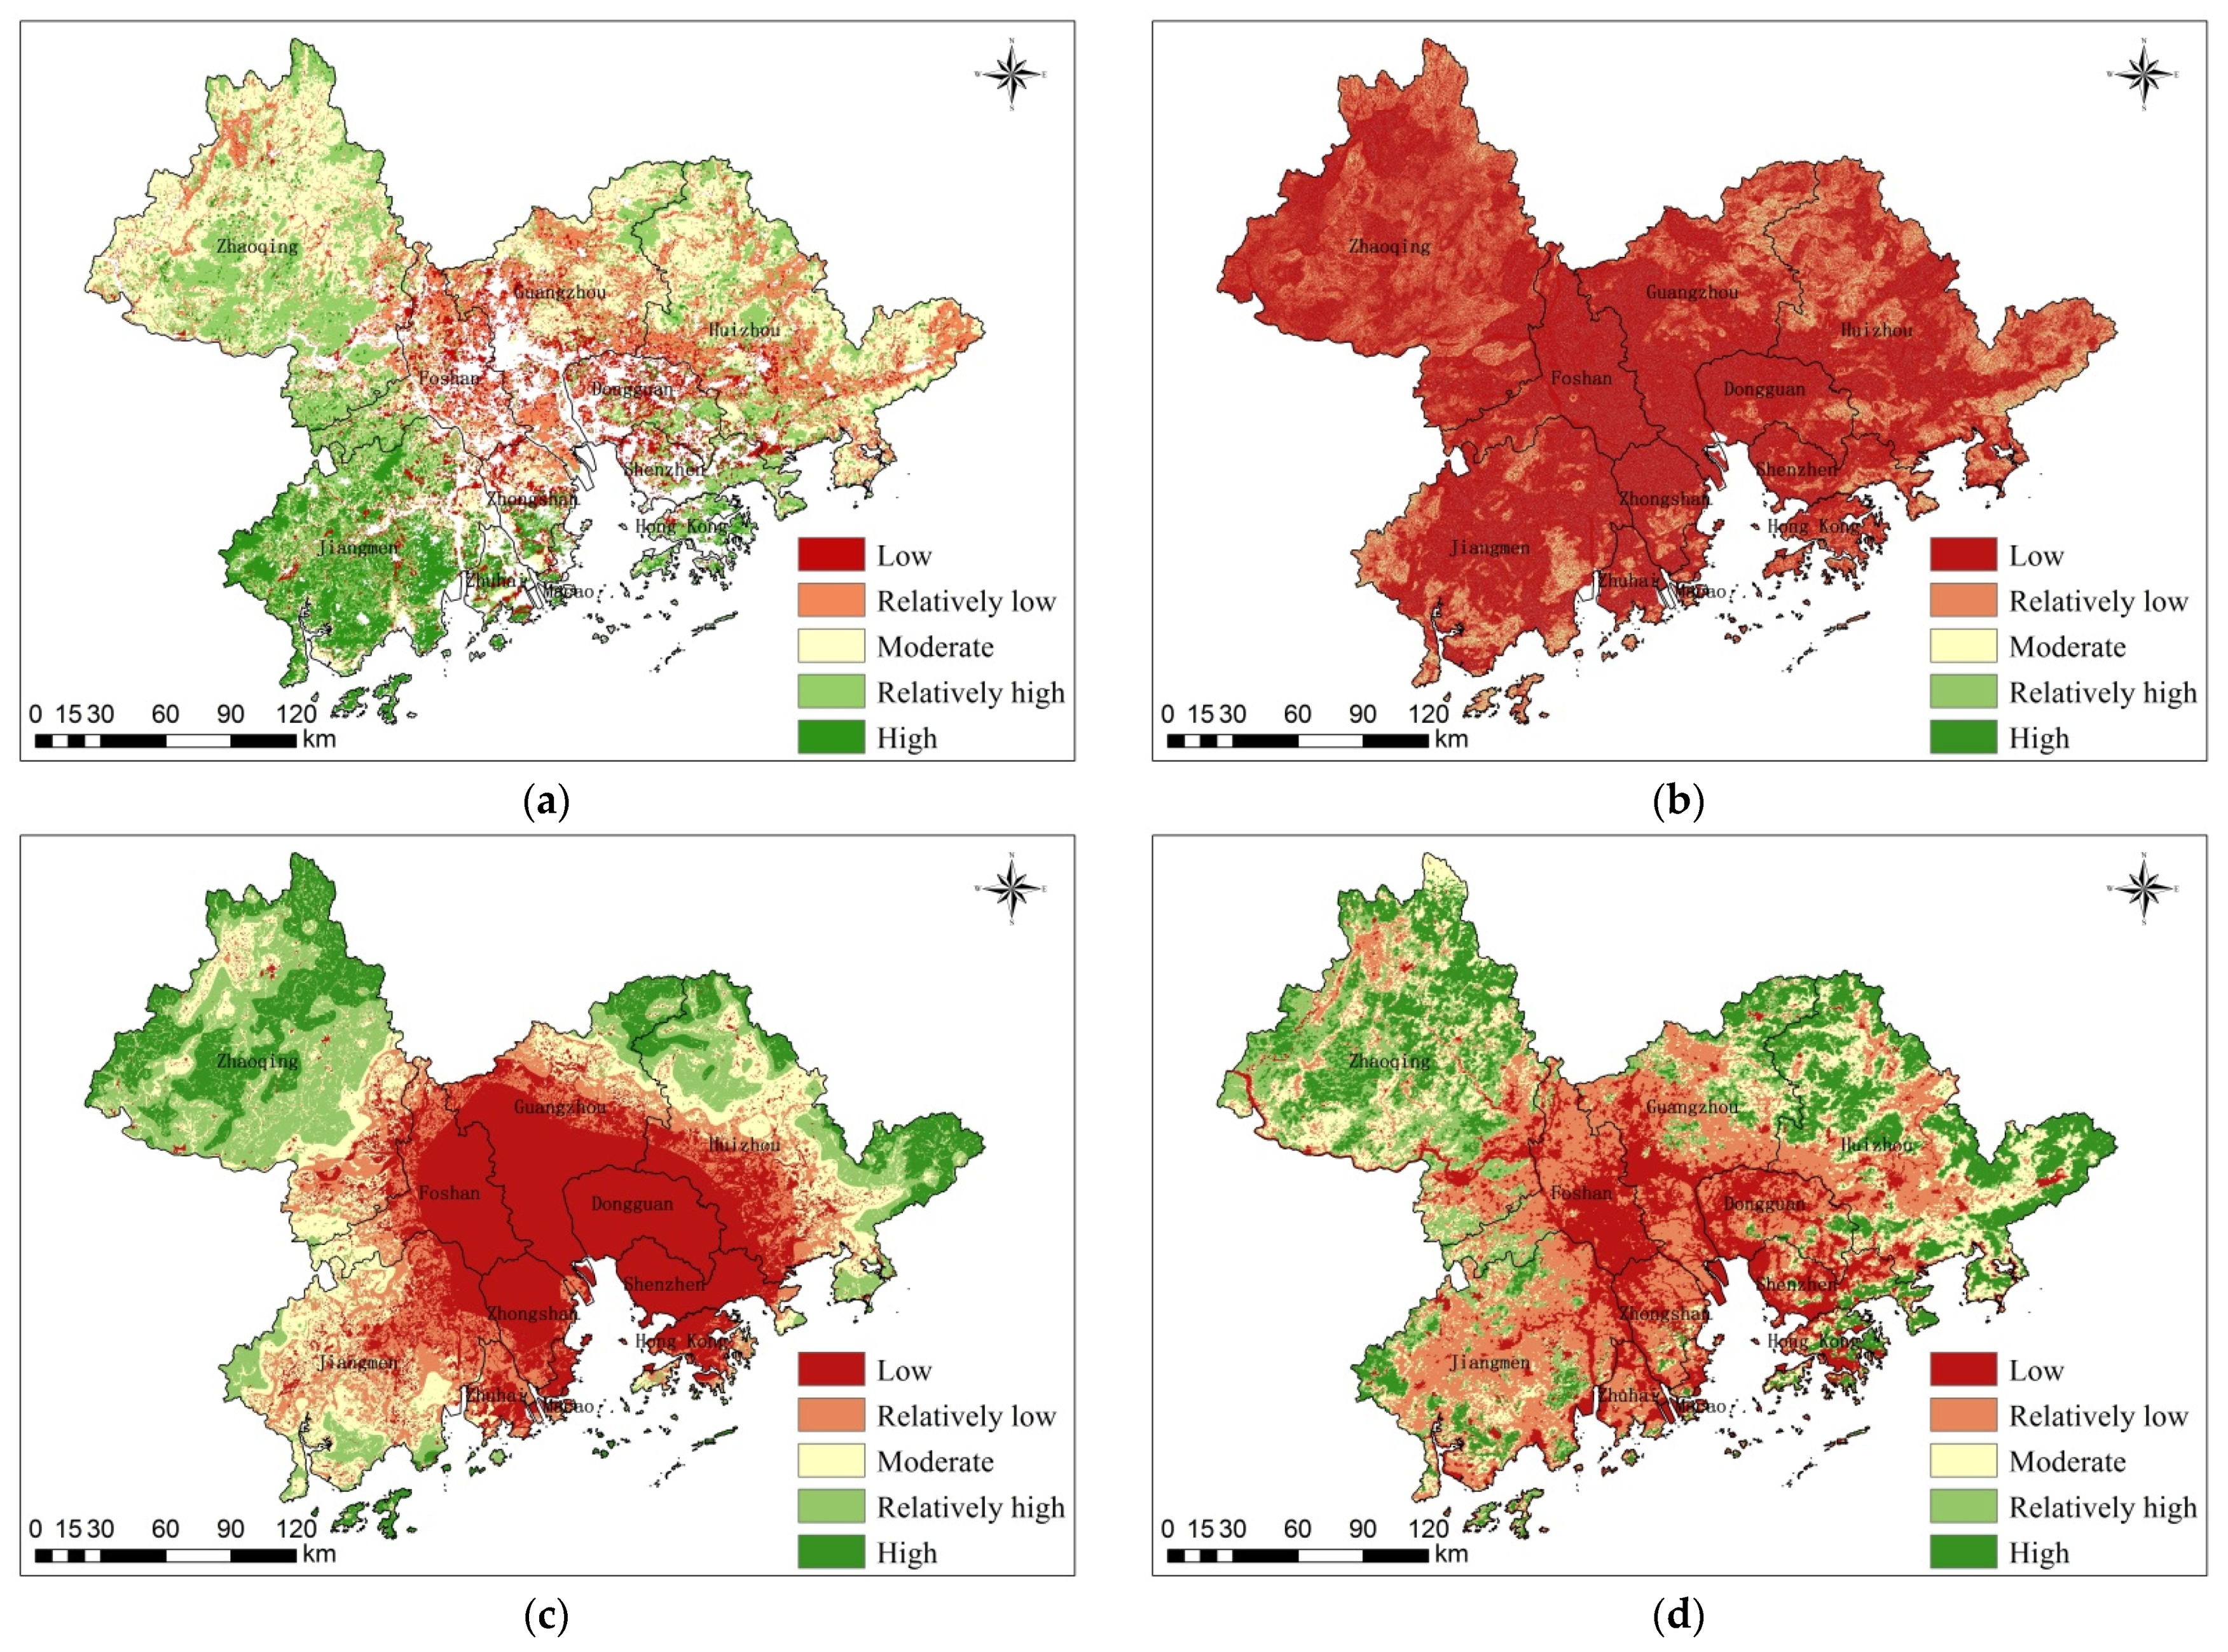
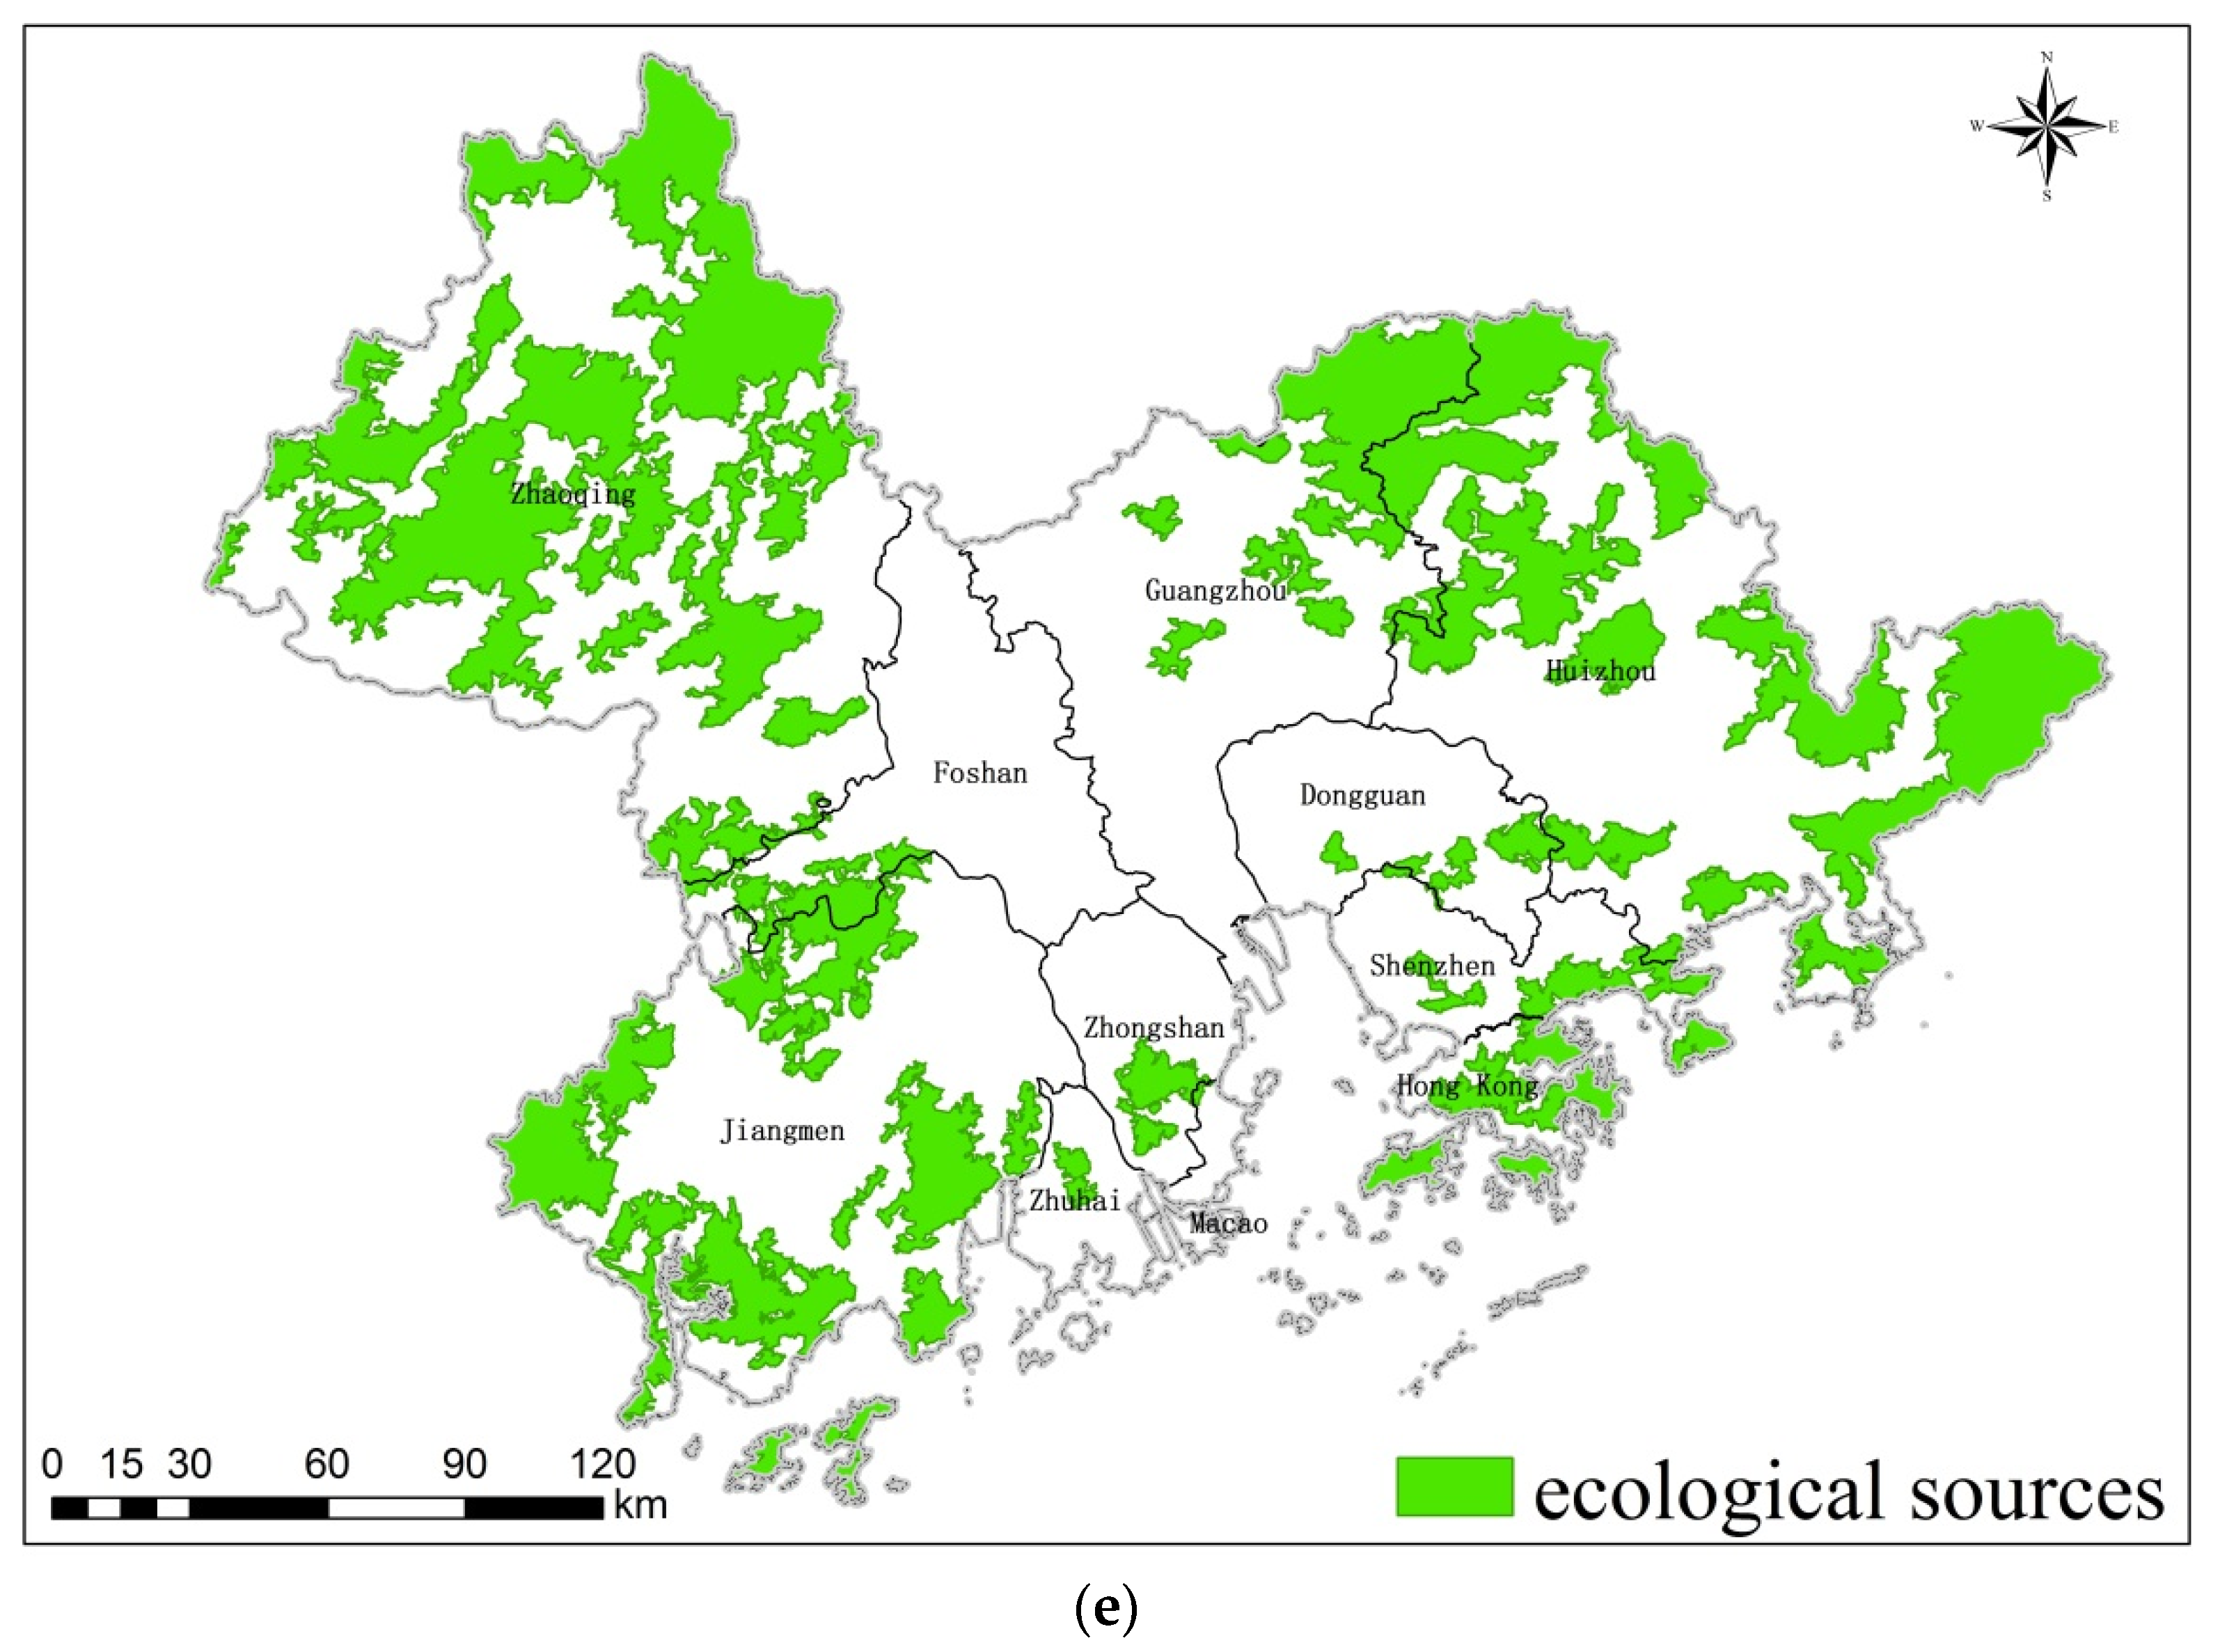
The importance of ES and ecological sources in the GBA is shown in Figure 3. The most important water conservation service areas covered 9135.9 km2, accounting for about 16.5%, which were primarily distributed in Jiangmen, Zhongshan, Zhuhai, and Hong Kong. The most important areas for soil conservation, carbon sequestration, and biodiversity maintenance are spatially heterogeneous, covering an area of 6504.3, 12,644.3, and 5964.7 km2, respectively, and are mainly located in the mountainous regions of Huizhou, Zhaoqing, Jiangmen, Guangzhou, and Hong Kong City. After combining the areas with the most important ESs, small patches below 28.1 km2 were deleted (based on the principle that patches of important ecological sources in highly urbanized areas, such as Baiyun Mountain in Guangzhou City, Daling Mountain in Dongguan City, and Yangtai Mountain in Shenzhen, among which the smallest is 28.1 km2, should be retained). Finally, a total number of 50 ecological sources were obtained, with a total area of 18,289.1 km2, accounting for 33.1% of the total study area, mainly distributed in the mountainous areas of the GBA.

4.1.2. Identification of Ecological Corridors

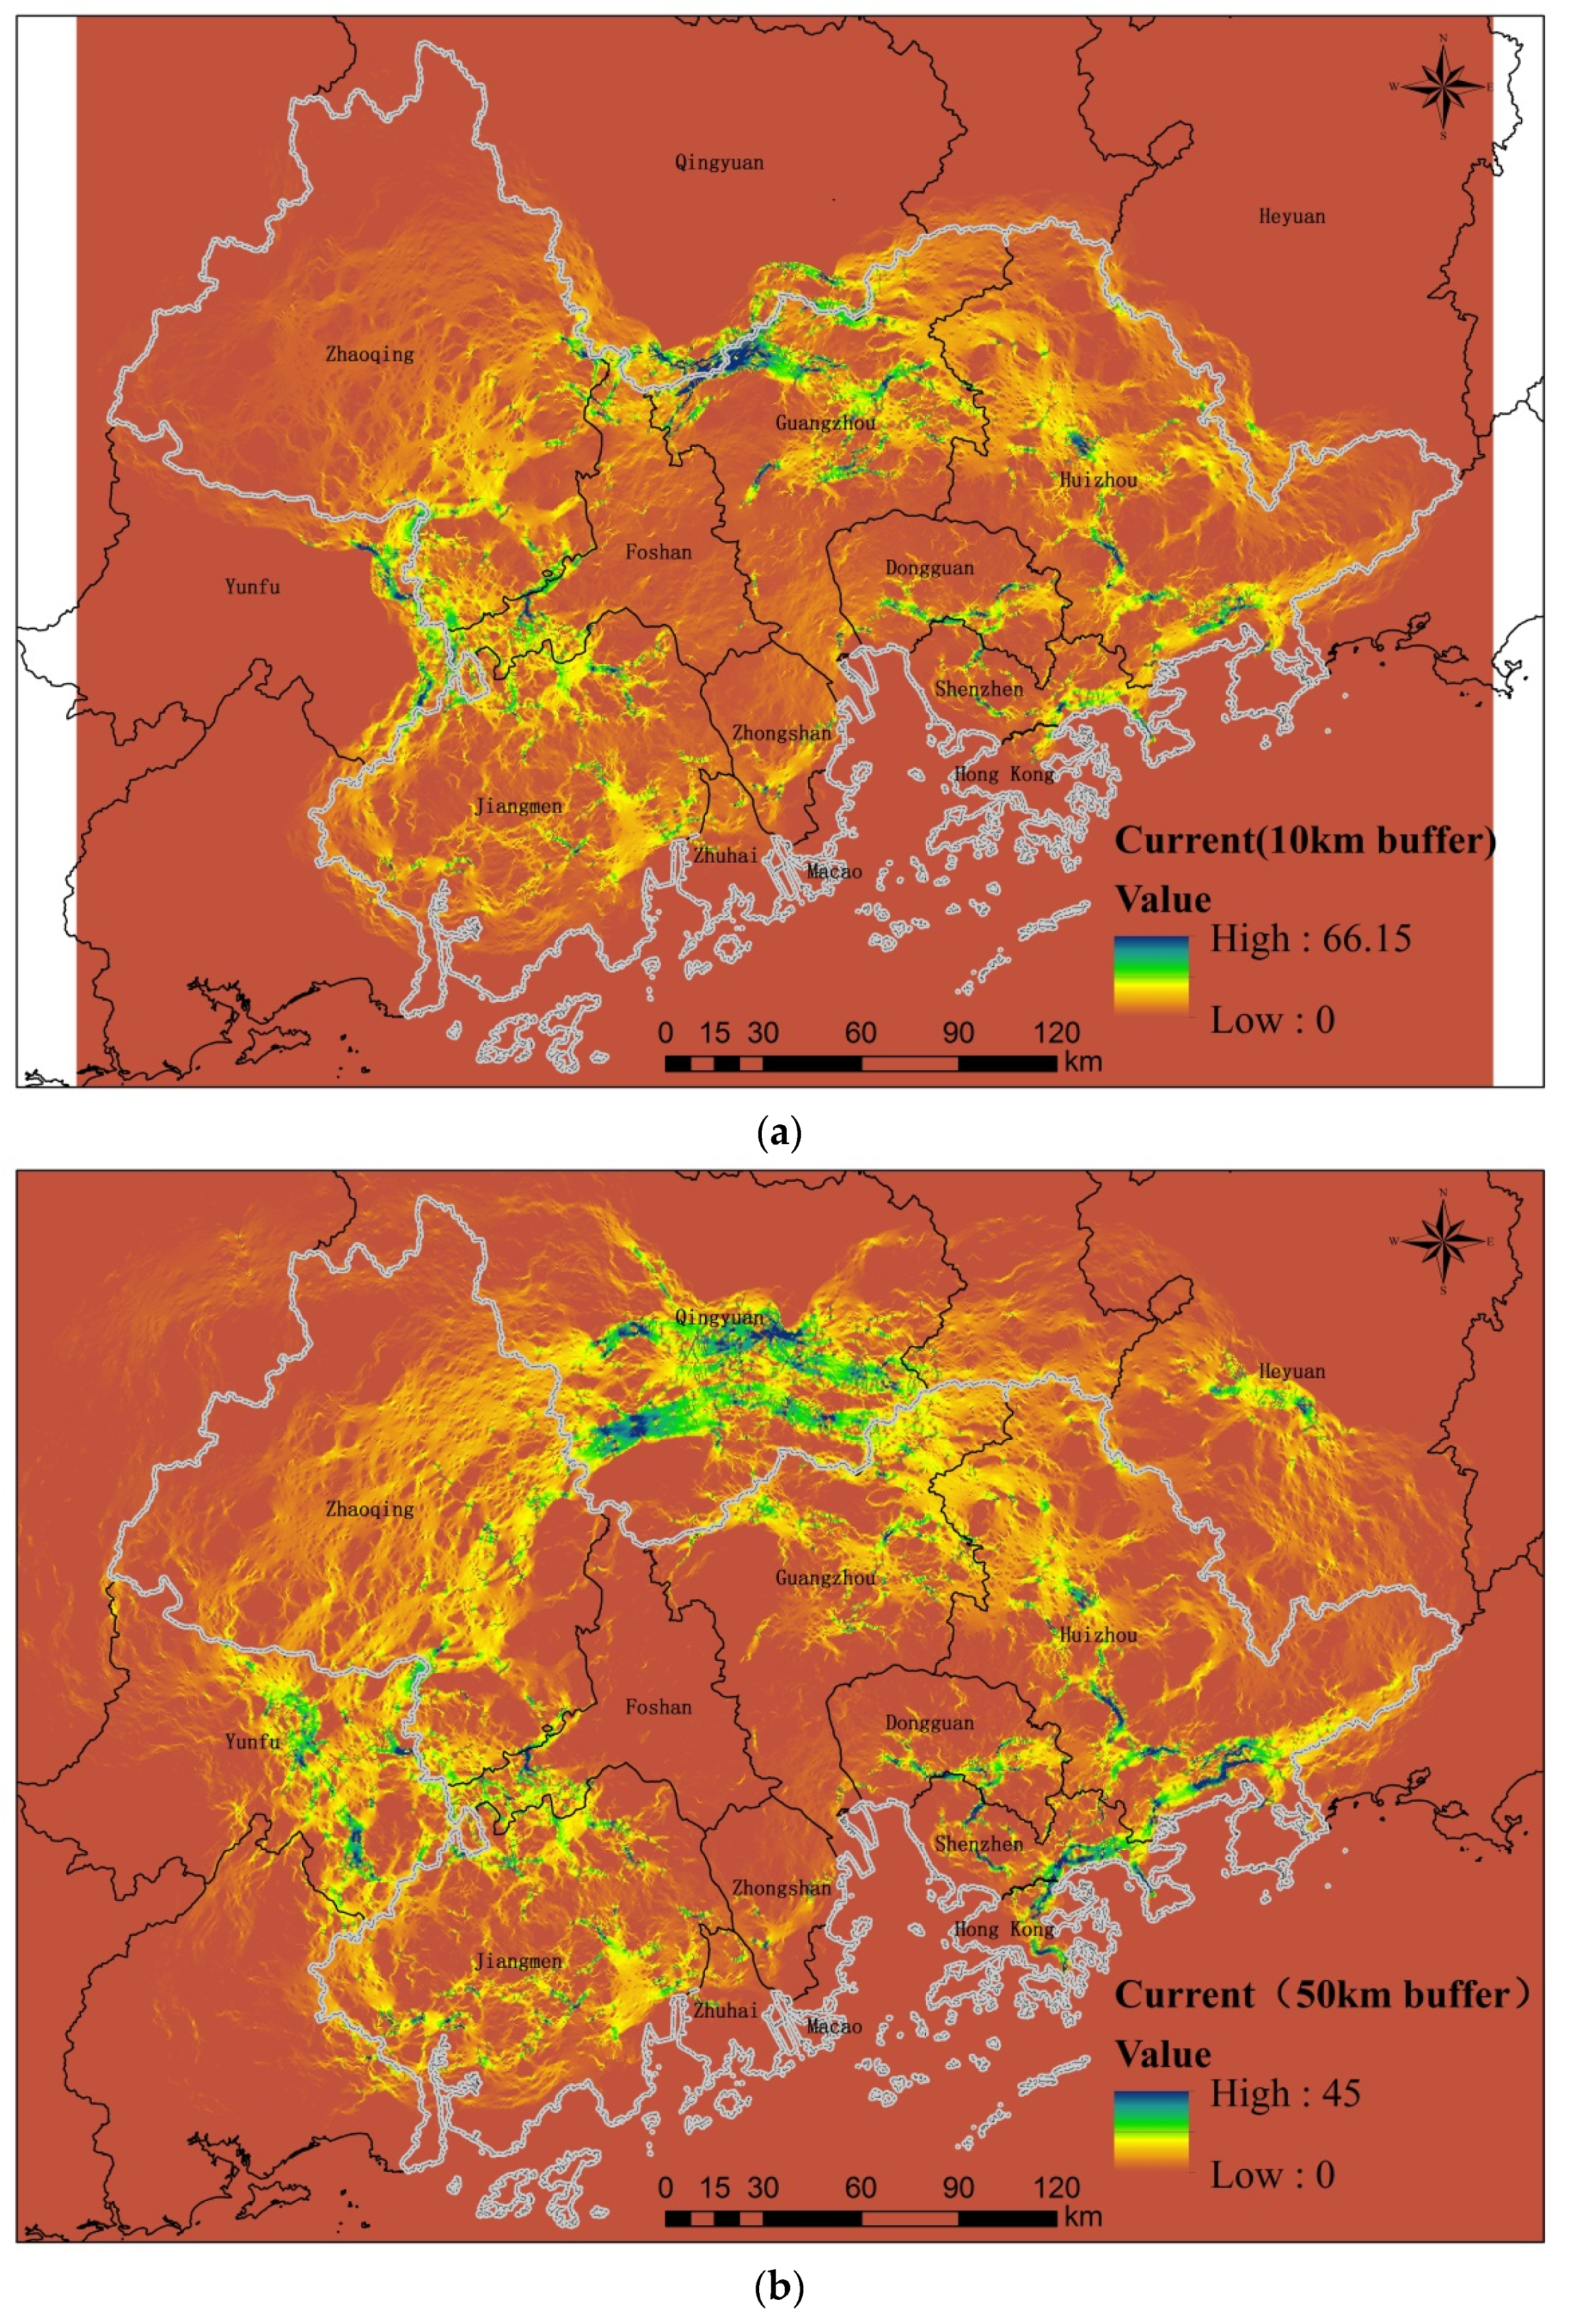
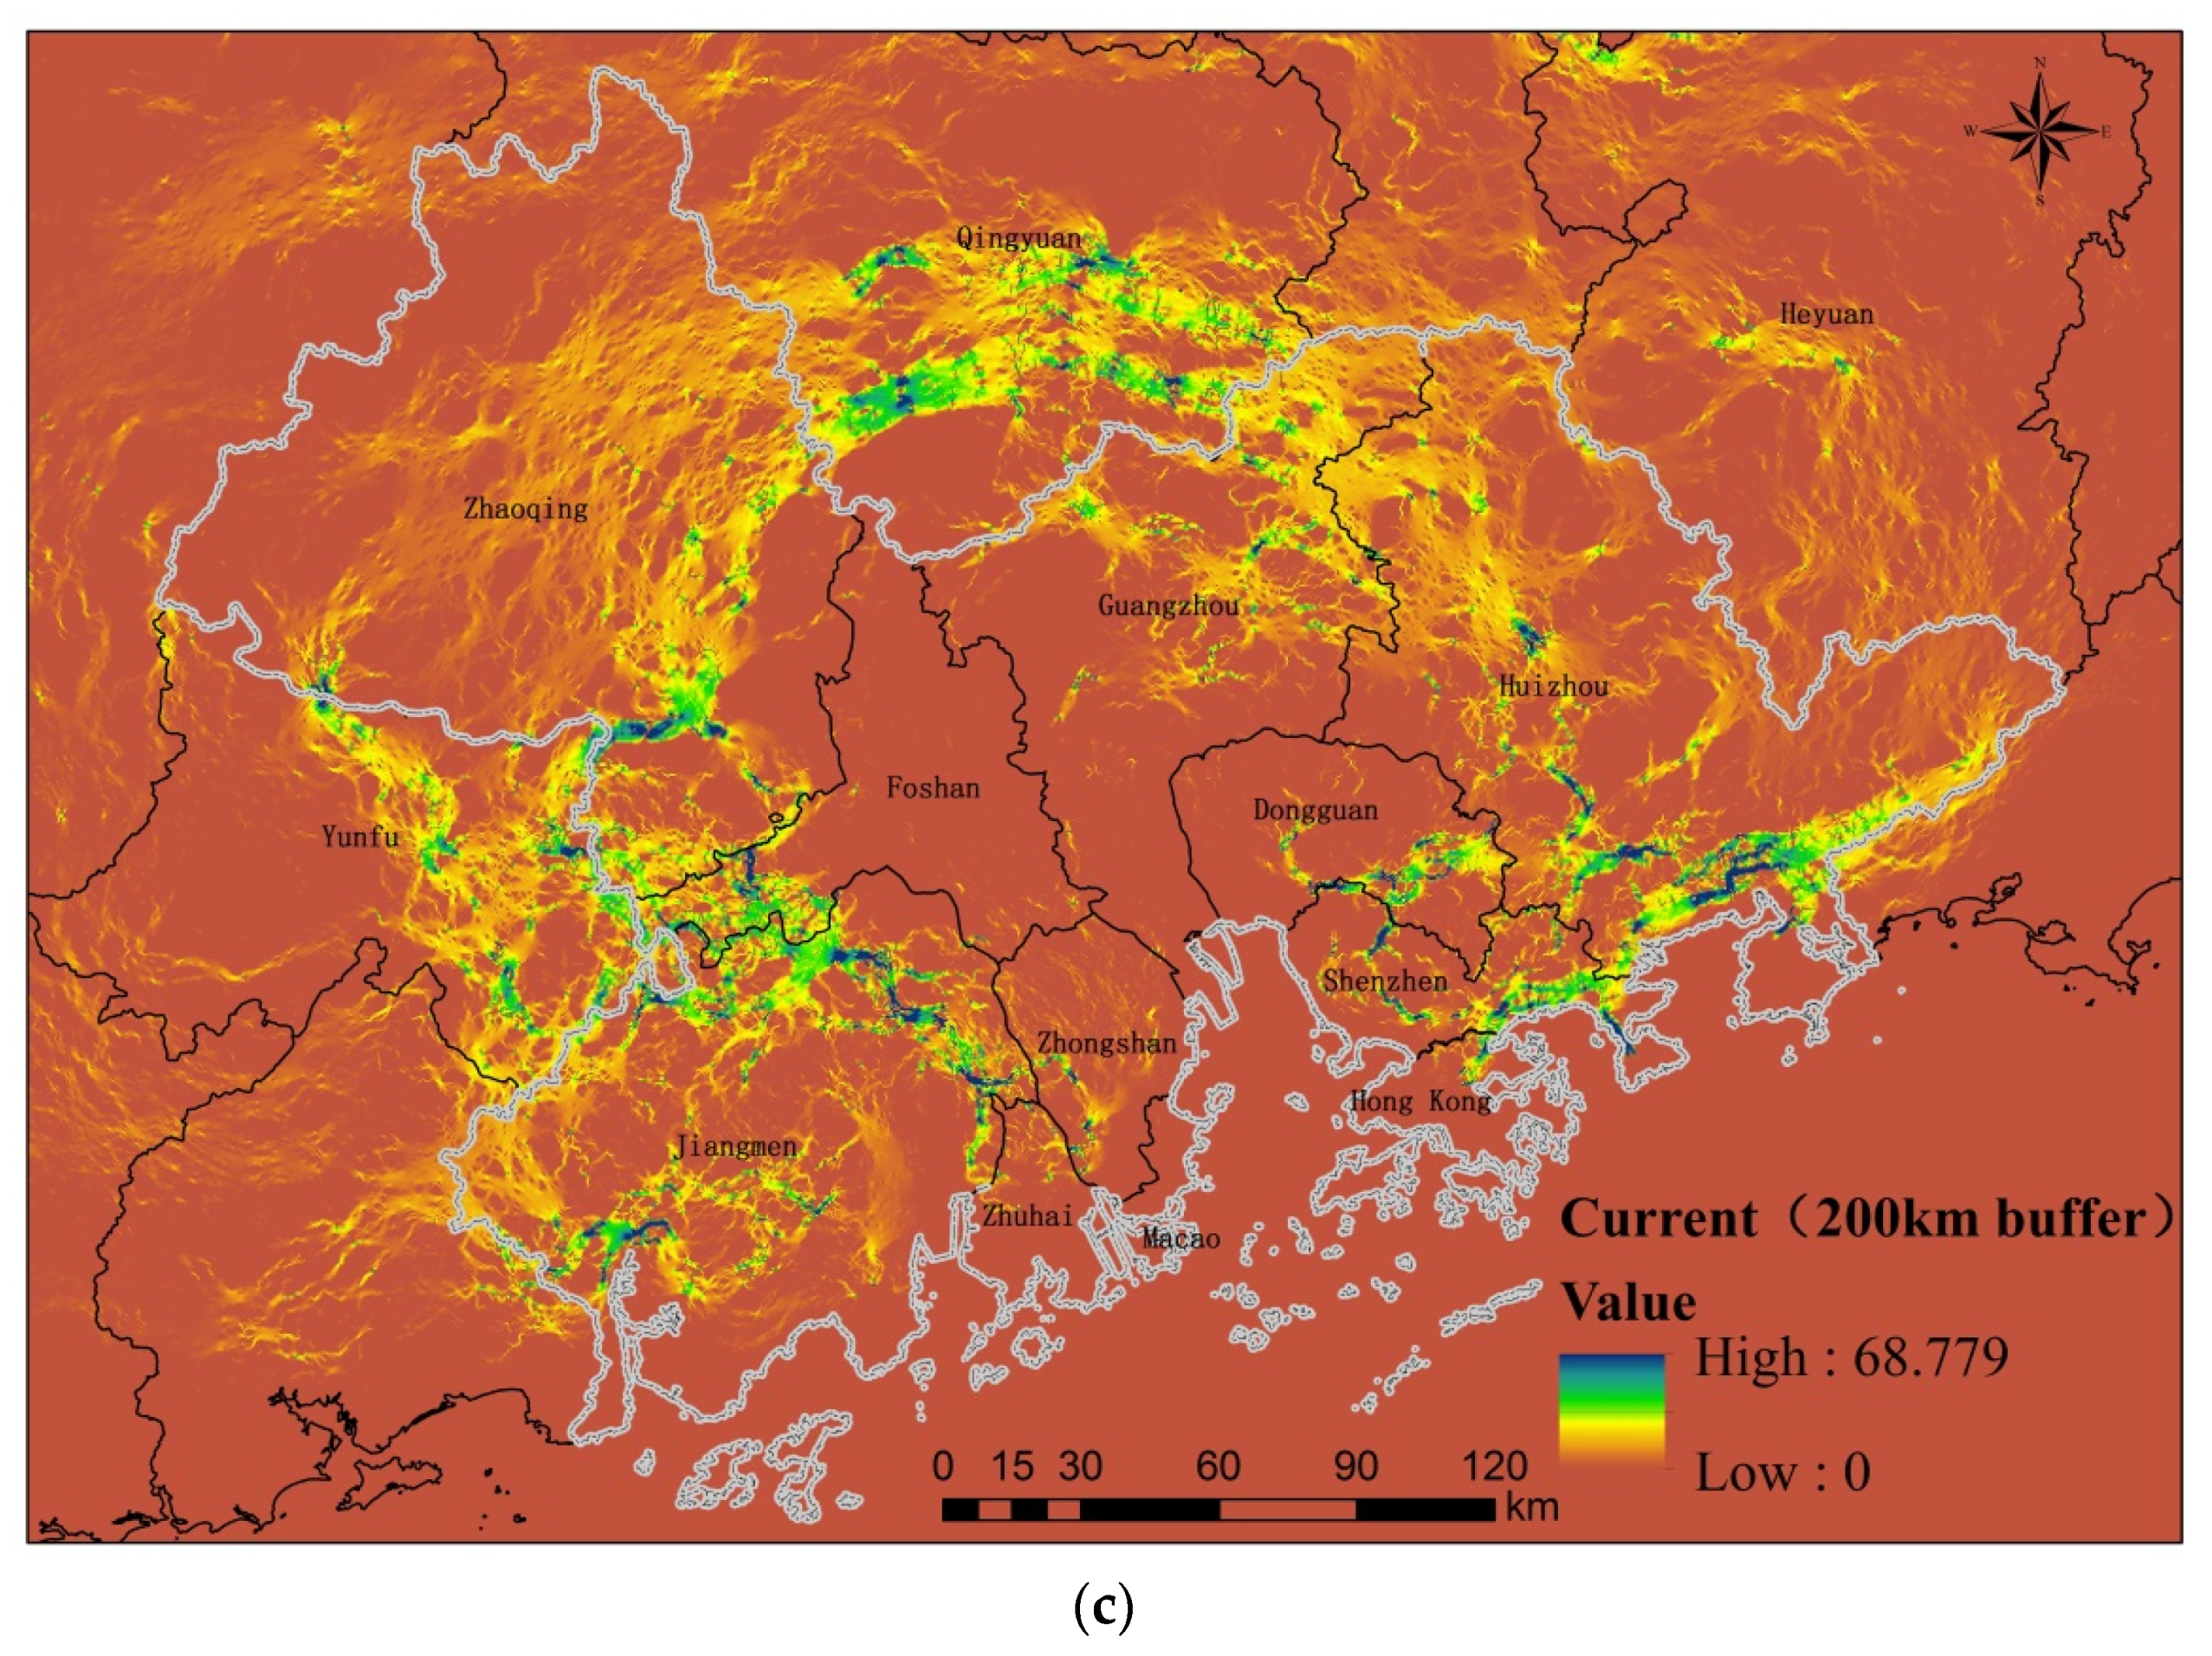
This paper compared the simulation results of ecological corridors based on different scopes of resistance surfaces, which are 10, 50, and 200 km buffer out of the GBA. The simulation results were basically the same when the resistance surfaces were constructed with extensions of 50 and 200 km, but they were different when the extensions were 10 and 50 km (Figure 4). For example, when the extension was 10 km, the high-current areas at the junction of Guangzhou and Qingyuan were identified as an ecological corridor, while the circular ecological corridor in Qingyuan was not identified. Therefore, the 50 km buffer zone of the GBA was used to simulate the ecological corridors.
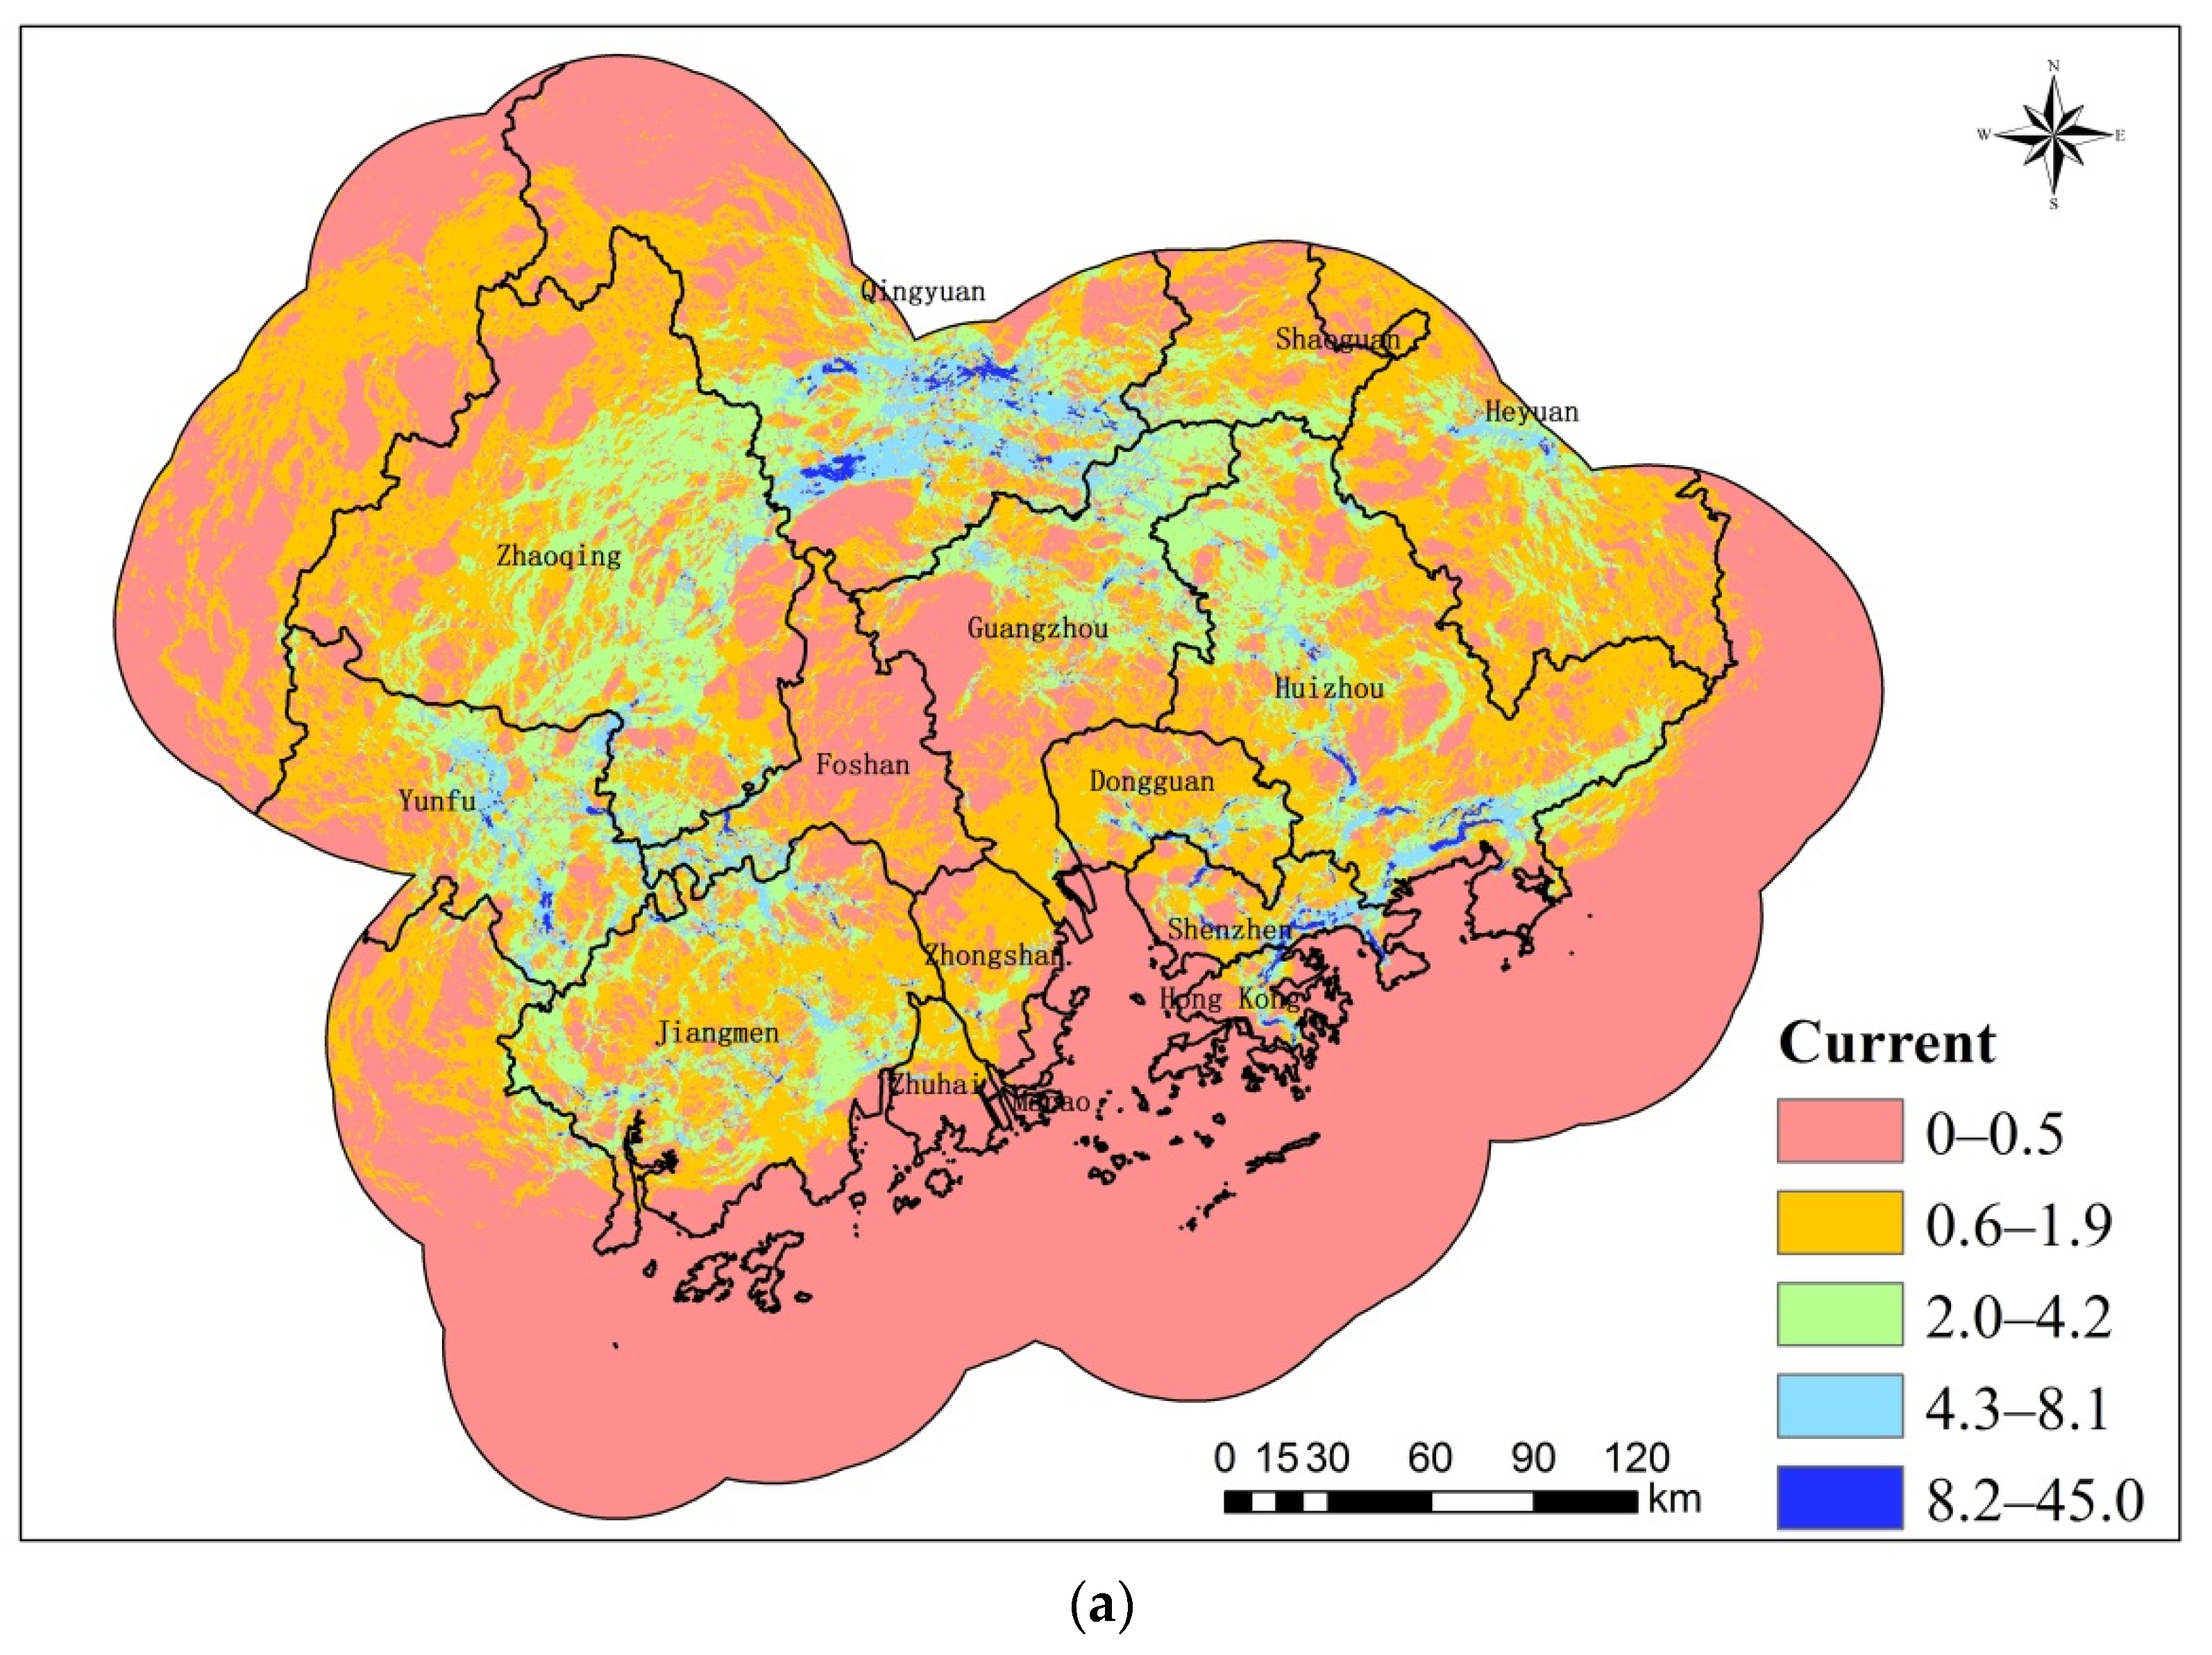
Using the natural break method [30], the current density was divided into five categories (Figure 5a). Results showed that the areas with the highest current density (≥1.95) covered an area of 23,314.88 km2, including 526 corridor patches, with areas ranging from 1.1 to 16,787.6 km2. Together, these ecological sources and ecological corridors form an ecological shelter for the metropolitan area around the GBA (Figure 5b), which is in line with the ecological security patterns of “two screens, one belt, one network” and “one screen, one belt, two corridors, and multiple cores”, respectively, proposed by “Main Functional Zoning of Guangdong Province” (2012) and the “Integrated Planning of the Ecological Security System in the Pearl River Delta Region” (2014–2020)” (2014) for Guangdong Province and the Pearl River Delta.

4.2. The Protection Effect of the EPR on Ecosystem Services and Ecological Connectivity

4.2.1. Protection Effect on Ecosystem Services

The EPR covered an area of 9381.4 km2, accounting for only 17.0% of the GBA, and it protected 23.4% of water conservation service, 41.6% of soil conservation service, 25.6% of carbon sequestration service, and 26.2% of biodiversity maintenance service of the study area. The average water conservation, soil conservation, and biodiversity maintenance services in the EPR were 2.4%, 14.9%, and 4.6% higher than in the ecological source areas, respectively, while the average carbon sequestration service in the EPR were 4.6% lower than that in ecological sources. These results indicated that the EPR effectively protected the water conservation, soil conservation, and biodiversity maintenance services. However, the protection efficiency of the carbon sequestration service was low.

4.2.2. Protection Effect on Ecological Connectivity

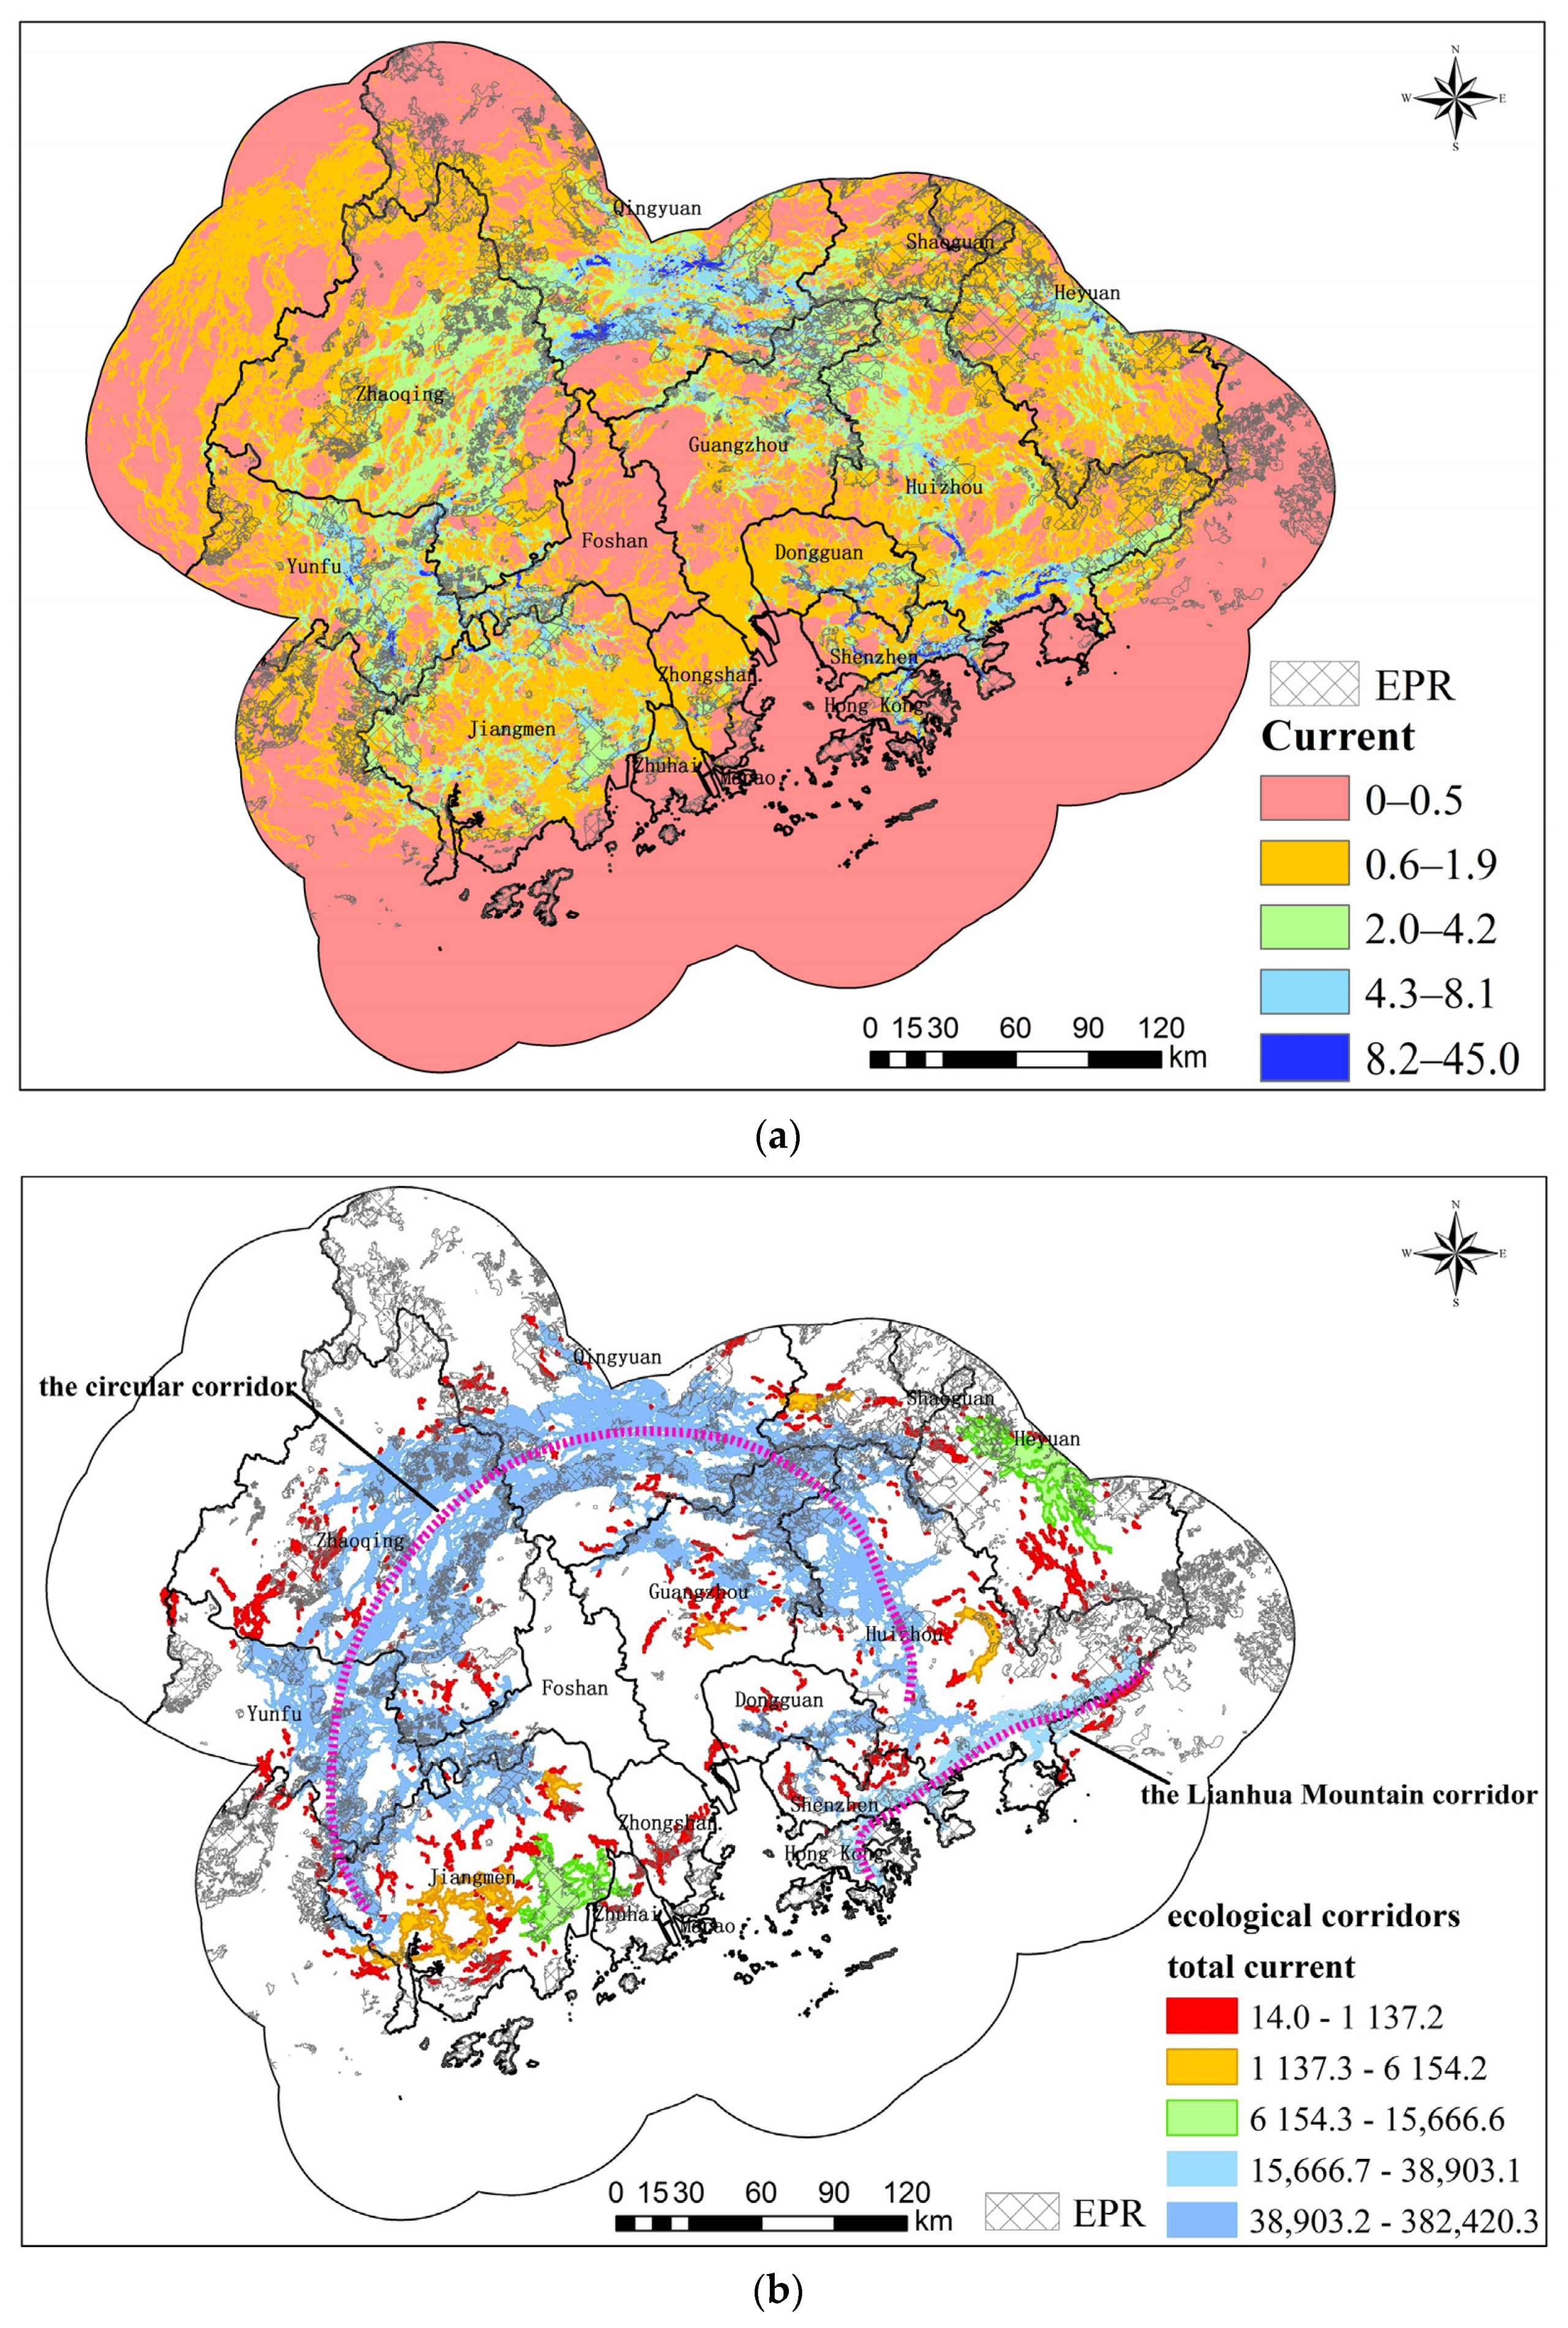
It can be seen from Figure 6a that areas with high current in Shenzhen, Dongguan, Qingyuan, and Jiangmen were protected by EPR: however, there were still protection gaps in Qingyuan, Yunfu, and Heyuan. If the ecological corridors outside the EPR were converted to construction land, it would cause 68.6% of the ecological flow losses. Figure 6b,c shows that the circular ecological corridor surrounding the urban agglomeration and Lianhua Mountain corridor, which had the largest total current and the highest transmission effect, have not been protected continuously. If the unprotected areas are occupied in the future, they may become stepping stones, and the corridor patency and transmission effect will be affected. At the same time, the stepping stones in Shenzhen, Zhongshan, Jiangmen, Guangzhou, and other places, which have high current density and high transmission efficiency, have not been protected by EPR either (Figure 6d). As an important transit station for species migration, stepping stones, if being occupied, will lead to the inhibition of species migration [43].
In the 50 km buffer zone area of the GBA, the EPR accounts for 17.4% and protects 25.9% of the ecological flow. The average current density within the EPR is 1.88, which is higher than the average current density of the study area (1.27) but lower than that of potential ecological corridors (3.62), indicating that the EPR is less effective in protecting ecological connectivity.

4.3. Vacancies in Ecological Protection

4.3.1. Vacancies in Carbon Sequestration Service Protection

The hotspot analysis of carbon sequestration service loss is shown in Figure 7a. The hotspots of NPP loss (confidence interval ≥90%) were mainly located in Huizhou and Zhaoqing, with an area of 1099.80 km2. If these areas are included in the scope of the EPR, the area of EPR will increase by 11.7%, and the carbon sequestration service will increase by 15.1%.

4.3.2. Vacancies in Ecological Connectivity Protection

In order to ensure that the large-scale ecological corridors are continuously protected as much as possible and that the vacancies are not too large (more than 20% of the designated EPR), the threshold of hotspot analysis was adjusted, and the ecological flow loss hotspots with a significance of more than 75% were regarded as protection vacancies, which were mainly distributed in Qingyuan, Yunfu, Huizhou, Jiangmen, Heyuan, and other cities (Figure 7b). If these gaps are included in the EPR, a large number of stepping stones in urbanized areas will be protected, and the continuity of the circular corridor and Lianhua Mountain corridor will be significantly improved. However, there are still some discontinuous nodes, which will break the corridor if they are occupied. Therefore, the relatively high current value areas around these potential break points were identified as protection gaps by using the Overlap toolbox in ArcGIS, including 30 patches in 14 locations (Figure 7c). The total area of the ecological connectivity protection vacancies finally identified was 2175.77 km2. After such areas are included in the EPR, the area of the EPR will increase by 23.2%, the ecological flow will increase by 38.1%, the continuity of the circular corridor and Lianhua Mountain corridor will be improved, and important stepping stones will be protected.

5. Discussion

5.1. Comparison with Similar Studies

Bai et al. [2] studied the changes of ESs and ecological connectivity indexes in the future under the EPR policy scenario, the original ecological protection policy scenario and the original urbanization development scenario. The results showed that compared with other scenarios, the implementation of the EPR policy will significantly improve carbon sequestration, water retention, water purification, soil conservation, and biodiversity maintenance service, and bring about the improvement of ecological connectivity. Research showed that EPR policy can effectively slow down the decline of ESV by comparing the ecosystem service value of EPR areas and non-EPR areas [5]. Consistent with the above research, this study also showed that EPR policy has high protection efficiency for water conservation, soil conservation, and biodiversity maintain service. However, this paper showed that the protection efficiency of EPR on carbon sequestration service and ecological connectivity was low; this means that some areas with high carbon sequestration and ecological flow were still not included in the EPR, which seems inconsistent with the above research. The main reason is that the focus of the above research was whether the EPR policy is effective, and the focus of this paper was the protection efficiency of EPR, and whether there were protection vacancies. Therefore, the two conclusions are not contradictory. Research showed that the basic ecological control line policy in Shenzhen failed to fully protect important stepping stones [30], which is consistent with the conclusion of this study, even if the scope of the EPR and the basic ecological control line do not completely overlap.

5.2. Analysis and Suggestions on EPR Protection Effect

5.2.1. Protection Effect on ES

The results of this study showed that the EPR has a good effect on the protection of ESs such as water conservation, soil conservation, and biodiversity conservation. However, the protection efficiency of carbon sequestration service was low. Ecosystem carbon sinks are the most cost-effective ways to sequester carbon, so important areas of carbon sink should be included in the EPR to strengthen protection. The protection vacancies for carbon sequestration service outside the EPR covered 1099.8 km2, mainly distributed in woodland areas of Huizhou and Zhaoqing. In the future, the development activities of these areas should be strictly limited to prevent them from being occupied. At the same time, forestry management should be carried out, thereby maximizing the carbon sequestration effect of the ecosystem and enhancing carbon sinks.

5.2.2. Protection Effect on Ecological Connectivity

The demarcation of the EPR is based on the idea of block protection. Related research has shown that block protection plays an important role in the protection of large areas of ecological land, but due to the lack of important connecting channels, material circulation and energy flow are blocked, and the ecological protection effects are poor [16]. This study showed that some areas in Qingyuan should be strictly protected if the ecological connectivity of ecological sources in Guangzhou and Zhaoqing is to be ensured. It also showed that the protection of ecological corridors should adhere to the principle of integrity, and the government should break the restrictions of administrative regions and implement coordinated protection of ecological corridors. More importantly, we should pay more attention to the intra-corridor heterogeneity [11]. On one hand, we should strengthen the repairment and reduce human interference of potential break points in the circular corridor and Lianhua Mountain corridor, in order to maintain the patency of large-scale ecological corridors; on the other hand, although the stepping stones are small and discontinuous, they can still be connected by overcoming ecological resistance [23,43], which is the only way to maintain ecological connectivity in highly urbanized areas. Therefore, in the future, important stepping stones in Shenzhen, Dongguan, Zhongshan, and other places should be strictly protected.

5.3. Suggestions for Future Adjustments and Implementation of the EPR

Besides the protection of ESs, ecological connectivity should be considered as an important factor to fully guarantee the integrity and continuity of regional ecological processes in the future adjusting of the EPR. According to the “Administrative Measures for the Ecological Protection Redline “(draft for comments), the construction of “necessary and unavoidable” linear infrastructures are still allowed in the areas located outside the core area of natural reserve and within the EPR. However, linear infrastructure has a great impact on biological migration [44], and the core areas of natural reserve in the current EPR do not completely cover important biodiversity areas. Therefore, it is suggested that linear infrastructure construction be prohibited for areas with biodiversity protection as the dominant function in the EPR.

5.4. Limitations and Future Prospects

Since the EPR has not been implemented, this paper did not evaluate the protection effects of EPR in different periods. Future research can study the actual protection effects of the EPR on ES and ecological connectivity after the implementation of EPR or employ land-use prediction models to simulate the loss of ESs and ecological connectivity caused by land-use conversion in different development scenarios under the background of the EPR protection, which would be more in line with the actual urbanization process.
The evaluation of ecological connectivity in this paper was based on the simulation of ecological corridors. Similar to many existing studies, due to lack of observational data, the ecological corridor simulation results were not able to be validated. In the future, the empirical research of ecological corridor should be strengthened. This study proposed that the resistance surface be extended in future ESP research, but the specific extension range needs to be further studied—investigating, for example, whether the closer the study area is to the circle, the smaller the extension required, or whether this problem can be solved by taking the natural landscape boundary as the study area.

6. Conclusions

This study analyzed the protection effects of EPR on ES and ecological connectivity in the GBA, and we also identified the protection vacancies there. Results indicated that the EPR effectively protects regional ecosystem functions, especially water conservation, soil conservation, and biodiversity maintenance services. However, the protection efficiency of carbon sequestration service and ecological connectivity are low, and protection vacancies still exist. In the future, regions with significant carbon sequestration service and ecological connectivity should be included in the EPR. Based on previous research, the present study evaluated the protection effects of ecological connectivity, identified vacancies in the EPR, and provided a comprehensive understanding of the protection effect of the EPR on ecological structure and function, producing significant insights into improvements of the EPR policy. Meanwhile, this paper proposed the scope of resistance surface should be extended because it has an important impact on corridor simulation, which improves the rationality of ecological corridor simulation.

Supplementary Materials

The following are available online at https://www.mdpi.com/article/10.3390/rs13245171/s1, Resistance values and resistance coefficients used in this paper were shown in supplementary materials.

Author Contributions

Conceptualization, X.W. and D.W.; methodology, X.W., D.W. and Y.W.; software, X.W. and P.Z.; validation, X.L. and Y.L.; data curation, P.L. and J.Z.; writing—original draft preparation, X.W. and X.L.; writing—review and editing, D.W., Y.W. and Y.L.; visualization, X.W. and P.L.; spell and grammar-check: J.Z.; funding acquisition, P.Z. All authors have read and agreed to the published version of the manuscript.

Funding

This research is financially supported by the Basal Specific Research of the Central Public-Interest Scientific Institute (No. PM-zx703-202105-185).

Acknowledgments

The authors are sincerely grateful for the data support from “National Earth System Science Data Center, National Science & Technology Infrastructure of China”. (http://www.geodata.cn, accessed on 16 December 2021). We are very grateful to the editors and anonymous reviewers for their valuable and constructive suggestions that helped us to improve the manuscript.

Conflicts of Interest

The authors declare no conflict of interest.

References

  1. Peng, J.; Zhao, H.; Liu, Y.; Jiansheng, W.U. Research progress and prospect on regional ecological security pattern construction. Geogr. Res. 2017, 36, 407–419. [Google Scholar]
  2. Bai, Y.; Wong, C.P.; Jiang, B.; Hughes, A.C.; Wang, M.; Wang, Q. Developing China’s Ecological Redline Policy using ecosystem services assessments for land use planning. Nat. Commun. 2018, 9, 3034. [Google Scholar] [CrossRef] [PubMed] [Green Version]
  3. Assessment, M.E. Ecosystems and Human Well-Being; Island Press: Washington, DC, USA, 2005; Volume 8, pp. 25–42. [Google Scholar]
  4. Fahrig, L.; Taylor, P.D.; Merriam, G.; Henein, K. Connectivity is a vital element of landscape structure. Oikos 1993, 68, 571–573. [Google Scholar]
  5. Yang, M.; Xie, Y. Spatial Pattern Change and Ecosystem Service Value Dynamics of Ecological and Non-Ecological Redline Areas in Nanjing, China. Int. J. Environ. Res. Public Health 2021, 18, 4224. [Google Scholar] [CrossRef]
  6. Zhou, M.; Deng, J.; Lin, Y.; Zhang, L.; Yang, W. Evaluating combined effects of socio-economic development and ecological conservation policies on sediment retention service in the Qiantang River Basin, China. J. Clean. Prod. 2020, 286, 124961. [Google Scholar] [CrossRef]
  7. Hu, T.; Peng, J.; Liu, Y.; Wu, J.; Li, W.; Zhou, B. Evidence of green space sparing to ecosystem service improvement in urban regions: A case study of China’s Ecological Red Line policy. J. Clean. Prod. 2020, 251, 119678. [Google Scholar] [CrossRef]
  8. Guo, X.; Zhang, X.; Du, S.; Li, C.; Siu, Y.L.; Rong, Y.; Yang, H. The impact of onshore wind power projects on ecological corridors and landscape connectivity in Shanxi, China. J. Clean. Prod. 2020, 254, 120075. [Google Scholar] [CrossRef]
  9. Jiang, Y.; Wang, Y.; Zhou, D.; Ke, Y.; Yan, J. The impact assessment of hydro-biological connectivity changes on the estuary wetland through the ecological restoration project in the Yellow River Delta, China. Sci. Total Environ. 2020, 758, 143706. [Google Scholar] [CrossRef]
  10. Jahanishakib, F.; Salmanmahin, Y.A.; Mirkarimi, S.H.; Poodat, F. Hydrological connectivity assessment of landscape ecological network to mitigate development impacts. J. Environ. Manag. 2021, 296, 113169. [Google Scholar] [CrossRef]
  11. Luo, Y.; Wu, J.; Wang, X.; Wang, Z.; Zhao, Y. Can policy maintain habitat connectivity under landscape fragmentation? A case study of Shenzhen, China. Sci. Total Environ. 2020, 715, 136829. [Google Scholar] [CrossRef]
  12. Yu, K. Security patterns and surface model in landscape ecological planning. Landsc. Urban Plan. 1996, 36, 1–17. [Google Scholar] [CrossRef]
  13. Peng, J.; Pan, Y.; Liu, Y.; Zhao, H.; Wang, Y. Linking ecological degradation risk to identify ecological security patterns in a rapidly urbanizing landscape. Habitat Int. 2018, 71, 110–124. [Google Scholar] [CrossRef]
  14. Li, S.; Zhao, Y.; Xiao, W.; Yue, W.; Wu, T. Optimizing ecological security pattern in the coal resource-based city: A case study in Shuozhou City, China. Ecol. Indic. 2021, 130, 108026. [Google Scholar] [CrossRef]
  15. Li, S.; Xiao, W.; Zhao, Y.; Lv, X. Incorporating ecological risk index in the multi-process MCRE model to optimize the ecological security pattern in a semi-arid area with intensive coal mining: A case study in northern China. J. Clean. Prod. 2020, 247, 119143. [Google Scholar] [CrossRef]
  16. Wang, C.; Yu, C.; Chen, T.; Feng, Z.; Hu, Y.; Wu, K. Can the establishment of ecological security patterns improve ecological protection? An example of Nanchang, China. Sci. Total Environ. 2020, 740, 140051. [Google Scholar] [CrossRef]
  17. Teng, M.; Wu, C.; Zhou, Z.; Lord, E.; Zheng, Z. Multipurpose greenway planning for changing cities: A framework integrating priorities and a least-cost path model. Landsc. Urban Plan. 2011, 103, 1–14. [Google Scholar] [CrossRef]
  18. Aminzadeh, B.; Khansefid, M. A case study of urban ecological networks and a sustainable city: Tehran’s metropolitan area. Urban Ecosyst. 2010, 13, 23–36. [Google Scholar] [CrossRef]
  19. Zhang, L.; Jian, P.; Liu, Y.; Wu, J. Coupling ecosystem services supply and human ecological demand to identify landscape ecological security pattern: A case study in Beijing–Tianjin–Hebei region, China. Urban Ecosyst. 2017, 20, 1–14. [Google Scholar] [CrossRef]
  20. Mandle, L.; Douglass, J.; Lozano, J.S.; Sharp, R.P.; Vogl, A.L.; Denu, D.; Walschburger, T.; Tallis, H. OPAL: An open-source software tool for integrating biodiversity and ecosystem services into impact assessment and mitigation decisions. Environ. Model. Softw. 2016, 84, 121–133. [Google Scholar] [CrossRef]
  21. Xin, C.; Jian, P.; Yanxu, L.; Yang, Y.; Guicai, L.I. Constructing ecological security patterns in Yunfu city based on the framework of importance-sensitivity-connectivity. Geogr. Res. 2017, 36, 471–484. [Google Scholar]
  22. Spear, S.F.; Balkenhol, N.; Fortin, M.J.; Mcrae, B.H.; Scribner, K. Use of resistance surfaces for landscape genetic studies: Considerations for parameterization and analysis. Mol. Ecol. 2010, 19, 3576–3591. [Google Scholar] [CrossRef] [PubMed]
  23. Dickson, B.G.; Albano, C.M.; McRae, B.H.; Anderson, J.J.; Theobald, D.M.; Zachmann, L.J.; Sisk, T.D.; Dombeck, M.P. Informing Strategic Efforts to Expand and Connect Protected Areas Using a Model of Ecological Flow, with Application to the Western United States. Conserv. Lett. 2017, 10, 564–571. [Google Scholar] [CrossRef]
  24. Monaco, R.; Negrini, G.; Salizzoni, E.; Soares, A.J.; Voghera, A. Inside-outside park planning: A mathematical approach to assess and support the design of ecological connectivity between Protected Areas and the surrounding landscape. Ecol. Eng. 2020, 149, 105748. [Google Scholar] [CrossRef]
  25. Feng, R.; Wang, F.; Wang, K. Spatial-temporal patterns and influencing factors of ecological land degradation-restoration in Guangdong-Hong Kong-Macao Greater Bay Area. Sci. Total Environ. 2021, 794, 148671. [Google Scholar] [CrossRef] [PubMed]
  26. Jiao, M.; Wang, Y.; Hu, M.; Xia, B. Spatial deconstruction and differentiation analysis of early warning for ecological security in the Pearl River Delta, China. Sustain. Cities Soc. 2021, 64, 102557. [Google Scholar] [CrossRef]
  27. Wang, X.Z.P.; Long, Y.; Song, W.; Liu, X. Identification of key areas of land space ecological protection and restoration based on the pattern of ecological security in Guangdong, Hong kong and Macau. Acta Ecol. Sin. 2022, 42, 1–12. [Google Scholar]
  28. Fu, Y.; Shi, X.; He, J.; Yuan, Y.; Qu, L. Identification and optimization strategy of county ecological security pattern: A case study in the Loess Plateau, China. Ecol. Indic. 2020, 112, 106030. [Google Scholar] [CrossRef]
  29. Peng, J.; Zhao, S.; Dong, J.; Liu, Y.; Meersmans, J.; Li, H.; Wu, J. Applying ant colony algorithm to identify ecological security patterns in megacities. Environ. Model. Softw. 2019, 117, 214–222. [Google Scholar] [CrossRef] [Green Version]
  30. Luo, Y.; Wu, J.; Wang, X.; Peng, J. Using stepping-stone theory to evaluate the maintenance of landscape connectivity under China’s ecological control line policy. J. Clean. Prod. 2021, 296, 126356. [Google Scholar] [CrossRef]
  31. Sharp, R.; Tallis, H.; Ricketts, T.; Guerry, A.D.; Wood, S.A.; Chaplin-Kramer, R.; Nelson, E.; Ennaanay, D.; Wolny, S.; Olwero, N. InVEST 3.2.0 User’s Guide: The Natural Capital Project; Stanford University: Stanford, CA, USA; University of Minnesota: Minneapolis, MN, USA; The Nature Conservancy: Arlington, VA, USA; World Wildlife Fund: Gland, Switzerland, 2016. [Google Scholar]
  32. Okou, F.A.Y.; Tente, B.; Bachmann, Y.; Sinsin, B. Regional erosion risk mapping for decision support: A case study from West Africa. Land Use Policy 2016, 56, 27–37. [Google Scholar] [CrossRef]
  33. Knaapen, J.P.; Scheffer, M.; Harms, B. Estimating habitat isolation in landscape planning. Landsc. Urban Plan. 1992, 23, 1–16. [Google Scholar] [CrossRef]
  34. Adriaensen, F.; Chardon, J.P.; De Blust, G.; Swinnen, E.; Villalba, S.; Gulinck, H.; Matthysen, E. The application of ‘least-cost’ modelling as a functional landscape model. Landsc. Urban Plan. 2003, 64, 233–247. [Google Scholar] [CrossRef]
  35. Kang, J.; Zhang, X.; Zhu, X.; Zhang, B. Ecological security pattern: A new idea for balancing regional development and ecological protection. A case study of the Jiaodong Peninsula, China. Glob. Ecol. Conserv. 2021, 26, e01472. [Google Scholar] [CrossRef]
  36. Peng, J.; Yang, Y.; Liu, Y.; Hu, Y.N.; Du, Y.; Meersmans, J.; Qiu, S. Linking ecosystem services and circuit theory to identify ecological security patterns. Sci. Total Environ. 2018, 644, 781–790. [Google Scholar] [CrossRef] [Green Version]
  37. Lin, Q.; Mao, J.; Wu, J.; Li, W.; Yang, J. Ecological Security Pattern Analysis Based on InVEST and Least-Cost Path Model: A Case Study of Dongguan Water Village. Sustainability 2016, 8, 172. [Google Scholar] [CrossRef] [Green Version]
  38. McRae, B.; Dickson, B.; Keitt, T.; Shah, V.; McRae, B.H.; Dickson, B.G.; Keitt, T.H.; Shah, V.B. Using circuit theory to model connectivity in ecology, evolution, and conservation. Ecology 2008, 89, 2712–2724. [Google Scholar] [CrossRef] [PubMed]
  39. Song, L.L.; Qin, M.Z. Identification of ecological corridors and its importance by integrating circuit theory. J. Appl. Ecol. 2016, 27, 3344–3352. [Google Scholar]
  40. Wu, J.; Feng, Z.; Gao, Y.; Peng, J. Hotspot and relationship identification in multiple landscape services: A case study on an area with intensive human activities. Ecol. Indic. 2013, 29, 529–537. [Google Scholar] [CrossRef]
  41. Kumar, D.; Singh, A.; Jha, R.K.; Sahoo, S.K.; Jha, V. Using spatial statistics to identify the uranium hotspot in groundwater in the mid-eastern Gangetic plain, India. Environ. Earth Sci. 2018, 77, 702. [Google Scholar] [CrossRef]
  42. Getis, A.; Ord, J.K. The Analysis of Spatial Association by Use of Distance Statistics. Geogr. Anal. 2010, 24, 189–206. [Google Scholar] [CrossRef]
  43. Wimberly, M.C.; Narem, D.M.; Bauman, P.J.; Carlson, B.T.; Ahlering, M.A. Grassland connectivity in fragmented agricultural landscapes of the north-central United States. Biol. Conserv. 2018, 217, 121–130. [Google Scholar] [CrossRef]
  44. Jongman, R.H.G. Connectivity and Ecological Networks. In Encyclopedia of Ecology, 2nd ed.; Fath, B., Ed.; Elsevier: Oxford, UK, 2019; pp. 366–376. [Google Scholar]
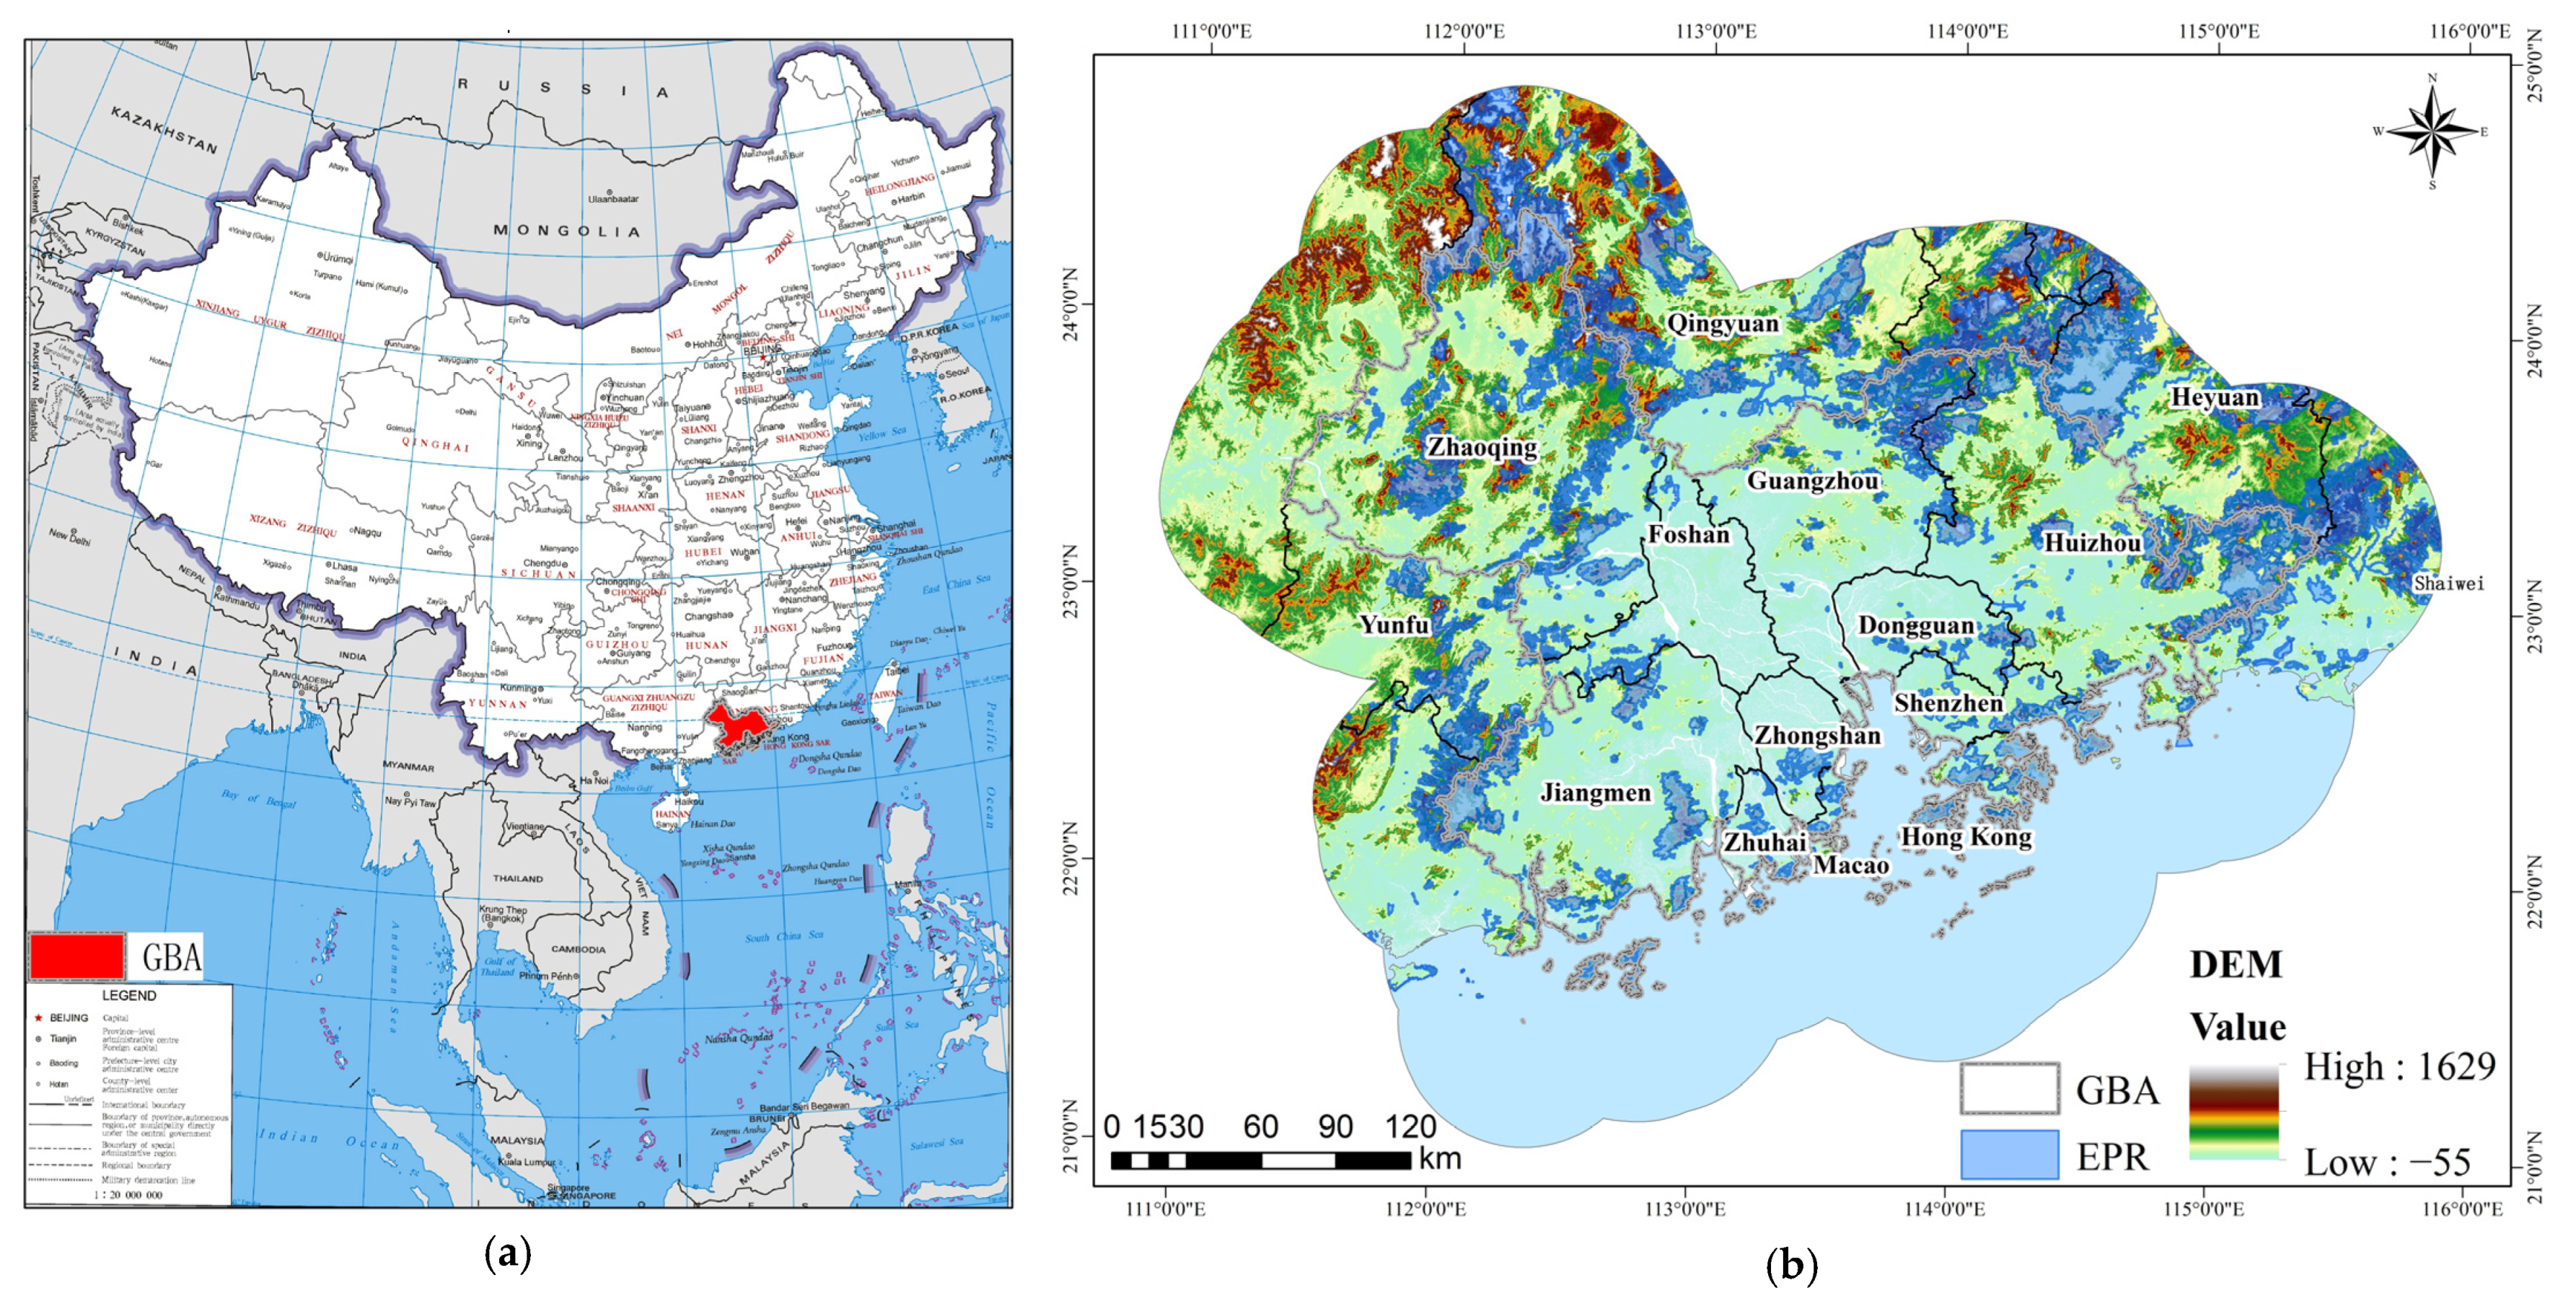
Figure 1. The study area. (a) Location of GBA in China. (b) The EPR in the study area.
Remotesensing 13 05171 g001
Figure 2. The technology roadmap.
Remotesensing 13 05171 g002
Figure 3. ES importance and ecological sources. (a) Water conservation service. (b) Soil conservation service. (c) Biodiversity maintenance service. (d) Carbon sequestration service. (e) Distribution of ecological sources.
Remotesensing 13 05171 g003aRemotesensing 13 05171 g003b
Figure 4. Ecological flow based on different ranges of resistance surfaces. (a) Based on a 10 km buffer out of the GBA. (b) Based on a 50 km buffer out of the GBA. (c) Based on a 200 km buffer out of the GBA.
Remotesensing 13 05171 g004aRemotesensing 13 05171 g004b
Figure 5. Ecological corridors and ecological security patterns. (a) Simulation results of the current. (b) Ecological security patterns.
Remotesensing 13 05171 g005aRemotesensing 13 05171 g005b
Figure 6. Spatial relationship between EPR and ecological corridors within 50 km buffer zone of the GBA. (a) EPR and current simulation results. (b) EPR and total current of each corridor. (c) EPR and average current of each corridor. (d) Stepping stones not protected by EPR.
Remotesensing 13 05171 g006aRemotesensing 13 05171 g006b
Figure 7. Protection vacancies: (a) protection vacancies of carbon sequestration, (b) protection vacancies that can improve the efficiency of connectivity protection, (c) protection vacancies that played an important role in maintaining corridor patency.
Remotesensing 13 05171 g007aRemotesensing 13 05171 g007b
Publisher’s Note: MDPI stays neutral with regard to jurisdictional claims in published maps and institutional affiliations.