A Complete Environmental Intelligence System for LiDAR-Based Vegetation Management in Power-Line Corridors
Abstract
:1. Introduction
- A complete LiDAR data processing pipeline for fusion of the derived data products (like digital terrain models, canopy height models and 3D data about power lines), with cadastral data and other important thematic maps for vegetation management, such as, for example, distribution of tree spices and soil pH maps,
- An efficient approach for encroaching vegetation detection that enables accurate assessment of corridor clearance and provides future threat assessment, and
- A new data segmentation approach for learning vegetation growth simulation, with weak predictors tuned to specific ecological niches.
2. Materials and Methods
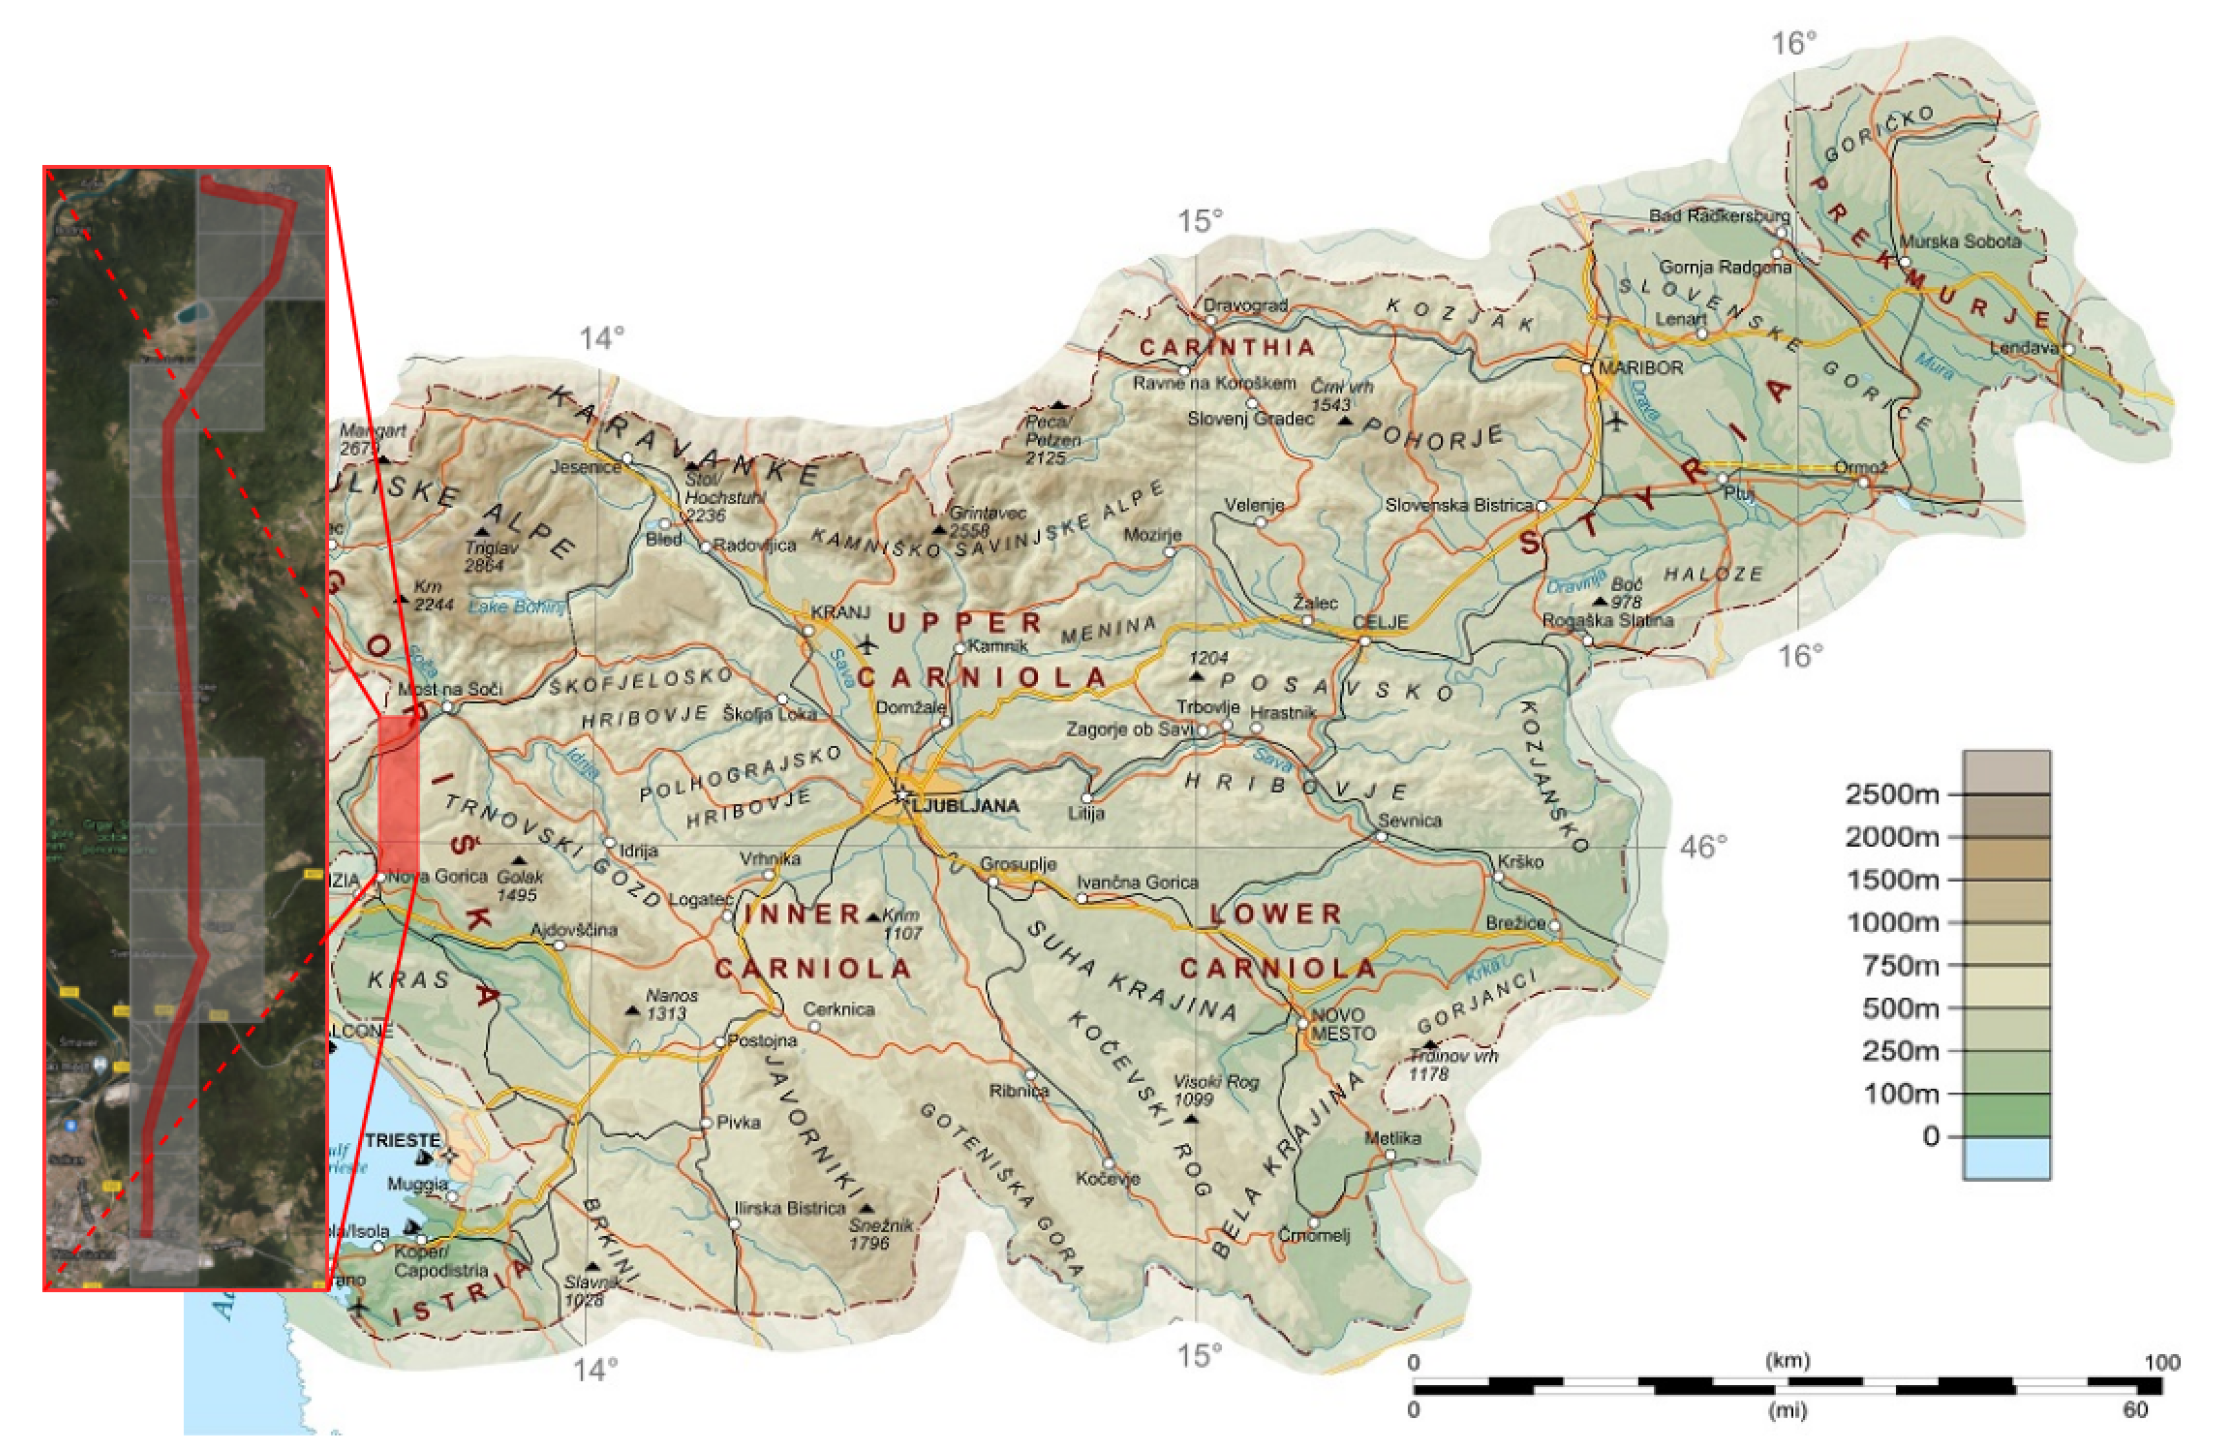
2.1. Study Area and Data Source Preprocessing
- Forest management activities conducted after LiDAR data were recorded;
- Vegetation growth up to the current date.
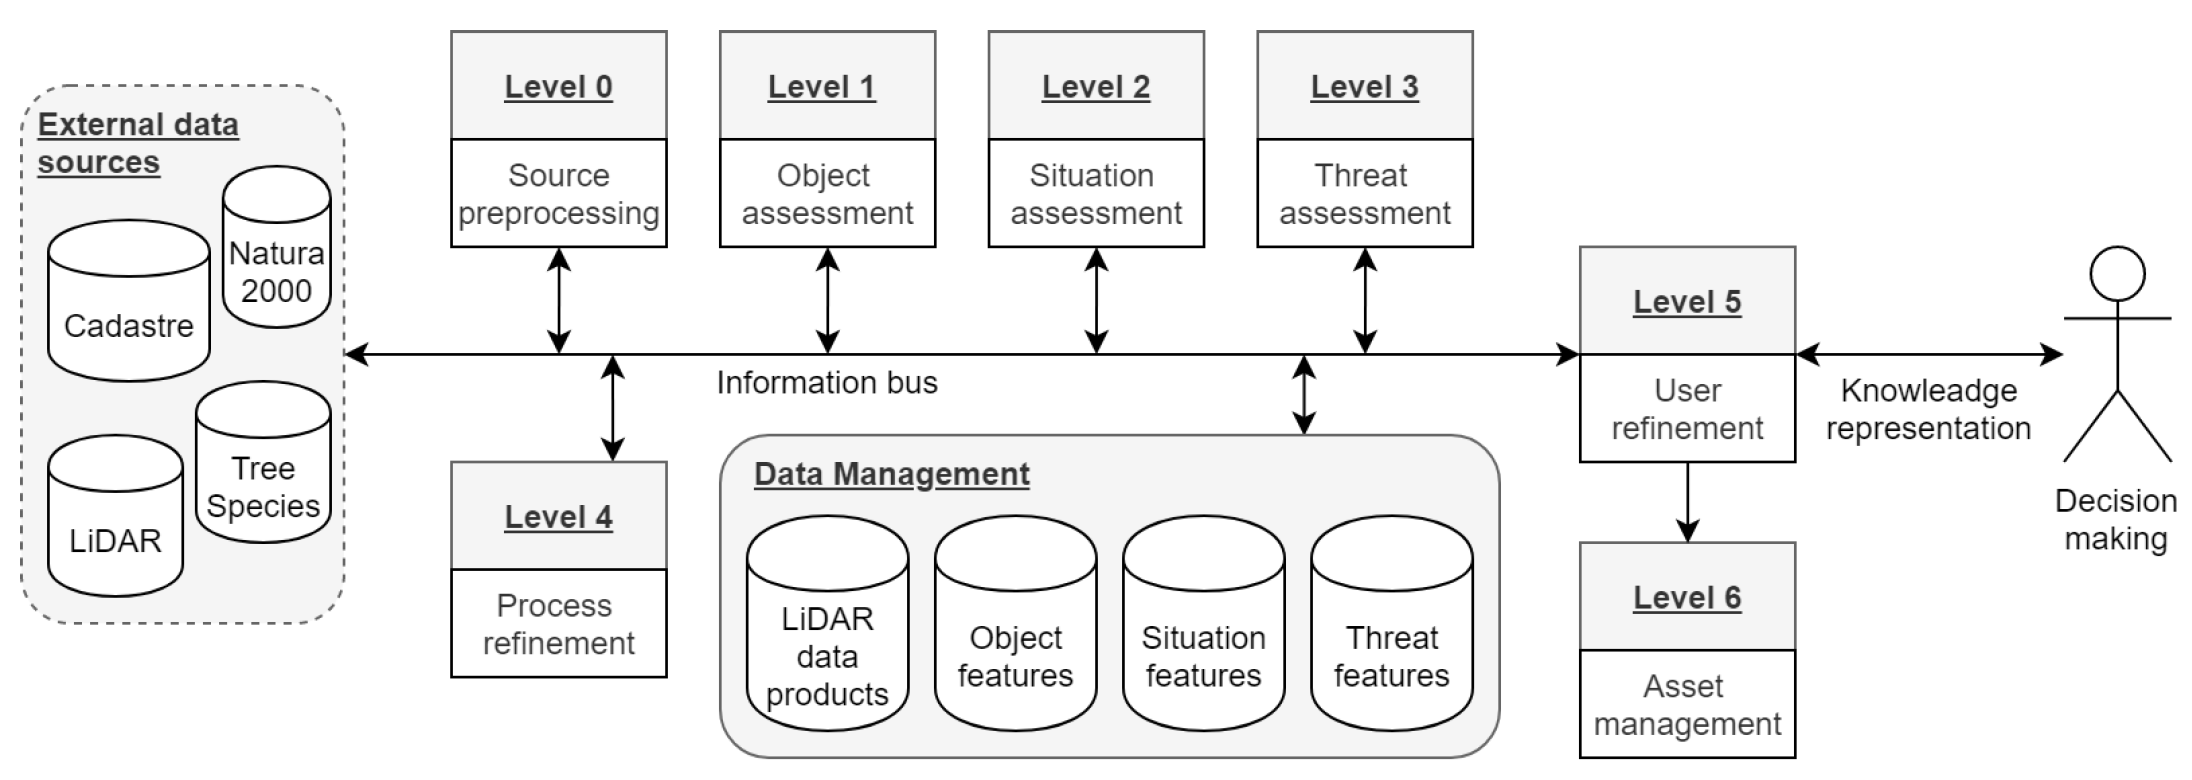
2.2. LiDAR Data Processing Framework for Vegetation Management
- Level 1—Object assessment dealt with the definition of individual trees, their features, as well as the features of power-lines;
- Level 2—Situation assessment provided encroaching vegetation detection and risk assessment features;
- Level 3—Threat assessment integrated tree-growth predictions for the assessment of risk prognosis features;
- Level 4—Process refinement dealt with the management of other levels, recorded performance of the system, provided adaptive data acquisition and made decisions on how to improve the system efficiency;
- Level 5—User refinement dealt with knowledge management and visual analytics to support decision-making; while
- Level 6—Asset management, in our case, provided task scheduling by also considering available resources, legal constraints, and other operational factors.
2.2.1. Level 1—Object Assessment
2.2.2. Level 2—Situation Assessment
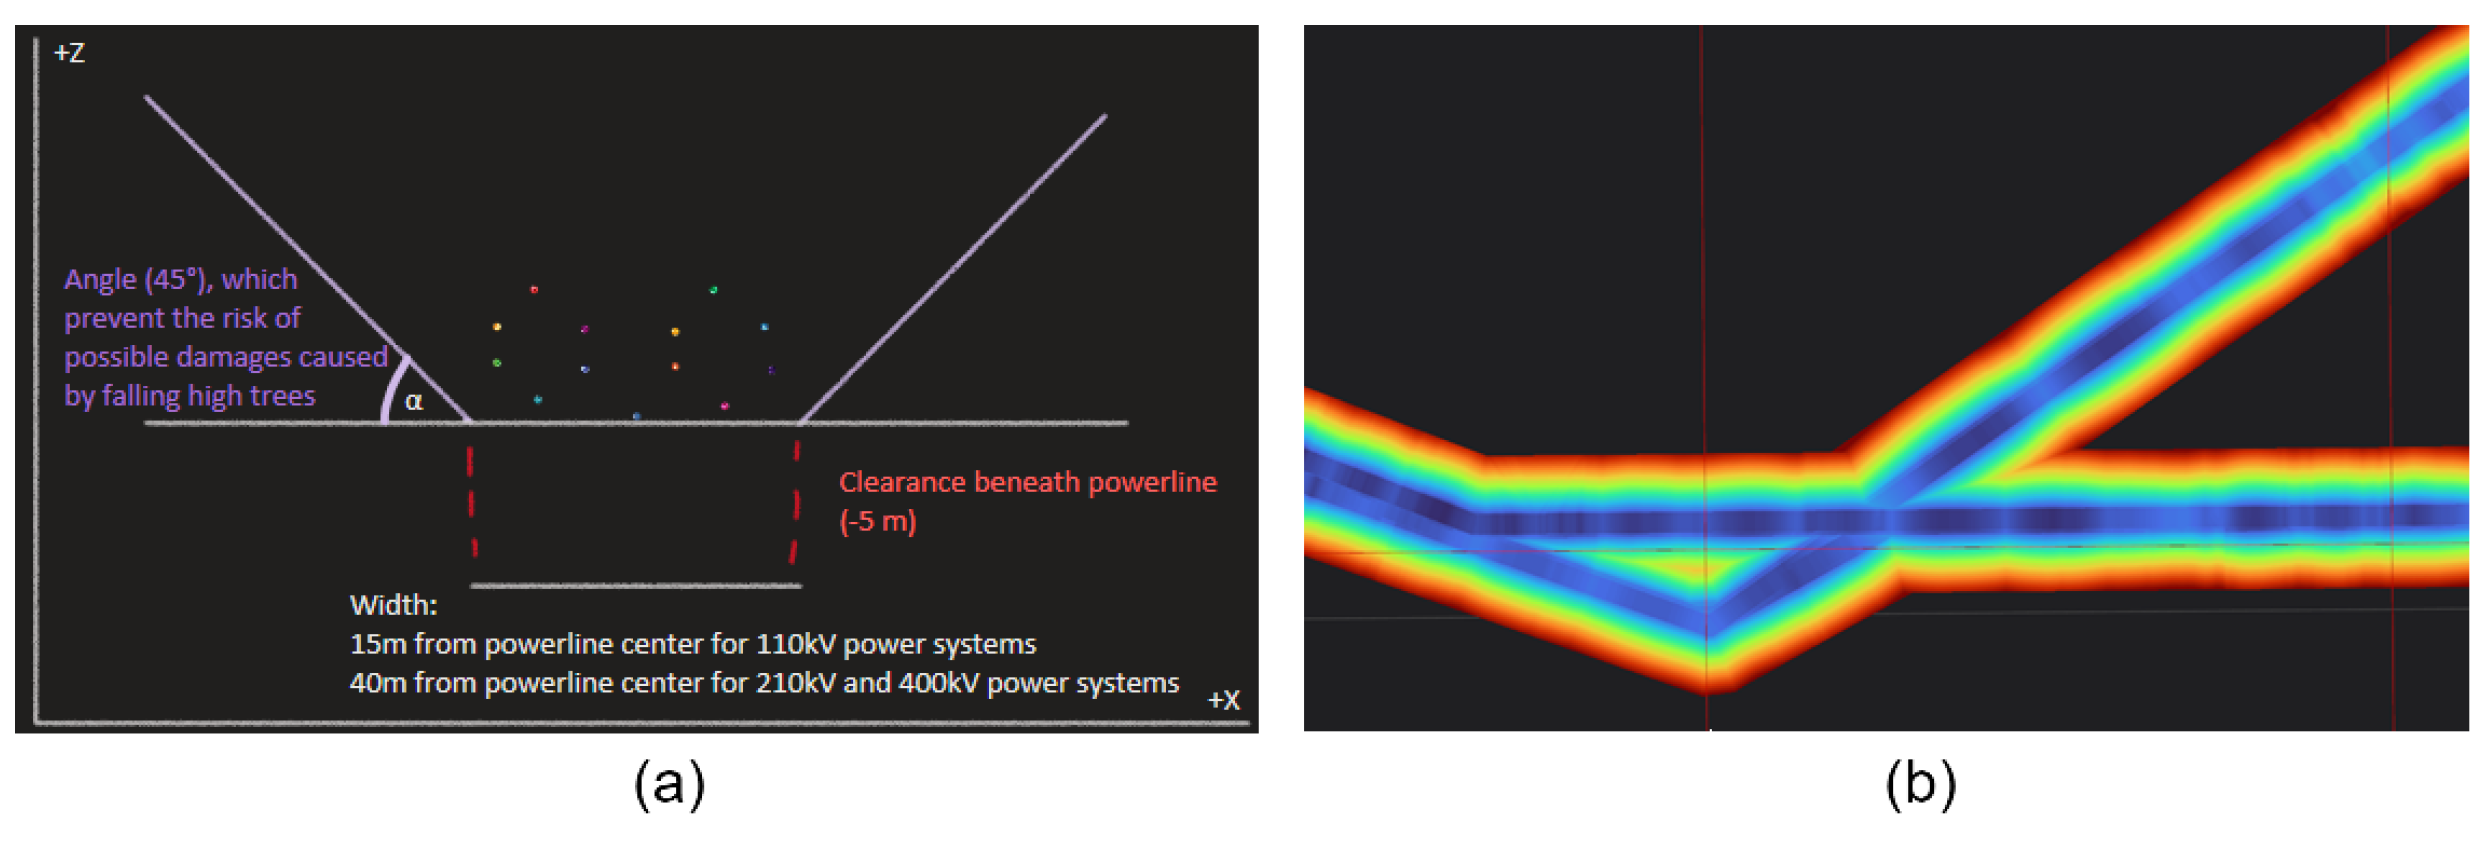
- The width of the filter was defined in accordance with the legislation, where 15 m was used for 110 kV transmission lines, while 40 m was used for higher voltage 210 kV and 400 kV power lines;
- The height of the filter was defined in accordance with the 3D shape of the lowest power-transmission line, ensuring at least 5 m clearance beneath it;
- The angle of the filter was fixed at in order to prevent the risk of possible damage cased by falling high trees.
2.2.3. Level 3—Threat Assessment
3. Results
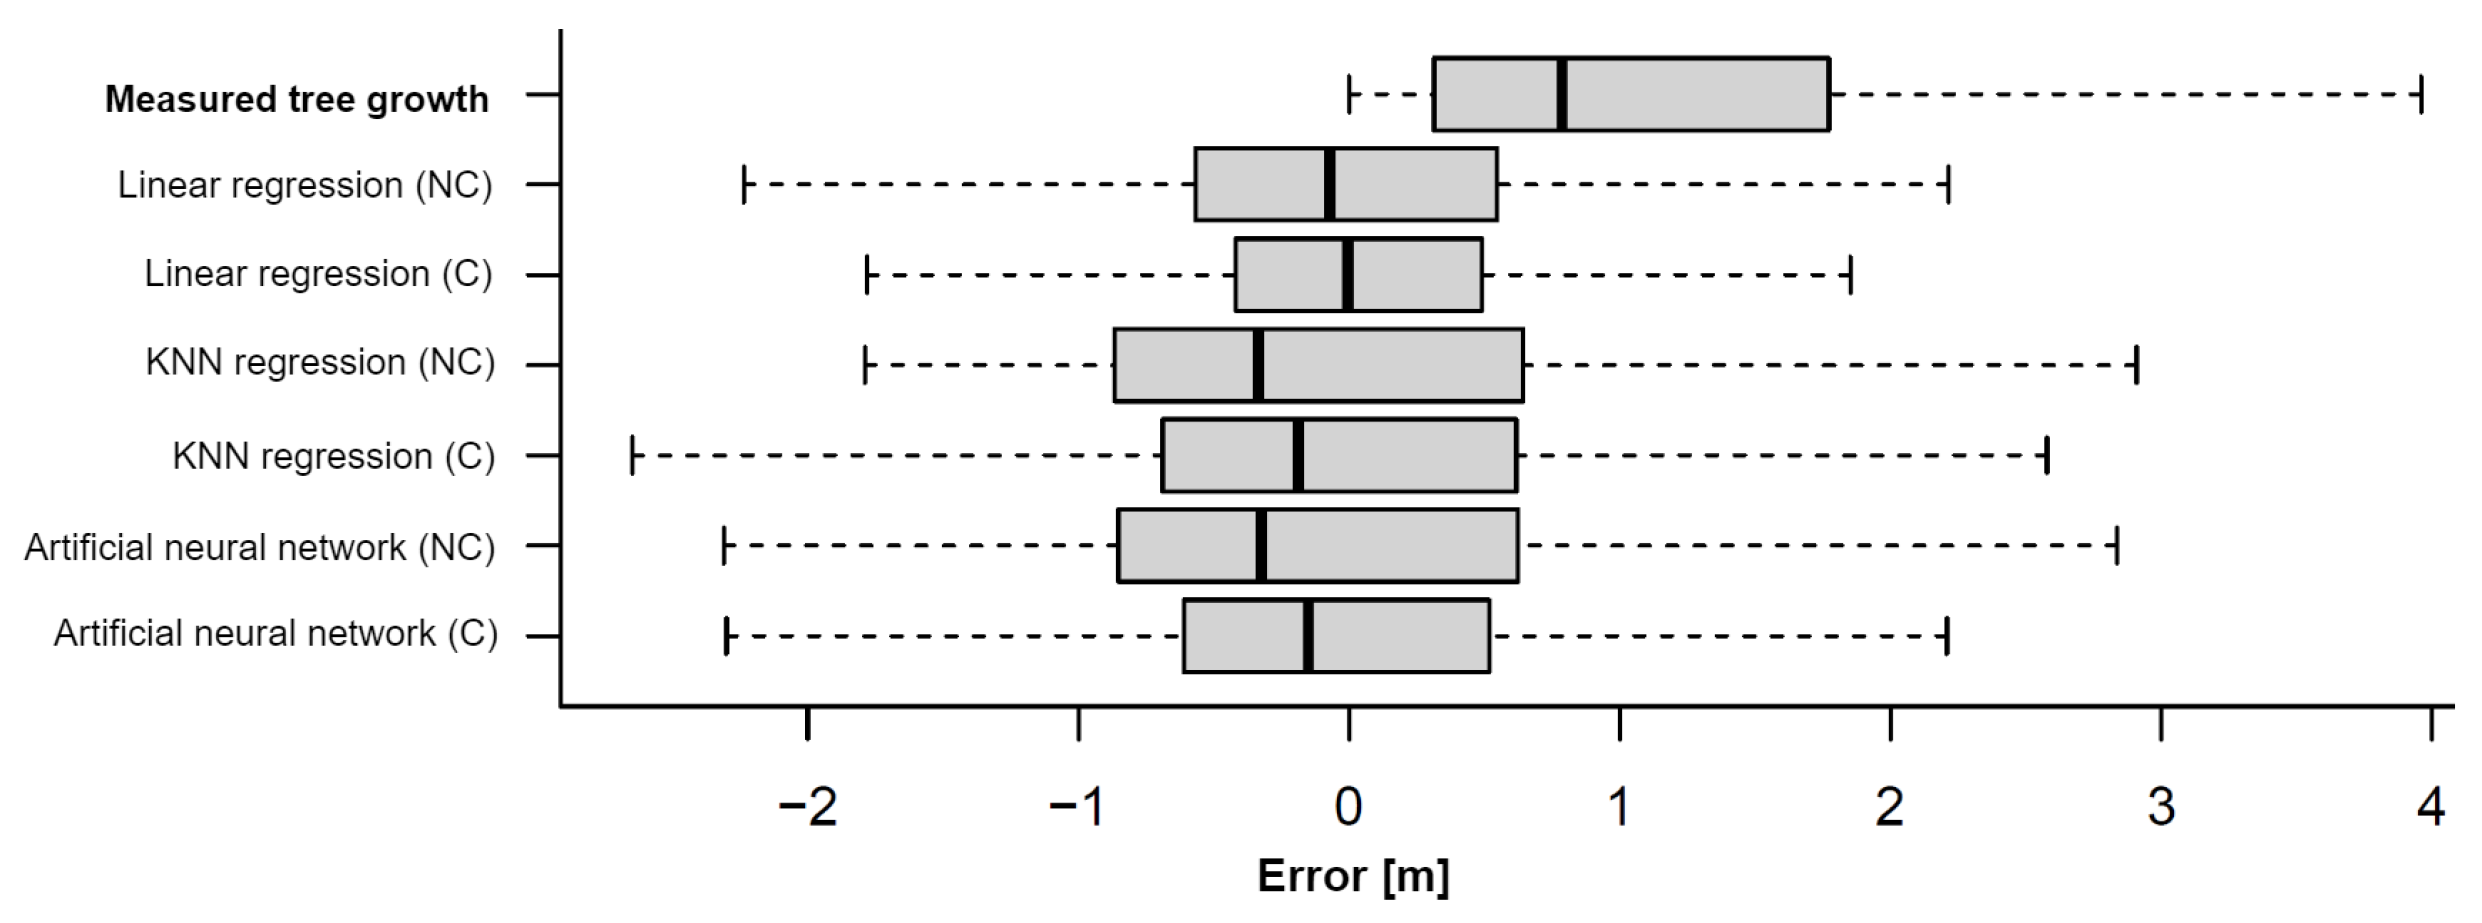
- Vegetation growth simulation accuracy was evaluated first, where Level 3 Threat assessment of data fusion was validated by pixel-comparison between the predicted and actual using the root-mean-square error () metric, defined aswhere was estimated by learning a weak regression model on contextually closest pixels to a pixel amongst all the pixels from the set ;
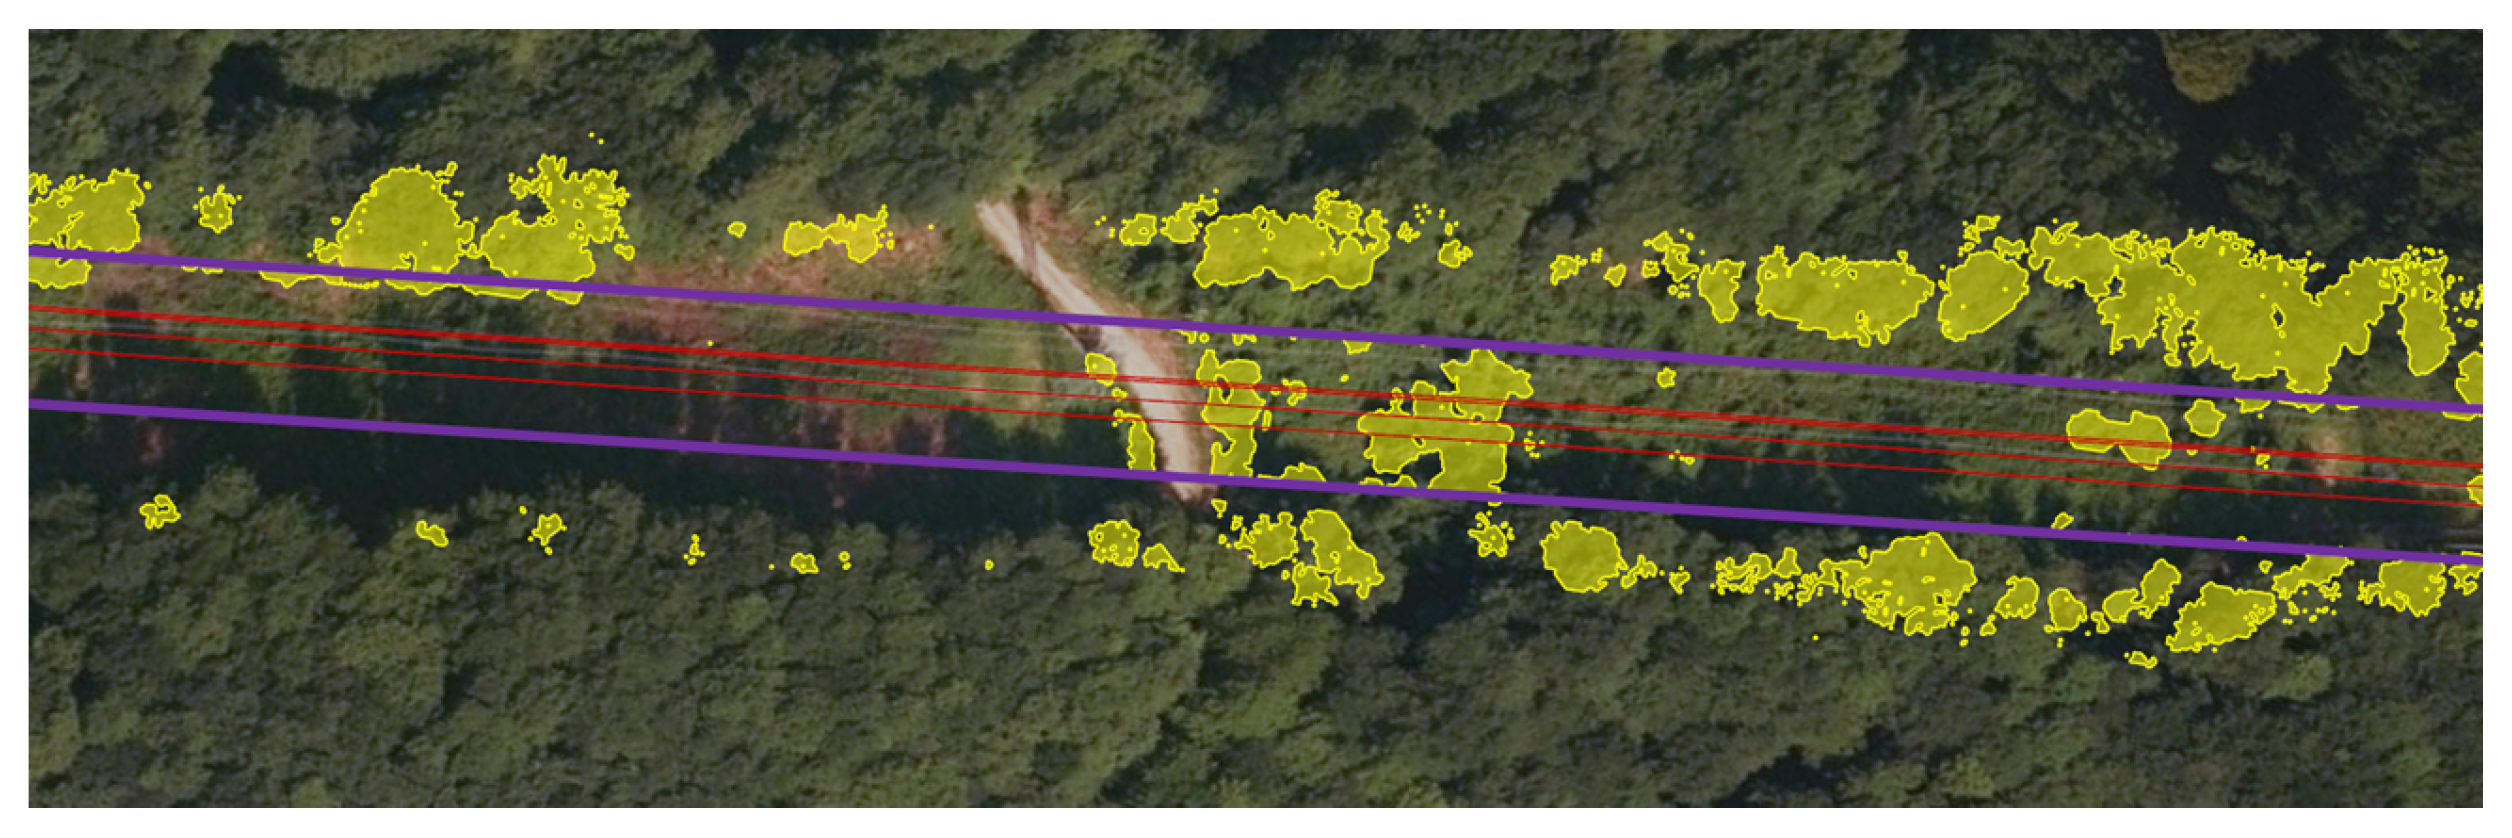
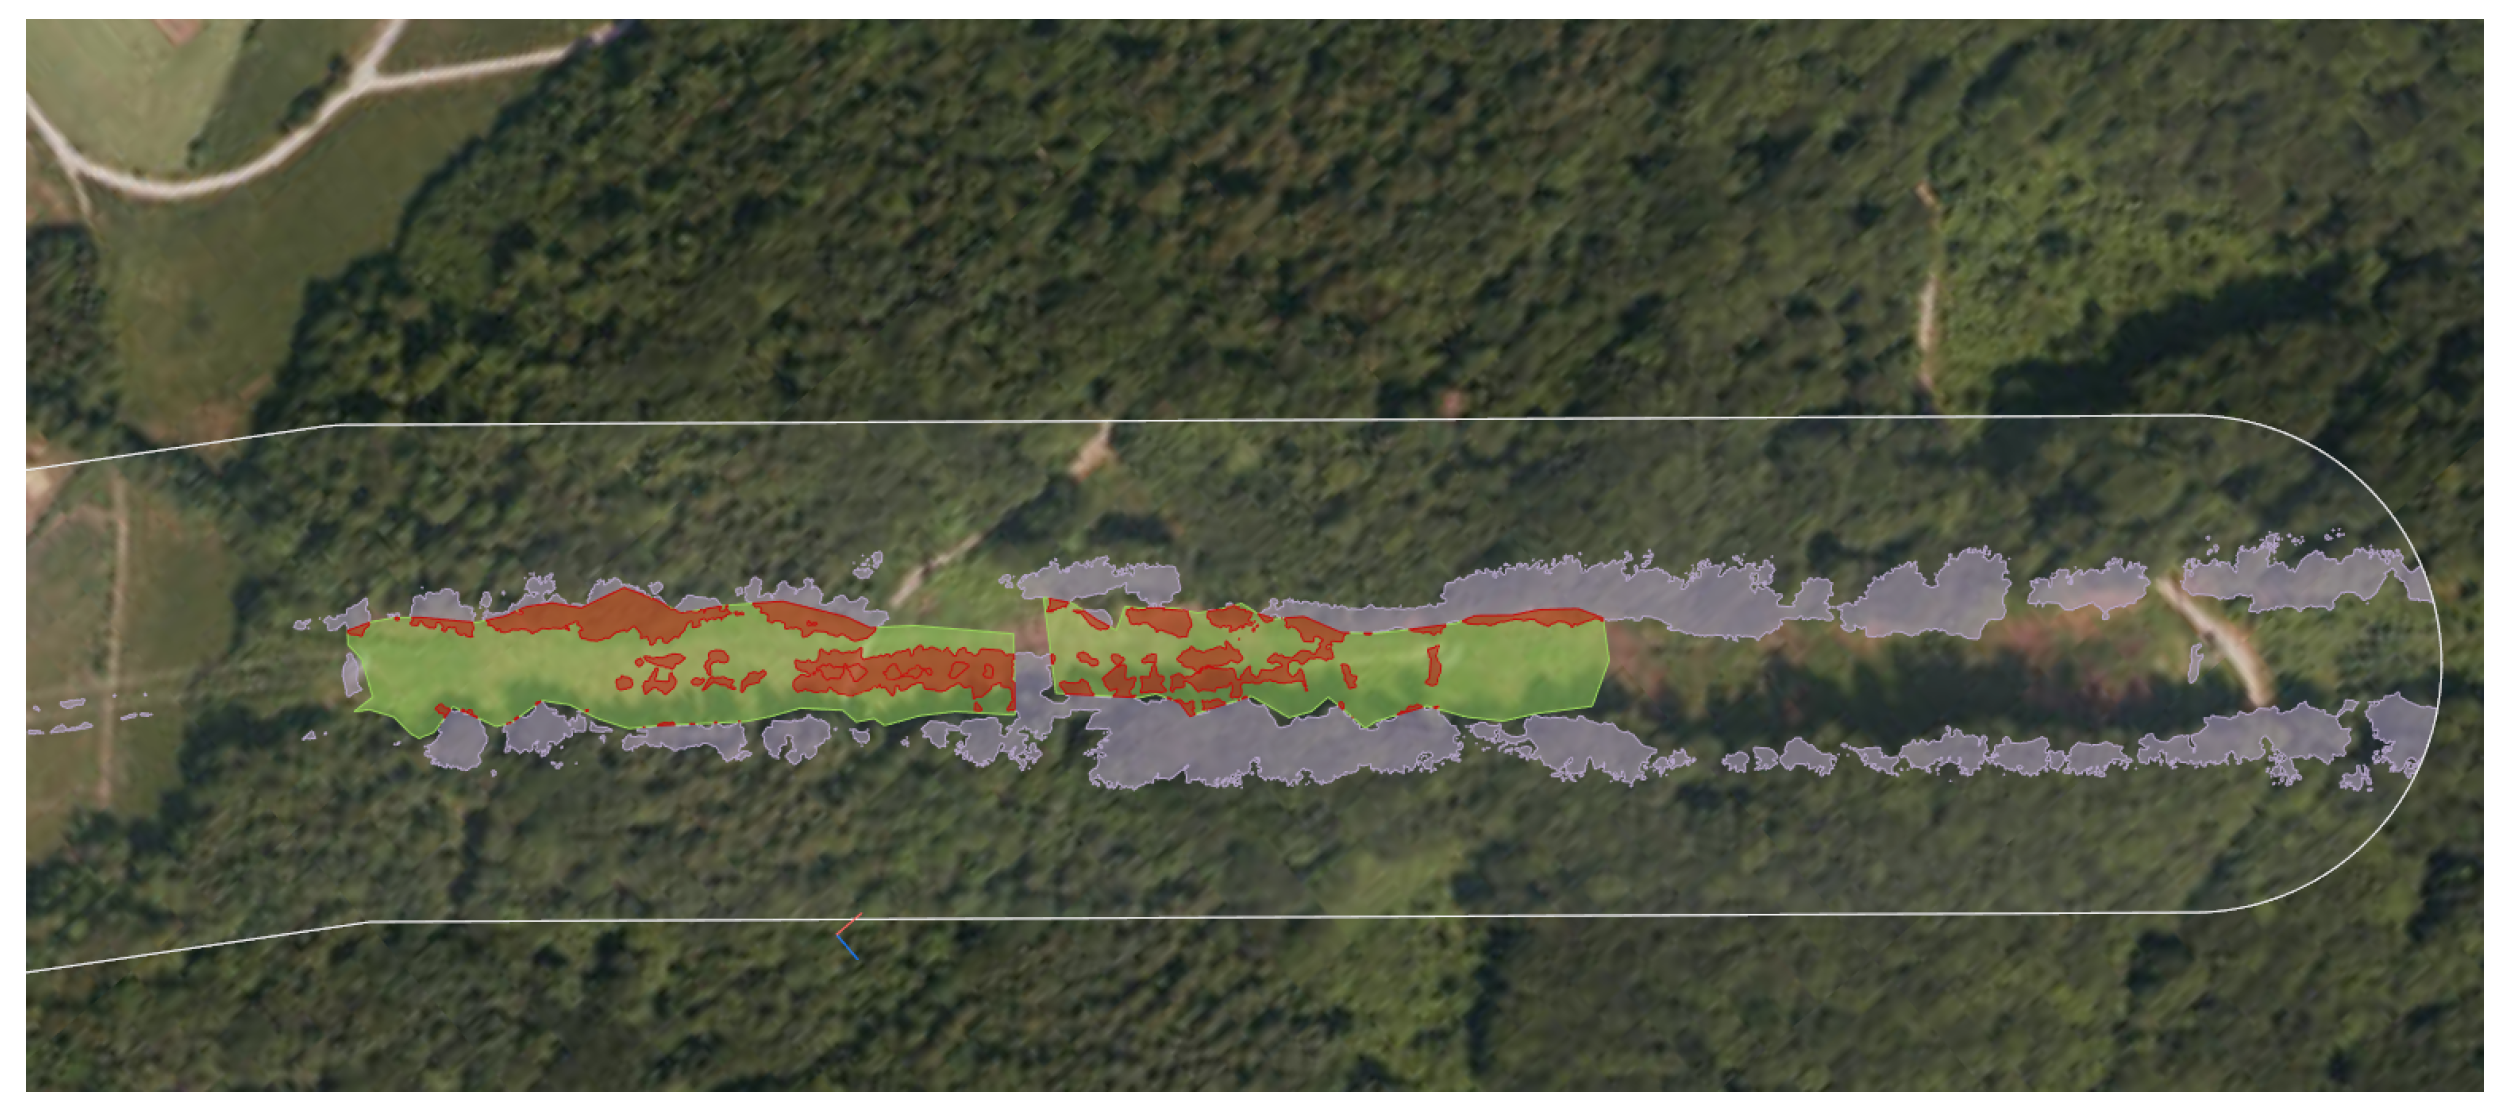
- Encroaching vegetation detection validation was then achieved in order to validate data fusion Level 2 situation assessment by comparing the areas of detected risks with the history of the performed power-line corridor cleaning tasks; and
- System performances’ assessment was finally carried out, where data preprocessing and object assessment, i.e., data fusion Levels 0 and 1, were evaluated additionally, and the overall data processing times are provided.
3.1. Vegetation Growth Simulation Assessment
3.2. Encroaching Vegetation Detection
3.3. System Performances
- DTM generation, together with LiDAR ground point labelling, achieved during preprocessing as proposed by Mongus, Lukač, and Žalik in [38];
- CHM generation, including labelling of vegetation points, achieved during preprocessing as proposed by Horvat, Mongus, and Žalik in [39];
- Delineation of single tree-crowns, achieved during object assessment in accordance with the methodology proposed by Mongus and Žlik in [31];
- Calculation of slope direction, based on Locally Fitted Surfaces (LoFS), proposed by Mongus, Lukač, and Žalik in [38], achieved during the object assessment;
- Other processing steps, such as resampling of raster data used during preprocessing and estimations of intersections between different layers for extraction of contextual features during object assessment.
4. Discussion
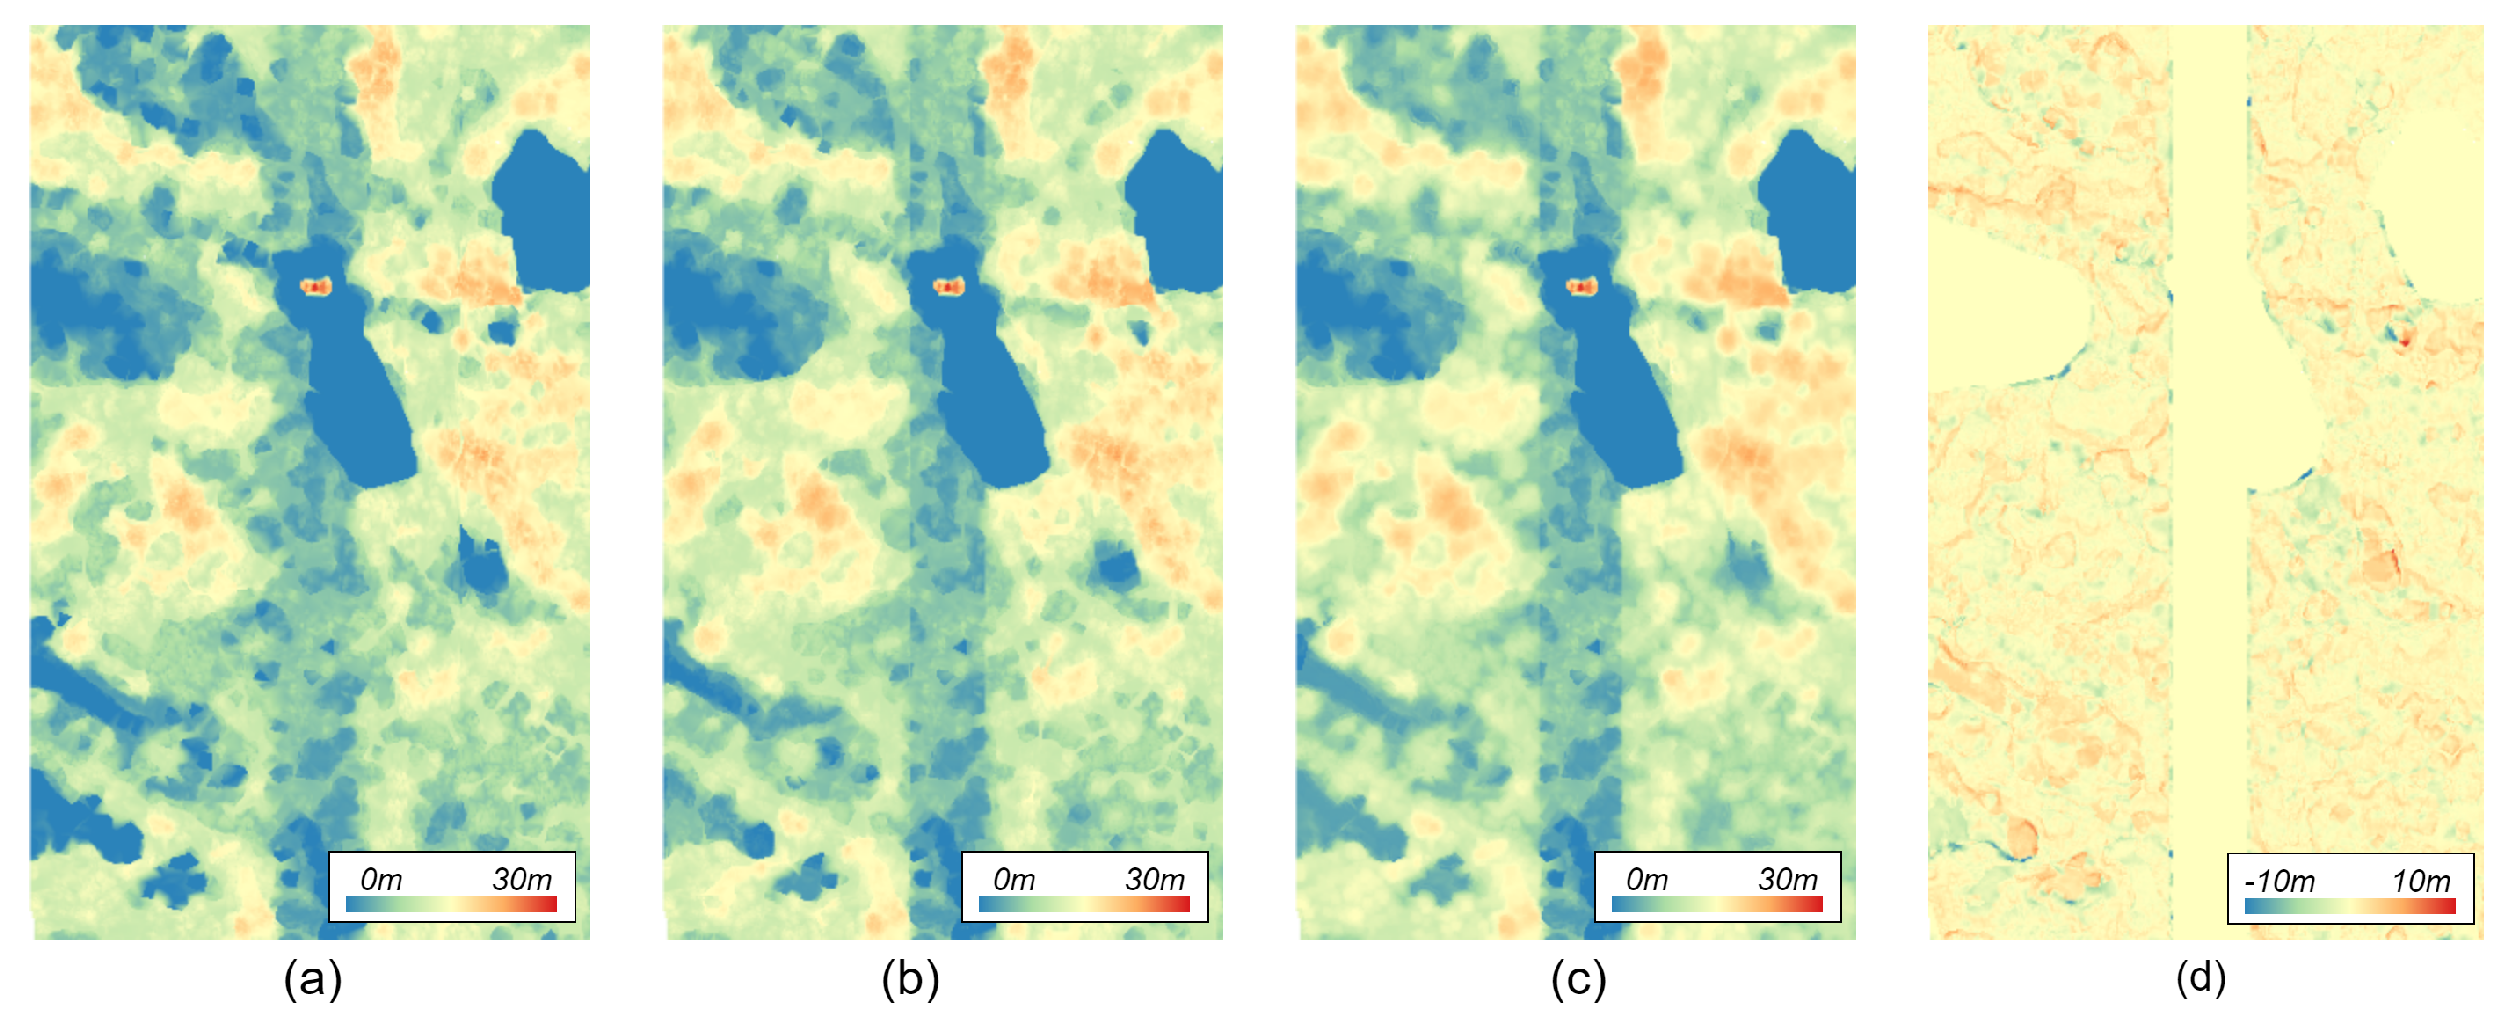
- Spatio-temporal data alignment was achieved by data sub-sampling to a common resolution, while composing the current state CHM by adjusting it according to past clearance task and predicted vegetation growth from the time the LiDAR data were recorded. As previous studies have focused exclusively on mapping the state of power line corridors, the proposed approach offers improved monitoring capacities that prolong the relevance of the acquired data.
- Situation assessment based on parametric definition of a funnel-shaped volumetric filter can be achieved in preprocessing, which allows for fast encroaching vegetation detection. While the results achieved on higher high-altitude airborne LiDAR, showed slightly lower, yet comparable, accuracy to the related study performed on UAV acquired data, significant improvements in comparison to the field-based encroaching vegetation detection have been demonstrated.
- Threat assessment, enabled by vegetation growth prediction that utilises contextual segmentation of learning data for tuning weak regression models to specific ecological niches. While this improved prediction accuracy, the proposed approach provides the first attempt towards establishing a digital twin of the power line corridor ecosystem.
Author Contributions
Funding
Institutional Review Board Statement
Informed Consent Statement
Data Availability Statement
Acknowledgments
Conflicts of Interest
References
- Chaurey, A.; Ranganathan, M.; Mohanty, P. Electricity access for geographically disadvantaged rural communities —technology and policy insights. Energy Policy 2004, 32, 1693–1705. [Google Scholar] [CrossRef]
- Garces, E.; Tomei, J.; Franco, C.J.; Dyner, I. Lessons from last mile electrification in Colombia: Examining the policy framework and outcomes for sustainability. Energy Res. Soc. Sci. 2021, 79, 102156. [Google Scholar]
- Mandelli, S.; Barbieri, J.; Mereu, R.; Colombo, E. Off-grid systems for rural electrification in developing countries: Definitions, classification and a comprehensive literature review. Renew. Sustain. Energy Rev. 2016, 58, 1621–1646. [Google Scholar] [CrossRef]
- Boliko, C.M.; Ialnazov, D.S. An assessment of rural electrification projects in Kenya using a sustainability framework. Energy Policy 2019, 133, 110928. [Google Scholar] [CrossRef]
- Mukhtar, M.; Obiora, S.; Yimen, N.; Quixin, Z.; Bamisile, O.; Jidele, P.; Irivboje, Y.I. Effect of inadequate electrification on Nigeria’s economic development and environmental sustainability. Sustainability 2021, 13, 2229. [Google Scholar] [CrossRef]
- Li, Y.; Cheng, X.; Cao, Y.; Wang, D.; Yang, L. Smart choice for the smart grid: Narrowband Internet of Things (NB-IoT). IEEE Internet Things J. 2017, 5, 1505–1515. [Google Scholar] [CrossRef]
- Dokic, T.; Kezunovic, M. Predictive risk management for dynamic tree trimming scheduling for distribution networks. IEEE Trans. Smart Grid 2018, 10, 4776–4785. [Google Scholar] [CrossRef]
- Haes Alhelou, H.; Hamedani-Golshan, M.E.; Njenda, T.C.; Siano, P. A survey on power system blackout and cascading events: Research motivations and challenges. Energies 2019, 12, 682. [Google Scholar] [CrossRef] [Green Version]
- Wanik, D.; Parent, J.; Anagnostou, E.; Hartman, B. Using vegetation management and LiDAR-derived tree height data to improve outage predictions for electric utilities. Electr. Power Syst. Res. 2017, 146, 236–245. [Google Scholar] [CrossRef]
- Kuntz, P.A.; Christie, R.D.; Venkata, S.S. Optimal vegetation maintenance scheduling of overhead electric power distribution systems. IEEE Trans. Power Deliv. 2002, 17, 1164–1169. [Google Scholar] [CrossRef]
- Eldegard, K.; Eyitayo, D.L.; Lie, M.H.; Moe, S.R. Can powerline clearings be managed to promote insect-pollinated plants and species associated with semi-natural grasslands? Landsc. Urban Plan. 2017, 167, 419–428. [Google Scholar] [CrossRef]
- Çoban, S.; Balekoğlu, S.; Özalp, G. Change in plant species composition on powerline corridor: A case study. Environ. Monit. Assess. 2019, 191, 200. [Google Scholar] [CrossRef] [PubMed]
- Matikainen, L.; Lehtomäki, M.; Ahokas, E.; Hyyppä, J.; Karjalainen, M.; Jaakkola, A.; Kukko, A.; Heinonen, T. Remote sensing methods for power line corridor surveys. ISPRS J. Photogramm. Remote Sens. 2016, 119, 10–31. [Google Scholar] [CrossRef] [Green Version]
- Melzer, T.; Briese, C. Extraction and modeling of power lines from ALS point clouds. Proceedings of 28th Workshop of the Austrian Association for Pattern Recognition, Hagenberg, Austria, 22–23 May 2004; pp. 47–54. [Google Scholar]
- McLaughlin, R.A. Extracting transmission lines from airborne LIDAR data. IEEE Geosci. Remote Sens. Lett. 2006, 3, 222–226. [Google Scholar] [CrossRef]
- Kim, H.B.; Sohn, G. Point-based classification of power line corridor scene using random forests. Photogramm. Eng. Remote Sens. 2013, 79, 821–833. [Google Scholar] [CrossRef]
- Cheng, L.; Tong, L.; Wang, Y.; Li, M. Extraction of urban power lines from vehicle-borne LiDAR data. Remote Sens. 2014, 6, 3302–3320. [Google Scholar] [CrossRef] [Green Version]
- Zhu, L.; Hyyppä, J. Fully-automated power line extraction from airborne laser scanning point clouds in forest areas. Remote Sens. 2014, 6, 11267–11282. [Google Scholar] [CrossRef] [Green Version]
- Jwa, Y.; Sohn, G.; Kim, H. Automatic 3d powerline reconstruction using airborne lidar data. Int. Arch. Photogramm. Remote Sens. Spat. Inf. Sci. 2009, 38, W8. [Google Scholar]
- Jwa, Y.; Sohn, G. A piecewise catenary curve model growing for 3D power line reconstruction. Photogramm. Eng. Remote Sens. 2012, 78, 1227–1240. [Google Scholar] [CrossRef]
- Guo, B.; Li, Q.; Huang, X.; Wang, C. An improved method for power-line reconstruction from point cloud data. Remote Sens. 2016, 8, 36. [Google Scholar] [CrossRef] [Green Version]
- Guo, B.; Huang, X.; Li, Q.; Zhang, F.; Zhu, J.; Wang, C. A Stochastic Geometry Method for Pylon Reconstruction from Airborne LiDAR Data. Remote Sens. 2016, 8, 243. [Google Scholar] [CrossRef] [Green Version]
- Ortega, S.; Trujillo, A.; Santana, J.M.; Suárez, J.P.; Santana, J. Characterization and modeling of power line corridor elements from LiDAR point clouds. ISPRS J. Photogramm. Remote Sens. 2019, 152, 24–33. [Google Scholar] [CrossRef]
- Awrangjeb, M. Extraction of power line pylons and wires using airborne lidar data at different height levels. Remote Sens. 2019, 11, 1798. [Google Scholar] [CrossRef] [Green Version]
- Zhou, R.; Jiang, W.; Jiang, S. A novel method for high-voltage bundle conductor reconstruction from airborne LiDAR data. Remote Sens. 2018, 10, 2051. [Google Scholar] [CrossRef] [Green Version]
- Ko, C.; Remmel, T.K.; Sohn, G. Mapping tree genera using discrete LiDAR and geometric tree metrics. Bosque 2012, 33, 313–319. [Google Scholar] [CrossRef] [Green Version]
- Chen, C.; Yang, B.; Song, S.; Peng, X.; Huang, R. Automatic clearance anomaly detection for transmission line corridors utilizing UAV-Borne LIDAR data. Remote Sens. 2018, 10, 613. [Google Scholar] [CrossRef] [Green Version]
- Munir, N.; Awrangjeb, M.; Stantic, B. An improved method for pylon extraction and vegetation encroachment analysis in high voltage transmission lines using LiDAR data. In Proceedings of the 2020 Digital Image Computing: Techniques and Applications (DICTA), Melbourne, Australia, 29 November–2 December 2020. [Google Scholar]
- Mills, S.J.; Castro, M.P.G.; Li, Z.; Cai, J.; Hayward, R.; Mejias, L.; Walker, R.A. Evaluation of aerial remote sensing techniques for vegetation management in power-line corridors. IEEE Trans. Geosci. Remote Sens. 2010, 48, 3379–3390. [Google Scholar] [CrossRef]
- Hartling, S.; Sagan, V.; Maimaitijiang, M.; Dannevik, W.; Pasken, R. Estimating tree-related power outages for regional utility network using airborne LiDAR data and spatial statistics. Int. J. Appl. Earth Obs. Geoinf. 2021, 100, 102330. [Google Scholar] [CrossRef]
- Mongus, D.; Žalik, B. An efficient approach to 3D single tree-crown delineation in LiDAR data. ISPRS J. Photogramm. Remote Sens. 2015, 108, 219–233. [Google Scholar] [CrossRef]
- Kolendo, Ł.; Kozniewski, M.; Ksepko, M.; Chmur, S.; Neroj, B. Parameterization of the Individual Tree Detection Method Using Large Dataset from Ground Sample Plots and Airborne Laser Scanning for Stands Inventory in Coniferous Forest. Remote Sens. 2021, 13, 2753. [Google Scholar] [CrossRef]
- Donager, J.J.; Sánchez Meador, A.J.; Blackburn, R.C. Adjudicating Perspectives on Forest Structure: How Do Airborne, Terrestrial, and Mobile Lidar-Derived Estimates Compare? Remote Sens. 2021, 13, 2297. [Google Scholar] [CrossRef]
- Hopkinson, C.; Chasmer, L.; Hall, R. The uncertainty in conifer plantation growth prediction from multi-temporal lidar datasets. Remote Sens. Environ. 2008, 112, 1168–1180. [Google Scholar] [CrossRef]
- Hudak, A.T.; Evans, J.S.; Stuart Smith, A.M. LiDAR utility for natural resource managers. Remote Sens. 2009, 1, 934–951. [Google Scholar] [CrossRef] [Green Version]
- Zhao, K.; Suarez, J.C.; Garcia, M.; Hu, T.; Wang, C.; Londo, A. Utility of multitemporal lidar for forest and carbon monitoring: Tree growth, biomass dynamics, and carbon flux. Remote Sens. Environ. 2018, 204, 883–897. [Google Scholar] [CrossRef]
- Liu, M.; Fang, S.; Dong, H.; Xu, C. Review of digital twin about concepts, technologies, and industrial applications. J. Manuf. Syst. 2021, 58, 346–361. [Google Scholar] [CrossRef]
- Mongus, D.; Lukač, N.; Žalik, B. Ground and building extraction from LiDAR data based on differential morphological profiles and locally fitted surfaces. ISPRS J. Photogramm. Remote Sens. 2014, 93, 145–156. [Google Scholar] [CrossRef]
- Horvat, D.; Žalik, B.; Mongus, D. Context-dependent detection of non-linearly distributed points for vegetation classification in airborne LiDAR. ISPRS J. Photogramm. Remote Sens. 2016, 116, 1–14. [Google Scholar] [CrossRef]
- Khosravipour, A.; Skidmore, A.K.; Isenburg, M.; Wang, T.; Hussin, Y.A. Generating pit-free canopy height models from airborne lidar. Photogramm. Eng. Remote Sens. 2014, 80, 863–872. [Google Scholar] [CrossRef]
- Strnad, D.; Kohek, Š.; Kolmanič, S. Fuzzy modelling of growth potential in forest development simulation. Ecol. Inform. 2018, 48, 80–88. [Google Scholar] [CrossRef]
- Rees, W. The accuracy of digital elevation models interpolated to higher resolutions. Int. J. Remote Sens. 2000, 21, 7–20. [Google Scholar] [CrossRef]
- Li, Z. Multi-scale modelling and representation of geospatial data. In Advances in Photogrammetry, Remote Sensing and Spatial Information Sciences: 2008 ISPRS Congress Book; CRC Press: Boca Raton, FL, USA, 2008; pp. 283–296. [Google Scholar]
- Meng, T.; Jing, X.; Yan, Z.; Pedrycz, W. A survey on machine learning for data fusion. Inf. Fusion 2020, 57, 115–129. [Google Scholar] [CrossRef]
- Munir, A.; Blasch, E.; Kwon, J.; Kong, J.; Aved, A. Artificial Intelligence and Data Fusion at the Edge. IEEE Aerosp. Electron. Syst. Mag. 2021, 36, 62–78. [Google Scholar] [CrossRef]
- Aigner, M.; Heinrich, C.; Jüttler, B.; Pilgerstorfer, E.; Simeon, B.; Vuong, A.V. Swept volume parameterization for isogeometric analysis. In IMA International Conference on Mathematics of Surfaces; Springer: Berlin/Heidelberg, Germany, 2009; pp. 19–44. [Google Scholar]
- Bajaj, C.L.; Pascucci, V.; Schikore, D.R. Seed Sets and Search Structures for Optimal Isocontour Extraction; Technical Report 99-35; Texas Institute for Computational and Applied: Austin, TX, USA, 1999. [Google Scholar]
- Song, Y.; Liang, J.; Lu, J.; Zhao, X. An efficient instance selection algorithm for k nearest neighbor regression. Neurocomputing 2017, 251, 26–34. [Google Scholar] [CrossRef]



| Year(s) of | SPATIAL | ||
|---|---|---|---|
| Data-Source Description | Type | Acquisition | Resolution |
| Power transmission line axes | Geometry | 2021 | m |
| Mean amount of precipitation | Geometry | 1981–2010 | 100 m |
| Mean air temperature | Geometry | 1981–2010 | 100 m |
| Sunshine duration in summer | Geometry | 1981–2010 | 100 m |
| Tree species distribution map | Raster | 2020 | 10 m |
| Soil quality index | Raster | 2011–2012 | 250 m |
| Soil pH | Raster | 2011–2012 | 250 m |
| Name | Notation | Description | Data source |
|---|---|---|---|
| Tree height | The highest point within the extent of the tree crown. | CHM | |
Tree species | Probabilities of the tree belonging to one of the three most common species in its extent | Tree species distribution map | |
Soil index | Average soil quality index within the extent of the tree crown | Soil quality index | |
| Soil pH | Average soil pH within the extent of the tree crown | Soil pH factors | |
| Amount of precipitation | The annual amount of precipitation per area of the tree crown | Mean amount of precipitation | |
Air temperature | 10 years average temperature within the extent of the tree crown | Mean air temperature | |
Sunshine duration | 10 years average sunshine duration in the area of the tree crown in summer | Sunshine duration in summer | |
Slope direction | A slope normal, estimated by Locally Fitted Surface (LoFS) [38] to the area of the tree crown | Digital terrain model |
| Number | Cache | Main | ||
|---|---|---|---|---|
| Type | CPU | of Cores | [MB] | Memory [GB] |
| Work- station | AMD® Ryzen™ Threadripper™ 1920X | 12 | 39.1 | 64 |
| Server | Intel® Xeon® E5-2650 v3 | 6 | 25 | 16 |
| Laptop | Intel® Core™ i7-9750HX | 6 | 14 | 64 |
| Execution Times [s] | |||||
|---|---|---|---|---|---|
| Regression Method | Segmentation | Workstation | Server | Laptop | |
| Linear regression | No | 170.3 | 293.5 | 188.3 | 1.16 |
| KNN regression | No | 179.6 | 306.4 | 198.6 | 1.38 |
| Artificial neural network | No | 342.7 | 586.7 | 379.0 | 1.36 |
| Linear regression | Yes | 602.6 | 1032.2 | 666.4 | 1.04 |
| KNN regression | Yes | 604.5 | 1035.2 | 668.1 | 1.29 |
| Artificial neural network | Yes | 774.2 | 1325.5 | 856.3 | 1.16 |
| AVG | No | 230.1 | 395.5 | 255.3 | 1.30 |
| AVG | Yes | 660.4 | 1130.1 | 730.3 | 1.16 |
| Average Execution Time [s] | Time | |||
|---|---|---|---|---|
| Step | Workstation | Server | Laptop | Complexity |
| Volumetric filter definition | ||||
| Filter rasterisation | ||||
| Encroaching vegetation detection | ||||
| Definition of ISO-lines | ||||
| Preprocessing (total) | ||||
| Runtime (total) | ||||
| Total | ||||
| Average Execution Time [s] | |||
|---|---|---|---|
| Step | Workstation | Server | Laptop |
| DTM generation | |||
| CHM generation | |||
| Delineation of single tree-crowns | |||
| Calculation of slope direction | |||
| Other | |||
| Total | |||
Publisher’s Note: MDPI stays neutral with regard to jurisdictional claims in published maps and institutional affiliations. |
© 2021 by the authors. Licensee MDPI, Basel, Switzerland. This article is an open access article distributed under the terms and conditions of the Creative Commons Attribution (CC BY) license (https://creativecommons.org/licenses/by/4.0/).
Share and Cite
Mongus, D.; Brumen, M.; Žlaus, D.; Kohek, Š.; Tomažič, R.; Kerin, U.; Kolmanič, S. A Complete Environmental Intelligence System for LiDAR-Based Vegetation Management in Power-Line Corridors. Remote Sens. 2021, 13, 5159. https://doi.org/10.3390/rs13245159
Mongus D, Brumen M, Žlaus D, Kohek Š, Tomažič R, Kerin U, Kolmanič S. A Complete Environmental Intelligence System for LiDAR-Based Vegetation Management in Power-Line Corridors. Remote Sensing. 2021; 13(24):5159. https://doi.org/10.3390/rs13245159
Chicago/Turabian StyleMongus, Domen, Matej Brumen, Danijel Žlaus, Štefan Kohek, Roman Tomažič, Uroš Kerin, and Simon Kolmanič. 2021. "A Complete Environmental Intelligence System for LiDAR-Based Vegetation Management in Power-Line Corridors" Remote Sensing 13, no. 24: 5159. https://doi.org/10.3390/rs13245159
APA StyleMongus, D., Brumen, M., Žlaus, D., Kohek, Š., Tomažič, R., Kerin, U., & Kolmanič, S. (2021). A Complete Environmental Intelligence System for LiDAR-Based Vegetation Management in Power-Line Corridors. Remote Sensing, 13(24), 5159. https://doi.org/10.3390/rs13245159


