1. Introduction
Stray light is one of the main factors that affect the performance of the satellite optical payload. For an optical system, stray light implies unwanted rays reaching the detecting surfaces that comes from an unintended source, or from an intended source which follows an unintended path [
1]. The stray light that affects the optical payload may come from the Sun, the Moon, the Earth’s atmosphere and the instrument’s own radiation. When stray light reaches the imaging sensor, it may confuse the energy distribution and decrease the signal-to-noise ratio, which seriously affects the imaging quality and detection ability of the whole system [
2,
3]. The analysis of stray light for the satellite optical payload is required both during the instrument design and orbit operation stages.
Theoretical analysis and simulation are often firstly performed to suppress the stray light during the instrument design stage. For example, Li [
4] calculated the point source normalized irradiance transmittance of the Xinglong 2.16m telescope at different off-axis angles, identified the dominant contributors to stray light, and added only five vanes inside the bottom portion of the secondary baffle to improve its stray light suppression capability. Park [
5] identified the critical objects and illumination objects by ray tracing to discover the stray light sources of a high resolution spaceborne camera on a low-Earth-orbit satellite. Wang [
6] analyzed the basic principle and the mathematical model of stray light for a geostationary orbit satellite, then obtained the requirements of stray light suppression under different imaging situations. Zhong [
7] analyzed the range of solar incident angles of the nighttime camera on the Luojia-1 satellite and designed a special-shaped baffle to avoid direct sunlight incidence. To sum up, possible sources of stray light need to be analyzed during instrument design to optimize features which suppress stray light such as hoods, shading rings, and internal coating absorption paint.
Despite the importance of stray light analysis during the instrument design phase, in complex space light environments, it is often difficult to completely eliminate the stray light effects of on-orbit imaging payloads only by relying on mechanically stray light suppression measures such as design of the baffle. Therefore, it is necessary to make a reasonable and efficient estimation of the stray light for on-orbit optical payload to eliminate the influence of stray light and improve the quality of satellite data.
On-orbit stray light estimation methods can be divided into two types. The first is based on on-orbit satellite data processing. It assumes that some image data from optical payload contaminated by stray light contain the information on the spatial distribution of stray light. The spatial distribution model of stray light extracted from these images can eliminate stray light noise in other scenes. Guo [
8] described the stray light model function with the stray light distribution outside of the Earth region and applied it to the inside of the Earth region to estimate the stray light of full field of view [
8]. Yan [
9] selected homogeneous feature images containing stray light pollution noise to calculate the stray light distribution feature curve. The adaptive algorithm is used to calculate the optimal correction coefficients for the chunked image. Mills and Lee [
10,
11] evaluated the stray light of Visible Infrared Imaging Radiometer Suite based on Earth-viewed data measured over dark surfaces during moonless nights. Wang [
12] corrected the stray light of Landsat 8 Thermal Infrared Sensor through using the information of external sensors. Ando [
13] extracted the Line Spread Function of the radiometer on-orbit employing the cross section of the Moon to correct the stray light of lunar images as well as from Earth images.
The second type is based on the formation mechanism of stray light, and analysis is carried out in combination with the actual situation in orbit. For example, You [
14] analyzed the formation mechanism of four different types of stray light based on the working mechanism of the multispectral channel imager on-board FY-2C, and corresponding improvement measures were put forward. Niu [
15] simulated the incidence angles of sunlight in FY-3 orbit to analyze the stray light pollution changes with the rotation of the scanning mirror and the flight position of the satellite. Chen [
16] analyzed the orbit characteristics and solar incidence angles distribution of Sun-synchronous orbit satellite, and kept out direct sunlight by designing a baffle.
FY-3C is a Chinese second-generation polar meteorological satellite [
17]. The Visible Infrared Radiometer (VIRR) is one of the key instruments of the FY-3C satellite. By studying the calibration blackbody count value, Xu [
18] found that sunlight can enter the interior of the VIRR when the satellite is crossing the day–night terminators at high latitudes. However, there is no research that has quantitatively described the VIRR stray light’s regularity and intensity. Here, we apply the FY-3C satellite orbital attitude model to quantitative analyze the VIRR stray light. There are two kinds of stray light according to its source. One kind of stray light, which is called the external stray light, comes from external radiation sources, which mainly include the Sun, the Moon, and ground gas. Another kind of stray light, which is called the internal stray light, is the radiation generated by the optical instrument’s internal structure [
19]. During the design phase of VIRR, the internal stray light has been optimized to be negligible. Therefore, we mainly consider the influence of external solar stray light on the VIRR. In this paper, based on the analysis of the solar stray light generation mechanism and theoretical model, we propose a simulation and analysis method combined with satellite orbit attitude model to quantitatively investigate the influence of solar stray light on the imaging quality of the VIRR. We simulate the sensor operation in orbit by using FY-3C orbital parameters to obtain the Sun vector variation pattern. By combining the optical scattering model into the VIRR mechanical structure model, we calculate the regularity of the stray light as well as the spatial distribution of the irradiation on the primary mirror. The remainder of this paper is organized as follows.
Section 2 theoretically analyzes the conditions and the incident paths of external solar stray light for VIRR.
Section 3 describes the detailed steps of external stray light simulation method. The evaluation results and discussion are presented in
Section 4. Conclusions are provided in
Section 5.
3. Methods
For the VIRR instrument, when the Sun–Earth–satellite geometry relationship changes, the incident parameters of sunlight will also change. Additionally, the incident path of sunlight, spatial distribution and solar incidence parameters are closely related. Therefore, we propose a simulation method utilizing satellite orbit attitude model to investigate the influence of solar stray light on the imaging quality of the VIRR.
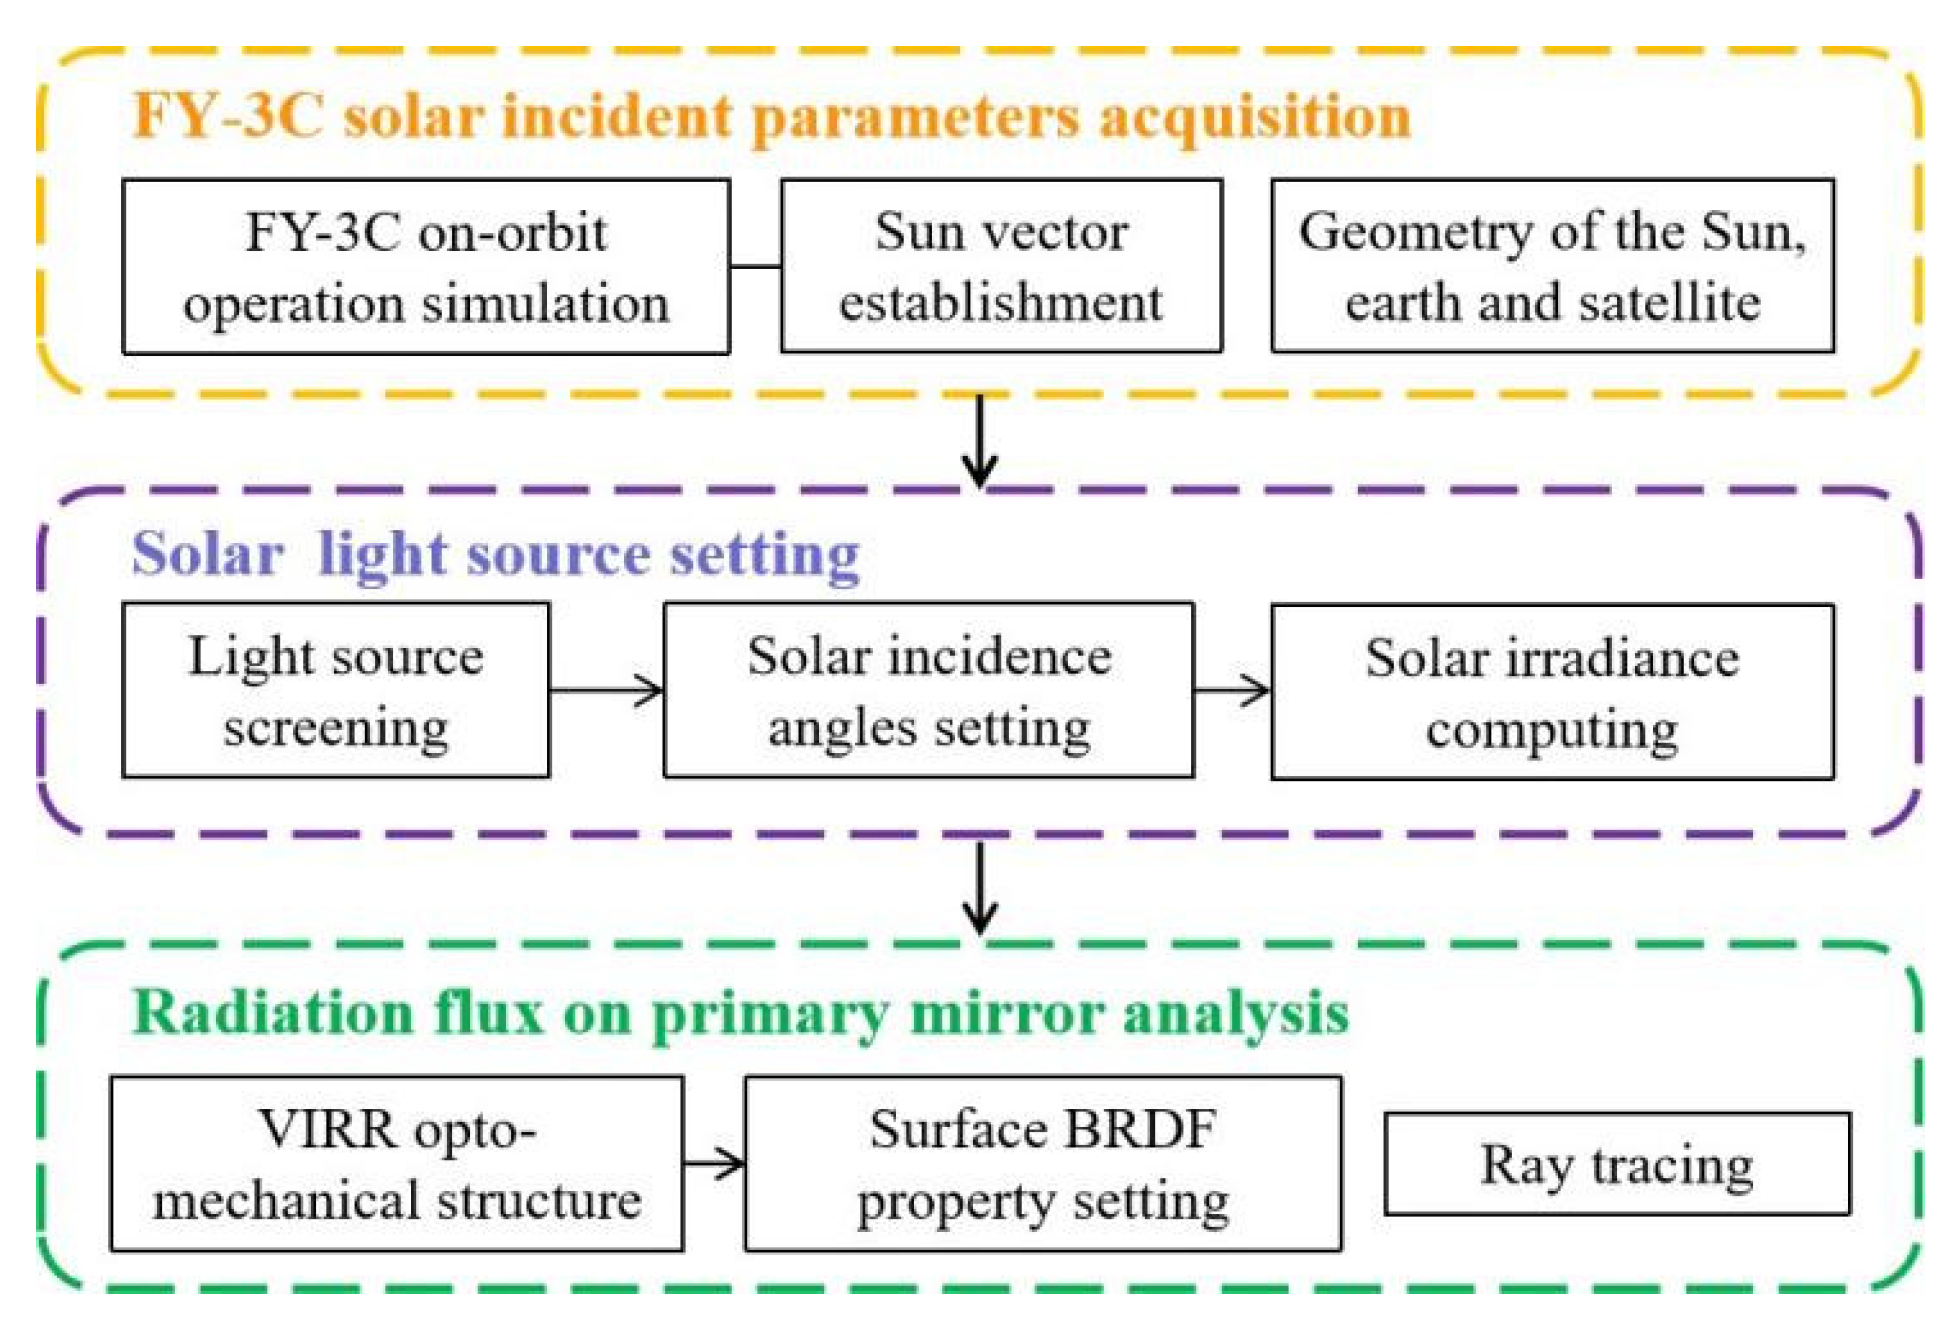
The simulation process of external stray light for VIRR is shown in
Figure 4. Firstly, the Satellite Tool Kit (STK) software is used to simulate the satellite operation based on the orbital parameters of FY-3C. We establish the solar vector in STK and obtain the key information such as solar incidence parameters, latitude information and umbra time based on the geometric position relationship between the Sun, the Earth and the satellite. Then, according to the obtained umbra time and incidence angles, the angles that meet the incidence conditions are selected to adjust the incidence direction of the simulated parallel light source. The corresponding solar radiation is calculated for setting the light source. After that, we import the VIRR optical machine structure model into the optical simulation software TracePro and set the surface BRDF properties of each mechanical structure of the VIRR. Finally, ray tracing is performed to obtain the spatial distribution of solar stray light on the primary mirror.
3.1. Incident Parameters Simulation of Solar Stray Light
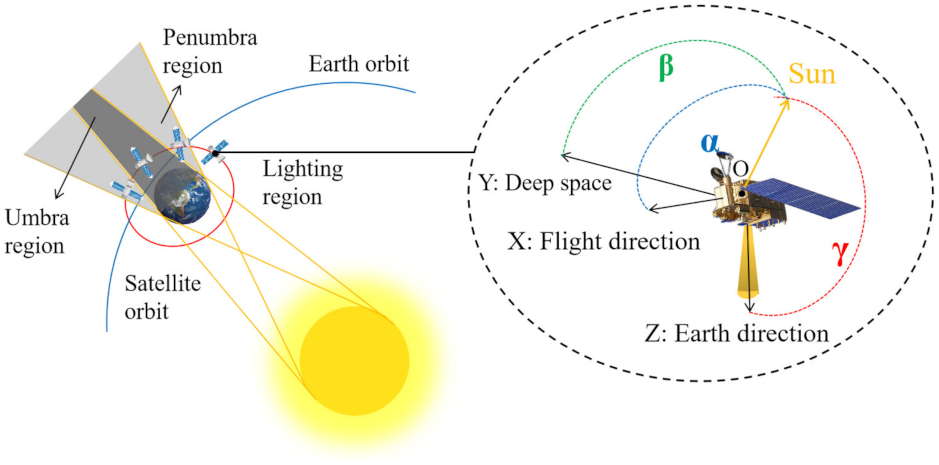
As FY-3C travels in its orbit, the relative geometrical relationship between the Sun, the Earth and the payload changes with the orbital position. This means that the incidence angles and direction of the Sun as a stray light source to the VIRR detection window also change accordingly. This is also the reason why VIRR experiences an absolute radiometric change caused by stray light that is time-varying. To solve this problem, the simulation of FY-3C satellite on-orbit should first be carried out based on its orbit parameters to establish the geometric relationship model among the Sun, the Earth and the satellite.
STK software supports the entire space mission cycle. In this study, we utilizes its powerful analysis, graphical support, and data export functions to carry out the simulation of FY-3C in-orbit operation process. Firstly, we input the basic orbital parameters of FY-3C into the Orbit Wizard in the software to generate the FY-3C satellite in the scenario; therefore, it can simulate the satellite orbit and realize orbit visualization. Then, we use the custom vector geometry function of the software to establish the Sun vector pointed from the satellite to the Sun in order to obtain the angles between the incident light from the Sun and the three axes of the payload at each orbital point. We use STK’s data reports function to output key information such as time of entering and leaving the umbra region, the angles between the Sun vector and the payload’s three axes, etc.
After screening and removing the time period without the influence of stray light, the incidence parameters will be imported into the optical analysis software TracePro to simulate the angles of incidence of the light source for VIRR solar stray light pollution analysis.
3.2. Solar Light Source Radiation
Due to the distance of about 150 million km between the satellite and the Sun, the sunlight can be considered as parallel light relative to the satellite. The relative position of the satellite to the Sun is constantly changing in orbit, and the direct solar radiation received by the outer surface of the satellite changes accordingly. Xiang [
20] gives a calculation method of the direct solar radiation received by a satellite surface. The angle between the normal vector of satellite’s Earth-facing surface and the solar vector is γ. The solar radiation received by this surface can be calculated according to Equation (1):
This equation can be used to calculate the solar radiation at different angles for the modelling of solar light sources. Ee is the solar radiation. Rs is the solar constant with a value of 1353 W/m2. The solar constant Rs refers to all radiation energy on the unit area and perpendicular to the direction of the solar rays when the Sun projected to a distance of one astronomical unit in the unit time.
We set up a parallel light source at different off-axis angles in TracePro to simulate the solar light source. These parallel light sources are set to proper size to cover the entire entrance of the VIRR optical system and the density distribution parameters are defined as uniformly distributed.
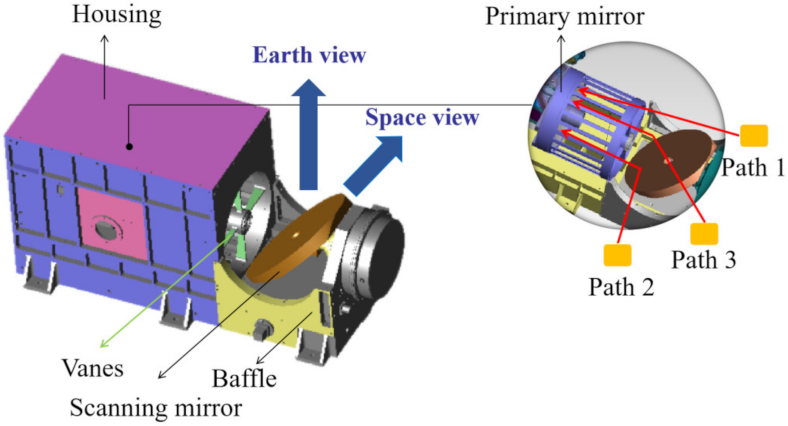
3.3. VIRR Opto-Mechanical Structure Modeling
Stray light simulation is used to find out how unwanted light propagates to the VIRR primary mirror and to determine the distribution of stray light irradiation on the primary mirror and whether its irradiation is large enough to cause a disturbance to the real scene radiation. As the rays propagate along different paths throughout the model, the interaction between sun-light rays and the model is partly determined by the geometric details of a mechanical structure and partly determined by the surface properties of the model. Therefore, based on the actual mechanical structure and surface properties of VIRR, ray tracing is an appropriate technique to track the irradiation value of each ray and analyze the distribution of the irradiation on each surface.
Firstly, we import the 3D model of the VIRR opto-mechanical structure into TracePro. After the VIRR actual model has been established, the surface property parameters of the opto-mechanical structures need to be set. Different surface property parameters are assigned to the corresponding entity model to accurately describe the scattered surface characteristics associated with stray light and to determine how rays interact with the model. The surface parameters of the opto-mechanical structures are the main influencing factor of stray light transmission in the optical machine system. Bidirectional reflectance distribution function (BRDF) proposed by Nicodemus [
21] is the basis of stray light analysis. It describes the anisotropic reflection properties of a surface and is in relation to the properties of the material surface itself. Mathematically, the BRDF is defined as the scattered radiance per unit incident irradiance. The ABg BRDF model is generally used in stray light analysis because it is suitable for describing the scattering characteristics of many structured surfaces, as shown by Equation (2):
where
A reflects the total scattered energy, and
B and
g reflect the degree of scattered energy concentration. The parameter
g depends on the material properties, surface polishing method and so on.
and
is the directional sine of the incident direction and reflection direction, respectively.
The optical material surface’s properties of VIRR is set in TracePro. The specular’s scattering parameters is set as A = 0.00076, B = 0.015, g = 2. The shield’s absorbance is set to 0.90, A = 0.035, B = 0.1, g = 0, and the receiving surface’s absorbance is set to 1.
3.4. Ray Tracing
The analysis method used by TracePro is a combination of Monte Carlo and ray tracing. We simulate the propagation process of stray light into the VIRR model and into the primary mirror by using TracePro.
Solar light sources can be simulated by setting parallel light sources with different incident directions and radiated power. After setting up the opto-mechanical structures model, surface properties and light source, light tracing is performed by using the TracePro. When performing ray tracing progress in TracePro, we set the ray tracing threshold as 1 × 10⁻⁹ of the starting flux. TracePro will discard the ray whose energy is too low relative to the initial ray energy. To avoid stray light being lost during tracing, we set the tracing threshold to be a small value of 1 × 10⁻⁹. The size of the number of traced rays determines the reliability of the results. The higher the number, the more reliable the result. However, tracking too many rays would consume too much computer resources. Therefore, we set one million rays for tracking, which ensures the reliability of the results while ensuring the speed. Based on the modeling of the optical mechanical structure and a large number of ray tracing, the radiation distribution of stray light on the primary mirror of the instrument can be obtained.
4. Results and Discussion
4.1. Incidence Analysis of Solar Light Source
The variation of the solar incidence angles over the year is analyzed firstly. The operation process of FY-3C from January 1, 2015 to January 1, 2016 is simulated by STK with the simulation interval of 1 min, and then the values of the angles between the sunlight and three axes of the VIRR are exported.
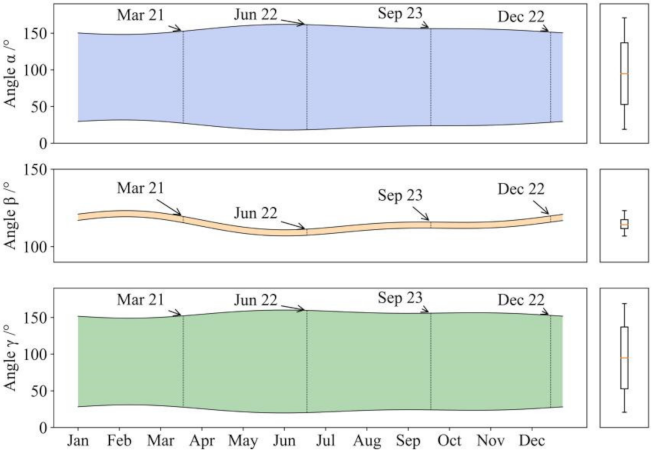
Figure 5 shows the change of the three angles of solar incidence direction throughout the whole year. The outer contour line represents the variation of amplitude in a year, and the area between the contour lines indicates the variation range of angle. The maximum value of α is 162.03°, the minimum value is 17.97°, and the average value is about 90°. The maximum value of γ is 160.13°, the minimum value is 19.86°, and the average value was about 90°.
Compared with the other two angles, the angle β has a smaller range of variation. Its maximum value is 123.30° and minimum value is 106.95°, floating up and down at 115°. β represents the angle between the orbital plane of the satellite and the solar vector. The small change of the angle proves that the angle between the orbit surface of the satellite and the solar vector is basically unchanged when the satellite is running in Sun-synchronous orbit. The β angle is always greater than 90°, which means that the solar vector is always on the negative side of the Y-axis under the current orbital characteristics. The angle γ represents the position relationship between the solar vector and the payload’s incident window. When the γ angle is greater than 90°, sunlight shines on the back side of the instrument incidence window and is blocked by the housing so the light cannot enter the instrument.
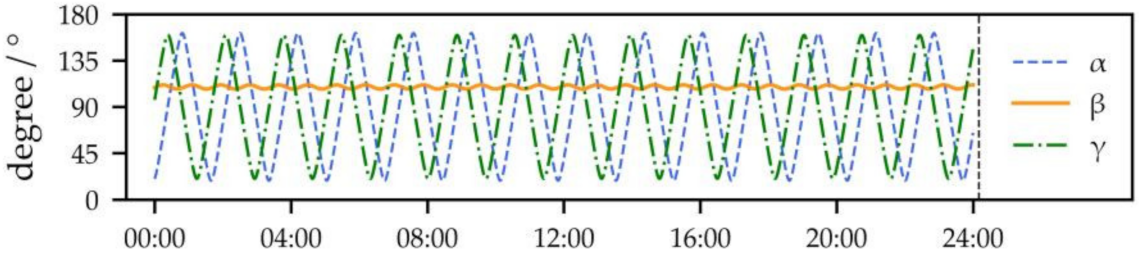
Figure 6 shows the variation of the angles between the solar vector and the three axes of the satellite on the summer solstice in 2015. The orbit time of FY-3C around the Earth is 6098 s, so it can go around the Earth 14 times a day. According to the trend of three angles as shown in
Figure 6, the change curve of α and β showed a sinusoidal trend in a day, and there were 14 peaks in a day.
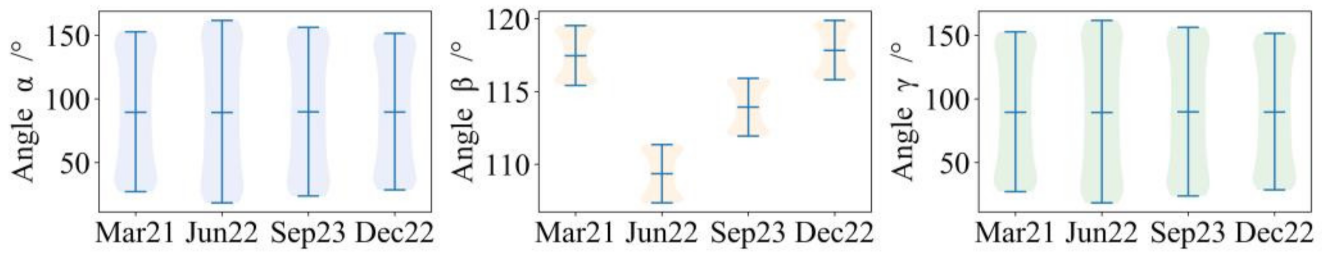
We selected the four days of the Spring Equinox (March 21), Summer Solstice (June 22), Autumn Equinox (September 23) and Winter Solstice (December 22) in 2015 as the key moments for analysis to explore the changes of stray light in different seasons.
Figure 7 and
Table 1 shows the comparison of incidence angles on these 4 special days in 2015. The mean values of α and γ are 90°, and the amplitude of the sine curve varies in different seasons. The greatest amplitude of α and γ is on the summer solstice. The variation of the Sun, the Earth, and satellite geometric relations is approximately the same for 14 orbits in a day, so only one orbit for each of these four days are selected for the study.
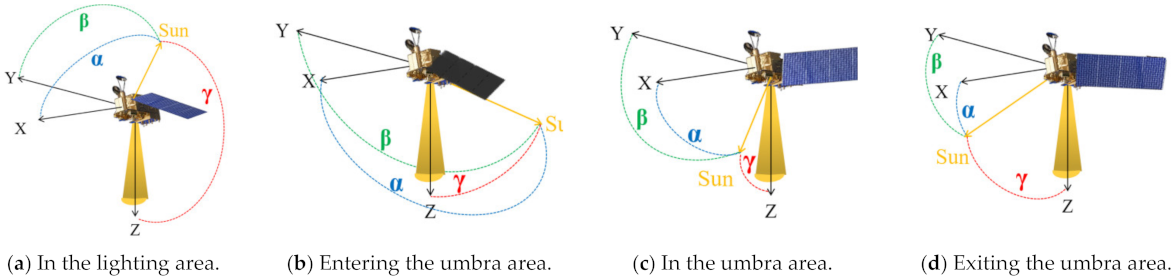
For FY-3C, when the satellite moves from the South Pole to the North Pole, the satellite enters the umbra region when the solar zenith angle γ decreases to about 60° in the Southern Hemisphere; in the middle and high latitudes of the Northern Hemisphere, the solar zenith angle γ increases to about 60° when the satellite crosses the morning twilight line and enters the light region. When the satellite is in the umbra region, the sunlight is completely blocked by the Earth, and there is no solar stray light at this time. When γ is greater than 90°, the sunlight shines on the back of the satellite, and there is no solar stray light at this time. At these particular time periods, there is no stray light radiation of the Sun to the VIRR primary mirror. Therefore, we only need to consider the case when the satellite meets the incidence condition, that is, when the satellite is entering and exiting the umbra area. When the satellite enters the umbra area, the α angle gradually becomes larger, the β angle gradually becomes larger, and the γ angle gradually becomes smaller. The α, β, and γ angles range at this time would reach about 130°~170°, 100°~120°, and 60°~90°, respectively. When the satellite exits the umbra area, the α angle gradually becomes smaller, the β angle gradually becomes larger, and the γ angle gradually becomes larger. The α, β, and γ angle ranges at this time would reach about 10°~50°, 100°~120°, and 60°~90°, respectively. For FY-3C, due to the angle β between the solar vector and the normal vector of the orbit plane (the plane perpendicular to the Y-axis) is about 115°, the illumination conditions of the satellite when entering and exiting the umbra region are not completely symmetrical. Therefore, the two cases need to be analyzed separately.
4.2. Irradiation Analysis when Entering the Umbra Area
The angular information when VIRR enters umbra area of the 4 special days is imported into TracePro and the ray tracing is simulated according to the method given in
Section 3.
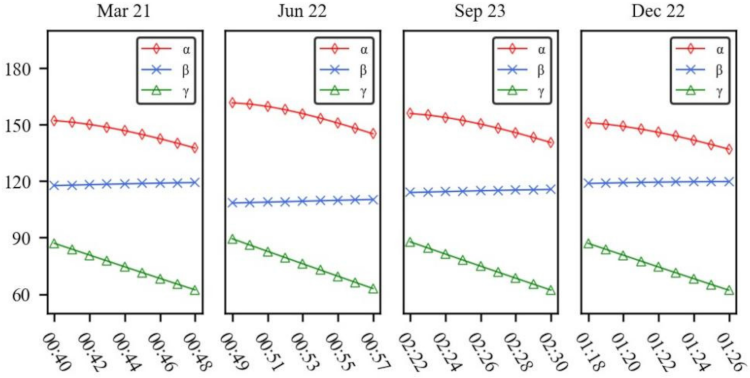
Figure 8 shows the variation of solar incidence parameters when entering the umbra area on four days: Mar 21, Jun 22, Sep 23 and Dec 22. The red line represents α angle, the blue line represents β angle, and the green line represents γ angle. In an orbit, the satellite has about 9~10 min to meet the incident conditions when it is entering the umbra region. During this period, angle α decreased, angle β increased, and angle γ decreased from about 90° to about 60°. In other words, during the period of entering the umbra region in each of these four days, the solar zenith angle satisfying the incident condition is about 60°~90°.
The moment of 00:49 UTC on June 22 is used as an example to investigate how stray solar light enters the interior of the instrument when the satellite enters umbra region.
Figure 9 shows the incident path of solar stray light at this time. At this moment, the stray light from the Sun mainly enters the interior of the instrument in the form of reflected light. Additionally, part of the solar stray light is scattered by the baffle and enters the instrument.
Figure 10 shows the variation of the irradiation distribution on the VIRR primary mirror when the satellite enters the umbra region on June 22. The ring between the two white circles in the picture is the primary mirror. The irradiation distribution pattern is formed by the vanes shading at the housing entrance.
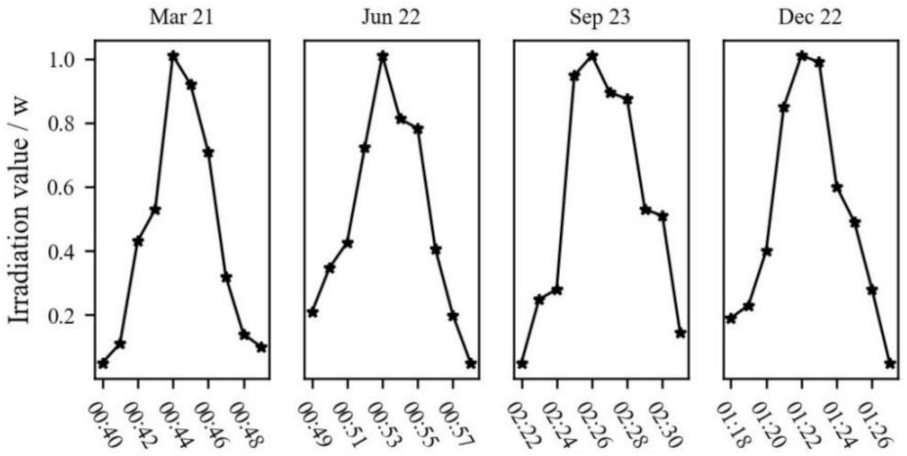
Figure 11 shows the irradiation value of solar stray light on the primary mirror obtained through simulation at the corresponding angles.
4.3. Irradiation Analysis When Exiting the Umbra Area
Figure 12 shows the variation of solar incidence parameters while exiting the umbra area. Just as when entering the umbra region, the satellite has about 10 min to meet the incident conditions when it is exiting the umbra region in an orbit. During this period angle α decreases, angle β increases, and angle γ increases from about 60° to about 90°. In other words, during the period of entering the umbra region in each of these four days, the solar zenith angle satisfying the incident condition is about 60°~90°.
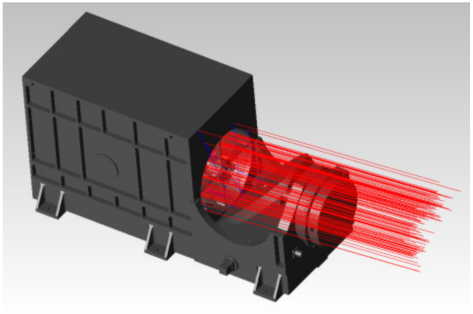
The moment 01:33 UTC on 22 June 2015 was chosen as a typical moment exiting the umbra region for the sunlight incidence path analysis.
Figure 13 shows only the light that can reach the primary mirror. At this moment, the stray radiation reaching the primary mirror is mainly composed of directly incident solar stray light. The stray light from the Sun mainly enters the interior of the instrument in the form of direct light to form an interference signal on the primary mirror. Additionally, a small amount of stray light is scattered by the instrument housing and then reaches the scanning mirror, which is reflected by the scanning mirror and then enters the interior of the instrument.
Figure 14 shows the variation of the irradiation distribution on the VIRR primary mirror when the satellite exited the umbra region on June 22. The distribution pattern is similar to the irradiation when entering the umbra area.
Figure 15 is the irradiation value of solar stray light on the primary mirror obtained through simulation when exiting the umbra area. Compared to the irradiation value when entering the umbra area, the irradiation value on the primary mirror is bigger during this period.
4.4. The Influence of Scanning Mirror
VIRR uses a scanning mirror with a rotation angle of ±55.4° to scan the Earth’s surface for observation. The scanning angle affects the intensity and distribution of stray light entering the instrument from the Sun. Therefore, it is necessary to consider the incidence of stray light when the scanning mirror is at different scanning angles. As an example, we analyze the stray light exiting the umbra region on June 22 with the scanning angles of −55°, 0°, and 55°.
Figure 16 shows the irradiation distribution on the primary mirror with different scanning angles at 01:34 on June 22 when the satellite is exiting the umbra region.
Figure 17 is the irradiation value variation on the primary mirror under different scanning angles during exiting the umbra region on June 22. The irradiation value is larger when the scanning mirror is rotated to −55°, and smaller when the mirror is rotated to 55°.
4.5. Verification of the Simulation Results
To verify the correctness of the stray light simulation, the simulation results are compared with the real earth observation data acquired by VIRR. The FY-3C single data file contains 5 min of observations, and each orbit consists of about 20 such data files. VIRR has 10 visible infrared channels. The infrared channels are band 3, band 4, and band 5, corresponding to the central wavelengths of 3.7 µm, 10.8 µm, and 12.0 µm, respectively. Band 3 has the most serious stripe noise. Some periods of band 4 and band 5 also have stripes, but the intensity of the stripe is relatively weak. In addition to the reflection, refraction and scattering of sunlight, stray light may also cause stripes in the longwave channels by contaminating the calibration blackbody, making the clamp voltage abnormal, or causing the temperature change in the scanning mirror [
22]. The visible channels have no obvious stripe noise, but they have defective pixels and lines during the alternation of day and night. Band 3 is selected for the verification because it shows the most serious stripe noise.
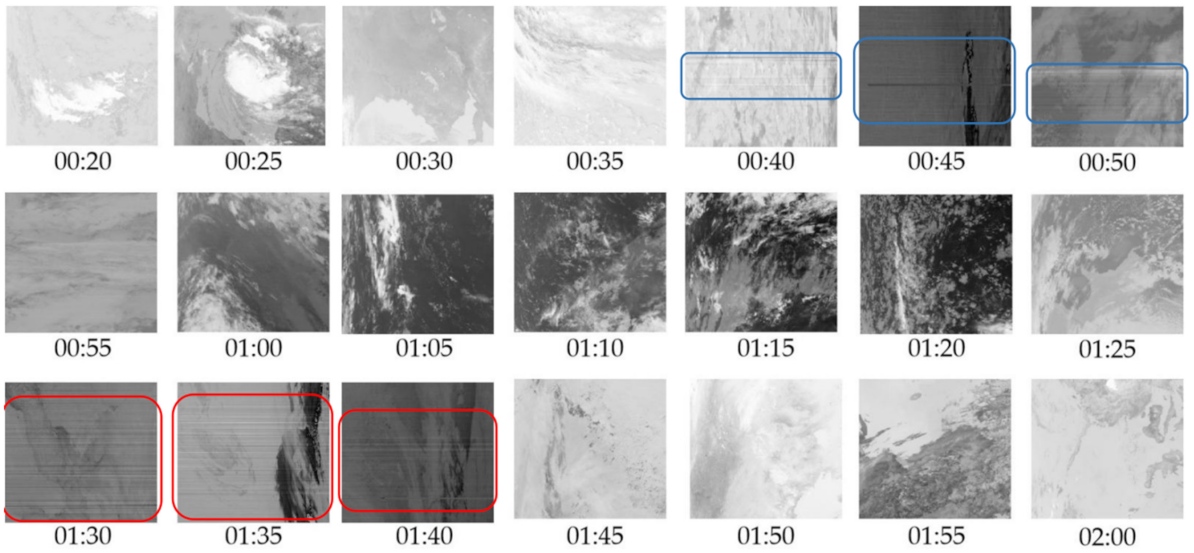
Figure 18 shows the Earth observation images of VIRR Band 3 in one entire orbit (from 00:20 UTC to 02:00 UTC) on March 21, 2015. Among them, the images marked with blue lines correspond to the time of entering the umbra area, and the images marked with red lines are corresponding to the time of exiting the umbra area. In these images, clear stripe noise contamination due to the effect of solar stray light can be seen. The extent to which an image is contaminated by solar stray light can be expressed in terms of the stripe rate of that image. The stripe noise in the image is all horizontal. The grayscale values of pixels contaminated by stripes are significantly different from other rows. By counting the number of lines occupied by stripes contaminated by stray light and dividing by the number by the total number of lines in the image, the stripe rate can be calculated.
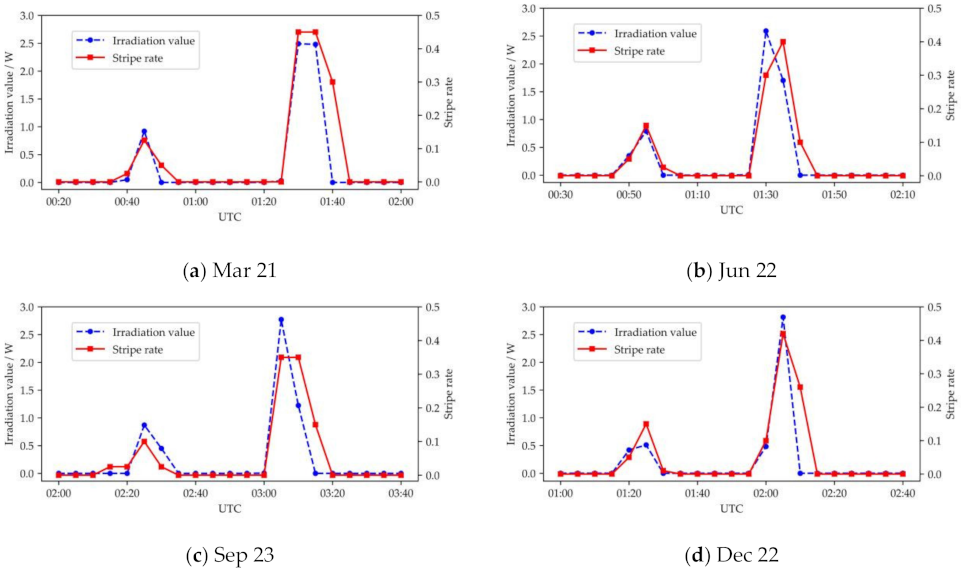
Figure 19 shows the comparison of stripe rate of Earth observation images and total irradiation value of solar stray light on the primary mirror of single-orbit on Mar 21, Jun 22, Sep 23 and 22 December 2015. The blue dashed line represents the solar stray light pollution obtained from the simulation. Its vertical axis represents the irradiation value of solar stray light on the primary mirror. The red line represents the stripe rate of single-orbit Earth observation images. Its vertical axis represents the stripe rate of image. The solar stray light emerges when the satellite entering and exiting the umbra region in one orbit, and is much stronger during the exiting period.
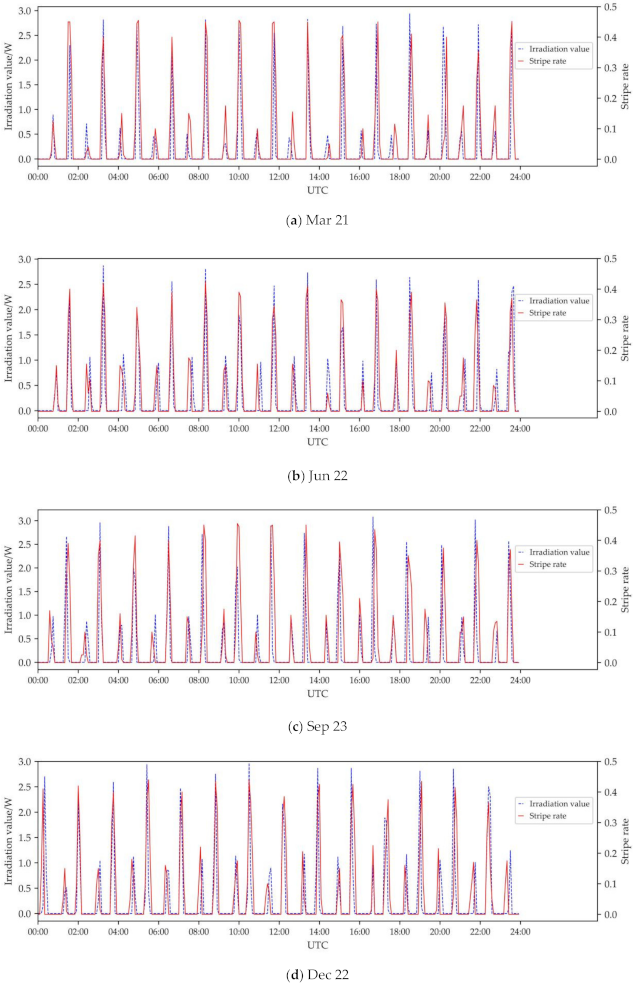
Figure 20 shows the comparison of stripe rate of the Earth observation images and total irradiation value of the solar stray light on the primary mirror on Mar 21, Jun 22, Sep 23 and 22 December 2015. FY-3C orbits the Earth 14 times a day, so the image shows 14 cycles. The solar stray light affects the sensor about 266 min over the whole day.
Figure 20 shows the comparison of stripe rate of the Earth observation images and total irradiation value of the solar stray light on the primary mirror on Mar 21, Jun 22, Sep 23 and 22 December 2015. FY-3C orbits the Earth 14 times a day, so the image shows 14 cycles. The solar stray light affects the sensor about 266 min over the whole day.
From the analysis described above, we can see that the occurrence time and intensity of stray light obtained by simulation are basically consistent with the occurrence time of stripe and stripe rate in actual ground observation images. Thus, we can obtain the regularity of the VIRR’s stray light, which can be used for the precise elimination of the stray light. It shows that the proposed method is correct and effective to simulate and evaluate the external stray light of the on-orbit payload.
In future research, the results of this simulation method can be utilized to remove the stray light contamination from satellite images. Currently, the simulation results are only the regular pattern of the stray light distribution; in order to perform fine stray light correction, the key work is to establish the link between the stray light distribution in the primary mirror and the pixels in the ground observation image. However, many factors need to be taken into account to explore the stray light intensity of each pixel. For instance, the pixel number and the size of the detector array, the responsivity of the detector at different wavelengths, the clamp circuit of the detector, the nonuniformity characteristics, the push-broom pattern and the resampling rate when stitching into the whole track images, etc. After we obtain each pixel’s stray light intensity, we can perform the subtraction on the ground observation image pixel by pixel. Meanwhile, we should also consider the pixel’s actual radiation intensity of the ground image. It is necessary to perform some compensation in the subtracted image pixels in order to avoid these pixels having no actual radiation or a lower radiation value after the stray light removal.
5. Conclusions
For satellites in Sun-synchronous orbit, solar stray light definitely affects the imaging process of their payloads. Since the relative position of the instrument with respect to the Sun varies with the season and orbital position, the stray light varies with the scene and time.
In this paper, we propose an external stray light simulation and analysis method utilizing satellite orbit attitude model in order to quantitatively investigate the regularity of solar stray light on the primary mirror of FY-3C/VIRR with the orbital position. On-orbit operation simulations are performed according to the orbital parameters of the FY-3C satellite. On this basis, we perform ray tracing by considering the VIRR mechanical structure and optical scattering model. Comparing the simulated solar stray irradiation value of a single-orbit and all day on the primary mirror with the stripe rates of real Earth observation image, the trends are generally consistent. Stray light from the Sun may affect the satellite in an orbit during its entrance and exit from the umbra region, and the latter is affected more heavily. In addition, the rotation angle of the scanning mirror also affects stray light.
By setting different parameters, this method can be applied to the analysis of stray light from instruments on other satellite platforms. Future research can be focused on how to correct or reduce the stray light in the observation images by utilizing the simulation results.


