Article

UAV-Based Mapping of Banana Land Area for Village-Level Decision-Support in Rwanda

1
International Institute of Tropical Agriculture (IITA), KG 563 ST, Kigali P.O. Box 1269, Rwanda
2
Leibniz Institute of Agricultural Development in Transition Economies (IAMO), 06120 Halle (Saale), Germany
3
Knowledge, Technology and Innovation Group, Wageningen University, P.O. Box 8130, 6700 EW Wageningen, The Netherlands
*
Author to whom correspondence should be addressed.
Remote Sens. 2021, 13(24), 4985; https://doi.org/10.3390/rs13244985
Submission received: 23 September 2021 / Revised: 5 November 2021 / Accepted: 3 December 2021 / Published: 8 December 2021

Abstract

:
Crop monitoring is crucial to understand crop production changes, agronomic practice decision-support, pests/diseases mitigation, and developing climate change adaptation strategies. Banana, an important staple food and cash crop in East Africa, is threatened by Banana Xanthomonas Wilt (BXW) disease. Yet, there is no up-to-date information about the spatial distribution and extent of banana lands, especially in Rwanda, where banana plays a key role in food security and livelihood. Therefore, delineation of banana-cultivated lands is important to prioritize resource allocation for optimal productivity. We mapped the spatial extent of smallholder banana farmlands by acquiring and processing high-resolution (25 cm/px) multispectral unmanned aerial vehicles (UAV) imageries, across four villages in Rwanda. Georeferenced ground-truth data on different land cover classes were combined with reflectance data and vegetation indices (NDVI, GNDVI, and EVI2) and compared using pixel-based supervised multi-classifiers (support vector models-SVM, classification and regression trees-CART, and random forest–RF), based on varying ground-truth data richness. Results show that RF consistently outperformed other classifiers regardless of data richness, with overall accuracy above 95%, producer’s/user’s accuracies above 92%, and kappa coefficient above 0.94. Estimated banana farmland areal coverage provides concrete baseline for extension-delivery efforts in terms of targeting banana farmers relative to their scale of production, and highlights opportunity to combine UAV-derived data with machine-learning methods for rapid landcover classification.

1. Introduction

Agricultural production is critical for growth in many developing economies [1] and is indispensable for food security in sub-Saharan Africa (SSA). The world’s population is gradually increasing and projected to reach 9 billion by the year 2050 [2]. Considering that approximately 815 million people in the world are chronically undernourished [2], it is imperative to address extant food insecurity challenges by increasing agricultural production (to the tune of 50% more) to feed the growing population [2]. Yet, the need to increase production is often constrained by resource limitations, production inefficiencies, and natural/human threats in many smallholder farming systems [3]. Globally, about one-third (38%) of the terrestrial surface is classified as agricultural land and pastures [4], and further expansion of both land-use types is expected to cause negative ecological impacts like biodiversity loss and deforestation [5]. Therefore, sustainable management of current cropland areas is important to improve productivity and address yield gaps [4]. However, this requires periodic monitoring of cropland area and composition to understand changes and develop or deploy appropriate agronomic tools and interventions for farm-level decision-support.
Generally, mapping of croplands includes the identification of crops and their areal coverage to generate relevant agricultural statistics (at various geographical scales), support yield forecasting, and assess agroecological/environmental changes [6]. In most SSA countries, conventional methods such as periodic agricultural surveys are adopted to map or quantify cropland areas, usually at irregular frequencies. Such methods are cost-prohibitive due to extensive and repetitive field surveys, mostly conducted on smaller areas/units of lands, and based on biased sampling techniques which may skew area estimates [7]. However, current remote sensing tools and technologies offer capabilities for the rapid and cost-effective acquisition of data to continuously map cropland changes at varying scales [7,8,9].
In Africa, about 80% of farmlands are cultivated by smallholder farmers, and in East Africa, these farmers account for 75% of the agricultural outputs [3]. Most of the smallholder farms are characterized by mosaic landscapes and mixed crop farming on small pieces of land, thereby posing a significant challenge to the monitoring of changes in these agricultural landscapes [10]. The increasing accessibility of high-resolution remotely sensed data is promising for mapping and monitoring vegetation growth and dynamics in these smallholder farms. Optical sensors that are coupled with unmanned aerial vehicles (UAVs) are emerging as a reliable source of high-resolution and multispectral imageries that can be used to distinguish crops within and between fields [11,12,13]. Moreover, the imagery reflectance data can be processed to generate vegetation indices which can further aid crop identification and differentiation [14]. Specifically, the Normalized Difference Vegetation Index (NDVI) [15], Green Normalized Difference Vegetation Index (GNDVI) [16] and Enhanced Vegetation Index (EVI2) [17], have proven useful for various agronomic use-cases [18,19,20]. In addition, relevant insights can be derived from UAV-acquired imagery data by applying advanced analytics, including machine learning techniques to achieve high prediction accuracy of various parameters for agronomic decision support.
Many researchers have utilized UAV-acquired data for crop and yield mapping in smallholder farming systems, in combination with various remote-sensing and machine learning tools/methods [18]. Chew et al. [21] mapped croplands in Rwanda using a deep convolutional neural network (CNN) on UAV-acquired imagery and achieved high classification accuracy (up to 96%) for staple crops like banana and maize compared to legumes (49%), which are mostly cultivated under intercropped conditions [21]. In Ghana, UAV-acquired RGB and near-infrared (NIR) spectral bands (and calculated vegetation indices) were used to delineate and map smallholder maize-cultivated farms with an accuracy of 94% [22], while several imagery products (including thermal imagery, multispectral band, and vegetation indices) were used to monitor crop growth within farmers’ fields in the Czech Republic [23]. The methods applied in these various studies differ as well. For instance, croplands in Zimbabwe were mapped by implementing automatic classification of UAV imageries, including ensemble classification methods and decision-level fusion (and NDVI thresholding) to identify the croplands and determine spatiotemporal cropland changes [24]. As explained by Lu and Weng [25], in addition to the right imagery, the right choice of classification methods is crucial to successfully map land cover. Machine learning methods, supervised or unsupervised, have been widely used for land-cover classification studies using remotely-sensed data [26,27,28]. For instance, support vector machine (SVM) has gained much attention [29] and has been applied widely in land cover classification using imageries with highly reliable outputs [29,30,31]. Phan and Kappas [32] compared land cover classification with k-nearest neighbor (KNN), random forest (RF), and SVM, and reported that higher overall classification accuracy and least sensitivity to training size samples was achieved with SVM. Other studies [28,33,34] have shown that RF is also promising for land-cover classification. Rodriguez-Galiano et al. [33] showed that high (>90%) overall accuracy was achieved (kappa = 0.92) by applying RF in a land cover classification of a complex area to classify 14 different land categories. While each of these classification techniques has unique strengths under specific application contexts, they can perform poorly in other contexts, and it is often important to compare performance across classifiers relative to the specific classification task.
In Rwanda, Banana is one of the important staple crops for food and nutritional security in the country, and it supports household livelihood as a source of income [35]. However, Banana production is threatened by the Banana Xanthomonas Wilt (BXW), an infectious crop disease that can cause up to 100% yield loss per infected stand [36,37], and spatially explicit data about areas of banana production are generally outdated or non-existent. The identification and delineation of cropland area is a critical first step towards targeting, controlling, and preventing crop-specific diseases, such as BXW, nationally. Similar to other sub-Saharan African Countries, national estimates about the location and areas of banana farms in Rwanda are predominantly estimated or extrapolated based on traditional survey and hierarchical reporting, which are often conducted post-season, at irregular intervals, and usually at sparse locations [9,38,39]. Rapid and spatially explicit assessment of banana farms at high-resolution and frequent intervals can support the need for timely extension delivery in banana production systems and support food security in Rwanda by providing reliable data at useable granularity for local action and interventions. The combination of high-resolution imageries, such as from new-generation satellites and UAVs, and evolving analytical methods, such as machine learning classification techniques, are promising to generate (near) real-time outputs and insights for timely decision-support. Yet, due to varying geographical contexts and the cost of collecting ground-truth data from representative locations, methods for classifying croplands should be evaluated for their reliability or relative accuracy [40], especially to advance credible national monitoring systems. For instance, the classification accuracy of supervised classification methods can be affected by the volume, dimensionality, and quality of the dataset [41]. Further, depending on the desired level of confidence in the classification process, the usefulness/reliability of landcover classification outputs can be determined by the robustness of the ground-truth training data. Limited research exists to guide the understanding of the impact of differing levels of sample points on classification accuracy, however, such assessment can generate useful information to guide the selection of the most reliable landcover classifier that can be reliable for national mapping purposes in Rwanda. Therefore, this study was conducted to assess the accuracy of multi-classifier models for mapping of banana landcover at a village level, and to evaluate if a combination of ground-truth georeferenced data within digitized point datasets from high-resolution UAV imageries can enhance the classification outcomes based on improved data robustness.

2. Materials and Methods
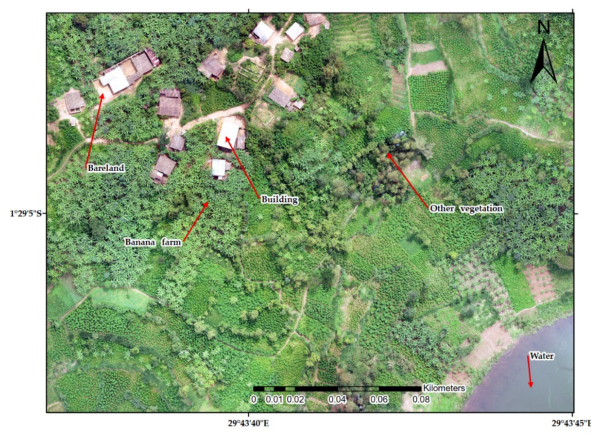
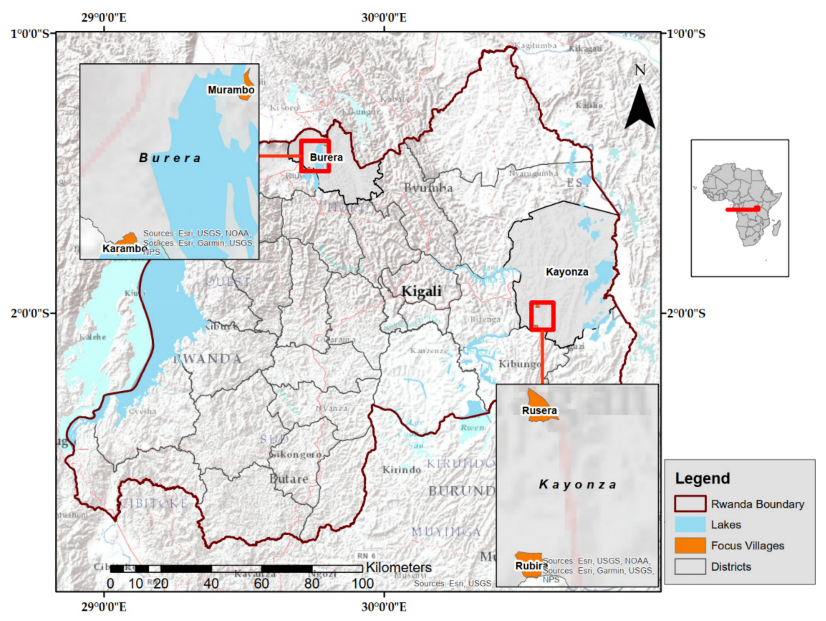
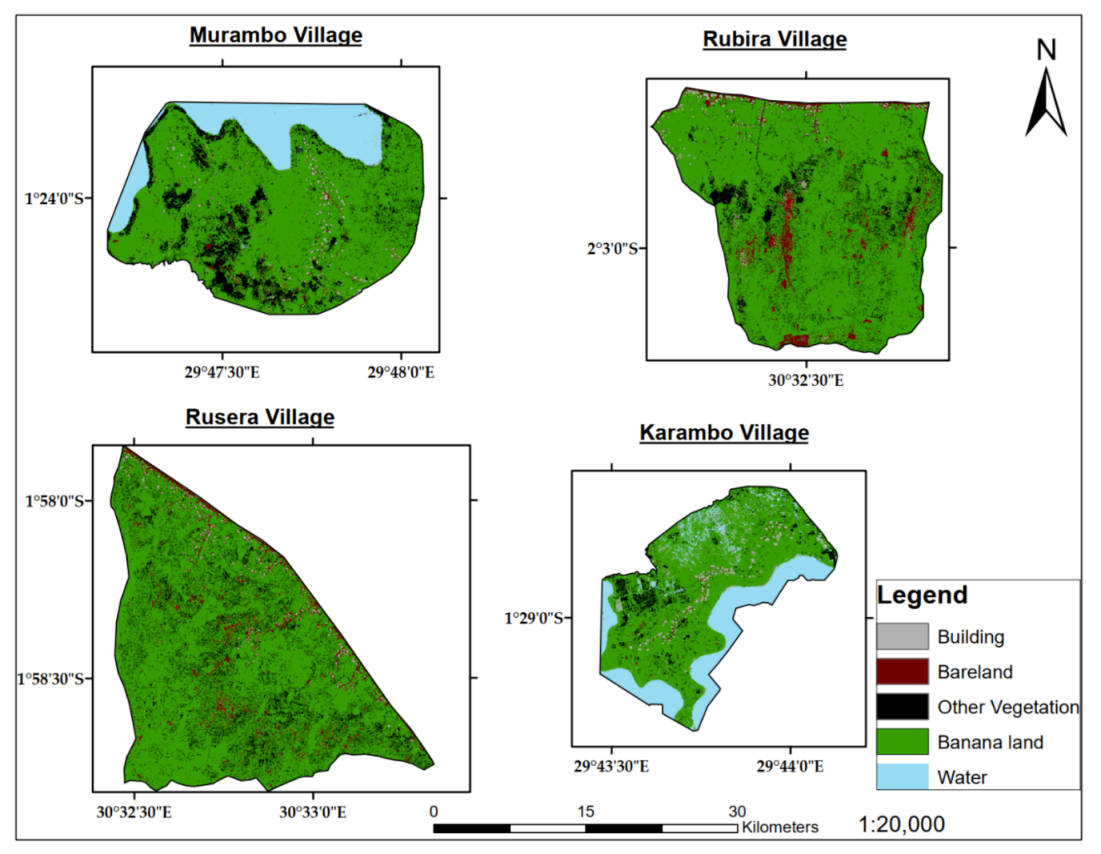
2.1. Study Area

This study was conducted in Rwanda (Figure 1), one of the most densely populated countries in Africa [35], which is characterized by a tropical highland climate. Agriculture contributed approximately 29% to the country’s GDP in 2019 and employs about 72% of the working population [35]. In this study, four (4) villages were selected, namely Murambo and Karambo in Burera Districts, and Rubira and Rusera in Kayonza district, based on the relative intensity of banana production. The landcover across the villages is mainly croplands, water, buildings, and bare land.

2.2. Data Description

During the growing season of 2019 (mid-May), field surveys were conducted across the four (4) target villages to collect georeferenced data on banana farms, as part of the research focused on surveillance of BXW presence/absence in the target geographies. We acquired multispectral imageries with Airinov multispec 4C sensor borne by eBeeX fixed-wing UAV which captured vegetation reflectance at 4 bands (red, red-edge, green and near-infrared). Four (4) UAV flight missions, including over 20 flights, were simultaneously planned to acquire high-resolution imageries (0.25 m × 0.25 m/px), covering each village. The entire fight mission was completed within two (2) days, covering a total area of 550 ha. The eBee UAV was flown at 100 m above-ground, with 85% frontal overlap and 75% lateral overlap to ensure successful image acquisition. Each flight was under optimal ambient conditions, with average windspeed of 8.5 m/sec, and temperature below 30 °C. All flight precautions and guidelines were followed, using a similar protocol as described by Adewopo et al. 2020 [18].
To acquire ground-truth points for the classification, we used a GPS device and open data kit (ODK; www.xlsform.com; accessed on 11 September 2021) survey form to collect coordinates of point locations and record the vegetation that was present at each point. The georeferenced points included 615 points which were acquired from existing banana-cultivated farmlands and 135 points from other land cover classes. This initial ground-truth dataset was enriched with additional georeferenced data points which were manually digitized from the UAV imageries. The additional reference points were digitized in the ArcGIS environment by visually identifying the different land cover classes of interest within the UAV-acquired RGB imagery for each village, and subsequently creating points for each clearly identified land cover while assigning the respective land cover label. Although banana-cultivated land was the primary land cover of interest, other land cover classes represented in the data points include built-up areas, bare land, other vegetation, and water. The relative number of data points that was acquired per land cover is shown in Table 1, while Figure 2 shows a sample of the RGB mosaic with the identified target land cover class objects.

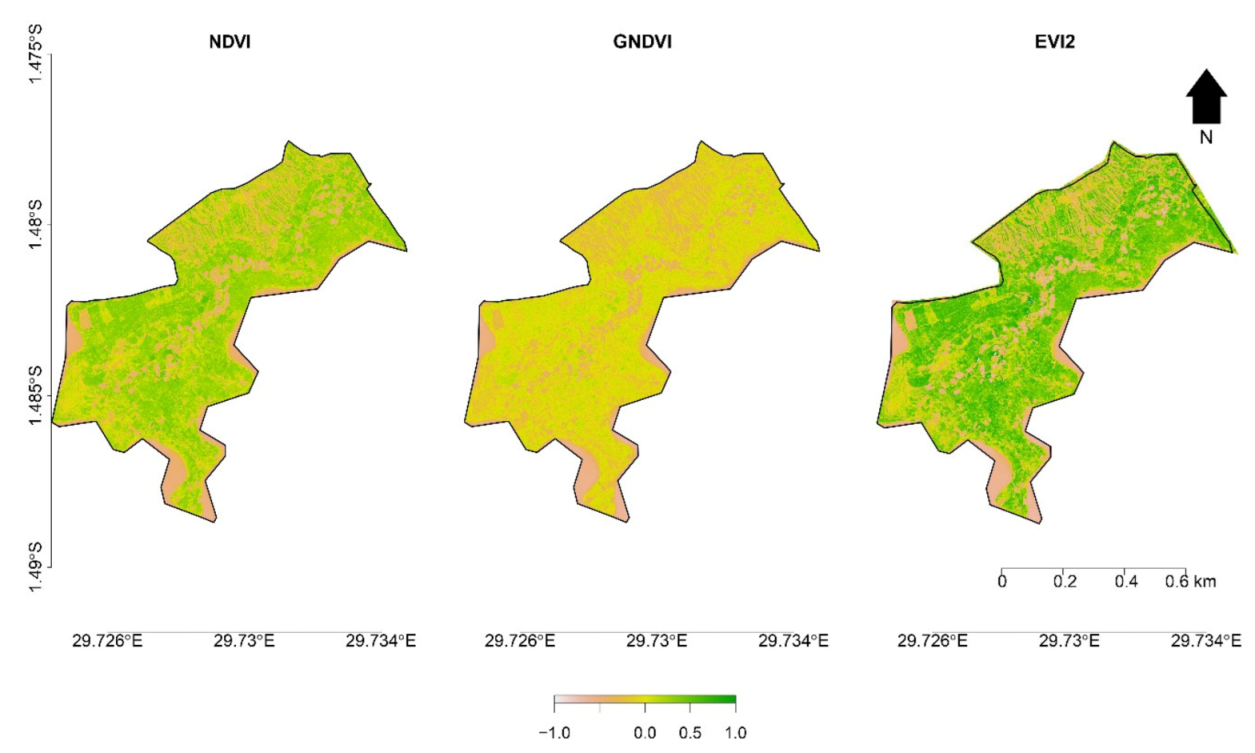
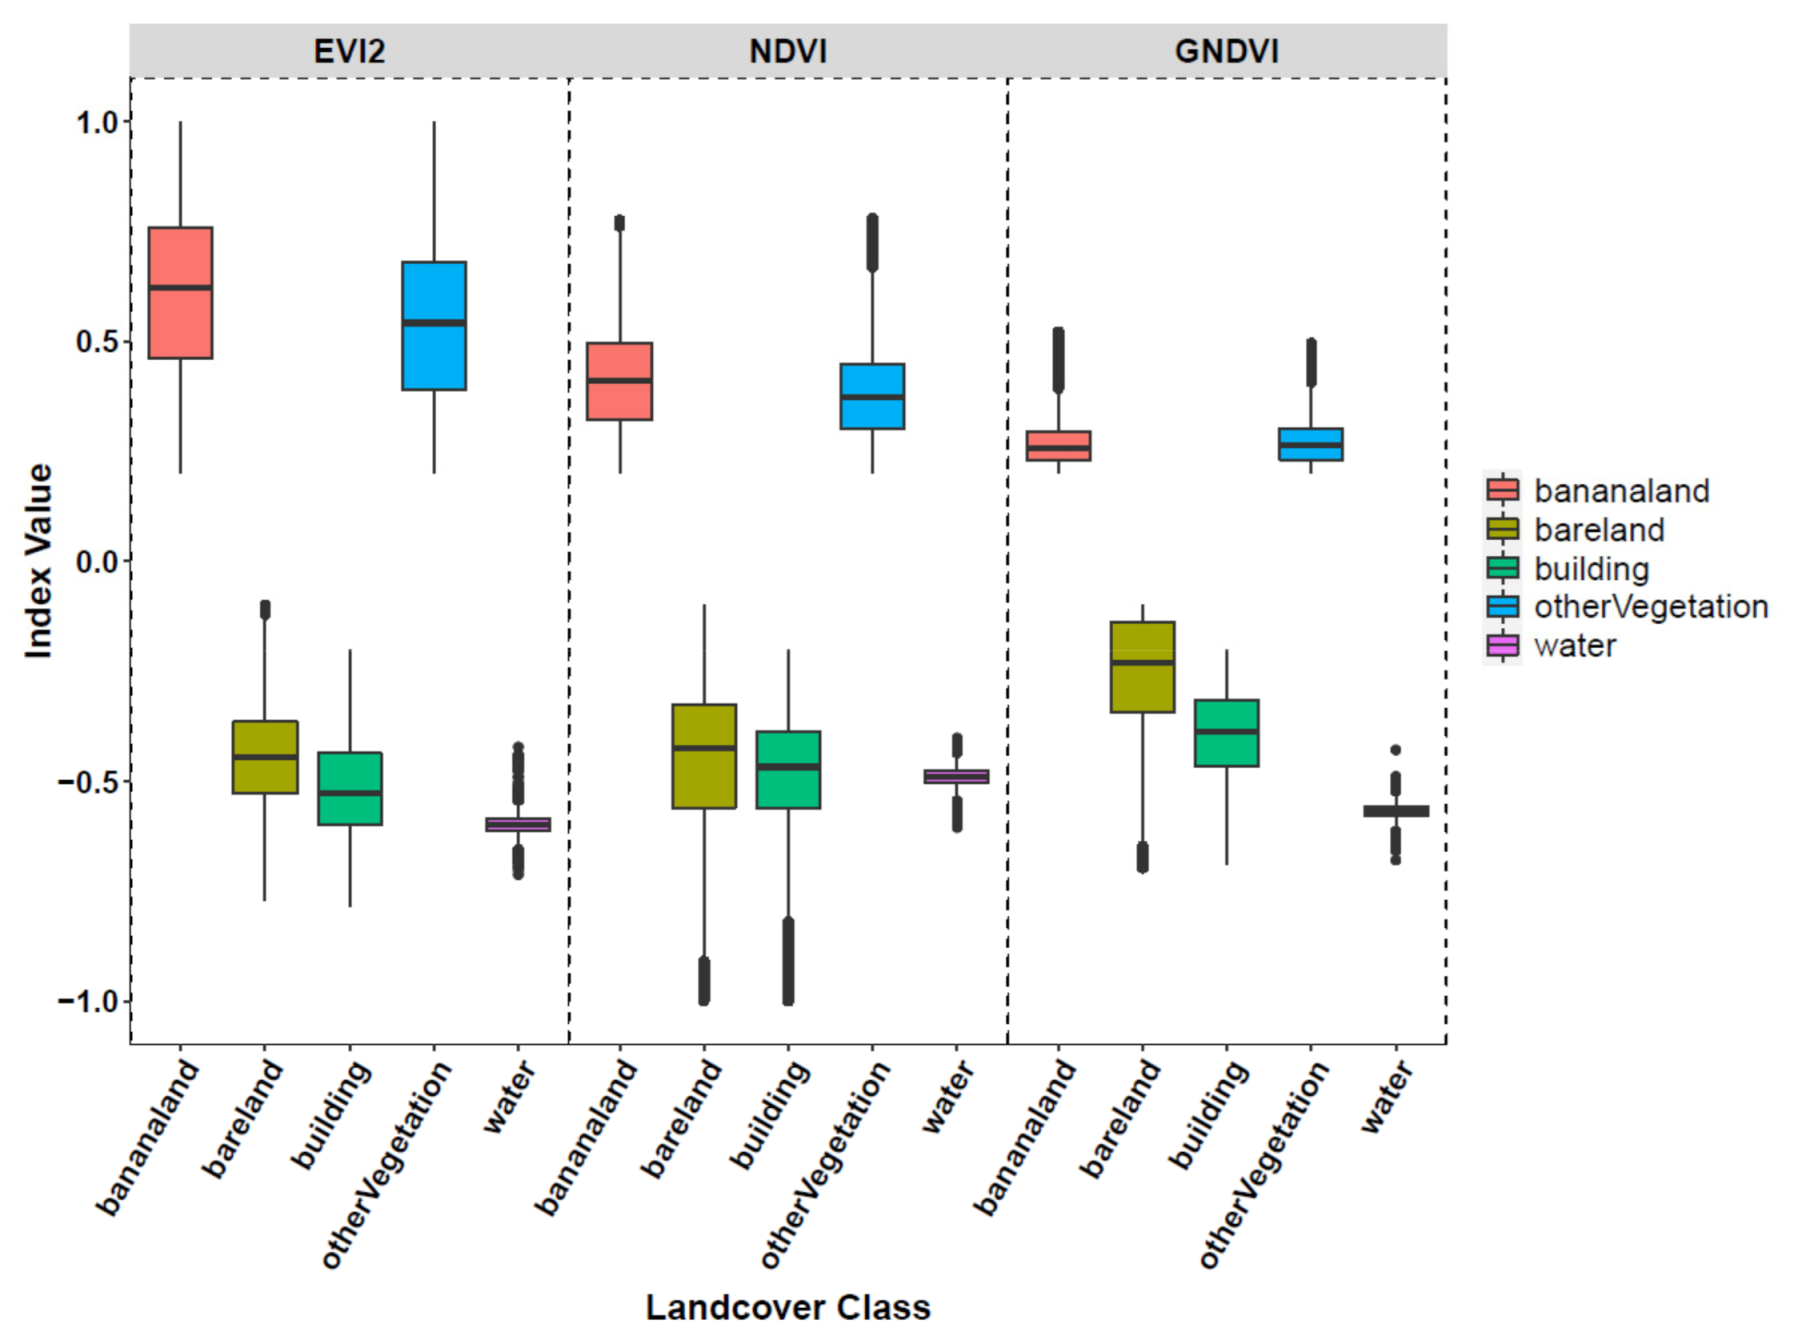
2.3. Vegetative Indices

The various landcover features all have different spectral properties, which are captured in the spectral bands and the vegetation indices (Figure 3). Both the spectral bands and VIs are useful as inputs for imagery analysis and classification. Some of the most used vegetation indices include the Normalized Difference Vegetation Index (NDVI), the green NDVI (GNDVI) and the Enhanced Vegetation Index (EVI). The NDVI was calculated as, NDVI = (NIR − RED)/(NIR + RED) and ranges from −1.0 to 1.0. The green NDVI was calculated as, GNDVI = (NIR − GREEN)/(NIR + GREEN), ranging from −1.0 to 1.0. The 2-band Enhanced Vegetation Index (EVI2) was calculated as EVI2 = 2.5 * [(NIR − RED)/(NIR + 2.4 * RED + 1)] [17,42], also ranging from −1.0 to 1.0.

2.4. Data Splitting

The ground truth dataset was used to extract training data based on spectral reflectance values and vegetation index values that were extracted from the imagery bands. The four bands (Red, NIR, Green and Red Edge) and three vegetation indices were used for training and prediction, relative to the target landcover classes. To assess the impact of data richness on classification accuracy, the entire pooled georeferenced point datasets were categorized into different 3 levels (Table 2). The level 1 data were based on the data that were available from the actual ground survey (i.e., 750 point locations), while level 2 and level 3 were accrued from the combination of the manually digitized data points (from UAV RGB imagery) with the actual ground surveyed data points from farmers’ fields. At each level of data richness, the datasets were randomly split into training (70%) and testing (30%) points across all villages prior for further classification analysis.

2.5. Classification Methods

Three pixel-based supervised multi-classifier models were used for banana cropland classification, namely support vector machines (SVM), classification and regression tree (CART) and Random Forest (RF). We overlaid the ground truth points on the UAV-imagery for each village and extracted the reflectance band values (Red, Green, NIR and Red-edge) and vegetation indices values (NDVI, EVI2 and GNDVI) from each incidence pixel. All the models were optimized using 10-fold cross-validation and specific details about the tuning of parameters are provided below. For each classification method and data richness level, we assessed overall accuracy and Kappa statistics, as recommended for land cover classifications [43], and selected the most suitable model for the final delineation of the landcover classes.
SVM classifier aims at finding an optimal hyperplane in an N-dimensional space where N is the provided number of features (variables) distinctly classifying the data points [29]. Unlike other classification algorithms that find differences between classes, SVM identifies the most similar characteristics between classes and uses them as support vectors. Based on the established support vectors, the SVM algorithm attempts to find the most optimal hyperplane, from the many possible hyperplanes, that best separates the available data classes. For this study, we used a linear kernel because it is preferred for the training of large datasets [30]. The L2 regularized SVM (dual) with linear kernel was applied to improve overall model generalization and a cost parameter of 0.5 was used.
Classification and regression tree (CART) classifier or the decision tree classifier breaks down data into smaller subsets as the decision tree develops. The classifier randomly splits a problem into smaller subproblems by defining some set of rules to be applied down a tree-like structure sequentially [44]. Using the concept of information entropy, a variable with the highest information gain at each node split is chosen to make the decision [44]. A complexity parameter (cp) was used to control the size of the tree and was 0.001, and this led to a relatively large tree of 46 leaf nodes optimally.
Considering the “overfitting” problem associated with the decision trees classifier, RF provides an alternative solution as an ensemble of decision trees [45,46]. Based on the architecture of decision trees, the tree nodes are further divided into nodes and sub-nodes through splitting. The RF algorithm constructs many decision trees with a bagging technique during training and provides a majority vote of the classes’ prediction of the individual decision trees [47]. The features for prediction are themselves a random subset of original features during each node split randomly (mtry parameter). The other parameter applied in our model is the number of trees used in the model, ntree. The number of trees is adjusted to ensure minimal out-of-bag error (OOB error). In our study, the parameters mtry and ntree described above were tuned to ensure an optimal model performance where 400 trees were used and the number of variables at each split was 3.
For every model, assessment of its performance is essential. In this study, training and testing samples are randomly chosen at a ratio of 70 to 30. After training data were used to construct and calibrate the model, we applied the model to predict the test data and assessed the prediction accuracy using a confusion matrix. As a general practice, the matrix is useful to generate relevant statistics to determine the reliability of the classification routine [43]. In this study, we assessed the overall accuracy, precision, producer’s and user’s accuracies, and Kappa coefficient.
After successful classification of the landcover classes using the best fit model, as determined based on the performance parameters, a spatially explicit landcover map for each village was created by applying basis routines (such as focal majority) on the classified raster which contains predicted classes for each pixel. Subsequently, the area (ha) of the banana farms in each village was calculated by counting the banana-predicted pixels in each village-level map and multiplying with the imagery resolution (Equation (1)).
Area (ha) = (Pixel Count * Imagery Resolution)/10,000 m2
where, Pixel Count for banana is the count of pixels predicted as banana-cultivated land, using the optimal classification model; imagery resolution is 0.063 m2 (i.e., 0.25 × 0.25 m).

3. Results

3.1. Descriptive Statistics

Reflectance values were extracted from the multispectral bands of the imageries covering the five land cover classes, and the vegetation indices were computed for EVI2, NDVI, and GNDVI. The plot in Figure 4 below shows the variation of reflectance values of the three vegetation indices (EVI2, NDVI and GNDVI) from the five landcover classes. These are characterized by a boxplot for each of the indices and each of the land cover classes shown. For each boxplot, the upper fence denotes the maximum value, the upper bound of the box is the upper quartile, the line in the box is the median, the lower bound of the box is the lower quartile and the lower fence denotes the minimum value. The dots represent outliers.
The range of values for the vegetation indices varied across all landcover classes, with water showing the least range. Moreover, it was possible to distinguish between banana crop and “other vegetation” using the value-ranges of EVI2 and NDVI despite potential similarity in the spectral signature of both classes. Generally, both vegetation classes (banana cropland and other vegetation) have indices values above 0.1 while non-vegetation features (bare land, building and water) had index values below 0.0. Therefore, the selected vegetation indices are reasonably suitable as input variables for the landcover classification.

3.2. Overall Classification Accuracy

The algorithms were used to identify the most probable class for the target feature points (Banana land, bare land, other vegetation, building, and water). The overall best performing model was the RF with an over 95% overall accuracy and over 0.93 kappa coefficient for all data used, as seen in Table 3. CART performed relatively well with over 90% overall accuracy and kappa above 0.85 for all data. On the other hand, SVM performed poorly with only 56% overall accuracy and kappa coefficient of 0.25.
There was a poor distinction of banana and other vegetation classes and of building and bare land classes when using the SVM model, as seen in the confusion matrix in the Appendix A (Table A1) as compared to the other models. For all models, banana was sometimes confused with other vegetation class. The best precision for banana was achieved when using RF model at 0.97 compared to SVM and CART, whose precision was 0.58 and 0.92, respectively.

3.3. Effect of Input Data Richness Level

The overall performance of all the models was comparable at the different data richness levels. For the SVM model, the overall accuracy of 0.57 was achieved with 750, 1500, and 2306 training features. For the CART model, the model had a minimal error of 0.065 (Table 3). Its overall accuracy of 0.91 was achieved with 750, 1500, and 2306 training features. For the RF model, the number of trees to grow was chosen as the one that minimizes the out-of-bag error estimate (OOB error rate) for each classification. Five variables were randomly selected during each split (mtry value), with 800, 1000, and 1300 trees grown, at the different data level richness, thereby generating an OOB error rate estimate of 1.39%, 1.23%, and 1.12%, respectively. Overall accuracy and kappa coefficient of 0.95 and 0.93 was achieved with 750 training feature points, 0.97 and 0.95 with 1500 feature points, and 0.97 and 0.95 with all the 2306 feature points (Table 3).

3.4. Banana Land Area Assessment

Considering that the RF classifier had the overall best performance, the outputs from the classification, using the RF model for all data samples (level 3), were subsequently used to map the banana farm area across the four villages (Figure 5). The area covered by banana land in each village was calculated based on the number of pixels that are classified as banana-cultivated by the classifier (Table 4). Rusera village (in Kayonza district) had the highest proportion of banana-cultivated land area (80.93%), followed by Rubira, Murambo, and Karambo where banana covered 82.32%, 67.28%, and 62.41% of their village-level land area, respectively.

4. Discussion

The rapid classification of land cover with UAV-acquired imagery across multiple villages can enhance timeliness and accuracy of cropland area estimates, especially to advance decision-support for the specific crop (such as banana) or farming systems. Although this research was conducted as a study focused on four banana-producing villages in Rwanda, it demonstrates the potential to adapt UAV as a tool to support the national framework for agricultural assessment. The availability of spatio-temporally rich and crop-specific map products, based on high-resolution UAV-acquired imageries and reliable classification routine, can support the delivery of tailored recommendations and extension support to farmers, depending on the status and dynamics of their cropland conditions.
Access to robust ground-truth data is indispensable for the implementation of training and validation of the classification models. However, ground-level data points are rarely available at sufficient volume to fully calibrate and test models, and this study is not an exception. For our study, it was noteworthy that the accuracies of classifier models were comparable at different data richness levels, notwithstanding the general differences in the performance of the models relative to each other. The initial 750 georeferenced data points that were collected from banana farms provided a good basis for implementing the classification routine. Yet, the high-resolution orthomosaic UAV images (i.e., RGB band combination) offered a major advantage to support manual digitization of banana farms and generate more georeferenced data points, based on visual identification of the banana stands and canopy. This flexibility to generate additional data points (up to 3x the initial feature points) enabled the testing of hypotheses regarding the performance of ML classifiers at a different level of data richness, to evaluate the potential trade-off between these methods, as a guide for future and larger scale classification within similar/the same geography. The accuracy of RF and CART increased with increasing training data samples, although by a smaller margin. The random forest model performed well, on average above 96% accuracy, for all data levels tested. This implies that while in general better model performance can be expected with more ground-truth data, the performance of classification models tends to flatten out when a sufficient number of the data points is reached. Modelers need to strike a balance between model performance and the cost of data collection; model performances can be optimized at moderate data richness, with careful parameter tuning, for effective mapping of banana croplands in our case. This understanding can help to evolve sampling strategies to minimize the difficulty associated with acquiring ground truth data in heterogeneous landscapes for future national banana mapping projects.
Other studies [21,22] have utilized UAV-acquired imageries and object-oriented modeling techniques to map croplands, with varied accuracies and outcomes. In our efforts to identify a suitable classification model, it was clear that the classification accuracy metrics contrasted between the different classifier models. Our results suggest that the random forest model can be effective for identifying banana cropland and agree with previous research where the model has been reported to be promising for cropland mapping [11,21,22]. The least accurate model, the SVM, may have performed very poorly compared to RF and CART due to the model’s training complexities. SVM classified some banana farms as other vegetation because they have similar spectral characteristics. Since the model constructs hyperplanes in a multi-dimensional space to classify the target data [29,48], it may have performed poorly when the target classes in the data overlap, including shades of green color that are characteristics of banana and other vegetations. Generally, CART and RF were expected to perform at similar accuracy levels for distinguishing the landcover classes, considering that RF is an ensemble of decision trees. However, the accuracy metrics of both models which shows that RF performed better than CART may be indicative of the inherent limitation of CART, which is prone to overfitting by penalizing the fitted model to minimize the training noise at the expense of the overall data [17]. This problem is addressed in the RF model, which minimizes bias-related overfitting of the data, specifically by recognizing the nuances of vegetation characteristics and accounting for the high dimensionality of the data [33,34].
The successful delineation and estimation of the current banana-cultivated land area within each village provide additional evidence regarding the potential application of UAV for rapid assessment of cropland area for local or national planning and agronomic decision-support. It is noteworthy that the estimated area of the banana-cultivated land area is comparable to the current village-level estimates reported in national agricultural statistics. This rapid mapping and assessment of the banana-cultivated area in Rwanda is important to target extension resources within critical banana production areas, and provide useful data that can further support the mitigation of banana disease (including BXW) risk by providing timely targeted resources for control at a local, regional, and national scale. For instance, the risk of BXW contagion and incidence is linked to the presence and density of the host plant, banana. Therefore, clusters of farmlands that are cultivated with banana can be identified more easily with the landcover maps and relevant extension (information and personnel) resources can be deployed to support the farmers both for proactive and reactive actions to minimize the potential or existing threat of the disease.
To fully unlock the opportunity for rapid mapping of banana croplands, UAV-derived imagery can be fused with satellite data for national-scale mapping of banana croplands. Therefore, the future research direction can go beyond the spectral-based classification by including texture-based and object-oriented algorithms to extract more information about the unique features of banana farmlands. Also, it will be relevant to assess how classified land-cover data can be combined with other ancillary data (e.g., weather, slope, soil) to implement specific agronomic use-cases at the local and national level, such as prediction of (BXW) disease incidence and risk in Rwanda’s banana production system.

5. Conclusions

In this paper, we used UAV-based remote sensing technology to map the banana plantation in four selected villages in Rwanda. By comparing the accuracy of the three most popular classification methods, namely, support vector machines, classification and regression trees, and random forests relative to different data richness levels, we show that the classification accuracy attainable is dependent on the choice of classifiers; the classification performance seems flatten out when sufficient ground-truth data points are used. Our research also provides a valuable reference to guide the further application of UAV-based crop mapping in African smallholder farming systems and other complex mosaics of farming landscapes where short distance variation in vegetation characteristics often limit the use of relatively coarse satellite imagery data. The output landcover maps from rapid UAV-based mapping can be very useful for extension officers in Rwanda to target farmlands where banana is cultivated extensively and support the farmers with relevant information resources on banana agronomy, disease control, and post-harvest management of their crops from improved profitability.

6. Patents

This section is not mandatory but may be added if there are patents resulting from the work reported in this manuscript.

Author Contributions

Conceptualization, J.A. and R.K.; methodology, R.K., J.A., Z.S. and M.S.; resources, M.S. and J.A.; data curation, R.K., J.A. and Z.S.; writing—original draft preparation, R.K., J.A. and Z.S.; writing—review and editing, M.S. and Z.S.; visualization, R.K.; supervision, J.A.; project administration, J.A.; funding acquisition, M.S. All authors have read and agreed to the published version of the manuscript.

Funding

This work received financial support from the German Federal Ministry for Economic Cooperation and Development (BMZ) commissioned and administered through the Deutsche Gesellschaft für Internationale Zusammenarbeit (GIZ) Fund for International Agricultural Research (FIA), grant number 81219434.

Institutional Review Board Statement

Not Applicable.

Informed Consent Statement

Not Applicable.

Data Availability Statement

The data presented in this study are available on request from the corresponding author. The data are not publicly available due to internal institutional guidelines regarding the period of data incubation prior to public release.

Acknowledgments

The authors wish to thank project partners and collaborators who supported field-level data acquisition and overall implementation of the project, including Svetlana Gaidashova and other staff of Rwanda Agriculture and Animal Resources Board (RAB). Additional support for this and other work on BXW in the Great Lakes Region is provided by the Belgian Directorate General for Development Cooperation and Humanitarian Aid (DGD) through the Consortium for Improving Agricultural Livelihoods in Central Africa (CIALCA—www.cialca.org (accessed on 12 June 2021). The research forms an integral part of the CGIAR Research Program on Roots, Tubers and Bananas (RTB) which is supported by CGIAR Fund Donors (http://www.cgiar.org/about-us/our-funders/ (accessed on 12 June 2021).

Conflicts of Interest

The authors declare no conflict of interest.

Appendix A

Table A1. Table showing confusion matrices across all the pixel-based classification models for different models on 750 data richness.
REFERENCE
PREDICTIONBanana LandBare LandBuildingOther VegetationWater
SVMBanana land41,731472441910
Bare land302784888230
Building4232599166280
Other vegetation22,6162515571840
Water008700
CARTBanana land43,0633335193941
Bare land1293418215229427
Building189059710,8311616
Other vegetation40019312723,6584
Water000087
RFBanana land43,755178319580
Bare land75360877613432
Building82036112,246580
Other vegetation701033824,1710
Water000087
Table A2. Table showing confusion matrices across all the pixel-based classification models for different models on 1500 data richness.
REFERENCE
PREDICTIONBanana LandBare LandBuildingOther VegetationWater
SVMBanana land125,036925912,55667,9560
Bare land13033181840
Building705214,44927,6104631288
Other vegetation28648855220
Water01300
CARTBanana land128,8883983583710351
Bare land71811,7079623821
Building1555535732,9995890
Other vegetation1195271563471,3040
Water435185286
RFBanana land131,110177917161410
Bare land34819,3908542491
Building849198937,7311210
Other vegetation5363914972,8041
Water0000286
Table A3. Table showing confusion matrices across all the pixel-based classification models for different models on 2306 data richness.
REFERENCE
PREDICTIONBanana LandBare LandBuildingOther VegetationWater
SVMBanana land207,91015,32121,129112,8450
Bare land152362391000
Building12,13824,24746,0128048490
Other vegetation453911128810
Water11300
CARTBanana land214,6946017849727460
Bare land131319,66823153531
Building2444930755,83710210
Other vegetation194143051033118,1340
Water1145335489
RFBanana land218,503287527682340
Bare land64532,40913524231
Building1399334263,1342010
Other vegetation1071069241121,0160
Water0100489

References

  1. Awokuse, T.O. Does Agriculture Really Matter for Economic Growth in Developing Countries? In Agricultural and Applied Economics Association, Proceedings of the 2009 Annual Meeting, Wisconsin WI, USA, 26–28 July 2009; Wiley Publishers: Toronto, ON, Canada, 2019; Volume 63. [Google Scholar]
  2. FAO. The State of Food Security and Nutrition in the World 2018. Building Climate Resilience for Food Security and Nutrition—Policy Support and Governance Gateway; Food and Agriculture Organization of the United Nations: Rome, Italy, 2018; pp. 820–821. Available online: http://www.fao.org/policy-support/tools-and-publications/resources-details/en/c/1152267/ (accessed on 11 September 2021).
  3. Salami, A.; Kamara, A.B.; Brixiova, Z. Smallholder Agriculture in East Africa: Trends, Constraints and Opportunities; African Development Bank Group: Abidjan, Ivory Coast, 2010. [Google Scholar]
  4. Foley, J.A.; DeFries, R.; Asner, G.P.; Barford, C.; Bonan, G.; Carpenter, S.R.; Chapin, F.S.; Coe, M.; Daily, G.C.; Gibbs, H.K.; et al. Global consequences of land use. Science 2005, 309, 570–574. [Google Scholar] [CrossRef] [PubMed] [Green Version]
  5. Eitelberg, D.A.; van Vliet, J.; Verburg, P. A review of global potentially available cropland estimates and their consequences for model-based assessments. Glob. Chang. Biol. 2015, 21, 1236–1248. [Google Scholar] [CrossRef] [PubMed]
  6. Monfreda, C.; Ramankutty, N.; Foley, J.A. Farming the planet: Geographic distribution of crop areas, yields, physiological types, and net primary production in the year. Glob. Biogeochem. Cycles 2008, 22. [Google Scholar] [CrossRef]
  7. Castillejo-González, I.L.; López-Granados, F.; García-Ferrer, A.; Pe, J.M.; Sánchez, M.; Orden, D. Object-and pixel-based analysis for mapping crops and their agro-environmental associated measures using QuickBird imagery. Eur. J. Agron. 2009, 68, 207–215. [Google Scholar] [CrossRef]
  8. Cihlar, J. Land cover mapping of large areas from satellites: Status and research priorities. Int. J. Remote Sens. 2000, 21, 1093–1114. [Google Scholar] [CrossRef]
  9. Weersink, A.; Fraser, E.; Pannell, D.; Duncan, E.; Rotz, S. Opportunities and challenges for big data in agricultural and environmental analysis. Annu. Rev. Resour. Econ. 2018, 10, 19–37. [Google Scholar] [CrossRef]
  10. Tittonell, P.; Vanlauwe, B.; Leffelaar, P.; Giller, K. Estimating yields of tropical maize genotypes from non-destructive, on-farm plant morphological measurements. Agric. Ecosyst. Environ. 2005, 105, 213–220. [Google Scholar] [CrossRef]
  11. Neupane, B.; Horanont, T.; Hung, N.D. Deep learning based banana plant detection and counting using high-resolution red-green-blue (RGB) images collected from unmanned aerial vehicle (UAV). PLoS ONE 2019, 14, e0223906. [Google Scholar] [CrossRef]
  12. Tripicchio, P.; Satler, M.; Dabisias, G.; Ruffaldi, E.; Avizzano, C.A. Towards smart farming and sustainable agriculture with drones. In Proceedings of the Proceedings-2015 International Conference on Intelligent Environments, Prague, Czech Republic, 15–17 July 2015; pp. 140–143. [Google Scholar] [CrossRef]
  13. Tsouros, D.C.; Bibi, S.; Sarigiannidis, P.G. A review on UAV-based applications for precision agriculture. Information 2019, 10, 349. [Google Scholar] [CrossRef] [Green Version]
  14. Bannari, A.; Morin, D.; Bonn, F.; Huete, A.R. A review of vegetation indices. Remote Sens. Rev. 1995, 13, 95–120. [Google Scholar] [CrossRef]
  15. Tucker, C.J. Red and photographic infrared linear combination for monitoring vegetation. J. Remote Sens. Environ. 1979, 8, 127–150. [Google Scholar] [CrossRef] [Green Version]
  16. Gitelson, A.A.; Kaufman, Y.J.; Merzlyak, M.N. Use of a green channel in remote sensing of global vegetation from EOS-MODIS. Remote Sens. Environ. 1996, 58, 289–298. [Google Scholar] [CrossRef]
  17. Jiang, Z.; Huete, A.R.; Didan, K.; Miura, T. Development of a two-band enhanced vegetation index without a blue band. Remote Sens. Environ. 2008, 112, 3833–3845. [Google Scholar] [CrossRef]
  18. Adewopo, J.; Peter, H.; Mohammed, I.; Kamara, A.; Craufurd, P.; Vanlauwe, B. Can a Combination of UAV-Derived Vegetation Indices with Biophysical Variables Improve Yield Variability Assessment in Smallholder Farms? Agronomy 2020, 10, 1934. [Google Scholar] [CrossRef]
  19. Clevers, J.G.P.W.; Kooistra, L.; Brande, M.M.M.V.D. Using Sentinel-2 Data for Retrieving LAI and Leaf and Canopy Chlorophyll Content of a Potato Crop. Remote Sens. 2017, 9, 405. [Google Scholar] [CrossRef] [Green Version]
  20. Svotwa, E.; Masuka, A.J.; Maasdorp, B.; Murwira, A.; Shamudzarira, M. Remote Sensing Applications in Tobacco Yield Estimation and the Recommended Research in Zimbabwe. ISRN Agron. 2013, 2013, 1–7. [Google Scholar] [CrossRef] [Green Version]
  21. Chew, R.; Rineer, J.; Beach, R.; O‘Neil, M.; Ujeneza, N.; Lapidus, D.; Miano, T.; Hegarty-Craver, M.; Polly, J.; Temple, D.S. Deep Neural Networks and Transfer Learning for Food Crop Identification in UAV Images. Drones 2020, 4, 7. [Google Scholar] [CrossRef] [Green Version]
  22. Hall, O.; Dahlin, S.; Marstorp, H.; Bustos, M.F.A.; Öborn, I.; Jirström, M. Classification of Maize in Complex Smallholder Farming Systems Using UAV Imagery. Drones 2018, 2, 22. [Google Scholar] [CrossRef] [Green Version]
  23. Raeva, P.L.; Šedina, J.; Dlesk, A. Monitoring of crop fields using multispectral and thermal imagery from UAV. Eur. J. Remote Sens. 2019, 52, 192–201. [Google Scholar] [CrossRef] [Green Version]
  24. Useya, J.; Chen, S.; Murefu, M. Cropland Mapping and Change Detection: Toward Zimbabwean Cropland Inventory. IEEE Access 2019, 7, 53603–53620. [Google Scholar] [CrossRef]
  25. Lu, D.; Weng, Q. A survey of image classification methods and techniques for improving classification performance. Int. J. Remote Sens. 2007, 28, 823–870. [Google Scholar] [CrossRef]
  26. Chen, Y.; Lu, D.; Moran, E.; Batistella, M.; Dutra, L.V.; Sanches, I.D.; da Silva, R.F.B.; Huang, J.; Luiz, A.J.B.; de Oliveira, M.A.F. Mapping croplands, cropping patterns, and crop types using MODIS time-series data. Int. J. Appl. Earth Obs. Geoinf. 2018, 69, 133–147. [Google Scholar] [CrossRef]
  27. Gumma, M.K.; Nelson, A.; Thenkabail, P.S.; Singh, A.N. Mapping rice areas of South Asia using MODIS multitemporal data. J. Appl. Remote Sens. 2011, 5, 053547. [Google Scholar] [CrossRef] [Green Version]
  28. Hegarty-Craver, M.; Polly, J.; ONeil, M.; Ujeneza, N.; Rineer, J.; Beach, R.H.; Lapidus, D.; Temple, D.S. Remote Crop Mapping at Scale: Using Satellite Imagery and UAV-Acquired Data as Ground Truth. Remote Sens. 2020, 12, 1984. [Google Scholar] [CrossRef]
  29. Huang, C.; Davis, L.S.; Townshend, J.R.G. An assessment of support vector machines for land cover classification. Int. J. Remote Sens. 2002, 23, 725–749. [Google Scholar] [CrossRef]
  30. Foody, G.M.; Mathur, A. Toward intelligent training of supervised image classifications: Directing training data acquisition for SVM classification. Remote Sens. Environ. 2004, 93, 107–117. [Google Scholar] [CrossRef]
  31. Löw, F.; Michel, U.; Dech, S.; Conrad, C. Impact of feature selection on the accuracy and spatial uncertainty of per-field crop classification using Support Vector Machines. ISPRS J. Photogramm. Remote Sens. 2013, 85, 102–119. [Google Scholar] [CrossRef]
  32. Thanh Noi, P.; Kappas, M. Comparison of random forest, k-nearest neighbor, and support vector machine classifiers for land cover classification using Sentinel-2 imagery. Sensors 2018, 18, 18. [Google Scholar] [CrossRef] [PubMed] [Green Version]
  33. Rodriguez-Galiano, V.F.; Ghimire, B.; Rogan, J.; Chica-Olmo, M.; Rigol-Sanchez, J.P. An assessment of the effectiveness of a random forest classifier for land-cover classification. ISPRS J. Photogramm. Remote Sens. 2012, 67, 93–104. [Google Scholar] [CrossRef]
  34. Zhao, L.; Shi, Y.; Liu, B.; Hovis, C.; Duan, Y.; Shi, Z. Finer Classification of Crops by Fusing UAV Images and Sentinel-2A Data. Remote Sens. 2019, 11, 3012. [Google Scholar] [CrossRef] [Green Version]
  35. Tuyishime, C.; Pernechele, V.; Bizimana, C.; Semwaga, O. Rwanda Food and Agriculture Policy Monitoring Review 2020; Food and Agriculture Organization of the United Nations: Rome, Italy, 2020. [Google Scholar]
  36. McCampbell, M.; Schut, M.; Bergh, I.V.D.; van Schagen, B.; Vanlauwe, B.; Blomme, G.; Gaidashova, S.; Njukwe, E.; Leeuwis, C. Xanthomonas Wilt of Banana (BXW) in Central Africa: Opportunities, challenges, and pathways for citizen science and ICT-based control and prevention strategies. NJAS-Wagening. J. Life Sci. 2018, 86–87, 89–100. [Google Scholar] [CrossRef]
  37. Tripathi, L.; Tripathi, J.N. Relative susceptibility of banana cultivars to Xanthomonas campestris pv. musacearum. Afr. J. Biotechnol. 2009, 8, 5343–5350. [Google Scholar]
  38. Ali, D.A.; Deininger, K. Is There a Farm-Size Productivity Relationship in African Agriculture? Evidence from Rwanda. Land Econ. 2018, 94, 317–343. [Google Scholar] [CrossRef]
  39. Lowder, S.K.; Skoet, J.; Raney, T. The Number, Size, and Distribution of Farms, Smallholder Farms, and Family Farms Worldwide. World Dev. 2016, 87, 16–29. [Google Scholar] [CrossRef] [Green Version]
  40. Talukdar, S.; Singha, P.; Mahato, S.; Shahfahad; Pal, S.; Liou, Y.-A.; Rahman, A. Land-Use Land-Cover Classification by Machine Learning Classifiers for Satellite Observations—A Review. Remote Sens. 2020, 12, 1135. [Google Scholar] [CrossRef] [Green Version]
  41. Rogan, J.; Franklin, J.; Stow, D.; Miller, J.; Woodcock, C.; Roberts, D. Mapping land-cover modifications over large areas: A comparison of machine learning algorithms. Remote Sens. Environ. 2008, 112, 2272–2283. [Google Scholar] [CrossRef]
  42. Mondal, P. Quantifying surface gradients with a 2-band Enhanced Vegetation Index (EVI2). Ecol. Indic. 2011, 11, 918–924. [Google Scholar] [CrossRef]
  43. Foody, G.M. Status of land cover classification accuracy assessment. Remote Sens. Environ. 2002, 80, 185–201. [Google Scholar] [CrossRef]
  44. Quinlan, J.R. Induction of decision trees. Mach. Learn. 1986, 1, 81–106. [Google Scholar] [CrossRef] [Green Version]
  45. Breiman, L.; Friedman, J.H.; Olshen, R.A.; Stone, C.J. Classification and Regression Trees; Tayor and Francis Group: London, UK, 1984; 368p. [Google Scholar]
  46. Breiman, L. Random Forests. Mach. Learn. 2001, 45, 5–32. [Google Scholar] [CrossRef] [Green Version]
  47. Guo, W.; Rage, U.K.; Ninomiya, S. Illumination invariant segmentation of vegetation for time series wheat images based on decision tree model. Comput. Electron. Agric. 2013, 96, 58–66. [Google Scholar] [CrossRef]
  48. Hsu, C.-W.; Chang, C.-C.; Lin, C.-J. A Practical Guide to Support Vector Classification; Department of Computer Science and information Engineering, National Taiwan University: Taipei, Taiwan, 2003. [Google Scholar]
Figure 1. Map of Rwanda showing selected villages; Murambo and Karambo (Burera district) and Rusera and Rubira (Kayonza district) where UAV imageries and ground-truth data were acquired.
Remotesensing 13 04985 g001
Figure 2. Sample of RGB orthomosaic aerial images that were acquired at 0.25 m resolution (Karambo Village).
Remotesensing 13 04985 g002
Figure 3. Sample imagery of vegetation indices (VIs) used for landcover classification in Karambo village.
Remotesensing 13 04985 g003
Figure 4. Relative range of the calculated value for enhanced vegetation index (EVI2), normalized difference vegetation index (NDVI), and green normalized vegetation difference index (GNDVI) for the target landcover classes.
Remotesensing 13 04985 g004
Figure 5. Classification maps for the four villages. The grey shows the buildings, brown for bare land, black for other vegetation, green for banana land, and blue for water.
Remotesensing 13 04985 g005
Table 1. Ground truth data for various land use classes across the villages.
Banana LandBare LandBuilt-UpOther VegetationWater
Murambo126131194774
Karambo10896219624
Rubira17913527441N/A
Rusera20274273107N/A
TOTAL6154369602878
Table 2. The relative split of training and test data samples across villages based on the different data richness levels for village-level classification of land cover in Rwanda.
Data RichnessNumber of Data SamplesTraining (70%)Test
(30%)
Level 1750525225
Level 215001050450
Level 323061615691
Table 3. Table showing model performance across all villages for different levels of selected data richness.
Data PointsSVMCARTRF
AccuracykappaAccuracykappaAccuracykappa
7500.5630.2530.9070.8560.9570.934
15000.5670.2520.9070.8560.9670.949
23060.5660.2520.9080.8570.9670.950
Table 4. Table showing banana farm area for the four villages and the percentage coverage of the banana farms for each village.
DistrictVillageBanana Area (ha)Village Area (ha)Banana Land (%)
KayonzaRusera134.02165.5880.93
KayonzaRubira121.12147.1282.32
BureraMurambo96.70143.7267.28
BureraKarambo52.3083.862.41
Publisher’s Note: MDPI stays neutral with regard to jurisdictional claims in published maps and institutional affiliations.

