Article

Maritime Multiple Moving Target Detection Using Multiple-BDS-Based Radar: Doppler Phase Compensation and Resolution Improvement

1
The School of Physics and Optoelectronic Engineering, Xidian University, Xi’an 710000, China
2
Xi’an Research Institute of High Technology, Xi’an 710000, China
*
Author to whom correspondence should be addressed.
Remote Sens. 2021, 13(24), 4963; https://doi.org/10.3390/rs13244963
Submission received: 8 November 2021 / Revised: 2 December 2021 / Accepted: 3 December 2021 / Published: 7 December 2021
(This article belongs to the Special Issue BDS/GNSS for Earth Observation)

Abstract

:
With the realization of global navigation satellite system (GNSS) completion, GNSS reflectometry (GNSS-R) has become increasingly popular due to the advantages of global coverage and the availability of multiple sources in terms of earth remote sensing. This paper analyzes the Beidou navigation satellite system (BDS) signal reflection detection of multiple satellites and multiple moving targets under multiple-input and multiple-output (MIMO) radar systems and proposes a series of methods to suppress multiple Doppler phase influences and improve the range detection property. The simulation results show the restored target peaks, which match the RCS data more accurately, with the GNSS-R Doppler phase influence removed, which proves the proposed method can improve target recognition and detection resolution performance.

1. Introduction

At the moment more than 70 satellites are already in view; this brings great opportunities and challenges for both scientific and engineering applications. The different global navigation satellite system (GNSS) signals are compared and analyzed in the literature [1] in terms of detection performance and signal characteristics. A four-system positioning model for multi-satellite detection is proposed in the literature [2].
Global navigation satellite system reflectometry (GNSS-R) detection has become a popular tool for earth remote sensing, such as multiple maritime targets detection, with its gradual improvement in observation technology. Based on GNSS-R delay–Doppler map (DDM) imaging, an effective method of expression based on GNSS-R signals, the literature [3,4,5] shows an incoherent range walk compensation method and accurate realization methods to improve the DDM imaging effectiveness. The waveform and detection models were analyzed in [6,7] for GNSS-R detection. With the gradual maturity of the Beidou navigation satellite system (BDS), BDS satellite remote sensing studies have become increasingly widespread. The single-frequency PPP time transfer performance of BDS-2/3 is evaluated for excellent performance and BDS-3’s is expected for better accuracy with the continuous development of real-time products of BDS [8]. Time–frequency-transfer and time performance technology based on BDS systems have been implemented and evaluated [9,10]. With the increase in the demand for precise positioning, an increasing number of observational reports have been proposed with constant improvement of the positioning method. The literature [11,12] presents a real-time detection and point position method based on the combination of GPS and BDS observations.
BDS-R detection still leaves some problems to be solved. Due to the low reflected signal power, it is difficult to obtain complete target information with a background of strong clutter and noise. Reference [13] notes that for large and medium-sized targets on the sea surface, GNSS-R detection can acquire a sufficient signal-to-noise ratio (SNR) of 20~25 dB [14] after several seconds of accumulation. Next, one study in the literature [14,15] simulated a delay–Doppler map (DDM) of large-scale targets and verified the effectiveness of large-scale target detection based on short time accumulation signals using the range–Doppler Fourier method. In terms of theoretical construction and system model, reference [16] gives an extremum approximation algorithm for advanced receiver autonomous integrity monitoring, and triple-frequency combining observation models have been studied for precise point positioning [17]. Moreover, real-time, direction-constrained determination methods were proposed for point velocity detection studies [18,19,20]. In order to better interpret the target information of the GNSS-R signal and obtain the images that match the detected target, many signal processing methods were proposed. The incoherent range walk compensation method was proposed for spaceborne GNSS-R imaging [3], and GNSS-R-based moving target indication is studied in the literature [21]. In terms of marine target detection, ocean surface target detection and positioning were discussed [22], the delay and Doppler tracking errors were analyzed [15], and the feasibility analysis of ship detection by DDM was simulated [23]. In order to distinguish sea targets from sea clutter, the blind sea clutter suppression method was discussed [24]. Moreover, the data of TDS-1 were used to prove the effectiveness of the proposed target detection method [25], and the anomalous artifacts of TDS-1 DDM were analyzed in [26].
In this paper, multiple-BDS signal reflection detection for multiple moving targets was studied. We propose the multiple targets Doppler compensation (MTDC) method to keep target peaks from the influence of the Doppler phase and provide a target peak identification method and range inversion methods to realize the specific scatter information detection of targets. The contributions of this paper can be summarized as follows: (1) The target peak reduction problem existing in multiple-BDS signal detection was analyzed by echo formulas, and solutions are proposed for two situations: when target estimation information is acquired and when it is not. In the simulation, a difference of more than 400 Hz in the Doppler frequency was set among the detected targets, which further verifies that the proposed method is effective; (2) The target peak identification method is proposed based on 33 m sampling at the echoes, and the improved target detection peaks can express the target information more accurately in terms of amplitude and range point; (3) A range inversion method is proposed to acquire the specific scatter information in the case of low-resolution BDS signals. The results are in good agreement with the corresponding RCS data in the ship target simulation; (4) In terms of practicability, the proposed MTDC method 1 and range inverse method 1 can remove the Doppler phase influence and further acquire the targets’ RCS distribution without target estimation. The target peak identification results based on 33 m echo sampling can be utilized to verify target recognition. Moreover, the results were simulated and analyzed under clutter and noise backgrounds.
The rest of the sections in this paper are organized as follows. Section 2 discusses the MIMO BDS signal detection model and lists existing problems. The Doppler compensation methods and range detection resolution design of the BDS signal based on MIMO multiple-target detection are discussed in Section 3. In Section 4, the simulation results and analysis are obtained. Finally, the paper is concluded in Section 5.

2. Detection Model and Existing Problems

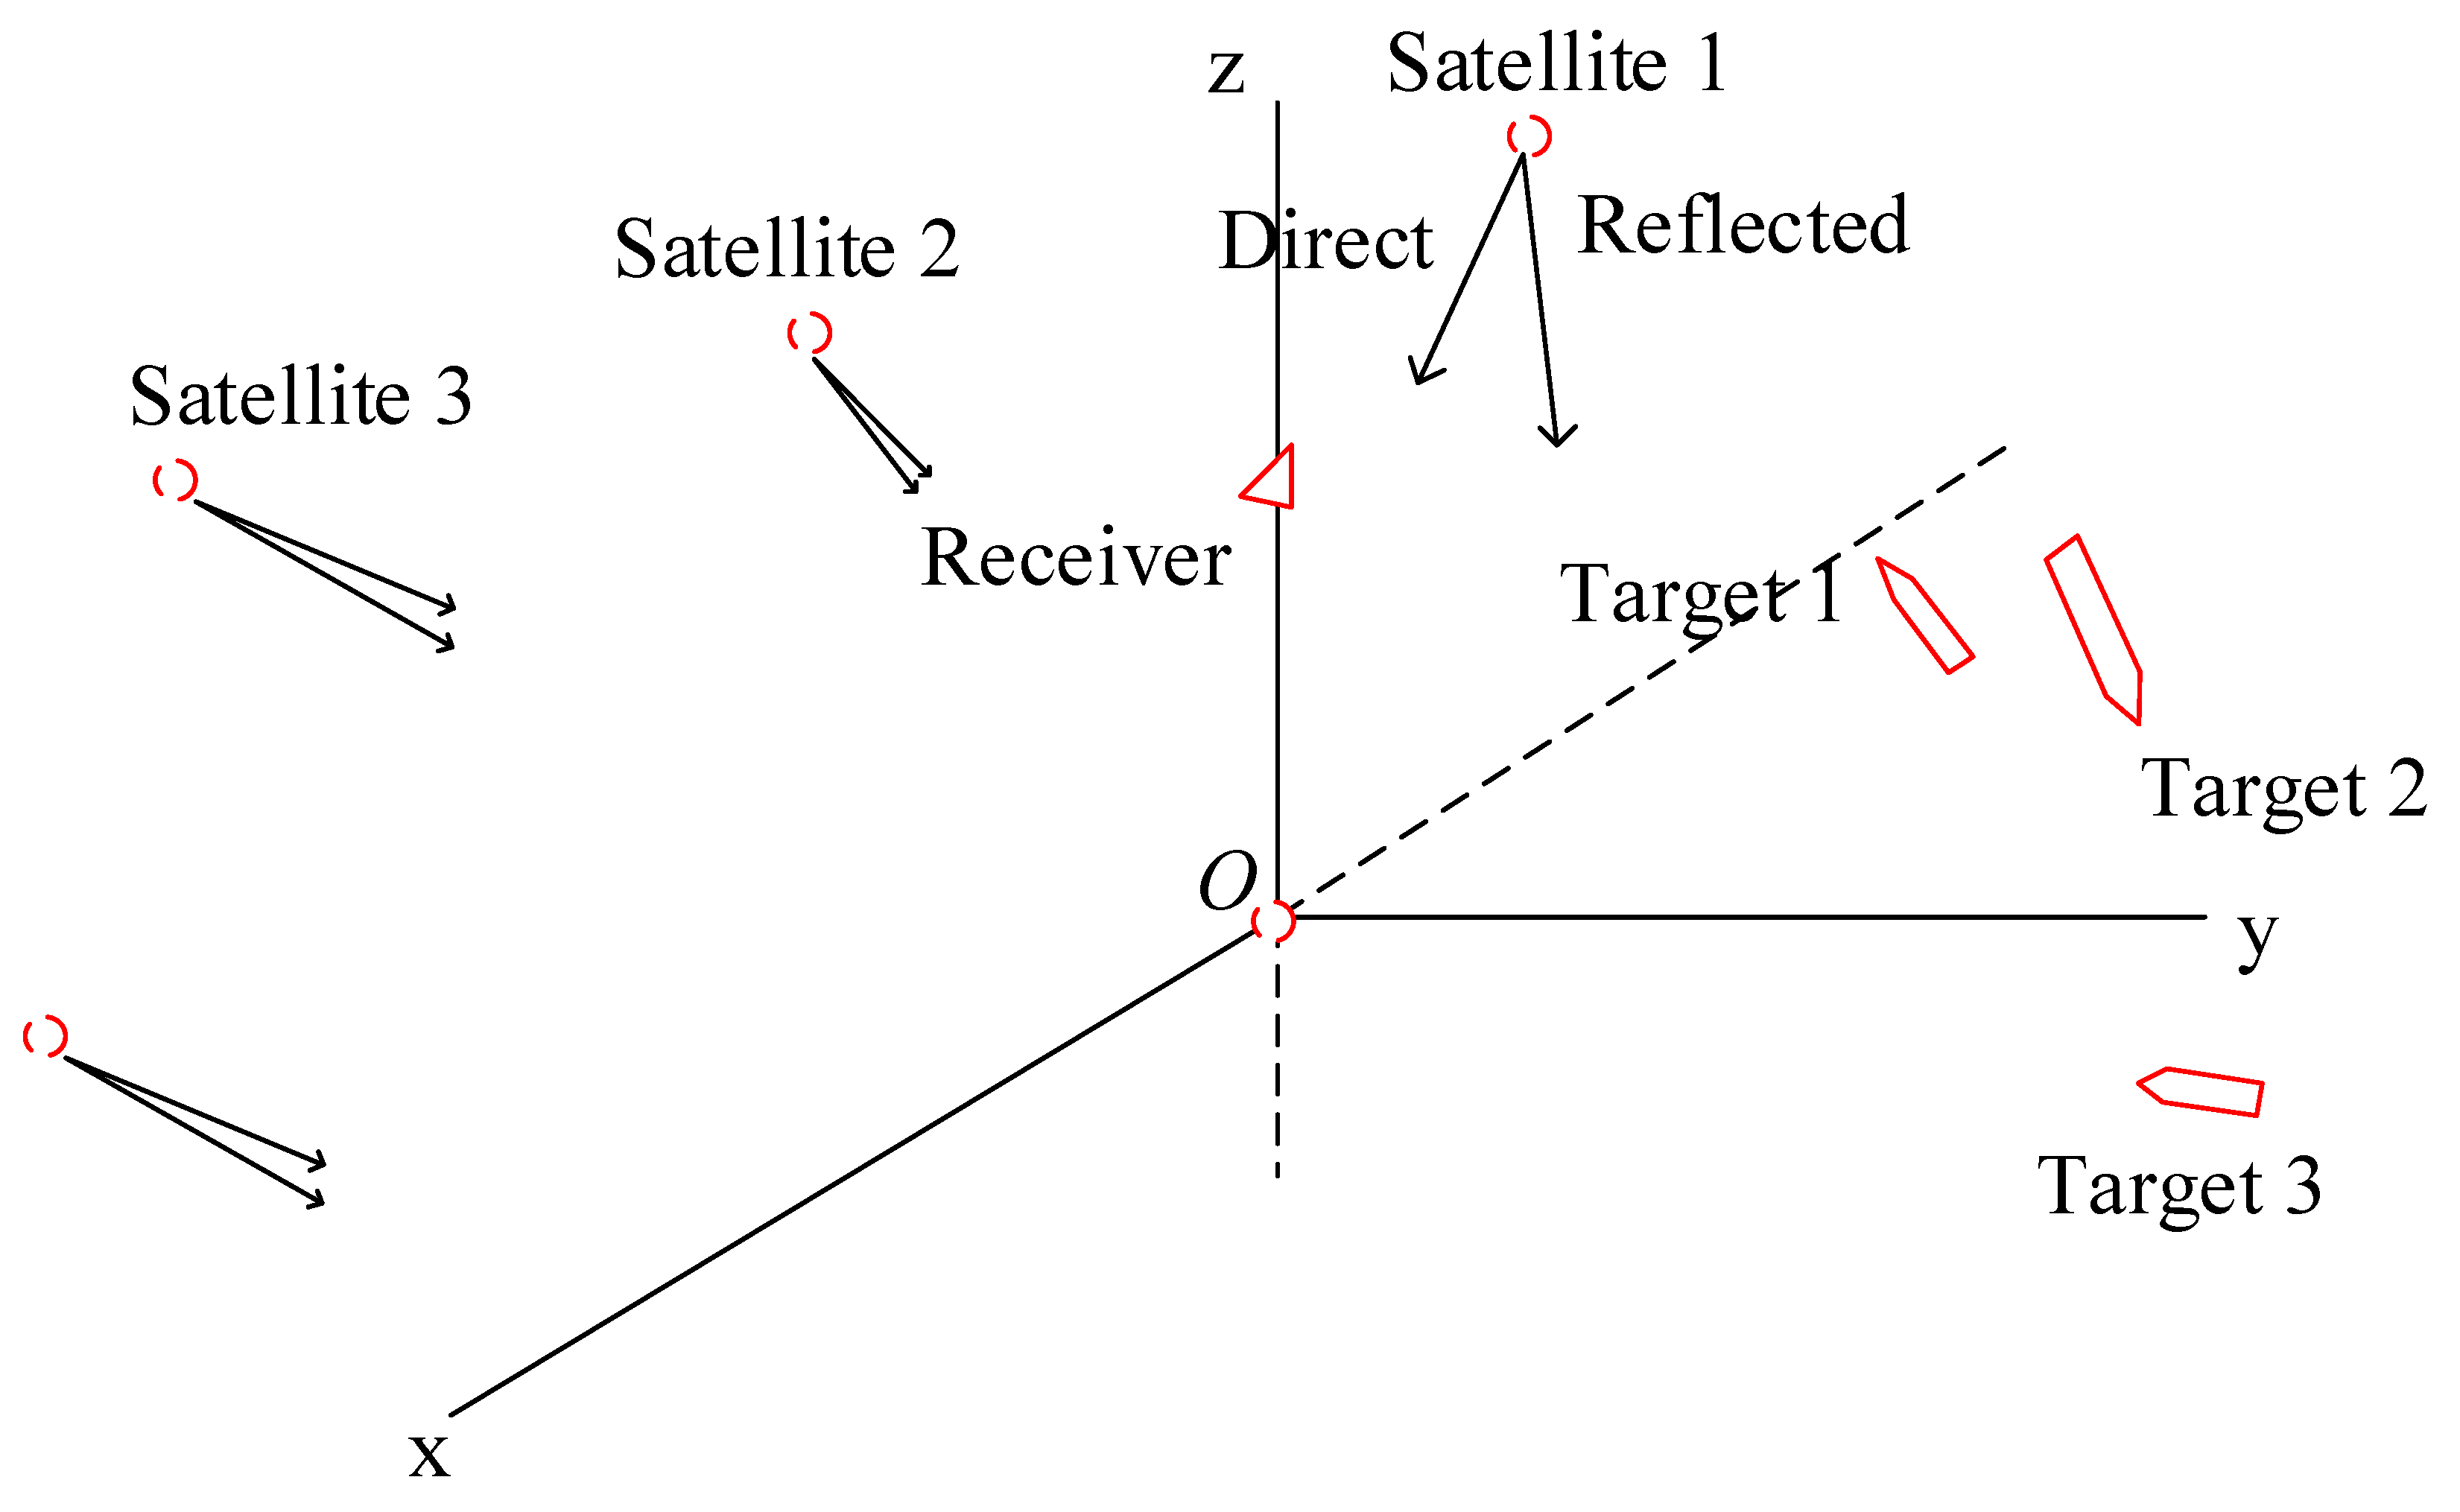
2.1. Detection Model

The detection model of multiple GNSS-R signals for multiple targets was firstly outlined. The BDS signals, which are transmitted by MEO (medium earth orbit) satellites in the Beidou No. 3 system fixed at 2.1528 × 10 4 km above the Earth’s surface, were used as detection sources. The detection simulated maritime multiple moving target detection under space-based observation. The geometry of the model is given in Figure 1, where a rectangular coordinate system is established and the XOY level coincides with the sea level. The satellites, targets, and receiver positions are marked in red.

2.2. Signal Structure

During the detection model, several sets of B1I and B3I signals transmitted by MEO satellites with corresponding pseudo-random noise (PRN) codes were used. A part of the signals reaches the airborne-based receiver directly, and the other part of the signals is reflected by the ship targets and arrives at the latter receiver. The received echo is the sum of all echoes transmitted by each satellite and reflected by each target. In the simulation experiment, we found the echo modulation information through the proposed geometric model with satellite ephemeris, receiver motion information and target position, altitude, and velocity information. The BDS signals’ model structures are expressed as formulae with changes and states in the propagation and receivers, as follows.
In the formula expression, we set ‘i’ as the satellite number and ‘j’ as the target number. The transmitting BDS signal [27,28] of satellite i is expressed as:
s i ( t ) = A C i D i cos ( 2 π f 0 t + φ i )
where s i ( t ) contains B1I and B3I signals. A is the signal amplitude, C i the signal ranging code, and D i the signal data code. During the cosine function, f 0 is the carrier frequency, and φ i is the original phase. The echoes after propagation and receiving can be expressed as follows:
R d i = a d i s i ( t τ d i , f d d i )
R r i , j = a r i , j s i ( t τ r i , j , f d r i , j )
where the subscripts ‘d’ and ‘r’ are direct signals and reflected signals, respectively. a d i is the propagation coefficient and scattering coefficient of direct signals, and a r i , j is the reflected signal reflected by target j. τ and f d are the responding transmitted delay and Doppler frequency, which are related to the carrier frequency and show different values between the B1I and B3I signals. Finally, the total received B1I and B3I signals transmitted by multiple satellites and propagated through the direct and multiple targets reflection approach is expressed as
R = i = 1 M ( R B 1 I , d i + j = 1 N R B 1 I , r i , j ) + i = 1 M ( R B 3 I , d i + j = 1 N R B 3 I , r i , j )
For pulse accumulation and slow-time Doppler frequency detection, the echoes expressed in Q ranging code periods is (5), after data code demodulation processing.
R Q = q = 1 Q u T P ( t q T P ) R
where R Q represents the echoes in Q ranging code periods, and u T P ( t q T P ) = 1 , q T P < t < ( q + 1 ) T P is the window function. T P is the ranging code cycle period.

2.3. Existing Problems

Based on the detection model, there exist several problems which promote the development of the proposed methods:
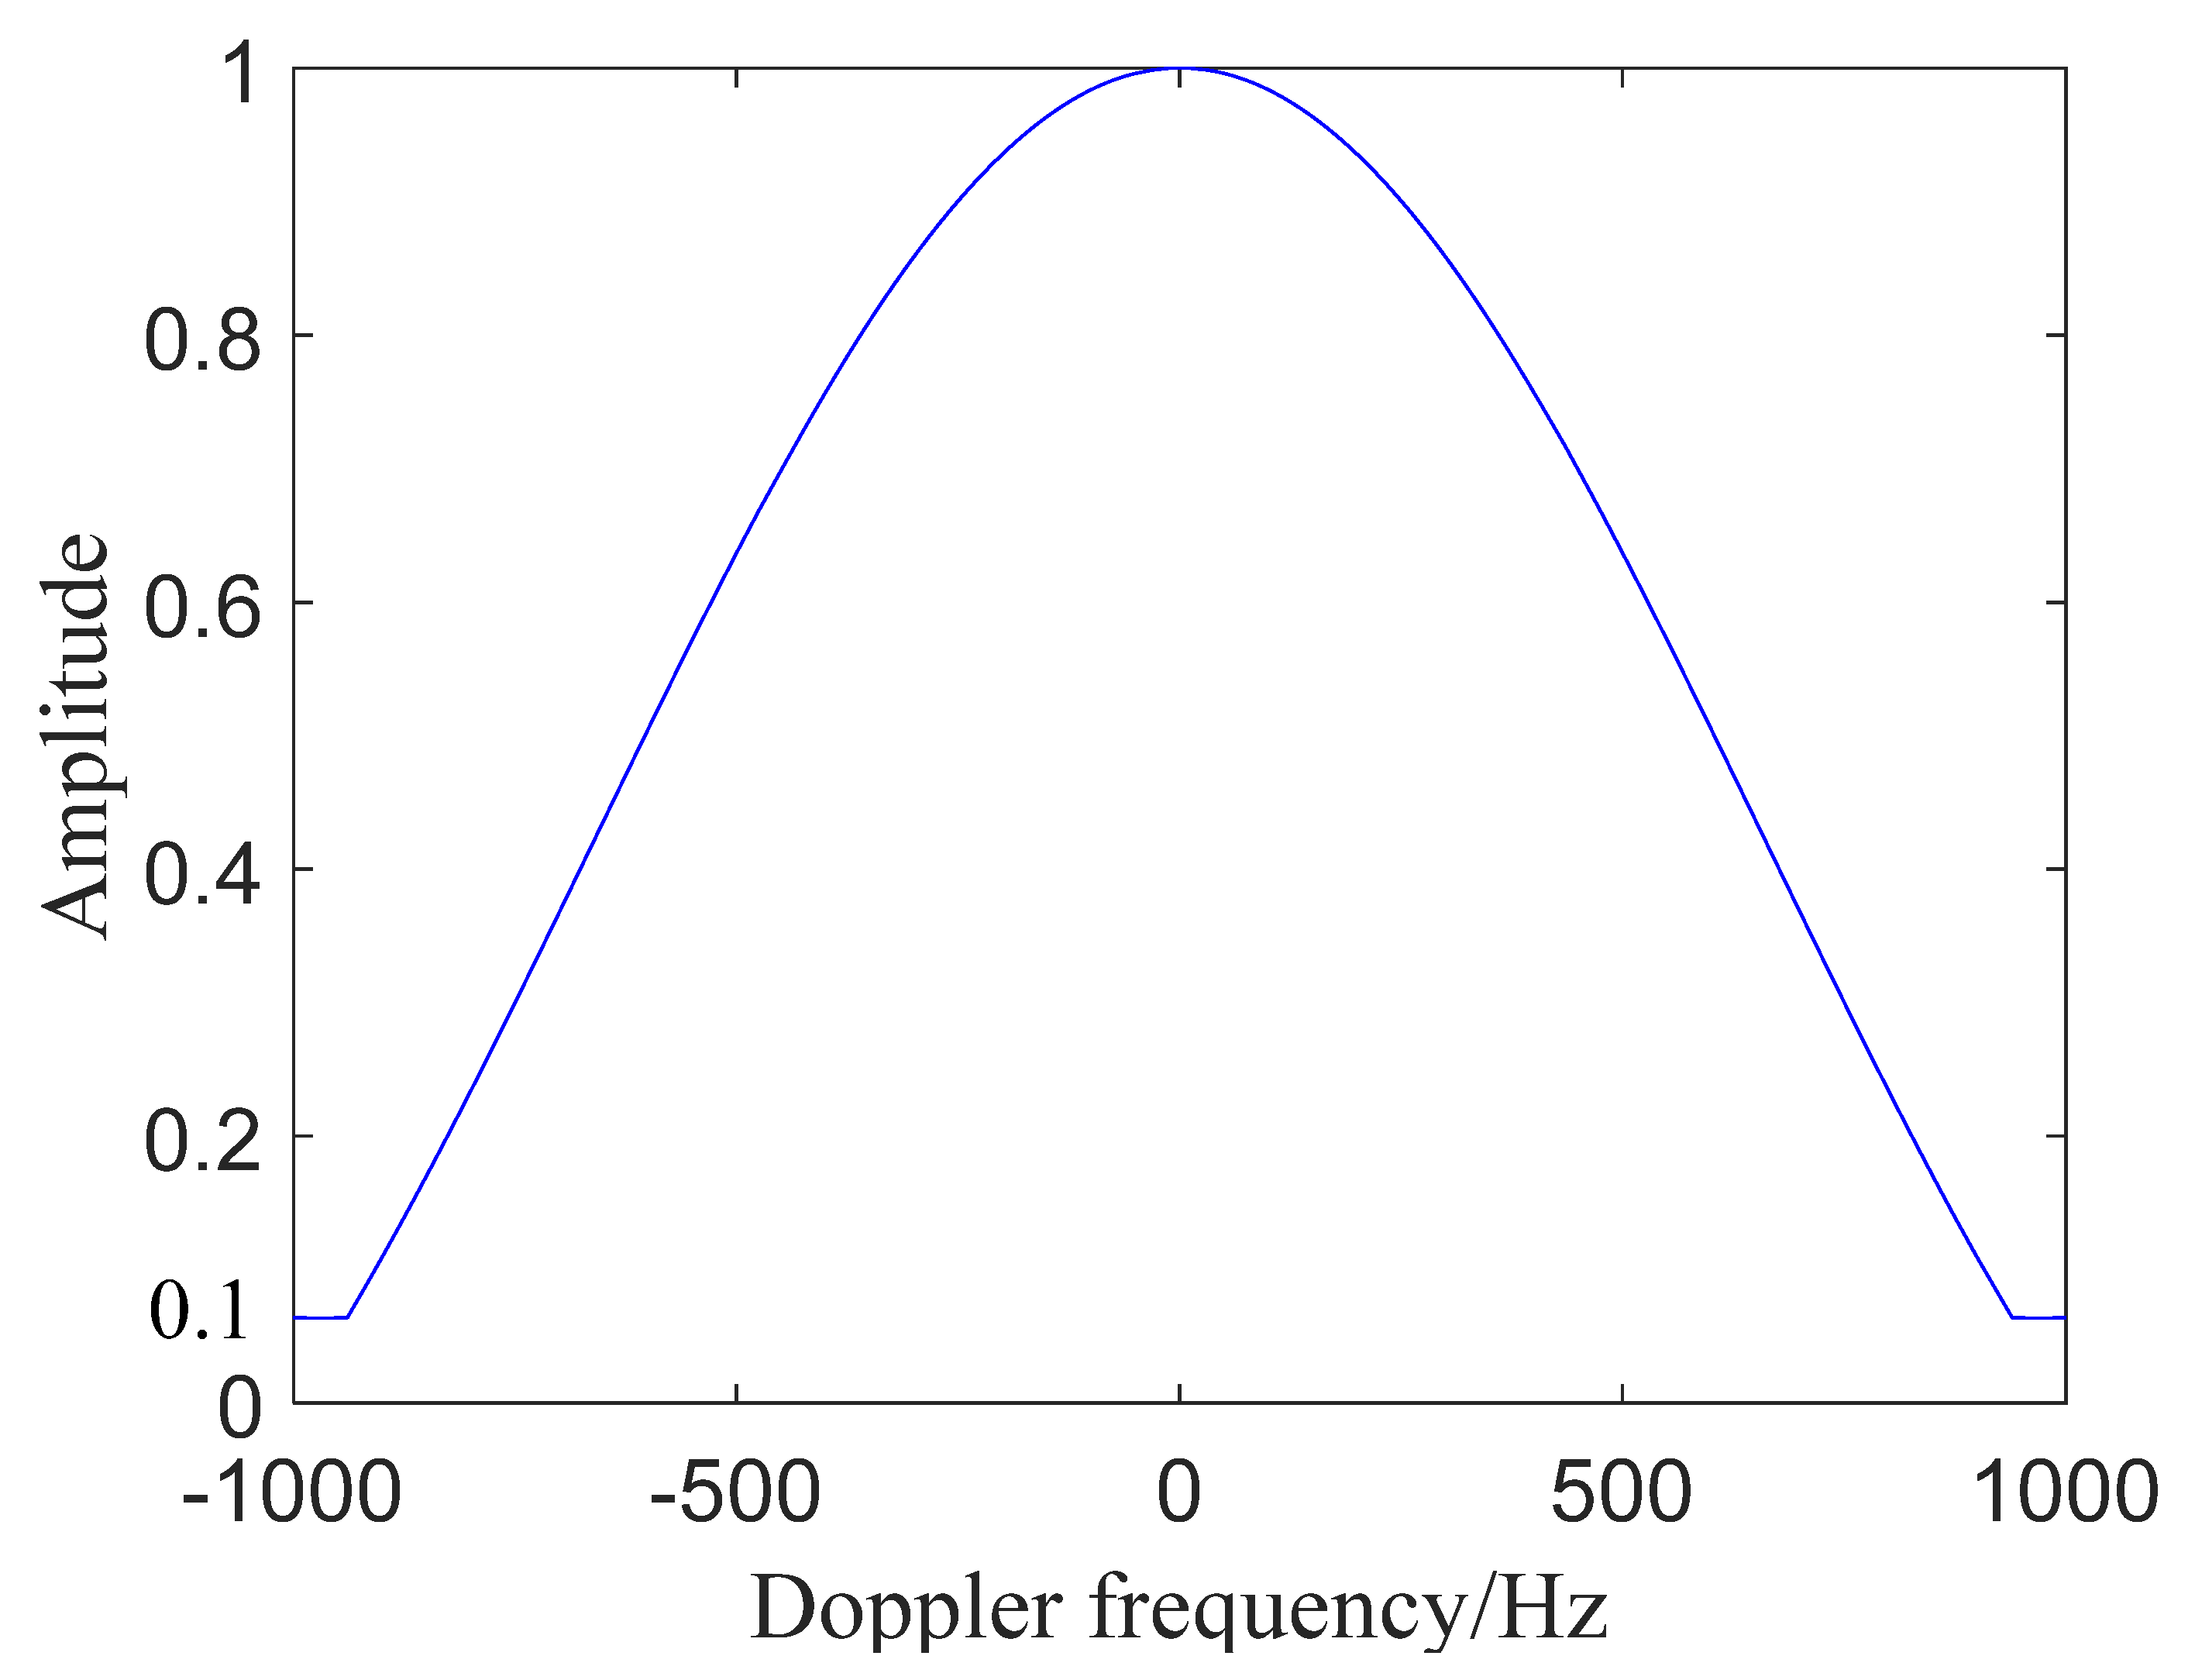
  • First, the satellites and receiver are moving fast, which will produce a large Doppler frequency. With different dual-station angle of targets, the Doppler frequencies among the targets shows big differences, which weakened target detection peaks to varying degrees. A Doppler compensation method should be given to restore and unify the target peaks.
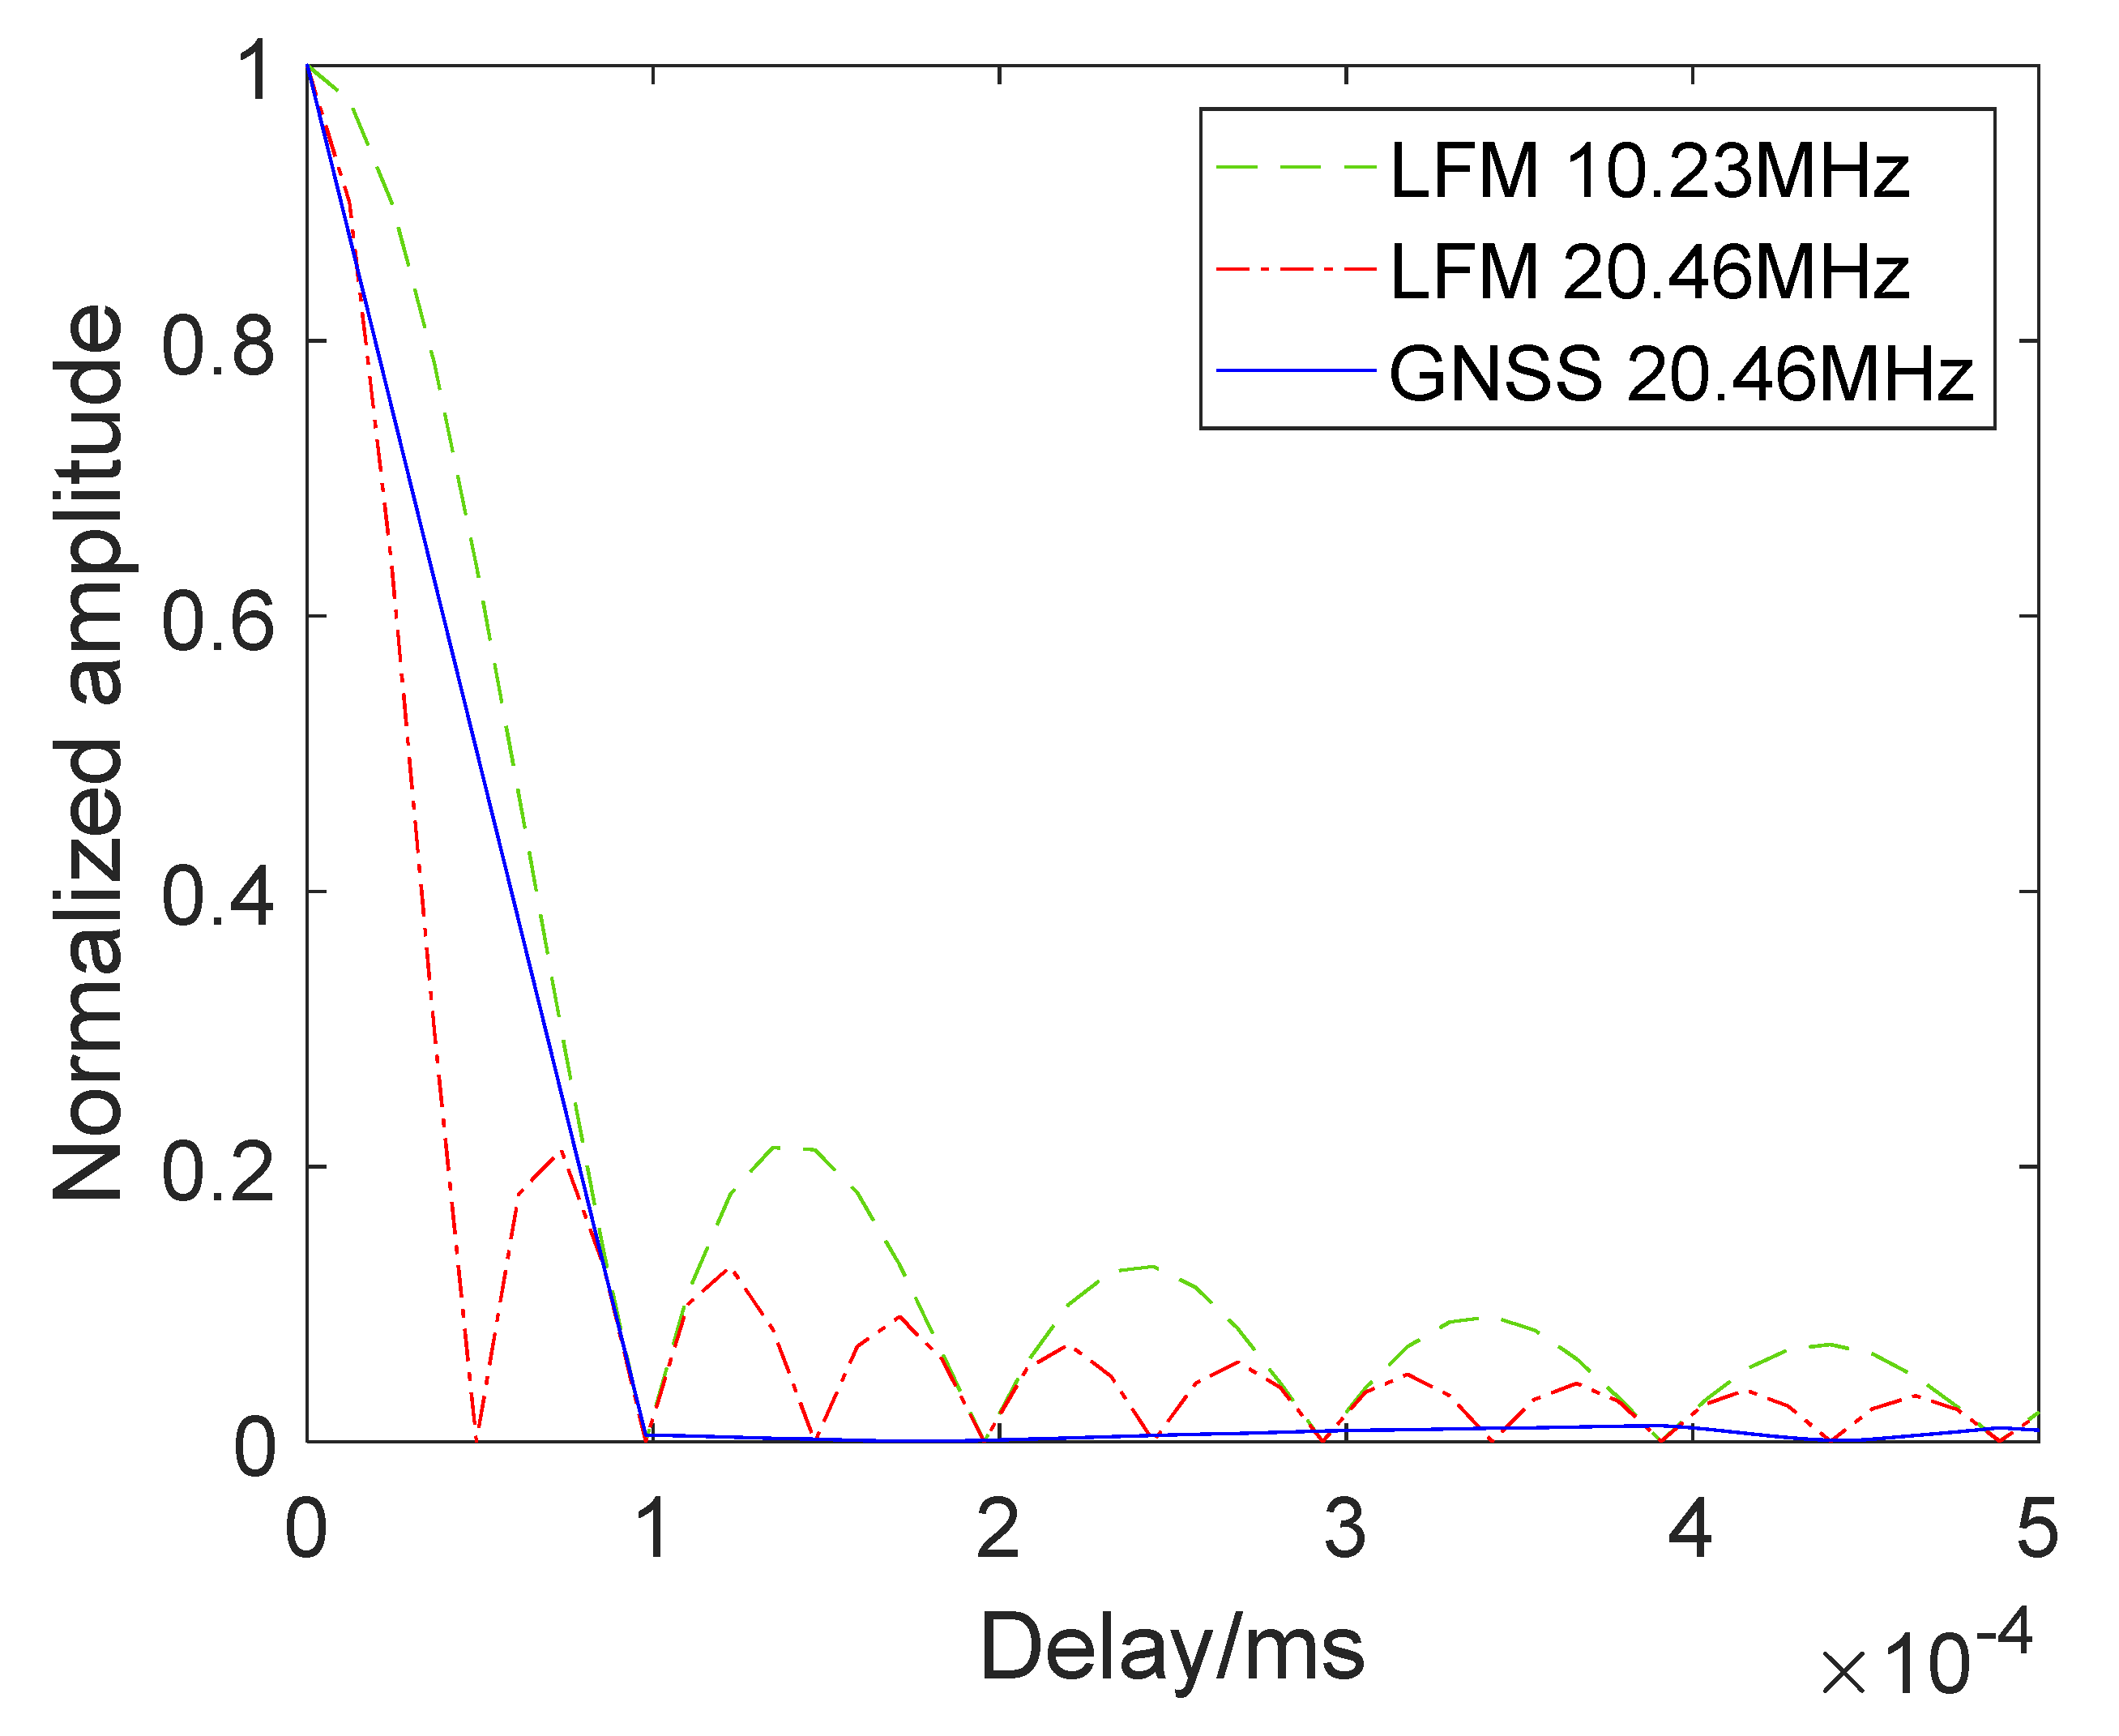
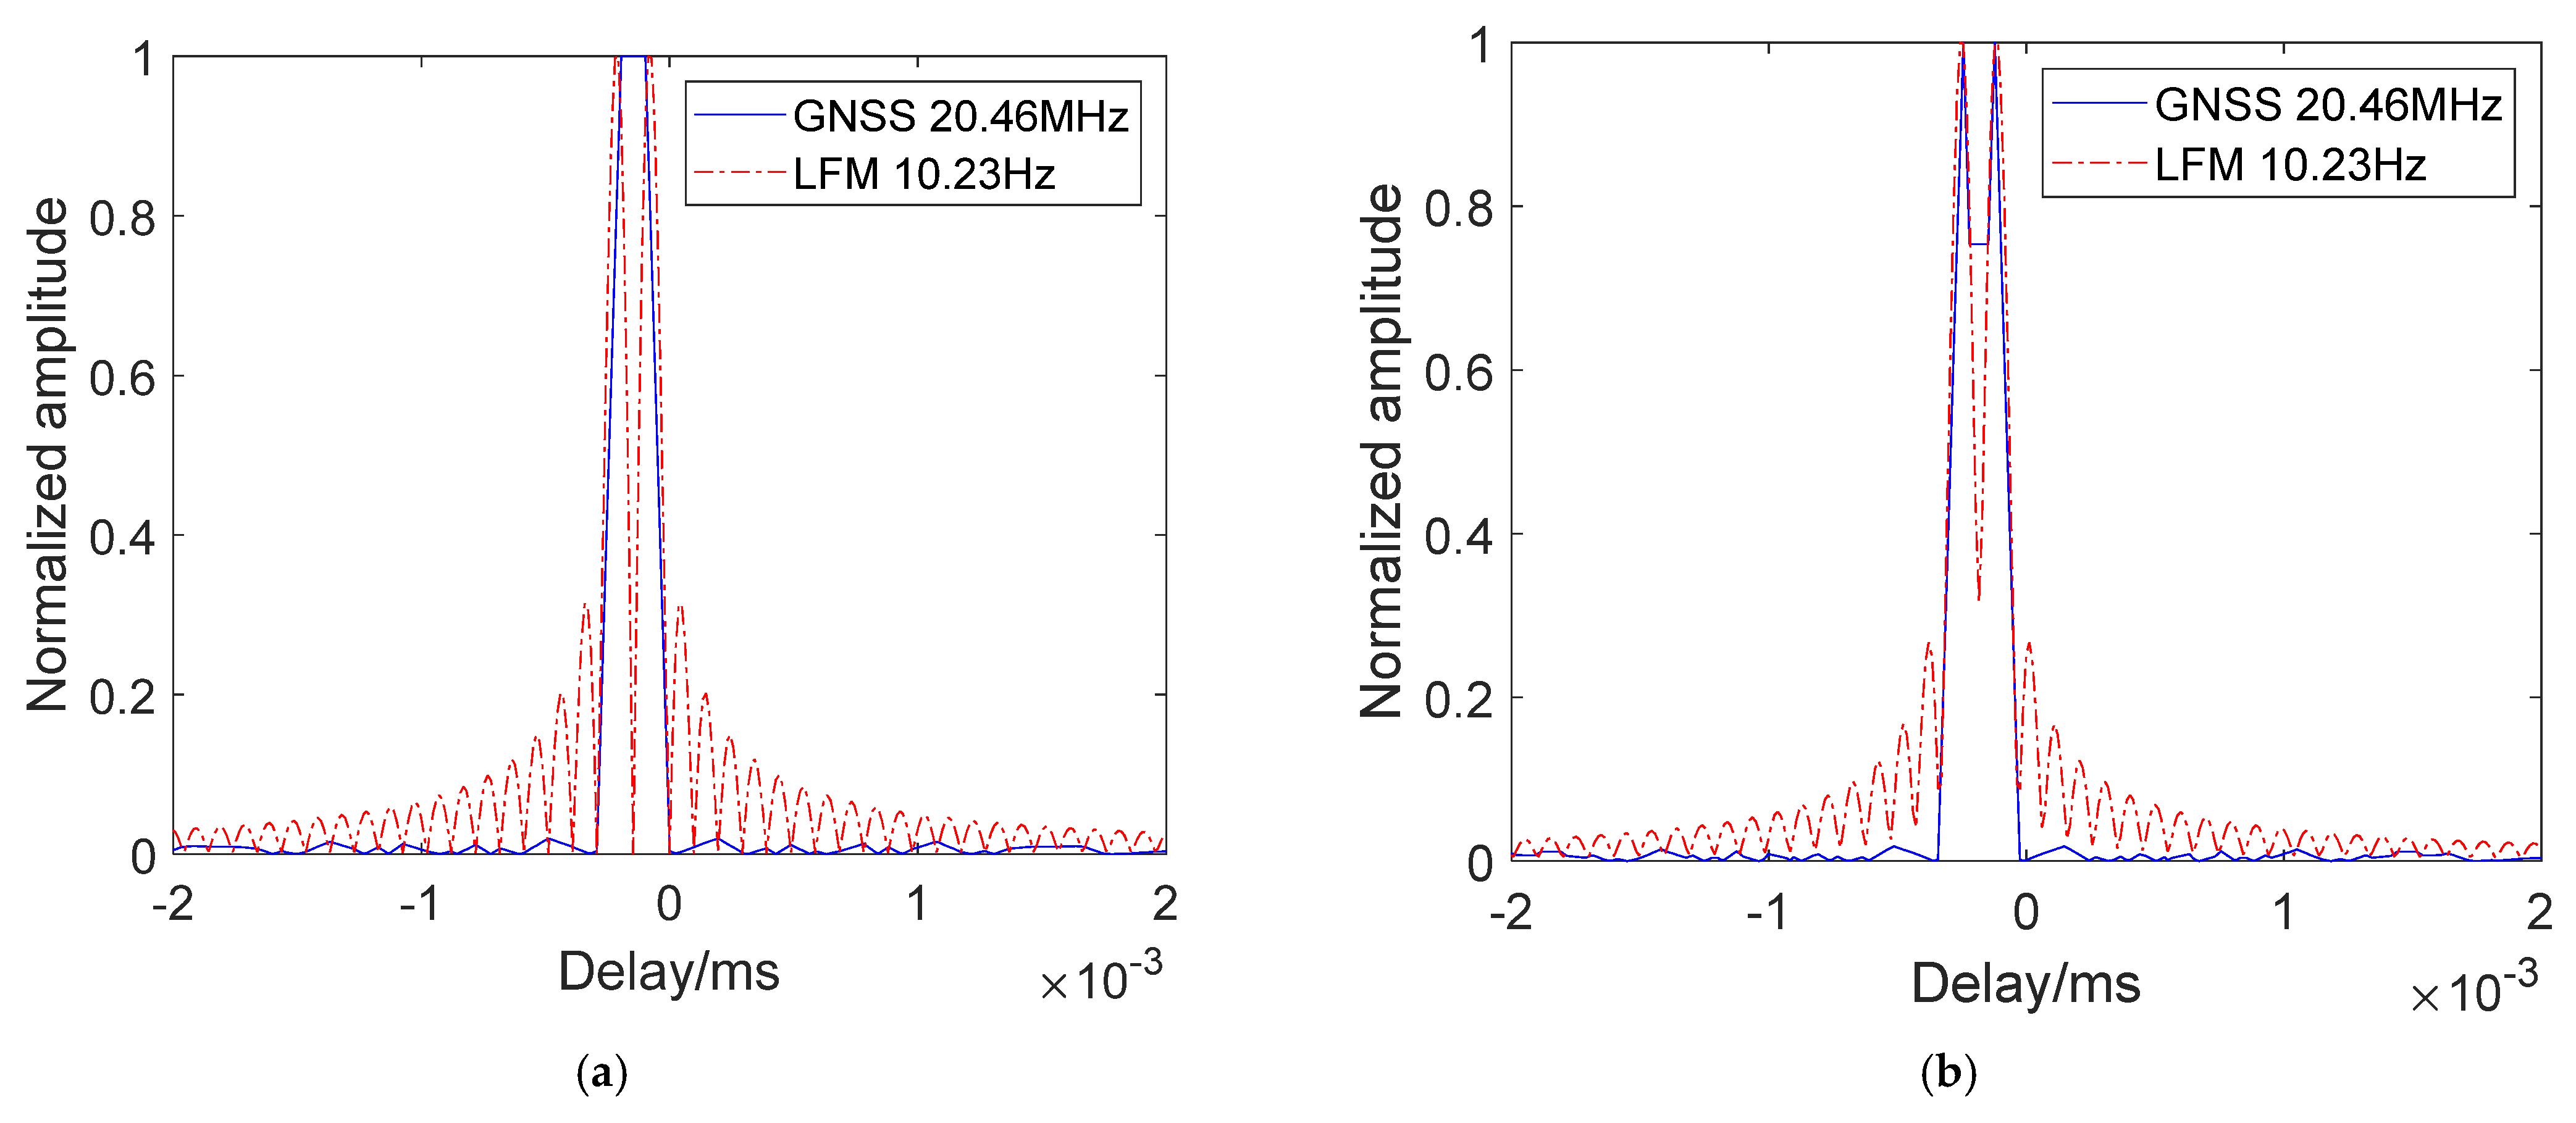
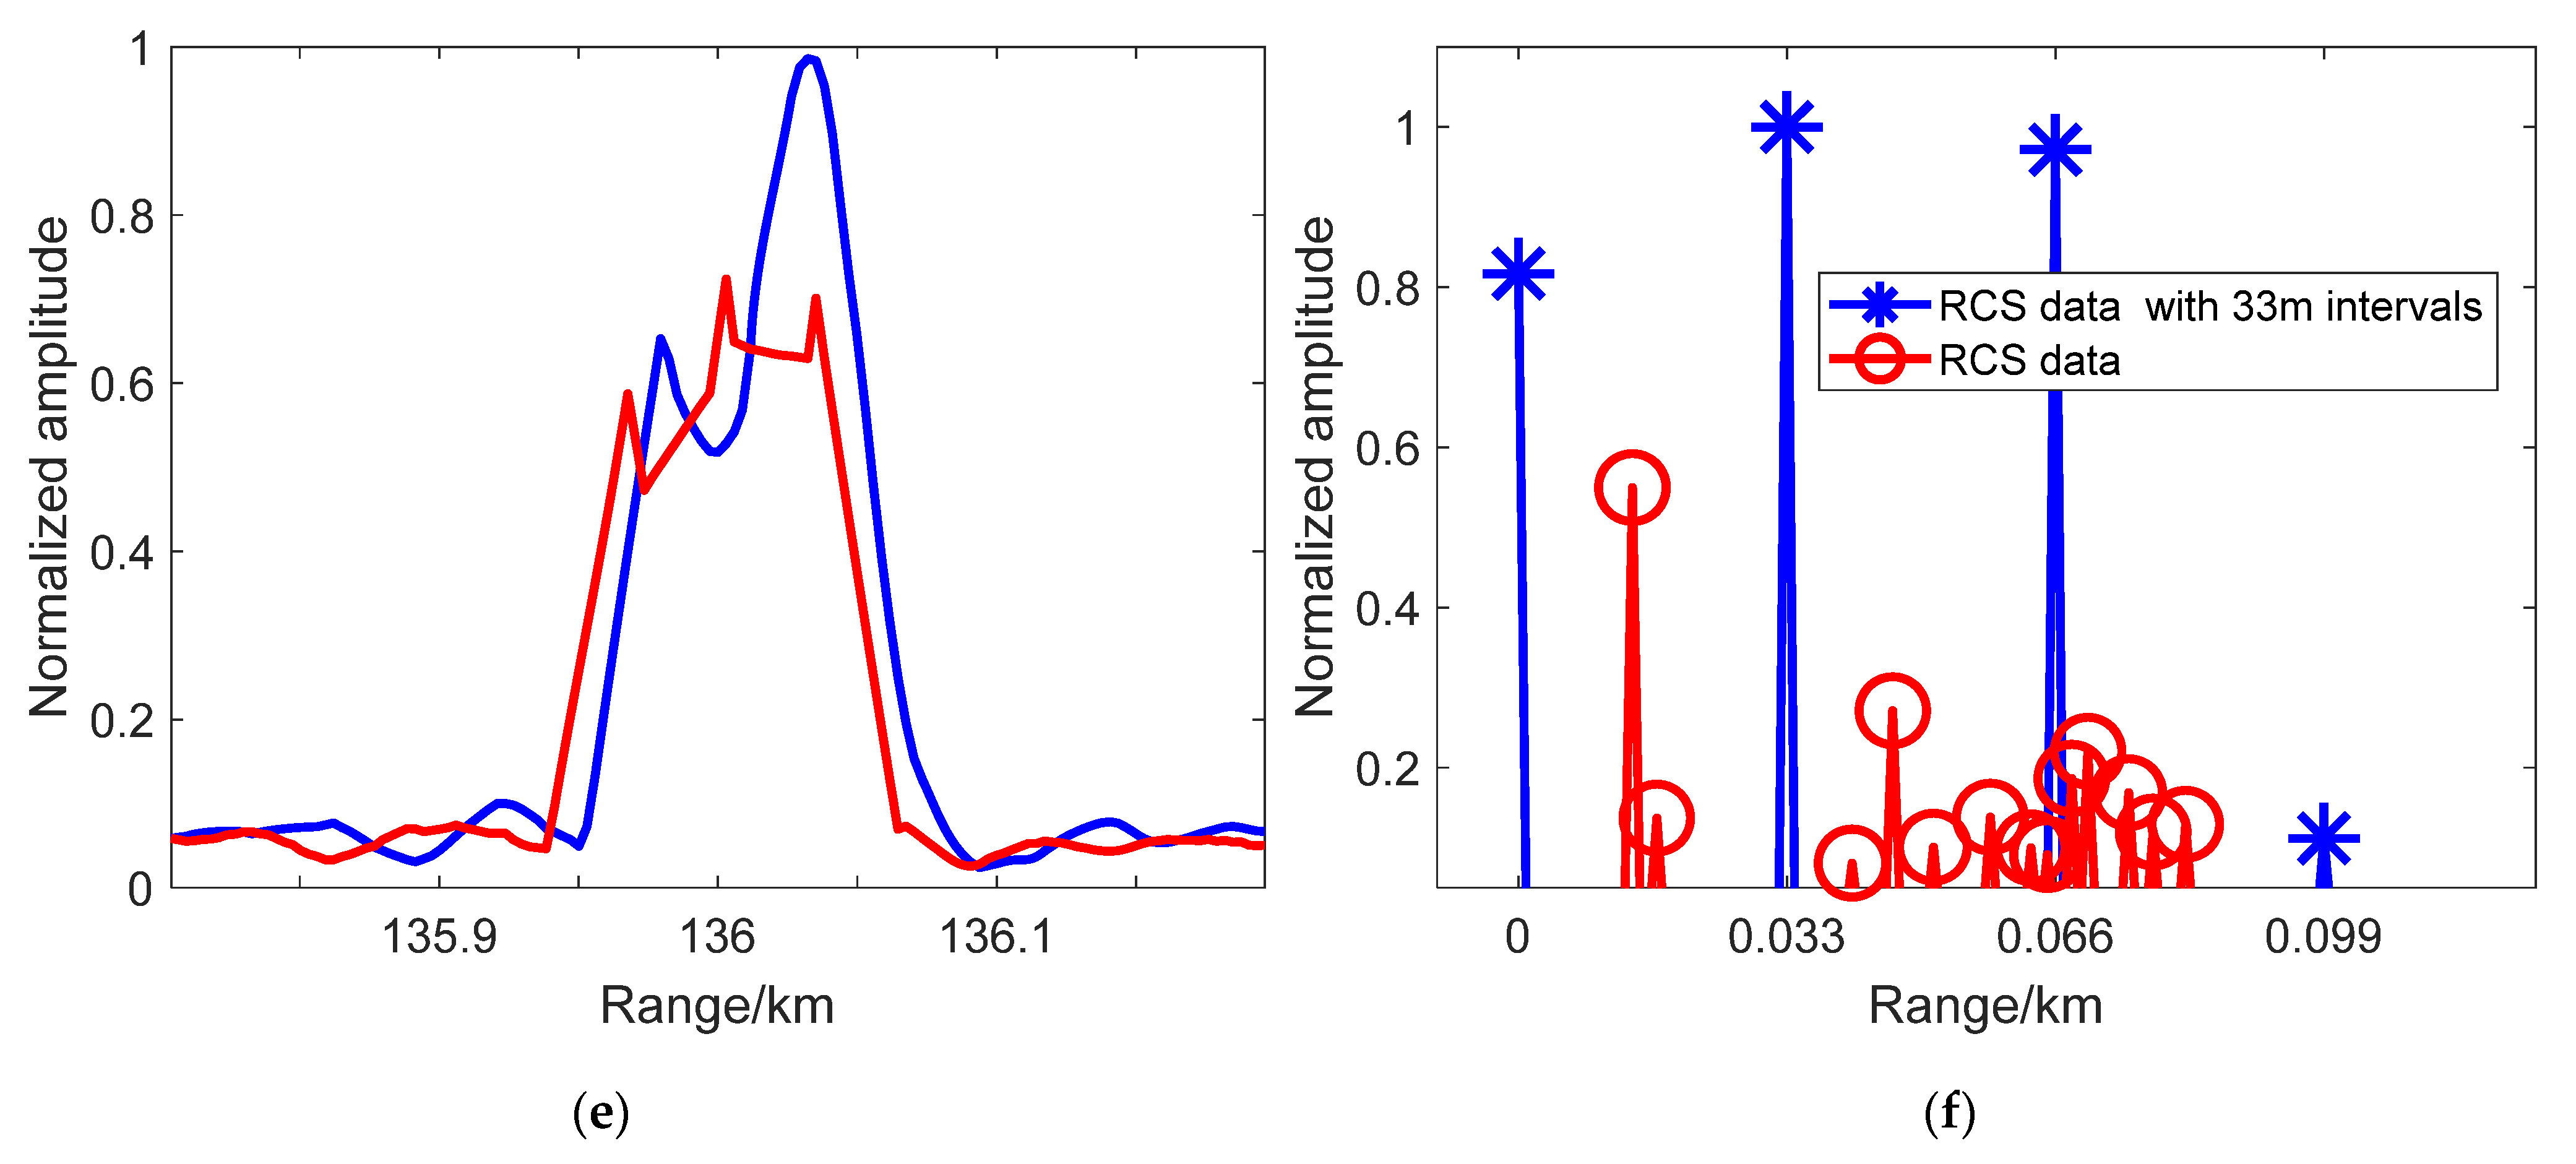
  • Second, since the BDS signal was not devised for GNSS-R detection, its range resolution is not sufficient to detect ship targets well. Further RCS distribution information of targets needs to be detected for target recognition.

3. Methods

3.1. Multiple Targets Detection Doppler Compensation

In order to remove the Doppler phase influence during multiple targets detection, we further studied echo processing. The B3I signal is set as an example to express the formula, and the B1I signal has the same form. Take Formulas (1) and (3) into (5) as
R Q B 3 I , r i , j = q = 1 Q u T P ( t q * T P ) R B 3 I , r i , j = a B 3 I , r i , j A B 3 I i C B 3 I i q = 1 Q { u ( t τ r j i q T P ) cos ( 2 π f d B 3 I , r i , j ( t τ B 1 I , r i , j q T P ) + φ B 3 I i ) }
where R Q B 3 I , r i , j is the received reflected B3I signals transmitted by satellite i and reflected by target j during Q ranging code periods. According to the ranging code C B 3 I i , we find the duty ratio of the signal to be 1 in a ranging code period. Therefore, the Doppler phase changes during a signal ranging code period cannot be ignored. The echoes model (6) is improved as
R Q B 3 I , r i , j = a B 3 I , r i , j A B 3 I i C B 3 I i q = 1 Q n = 1 N C { u T c ( t τ r i , j q T P n T c ) cos ( 2 π f d B 3 I , r i , j ( t τ B 3 I , r i , j q T P n T c ) + φ B 3 I i ) }
where N c is the number of range code elements, and T c is the range code element period. In (7), the Doppler phase of echoes changes with each ranging code element, and it influences the target range peak result level of the matched filter. The normalized autocorrelation peak level changing with Doppler frequency is shown in Figure 2, where the peak level reduces slowly first and then drops quickly to lower than 0.1 when the Doppler frequency is more than 1000 Hz. Moreover, the relevant parameters are described in the simulation section. Focusing on the Doppler phase influence, we express (7) as
R Q B 3 I , r i , j = R Q B 3 I , r i , j ( P h B 3 I , r i , j ) P Q h B 3 I , r i , j = q = 1 Q n = 1 N C u T c ( t q T P n T c ) 2 π f d B 3 I , r i , j ( t q T P n T c ) = P Q h B 3 I , r i , j ( f d B 3 I , r i , j )
where we can find that P Q h B 3 I , r i , j is the sequence with a length of Q N c and is up to f d B 3 I , r i , j . Moreover, each target reflects echo carriers with different Doppler frequencies, and we needed to reduce multiple Doppler phase influences for better detection of the target peak.
Before the Doppler phase compensation, the compensatory Doppler frequency of target echoes needed to be acquired. We propose two methods: method 1, without estimation and method 2, with estimation. In method 1, we acquired the Doppler frequency range of targets by satellite navigation code data and receiver data as
f d B 1 I , min i = min ( f d B 1 I , sat _ rec i + f d B 1 I , rec _ tar _ max i , f d B 1 I , sat _ rec i f d B 1 I , rec _ tar _ max i ) f d B 1 I , max i = max ( f d B 1 I , sat _ rec i + f d B 1 I , rec _ tar _ max i , f d B 1 I , sat _ rec i f d B 1 I , rec _ tar _ max i )
and the compensated Doppler frequencies are acquired by sampling in the range with an interval of 125 Hz as
f 1 d B 1 I , r i , j = f 1 d B 1 I , min i + 250 * ( j 1 ) f 1 d B 1 I , min i f 1 d B 1 I , r i , j f 1 d B 1 I , max i
where f 1 d B 1 I , r j i is the compensation Doppler frequency of method 1 and j′ is the compensation number. Using the estimated information of targets, the compensated Doppler frequencies are set as Doppler frequency estimation values in method 2.
f 2 d B 1 I , r i , j = f 2 d B 1 I , e i , j
where f 2 d B 1 I , r i , j is the compensation Doppler frequency of method 2. After acquiring the corresponding Doppler frequency, the compensation phase is expressed as
C Q P h B 3 I , r i , j = q = 1 Q n = 1 N C u T c ( t q T P n T c ) 2 π f d B 3 I , r i , j ( t q T P n T c ) = C Q P h B 3 I , r i , j ( f d B 3 I , r i , j )
To solve the multiple Doppler phase influences and restore the weakened target peak, we propose the multiple target Doppler compensation (MTDC) method, which compensates for the echoes with multiple Doppler phase sequences at the corresponding range code period position of targets and fetches the maximum value of the filter outputs as the compensation result. Next, (13) expresses the compensated echo.
C Q R B 3 I , r i , j , j = R Q B 3 I , r i , j ( P Q h B 3 I , r i , j + C Q P h B 3 I , r i , j )
where C Q R B 3 I , r i , j , j denotes the echoes of satellite i and target j with compensation j’. The echoes from satellite i with multiple-target Doppler compensation can be expressed as
C Q R B 3 I i , j = C Q R B 3 I , d i + j = 1 N C Q R B 3 I , r i , j , j
Next, we matched echoes with the corresponding satellite signal as
C Q M B 1 I i , j = C Q R B 3 I i , j s B 3 I i ( t )
Finally, (16) shows the selected maximum of each compensation as the result.
C Q M B 1 I i c = max ( C Q M B 1 I i , 1 , , C Q M B 1 I i , j , , C Q M B 1 I i , N )
The formula mentioned above is the one-dimensional range–Doppler compensation of multiple target reflections. In the next part, we show the Doppler and the delay two-dimensional Doppler compensation methods for Doppler delay image target peak compensation. To better express the Doppler phase changes among code element periods ranging code periods in a discrete time system, we express the Doppler phase in the form of a matrix as (17), where each row expresses a period of T P , and its range is from 0 to Q T P .
p h B 1 I , r j i = f d B 1 I , r j i [ 0 + 0 , , 0 + n T c , , 0 + ( N c 1 ) T c q T P + 0 , , q T P + n T c , , q T P + ( N c 1 ) T c ( Q 1 ) T P + 0 , , ( Q 1 ) T P + n T c , , ( Q 1 ) T P + ( N c 1 ) T c ]
where we can find that the number column is incremented by T c in each row and is incremented by T P in each column. Therefore, we can take the FFT in the columns of the matrix to first acquire the Doppler information of targets. Next, we compensate the matrix in each T P row for the duration based on the compensation phase. Finally, we can obtain the compensated DDM results by the proposed MTDC method.

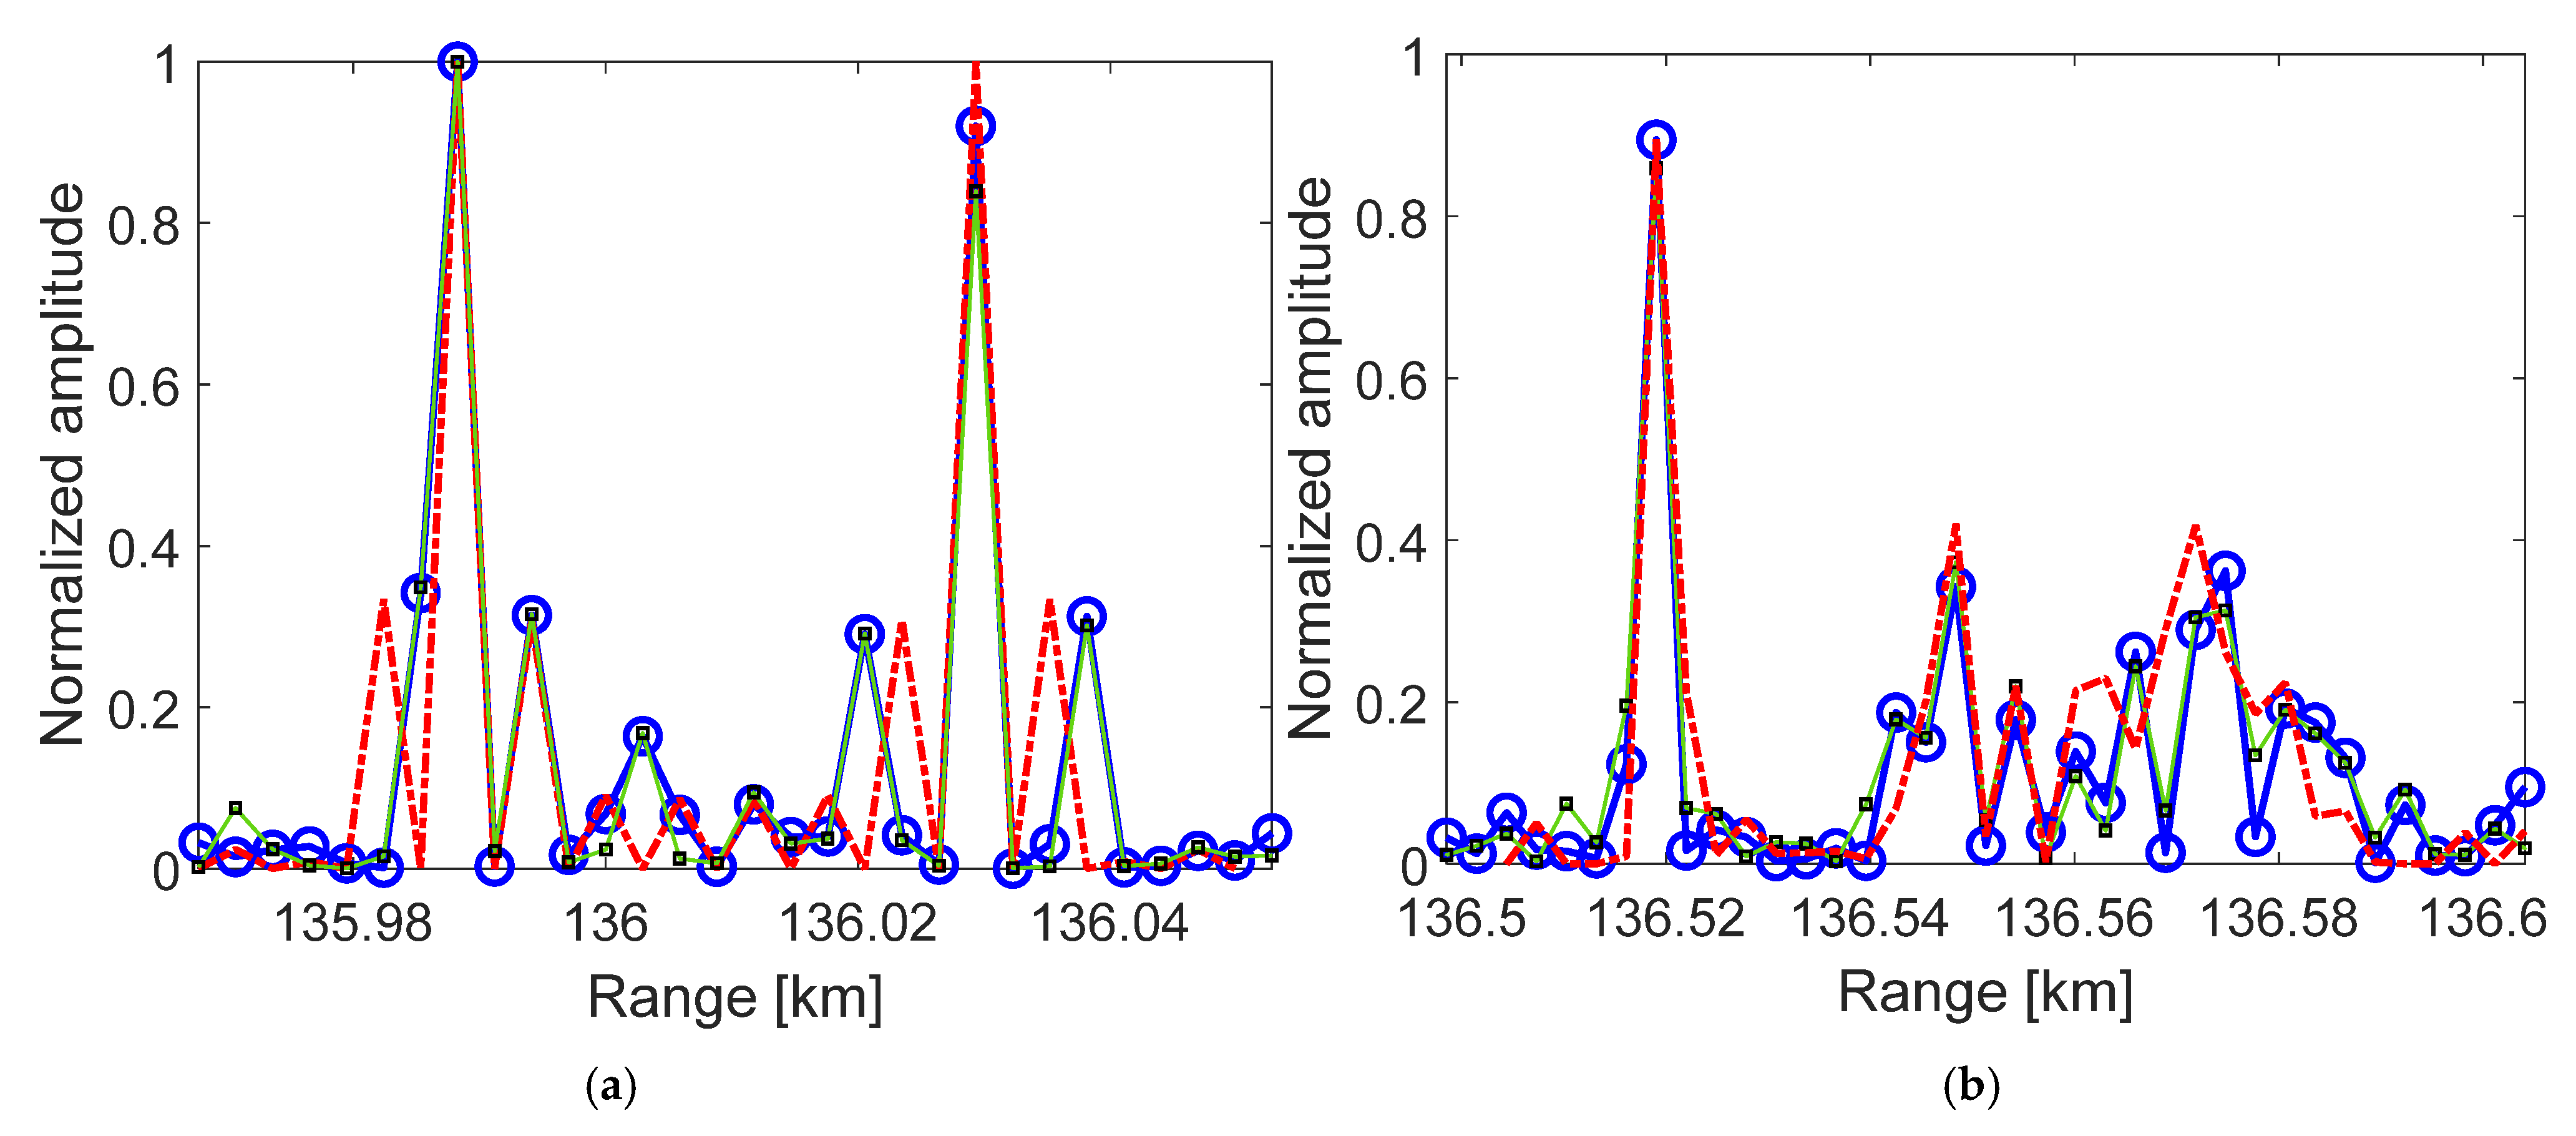
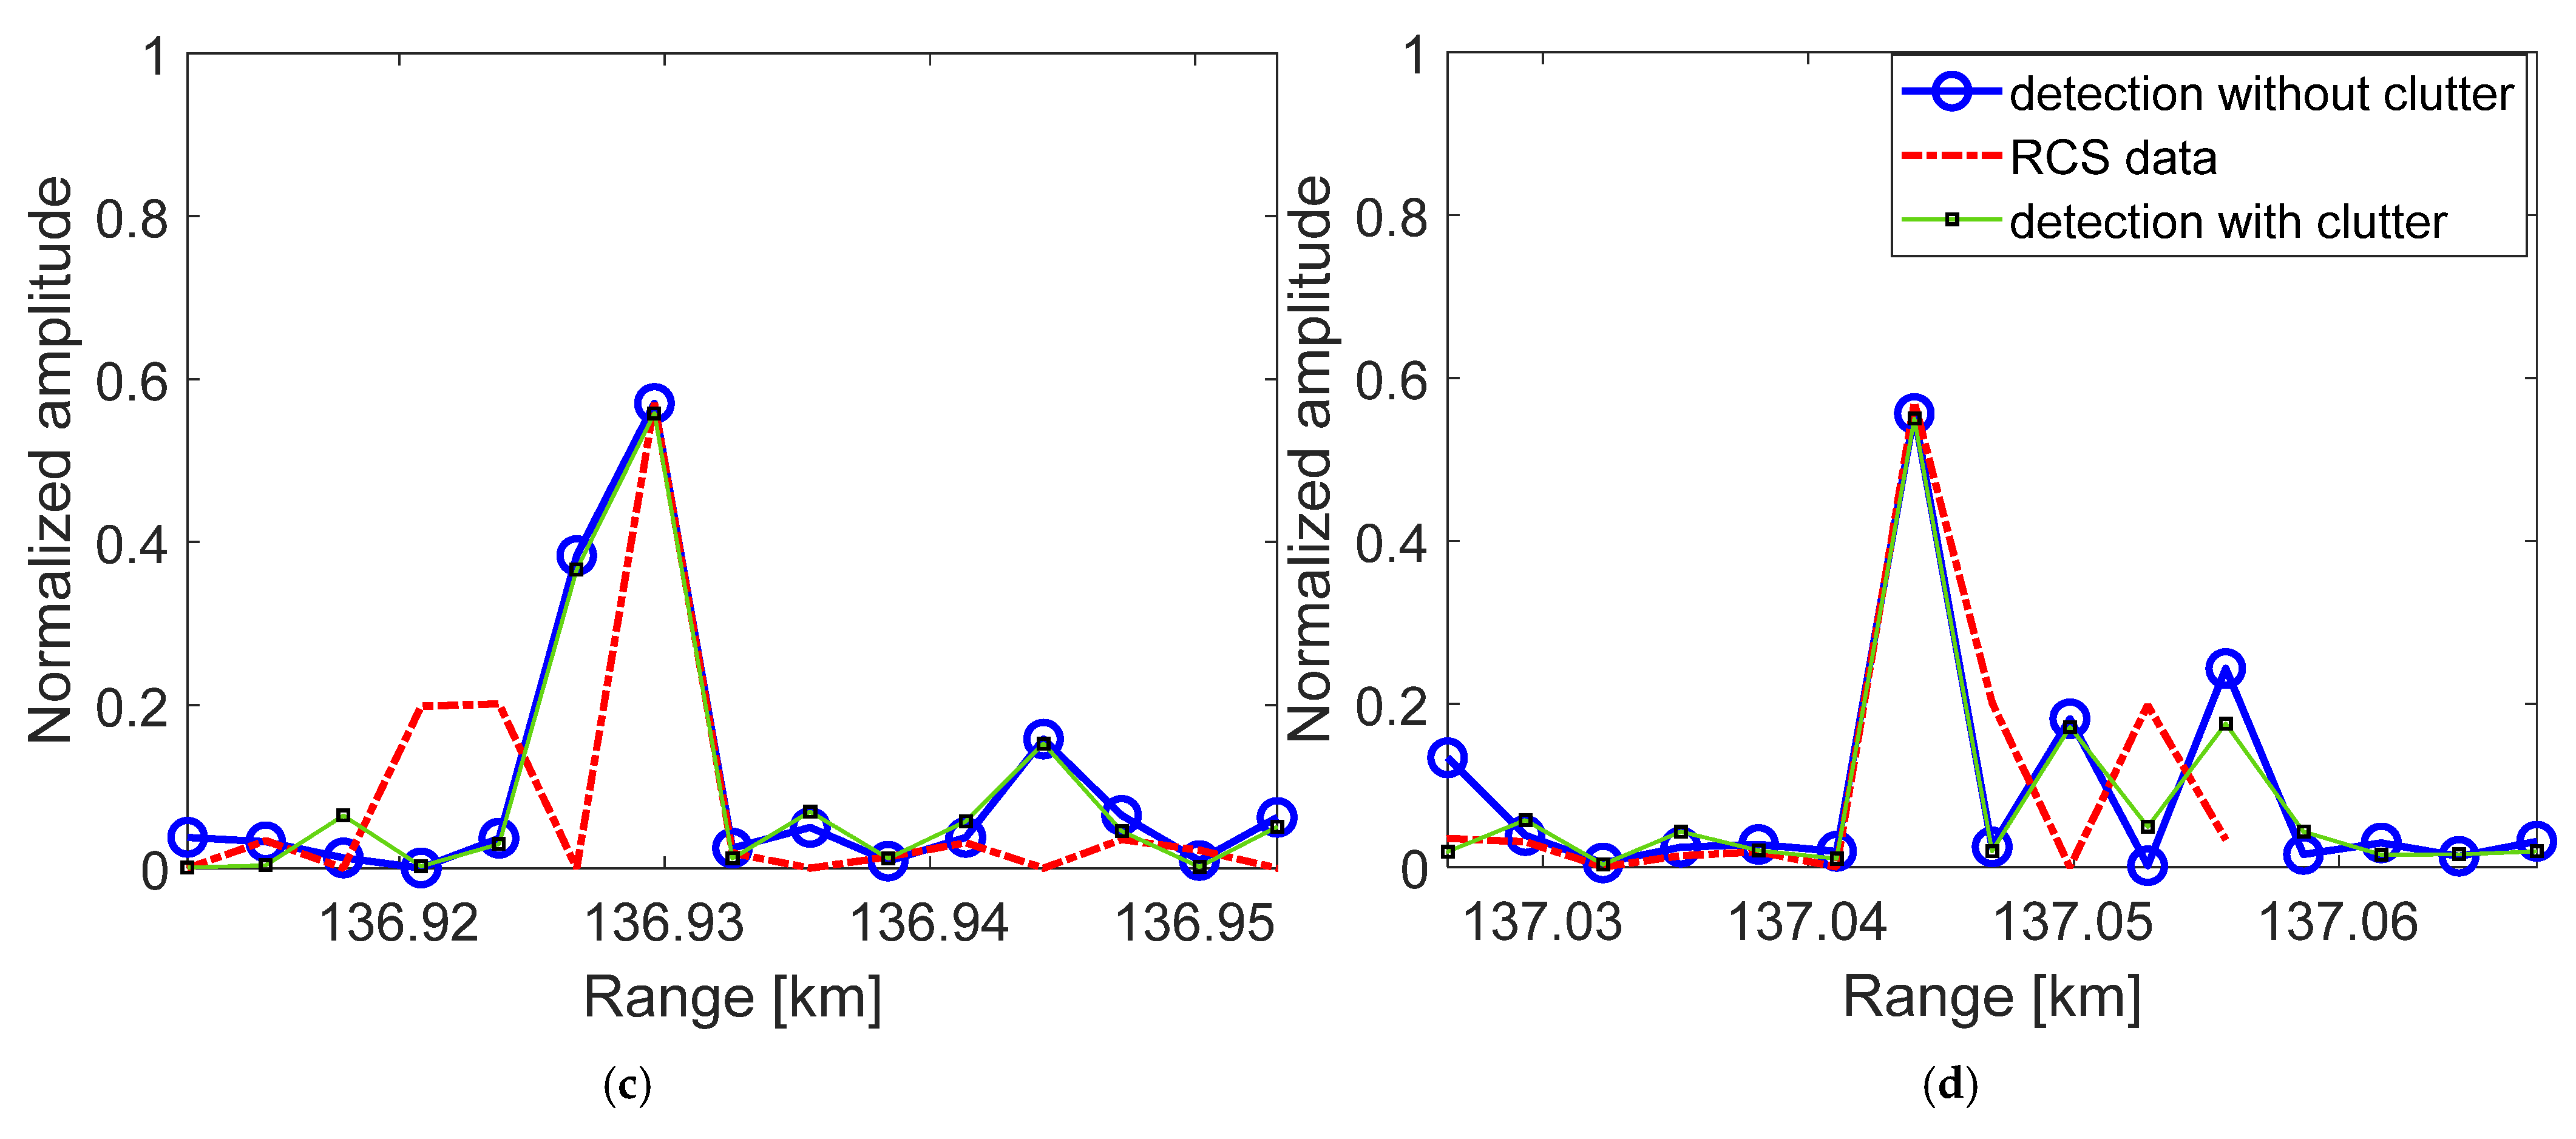
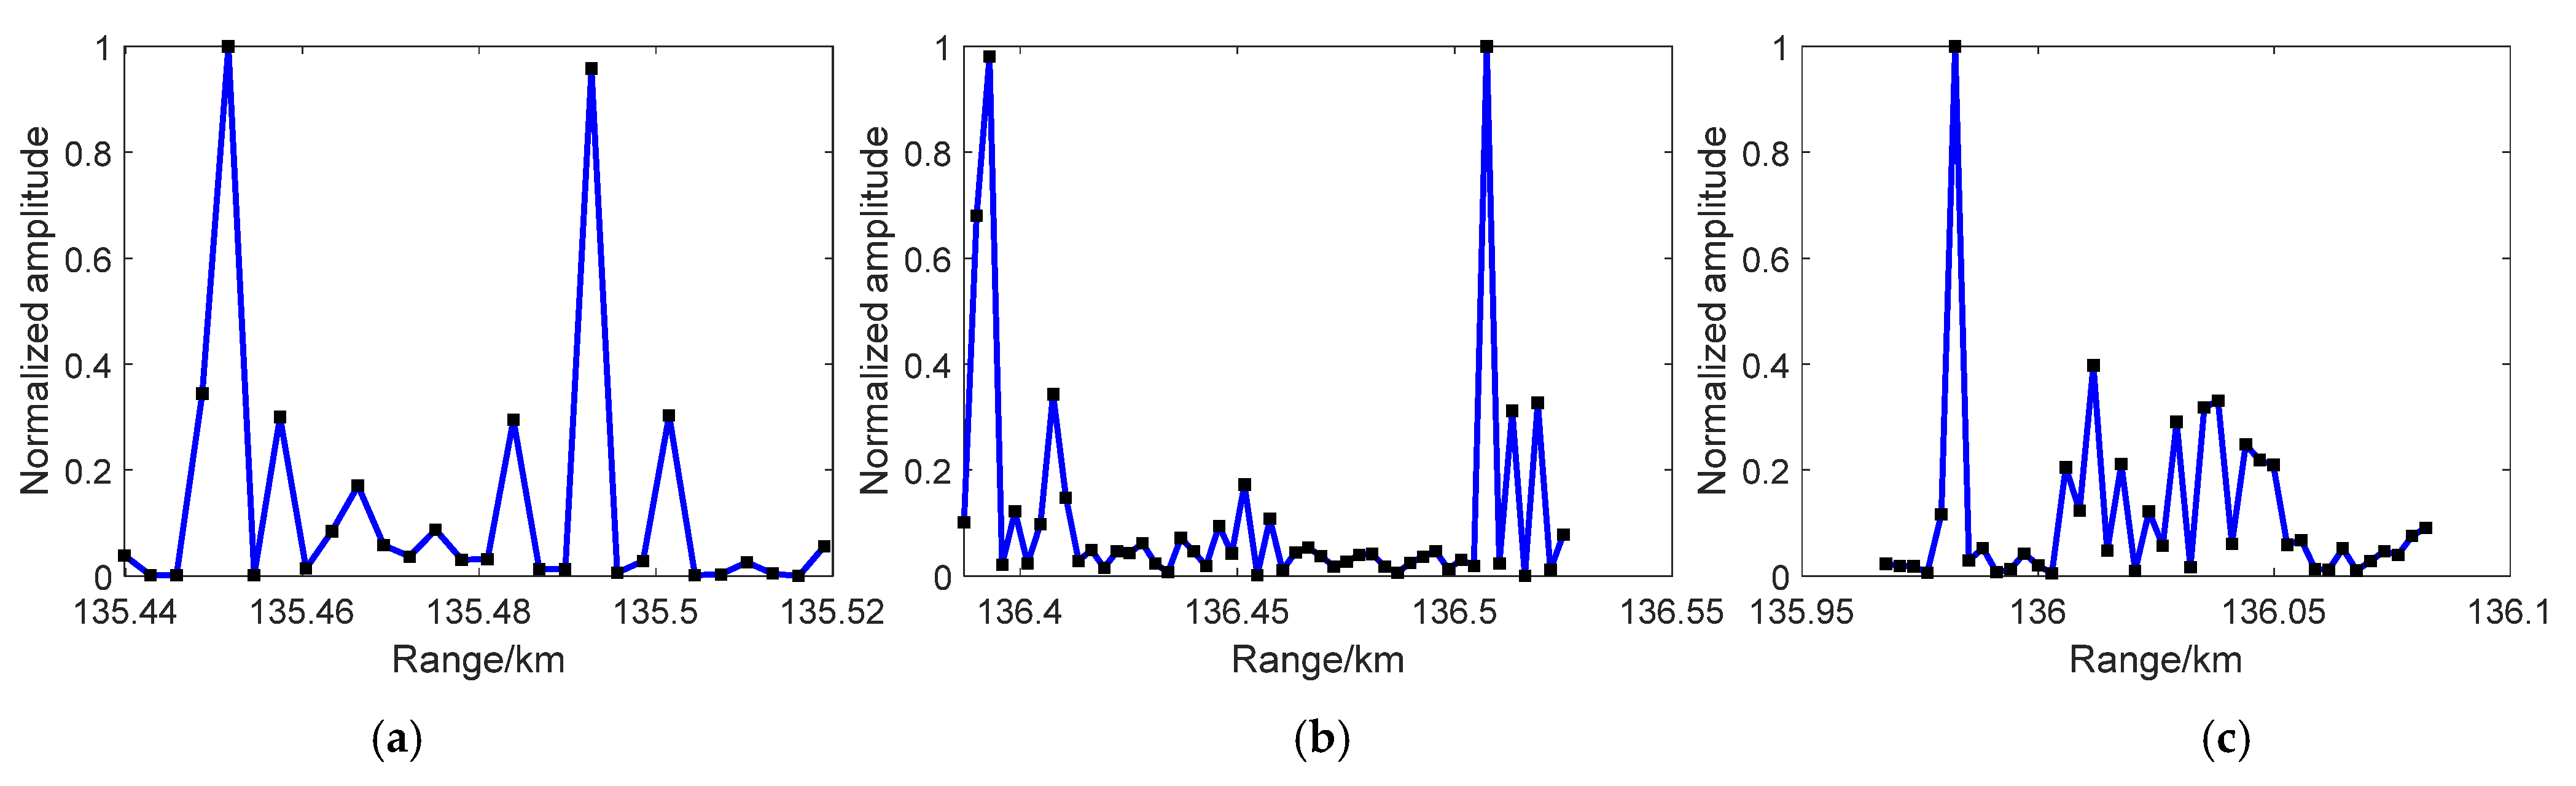
3.2. Resolution Study and Peaks Identifying Methods

In this part, we study the resolution performance of the BDS signal. As shown in Table 1 in the simulation section, the B3I signal is transmitted with a bandwidth of 20.46 MHz. Figure 3 shows the autocorrelation curves of the B3I signal and two chirp signals with bandwidths of 10.23 MHz and 20.46 MHz.
In Figure 3, we find that the main lobe of the B3I signal is wider than that of the chirp signal at 20.46 MHz. According to Formula (18), where C is the electromagnetic wave velocity and B is the signal bandwidth, the range resolution of the two chirp signals can be calculated as 29.32 m. The resolution of the B3I signal is approximately 30 m, as shown in Figure 3.
Δ r = C / B
To further study the resolution of the B3I signal, we simulated two-point target detection with interval of 29 m and 33 m by using the B3I signal, setting the chirp signal at a 10.23 MHz bandwidth as a comparison. Figure 4a shows the detection peaks of the GNSS B3I signal and chirp signal reflected by two-point targets with a distance of 29 m. We found that the solid line peaks overlap completely, which means that the B3I signal cannot distinguish the two-point targets. The chirp signal, with a bandwidth of 10.23 MHz, can clearly detect two-point target peaks. Next, in Figure 4b, where the distance between two-point targets is 33 m, two signals show two target peaks, and the sidelobe of the B3I signal in the center is higher, while its sidelobes on both sides are lower than those of the chirp signal.
Next, we studied the sidelobe between the two target peaks of the B3I signal detection curves. Figure 5 shows the normalized sidelobe peak curves between two target peaks of the GNSS B3I signal as the distance between two targets. We found that the sidelobe peaks gradually decreased until the distance was more than 30 m, and in the range of 30~60 m, they had a linear decline as the distance increased. The results show that the GNSS B3I signal can realize a clear target peak resolution with an interval of targets near 30 m. After further simulation, we found that 33 m is the suitable interval for B3I signals with clear and smaller peak resolutions.
In BDS-R detection, the echo intervals are smaller than the resolution of the B3I signal, and in the case of bistatic detection, intervals of targets vary with the bistatic angle. To acquire a clear and stable resolution, we propose sampling the echoes with an interval of 33 m, and the RCS data for comparative verification can also be processed with an interval of 33 m.

3.3. Resolution Study and Range Inversion Methods

In this section, we study the peak inversion methods. For the limited resolution problem, we propose a correlation peak inversion method to determine the specific range information of targets based on one-dimensional detection data and the corresponding signal autocorrelation function. Moreover, the inversion result accuracy is related to the sampling frequency of the echoes. We propose two methods to find the approximate ranges of target positions in the time domain. In method 1, without target estimation information, we found the range as follows: (1) Acquiring matched filter results, we filtered it with a normalized amplitude > a 0 . (2) Next, we divided the results into small segments, between each pair of segments. There is a low amplitude period with a length of b 0 , where a 0 and b 0 can be utilized to adjust the target range for better adaptability of detecting targets. In method 2, we can obtain the rough target position in the echoes by rough detection. The inversion ranges can be expressed as Range = [ r a n g e 1 , r a n g e 2 , , r a n g e m , , r a n g e M ] , and the corresponding sampling points can be expressed as N = [ n 1 , n 2 , , n m , , n M ] . The inversion in r a n g e m can be expressed as
q = 1 n m ( s ( n n m + q ) s ( n + q ) ) A m p ( q ) = M ( r a n g e m )
where Amp is the modulating amplitude of the received signals. When clutter, noise, and the correlation sidelobe have little influence, the specific radar cross-section (RCS) distribution can be expressed as
R C S ( r a n g e m ) = A m p
According to the literature [28], clutter and noise influence can be suppressed effectively during long-term accumulation. Because the RCS of the simulation ship is large, we accumulated 10 s to effectively suppress the clutter and noise in simulation 2 and corrected the distance and velocity migration. Therefore, we can utilize the inversion method to acquire the specific range information of targets.

3.4. Target Information Inversion Method Based on GNSS-R Detection

In signal processing, the detection results of different satellites can be separated by signal range codes. After acquiring multiple satellite detection results for the targets, the different target peaks in the range dimension can be distinguished when the targets keep a sufficiently large distance. Additionally, we can also distinguish them by the difference in beam direction. To acquire the precise coordinate information of targets in bistatic detection, we can determine the target coordinates by detecting the target range and velocity information, satellite information, and receiver information.
N i , j T P C + r i , j = ( x s i x t j ) 2 + ( y s i y t j ) 2 + ( z r i z t j ) 2 + ( x r x t j ) 2 + ( y r y t j ) 2 + ( z r z t j ) 2
( v r θ r i , 1 + v s i θ r i , 2 ) / λ + ( v t i , j θ i , j , 1 + v s i θ i , j , 2 ) / λ = M i , j P R F + f d i , j
The target coordinate information can be acquired by the satellite coordinate information from the signal data and the range detection results, as shown in Formula (21). We can also obtain the target velocities through the Doppler detection results as (22), where x s i , y s i , z s i are the coordinates of satellite i, and x t j , y t j , z t j are the coordinates of target j. N i , j , and r i , j are the cycle number and distance during a cycle of detected results of target j and satellite i,, respectively. In (22), v t i , j θ i , j , 1 expresses the component of the velocity of target i in the direction of the bistatic angular bisector between satellite i and the receiver, and v s i θ i , j , 2 is the component of the velocity of satellite i in the direction of target j. v r θ r i , 1 and v s i θ r i , 2 are the corresponding velocity components between target i and the receiver. M i , j and f d i , j are the Doppler cycle number and Doppler value of the detected results of target j and satellite i, respectively.

3.5. Experimental Technical Scheme

Figure 6 shows the experimental technical scheme of multiple targets and multiple-GNSS-R-signal detection. The technical route of the detection can be divided into three parts: (1) The BDS MEO satellite information can be obtained from the database [29] and the signal can simulate the parameter, as observed in the literature [27,28]. We found the ship model using the physical optics scattering method and simulated the sea clutter with the weibull distribution model; (2) After establishing the detection model, the echo was simulated and preprocessed. Where the echo was sampled, the distance migration and velocity migration were corrected, and the direct part of echo was suppressed; (3) For the third part, we simulated the DDM, 33-meter one-dimensional range image, and inverse image with multiple-target Doppler compensation, 33-meter peak identifying methods, and inverse methods. The proposed method has been bolded in the picture.

4. Simulation Results and Discussion

In this section, two sets of simulation results are given to evaluate the effectiveness of the proposed MTDC method, the target peaks resolution method and the target peaks range inversion method based on the B3I signal of four BDS satellites and the MIMO system. The system parameters and target parameters are listed in Table 1 and Table 2. The geometry schematic diagram of the simulation is plotted in Figure 6, where the receiver was set as airborne-based to better reflect the Doppler frequency difference of each target during GNSS-R detection. During the 10 s pulse accumulation time in simulation 2, we set the receiver plane to move horizontally and at a constant speed according to the given direction and speed, and the ship does not change its track. The influence of the Doppler and distance values instigated by the aircraft movement can be compensated for by the known aircraft movement parameters combined with the geometric model. Additionally, we set the linear delay compensation to be once per pulse period to remove the delay effect caused by ship motion.

4.1. Simulation 1

In simulation 1, we detected three sets of point targets based on the B3I signals of four BDS satellites without considering clutter and noise. The point target information is expressed in Table 2, where the points were set with an interval of 30 m, and its geometric distribution was plotted in Figure 7. In particular, to better study the detection property, the RCS ratios of target 1, target 2, and target 3 were set to 2:5:15.
To study the target peak resolution effectiveness of the sampling method at 33 m, Figure 8 and Figure 9 show the RCS data distribution and one-dimensional range detection results with sampling at 33 m. In Figure 8, the circle line expresses the original RCS distribution of point target 3 under each satellite, and the star line represents the data with a sample at 33 m. In Figure 9, the curves are the detection peaks of point target 3 under each satellite, and its direction and length vary with the detection angle. Taking Figure 8 as a comparison, we found that the small peaks in the detection results of Figure 9 are in good agreement with the sampling data at 33 m in terms of amplitude and range point. The results can be utilized to estimate the RCS distribution of targets and verify target recognition.
To research the Doppler and range information of detection by four satellites, the simulation shows the DDM results of three sets of point targets of the B3I signal from four satellites separately in Figure 10. Because the resolution of B3I is near 30 m, each set of point targets was detected as a few light points in the DDM, and according to the number of points set in each target, we identified that the highlights are target 3, target 2, and target 1, in order from the strongest to the weakest. Among the four detection results, the Doppler frequency of each target ranged from −1000 to 1900 Hz for the high speed and different radiation angle of the satellites, but the difference in the Doppler value among targets was stable at approximately 400 Hz on account of the target points and receiver location. The motion of the receiver and the target determine the Doppler difference among targets. Moreover, the range and velocity information of the detection of four satellites can determine the target coordinate information using the target information inversion method mentioned previously.

4.2. Simulation 2

In simulation 2, we designed a simulation to detect three sets of ship targets based on the B3I signals of satellite 3 considering Gaussian noise and sea clutter based on the Weibull model. The ship target information and geometric diagram are also expressed in Table 2 and Figure 7.
In Figure 11 and Figure 12, we show the Doppler compensation effectiveness comparison of the two compensation methods. In Figure 11, we simulated the one-dimensional range detection compensated results of three ship targets without target estimation information, and the results are compensated for with single Doppler channels and the MTDC method. Figure 11a–c show the incomplete peak amplitudes of three ship targets, and Figure 11d shows the target peaks without Doppler phase influence, which shows the effectiveness of MTDC in estimating no-target information situations. Figure 12 shows the compensation results with acquired target estimation information. Figure 12a–c show that each target peak can return to the normal level under the corresponding Doppler compensation and that other target peaks lose part of their amplitudes. Figure 12d shows the MTDC method compensation results expressing all target peaks, obtaining their maximum level. The results of Figure 11 and Figure 12 verify that the proposed MTDC method can remove the Doppler phase influence of multiple target detection.
Based on the same sampling at 33 m, we plotted the one-dimensional range detection results of three ship targets by satellite 3 in Figure 13, where Figure 13a,c,e show the sampling detection results at 3 m and the sampling detection results at 33 m for ships 1, 2, and 3, respectively. Compared with the RCS data of Figure 13b,d,f, we found that the sampling detection at 3 m can express the general outline of the ship’s target RCS without accurate amplitude and range point information. The small peaks in the sampling results at 33 m, which are in good agreement with the sampling data obtained at 33 m, express segmented scattering strong points with accurate amplitude and computable range points. The results can be more accurate in the service of target recognition.
To further study the resolution improvement method, we simulated the detection results of satellite 3 with range inverse methods to acquire the more delicate RCS distribution of targets based on the sampling frequency fs = 10*B. Figure 14 shows the range inverse results of method 1, in which we screened the probable target information by amplitude and segment; the results are given by a certain length in the low-amplitude region. The dotted line in Figure 14 expresses the RCS data, and the circle line, which is the inverse result, which does not consider clutter, is in good agreement with the data in terms of the amplitude and range point, especially at strong scattering points. Moreover, we utilized the small square line to express the inverse results with clutter and noise backgrounds with 10 s pulse accumulation. It shows that target peaks can be recognized from clutter and noise backgrounds with the proposed inverse method.
In the other situation, since we have estimated the target information, we can acquire rough target distance ranges and reverse them using the range inverse method 2. Figure 15 shows the range inverse results based on target estimation information, where ship 2 can notably be expressed more completely and accurately than with method 1.
Starting from the two dimensions of Doppler and range, Figure 16 plots the DDM results of three ship targets under the detection of the B3I signal of satellite 3, where pictures (a) and (b) express whether the results consider clutter and noise. In Figure 16a, combined with target peak identification and target range inverse results, we found that the highlight groups were target 1, target 3, and target 2 from left to right. The ship targets can be detected as several highlights with a range resolution of near 30 m and a Doppler frequency resolution of approximately 8 Hz. Due to the high speed of the receiver and different received angles, the targets’ Doppler frequency varies in the range of 400 Hz, and there are 8 Hz offsets in the scattered point in a target. After introducing clutter and noise backgrounds, Figure 16b shows the detection results with clutter distribution, as shown in Figure 7, with 10 s pulse accumulation. We found a clutter highlight group near the 0 Hz Doppler channel with a normalized amplitude of 0.6. In the range dimension, a few clutter peaks overlapped target 1, which protected the detection of target 1 from clutter influence. Some cluttered peaks overlapped target 2 and target 3, but the cluttered peaks are small and dispersed, which reduces the influence of the detection of the two targets. Moreover, the cluttered strong scatter point does not overlap in the simulation, supporting better detection results for the signal process. This situation has a large probability of overlapping since the scattering intensity of sea clutter is random.
Figure 12, Figure 13, Figure 14, Figure 15 and Figure 16 show the one-dimensional range image Doppler compensation results, one-dimensional range image target peak identification results, range inverse results, and DDM results of three ship targets in simulation 2, which verify that multiple fetched ship targets can be detected with better strength using the MDTC method with noise and sea clutter backgrounds in a 10 s accumulation, and the ship RCS distribution structure can be further acquired by the proposed target peak identification method and range inversion method.

5. Conclusions

This paper studies multiple-BDS signal reflection detection for multiple moving targets in the sea. It analyzes the influence of multiple-target Doppler phases and proposes the MDTC method to suppress influence under target estimation and not under target estimation. The results show the proposed method can effectively restore target peaks under the influence of four kinds of Doppler frequencies in GNSS-R detection, where the Doppler frequency variation range is −1000–1900 Hz. For further study of target peak detection, simulations of point target and ship target detection were performed to verify the effectiveness of the proposed peak identification method and range inversion methods. The peak identification results of four satellites and three ship targets showed corresponding peaks which matched the RCS data of detected targets. The range inversion results show a better resolution of target peak detection results, which can obtain the specific RCS distribution of ships in the hundred-meter class. At last, noise and clutter backgrounds were added to simulation 2 under 10 s pulse accumulation, which shows some influence on the sidelobe of target 2 and target 3, and the three target main peaks can still be detected relatively clearly. In the future, we will study the detection simulation of small-scale targets in the sea and detection with various satellite detection angles.

Author Contributions

Conceptualization, methodology, formal analysis, writing—original draft preparation, X.L.; data curation, L.W. and W.J.; writing—review and editing, X.L., J.L. and M.Z.; supervision, M.Z. All authors have read and agreed to the published version of the manuscript.

Funding

This work was supported in part by the National Natural Science Foundation of China under Grant No. 62171351, No. 6217011640, No. 62001343, No. 41901267, and No. 41701386 and the China Postdoctoral Science Foundation under Grant No. 2021T140532.

Data Availability Statement

The satellite coordinates based on the geodetic coordinate system were obtained from http://www.csno-tarc.cn/datacenter/ephemeris (accessed on 1 January 2021). The signal PRN parameters were obtained from literature [27,28].

Conflicts of Interest

The authors declare no conflict of interest.

References

  1. Ansari, K.; Bae, T.S.; Seok, H.W.; Kim, M.S. Multiconstellation global navigation satellite systems signal analysis over the Asia-Pacific region. Int. J. Satell. Commun. Netw. 2020, 39, 280–293. [Google Scholar] [CrossRef]
  2. Li, X.; Zhang, X.; Ren, X.; Fritsche, M.; Wickert, J.; Schuh, H. Precise positioning with current multi-constellation global navigation satellite systems: GPS, GLONASS, Galileo and BeiDou. Sci. Rep. 2015, 5, 8328. [Google Scholar] [CrossRef] [PubMed]
  3. Southwell, B.J.; Dempster, A.G. Incoherent Range Walk Compensation for Spaceborne GNSS-R Imaging. IEEE Trans. Geosci. Remote Sens. 2019, 57, 2535–2542. [Google Scholar] [CrossRef]
  4. Huang, F.X.; Garrison, J.L.; Leidner, S.M.; Annane, B.; Hoffman, R.N.; Grieco, G.; Stoffelen, A. A Forward Model for Data Assimilation of GNSS Ocean Reflectometry Delay-Doppler Maps. IEEE Trans. Geosci. Remote Sens. 2021, 59, 2643–2656. [Google Scholar] [CrossRef]
  5. Giangregorio, G.; Bisceglie, M.D.; Addabbo, P. Stochastic Modeling and Simulation of Delay–Doppler Maps in GNSS-R Over the Ocean. IEEE Trans. Geosci. Remote Sens. 2016, 54, 2056–2069. [Google Scholar] [CrossRef]
  6. Martin, F.; Camps, A.; Park, H.; DaAddio, S.; Martín-Neira, M.; Pascual, D. Cross-correlation waveform analysis for conventional and interferometric GNSS-R approaches. IEEE J. Sel. Top. Appl. Earth Observ. Remote Sens. 2014, 7, 1560–1572. [Google Scholar] [CrossRef]
  7. Martin, F.; D′Addio, S.; Camps, A.; Martín-Neira, M. Modeling and analysis of GNSS-R waveforms sample-to-sample correlation. IEEE J. Sel. Top. Appl. Earth Observ. Remote Sens. 2014, 7, 1545–1559. [Google Scholar] [CrossRef]
  8. Xiao, X.; Shen, F.; Lu, X.C.; Shen, P.L.; Ge, Y.L. Performance of BDS-2/3, GPS, and Galileo Time Transfer with Real-Time Single-Frequency Precise Point Positioning. Remote Sens. 2020, 13, 4192. [Google Scholar] [CrossRef]
  9. Zhang, P.F.; Tui, R.; Zhang, R.; Liu, N.; Gao, Y. Time and frequency transfer using BDS-2 and BDS-3 carrier-phase observations. IET Radar Sonar Navig. 2019, 13, 1249–1255. [Google Scholar] [CrossRef]
  10. Feng, Z.; Li, X.-H.; Zhang, H.-J.; Huang, L.-X.; Xu, L.-X. Timing performance evaluation of BDS IGSO-6 and GEO-7 satellite Network. In Proceedings of the Joint Conference of the European Frequency and Time Forum and IEEE International Frequency Control Symposium (EFTF/IFCS), Besancon, France, 9–13 July 2017; pp. 817–820. [Google Scholar]
  11. Tu, R.; Zhang, R.; Liu, Z.K. Real-time detection of BDS orbit manoeuvres based on the combination of GPS and BDS observations. IET Radar Sonar Navig. 2020, 14, 1603–1609. [Google Scholar] [CrossRef]
  12. Pei, T.D.; Pan, W.; Liu, Y. Research on BDS/GPS dual-mode single point positioning. In Proceedings of the Chinese Automation Congress (CAC), Jinan, China, 20–22 October 2017; pp. 1163–1168. [Google Scholar]
  13. Li, Z.Y.; Huang, C.; Wu, J.; Yang, H.; Yang, J. Over view of maritime target detection techniques using GNSS-Based passive radar (in Chinese). Radar Sci. Technol. 2020, 18, 404–413. [Google Scholar]
  14. Ma, H.; Antoniou, M.; Pastina, D.; Santi, F.; Pieralice, F.; Bucciarelli, M.; Cherniakov, M. Maritime Moving Target Indication Using Passive GNSS-Based Bistatic Radar. IEEE Trans. Aerosp. Electron. Syst. 2018, 54, 115–128. [Google Scholar] [CrossRef]
  15. Beltramonte, T.; Braca, P.; Bisceglie, M.D.; Di Simone, A.; Galdi, C.; Iodice, A.; Millefiori, L.M.; Riccio, D.; Willett, P.K. Simulation-Based Feasibility Analysis of Ship Detection Using GNSS-R Delay-Doppler Maps. IEEE J. Sel. Top. Appl. Earth Observ. Remote Sens. 2020, 13, 1385–1399. [Google Scholar] [CrossRef]
  16. Sun, X.Y.; Xu, L.Z.; Ji, Y.F. An Extremum Approximation ARAIM Algorithm Based on GPS and BDS. IEEE Access 2020, 8, 30027–30036. [Google Scholar] [CrossRef]
  17. Qin, H.; Liu, P.; Cong, L.; Ji, W. Triple-Frequency Combining Observation Models and Performance in Precise Point Positioning Using Real BDS Data. IEEE Access 2019, 7, 69826–69836. [Google Scholar] [CrossRef]
  18. Liu, G.J.; Guo, J. Real-time determination of a bds satellite’s velocity using the broadcast ephemeris. In Proceedings of the Fourth International Conference on Instrumentation and Measurement, Computer, Communication and Control, Harbin, China, 18–20 September 2014; pp. 478–483. [Google Scholar]
  19. Zhang, B.Q. Research on GPS/BDS single point velocity measurement considering direction constraints. In Proceedings of the IEEE 8th Data Driven Control and Learning System Conference, Dali, China, 24–27 May 2019; pp. 982–986. [Google Scholar]
  20. Ding, W.D.; Wang, J.L. Precise velocity estimation with s stand-alone GPS receiver. J. Navig. 2011, 64, 311–325. [Google Scholar] [CrossRef] [Green Version]
  21. Zhou, X.K.; Wang, J.C.; Zeng, H.C.; Pei, Z.C. Experimental results for GNSS-R based moving target indication. In Proceedings of the IEEE International Geoscience and Remote Sensing Symposium (IGARSS), Waikoloa, HI, USA, 26 September–2 October 2020; pp. 2819–2822. [Google Scholar]
  22. Park, H.; Camps, A.; Valencia, E.; Carreno-Luengo, H.; Martin, F.; Alonso, A.; Pascual, D. Analysis of gnss-r delay and doppler tracking errors. IEEE J. Sel. Top. Appl. Earth Obs. Remote Sens. 2014, 7, 1481–1492. [Google Scholar] [CrossRef]
  23. Ji, W.X.; Xiu, C.D.; Li, W.Q.; Wang, L.J. Ocean surface target detection and positioning using the spaceborne GNSS-R delay-Doppler maps. In Proceedings of the IEEE International Geoscience and Remote Sensing Symposium (IGARSS), Quebec City, QC, Canada, 13–18 July 2014; pp. 3806–3809. [Google Scholar]
  24. Cheong, J.W.; Southwell, B.J.; Dempster, A.G. Blind sea clutter suppression for spaceborne GNSS-R target detection. IEEE J. Sel. Top. Appl. Earth Obs. Remote Sens. 2019, 12, 5373–5378. [Google Scholar] [CrossRef]
  25. Simone, A.D.; Park, H.; Riccio, D.; Camps, A. Sea target detection using spaceborne gnss-r delay-doppler maps theory and experimental proof of concept using TDS-1 data. IEEE J. Sel. Top. Appl. Earth Obs. Remote Sens. 2017, 10, 4237–4255. [Google Scholar] [CrossRef]
  26. Hu, C.J.; Benson, C.; Park, H.; Camps, A.; Qiao, L.; Rizos, C. Analyzing anomalous artefacts in TDS-1 delay doppler maps. In Proceedings of the IEEE International Geoscience and Remote Sensing Symposium (IGARSS), Yokohama, Japan, 28 July–2 August 2019; pp. 8366–8369. [Google Scholar]
  27. Open Service Signal B3I (Version 1.0). Available online: http://www.beidou.gov.cn/xt/gfxz/201802/P020180209620480385743.pdf (accessed on 1 January 2021).
  28. Open Service Signal B1I (Version 1.0). Available online: http://www.beidou.gov.cn/xt/gfxz/201902/P020190227592987952674.pdf (accessed on 1 January 2021).
  29. Test and Assessment Research Center of China Satellite Navigation Office. Available online: http://www.csno-tarc.cn/datacenter/ephemeris (accessed on 1 January 2021).
Figure 1. MIMO and multiple target BDS signal detection geometric model.
Remotesensing 13 04963 g001
Figure 2. Target peak curves with the Doppler channel in the detection of BDS signals.
Remotesensing 13 04963 g002
Figure 3. Autocorrelation curves of GNSS B3I and chirp signals.
Remotesensing 13 04963 g003
Figure 4. Two-point target detection main lobe curves of GNSS B3I and chirp signals: (a) The distance between the two targets is 29 m; (b) the distance between two targets is 33 m.
Remotesensing 13 04963 g004
Figure 5. Sidelobe between two main lobe peak ratios of the B3I and chirp signals.
Remotesensing 13 04963 g005
Figure 6. The technical process of multiple GNSS-R signals and multiple-targets detection.
Remotesensing 13 04963 g006
Figure 7. Geometry schematic diagram of multi-signal and multi-target detection simulation.
Remotesensing 13 04963 g007
Figure 8. RCS data of point target 3 under the detection of 4 BDS satellites: (a) satellite 1; (b) satellite 2; (c) satellite 3; and (d) satellite 4.
Remotesensing 13 04963 g008
Figure 9. One-dimensional range detection results of point target 3 under the detection of 4 BDS satellites with 33-meter echo sampling: (a) satellite 1; (b) satellite 2; (c) satellite 3; and (d) satellite 4.
Remotesensing 13 04963 g009aRemotesensing 13 04963 g009b
Figure 10. DDM of point targets under the detection of 4 BDS satellites: (a) satellite 1; (b) satellite 2; (c) satellite 3; and (d) satellite 4.
Remotesensing 13 04963 g010aRemotesensing 13 04963 g010b
Figure 11. Doppler compensation comparison of method 1 in a one-dimensional range image using B3I signals of satellite 3: (a) Results with Doppler channel 1 compensation; (b) results with Doppler channel 2 compensation; (c) results with Doppler channel 3 compensation; (d) results with the proposed MTDC method based on multiple Doppler channels.
Remotesensing 13 04963 g011
Figure 12. Doppler compensation comparison of method 2 in a one-dimensional range image by B3I signals of satellite 3: (a) results with first target Doppler compensation; (b) results with second target Doppler compensation; (c) results with third target Doppler compensation; (d) results with the proposed MTDC method based on multiple estimated target Dopplers.
Remotesensing 13 04963 g012
Figure 13. One-dimensional range detection results of 3 ship targets under the detection of satellite 3 with 33-meter echo sampling and 3-meter echo sampling and the corresponding RCS data distribution: (a) ship 1 detection result; (b) ship 1 RCS data; (c) ship 2 detection result; (d) ship 2 RCS data; (e) ship 3 detection result; (f) ship 3 RCS data.
Remotesensing 13 04963 g013aRemotesensing 13 04963 g013b
Figure 14. Range inversion results of 3 ship targets under the detection of BDS satellite 3 with range inversion method 1: (a) ship 1; (b) ship 3; (c) left part of ship 2; (d) right part of ship 2.
Remotesensing 13 04963 g014aRemotesensing 13 04963 g014b
Figure 15. Range inversion results of 3 ship targets under the detection of BDS satellite 3 with target estimation information by range inversion method 2: (a) ship 1; (b) ship 2; (c) ship 3.
Remotesensing 13 04963 g015
Figure 16. DDM detection results of 3 ship targets under the detection of satellite 3: (a) without clutter and noise influence; (b) with clutter background.
Remotesensing 13 04963 g016
Table 1. System parameter.
SignalsB3I
Bandwidth (B)/MHz20.46
Carrier frequency f 0 /Hz 1.268 × 10 9
Satellite1 PRN19
Satellite2 PRN26
Satellite3 PRN21
Satellite4 PRN22
Receiver label/km(0, 0, 6.5)
Receiver velocity/m/s 250
Receiver velocity angle φ = 135 ° , θ = 90 °
Simulation serial number 12
Accumulation time/s0.12810
Table 2. Target parameter.
Simulation 1
Point
r/km φ r v/m/s φ v Interval/mNumber
Target 11 150 ° 15 120 ° 301
Target 21.5 135 ° 20 135 ° 305
Target 32 60 ° 20 120 ° 303
Simulation 2
Ship
r/km φ r v/m/s φ v Length/Width(m)
Target 11 150 ° 15 120 ° 141/20
Target 21.5 135 ° 20 135 ° 314.6/40.8
Target 32 60 ° 20 120 ° 142/18
Publisher’s Note: MDPI stays neutral with regard to jurisdictional claims in published maps and institutional affiliations.

