Abstract
Mega-dunes in the lake group area of the Badain Jaran Sand Sea, China, are generally taller than dunes in the non-lake group area. This spatial distribution of dune heights may provide a new perspective on the controversy regarding the dunes’ formation mechanism. In this study, we calculated the relative heights and slopes of individual dunes based on a digital elevation model, and we confirmed the height distribution of abnormally tall dunes in the lake group area of the sand sea. It was also found that slopes of more than 10° in the lake group area are more common than those in the non-lake group area. Based on meteorological observations, coupled with the measurement of water content in the sand layers, we propose a conceptual model demonstrating that moisture exchange between the lakes and soil via non-rainfall water will humidify dune slopes and form a more favorable accumulation environment for aeolian sand, thus increasing dune heights. Although long-term observations are yet to be carried out, the present study can be used as evidence for understanding the basis of dune formation in the lake group area and assessing groundwater utilization in deserts.
1. Introduction
The formation and evolution of sand dunes are related to various factors such as wind conditions [1], sand supply [2], topography [3], geological constraints [4], and the depth of the atmospheric boundary layer [5]. In particular, the formation of mega-dunes has long been a topic of interest in aeolian sand geomorphology due to their relationship with the natural limit of maximum dune height and their importance in understanding and verifying the mechanism of dune morphological evolution [6,7,8,9]. Mega-dunes in the Badain Jaran Sand Sea of Northern China have been identified as being the tallest in the world [6,10,11,12], but the reason for the tallest dunes being found adjacent to the lakes is currently unclear, and more work needs to be conducted on the interaction of lakes and dunes. In previous studies, remote sensing images were frequently used to identify dune types [12], measure certain dune morphological indicators [13], or study the relationship between dune orientation and wind regime [2]. However, few studies have explored the spatial distribution of dune morphological indicators over the entire studied desert area. An important reason is that the conventional heights and slopes obtained from DEM data cannot distinguish the heights and slopes of every single dune. This study proposes an algorithm for calculating dune heights and slopes using a digital elevation model (DEM), which was then applied to the Badain Jaran Sand Sea. The location and area of the lakes were obtained through visual interpretation, and the spatial distribution pattern of dune morphology and statistical relationship between the morphological indexes and total lake area were analyzed. Dune heights, dune slopes, and the location of lakes in the Tengger Sand Sea in China and the Idehan Ubari Sand Sea in Libya were also calculated by the same method for comparison. Finally, based on meteorological observations and water content measurements of dune surface layers in different basins, a conceptual model of dune growth incorporating the lake-dune pattern was proposed to explain the occurrence of the tallest dunes in the lake group area of the Badain Jaran Sand Sea.
2. Background
The tallest dune in the Badain Jaran Sand Sea is approximately 453.193 m (by Electronic Total Station); it is noticeably taller than dunes in other desert locations, such as the 300-m dunes in the Namib Desert [10], 230-m dunes in the Grand Erg Oriental in the Sahara Desert [10], 150-m dunes in the Thar Desert [10], 250-m dunes in the Rub’ al-Khali Desert [14], and 170-m dunes in the Ad-Dahna Desert [15]. Many researchers have noticed this phenomenon and several hypotheses have been proposed to explain the formation of the mega-dunes in the Badain Jaran Sand Sea [6,8,10,11,12,16,17,18,19], but the explanations remain unclear [6]. The hypothesis of the formation of mega-dunes can be summarized into three types [9]—the underlying topography control hypothesis, wind dominance hypothesis, and groundwater maintenance hypothesis.
Considering the first hypothesis, the underlying topography in the Badain Jaran Sand Sea likely consists of stony hills, and they have two functions in this capacity [20]. First, the hills limit the speed of mobile sand, making it easier for sand in saltation and creeping to accumulate, thus causing dunes to grow taller. Second, as mobile sand covers the surface of a stony hill, it creates the illusion that the mega-dune is made entirely of sand; in fact, the total heights of such mega-dunes are mainly attained by the supporting volumes of the underlying stony hills. However, one challenge to this hypothesis is that the spatial distribution of all dunes in the sand sea conforms to aeolian geomorphologic characteristics, which stony hills inherently do not possess [7]. Ancient dunes may also influence the formation process of mega-dunes in the Badain Jaran Sand Sea in terms of the underlying topography. Several calcareous cementation layers have been identified within the mega-dunes. It has been speculated that these deposits were formed by solidified ancient dunes during relatively wet periods over the last 31,000 years and that the cycles of dune fixation and development caused by climate fluctuations created the mega-dunes [11].
Regarding the second hypothesis of wind dominance, it has been suggested that in the Badain Jaran Sand Sea, dunes of different orders (individual simple dunes and mega-dunes) exhibit statistical relationships between dune height and spacing that are consistent with those in general aeolian landforms [19]. In other words, the morphology of sand dunes in the Badain Jaran Sand Sea could be shaped by wind alone. For the spatial distribution pattern of dune height, it has been suggested that the Yabulai Mountains, located on the southeast part of the sand sea, have physically interfered with the near-surface airflow and enhanced the accumulation of blowing sand, resulting in the pattern of increasing dune height from northwest to southeast [7,17]. On the other hand, it may be that the presence of the Yabulai Mountains does not explain the spatial distribution of dune heights. This is because, in the regional wind regime, dunes in the Badain Jaran Sand Sea migrate from northwest to southeast; therefore, the increase in dune heights from northwest to southeast could result from merely the natural evolution of dune heights from the sand source area to the accumulation area. Moreover, the Yabulai Mountains, with a relative height of approximately 300 m on the windward slope (northwest slope), are located approximately 50 km from the tallest dunes in the Badain Jaran Sand Sea, thus it is unlikely that they are situated close enough to interfere with the airflow.
Regarding the third hypothesis of groundwater maintenance, because the concentration region of the tallest dunes coincides with the lake group area, water could possibly act as a cohesion agent to influence the heights of the dunes, protecting them against wind erosion and transportation [8]. It has been suggested that the dune heights result from the equilibrium between the discharge of water vapor from groundwater and the evaporation demand on the dune surface, that is, the groundwater sustains the existence of the mega-dunes [18]. The basic principle of this hypothesis is that within the interior of a given dune, water vapor from the springs under the dune rises continuously. This promotes sand grain accumulation and reduces sand grain erosion. Ultimately, the rising water vapor reduces to a state of equilibrium following its evaporation from the dune surface, and then the vertical growth of the dune ceases [18]. However, precipitation and evaporation data collected from in-situ observation by automatic weather stations and an eddy covariance (EC) system in the Badain Jaran Sand Sea do not support the view that such water vapor continuously moves upward [21].
Based on the above analysis, it seems that the dune morphology in the Badain Jaran Sand Sea is mainly controlled by the regional wind regime, and no additional factors are required for the explanation. However, the phenomenon of the largest dunes being concentrated within the lake group area raises questions.
As one potential explanatory factor, non-rainfall water (dew, frost, fog, vapor adsorption, etc.) from lakes in the Badain Jaran Sand Sea may have a significant effect on the lakes’ surrounding environment. This is because non-rainfall water contributes significantly to precipitation in arid areas, and the amount of non-rainfall moisture is also considerable. For instance, fog water varies from site to site around the world, but operational projects with a passive mesh system for fog water collection report average collection rates of 3–10 L per square meter of mesh per day [22]. In addition, the amount of non-rainfall water that enters the soil varies greatly owing to factors such as climate, season, topography, soil, and vegetation. Most observations show that the average monthly dew precipitation is nearly 5 mm [23,24,25,26], which is comparable to rainfall in some arid regions. Moreover, dew is neither the only form of non-rainfall water nor is it the primary form of non-rainfall water that occurs in the region. A study in the Namib Desert showed that the quantity of water vapor adsorption can be up to three times that of dew water [27], and in extreme cases, when combining the factors of dew precipitation, fog precipitation, and water vapor adsorption, the daily total non-rainfall water accumulation can reach up to 8.7 mm [28]. Among the different sources of non-rainfall moisture, dew condensation requires a relative humidity exceeding 84% and a soil surface temperature that is below the dew point, whereas formation of fog only requires a relative humidity exceeding 84% [28]. Water vapor adsorption occurs more frequently and can occur when the relative humidity of the near-surface atmosphere exceeds 20% [29]. Based on these studies, the potential contribution of non-rainfall water should not be disregarded in the hyper arid Badain Jaran Sand Sea, especially within the lake group area. However, previous studies have not focused on this.
3. Materials and Methods
3.1. Study Area
The Badain Jaran Sand Sea (40° N, 102° E; Figure 1a) covers an area of 52,162 km2 [30]. The sand sea is alternately controlled by northwesterly winds in winter and the southeast monsoon in summer, with the former being stronger. Compound transverse dunes that are oriented NNE-SSW are the main dune types in the Badain Jaran Sand Sea. The dry alluvial deposits around the middle and lower reaches of the Heihe River on the northwest part of the sand sea provide abundant sand sources [31]. The dune heights increase from northwest to southeast [7]; however, the tallest sand dunes are found adjacent to interdune lakes (referred to here as the ‘lake group area’), in the southeast part of the sand sea, slightly away from the sea’s southeast margin. There are approximately 110 lakes in the lake group area, forming a landscape where lakes and mega-dunes coexist (lake-dune pattern; Figure 1b,c) approximately 30 km in radius (Figure 1a, the lake group area). Dunes in the lake group area exceed 350 m in relative height [12] and constitute the tallest dunes in the Badain Jaran Sand Sea.
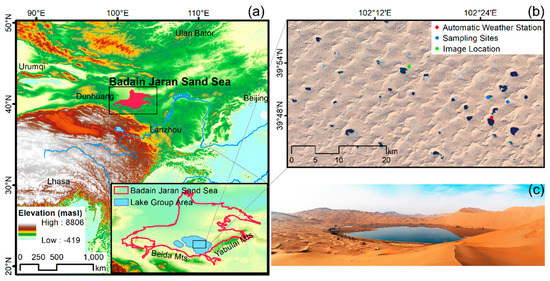
Figure 1.
(a) Location of the Badain Jaran Sand Sea. (b) Location of the automatic weather station and sampling sites. The image location is marked with a green dot. (c) Coexistence of lakes and dunes in the Badain Jaran Sand Sea.
The vegetation in the lake group area of the Badain Jaran Sand Sea is sporadic and low, except for along the lakeside. A few tall shrubs are occasionally visible on the dunes [32].
The coexistence of lakes and dunes does not only occur in the Badain Jaran Sand Sea. There are also interdune lakes in the Tengger Sand Sea in northern China and the Idehan Ubari Sand Sea in western Libya. In this study, the dunes of these two sand seas were also studied by remote sensing method for comparison.
3.2. Data
In this study, the Advanced Spaceborne Thermal Emission and Reflection Radiometer (ASTER) Global Digital Elevation Model (GDEM) Version 3 (hereafter, the DEM) [33] with a spatial resolution of 30 m was used to calculate the relative heights, gentle slopes, steep slopes, and mean slopes of the dunes (defined in Section 3.3 and Section 3.4) in the Badain Jaran Sand Sea, the Tengger Sand Sea, and the Idehan Ubari Sand Sea. The area of the lakes between the mega-dunes in the Badain Jaran Sand Sea was acquired by visual interpretation based on high-resolution remote sensing images (spatial resolution of approximately 0.46 m) provided by Google Earth (Google LLC., Mountain View, CA, USA, 2019). The authors’ field investigation experience was helpful in the visual interpretation. Meteorological observations and soil water content measurements were conducted in this study in order to explore the possibility and the way that meteorological elements affect the water content of the sand layer.
3.3. Algorithm for Dune Heights
The relative height was used to describe the relief of a sand dune, which was defined by the elevation difference between the dune peak and a local low point in a spatial range (specified by the search distance, defined in the next paragraph). The expected distribution density of the dunes within a sand sea may be expected to differ; therefore, the use of a fixed search distance throughout the dune field is inappropriate. To avoid this issue, we first divided the dune area into 18 × 18 km blocks (600 × 600 pixels for the DEM with a spatial resolution of 30 m). The block size then served as an empirical value to balance local representativeness and regional differences, and in each block, we calculated a search distance. At the edge of the sand sea, valid blocks were those with pixels for which at least half were valid (600 × 600/2).
For the search distance, the global highest point (the highest of all the local maximum value points in a DEM block) was selected as the center; then, we searched all the local minimum points in the DEM block one by one from near to distant locations. In instances where the elevation of a local minimum point was higher than the previous one (Figure 2, point C was higher than point B), we adjusted the elevation of the former to that of the latter (Figure 2, the elevation of point C’ was equal to that of point B). Using this method, the differences in horizontal distance and elevation between each local lowest point and the previous point formed a slope β. In this way, the search distance could represent the horizontal distance from the global highest point to the last local lowest point that satisfies β > β0 within the upper bound of the search distance. In this study, β0 was set as 5°.
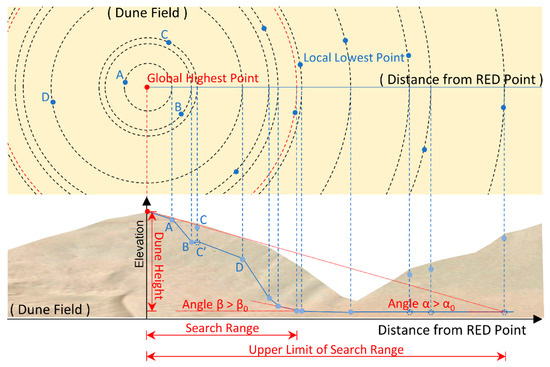
Figure 2.
Sketch map of the algorithm for the dune height.
For the upper bound of the search distance, the angle α is the slope formed by the difference between the horizontal distance and elevation of the global highest point and those of each of the local lowest points. The upper bound of the search distance is the horizontal distance between the global highest point and the last local minimum point that satisfies α > α0 when searching all the local lowest points. In this study, α0 was set as 5°.
Every search distance within an 18 × 18 km area was assigned to its highest point in the grid. Then, the biharmonic splines interpolation method [34] was applied to interpolate all the search distances into a raster dataset with the same size as the original dune field in a DEM image. This raster dataset represented the grid of the search distance.
To determine dune peaks, we calculated the local maximum and minimum points in the dune field using the DEM image. Every local maximum point was matched with the grid of the search distance. If a local maximum point was the highest point in its search distance, it was considered to be the peak of a dune. To determine dune height, for every dune peak, the local minimum point within a search distance was identified. The elevation difference between the dune peak and the local minimum point was the relative height of a dune.
3.4. Algorithm for the Slopes of Single Sand Dunes
The spatial distribution of the dune slope depends on the slope condition of each individual dune. For every dune peak, the dune slope within its search distance was calculated using the DEM image. The gentle slope was defined as the average value of slopes within the range of 10° and 25°, the steep slope was defined as the average value of slopes exceeding 25°, and the mean slope was defined as the average value of slopes exceeding 5°. These thresholds (5°, 10°, 25°) were used to roughly distinguish between flat, windward slopes, and leeward slopes after repeated tests. The gentle slope and steep slope were used to roughly represent the windward slope and leeward slope, respectively.
3.5. Algorithm for the Lake Area
Lakes are distributed among the mega-dunes in the southeastern part of the Badain Jaran Sand Sea, comprising the referred lake group area. This study used high-resolution images obtained from Google Earth, combined with field observations, to visually interpret the lakes. The total area of each lake was calculated under the Albers Equal Area Conic Projection. In the case of there being several temporal images of a given lake, the one covering the maximum area was selected as the total area of the lake, because the time spans of the images were within 10 years. For each lake, the difference in the area was mainly attributed to the seasonal changes caused by evaporation. In addition, because all the lakes are relatively small, we selected the largest area as an indicator to fully describe the areal differences between lakes. Occasionally, multiple lakes were located in close proximity to each other (<1 km) and regarded as one water body. We obtained the locations and areas of 100 lakes in total.
3.6. Mapping Method from Lakes to Dunes
When discussing the relationship between the relative height and slopes of the dunes and the area of the lakes, we first mapped every lake to the tallest dune nearby within a particular distance. The range of the surrounding area of a lake was the maximum distance between each lake and the lake closest to it (see Supplementary Materials, Figure S1). This value was uniform for each lake. This ensured that every lake had a corresponding dune; however, there were cases of multiple lakes being adjacently distributed and corresponding to the same dune. In such cases, we merged the areas of these lakes and matched the resulting area to the dune. The center point of a lake was set as the mean of the coordinate values of the four boundaries (east, west, south, and north). The location of a dune was represented by the coordinates of its peak.
3.7. Two-Dimensional Simplified Dune Height Model
Bagnold [35] used a two-dimensional simplified model to express the relationship between the sand transport rate, the speed of dune movement, and the height of the dune. In this study, we also considered using a two-dimensional simplified model to describe the factors affecting the height of a sand dune.
By using a triangle to represent the dune peak supporting structure, then,
hence,
where, S is the area of the triangle and represents the volume of a dune approximately, h is the height of a dune, and θa and θb are the degrees of two slope lines, in most cases, representing the windward and leeward slope of a dune, respectively.
3.8. Automatic Weather Observation
In this study, the GILL GMX600 MaxiMet (Gill Instruments Limited, 2021) miniature weather station (Figure 3e) was used to conduct meteorological observations in two interdune basins that were in close proximity—Bagajilin and Wulanaogeqin, representing (and referred to hereafter as the lake basin and non-lake basin, respectively) (Table 1). The observations lasted one day, and the observation dates were 16 April and 18 April 2019, respectively. The overall observation location was similar to that of the sampling sites in Figure 1b.
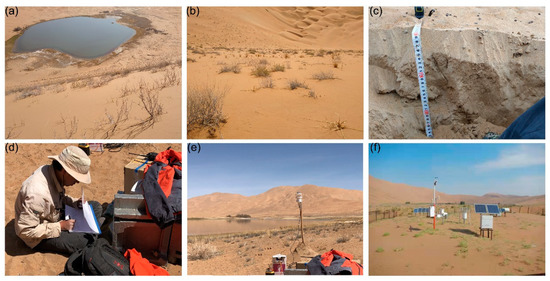
Figure 3.
Photos of fieldwork and observation stations. (a) Environment of the lake basin (Bagajilin). (b) Environment of the non-lake basin (Wulanaogeqin). (c) Sampling profile with a depth of 30 cm. (d) In-situ weighing. (e) Miniature weather station in the lake basin. (f) Automatic weather station in Sumubarunjilin.

Table 1.
Basic description of the field work.
An automatic weather station was established in the Sumubarunjilin lake basin (Figure 1b, automatic weather station; Figure 3f) by the Field Scientific Observation and Experiment Station of the Center for Glacier and Desert Research, Lanzhou University. We selected a complete year-long period (April 2018 to April 2019) for observation.
3.9. Oven Drying Method for Determination of Moisture
In this study, the oven drying method was used to measure the water content of surface layer sand in both the lake basin and non-lake basin (Figure 1b, sampling sites; Figure 3). The measurements were carried out on 16 April and 18 April 2019, for each basin, respectively, with samples being collected at time intervals of 2 h for a total of 24 h. Samples were collected at depth intervals of 5 cm to a total depth of 30 cm. This methodology was based on research in the Gurbantunggut Desert, which has shown that the most dramatic changes in water content of the sand layer occur within the top 30 cm [36]. Similar results have previously been found for the Badain Jaran Sand Sea [32], so the present study focused on changes in the water content of this sensitive layer. Finally, the average value of all six samples in each depth profile was used to represent the moisture content of the sand surface at the time. The samples were dried at a constant temperature at 105 °C for 7.5 h.
4. Results
4.1. Spatial Distributions of Dune Heights and Slopes
The locations, relative heights, gentle slopes, and steep slopes of all dunes in the Badain Jaran Sand Sea were plotted on a spatial distribution map (Figure 4a–c). It can be seen that in general, the sand dunes at the edge of the sand sea are relatively small, whereas those in the hinterland of the sand sea are relatively large. The relative height of the sand dune gradually increases from the northwest to the southeast.
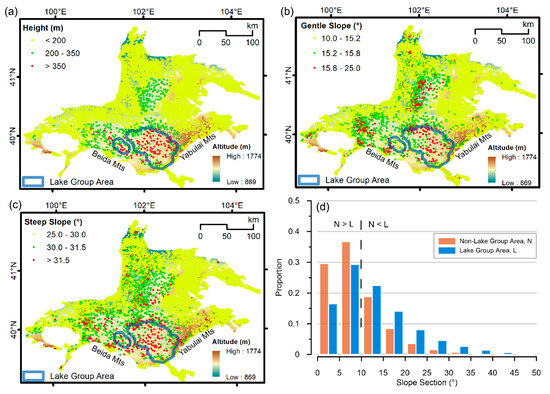
Figure 4.
Spatial distributions of the (a) relative height of dunes, (b) gentle slopes of dunes, and (c) steep slopes of dunes in the Badain Jaran Sand Sea. The lake group area features a 10 km buffer zone with lakes at the center [37] in the southeastern part of the Badain Jaran Sand Sea. (d) Histogram of slope composition in the lake and non-lake group areas.
Almost all the dunes with a relative height exceeding 350 m were distributed within the lake group area (Figure 4a), which had a radius of ~30 km. The center of the lake group area was up to 50 km in proximity from the Yabulai Mountains. Dune heights in the lake group area were significantly (p < 0.01) greater than those in the non-lake group area. The spatial distribution patterns of the gentle and steep slopes were similar to the patterns of the relative height, the dune slopes in the lake group area were significantly (p < 0.01) steeper than those in the non-lake group area. As shown in Table 2, the average value of the dune heights, the average value of the gentle and steep slopes of dunes, and the average value of slopes exceeding 5° in the lake group area all exceeded those of the non-lake group area.
Table 2.
Comparison between the dune heights and slopes in the lake and those in the non-lake group areas.
A histogram analysis (Figure 4d) of raster-type slope data shows that the proportion of slopes > 10° in the lake group area is evidently higher than that in the non-lake group area, whereas the proportion of slopes < 10° is evidently lower. This indicates that in the study of the dune heights of the Badain Jaran Sand Sea, the lake group area is a unique region in which the heights and slopes of the dunes in that area clearly differ from those in the non-lake group area.
The locations, relative heights, gentle slopes, and steep slopes of all dunes in the Tengger Sand Sea and the Idehan Ubari Sand Sea were plotted on the following spatial distribution maps (Figure 5). In both sand seas, the relative heights of dunes in the lake group area are higher compared with the non-lake group areas, and both the gentle slope and the steep slope of dunes are steeper. These patterns are consistent with those of dunes in the Badain Jaran Sand Sea.
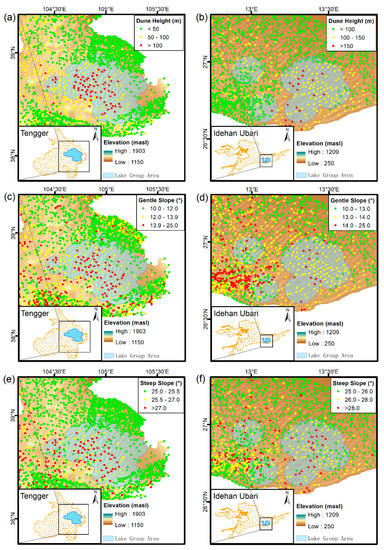
Figure 5.
Spatial distribution of dune heights (a) gentle slopes (c) steep slopes (e) in and around the lake group area of the Tengger Sand Sea, and the spatial distribution of dune heights (b) gentle slopes (d) steep slopes (f) in and around the lake group area of the Idehan Ubari Sand Sea.
4.2. Relationships between the Lake Size, Dune Height, and Dune Slopes
As shown in the scatter plots of dune slope versus height (Figure 6a–c), the dune height and slope steepness are positively correlated regardless of slope type. This is true for all slope types in the lake and non-lake group areas. Additionally, the mega-dunes adjacent to lakes are the tallest within the lake group area and throughout the sand sea. Thus, it can be stated that, if not for the mega-dunes mapped to the lakes, the tallest dunes in the Badain Jaran Sand Sea would not exceed 400 m, if not for the dunes in the lake group area, the tallest dunes in the sand sea would reach only to approximately 300 m, which is closer to the dune heights in the Namib Desert [10]. Moreover, the heights of the dunes increase with the increase in the sizes of nearby lakes (Figure 6d). For evaluating the distribution of dune height to lake size, the square root of the lake area was used to represent the size of the lake. When the lake size increased from 0 to 2.8 km, the dune height increased by approximately 80 m. In summary, the slope (Table 2, Figure 4d) and height anomalies (Figure 4a and Figure 6a–c) in the lake group area were found to be interrelated, not independent phenomena, and this is most likely related to the existence and size of the lakes (Figure 6d).
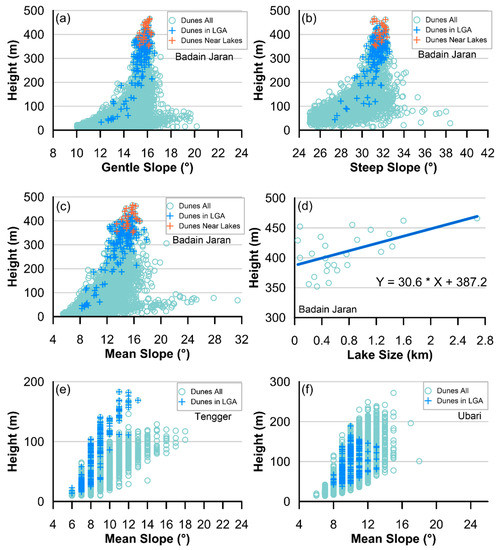
Figure 6.
Scatter plots showing the relationship between the dune height and the (a) gentle (10–25°), (b) steep (>25°), and (c) mean (>5°) dune slopes; (d) the lake size (considered to be the square root of the lake area) in the Badain Jaran Sand Sea; and the relationship between the dune height and the mean (>5°) dune slopes in (e) the Tengger Sand Sea and (f) the Idehan Ubari Sand Sea. Blue crosses represent dunes in the lake group area (LGA). Orange crosses represent the dunes mapped to lakes. The blue line in (d) represents the linear fitting.
In the Tengger Sand Sea (Figure 6e) and the Idehan Ubari Sand Sea (Figure 6f), dune heights increase with dune slopes, similar to the trend observed in the Badain Jaran Sand Sea. In the Tengger Sand Sea, the tallest dunes occur in the lake group area, whereas in the Idehan Ubari Sand Sea, the heights of the dunes in the lake group area do not stand out from those of the dunes in the non-lake group area.
4.3. Influence of Lakes on the Meteorological Environment
The observation results of the automatic weather station from April 2018 to April 2019 (Figure 7a) show that the average relative humidity of the air inside the lake basin was 32.4%, which was significantly higher than the soil moisture adsorption (20%, as indicated in literature [30]). For 278 days, the daily average relative humidity exceeded this value. The process of soil moisture adsorption occurred all year round.
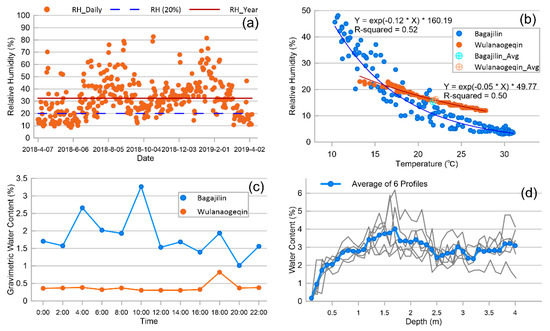
Figure 7.
(a) Relative humidity from the automatic weather station of Sumubarunjilin (Figure 1b) from 7 April 2018, to 6 April 2019. Solid line is the average (32.4%). Dashed line represents the minimum relative humidity (20%) when water vapor adsorption occurs [30]. (b) Scatter plot showing the relationship between air temperature and relative humidity in the lake basin (Bagajilin) and non-lake basin (Wulanaogeqin), and their average values and exponential fittings. The linear distance of the two observation sites was approximately 3.2 km. (c) Variation of gravimetric water content of the surface sand layer in the lake basin and non-lake basin over 24 h. Data were recorded in China Standard Time, which is approximately 1 h 10 min before Local Time. (d) Water content of six profiles with depths of 4 m on the leeward slope of a dune in the lake group area, and their average [38].
Meteorological observations of the lake and non-lake basins on 16 April and 18 April 2019, respectively (Figure 7b), showed that the relative humidity of the air increased as temperature decreased. However, the relative humidity of the air changed more extensively in the lake basin (from 3.00% to 48.12%), and at a greater rate, while the relative humidity of the air changed to a lesser degree, from 12.00% to 23.03%, in the non-lake basin. It should be noted that the daily average values of temperature and relative humidity obscured this information in part.
4.4. Influence of Lakes on the Water Content of the Surface Sand Layer
During the study period, the observations of the surface sand layer (0–30 cm) water content (Figure 7c) showed that the maximum water content of the lake basin was 3.27%, which was recorded at 10:00, and the minimum water content was 1.01%, recorded at 20:00. The water content of the lake basin varied by 2.25%. Conversely, in the non-lake basin, the water content throughout the day was basically less than 0.4%, and the water content of the surface layer changed little within a single day at a change range of only 0.52%. Water content in the deeper layer in the lake group area (1–4 m) fluctuated at approximately 3% (Figure 7d; literature [38]), which is comparable to the maximum water content observed in the lake basin. It is important to note that the present study was conducted for only 1 day, and observations at different seasons or for longer periods in the future would help to improve the robustness of these conclusions.
4.5. Correlation between Meteorological Factors and Soil Water Content
Considering data completeness, we selected the time series of the water content of all 6 layers of the lake basin and layers 1 (0–5 cm) and 3 (10–15 cm) of the non-lake basin for correlation analysis with the time series of meteorological elements. In addition, the time series of meteorological elements have 6 lagged moments from 10 min lag to 60 min lag at 10 min intervals. The results of the correlation analysis are as follows (Figure 8).
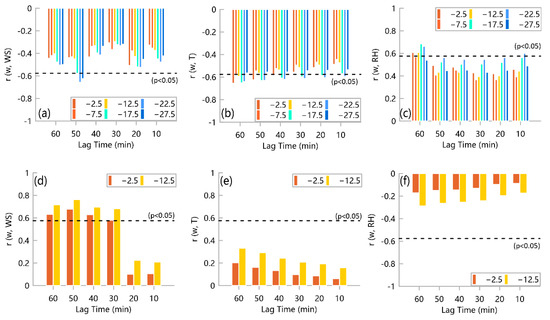
Figure 8.
The relationship between water content (w) of sand layer at different depths and wind speed (WS), air temperature (T) and relative humidity (RH), where “−2.5” represents 0–5 cm depths, “−7.5” represents 5–10 cm depths, etc. (a–c) were for the lake basin; (d–f) were for the non-lake basin.
Soil water content in the lake basin was negatively correlated with wind speed and air temperature, and positively correlated with relative air humidity, and the correlation coefficients were generally not significant. Soil water content in the non-lake basin was positively correlated with wind speed and air temperature and negatively correlated with relative air humidity, with significant correlation coefficients (p < 0.05) from a lag of 30 min to a lag of 60 min with wind speed and very small correlation coefficients with air temperature and relative air humidity.
5. Discussion
In previous research on the height of sand dunes, dune spacing [12,39] was the most discussed morphological indicator, and discussion on dune slopes was inadequate. Sand supply, wind regime, and vegetation were the most discussed external environmental factors [40,41,42], thus discussion regarding the impact of sand moisture content on dune height was relatively insufficient.
5.1. Lakes and Their Influence on the Environment of Basins
The lake group area in the Badain Jaran Sand Sea features approximately 110 lakes with perennial water (total water area of 21.65 km2), which are distributed in a region covering a total area of approximately 5107.55 km2 (Figure 4, lake group area). A previous study found that lakes within the lake group area affected the local climate [43].
The relative humidity records from the automatic weather station (Sumubarunjilin; Figure 7a) indicate that the relative humidity of the air in all lake basins within the lake group area should be relatively high all year round. As evidence to this, we observed a fog floating around the hillside of the mega-dune in another example lake basin, that of Huhejilin Lake (one of the many lakes in the lake group area), on a cloudy morning in October during a field investigation, which indicated that the air vapor in that lake basin could reach saturation under certain conditions. Fog has previously been reported in coastal deserts with abundant moisture such as the Namib Desert and Negev Highlands and is known to be an important source of soil moisture [29,44].
For the two studied basins, our meteorological observations (Figure 7b) show that in the lake basin, the fluctuation range of relative humidity is 4.1 times that of the non-lake basin. Moreover, the relative humidity of the air in the lake basin rose increasingly rapidly with each incremental temperature decrease. However, this phenomenon is not reflected in the daily average relative humidity value. Considering the relatively large temperature difference between day and night in the desert hinterland, high relative humidity of the air may be observed during part of the day, even when the daily average relative humidity is low.
The measurement of water content in the surface sand layer (Figure 7c) shows that the surface water content in the non-lake basin was basically stable at approximately 0.4%. However, the surface water content in the lake basin clearly fluctuated, and the fluctuation range was 4.3 times that in the non-lake basin. The fluctuation characteristics over one day and night were consistent with that of non-rainfall water under semi-arid conditions, which was identified by previous research [45].
Zhao et al. [38] also found that the water content down to a depth of 4 m in the dunes of the lake group area fluctuated by approximately 3% (Figure 7d), which is close to the highest surface water content observed in the lake basin. Moreover, field investigations showed the presence of several Tamarix laxa that was approximately 1.5–3 m high [32] on the slope of dunes in the lake group area of the sand sea, indicating the presence of a species that can survive without relying on groundwater [46]. This indicates that the surface water content of the leeward slope is high, and under current conditions, can support tall, sporadic shrubs. However, in hyper arid deserts where the annual precipitation is less than 100 mm, the water content in the sand layer is generally below 2% [47]. This combined evidence shows that lakes in the lake basin likely do impact the water environment and water cycle processes of the basin.
Previous studies have posited that the lakes in the Badain Jaran Sand Sea are mainly recharged by groundwater [12,48,49], which is consistent with the findings of Zhang et al. [32]. Moreover, precipitation in the lake area is known to be scarce [50,51]. The observations by Ma et al. [21] with respect to the EC system show that almost all of the rain that falls on the dunes evaporates, which leads to very little replenishment of the water content of the mega-dunes. Furthermore, because the rise of capillary water above the water table has a limited ascent height [52], groundwater cannot be a reasonable source of water supply for the sand layer of mega-dunes. Therefore, lake surface evaporation is the most likely potential source of water vapor in the lake basins. Although long-term continuous observations are yet to be carried out, the available observations and correlation analyses (Figure 8) show that the high soil moisture content may be the result of an equilibrium between air water vapor around the lakes and soil moisture of the sand layer during the long-term coexistence of dunes and lakes. On longer time scales, the soil water content of the non-lake basin may also be influenced by the nearby lakes by means of advective transport by wind (Figure 8).
In terms of moisture exchange, the temperature gradient and moisture gradient at the interface between the soil and atmosphere are thought to be the driving forces [53,54]. In a typical desert area, the diurnal temperature difference provides the interface temperature gradient between the air and surface sand layer. In addition, during the daily warming period, owing to the small specific heat capacity of sand, when the surface temperature of sand dunes rises rapidly, the sub-surface temperature rises more slowly. Because of this, the temperature difference between the surface and sub-surface layers of sand dunes [55] causes some water vapor to migrate downward, instead of entirely evaporating into the atmosphere, which is therefore beneficial to the long-term maintenance of the water in the sand layer.
In the lake group area of the Badain Jaran Sand Sea, the numerous lakes between the mega-dunes provide a rich source of water vapor for the surrounding atmosphere. The EC system in the lake group area observed that the actual evaporation of the lake surface was 1450 mm/a (3.97 mm/d) [56], which was approximately 20 times the annual precipitation [50,51]; therefore, a large humidity gradient between the air and the sand surface is thought to be forming consistently and steadily. Further, owing to the large size of the sand dunes, the excessive air vapor in the lake basin spreads relatively slowly, which further strengthens the effect of air moisture on the surface water content of the dunes.
Isotope analysis of soil water has revealed a repeated recharge–evaporation process [57]. Additional studies [32,58] support the conjecture that the source of soil water may be lakes via intense evaporation. Moreover, the isotopes of soil water are on the same evaporation line as those of lake water, groundwater, atmospheric water vapor, and condensed water (Figure 9a). Therefore, the water content in the lake group area of the Badain Jaran Sand Sea that fluctuates around 3%, observed by Zhao et al. [38], is most likely the result of the dynamic equilibrium formed by the long-time coexistence of the lakes and adjacent mega-dunes in that area.
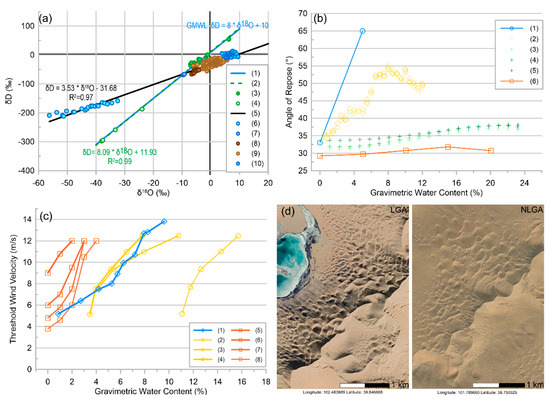
Figure 9.
(a) Isotope δD-δ18O composition of the Global Meteoric Water Line (GMWL) (1), local meteoric water line (rainfall and snow water) (2), rainfall (3), snow water (4), evaporation line (5), atmospheric water vapor (6), condensate water (7), groundwater (8), soil water (9), and lake water (10) in the lake group area of the Badain Jaran Sand Sea [32]. (b) Variation of the angle of repose with water content in non-uniform sand [59,60] and uniform sand with different grain sizes [61,62]. (1) Non-uniform sand [59]. (2) Non-uniform sand [63]. (3) Very fine sand [61]. (4) Fine sand [61]. (5) Coarse sand [61]. (6) Fine sand [62]. (c) Variation of threshold wind velocity with water content in different types of soil and in sand with different grain sizes [64,65,66]. (1) Sandy loam [65]. (2) Clay [64]. (3) Loam [64]. (4) Fine sandy loam [64]. (5) 1.0–2.0 mm [66]. (6) 0.5–1.0 mm [66]. (7) 0.25–0.5 mm [66]. (8) 0.175–0.25 mm [66]. (d) Morphological comparison of superimposed dunes on windward slope of dunes in lake group area (LGA) and non-lake group area (NLGA).
5.2. Water Content and Aeolian Sand Deposition
Multiple studies [59,60,61,62,63] have found that the angle of repose increases considerably with increasing sand moisture content (Figure 9b). This influence is enhanced by the increase in particle size and the homogenization of grain composition [61]. In other words, for natural sand, water content has a relatively great influence on the angle of repose [59,63]. Wang et al. [63] conducted experiments and found that an increase in gravimetric water content from 0% to 8% can cause an increase in the angle of repose by nearly 20°. For the transversal dunes in the lake group area of the Badain Jaran Sand Sea, the leeward slope can be roughly interpreted as the repose angle of dune sand. Therefore, an increase in water content may cause an increase in the leeward slope of the sand dune.
Transverse dunes move by sand erosion of the windward slope surface and sand accumulation on the leeward slope surface [35]. Increasing the water content of surface sand on the windward slope increases the critical wind speed for sand transport (Figure 9c; as indicated by literature [64,65,66,67]) and increases adhesion [68,69], which further reduces erosion on the windward slope and decreases the movement speed of the dune. Afterwards, additional upwind small dunes may merge on the mega-dunes after collision [70], which therefore increases the volume of the mega-dunes.
In addition, water content influences the superimposed dunes on the windward slopes of the mega-dunes by the same mechanism, and the volume and relative height of these superimposed dunes will gradually increase along the windward slope of mega-dunes. This phenomenon is consistent with the results of field investigations and interpretation of high-resolution Google Earth images (Figure 9d).
5.3. How Do Dune Slopes Influence Dune Heights When Dune Volume Is Stable?
As shown in Figure 6a–c, dune slope and dune height are correlated, and this relationship may be related to the mechanism of dune height maintenance. Since dunes are composed of loose deposits, the peak point of a dune is always supported by several slope faces regardless of dune type (Figure 10a). The slope gradient of sand dunes directly influences the dune height. Thus, if the volume of the dunes remains unchanged, any increase in a slope inevitably causes an increase in the dune height, as shown schematically in Figure 10b,c.
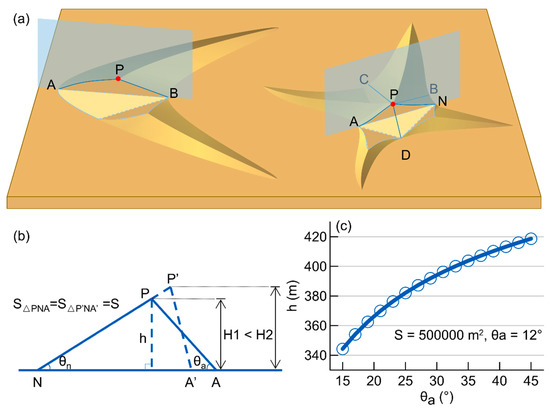
Figure 10.
(a) Sketch of the relationship between the dune height and dune slope. (b) Line chart of θa and h incorporating the area of the triangle (referring to the dune volume) and assuming that S = 500,000 and that θn = 12°. (c) Sketch showing that the peak point of a dune (point P) is maintained by several slope faces, which are described by the maximum slope lines (PA, PB, PC, and PD). Among these slope line relationships, PN is coplanar with PA and plane PAN is perpendicular to the ground plane.
Through the peak point of a dune, there is a representative line on each slope face (such as PA, PB, PC, PD in Figure 10), and its angle to the ground equals the slope gradient of its corresponding slope face. Thus, for a dune of constant volume, the steeper a slope is, the higher the dune. The relationship between the slope and height is shown in Equation (2) and Figure 10.
Moreover, the increasing rate of a dune’s height, as shown in Figure 10, decreases with increasing dune slope, which differs from the relationship observed using the remote sensing method in Figure 6. This is because Equation (2) assumes that the volume of a dune is fixed. However, the volume of the dunes in the Badain Jaran Sand Sea increased vastly from the edge of the sand sea to the hinterland. The scatters at the lower-right corner of Figure 6a–c roughly satisfy the assumption of Equation (2), because they represent the group of dunes with heights below 100 m and are increasing linearly. These scattered points are spatially distributed around the edge of the Badain Jaran Sand Sea and represent small barchans, barchan chains, transversal dunes, and star dunes.
Therefore, in the lake group area of the Badain Jaran Sand Sea, the changes in slopes due to the presence of lakes may contribute to the continued increase in dune heights when the dune height is determined by the evolution of the wind energy environment to a near-steady state. Furthermore, in comparison with dunes in the non-lake group area, dunes in the lake group area may be taller due to their steeper slopes, despite similarities in external conditions such as sand supply.
5.4. Conceptual Model of Dune Growth with Lake-Dune Patterning
Data of this study confirms that abnormally high dunes are concentrated in the lake group area of the Badain Jaran Sand Sea (Figure 4a and Figure 6). We used the same method to delineate the range of lake group areas and calculate the relative heights and slopes of dunes in the Idehan Ubari Sand Sea in Libya and the Tengger Sand Sea in China and found that dunes in those lake group areas are also taller (Figure 5e,f), in agreement with our findings for the Badain Jaran Sand Sea. Furthermore, a moderate relationship between the size of the lakes and the height of the dunes in the lake group area of the Badain Jaran Sand Sea was also detected (Figure 6d). The correlation analysis (Figure 8) suggests that changes in soil water content in the lake group area is significantly influenced by water vapor above the lakes.
Therefore, it is strongly possible that the formation mechanism of taller dunes in the lake group area of the Badain Jaran Sand Sea is related to the lake-dune pattern. Although the duration of our meteorological observations and water content measurements was relatively short, the results point to a possible pathway to promote the growth of dunes, that is, referring to the moisture exchange between lakes and dunes. It is important to note that lake-dune moisture exchange is only one of the many factors that contribute to dune growth and is usually not a major factor. The long-term coexistence of lakes and sand dunes results in a favorable sedimentary environment and the steepening of the slopes. According to the discussion in Section 5.3, increases in slope gradient and volume can be triggers for an increase in dune height.
Based on the existing evidence, we have denoted three reasonable dune growth mechanisms. First, lakes increase the water content of the dune surface and promote the vertical growth of sand dunes by steepening their leeward slope (roughly in the same manner as the “steep slopes” mentioned above). Second, lakes enhance the water content of the dune surface. This decreases the mobility of the surface sand on the windward slope (roughly in the same manner as the “gentle slopes” mentioned above) and facilitates the merging of superimposed dunes, causing dunes to grow taller. Third, high water content promotes the development of superimposed dunes by reducing their movement speed. For the study area, more developed superimposed dunes appear to steepen the overall windward slope of the mega-dunes in the lake group area, which is also conducive to the relative height growth of the mega-dunes.
In view of the above information, we propose a conceptual model of dune growth with lake-dune patterning (Figure 11) to explain the effect of lakes on the height of sand dunes in the study area, explained as follows. Inside the lake basin, lake evaporation contributes a large amount of water vapor to the air above it. Mega-dunes surrounding the lake basin prolong the retention time of this water vapor in the lake basin. Then, over time, the diurnal variation of temperature in the dune field and the temperature difference between the surface sand and sand undersurface ensure that water vapor in the air enters the surface layer of the dunes. The dune surface becomes moister, steepening the leeward slope (i.e., the angle of repose increases) and decreasing erosion on the windward slope (i.e., the critical sand-blown wind speed increases). Following that decreased erosion, the movement of the mega-dune and superimposed dunes on its windward slope slows down, which in turn steepens the windward slope of the mega-dune and increases its volume. In this way, the steepened slopes of the windward and leeward slope faces, as well as the increased volume of the dunes, have led to abnormally high relative heights of the dunes in the lake group area of the Badain Jaran Sand Sea.
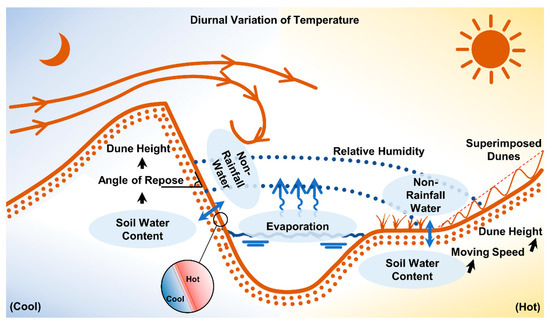
Figure 11.
Schematic of the model of mega-dune growth with the lake-dune pattern.
Finally, it is important to note that this is not the dominant, but only a contributing, factor in the formation of the mega-dunes in the Badain Jaran Sand Sea. As mentioned earlier, without the lakes, the dunes in the Badain Jaran Sand Sea could also grow to about 300 m in height.
6. Conclusions
This study confirms that the tallest mega-dunes in the Badain Jaran Sand Sea are located in the lake group area, which has the highest concentration of lakes. To address the mega-dunes formation mechanism, we have proposed a model of mega-dune growth with lake-dune patterning. The model was derived on the basis of weather observations, water content measurements, and the statistical relationships between the lake area, slope of dunes, and relative height of dunes. This conceptual model suggests that, throughout the long-term coexistence between lakes and sand dunes, the presence of lakes has significantly increased the water vapor content of the air in the lake basin, which in turn has provided non-rainfall moisture that replenished the water content of the sand layer. This altered water content affects the wind speed of sand initiation and the angle of repose, which ultimately contributes to the tall dune heights by increasing both the dune volume and slopes. Long-term field observations are still needed to finely characterize the seasonal variation of soil water content and to confirm the influence of moisture on the morphology of sand dunes, especially where lakes and dunes coexist. Moreover, as the effect of lakes on dune height varies in different sand seas, lakes are not usually the main contributors to dune heights. Further studies should focus on whether the ongoing groundwater abstraction will destroy the coexisting landscape of lakes and mega-dunes in the Badain Jaran Sand Sea, and whether such an effect will decrease dune height and increase the speed of dune movement toward the downwind cities.
Supplementary Materials
The following are available online at https://www.mdpi.com/article/10.3390/rs13234915/s1. Figure S1: Sketch of the algorithm of the range of the surrounding area of a lake.
Author Contributions
N.W. and Z.N. designed this work. Z.N., N.M., H.C., P.W., W.Z., X.Y. and X.L. (Xueran Liang) collected the data. Z.N. did the analysis and wrote this paper. N.W., P.W., N.M., J.L. and X.L. (Xiaoyan Liang) revised this paper. All authors have read and agreed to the published version of the manuscript.
Funding
This research was funded by National Natural Science Foundation of China, grant number 41871021 and the Key Project of the National Natural Science Foundation of China, grant number 41530745.
Acknowledgments
The authors thank Dezhong Zhang and Lyulyu Zhang from Lanzhou University for the fruitful discussions. We would like to thank Yukun Liu and Qida Jiang for their hard work in the in-situ measurements of the dune height.
Conflicts of Interest
The authors declare no conflict of interest.
References
- Wasson, R.J.; Hyde, R. Factors Determining Desert Dune Type. Nature 1983, 304, 337–339. [Google Scholar] [CrossRef]
- Du Pont, S.C.; Narteau, C.; Gao, X. Two modes for dune orientation. Geology 2014, 42, 743–746. [Google Scholar] [CrossRef]
- Hugenholtz, C.H.; Barchyn, T.E. Spatial analysis of sand dunes with a new global topographic dataset: New approaches and opportunities. Earth Surf. Proc. Land. 2010, 35, 986–992. [Google Scholar] [CrossRef]
- Ewing, R.C.; Kocurek, G. Aeolian dune-field pattern boundary conditions. Geomorphology 2010, 114, 175–187. [Google Scholar] [CrossRef]
- Andreotti, B.; Fourriere, A.; Ould-Kaddour, F.; Murray, B.; Claudin, P. Giant aeolian dune size determined by the average depth of the atmospheric boundary layer. Nature 2009, 457, 1120–1123. [Google Scholar] [CrossRef] [PubMed]
- Yang, X.; Liu, T.; Xiao, H. Evolution of megadunes and lakes in the Badain Jaran Desert, Inner Mongolia, China during the last 31,000 years. Quatern. Int. 2003, 104, 99–112. [Google Scholar] [CrossRef]
- Wang, T. Formation and evolution of Badain Jaran Sandy Desert, China. J. Desert Res. 1990, 10, 29–40. [Google Scholar]
- Chen, J.; Li, L.; Wang, J.; Barry, D.A.; Sheng, X.; Gu, W.; Zhao, X.; Chen, L. Groundwater maintains dune landscape. Nature 2004, 432, 459–460. [Google Scholar] [CrossRef]
- Dong, Z.; Wang, T.; Wang, X. Geomorphology of the megadunes in the Badain Jaran Desert. Geomorphology 2004, 60, 191–203. [Google Scholar] [CrossRef]
- McKee, E.D. A Study of Global Sand Seas; United States Government Printing Office: Washington, DC, USA, 1979.
- Yang, X. Landscape evolution and precipitation changes in the Badain Jaran Desert during the last 30 000 years. Chin. Sci. Bull. 2000, 45, 1042–1047. [Google Scholar] [CrossRef]
- Dong, Z.; Qian, G.; Luo, W.; Zhang, Z.; Xiao, S.; Zhao, A. Geomorphological hierarchies for complex mega-dunes and their implications for mega-dune evolution in the Badain Jaran Desert. Geomorphology 2009, 106, 180–185. [Google Scholar] [CrossRef]
- Zimbelman, J.R. Transverse Aeolian Ridges on Mars: First results from HiRISE images. Geomorphology 2010, 121, 22–29. [Google Scholar] [CrossRef]
- Lorenz, R.D.; Zimbelman, J.R. Dune Worlds—How Windblow Sand Shapes Planetary Landscapes; Springer: Berlin/Heidelberg, Germany, 2014. [Google Scholar]
- Holm, D.A. Desert geomorphology in the Arabian Peninsula. Science 1960, 132, 1369–1379. [Google Scholar] [CrossRef]
- Yang, X.; Scuderi, L.; Liu, T.; Paillou, P.; Li, H.; Dong, J.; Zhu, B.; Jiang, W.; Jochems, A.; Weissmann, G. Formation of the highest sand dunes on Earth. Geomorphology 2011, 135, 108–116. [Google Scholar] [CrossRef]
- Yan, M.; Wang, G.; Dong, G.; Li, B. Study on mega dunes development and environmental change in Badain Jaran Desert. J. Desert Res. 2001, 21, 361–366. [Google Scholar] [CrossRef]
- Chen, J.; Zhao, X.; Sheng, X.; Dong, H.; Rao, W.; Su, Z. Formation mechanisms of megadunes and lakes in the Badain Jaran Desert, Inner Mongolia. Chin. Sci. Bull. 2006, 51, 3026–3034. [Google Scholar] [CrossRef]
- Dong, Z.; Qian, G.; Lv, P.; Hu, G. Investigation of the sand sea with the tallest dunes on Earth: China’s Badain Jaran Sand Sea. Earth-Sci. Rev. 2013, 120, 20–39. [Google Scholar] [CrossRef]
- Lou, T. The formation and utilization of the desert between Minqing and Badain Monastery. In Research on Desert Control; Series 3; Science Press: Beijing, China, 1962; pp. 90–95. [Google Scholar]
- Ma, N.; Wang, N.; Zhao, L.; Zhang, Z.; Dong, C.; Shen, S. Observation of mega-dune evaporation after various rain events in the hinterland of Badain Jaran Desert, China. Sci. Bull. 2014, 59, 162–170. [Google Scholar] [CrossRef]
- Klemm, O.; Schemenauer, R.S.; Lummerich, A.; Cereceda, P.; Marzol, V.; Corell, D.; Heerden, J.v.; Reinhard, D.; Gherezghiher, T.; Olivier, J.; et al. Fog as a fresh-water resource: Overview and perspectives. Ambio 2012, 41, 221–234. [Google Scholar] [CrossRef]
- Subramaniam, A.R.; Rao, A.V.R.K. Dew fall in sand dune areas of India. Int. J. Biometeorol. 1983, 27, 271–280. [Google Scholar] [CrossRef]
- Zangvil, A. Six years of dew observations in the Negev Desert, Israel. J. Arid Environ. 1996, 32, 361–371. [Google Scholar] [CrossRef]
- Li, X. Effects of gravel and sand mulches on dew deposition in the semiarid region of China. J. Hydrol. 2002, 260, 151–160. [Google Scholar] [CrossRef]
- Pan, Y.-X.; Wang, X.-P.; Zhang, Y.-F.; Hu, R. Dew formation characteristics at annual and daily scale in xerophyte shrub plantations at Southeast margin of Tengger desert, Northern China. Ecohydrology 2018, 11, e1968. [Google Scholar] [CrossRef]
- Kaseke, K.F.; Mills, A.J.; Brown, R.; Esler, K.J.; Henschel, J.R.; Seely, M.K. A method for direct assessment of the “non-rainfall” atmospheric water cycle: Input and evaporation from the soil. Pure Appl. Geophys. 2012, 169, 847–857. [Google Scholar] [CrossRef]
- Kaseke, K.F.; Mills, A.J.; Esler, K.; Henschel, J.; Seely, M.K.; Brown, R. Spatial variation of “non-rainfall” water input and the effect of mechanical soil crusts on input and evaporation. Pure Appl. Geophys. 2012, 169, 2217–2229. [Google Scholar] [CrossRef]
- Zhang, X. Water vapor condensation on sand dunes in arid area and its significance. Hydrogel. Eng. Geol. 1986, 6, 43–46. [Google Scholar]
- Zhu, J.; Wang, N.a.; Chen, H.; Dong, C.; Zhang, H. Study on the boundary and the area of Badain Jaran Desert based on remote sensing imagery. Prog. Geog. 2010, 29, 1087–1094. [Google Scholar] [CrossRef]
- Zhang, H.; Lu, H.; Yi, S.; Xu, Z.; Zhou, Y.; Tan, H. Zircon typological analyses of the major deserts/sand fields in northern China and its implication for identifying sediment source. Quat. Sci. 2013, 33, 334–344. [Google Scholar] [CrossRef]
- Zhang, J.; Wang, N.A.; Niu, Z.; Sun, J.; Dong, C.; Zhang, L. Stable isotope analysis of water sources for Tamarix laxa in the mega-dunes of the Badain Jaran Desert, China. J. Arid Land 2018, 10, 821–832. [Google Scholar] [CrossRef]
- Abrams, M.; Bailey, B.; Tsu, H.; Hato, M. The ASTER Global DEM. Photogramm. Eng. Remote Sens. 2010, 76, 344–348. [Google Scholar]
- Sandwell, D.T. Biharmonic splines interpolation of GEOS-3 and SEASAT altimeter data. Geophys. Res. Lett. 1987, 14, 139–142. [Google Scholar] [CrossRef]
- Bagnold, R.A. The Physics of Blown Sand and Desert Dunes; Chapman and Hall: London, UK, 1973. [Google Scholar]
- Jiang, J.; Wang, X.Q.; Lei, J.Q. Soil moisture distribution in straw barrier system in Gurbantonggute Desert of Xingjiang, China. J. Soil Water Conserv. 2003, 17, 74–77. [Google Scholar] [CrossRef]
- Zhang, X.; Wang, N.a.; Zhao, L.; Wu, Y.; Liang, X. Spatial distribution of winter warm islands in Badain Jaran Desert based on MODIS data. J. Lanzhou Univ. (Nat. Sci.) 2015, 51, 180–185. [Google Scholar] [CrossRef]
- Zhao, J.; Chen, Z.; Ma, Y.; Luo, X.; Chen, B.; Shao, T. Film moisture with high content in sand layer and its movement in mega-dune of the Badain Jaran Desert. Sci. Geogr. Sin. 2017, 37, 960–966. [Google Scholar] [CrossRef]
- Lancaster, N. Controls of eolian dune size and spacing. Geology 1988, 16, 972–975. [Google Scholar] [CrossRef]
- Cornish, V. Limits of form and magnitude in desert dunes. Nature 1928, 121, 620–622. [Google Scholar] [CrossRef]
- Lancaster, N. Geomorphology of Desert Dunes; Routledge: London, UK, 1995. [Google Scholar]
- Thomas, D.S.G. Arid Zone Geomorphology: Process, Form and Change in Drylands; John Wiley & Sons, Ltd.: Hoboken, NJ, USA, 2011. [Google Scholar]
- Liang, X.; Zhao, L.; Niu, Z.; Xu, X.; Meng, N.; Wang, N.A. Warm island effect in the Badain Jaran Desert lake group region inferred from the accumulated temperature. Atmosphere 2020, 11, 153. [Google Scholar] [CrossRef]
- Kidron, G.J. Analysis of dew precipitation in three habitats within a small arid drainage basin, Negev Highlands, Israel. Atmos. Res. 2000, 55, 257–270. [Google Scholar] [CrossRef]
- Baier, W. Studies on dew formation under semi-arid conditions. Agr. Meteorol. 1966, 3, 103–112. [Google Scholar] [CrossRef]
- Editorial Committee of Chinese Flora of Chinese Academy of Sciences. Chinese Flora Volume 50 Book 2; Science Press: Beijing, China, 1990. [Google Scholar]
- Feng, Q.; Cheng, G. Moisture distribution and movement in sandy lands of China. Acta Pedol. Sin. 1999, 36, 225–236. [Google Scholar]
- Gates, J.B.; Edmunds, W.M.; Darling, W.G.; Ma, J.; Pang, Z.; Young, A.A. Conceptual model of recharge to southeastern Badain Jaran Desert groundwater and lakes from environmental tracers. Appl. Geochem. 2008, 23, 3519–3534. [Google Scholar] [CrossRef]
- Wang, N.a.; Ning, K.; Li, Z.; Wang, Y.; Jia, P.; Ma, L. Holocene high lake-levels and pan-lake period on Badain Jaran Desert. Sci. China Earth Sci. 2016, 59, 1633–1641. [Google Scholar] [CrossRef]
- Zhang, X.; Wang, N.a.; Xie, Z.; Ma, X.; Huete, A. Water loss due to increasing planted vegetation over the Badain Jaran Desert, China. Remote Sens. 2018, 10, 1–21. [Google Scholar] [CrossRef]
- Liang, X.; Zhao, L.; Xu, X.; Niu, Z.; Wang, N.A. Plant phenological responses to the warm island effect in the lake group region of the Badain Jaran Desert, northwestern China. Ecol. Inform. 2020, 57, 101066. [Google Scholar] [CrossRef]
- Lin, D. Soil Science; China Forestry Publishing House: Beijing, China, 2002. [Google Scholar]
- Rollins, L.R. Movement of Soil Moisture under a Thermal Gradient. Ph.D. Thesis, Iowa State University, Ames, IA, USA, 1954. [Google Scholar]
- Jacobs, A.F.G.; Heusinkveld, B.G.; Berkowicz, S.M. Dew deposition and drying in a desert system: A simple simulation model. J. Arid Environ. 1999, 42, 211–222. [Google Scholar] [CrossRef]
- Huang, B.; Zhao, L.; Cheng, H.; Liang, X.; Wang, N. Characteristic of soil temperature variation in the Badain Jaran Desert hinterland. J. Desert Res. 2017, 37, 530–535. [Google Scholar] [CrossRef]
- Hu, W.; Wang, N.a.; Zhao, L.; Ning, K.; Zhang, X.; Sun, J. Water-heat exchange over a typical lake in Badain Jaran Desert, China. Prog. Geog. 2015, 34, 1061–1071. [Google Scholar] [CrossRef]
- Gu, W.; Chen, J.; Wang, J.; Zhao, X.; Xie, M.; Lu, J.; Seiler, K.P. Challenge from the appearance of vadose water within the surface layer of megadunes, Badain-jaran dune desert, Inner Mongolia. Adv. Water Sci. 2004, 15, 695–699. [Google Scholar]
- Wu, Y.; Wang, N.a.; Zhao, L.; Zhang, Z.; Chen, L.; Lu, Y.; Lü, X.; Chang, J. Hydrochemical characteristics and recharge sources of Lake Nuoertu in the Badain Jaran Desert. Sci. Bull. 2014, 59, 886–895. [Google Scholar] [CrossRef]
- Webster, A.G. On the angle of repose of wet sand. Proc. Natl. Acad. Sci. USA 1919, 5, 263–265. [Google Scholar] [CrossRef]
- Al-Hashemi, H.M.B.; Al-Amoudi, O.S.B. A review on the angle of repose of granular materials. Powder Technol. 2018, 330, 397–417. [Google Scholar] [CrossRef]
- Liu, J.; Wang, N.a.; Cheng, H.; Yang, W.; Guo, Z. Influencing factors of repose angle of sand dunes: An experiment. J. Desert Res. 2010, 30, 758–762. [Google Scholar]
- Fan, Z.; Qu, J.; Zhou, H. The relationship between sand particle internal friction angle and particle size, water content and slope angle. J. Desert Res. 2015, 35, 301–305. [Google Scholar] [CrossRef]
- Wang, H.; Shi, D.; Wang, W. A modification theory for the existing theory of water content and angle of repose. Phys. Eng. 2019, 29, 104–120. [Google Scholar] [CrossRef]
- Bisal, F.; Hsieh, J. Influence of moisture on erodibility of soil by wind. Soil Sci. 1966, 102, 143–146. [Google Scholar] [CrossRef]
- Chen, W.; Dong, Z.; Li, Z.; Yang, Z. Wind tunnel test of the inffuence of soil moisture on erodibility of loessial sandy loam soil by wind. J. Arid Environ. 1996, 34, 391–402. [Google Scholar] [CrossRef]
- Bao, W. Analysis of the effects of sand moisture on the threshold wind velocity. J. Desert Res. 1996, 16, 316–319. [Google Scholar]
- Fécan, F.; Marticorena, B.; Bergametti, G. Parametrization of the increase of the aeolian erosion threshold wind friction velocity due to soil moisture for arid and semi-arid areas. Ann. Geophys. 1998, 17, 149–157. [Google Scholar] [CrossRef]
- Kocurek, G.; Fielder, G. Adhesion structures. J. Sediment. Res. 1982, 52, 1229–1241. [Google Scholar] [CrossRef]
- Hansen, E.C.; Bodenbender, B.E.; Johnson, B.G.; Kito, K.; Davis, A.K.; Havholm, K.G.; Peaslee, G.F. The Origin of Dark Sand in Eolian Deposits along the Southeastern Shore of Lake Michigan. J. Geol. 2011, 119, 487–503. [Google Scholar] [CrossRef]
- Diniega, S.; Glasner, K.; Byrne, S. Long-time evolution of models of aeolian sand dune fields: Influence of dune formation and collision. Geomorphology 2010, 121, 55–68. [Google Scholar] [CrossRef]
Publisher’s Note: MDPI stays neutral with regard to jurisdictional claims in published maps and institutional affiliations. |
© 2021 by the authors. Licensee MDPI, Basel, Switzerland. This article is an open access article distributed under the terms and conditions of the Creative Commons Attribution (CC BY) license (https://creativecommons.org/licenses/by/4.0/).