Article

A Performance Prediction Method Based on Sliding Window Grey Neural Network for Inertial Platform

School of Automation Science and Electrical Engineering, Beijing University of Aeronautics and Astronautics, Beijing 100191, China
*
Author to whom correspondence should be addressed.
Remote Sens. 2021, 13(23), 4864; https://doi.org/10.3390/rs13234864
Submission received: 13 October 2021 / Revised: 15 November 2021 / Accepted: 18 November 2021 / Published: 30 November 2021
(This article belongs to the Section AI Remote Sensing)

Abstract

:
An inertial platform is the key component of a remote sensing system. During service, the performance of the inertial platform appears in degradation and accuracy reduction. For better maintenance, the inertial platform system is checked and maintained regularly. The performance change of an inertial platform can be evaluated by detection data. Due to limitations of detection conditions, inertial platform detection data belongs to small sample data. In this paper, in order to predict the performance of an inertial platform, a prediction model for an inertial platform is designed combining a sliding window, grey theory and neural network (SGMNN). The experiments results show that the SGMNN model performs best in predicting the inertial platform drift rate compared with other prediction models.

1. Introduction

An inertial platform is the core component of a remote sensing system, which has been widely used in military and civil equipment such as aircraft, spacecraft and satellite [1,2,3]. Before service, an inertial platform is stored for a long time. Usually, affected by the environment and maintenance management factors, the performance of an inertial platform decreases with the extension of storage time [4,5]. The accurate prediction of the performance of an inertial platform system can provide an important theoretical basis for the preparation of backup parts, the maintenance of state and the formulation of various maintenance strategies [6,7]. Figure 1 shows the inertial platform.
In research of remaining useful life (RUL) prediction and performance prediction of an inertial platform, it is difficult to establish an accurate physical model due to the complexity of an inertial platform. At present, RUL prediction is mainly based on the monitoring degradation data of the inertial platform, including a random process model, a regression model and an artificial intelligence model. Baokun Yang [8] proposed the prediction method of storage reliability of an inertial platform based on small sample data and introduced the prediction method of least squares support vector machine to predict the storage reliability of an inertial platform. Xunyuan Yin [9] established the error evaluation model of an inertial navigation system, achieved performance prediction by support vector machines (SVM) and improved prediction accuracy by adding particle swarm optimization (PSO). Yue Zhang [10] analyzed the error model of an inertial navigation system and proposed the performance evaluation and accuracy prediction method based on PSO-SVM. Hongtao Dang [11] constructed a navigation error model and least squares support vector regression (LS-SVR) for integrated modeling of a platform inertial navigation system, constructed an integrated performance prediction model and realized integrated performance prediction of inertial system. Mariusz Specht [12] combined a wavelet transform with SVM to predict the error of an inertial navigation system, where the wavelet transform has multiresolution characteristics, and SVM has characteristics of nonlinear fit. Wei Sun [13] proposed a random error prediction method of MEMS gyroscope based on grey theory and a radial basis function (RBF) neural network. Xiaowen Cai [14] applied the empirical mode decomposition (EMD) model to decompose the system part and random part of fiber optic gyroscope (FOG) drift data. The grey model with the ARMA model, ARGM (1,1) model is proposed to predict the partial error of a fiber optic gyroscope (FOG) drift rate system. Chenglong Dai [15] proposed an automatic selection CoG-ARGM prediction model based on cooperative game theory for long-term prediction of the life of hemispherical long time. Xudong Gao [16] proposed an offline estimation and online update model based on a maximum likelihood algorithm and Bayesian theory to realize online adaptive prediction of gyro residual life in an inertial navigation system. Daidai Chen [17] proposed an initial alignment performance evaluation model of an inertial navigation system based on a Bayesian smoothing algorithm to evaluate and predict the performance of an inertial navigation system. Pavlenko Ivan [18] applied an artificial neural network (ANN) and multiparametric quasi-linear regression to assess the technological parameters’ influence on the power characteristics for the cutting process, which could optimize the structure of machining cycles. Baressi Segota, Sandi [19] proposed the evolutionary computation algorithms based on artificial intelligence theory to optimize the paths of the robotic manipulator and lower the joint torques, which could lower the energy and increase the longevity of a robotic manipulator.
It can be observed that in the research of inertial platform performance prediction, researchers regard the performance prediction of inertial platform system as a small sample problem. The support vector machine method can solve the nonlinear regression problem of small samples. However, overfitting occurs for sequences with unobvious nonlinearity, and the method of support vector regression has a large amount of calculation. The grey model can solve the small sample prediction problem, but it is difficult to describe nonlinear information. The Bayesian method requires more prior knowledge. At the same time, equipment performance degradation is a gradual process, and different historical time performance has different influence on the current performance. The above methods directly use the whole sequence without considering the situation that the far performance index has little influence on the current situation.
Drift rate is the main factor affecting the accuracy of an inertial platform, which can directly reflect the system performance. Periodic examination is generally applied to acquaint the performance of an inertial platform during storage [20]. Only a set of drift rate could be obtained at each examination, so the drift rate belongs to small sample data. In this paper, in order to solve the problem that it is difficult to establish an accurate prediction model for small samples, the grey cumulative generation operation (AGO) of grey theory was applied as a preprocessing method to reduce the randomness of original data [21,22]. The neural network has strong nonlinear fitting ability and can map any complex nonlinear relationship. It has the advantages of strong fault tolerance, fast prediction speed and multistep prediction [23,24]. At the same time, the change of drift rate is cumulative, and the drift rate has different influence on the future drift rate at different historical times. The sliding window is added to improve the prediction accuracy [25,26].
The main contribution of this paper is that in view of the problem that it is difficult to establish an accurate prediction model for small sample data of inertial platform drift rate, the sliding window, grey model and neural network are combined to establish a comprehensive prediction model (SGMNN). The initial prediction sequence is obtained by modeling small sample data of the inertial platform drift rate with different improved grey models. The accuracy of grey model prediction is improved by adding sliding windows. The grey prediction sequence is input into the neural network to improve the prediction effect. The proposed prediction model can solve the problem of analyzing small sample data of the inertial platform drift rate, which fits nonlinear drift rate series. At the same time, considering the correlation degree of future time drift rate to different historical time drift rate, the sliding window technology is added to further improve the generalization ability and model prediction accuracy. Compared with similar small sample prediction models, it has the advantages of high prediction accuracy, strong generalization ability and low computational resource consumption.

2. Materials and Methods

2.1. Description of Research Object

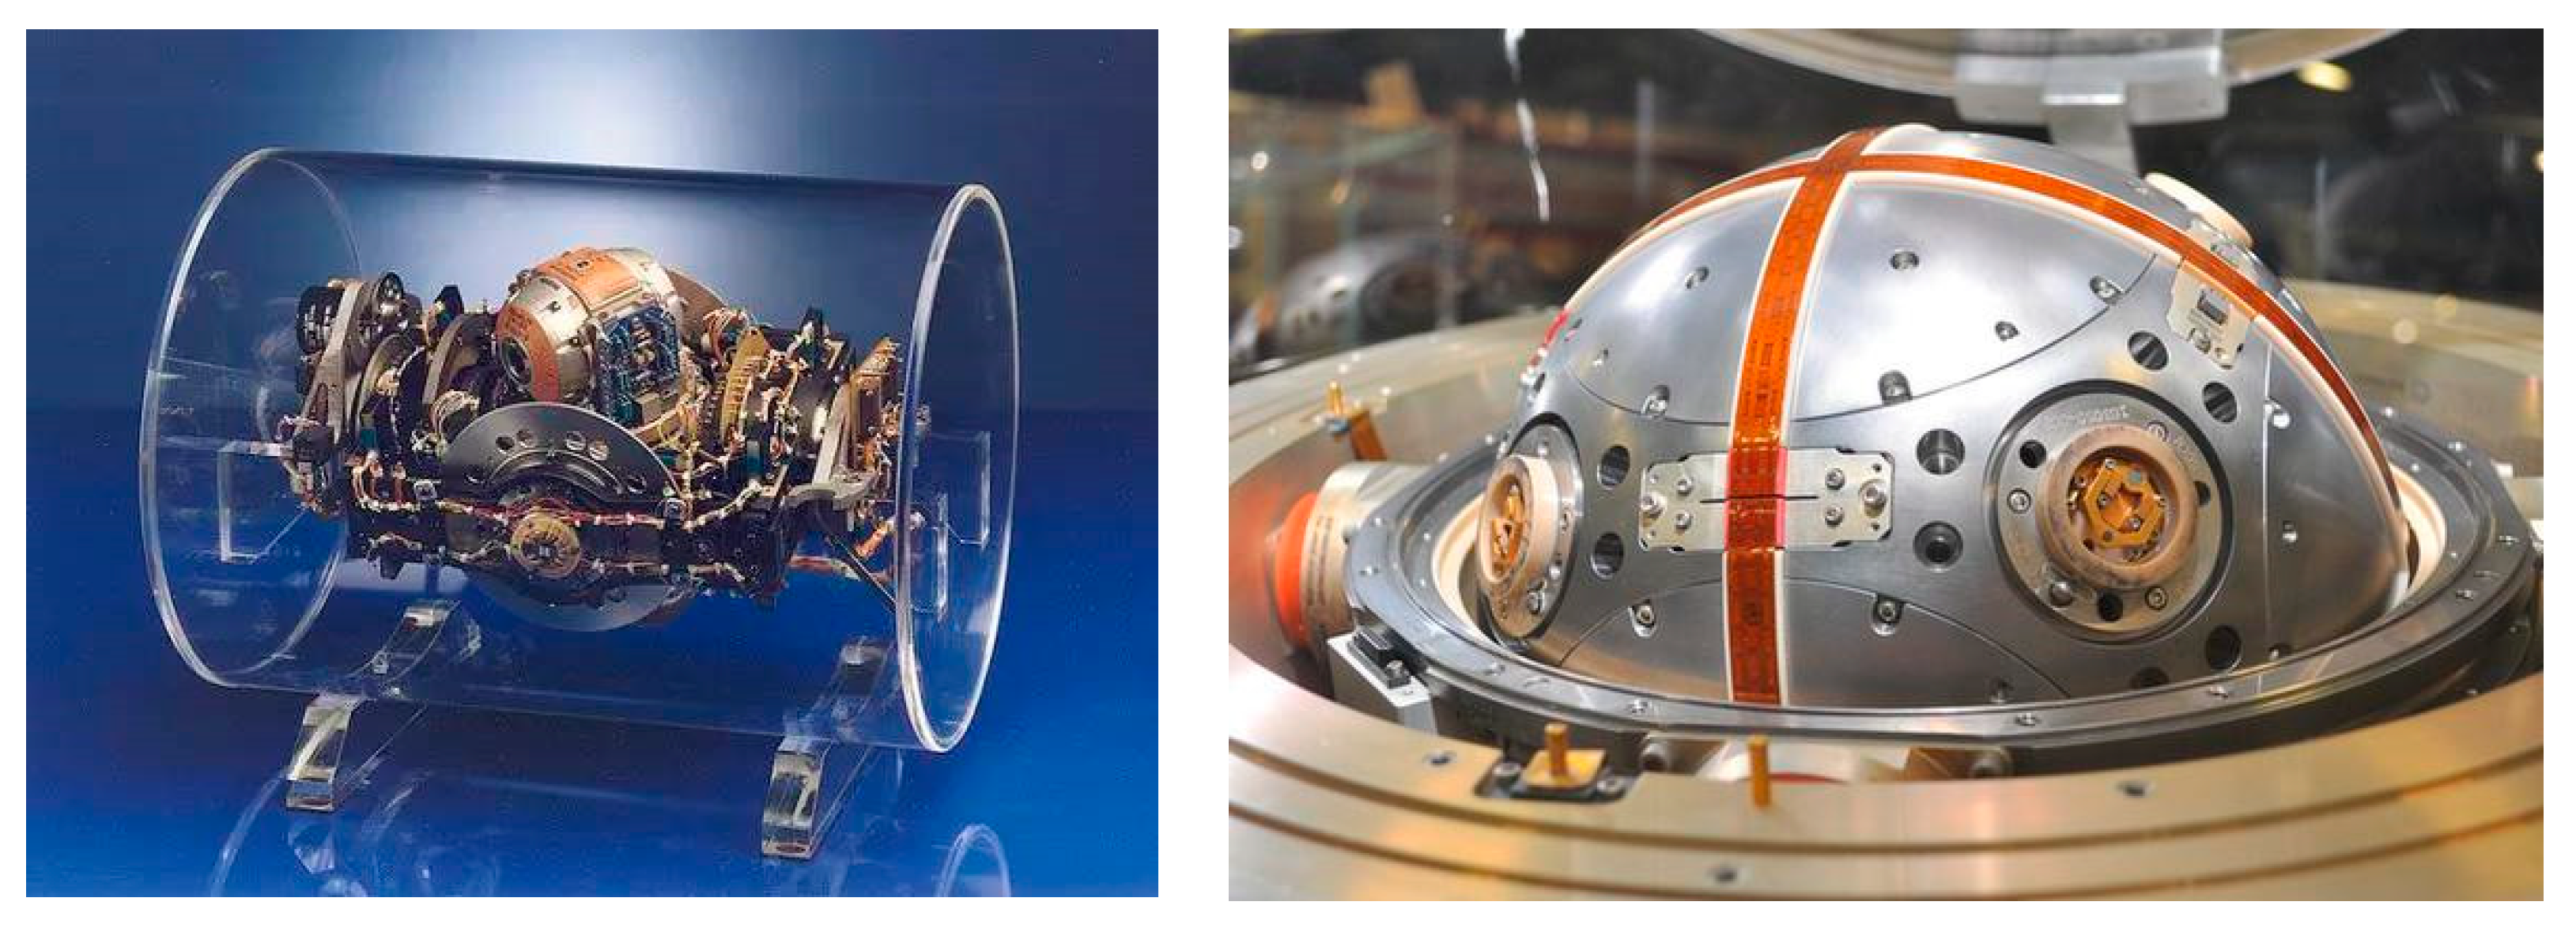
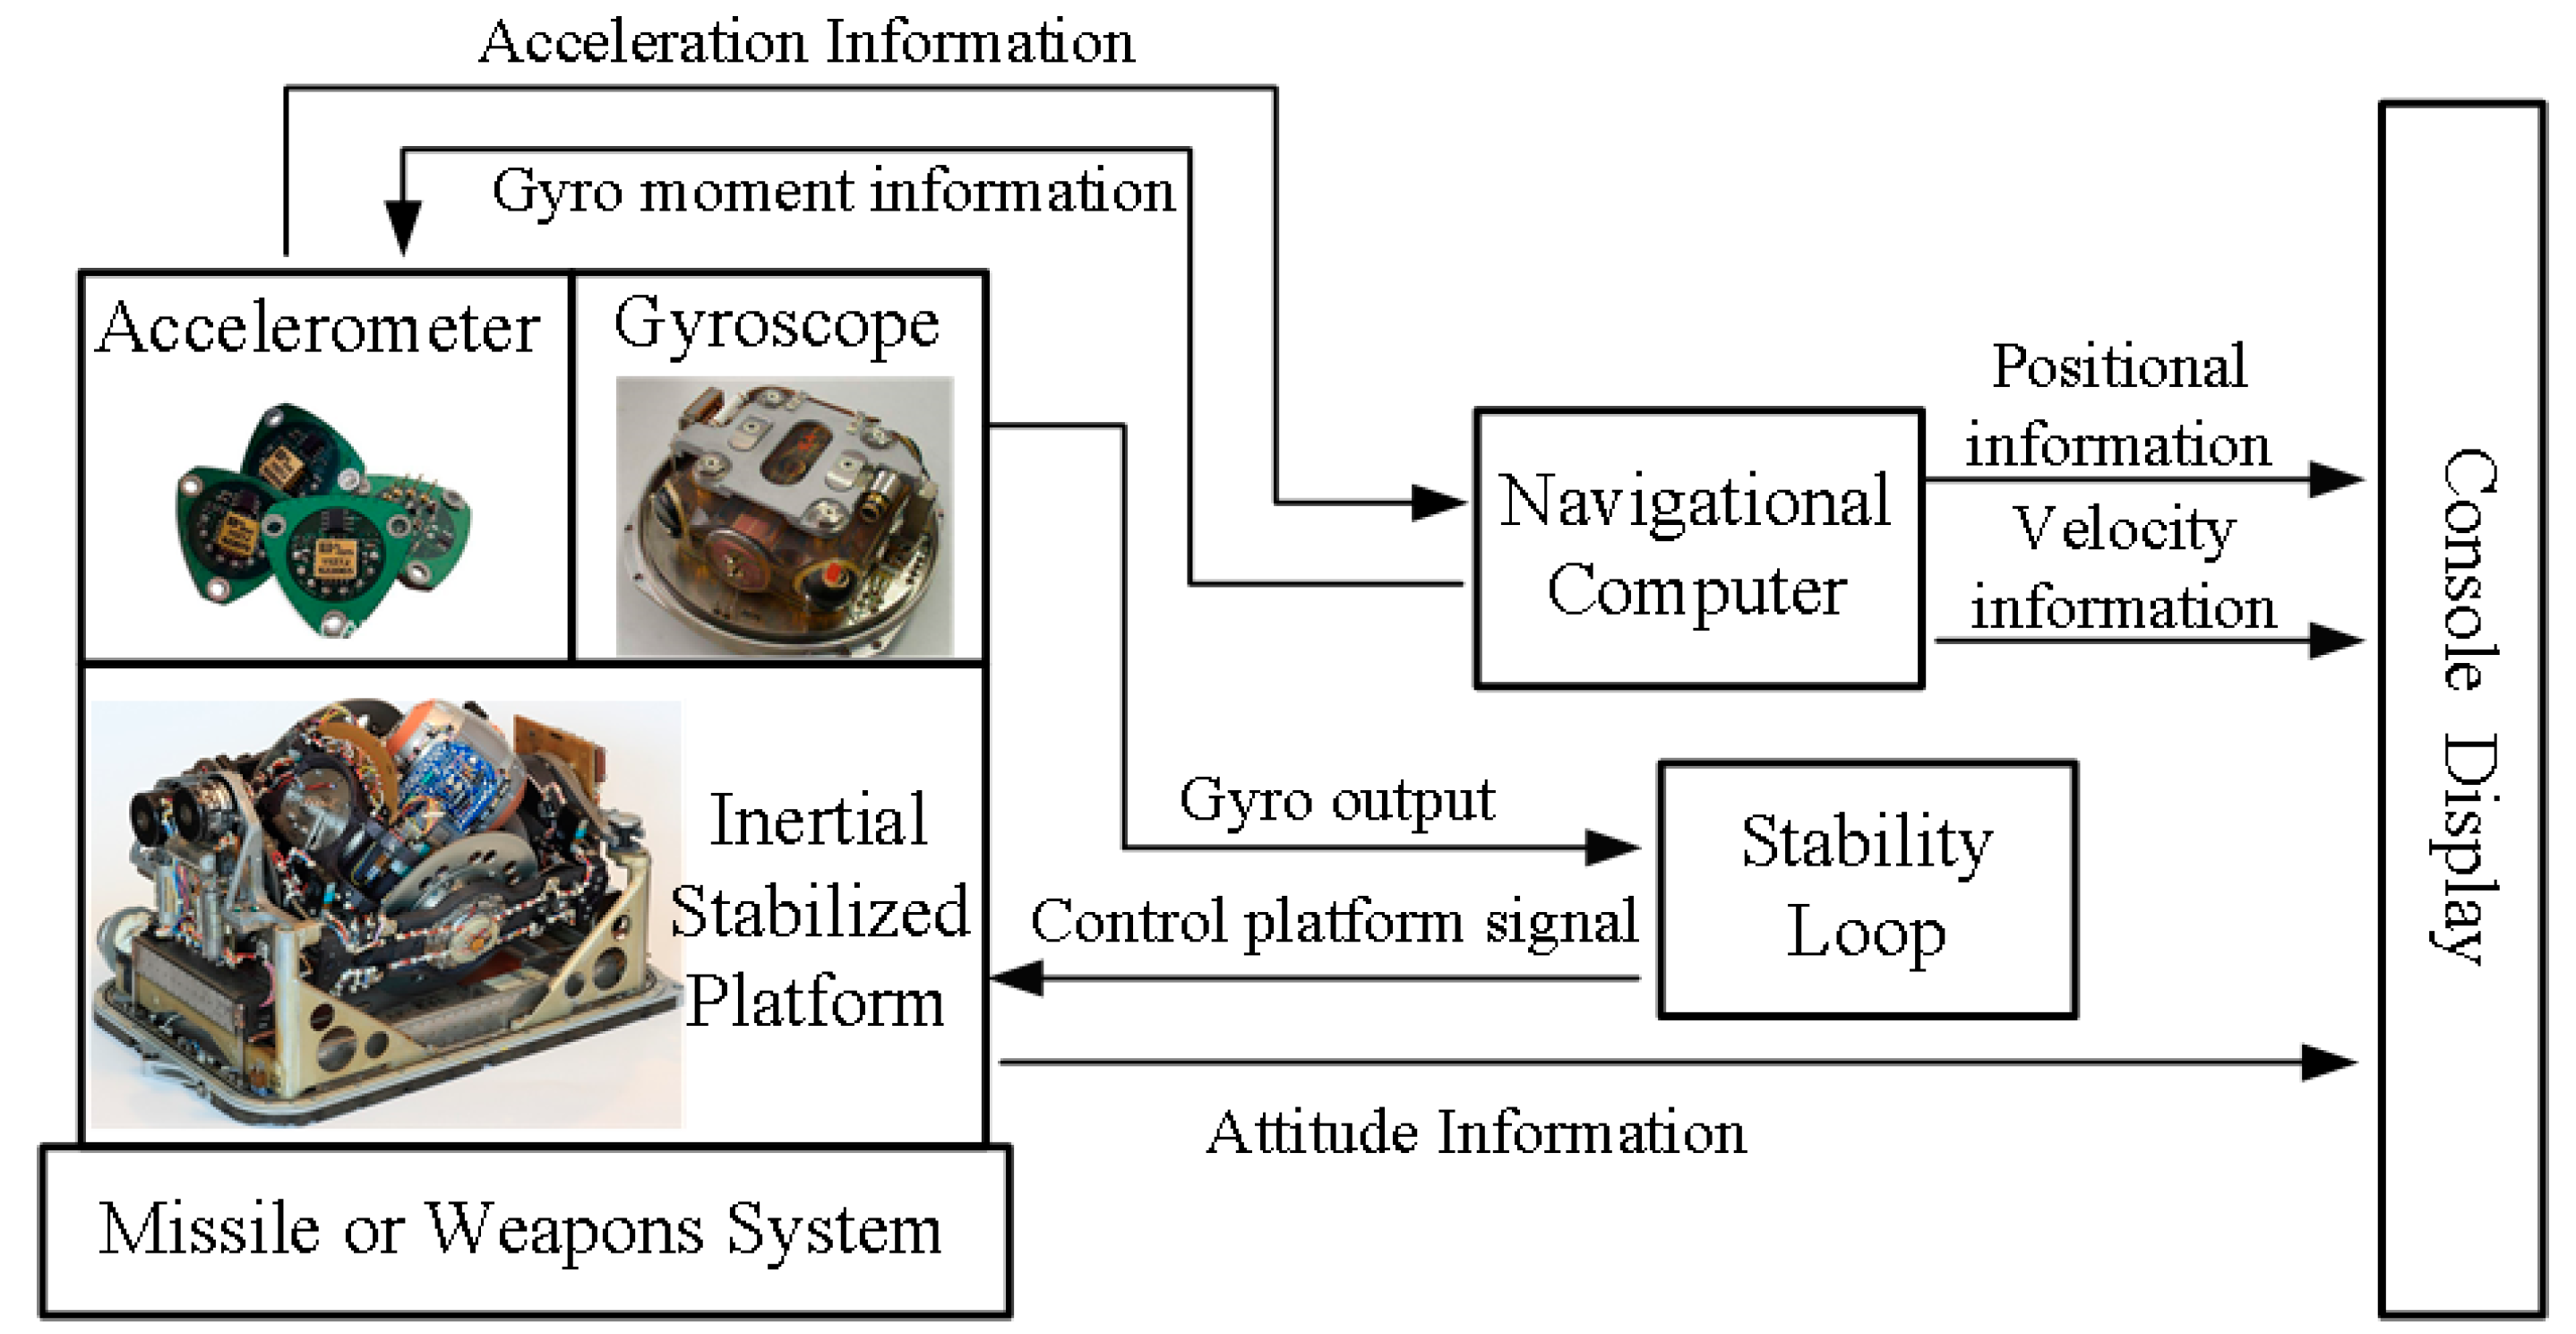
Inertial platform is the core component of a remote sensing system, which is composed of platform, gyroscope, frame, torque motor and other parts. The inertial coordinate system benchmark is provided by the platform stability system [3,27]. The structure diagram of the platform inertial navigation system is shown in Figure 2.
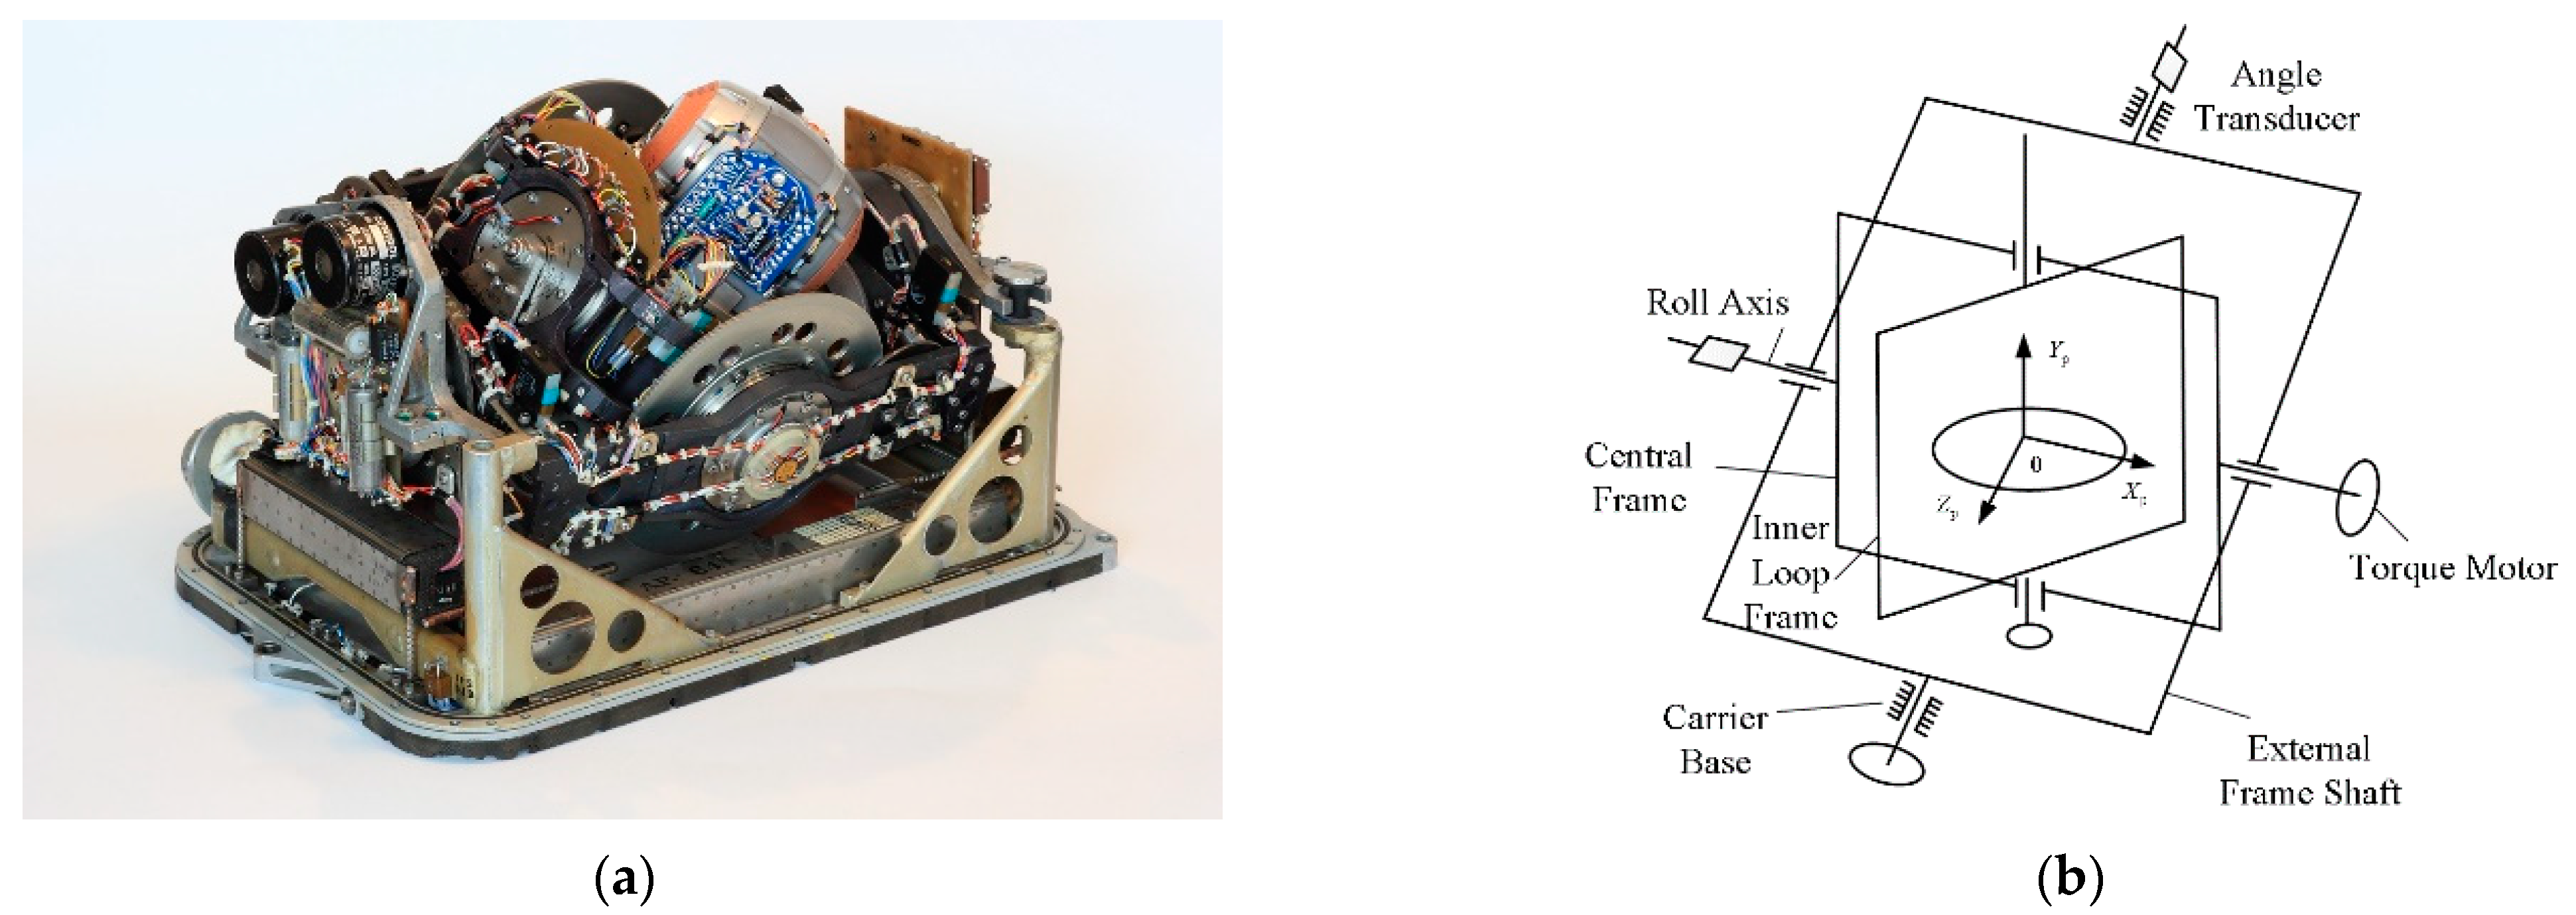
The inertial platform is shown in Figure 3a, and its frame structure is shown in Figure 3b, which is composed of an angle transducer, a roll axis, a central frame, an inner loop frame, a torque motor, a carrier base and an external frame shaft. The inertial platform can continuously turn around the external frame shaft, the inner loop frame and the central frame. These rotations will be detected by the gyroscope and converted into electrical signals. Through signal processing, the torque in the opposite direction of the interference torque will be generated by the torque electricity, so as to stabilize the inertial platform in the inertial space [3,28].
The inertial platform is on long-term storage before service. Usually, affected by environmental factors and maintenance management factors, the performance of inertial platform decreases with the extension of service time, which results in abnormal function, low precision, and increased failure rate.
The performance failure of an inertial platform system mainly refers to the lack of measurement accuracy, and the error is the main factor affecting the accuracy. Errors of an inertial platform during storage are calculated by periodic detection, and the performance of an inertial platform is reflected by error. Error sources of an inertial platform system include zero bias of the accelerometer, gyro drift rate, scale factor error, installation error, initial posture of the platform, error of the initial position, error of the benchmark measurement equipment itself and so on [29]. Among these errors, uncompensated platform drift error is the main factor determining accuracy error. Gyro drift is a slow change in the initial zero or reference and accumulates along with time. Gyro drift affects the accuracy of the inertial platform system seriously, which causes abnormal function and system failure. According to the different properties of drift, it can be divided into constant drift and random drift [14]. Constant drift is characterized by the mean value of multiple measurements under the same conditions. Random drift is related to environmental factors such as temperature and vibration, which reflects the uncertainty of drift error.
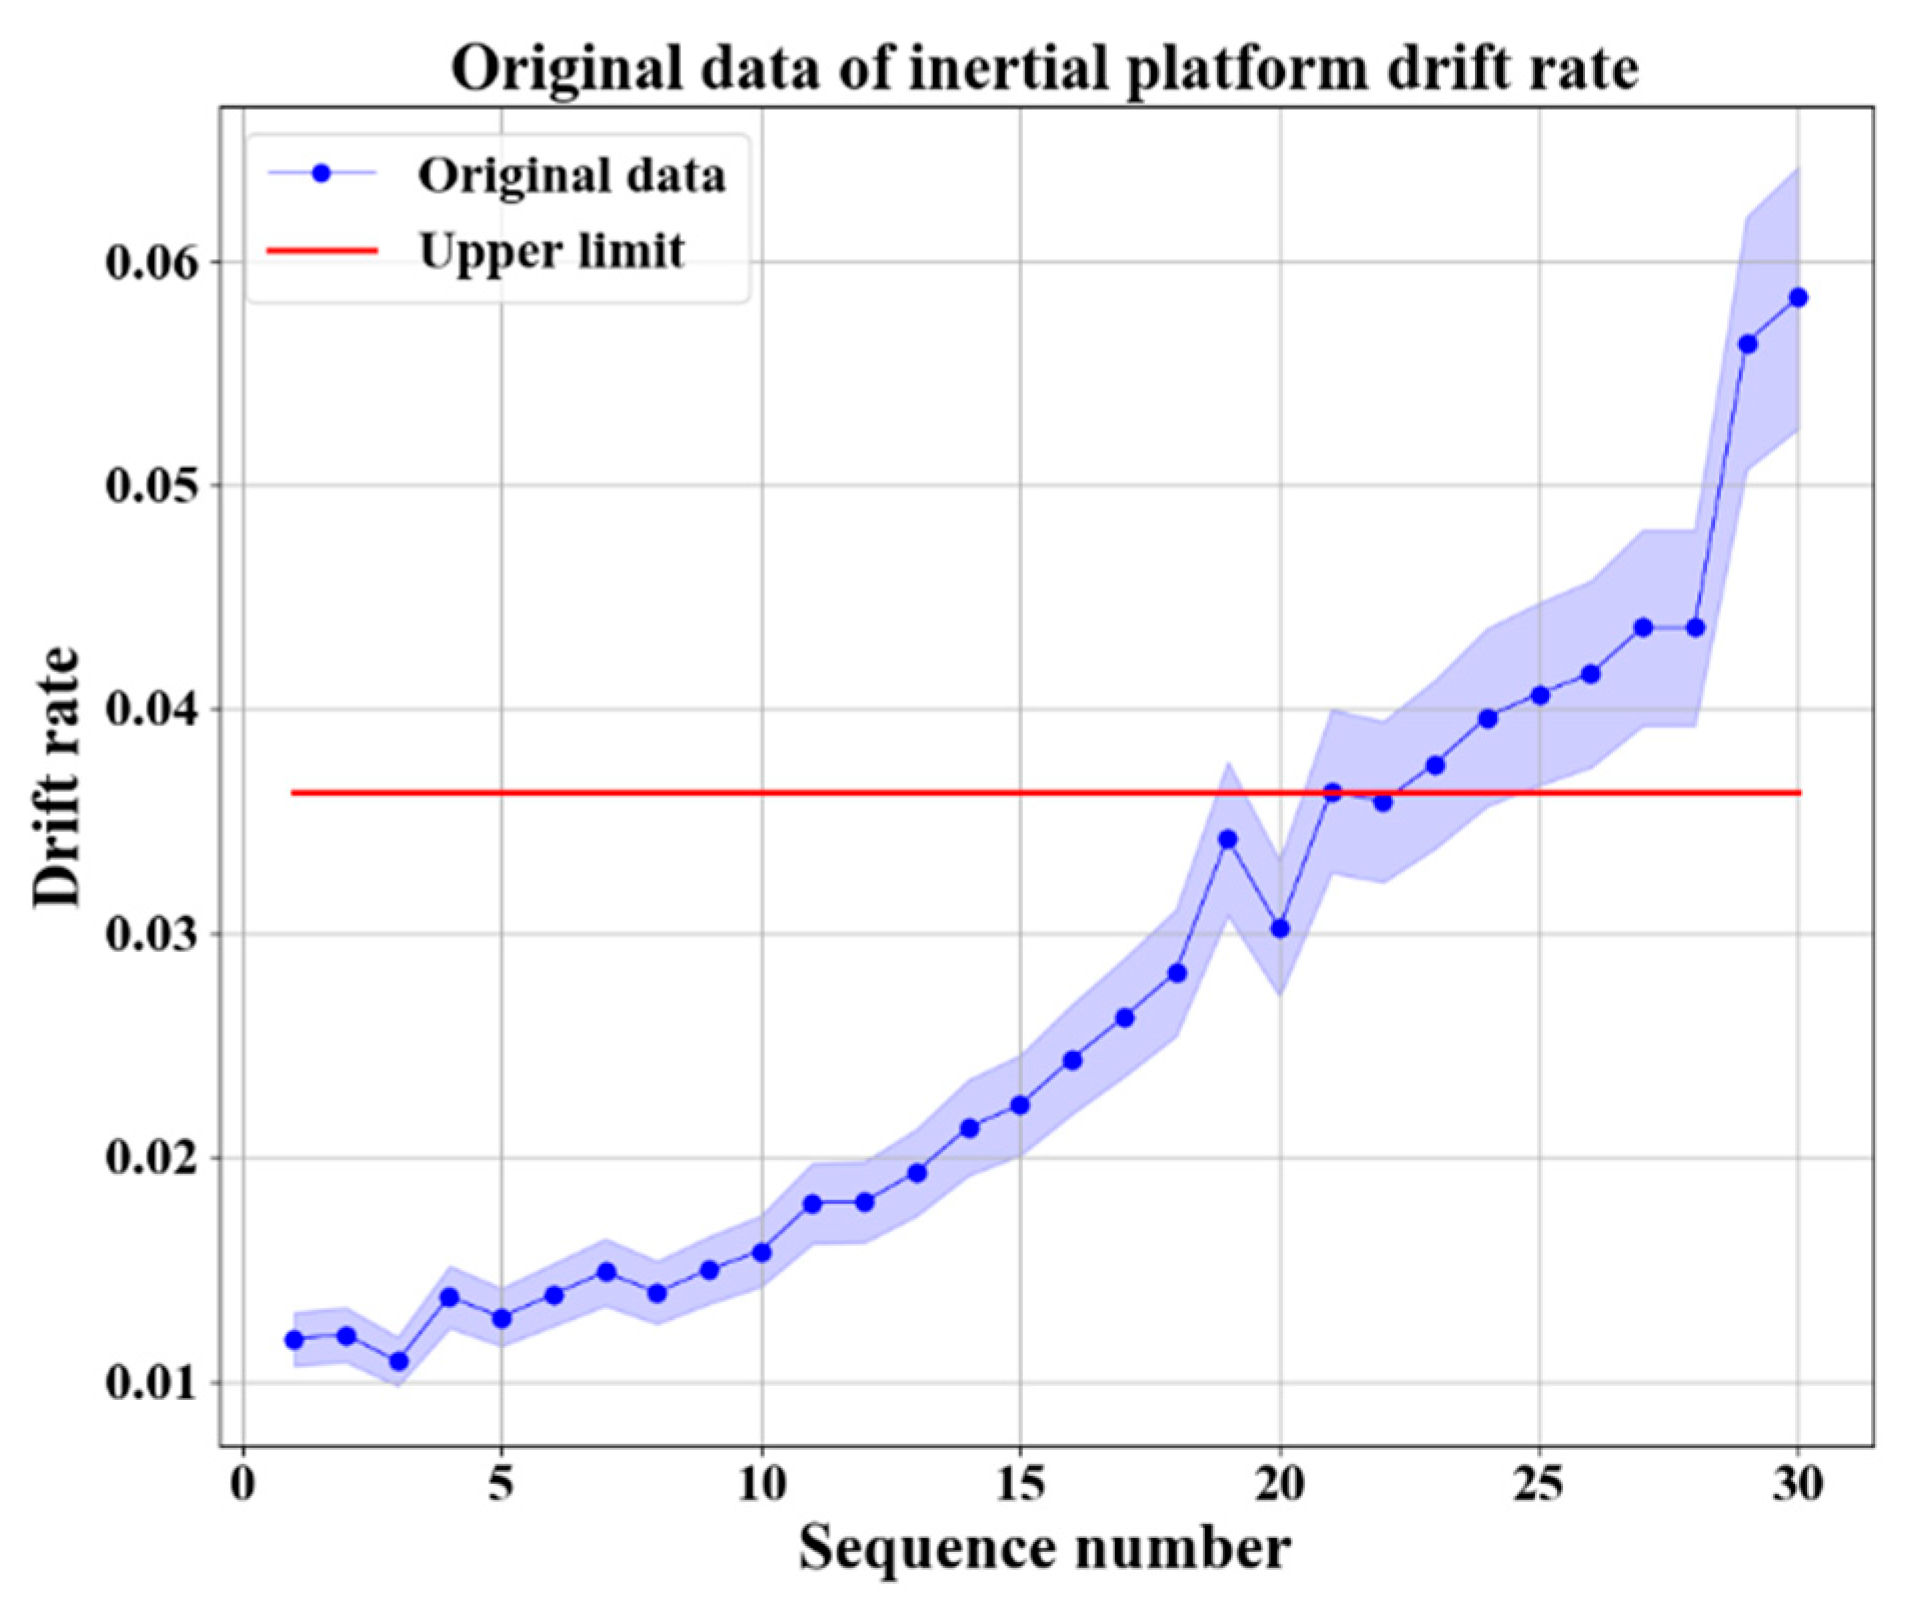
Therefore, the drift rate of an inertial platform can be directly used as a characteristic parameter to measure the health status of the system. In the regular examination of an inertial platform, the drift error is calculated with each inspection. Because the inertial platform is very expensive and has limited life, its periodic examination is limited by many factors, which causes the sample size of drift rate data is very small. The analysis and prediction of drift rate can directly reflect the performance change trend of an inertial platform. When the drift rate is higher than a certain value, the accuracy of the inertial platform will not meet the use requirements, so the inertial platform needs to be repaired or retired.

2.2. The Prediction Model Based on Slide Window and Grey Neural Network

Due to the drift rate data is very small, in order to obtain more information, it is necessary to combine multiple models. In this paper, the grey model is applied to obtain trend information from small sample data [19,22]. The neural network model is applied to obtain nonlinear information. Considering the different influence of future drift rate and historical drift rate, sliding windows are added to improve the prediction accuracy furtherly.
The grey neural network includes four fusion types: series type, parallel type, embedded type and hybrid type [
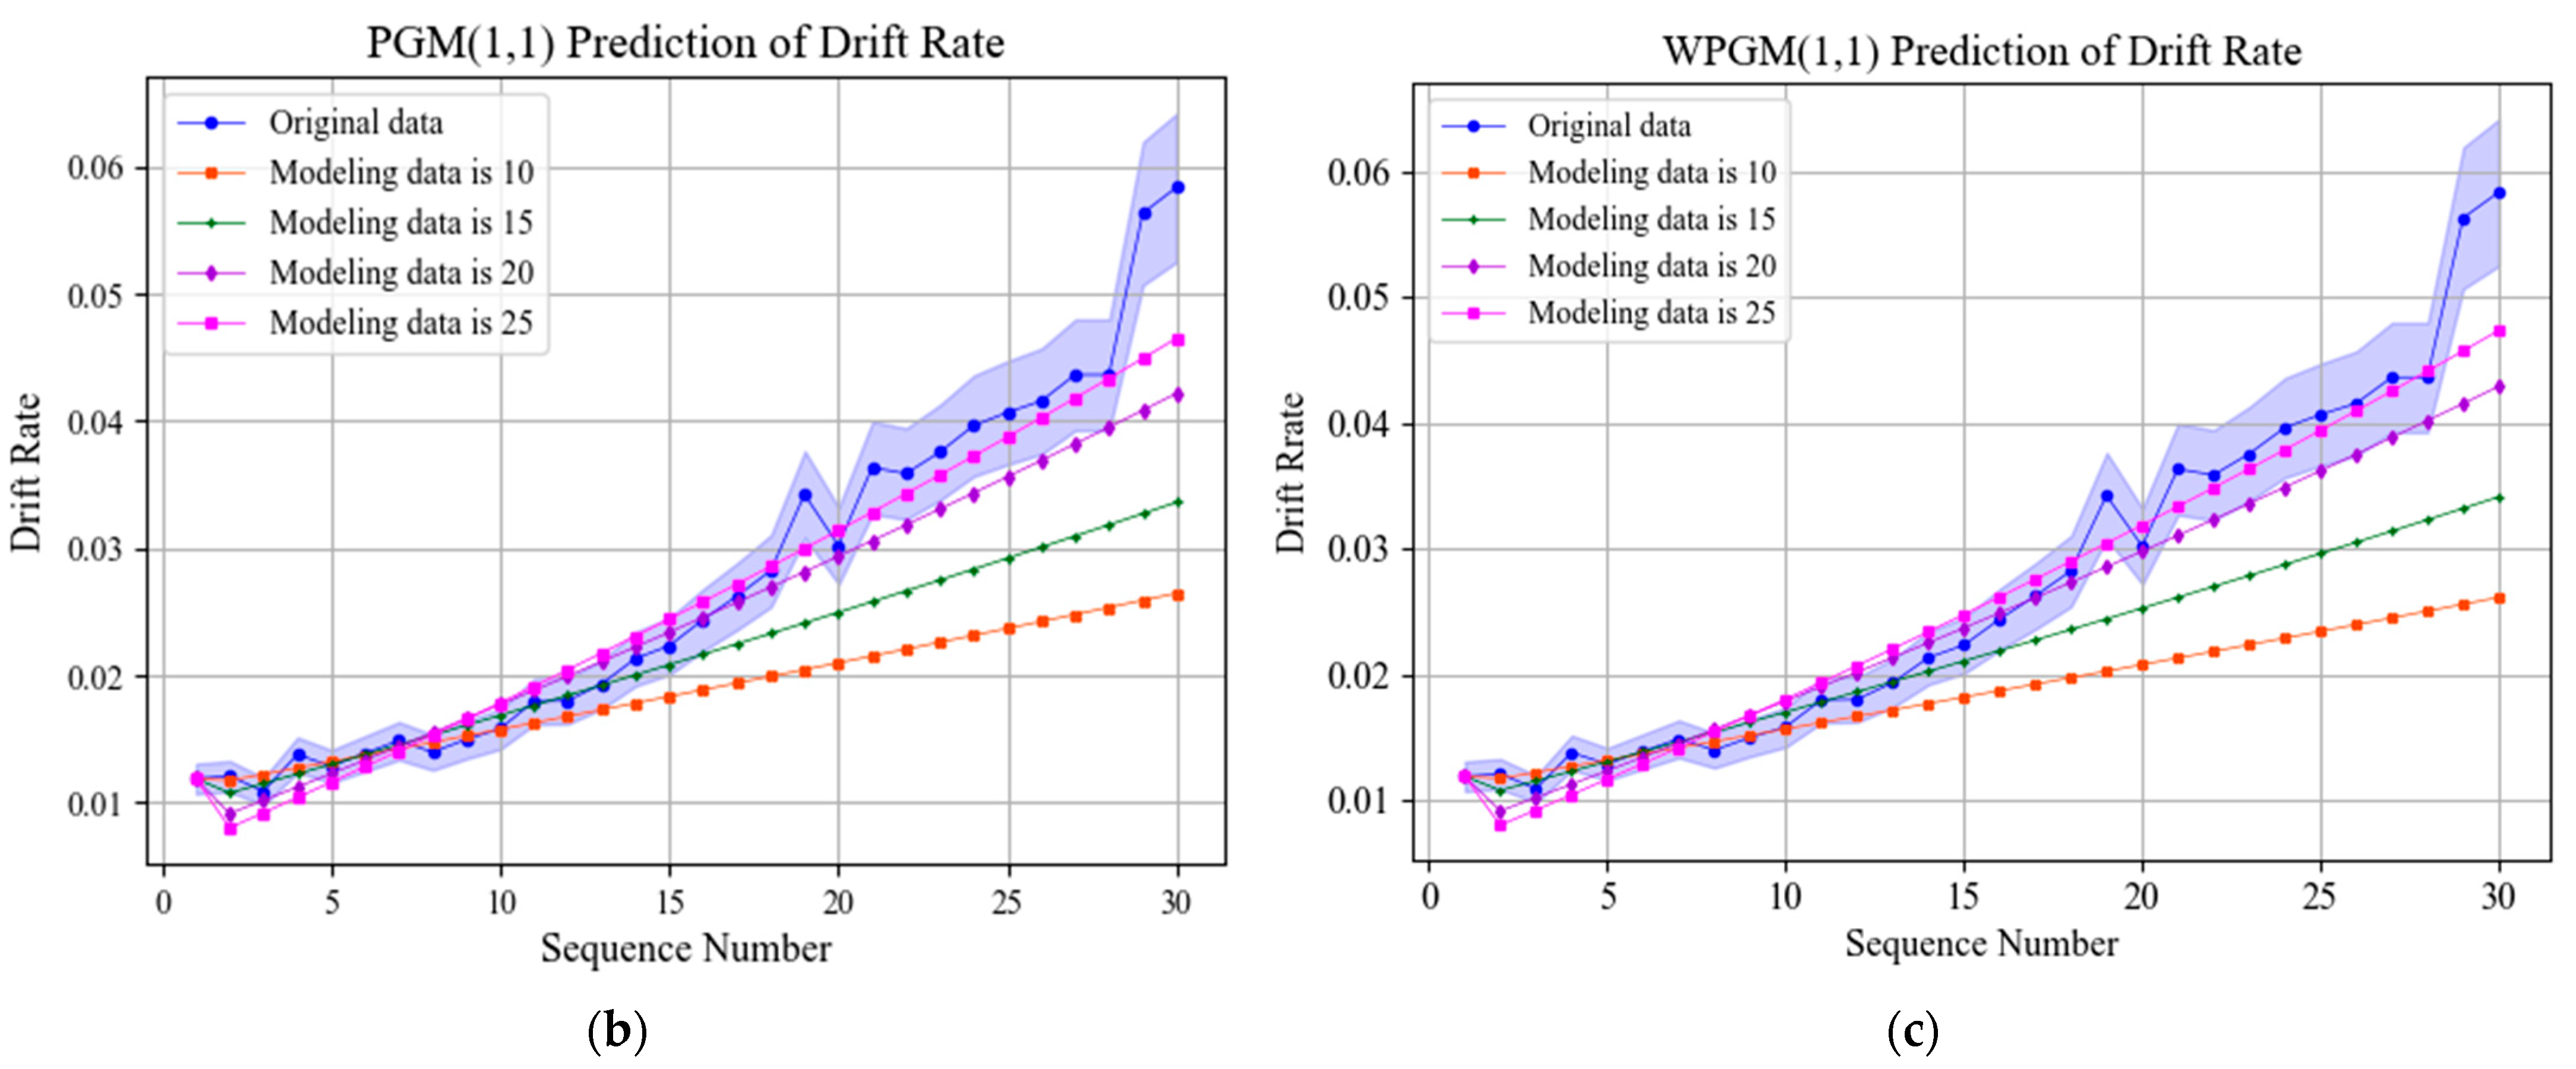
30]. In this paper, the series type of a grey neural network is applied. Due to the limitations of the ordinary grey model (GM), relevant researchers proposed the correction methods of parameters in the grey model. Two typical improved grey models are unbiased grey model (PGM) [31,32] and weighted unbiased grey model (WPGM) [33,
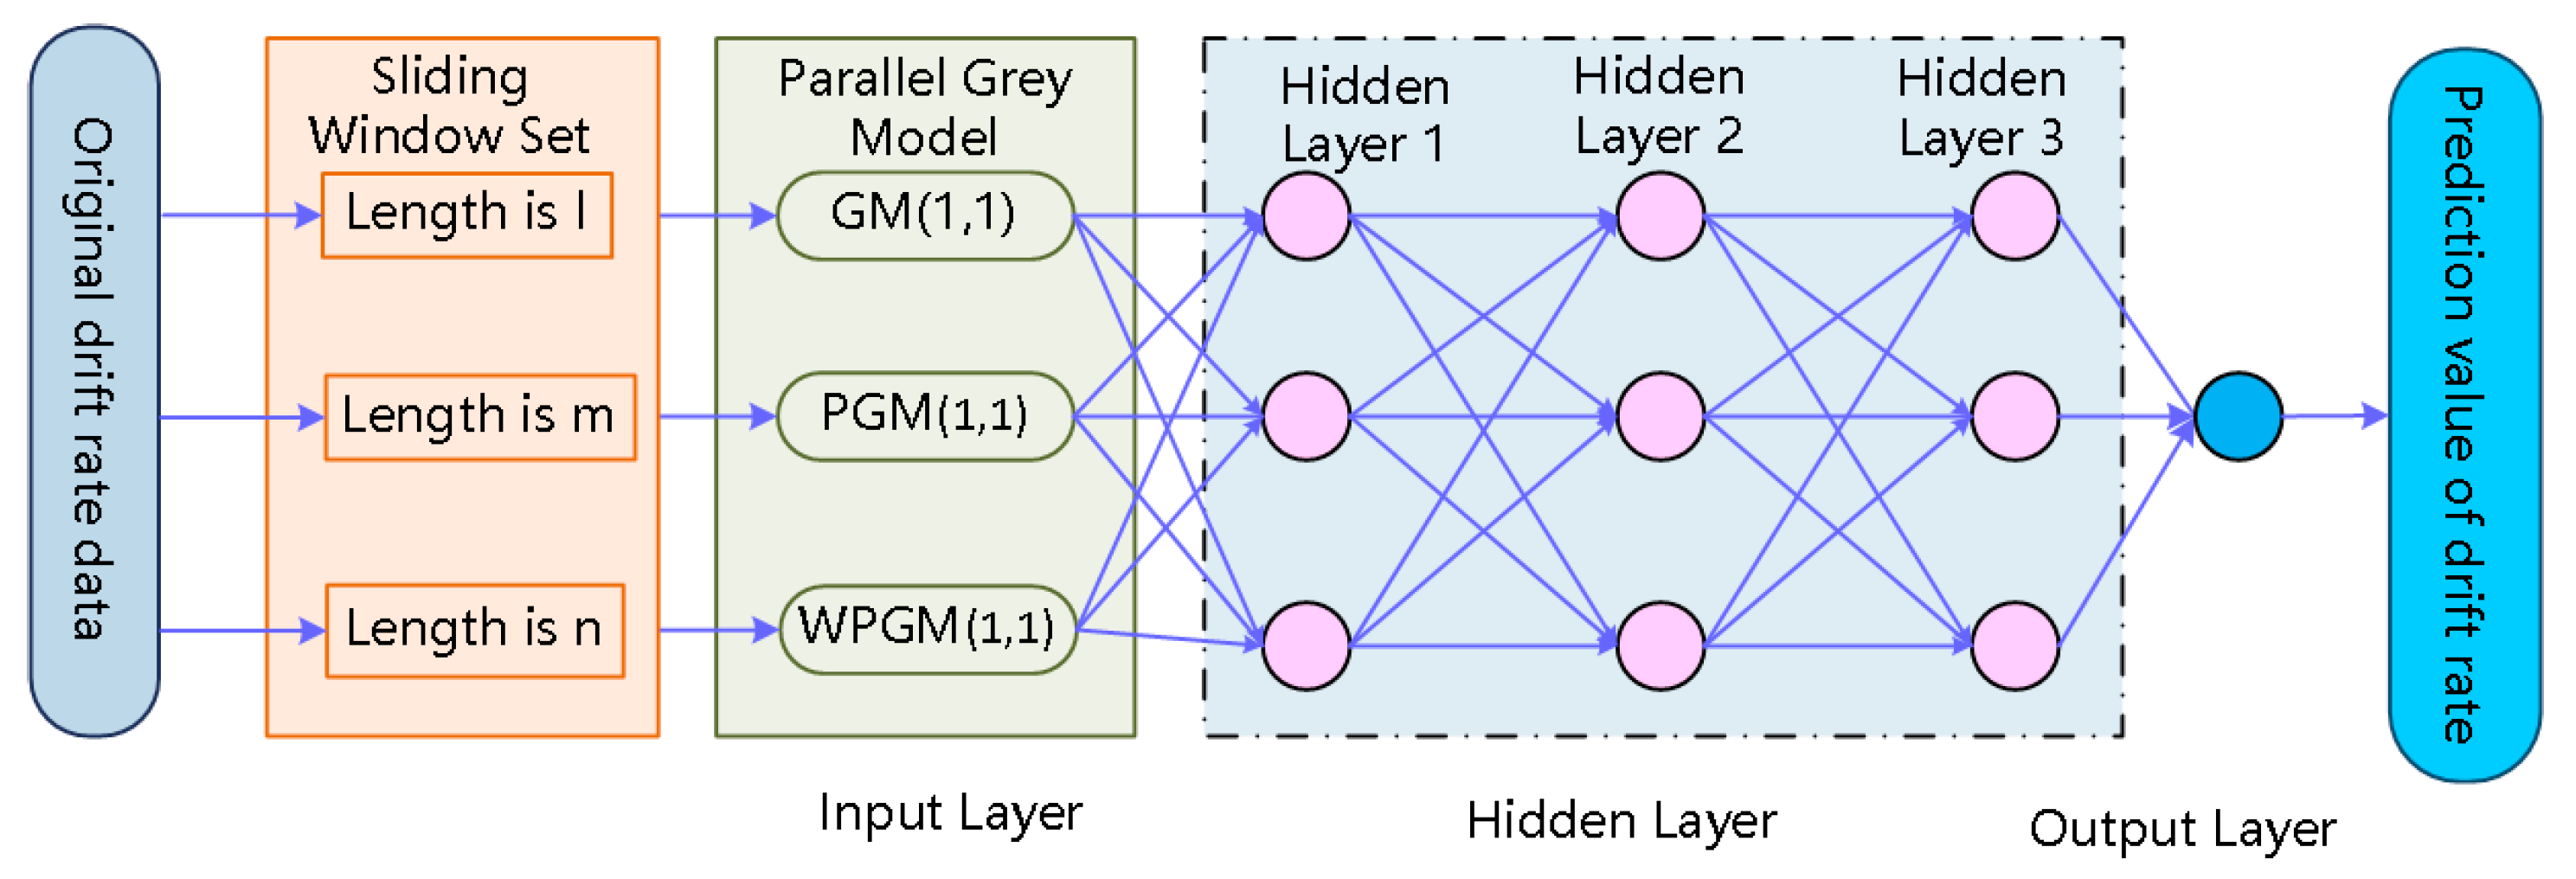
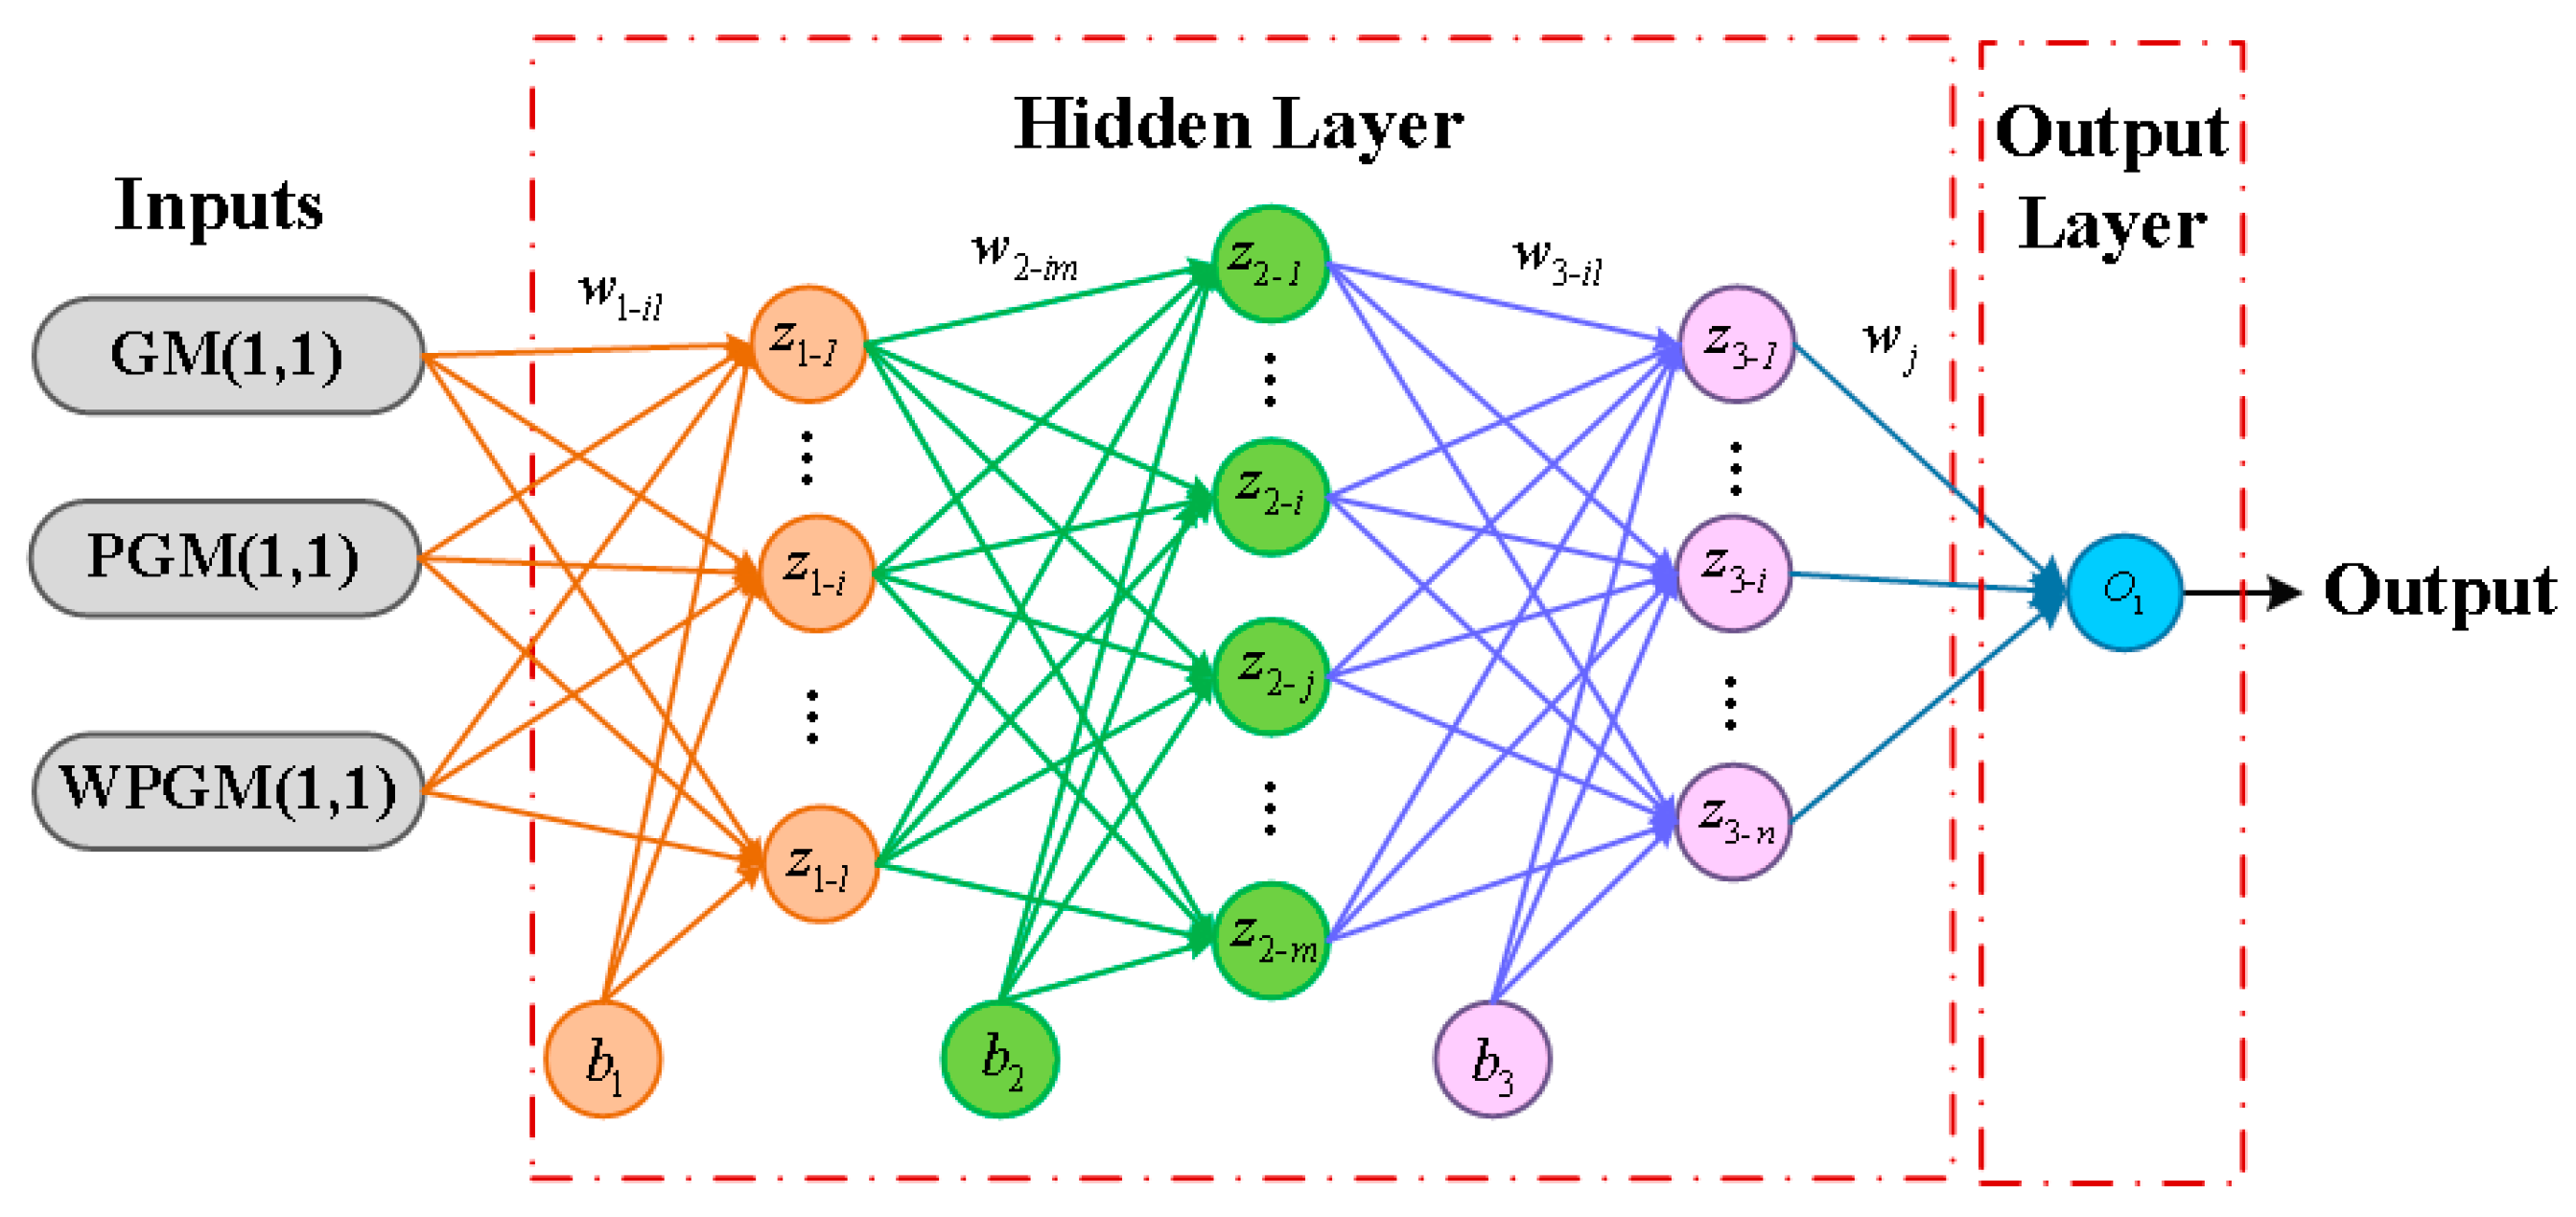
34]. In this paper, the grey model (GM), unbiased grey model (PGM) and weighted unbiased grey model (WPGM) are connected with a feedforward neural network, and sliding windows are added, which form the combined prediction model of a sliding window grey neural network (SGMNN). The topology of SGMNN is shown as Figure 4. The outputs of three grey models are taken as the inputs of the neural network, and a three-layer neural network structure with two hidden layers is built to put out the prediction results of drift rate.
The prediction steps of the sliding window grey neural network are as follows:
Step 1.
Data inspection and processing
Calculate the series ratio of a sequence to determine whether the grey model can be applied for prediction. If the sequence doesn’t fit the model use conditions, the drift rate sequence should be adjusted. The drift rate sequence of the inertial platform is r ( 0 ) ( i ) , i = 1 , 2 , , n , where n is the sequence number. Calculate the series ratio as follows:
λ ( k ) = r ( 0 ) ( k 1 ) r ( 0 ) ( k ) , k = 2 , 3 , , n
When λ ( k ) should fall within the allowable range X = ( e 2 n + 1 , e 2 n + 2 ) , which verifies that the original sequence x ( 0 ) can be applied to the grey prediction model GM(1,1). Otherwise, it needs to do some necessary transformation processing to make the level ratio within the allowable range. The transformation method is to take appropriate constant c for translation, as shown in Formula (2).
y ( 0 ) ( k ) = x ( 0 ) ( k ) + c , k = 1 , 2 , , n
The series ratio of sequence x ( 0 ) ( k ) is
λ y ( k ) = y ( 0 ) ( k 1 ) y ( 0 ) ( k ) X , k = 2 , 3 , , n
Step 2.
Build the sliding windows
The fixed length sliding window is applied [35]. The grey prediction model is constructed based on data in sliding window.
r s ( 0 ) = [ r ( 0 ) ( m - k ) , r ( 0 ) ( m - k + 1 ) , , r ( 0 ) ( m 1 ) ]
where m represents the moment in the drift rate series and k represents the length of the sliding window.
Step 3.
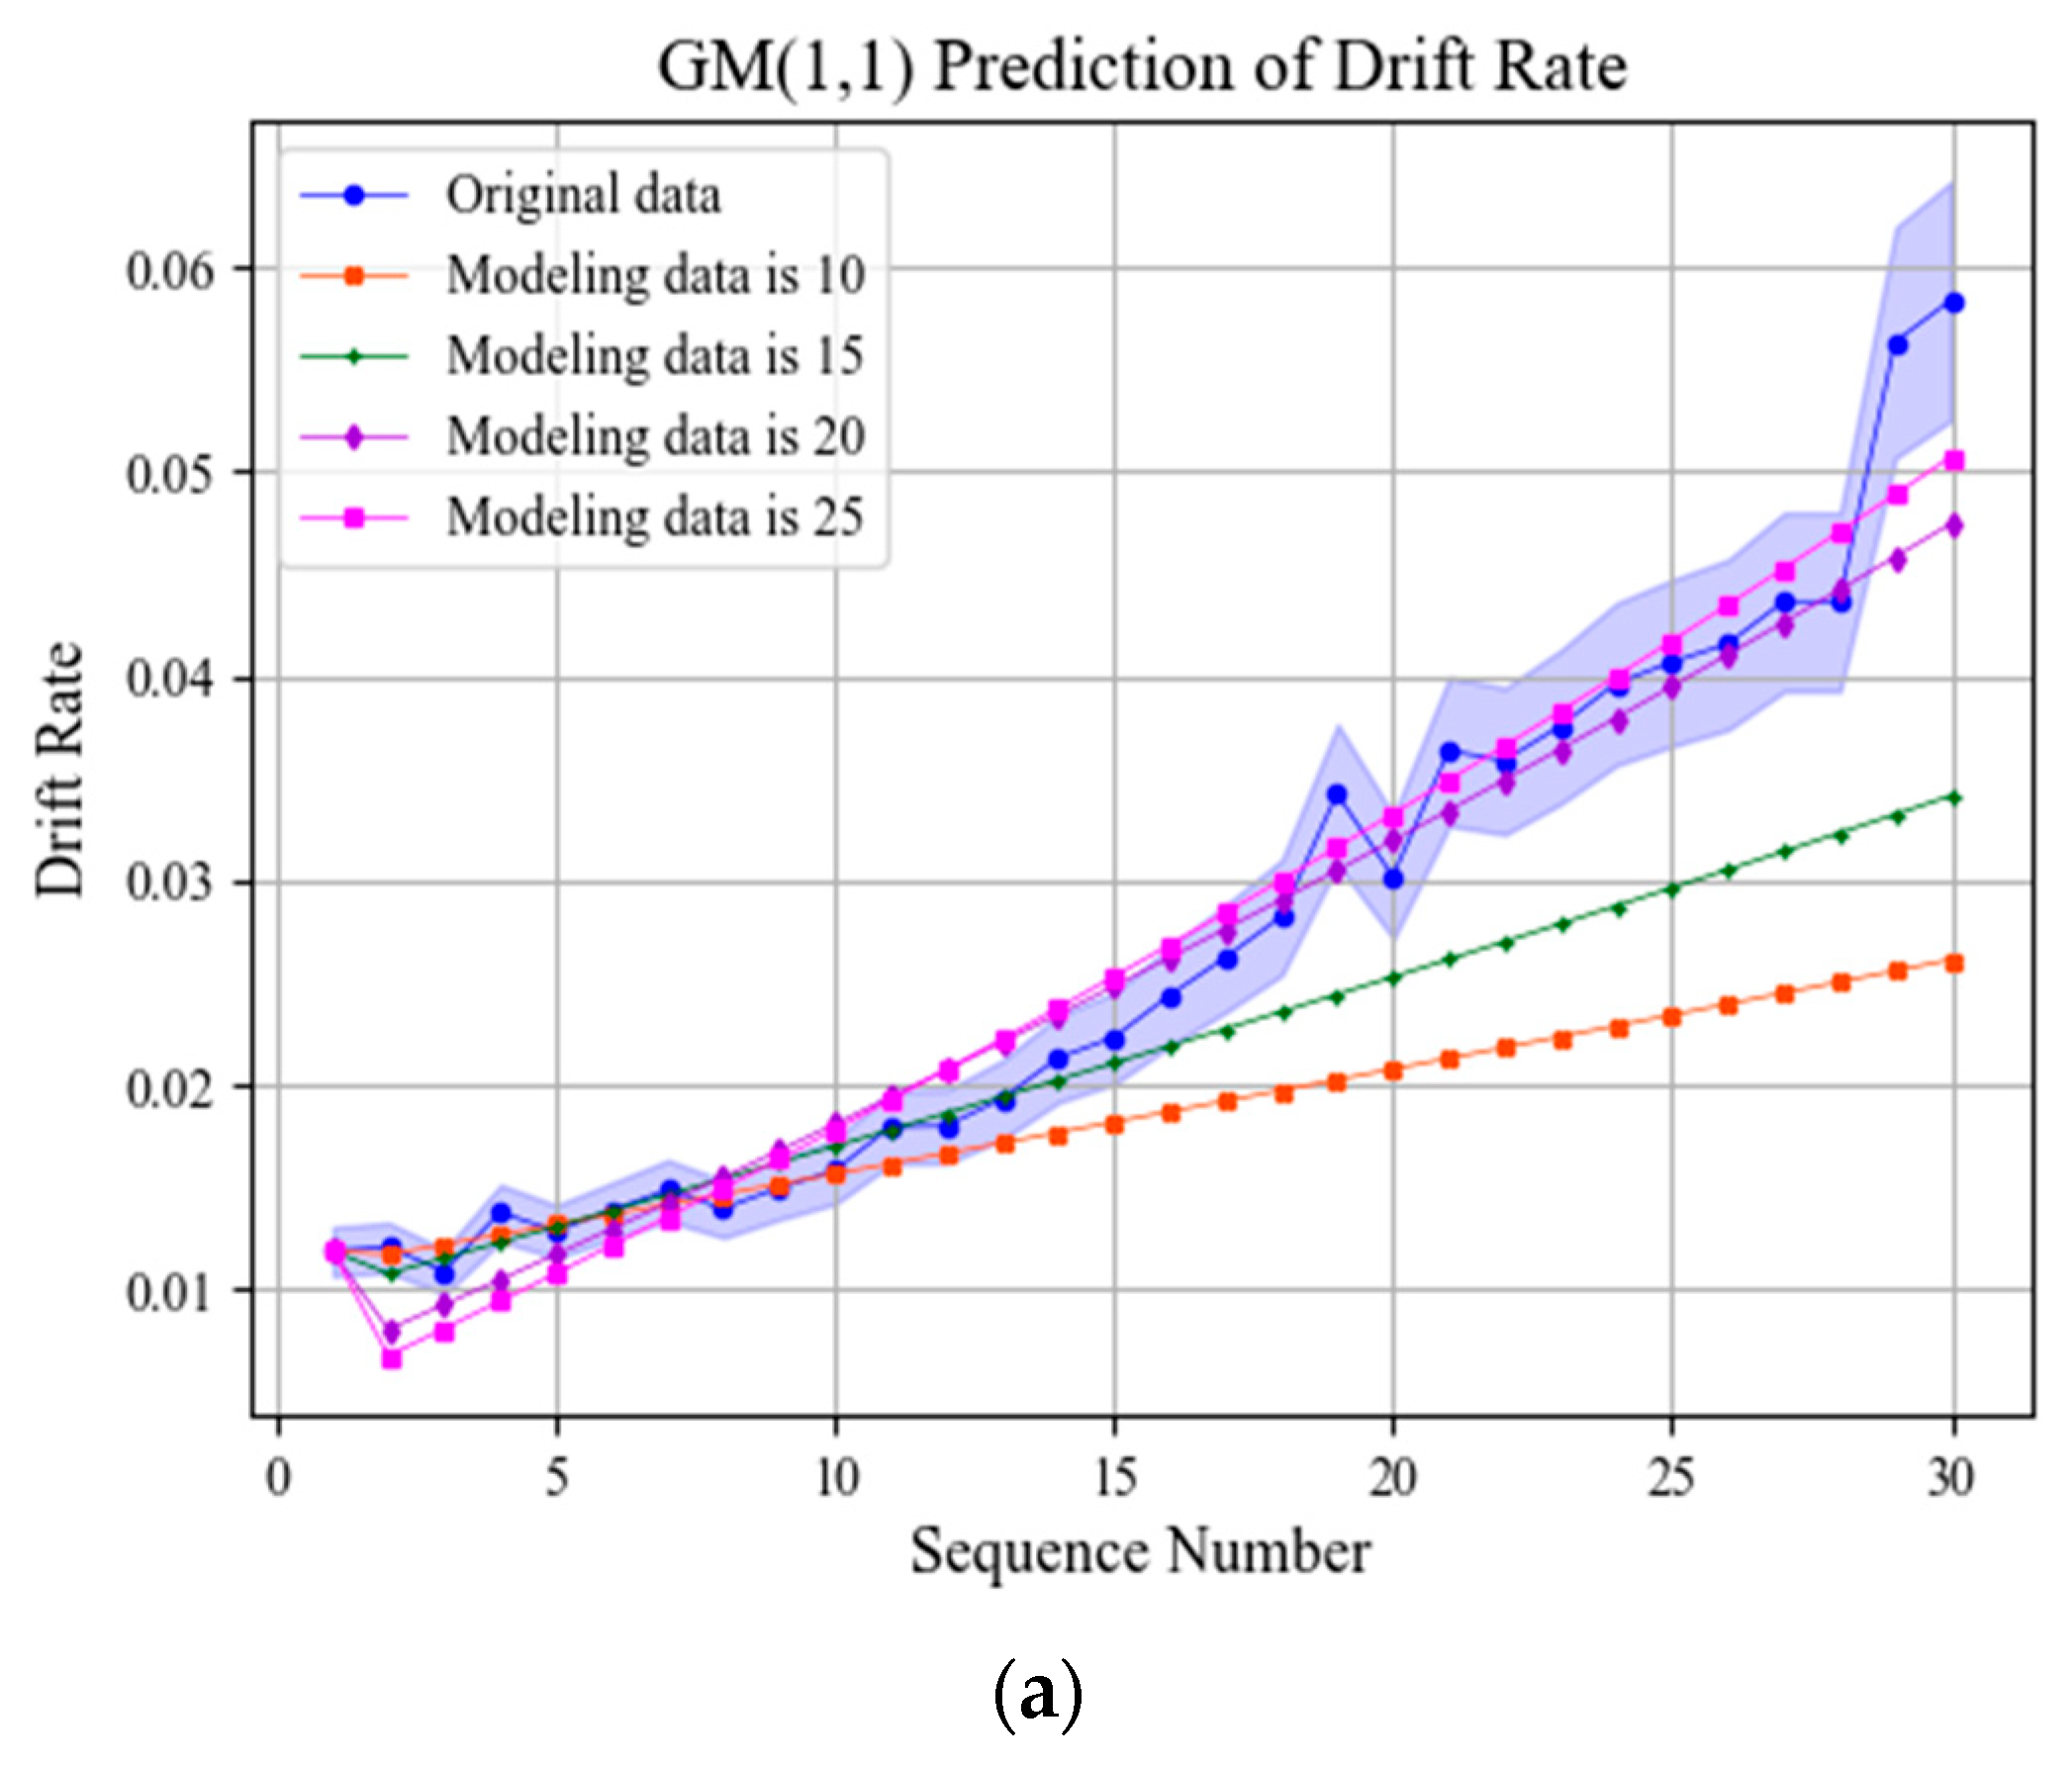
Build the grey model
In this paper, GM(1,1), PGM(1,1) [36] and WPGM(1,1) [37,38] models are built for prediction.
(1)
GM(1,1) model
Construct the drift rate nearest neighbor mean first cumulative sequence (1-AGO) as follows,
r ( 1 ) ( k ) = AGO ( r ( 0 ) ( k ) ) = i = 0 k r ( 0 ) ( i )
The formula of GM(1,1) is as follows,
r ^ ( 1 ) ( k ) = ( r ( 0 ) ( 1 ) b a ) e - a ( k - 1 ) + b a
where a is the development coefficient, b is the grey action and k = 2, 3, …, n is the number of newly constructed sequence elements.
Parameters a and b can be estimated by least squares.
[ a b ] = ( B T B ) - 1 B T y n
where
B = [ - 0.5 ( r ( 1 ) ( 1 ) + r ( 1 ) ( 2 ) ) - 0.5 ( r ( 1 ) ( 2 ) + r ( 1 ) ( 3 ) ) - 0.5 ( r ( 1 ) ( n 1 ) + r ( 1 ) ( n ) ) 1 1 1 ] , Y n = [ r ( 0 ) ( 2 ) r ( 0 ) ( 3 ) r ( 0 ) ( n ) ]
The prediction sequence is obtained by cumulative reduction as follows.
{ r ^ ( 0 ) ( k + 1 ) = r ^ ( 1 ) ( k + 1 ) r ^ ( 1 ) ( k ) , r ^ ( 0 ) ( 1 ) = r ^ ( 1 ) ( 1 )
(2)
PGM(1,1) model
The PGM(1,1) model obtains the model parameters of θ ^ and A ^ according to formulas θ ^ = ln 2 a 2 + a and A ^ = 2 b 2 + a , where a and b are parameters in GM(1,1). The prediction sequence is obtained as follows.
r ^ ( 0 ) ( k ) = A ^ e θ ^ ( k - 1 )
k = 2, 3, …, n is the number of newly constructed sequence elements.
(3)
WPGM(1,1) model
Give a certain weight p for r ( 1 ) ( k ) and r ( 1 ) ( k + 1 ) in the GM(1,1) model, and it can obtain B as follows.
B = [ ( ( 1 p ) r ( 1 ) ( 1 ) + p r ( 1 ) ( 2 ) ) 1 ( ( 1 p ) r ( 1 ) ( 2 ) + p r ( 1 ) ( 3 ) ) 1 ( ( 1 p ) r ( 1 ) ( n 1 ) + p r ( 1 ) ( n ) ) 1 ]
In the formula, p is the weight value. The search area of weight value p can be set as [0.01, 0.99], and the increment unit is 0.02. The search method is to perform the modeling step in turn. In each cycle, the predicted average relative error value needs to be calculated, and the best value is obtained by comparison among errors with different weight value p [39].
Step 4.
Build the neural network model
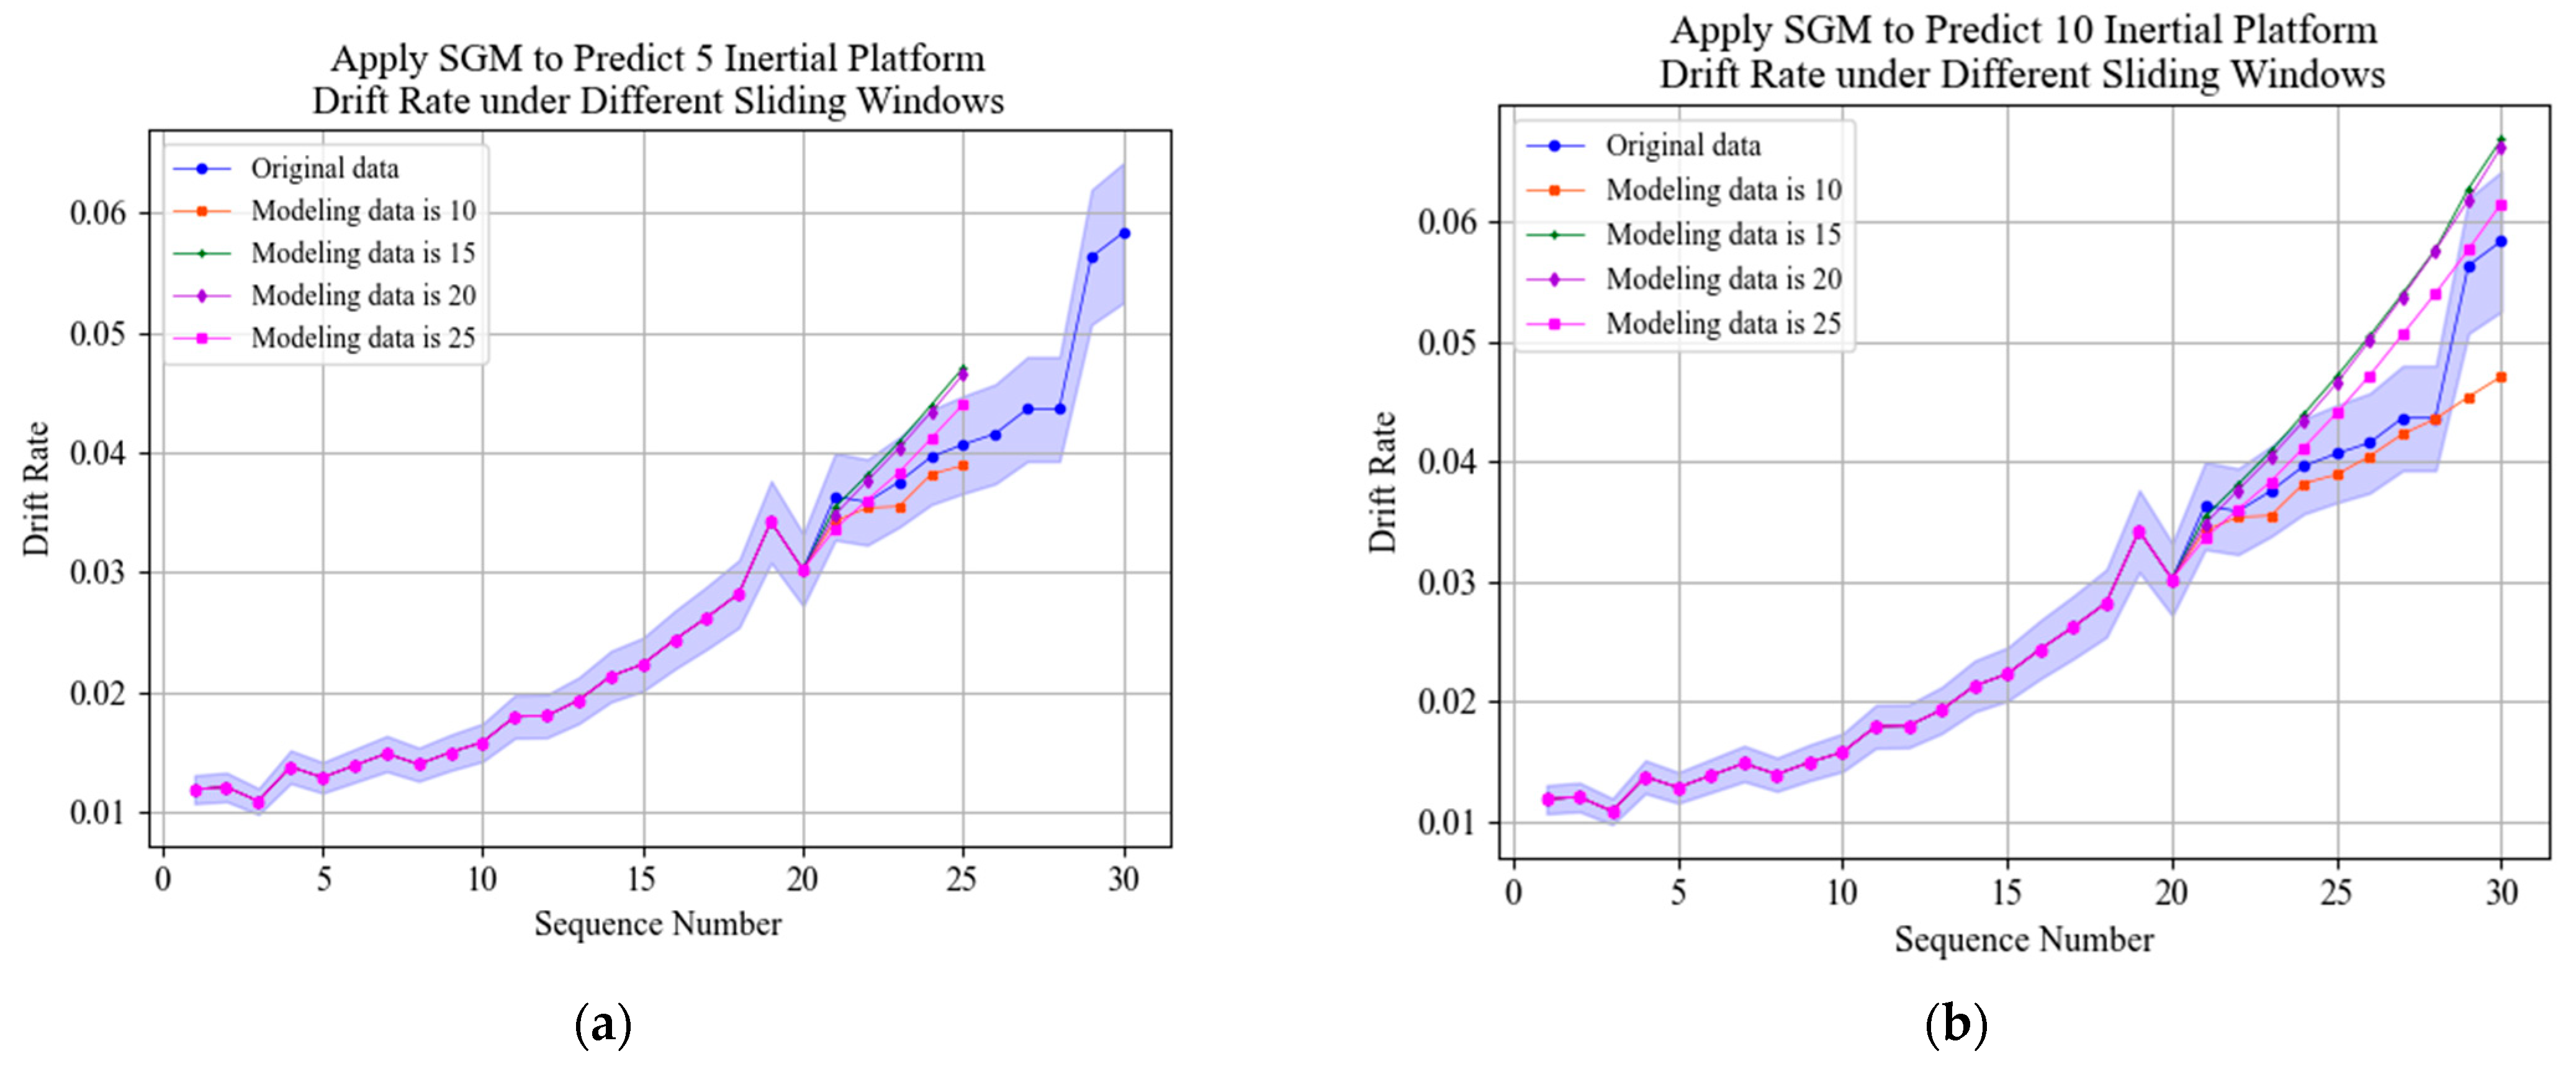
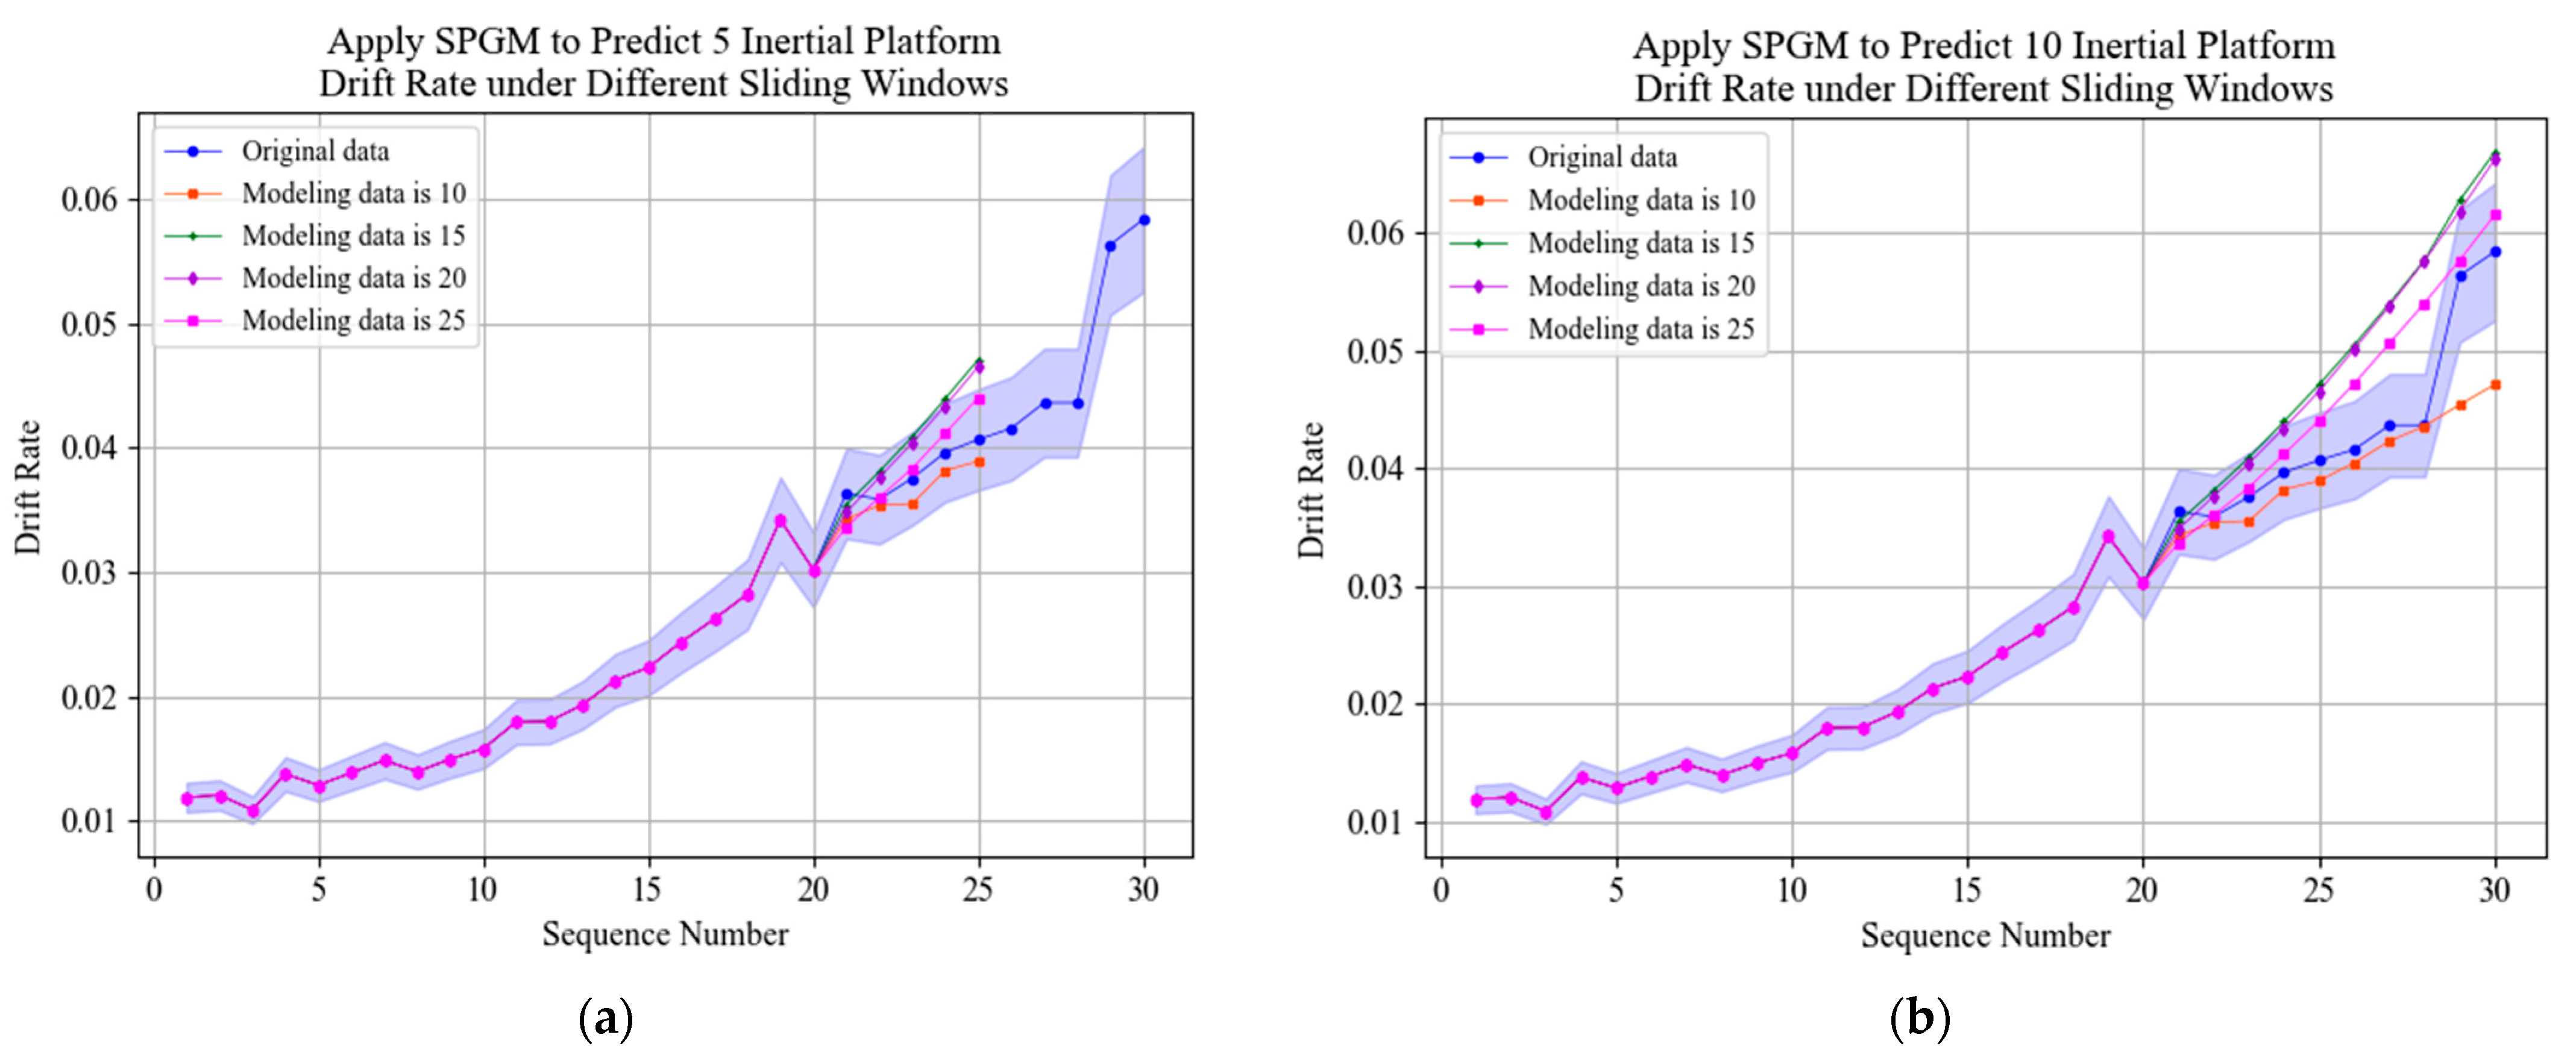
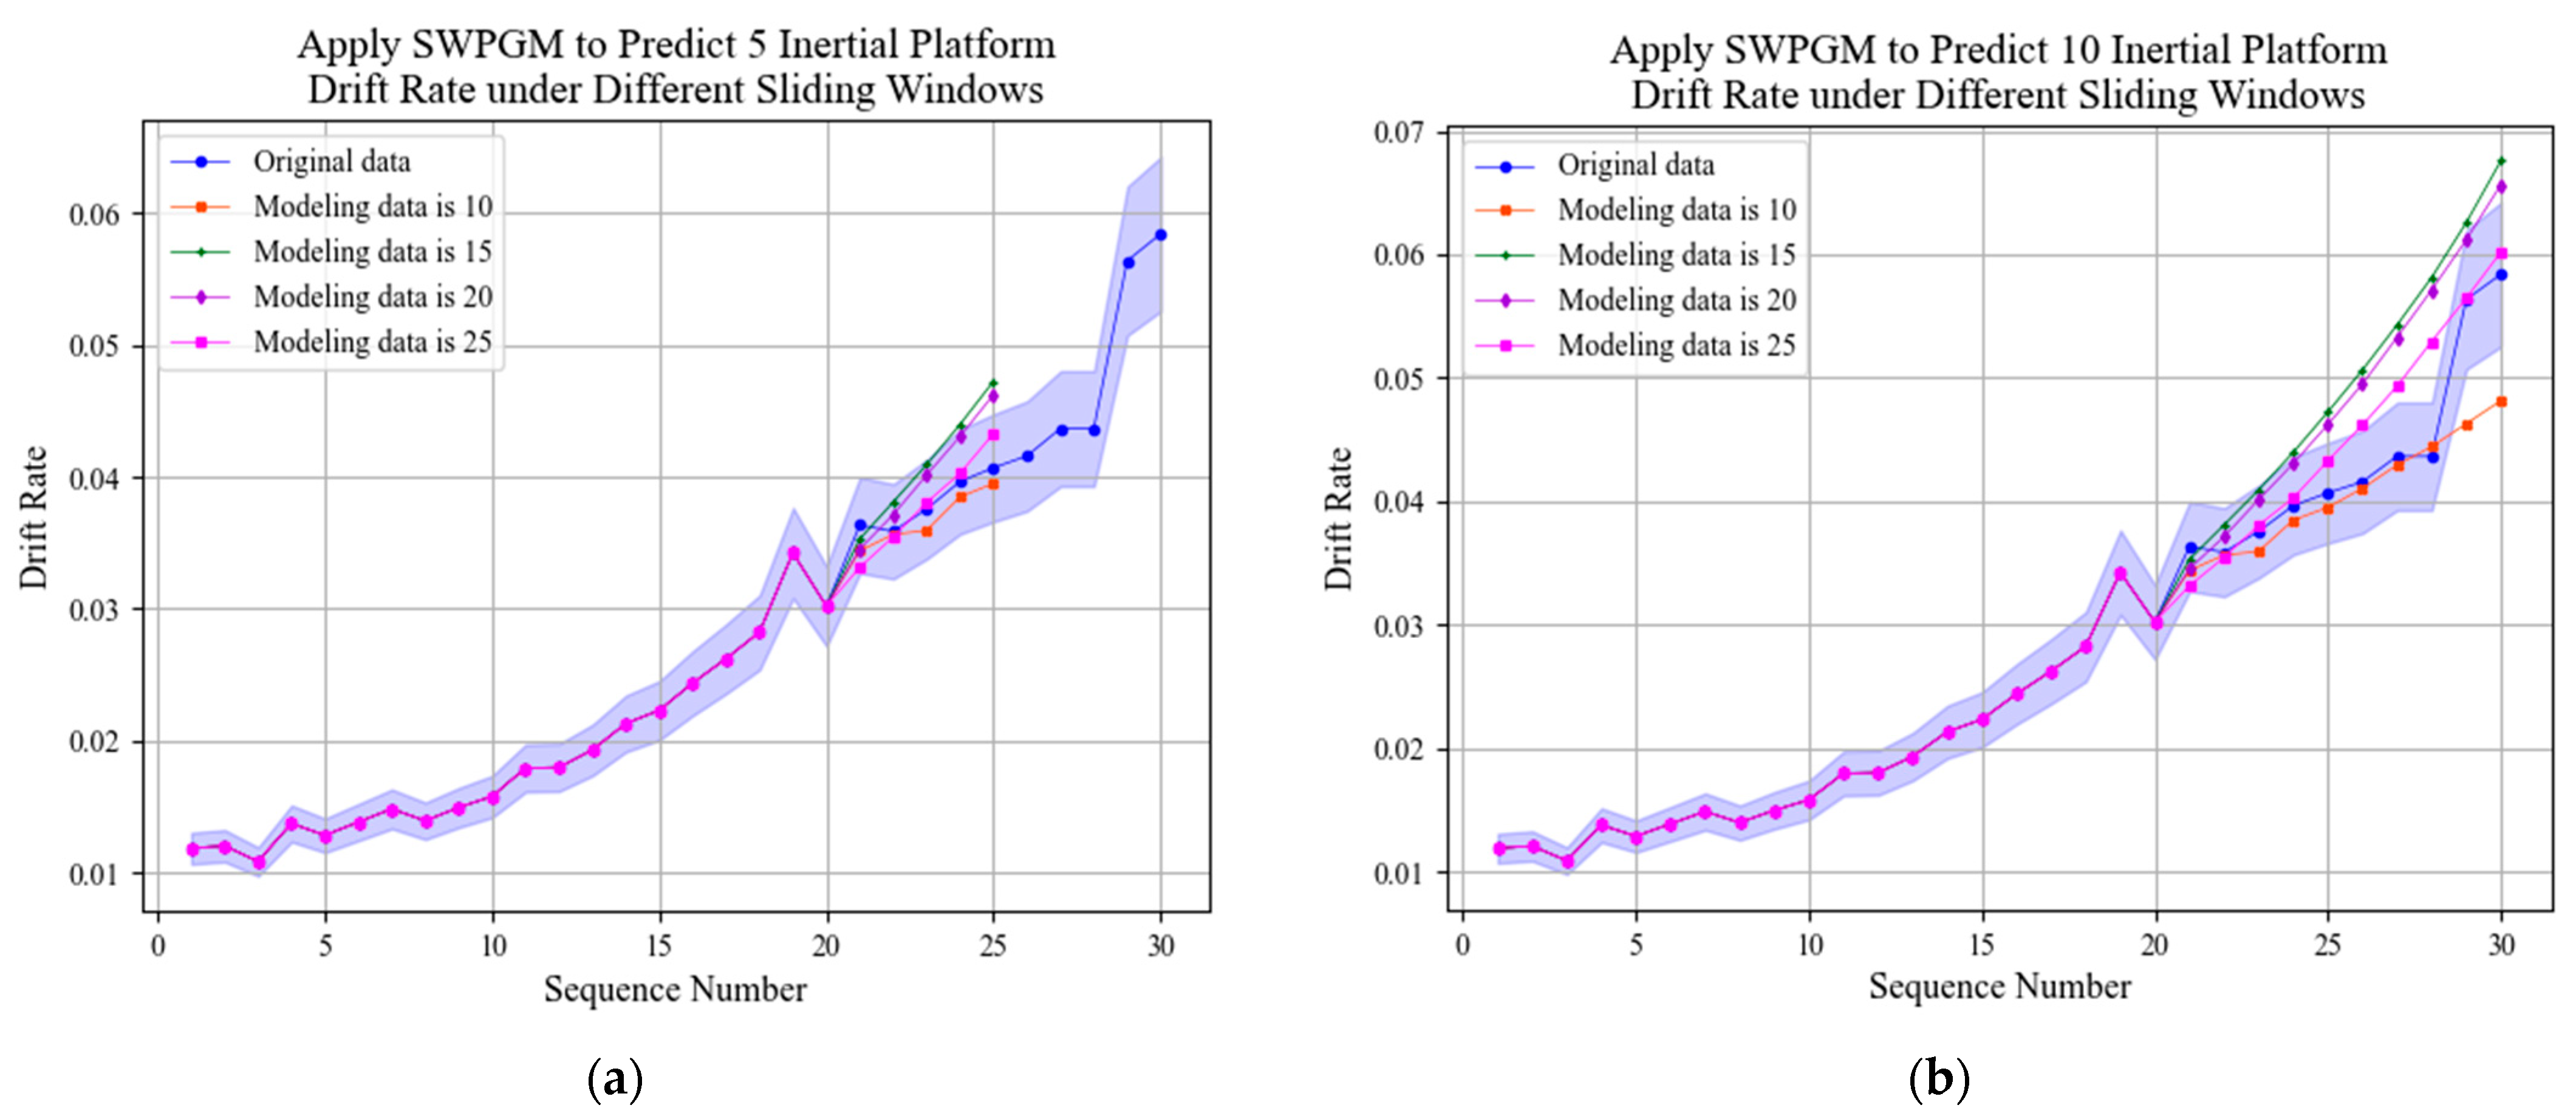
The prediction results of SGM(1,1), SPGM(1,1) and SWPGM(1,1) with sliding windows are input into the feedforward neural network and trained to obtain the grey neural network prediction model SGMNN. The structure of neural network is shown in Figure 5.
The weights and thresholds of neurons in feedforward neural networks are updated by a back propagation (BP) algorithm. The gradient descent method is used to minimize the loss function. According to the learning rate, the parameters in the network are iteratively updated to meet the set training step size or error accuracy requirements.
Step 5.
Model adjustment
Mean absolute percentage error (MAPE) and root mean square error (RMSE) are calculated by comparing the predicted results with the real values. According to the error, the model parameters including sliding window length and neural network parameters are adjusted to obtain the best prediction model.
Step 6.
Prediction
The sliding window grey neural network model is trained from the historical test drift rate data, and the drift rate value in the specified time of the system is predicted to realize the prediction.
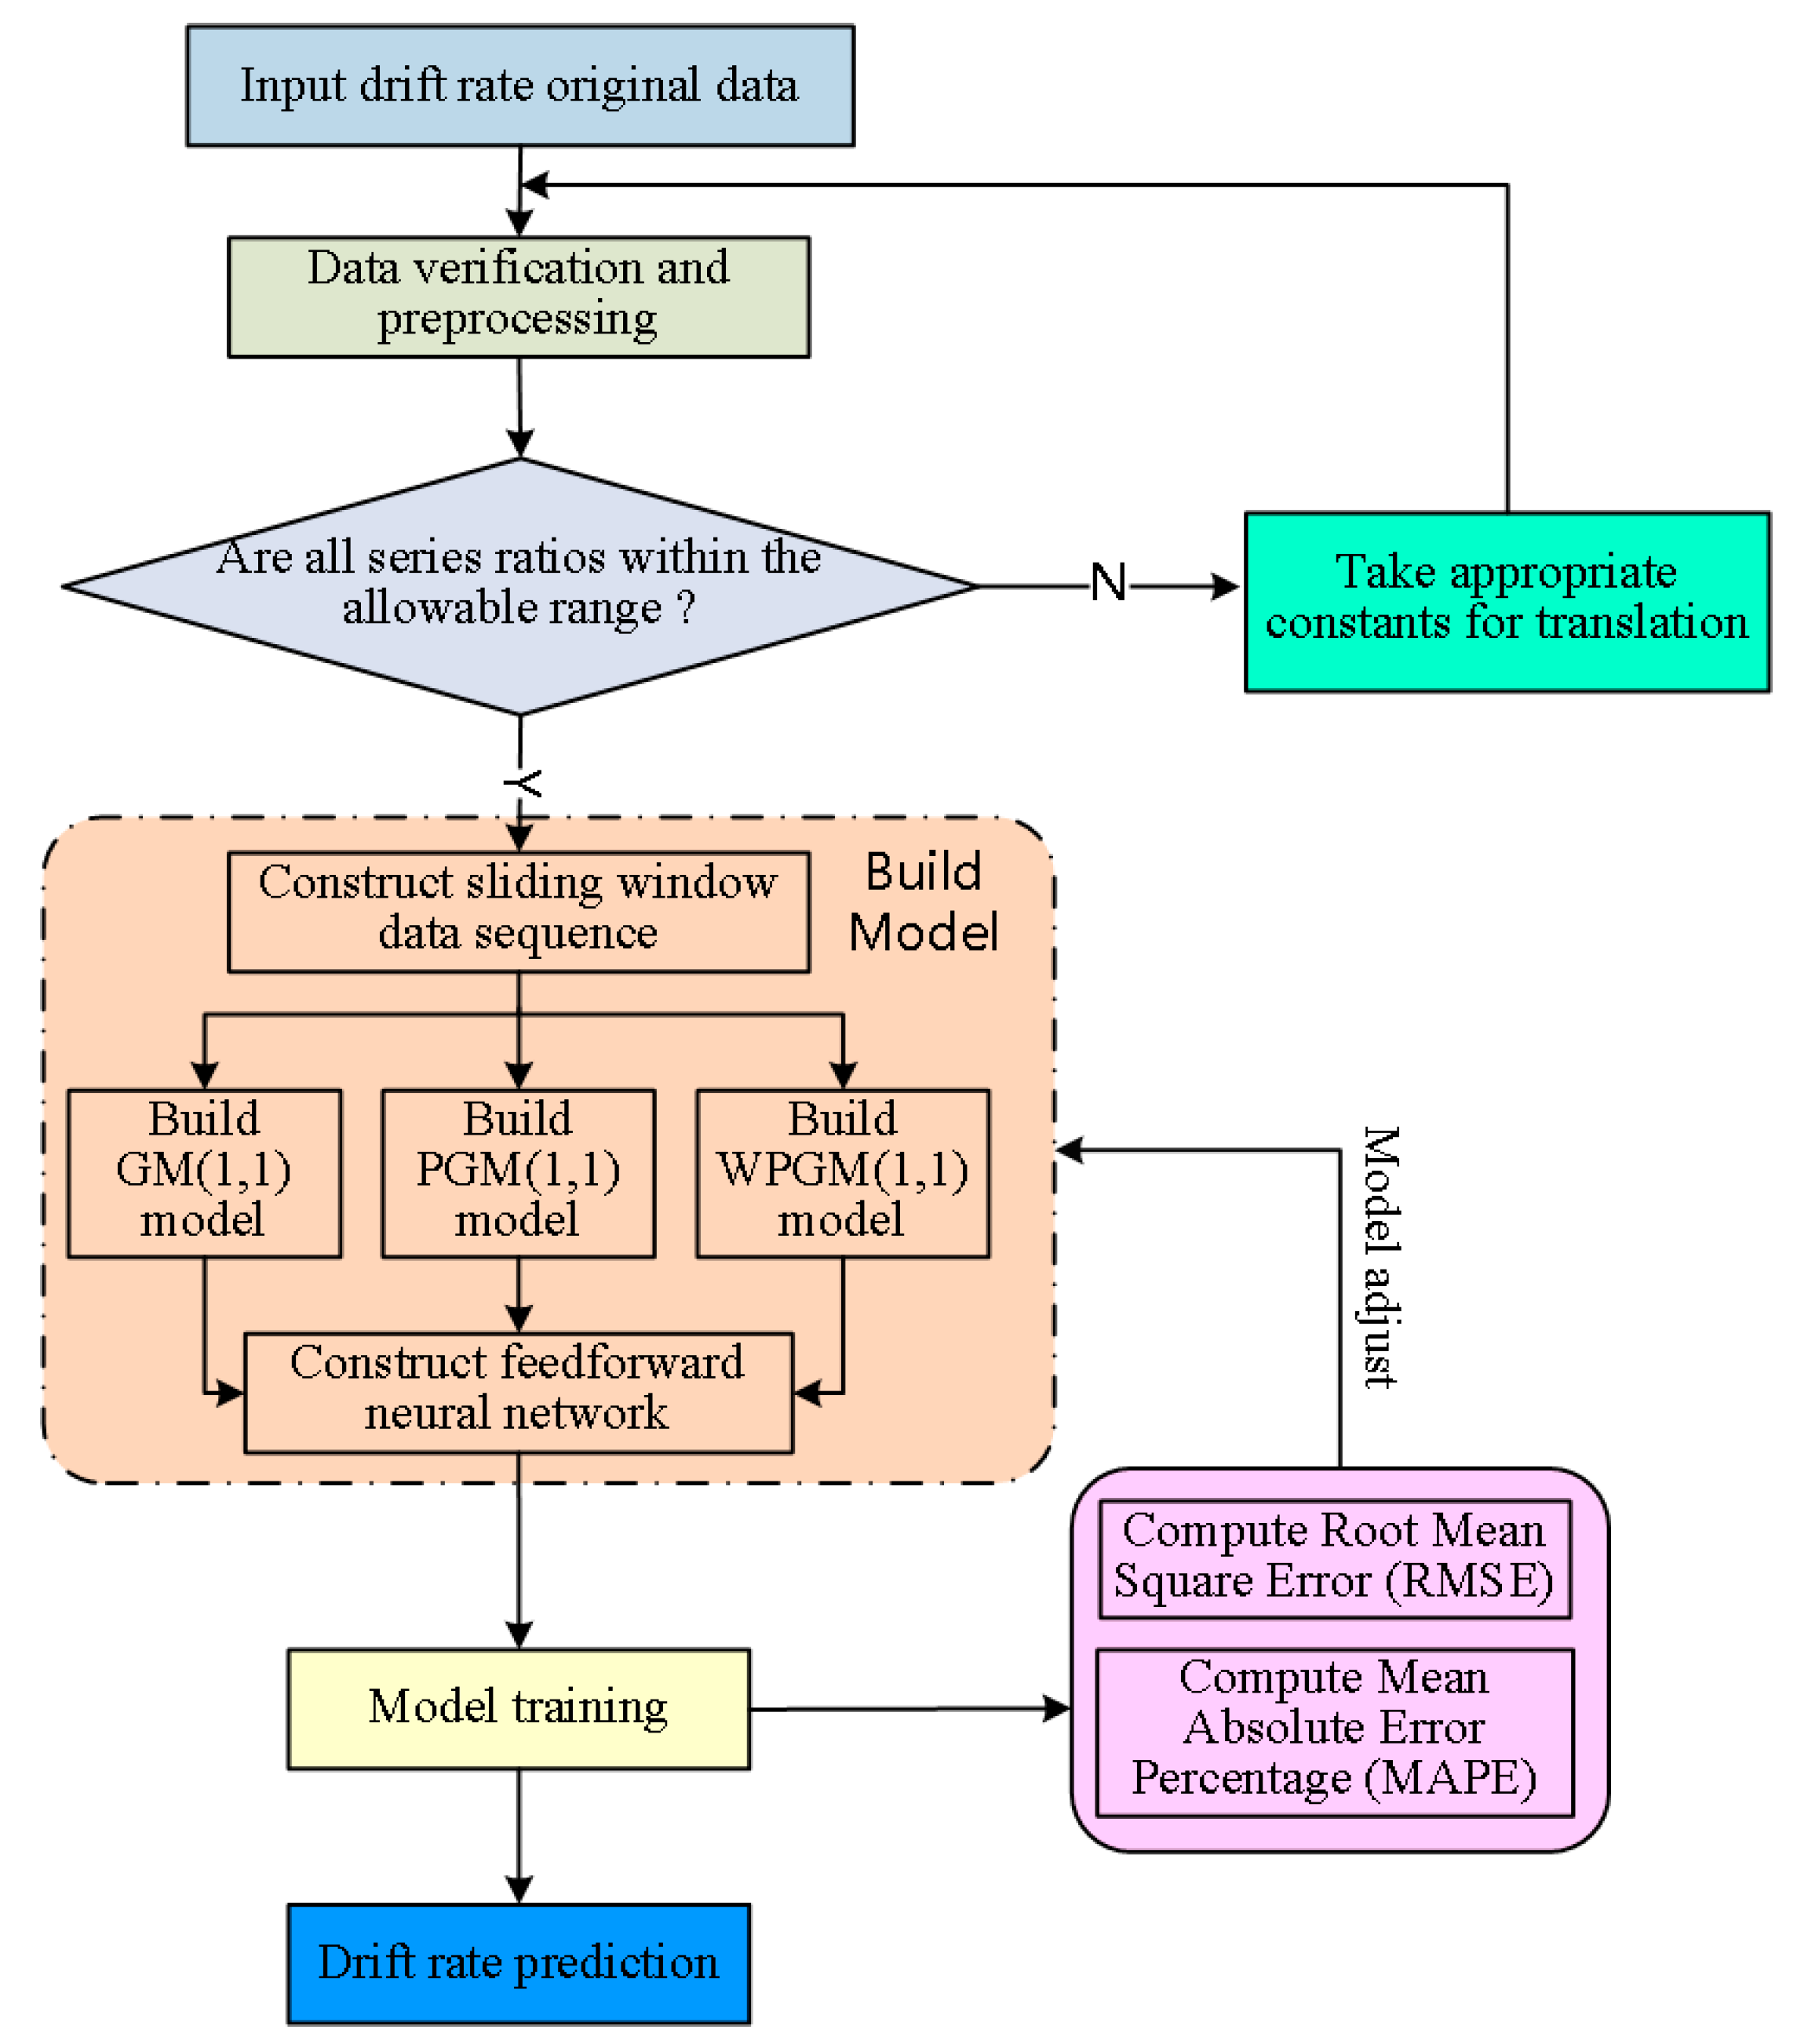
The algorithm flow is shown in Figure 6.

3. Results and Discussion

3.1. Problem Description

The storage life of inertial platform is several years and the drift rate of inertial platform is obtained as the analysis object. In the storage process, the inertial platform examination work is carried out once a month. Obtaining drift rate data during storage from 2018 to 2020 as datasets, as shown in Table 1 and Figure 7. In practical engineering, due to the different accuracy of different types of inertial platforms, the standard of drift rate is also different. When the drift rate of a certain type of inertial platform in this experiment is higher than 0.036346, it is considered that the error is too large to be repaired or retired. It can be seen from Figure 7 that the drift rate shows an upward trend and has a weak nonlinearity, which indicates that the performance of an inertial platform degrades over time. The red baseline is the error baseline of the inertial platform, which indicates that the inertial platform needs to be repaired or decommissioned.
In order to verify the prediction effect of the proposed model, 30 sets of drift rate calibration data from 2018 to 2020 are applied as datasets to divide training sets and test sets. Different prediction models are built to predict and verify the accuracy of models. The GM(1,1) model, the PGM(1,1) model and the WPGM(1,1) model are constructed. The top 10/15/20/25 of 30 groups of drift rate historical data is selected as the training set, and the remaining data is selected as the test set for modeling and prediction. On the basis of the GM(1,1) model, the PGM(1,1) model and the WPGM(1,1) model, sliding windows are added with lengths of 5/10/15/20. Then, with inputs of GM(1,1) model, PGM(1,1) model and WPGM(1,1) model, the neural network model is constructed for predicting. Finally, the prediction accuracy of other regression models are compared to verify the accuracy of proposed model.

3.2. Data Test and Preprocess

The original data of drift rate coefficient is shown in Figure 7. The conditional formula is established according to the GM(1,1) model, and the order ratio is calculated as shown in Table 2.
Compared with the coverable range X = (0.93752, 1.06449), some values are not in the range. It means that the original data sequence is not suitable for the grey prediction model, and the horizontal shift transformation is need. When the translation value c = 0.1, the level ratio of the new data sequence obtained by the translation transformation is all within the coverage, which can be applied to the grey prediction model.

3.3. Results

In this paper, GM(1,1), PGM(1,1) and WPGM(1,1) are selected, and the model parameters are obtained with comparative analysis of experiments. p is unbiased value, a is development coefficient and u is grey action. Settings of model parameters are shown in Table 3.
The neural network has three layers where the first hidden layer has 10 neurons, the second hidden layer has 16 neurons and the third hidden layer had 10 neurons, and the input layer has three inputs. The input layer of the neural network is the prediction results of GM(1,1), PGM(1,1) and WPGM(1,1). The first layer of the activation function is Sigmoid function, the second layer is Relu function and the third layer is Sigmoid function. The gradient descent method is used to train the network. The learning rate is 0.05, and the training time is 10,000.

3.3.1. Prediction Results of GM(1,1) and Improved-GM(1,1)

The training set is selected with 10/15/20/25 from inertial platform drift rate. The GM(1,1) model, PGM(1,1) model, and WPGM(1,1) model are built to predict the residual drift rate value. The prediction result is shown as Figure 8 and Table 4.
According to the prediction errors of GM(1,1) and improved GM(1,1), when more data are selected for modeling, the prediction accuracy will be improved. When selecting the same modeling data, GM(1,1) and improved GM(1,1) have little difference in prediction accuracy and show different advantages in different indicators.

3.3.2. Prediction Results of GM(1,1) and Improved GM(1,1) Models with Sliding Windows

In order to verify the prediction effect after adding sliding windows, the modeling data is 20, and the residual drift rate is predicted with different sliding windows. Prediction results of SGM(1,1) model with different sliding windows are shown in Figure 9. Prediction errors of GM(1,1) model with different sliding windows are shown in Table 5.
According to the errors of prediction results, compared with the GM(1,1) prediction results without a sliding window, the sliding window can significantly improve the prediction accuracy of the GM(1,1) model. When the length of sliding window is five, the prediction accuracy is the highest, which indicates that the time series of the past time have different effects on the time series of the future time. The accuracy of predicting 5 values is higher than predicting 10 values.
Prediction results of PGM(1,1) model with different sliding windows are shown in Figure 10. Prediction errors of PGM(1,1) model with different sliding windows are shown in Table 6.
According to the errors of prediction results, compared with the PGM(1,1) prediction results without sliding windows, adding a sliding window can significantly improve the prediction accuracy of the PGM(1,1) model. When the length of sliding window is five, the prediction accuracy is the highest, which indicates that the time series of the past time have different effects on the time series of the future time. The accuracy of predicting 5 values is higher than predicting 10 values.
Prediction results of WPGM(1,1) model with different sliding windows are shown in Figure 11. Prediction errors of WPGM(1,1) model with different sliding windows are shown in Table 7.
According to the errors of prediction results, compared with WPGM(1,1) prediction results without a sliding window, adding a sliding window can obviously improve the prediction accuracy of the WPGM(1,1) model. When the length of sliding window is five, the prediction accuracy was the highest, which indicates that the time series of the past time have different effects on the time series of the future time. The accuracy of predicting 5 values is higher than predicting 10 values.
In general, after adding sliding window, the prediction accuracy of grey models is improved. When the length of sliding window is five, the prediction accuracy is highest. The prediction accuracy of PGM(1,1) is almost the same as that of GM(1,1). The prediction accuracy of WPGM(1,1) is better than that of GM(1,1) and PGM(1,1).

3.3.3. Prediction Results of the SGMNN Model

According to the prediction results of the improved grey model, different GM(1,1), PGM(1,1) and WPGM(1,1) models are selected as the inputs of the neural network. The sliding window grey neural network (SGMNN) is constructed to improve the prediction accuracy. When predicting five values, 20 drift rate values are selected as training sets, and different sliding windows are added to the GM(1,1) model, the PGM(1,1) model and the WPGM(1,1) model to analyze the prediction effects. The prediction results are shown in Figure 12. The prediction errors of five values predicted by SGMNN under different sliding windows are shown in Table 8.
The error analysis of prediction results shows that the prediction accuracy of SGMNN model is obviously better than that of the grey model and the improved model. SGMNN model has the highest prediction accuracy when predicting five inertial platform drift rates.

3.3.4. Prediction of Inertial Platform Drift Rate with Other Models

In order to verify the prediction effects of SGMNN furtherly, traditional regression prediction models are applied to analyze and predict drift rate. The prediction results are comprehensively compared as shown in Table 9.
In the comparative experiments, linear regression model, SVM regression model, decision tree regression model and neural network model are applied to predict the drift rate of the inertial platform. These models apply 20 drift rate data for training and predicted five data.
According to the errors of prediction results shown in Table 9, the prediction accuracy of the SGMNN model is better than that of the small sample prediction models and the improved GM(1,1) models.

3.4. Discussion

According to the results of error analysis, the prediction accuracy of the GM(1,1) model and the improved GM(1,1) model is better than that of regression models. Adding different sliding windows can improve the prediction accuracy of the grey models. In the prediction of inertial platform drift rate, compared with traditional prediction models and improved GM(1,1) models, the SGMNN model has the highest prediction accuracy.

4. Conclusions

The purpose of this paper is to enhance the accuracy and robustness of prediction by combining grey model and neural network based on small sample data. This is the first known application of combing improved GM(1,1) models, sliding windows and neural network. Results of the experiments indicate that the SGMNN model can improve the small sample prediction accuracy compared with that of traditional prediction methods. Compared with the prediction accuracy of linear regression models, the prediction accuracy of SGMNN model reduces MAE by 80.18 × 10⁻⁴, MAPE by 17.27% and RMSE by 91.69 × 10⁻⁴. Compared with the prediction accuracy of a neural network prediction model, the prediction accuracy of SGMNN model reduces MAE by 12.97 × 10⁻⁴, MAPE by 3.28% and RMSE by 14.3 × 10⁻⁴.
The SGMNN model proposed in this paper can improve the accuracy of drift rate prediction of inertial platform, which can effectively solve the problem of reliability and performance prediction of inertial platform. Furthermore, the SGMNN model can be applied to solve other similar small sample prediction problems.

Author Contributions

L.C. proposed and designed the SGMNN model; L.C. and L.Y. contributed to the manuscript’s discussion and writing; Q.Z. gave comments on the manuscript and checked the writing; C.B. contributed to the conception of the study. All authors have read and agreed to the published version of the manuscript.

Funding

This research was funded by the National Science and Technology Major Project of China, grant number 2019ZX04026001 and Shanghai Aerospace Science and Technology Innovation Fund, grant number SAST52016001.

Institutional Review Board Statement

Not applicable.

Informed Consent Statement

Not applicable.

Data Availability Statement

Not applicable.

Conflicts of Interest

The authors declare no conflict of interest.

References

  1. Yu, C.; Zhang, S.; Bai, X.; Li, A. Robust finite time second order sliding mode stabilization control for floated inertial platform. Proc. Ins. Mech. Eng. 2018, 232, 1620–1627. [Google Scholar] [CrossRef]
  2. Ding, Z.; Zhou, H.; Zhang, S.; Yang, H.; Cai, H. Initial Self-Alignment Method for Inertial Platform on a Stationary Base. J. Astron. 2017, 38, 612–620. [Google Scholar]
  3. Li, A.; Wan, Y.; Li, K.; Jiang, Z. Contrast Analysis of High-accuracy Methods for Stabilization Loop of Inertial Navigation Platform. Missile Space Veh. 2018, 3, 61–68. [Google Scholar]
  4. Chen, W.; Wang, L.; Zheng, T.; Wang, L. Research on Calibration Method of Installation Error of Star Sensor in Inertial Platform. Navig. Control 2017, 16, 71–75. [Google Scholar]
  5. Shi, Q.; Hu, C.; Si, X.; Hu, X.; Zhang, Z. Remaining Useful Lifetime Prediction Method of Controlled Systems Considering Performance Degradation of Actuator. Acta Autom. Sin. 2019, 45, 941–952. [Google Scholar]
  6. Wang, L.; Wang, W.; Liu, Z.; Song, T. Research on the Digital Platform for Hybrid Inertial Navigation System. Acta Armamen 2018, 39, 1316–1322. [Google Scholar]
  7. Wang, H.; Duan, F.; Jiang, X. Research on reliability of inertial navigation system based on fuzzy GO methodology. J. Dalian Univ. Technol. 2018, 58, 285–292. [Google Scholar]
  8. Yang, B.; Kang, X. Inertial Platform System Storage Reliability Prediction Method Based on Small Sample Data. Aerosp. Control 2015, 33, 90–95. [Google Scholar]
  9. Yin, X.; Sun, Y.; Wang, C. Positioning Errors Predicting Method of Strapdown Inertial Navigation Systems Based on PSO-SVM. Abstr. Appl. Anal. 2013, 2013, 737146. [Google Scholar] [CrossRef]
  10. Zhang, Y. Research on Performance Evaluation Method of Inertial Navigation System Based on PSO-SVM; Harbin Institute of Technology: Harbin, China, 2015. [Google Scholar]
  11. Dang, H.; Du, Z.; Wang, C. Practical combination forecasting evaluation method for PINS comprehensive performance. J. Chin. Inert. Technol. 2014, 22, 9–13. [Google Scholar]
  12. Mariusz, S.; Cezary, S.; Paweł, D.; Krzysztof, C.; Leszek, S.; Oktawia, L. Road Tests of the Positioning Accuracy of INS/GNSS Systems Based on MEMS Technology for Navigating Railway Vehicles. Energies 2020, 13, 4463. [Google Scholar]
  13. Sun, W.; Liu, D.; Wen, J.; Wu, Z. Modeling of MEMS gyroscope random errors based on grey model and RBF neural network. J. Navig. Position. 2017, 5, 9–13. [Google Scholar]
  14. Cai, X.; Zhang, C.; Gao, S.; Wang, L.; Li, X. A novel method based on a high-dynamic hybrid forecasting model for fiber optic gyroscope drift. Sens. Mater. 2017, 29, 1–13. [Google Scholar]
  15. Dai, C.; Pi, D. Parameter auto-selection for hemispherical resonator gyroscope’s long-term prediction model based on cooperative game theory. Knowl.-Based Syst. 2017, 134, 105–115. [Google Scholar] [CrossRef]
  16. Gao, X.; Hu, C.; Du, D. Adaptive prediction of remaining useful life for stochastic deteriorating equipment based on linear FBM process. China Meas. Test 2021, 47, 111–119. [Google Scholar]
  17. Chen, D. Studies on SINS Calibration Performace Quantitative Evaluation Approach Based on Bayesian Smoothing; Harbin Engineering University: Harbin, China, 2017. [Google Scholar]
  18. Pavlenko, I.; Saga, M.; Kuric, I.; Kotliar, A.; Basova, Y.; Trojanowska, J.; Ivanov, V. Parameter Identification of Cutting Forces in Crankshaft Grinding Using Artificial Neural Networks. Materials 2020, 13, 5357. [Google Scholar] [CrossRef]
  19. Baressi Šegota, S.; Anđelić, N.; Lorencin, I.; Saga, M.; Car, Z. Path planning optimization of six-degree-of-freedom robotic manipulators using evolutionary algorithms. Int. J. Adv. Robot. Syst. 2020, 17, 1729881420908076. [Google Scholar] [CrossRef] [Green Version]
  20. Li, R.; Wang, L.; Liu, G. Adaptive remaining useful life prediction for inertial platform with uncertain measurements. J. Chang. Univ. Technol. 2014, 35, 189–195. [Google Scholar]
  21. Chen, L.; Chen, J.; Wang, H.; Wang, Y.; An, J.; Yang, R.; Pan, H. Remaining Useful Life Prediction of Battery Using a Novel Indicator and Framework with Fractional Grey Model and Unscented Particle Filter. IEEE Trans. Power Electron. 2019, 35, 5850–5859. [Google Scholar] [CrossRef]
  22. Pang, C.; Fani, D.; Kim, J.; Yonsun, O. Using Improved Non-linear Multivariate Grey Bernoulli Model to Evaluate China’s CO2 Emission. J. Grey Syst. 2020, 32, 15–31. [Google Scholar]
  23. Cheng, Y.; Wu, J.; Zhu, H.; Or, S.W.; Shao, X. Remaining Useful Life Prognosis Based on Ensemble Long Short-Term Memory Neural Network. IEEE Trans. Instrum. Meas. 2021, 70, 1–12. [Google Scholar] [CrossRef]
  24. Gao, Y.; Wen, Y.; Wu, J. A Neural Network-Based Joint Prognostic Model for Data Fusion and Remaining Useful Life Prediction. IEEE Trans. Neural Netw. Learn. Syst. 2021, 32, 117–127. [Google Scholar] [CrossRef]
  25. Zhang, L.; Zhao, J.; Li, W. Online and Unsupervised Anomaly Detection for Streaming Data Using an Array of Sliding Windows and PDDs. IEEE Trans. Cybern. 2021, 51, 2284–2289. [Google Scholar] [CrossRef]
  26. Gaur, P.; Gupta, H.; Chowdhury, A.; McCreadie, K.; Pachori, R.B.; Wang, H. A Sliding Window Common Spatial Pattern for Enhancing Motor Imagery Classification in EEG-BCI. IEEE Trans. Instrum. Meas. 2021, 70, 1–9. [Google Scholar] [CrossRef]
  27. Yuan, Y.; Gao, J.; Wu, Z.; Shen, Z.; Wu, G. Performance estimate of some prototypes of inertial platform and strapdown marine gravimeters. Earth Planets Space 2020, 72, 1–11. [Google Scholar] [CrossRef]
  28. Itu, C.; Bratu, P.; Borza1, P.N.; Vlase1, S.; Lixandroiu, D. Design and Analysis of Inertial Platform Insulation of the ELI-NP Project of Laser and Gamma Beam Systems. Symmetry 2020, 12, 1972. [Google Scholar] [CrossRef]
  29. Wang, M. Research on Continuous Tumbling Self-Calibration for Inertial Navigation Platform System; Harbin Institute of Technology: Harbin, China, 2020. [Google Scholar]
  30. Yuan, J.; Zhong, L.; Li, X.Y. The Research and Development of Grey Neural Network. J. Wuhan Univ. Technol. 2009, 31, 91–93. [Google Scholar]
  31. Shi, B.; Liu, S.; Dang, Y.; Wang, Z. Recursive soluction to unbiased grey model and its optimization. Syst. Eng.-Theory Pract. 2011, 31, 1532–1538. [Google Scholar]
  32. Mu, Y. A Direct Method of the Unbiased GM(1,1). Syst. Eng. Electron. 2003, 25, 1094–1095, 1107. [Google Scholar]
  33. Zhang, L.; Fu, X.; Li, H. A tags’ arrival rate estimation method using weighted grey model(1,1) and sliding window in mobile radio frequency identification systems. Int. J. Distrib. Sens. Netw. 2020, 16, 1550147720967894. [Google Scholar] [CrossRef]
  34. Yang, F.; Zhao, Z.; Wang, X. Prediction of Foundation Settlement Prediction Based on Improved Grey Markov Model. Geomat. Spat. Inf. Technol. 2017, 40, 15–18, 22. [Google Scholar]
  35. Ren, L.; Wei, Y.; Cui, J.; Du, Y. A sliding window-based multi-stage clustering and probabilistic forecasting approach for large multivariate time series data. J. Stat. Comput. Simul. 2017, 87, 2494–2508. [Google Scholar] [CrossRef]
  36. Yuan, Q.; Sun, Y.; Zhou, R.; Wen, X.; Dong, L. Prediction and analysis of bearing vibration signal with a novel gray combination model. Adv. Mech. Eng. 2020, 12, 1687814020919241. [Google Scholar] [CrossRef]
  37. Li, Y.; Zhang, X.; Mei, H.; Liu, B. Particle swarm adaptive satellite clock error prediction model based on grey theory. J. Harbin Inst. Technol. 2018, 50, 71–77. [Google Scholar]
  38. Yan, J.; Deng, K. Combination model of BP network and WPGM (1,1) for land subsidence prediction. J. Hefei Univ. Technol. 2013, 36, 361–364. [Google Scholar]
  39. Liu, C.X.; Shu, T.; Chen, S.; Wang, S.Y.; Lai, K.K.; Gan, L. An improved grey neural network model for predicting transportation disruptions. Expert Syst. Appl. 2016, 45, 331–340. [Google Scholar] [CrossRef]
Figure 1. Inertial Platform.
Remotesensing 13 04864 g001
Figure 2. Principle diagram of a platform inertial navigation system.
Remotesensing 13 04864 g002
Figure 3. Inertial platform and frame structure. (a) The inertial platform. (b) The frame structure of inertial platform.
Remotesensing 13 04864 g003
Figure 4. The topology of SGMNN.
Remotesensing 13 04864 g004
Figure 5. Neural network model.
Remotesensing 13 04864 g005
Figure 6. Flow chart of the sliding window grey neural network algorithm.
Remotesensing 13 04864 g006
Figure 7. Original drift rate data of inertial platform.
Remotesensing 13 04864 g007
Figure 8. Apply GM(1,1) and improved GM(1,1) models for prediction. (a) GM(1,1) model prediction results; (b) PGM(1,1) model prediction results; (c) WPGM(1,1) model prediction results.
Remotesensing 13 04864 g008aRemotesensing 13 04864 g008b
Figure 9. Prediction results of SGM(1,1) model with different sliding windows. (a) Apply SGM(1,1) model to predict 5 drift rate with different sliding windows. (b) Apply SGM(1,1) model to predict 10 drift rate with different sliding windows.
Remotesensing 13 04864 g009
Figure 10. Prediction results of PGM(1,1) model with different sliding windows. (a) Apply SPGM to prediction 5 drift rate values with different sliding windows. (b) Apply SPGM to prediction 10 drift rate values with different sliding windows.
Remotesensing 13 04864 g010
Figure 11. Prediction results of WPGM(1,1) model with different sliding windows. (a) Apply WPGM to predict five drift rate values with different sliding windows. (b) Apply WPGM to predict 10 drift rate values with different sliding windows.
Remotesensing 13 04864 g011
Figure 12. Prediction results of SGMNN model with different sliding windows. (a) The sliding windows are set to 20/20/20; (b) The sliding windows are set to 5/20/20; (c) The sliding windows are set to 5/5/20; (d) The sliding windows are set to 5/5/5.
Remotesensing 13 04864 g012
Table 1. Calibration data of inertial platform drift rate from January 2018 to September 2020.
kYear/MonthDrift Rate (×10−4 °/h)kYear/MonthDrift Rate (×10−4 °/h)
12018/1118.8557162019/4243.8600
22018/2120.7557172019/5262.3600
32018/3108.8557182019/6282.3600
42018/4137.6660192019/7342.3600
52018/5128.6550202019/8302.1600
62018/6138.6660212019/9363.4600
72018/7148.6660222019/10358.7600
82018/8139.6660232019/11375.5600
92018/9149.6660242019/12396.4600
102018/10158.0960252020/1406.8000
112018/11179.5640262020/2415.7600
122018/12180.0600272020/3436.4700
132019/1193.2600282020/4436.4700
142019/2213.2600292020/5563.4700
152019/3223.2600302020/6583.8300
Table 2. Level ratio of drift rate data.
kΛ (×10−4)kΛ (×10−4)kΛ (×10−4)
110,159.85771110,027.6225219870.6873
29014.53931210,733.08902210,468.2796
312,646.65061311,034.87532310,556.5023
49345.44481410,468.91122410,260.8082
510,778.12761510,922.69102510,220.2557
610,721.15731610,758.63202610,498.1239
79394.61611710,762.31132710,000.0000
810,715.99391812,124.94692812,909.7074
910,563.2542198825.79742910,361.3325
1011,357.90912012,028.7265
Table 3. Model parameter settings.
ModelParameter
pA (×10−2)U (×10−4)
GM(1,1)0.5−1.3912.25
PGM(1,1)0.5−0.04401.33
WPGM(1,1)0.4−0.05401.32
Table 4. Prediction errors of GM(1,1) and improved GM(1,1) models.
Model DataGM(1,1) ModelPGM(1,1) ModelWPGM(1,1) Model
MAE (×10−4)MAPE (%)RMSE (×10−4)MAE (×10−4)MAPE (%)RMSE (×10−4)MAE (×10−4)MAPE (%)RMSE (×10−4)
1086.4623.32125.5085.0122.88123.7486.4823.33125.52
1556.3215.1285.8658.3215.6388.5056.3915.1485.95
2023.289.4733.7032.9510.3250.6230.989.9647.62
2524.2510.8830.0124.419.5136.0623.369.4833.88
Table 5. Prediction errors of GM(1,1) model with different sliding windows.
Length of Sliding WindowPredict 5 ValuesPredict 10 Values
MAE (×10−4)MAPE (%)RMSE (×10−4)MAE (×10−4)MAPE (%)RMSE (×10−4)
515.614.0916.6532.576.5251.39
1034.388.8439.1665.3114.7375.63
1531.468.1035.1861.6813.9472.37
2017.114.4320.8335.928.3046.95
Table 6. Prediction errors of PGM(1,1) model with different sliding windows.
Length of Sliding WindowPredict 5 ValuesPredict 10 Values
MAE (×10−4)MAPE (%)RMSE (×10−4)MAE (×10−4)MAPE (%)RMSE (×10−4)
515.614.0916.6532.576.5251.39
1034.388.8439.1665.3114.7375.63
1531.468.1035.1861.6813.9472.37
2017.114.4320.8335.928.3046.95
Table 7. Prediction errors of WPGM(1,1) model with different sliding windows.
Length of Sliding WindowPredict 5 ValuesPredict 10 Values
MAE (×10−4)MAPE (%)RMSE (×10−4)MAE (×10−4)MAPE (%)RMSE (×10−4)
512.323.2413.5928.485.6346.56
1034.979.0039.7067.0715.1177.90
1529.177.5132.7857.6913.0568.31
2014.663.8518.8328.786.7840.07
Table 8. Errors of five values predicted by SGMNN model with different sliding windows.
The Length of Sliding WindowsProduction Error
GM(1,1)PGM(1,1)WPGM(1,1)MAE (×10−4)MAPE (%)RMSE (×10−4)
2020204.571.235.57
520203.671.015.16
55203.250.894.98
5554.251.185.44
Table 9. Errors of prediction results with different models.
Production ModelMAE (×10−4)MAPE (%)RMSE (×10−4)
Linear regression83.4318.1696.67
Polynomials of order 243.3210.1353.09
Decision tree regression131.5428.52151.26
SVR regression208.1046.63221.09
Ridge regression83.6718.2296.90
GM (1,1)24.2510.8830.01
PGM (1,1)24.419.5136.06
WPGM (1,1)23.369.4833.88
SGM (1,1)15.614.0916.65
SPGM (1,1)15.614.0916.65
SWPGM (1,1)12.323.2413.59
SGMNN3.250.894.98
Neural Network16.224.1719.28
Publisher’s Note: MDPI stays neutral with regard to jurisdictional claims in published maps and institutional affiliations.

