Article

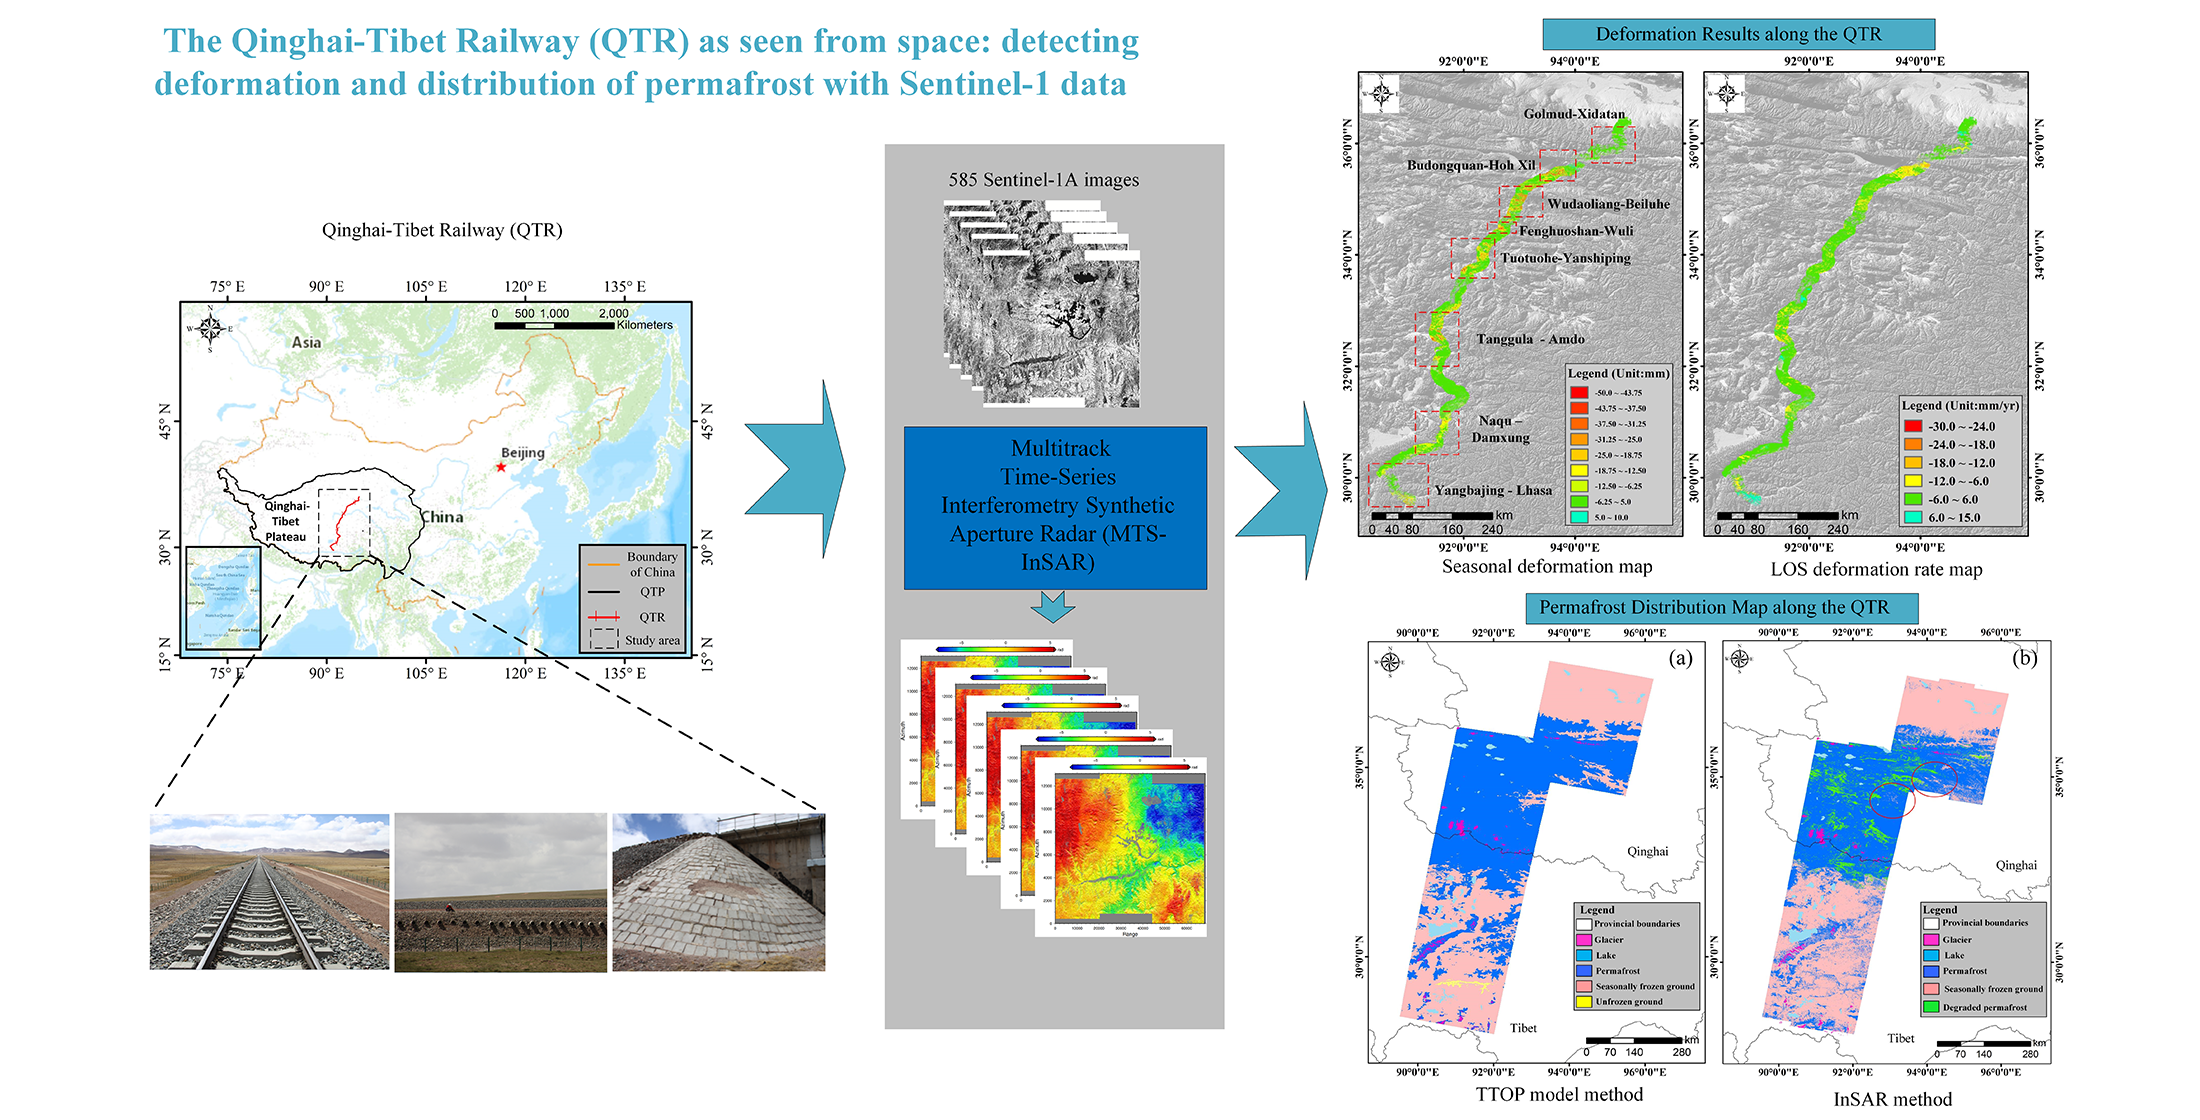
Freeze-Thaw Deformation Cycles and Temporal-Spatial Distribution of Permafrost along the Qinghai-Tibet Railway Using Multitrack InSAR Processing

1
Key Laboratory of Digital Earth Science, Aerospace Information Research Institute, Chinese Academy of Sciences, Beijing 100094, China
2
International Research Center of Big Data for Sustainable Development Goals, Beijing 100094, China
3
College of Resources and Environment, University of Chinese Academy of Sciences, Beijing 100049, China
*
Author to whom correspondence should be addressed.
Remote Sens. 2021, 13(23), 4744; https://doi.org/10.3390/rs13234744
Submission received: 27 August 2021 / Revised: 17 November 2021 / Accepted: 18 November 2021 / Published: 23 November 2021

Abstract

:
The Qinghai-Tibet Railway (QTR) is the railway with the highest elevation and longest distance in the world, spanning more than 1142 km from Golmud to Lhasa across the continuous permafrost region. Due to climate change and anthropogenic activities, geological disasters such as subsidence and thermal melt collapse have occurred in the QTR embankment. To conduct the large-scale permafrost monitoring and geohazard investigation along the QTR, we collected 585 Sentinel-1A images based on the composite index model using the multitrack time-series interferometry synthetic aperture radar (MTS-InSAR) method to retrieve the surface deformation over a 3.15 × 10⁵ km2 area along the QTR. Meanwhile, a new method for permafrost distribution mapping based on InSAR time series deformation was proposed. Finally, the seasonal deformation map and a new map of permafrost distribution along the QTR from Golmud to Lhasa were obtained. The results showed that the estimated seasonal deformation range of the 10 km buffer zone along the QTR was −50–10 mm, and the LOS deformation rate ranged from −30 to 15 mm/yr. In addition, the deformation results were validated by leveling measurements, and the range of absolute error was between 0.1 and 4.62 mm. Most of the QTR was relatively stable. Some geohazard-prone sections were detected and analyzed along the QTR. The permafrost distribution results were mostly consistent with the simulated results of Zou’s method, based on the temperature at the top of permafrost (TTOP) model. This study reveals recent deformation characteristics of the QTR, and has significant scientific implications and applicational value for ensuring the safe operation of the QTR. Moreover, our method, based on InSAR results, provides new insights for permafrost classification on the Qinghai-Tibet Plateau (QTP).

Graphical Abstract

1. Introduction

Permafrost is the soil that stays frozen, with a temperature remaining at or below 0 °C, for at least two consecutive years [1]. The Qinghai-Tibet Plateau (QTP) permafrost area is approximately 1.5 million km2, which is the highest and most extensive permafrost in low-middle latitudes on Earth [2,3,4]. Due to climate change and anthropogenic interference, permafrost has been degraded over a significant area in recent years [5,6]. The thermal state of permafrost is sensitive to changing climatic conditions, especially increasing air temperatures [7]. Therefore, such changes in permafrost will have serious consequences for ecosystems, hydrological systems, and infrastructure integrity [8]. In particular, due to the construction and operation of the Qinghai-Tibet Railway (QTR), the Qinghai-Tibet Highway (QTH), oil and gas pipelines, and the impacts of human activities on the QTP, the local topography, the surface conditions of frozen soil (vegetation, snow cover, and water), and the physical properties of the shallow layers of the ground have changed dramatically [9,10]. Therefore, the thermal state of the permafrost and the long-term stability of the roadbed are facing great challenges, and these changes may trigger geohazards along the Qinghai-Tibet Engineering corridor [11]. The QTR is the highest-elevated and longest railway across a permafrost region in the world [12]. Permafrost subsidence is a common hazard affecting the stability of railway embankment. Moreover, the temporal–spatial distribution of permafrost is a major component of cryosphere research. Seasonally frozen ground and permafrost are widely distributed along the QTR, and their deformation laws are different. The deformation laws of the freeze-thaw cycles of different types of frozen soil are closely related to the permafrost distribution. Therefore, it is of great scientific significance to conduct long-term deformation monitoring and large-scale permafrost research along the QTR, and it is also necessary to study the distribution characteristics of frozen soil and to evaluate the influence of temporal-spatial changes of frozen soil on regional climate system [13].
Traditional geodetic measurement methods of permafrost along the Qinghai-Tibet Engineering corridor include leveling surveys [14], global navigation satellite system (GNSS) surveys [15], and drilling [16]. These methods can obtain the single-point and high-precision measurement results of the Qinghai-Tibet Engineering corridor [17]. However, the results can only be obtained at limited sections, and it is also difficult and time-consuming to measure in the harsh environmental plateau [18].
Synthetic aperture radar interferometry (InSAR) is a useful tool to investigate large and hard-to-access permafrost areas with high spatial and temporal resolutions, wide coverage, and frequent acquisitions of SAR images [19,20,21]. Several studies have demonstrated the ability of differential SAR interferometry (DInSAR) to detect ground displacements at millimeter to centimeter scales, and monitor ground movement related to freezing/thawing over permafrost regions of the QTP [19,22,23,24]. However, there are some limitations that the DInSAR technique encounters to measure the movement of permafrost, such as atmospheric disturbances [25], temporal decorrelation [21,26,27], and nonlinear motion trends caused by seasonal deformation of the active layer above the permafrost [28,29]. The persistent scatterer interferometry (PSI) technique [30] is used to retrieve the slow surface deformation in frozen soil regions by extracting highly coherent permanent scatterer (PS) points [31]. SBAS-InSAR technology [32], with small spatial-temporal baseline interferograms, has greatly improved the density of the measurement points in alpine steppe and alpine meadow areas of the QTP [24,33]. Due to the surface deformation of permafrost is a complex physical process, and the linear deformation model is generally adopted to retrieve the ground deformation in time series InSAR analysis. To describe the freezing and thawing processes of permafrost, a series of deformation models are proposed, such as a sinusoidal or cosinoidal model [34,35], a seasonal deformation model based on the square root of the accumulated degree days of thaw [18,36,37], and a normalized composite index based on the two seasonal coefficients (subsidence/uplift), as well as linear deformation trends [31,33] and a deformation model considering both the external (mainly climatic) and the internal factors (such as tectonic activities and thermal character) [38].
Recent studies have highlighted the potential of multitemporal radar interferometry (MT-InSAR) to detect and monitor the seasonal ground displacements caused by freezing and thawing processes of the active layer of permafrost [19,24,29,33,39]. Deformation monitoring of the QTR and QTH is carried out using multisource SAR data [18,40]. The active layer thickness (ALT) inversion model based on seasonal deformation, soil moisture, and soil porosity are established to derive the ALT [35,37,41,42,43]. The MT-InSAR technology also provides continuous measurements of surface displacements at a large scale and over a long period in permafrost regions [19,44], and monitors surface deformation and permafrost degradation over a discontinuous permafrost terrain [29,45]. The recent launch of Sentinel-1A/B satellites with a short revisit time enables scientists to study the seasonal and inter-annual deformation of frozen soil in greater detail [19,24,44]. A considerable number of studies on deformation monitoring along the QTR mostly focus on some sections of the QTR at the regional scale [18,22,23,28,40,46,47], and little attention has been paid to the freeze-thaw cycles of seasonal deformation of the whole QTR.
On the other hand, to effectively understand permafrost distribution and estimate future permafrost degradation, some researchers in the field of cryopedology are devoted to the study of permafrost distribution mapping [48,49,50,51]. They compile many permafrost maps by using multi-source datasets based on mathematical and physical models to evaluate the distribution and thermal states of frozen soil on the QTP in different periods [52]. With the development of remote sensing and Geographic Information System (GIS) technology, permafrost models are gradually improved, and the new maps of permafrost distribution on the QTP have been compiled [53,54]. Although these physical or mathematical models provide good permafrost distribution maps, these models with many parameters (such as surface temperature, vegetation coverage, snow depth, annual average ground temperature, soil moisture, altitude, and so on) are complicated and computationally intensive. Furthermore, some approaches are based on field observation data, which are difficult to obtain, and the spatial resolutions of permafrost distribution maps are low. For example, Zou et al. [53] proposed the permafrost distribution map with a resolution of 1 km based on the Temperature at the Top of The Permafrost (TTOP) model and remote sensing technology.
The abovementioned literature demonstrates the usefulness of InSAR in retrieving ground deformation of the QTR and the effectiveness of model methods in permafrost distribution mapping. However, none of these studies take advantage of InSAR deformation results to study the seasonal deformation characteristics in such wide coverage of entire QTR and explore the study of permafrost distribution mapping.
The purpose of this study aims to employ the multitrack time-series interferometry synthetic aperture radar (MTS-InSAR) method based on a composite index model to retrieve the ground displacement and map permafrost distribution from the Golmud to Lhasa section along the QTR. Firstly, 585 scenes of the Sentinel-1 dataset from March 2017 to March 2020 are collected to implement the InSAR process. Secondly, the deformation maps over a 3.15 × 10⁵ km2 area along the QTR are obtained. Subsequently, some geohazard-prone sections of the QTR are determined, and the freeze-thaw deformation cycles, combined with the daily air temperature data and deformation results, are analyzed. Finally, the unsupervised classification method of Iterative Self-Organizing Data Analysis Technique (ISODATA) based on an InSAR time series deformation is used to map permafrost distribution along the QTR.

2. Study Area and Dataset
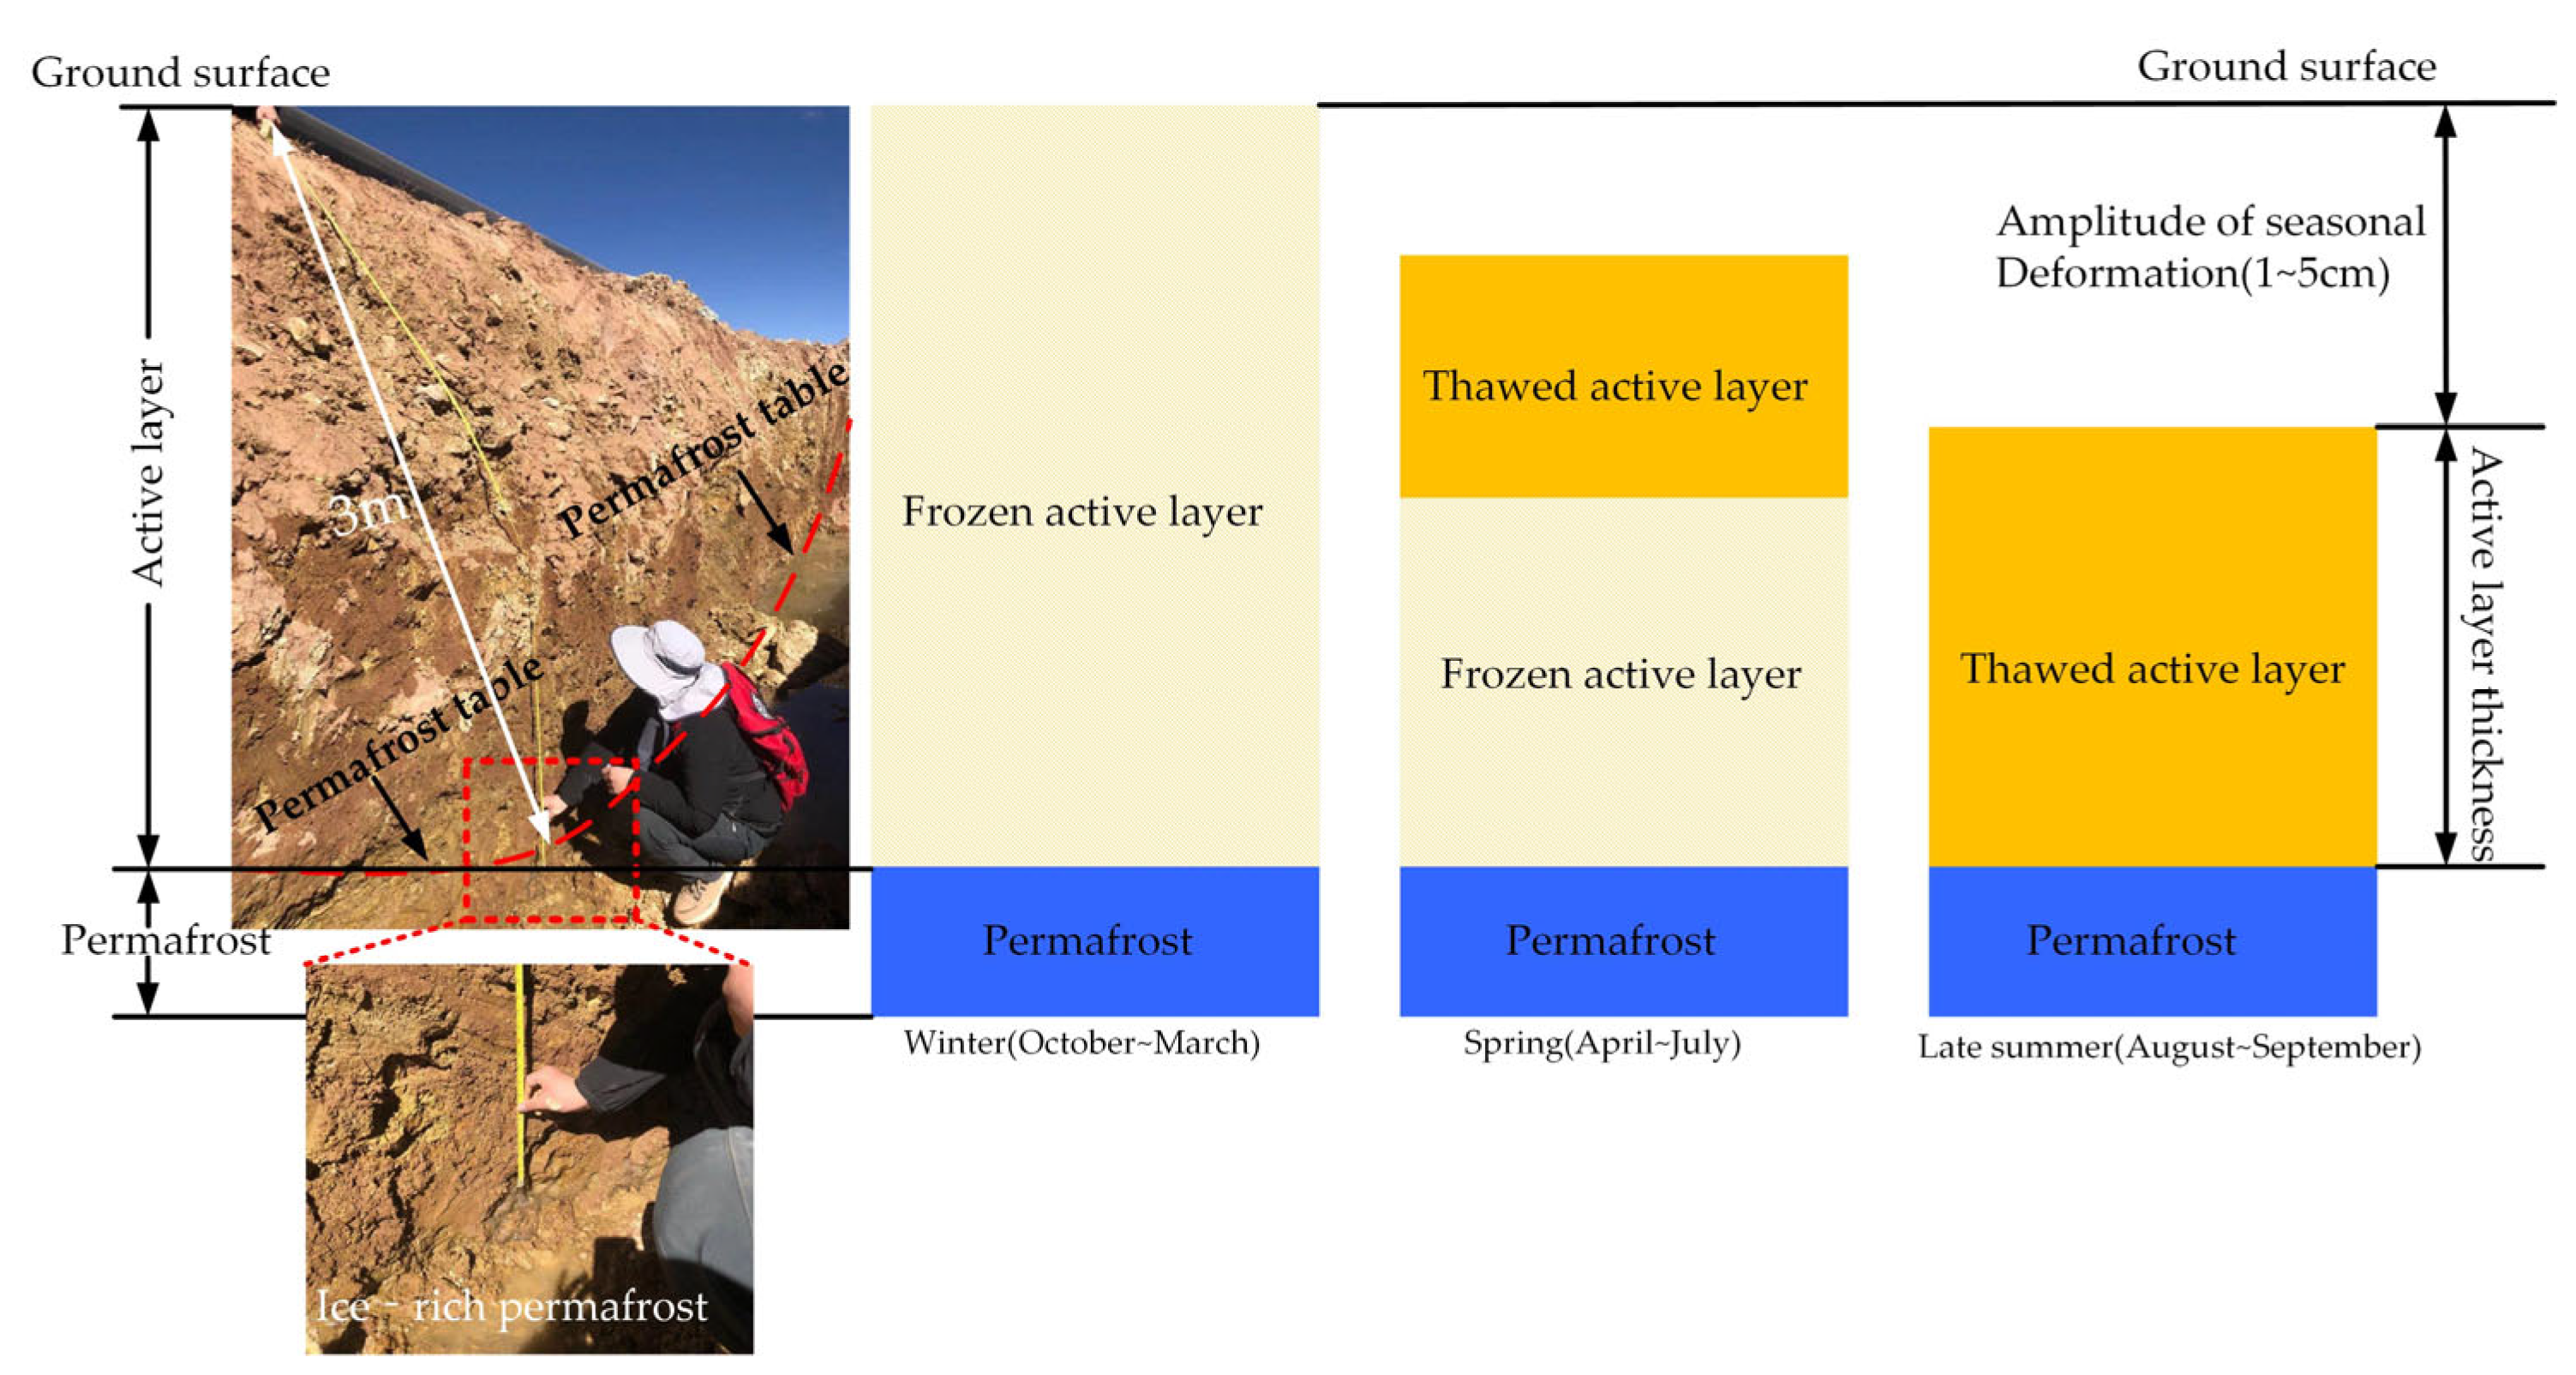
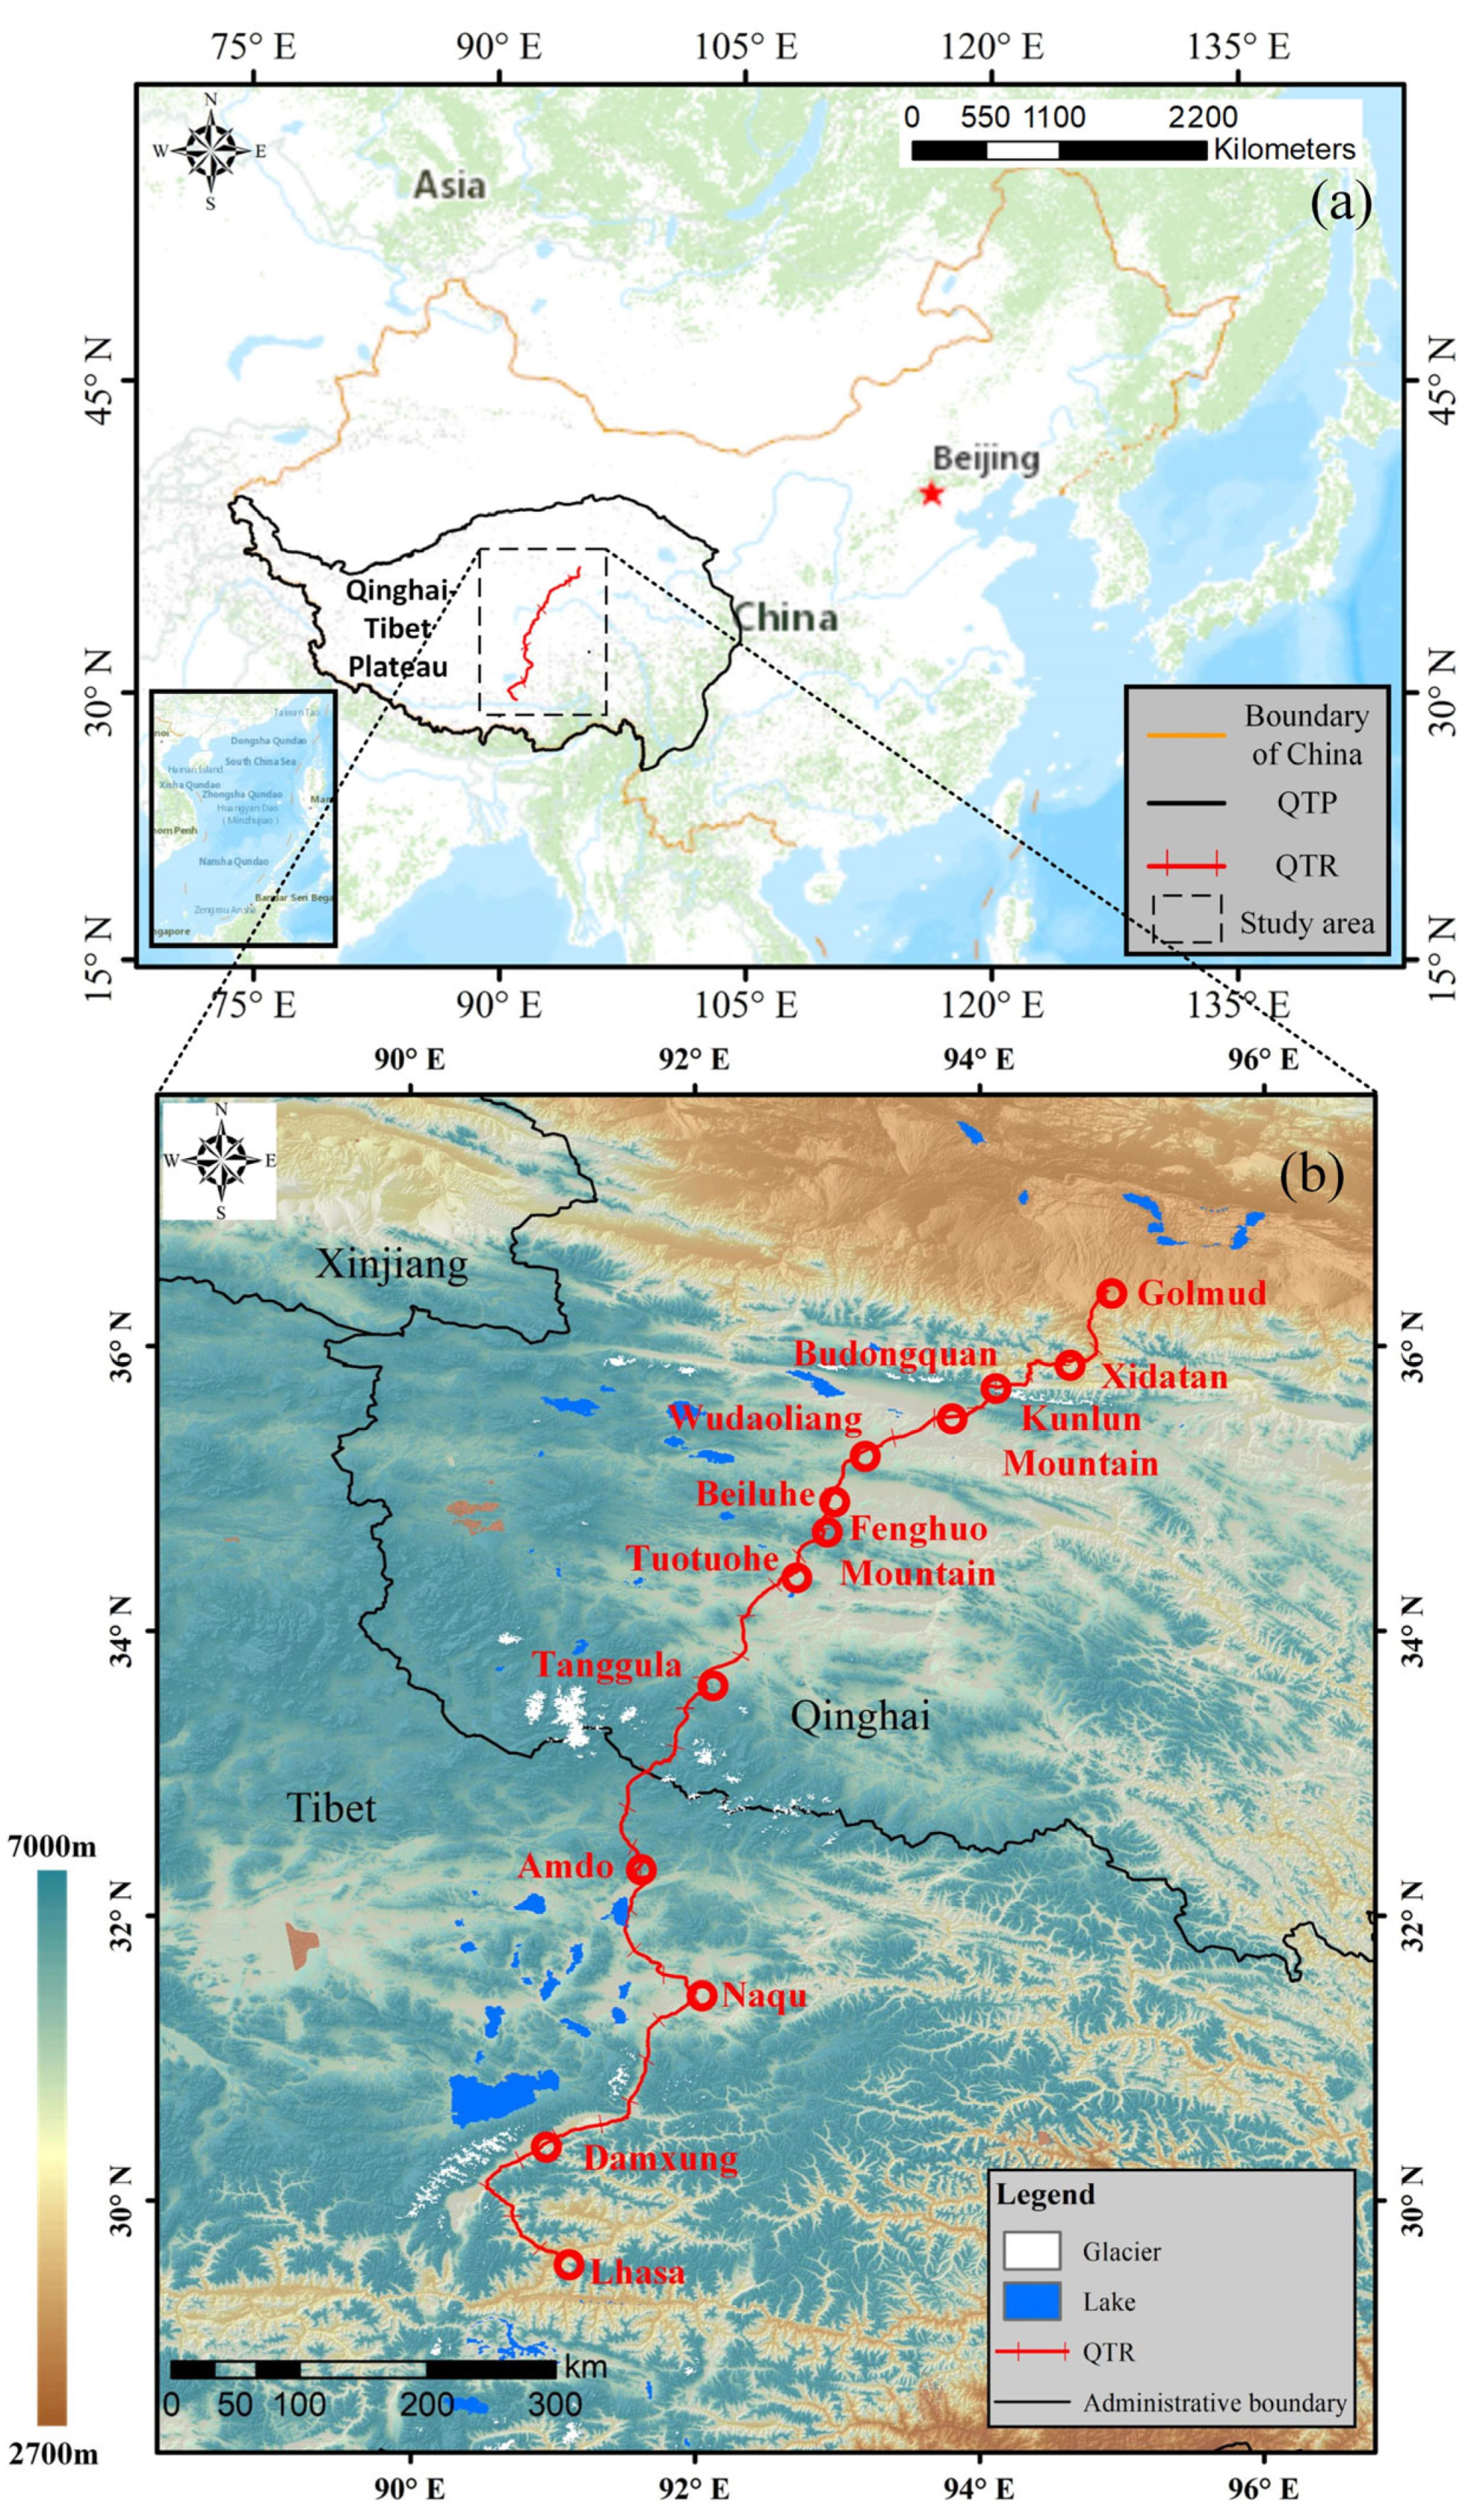
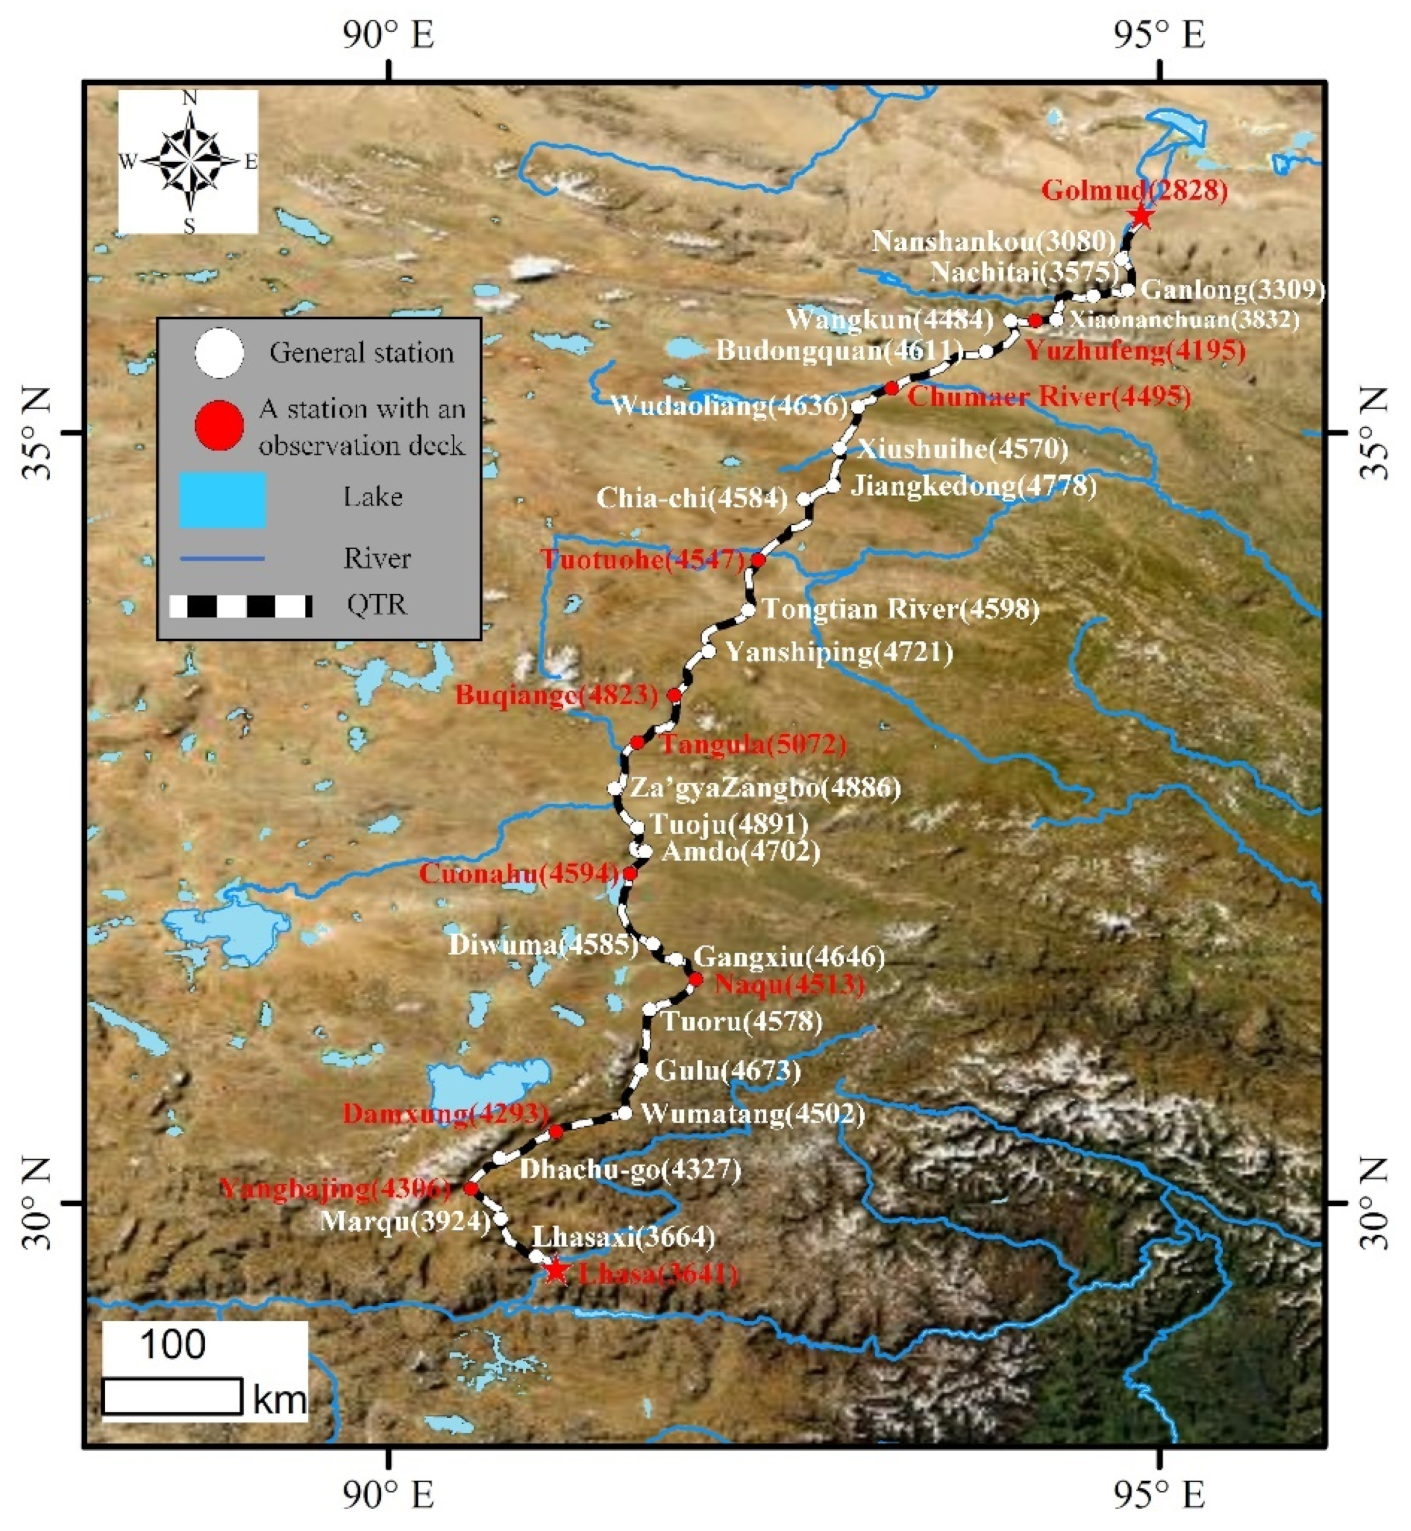
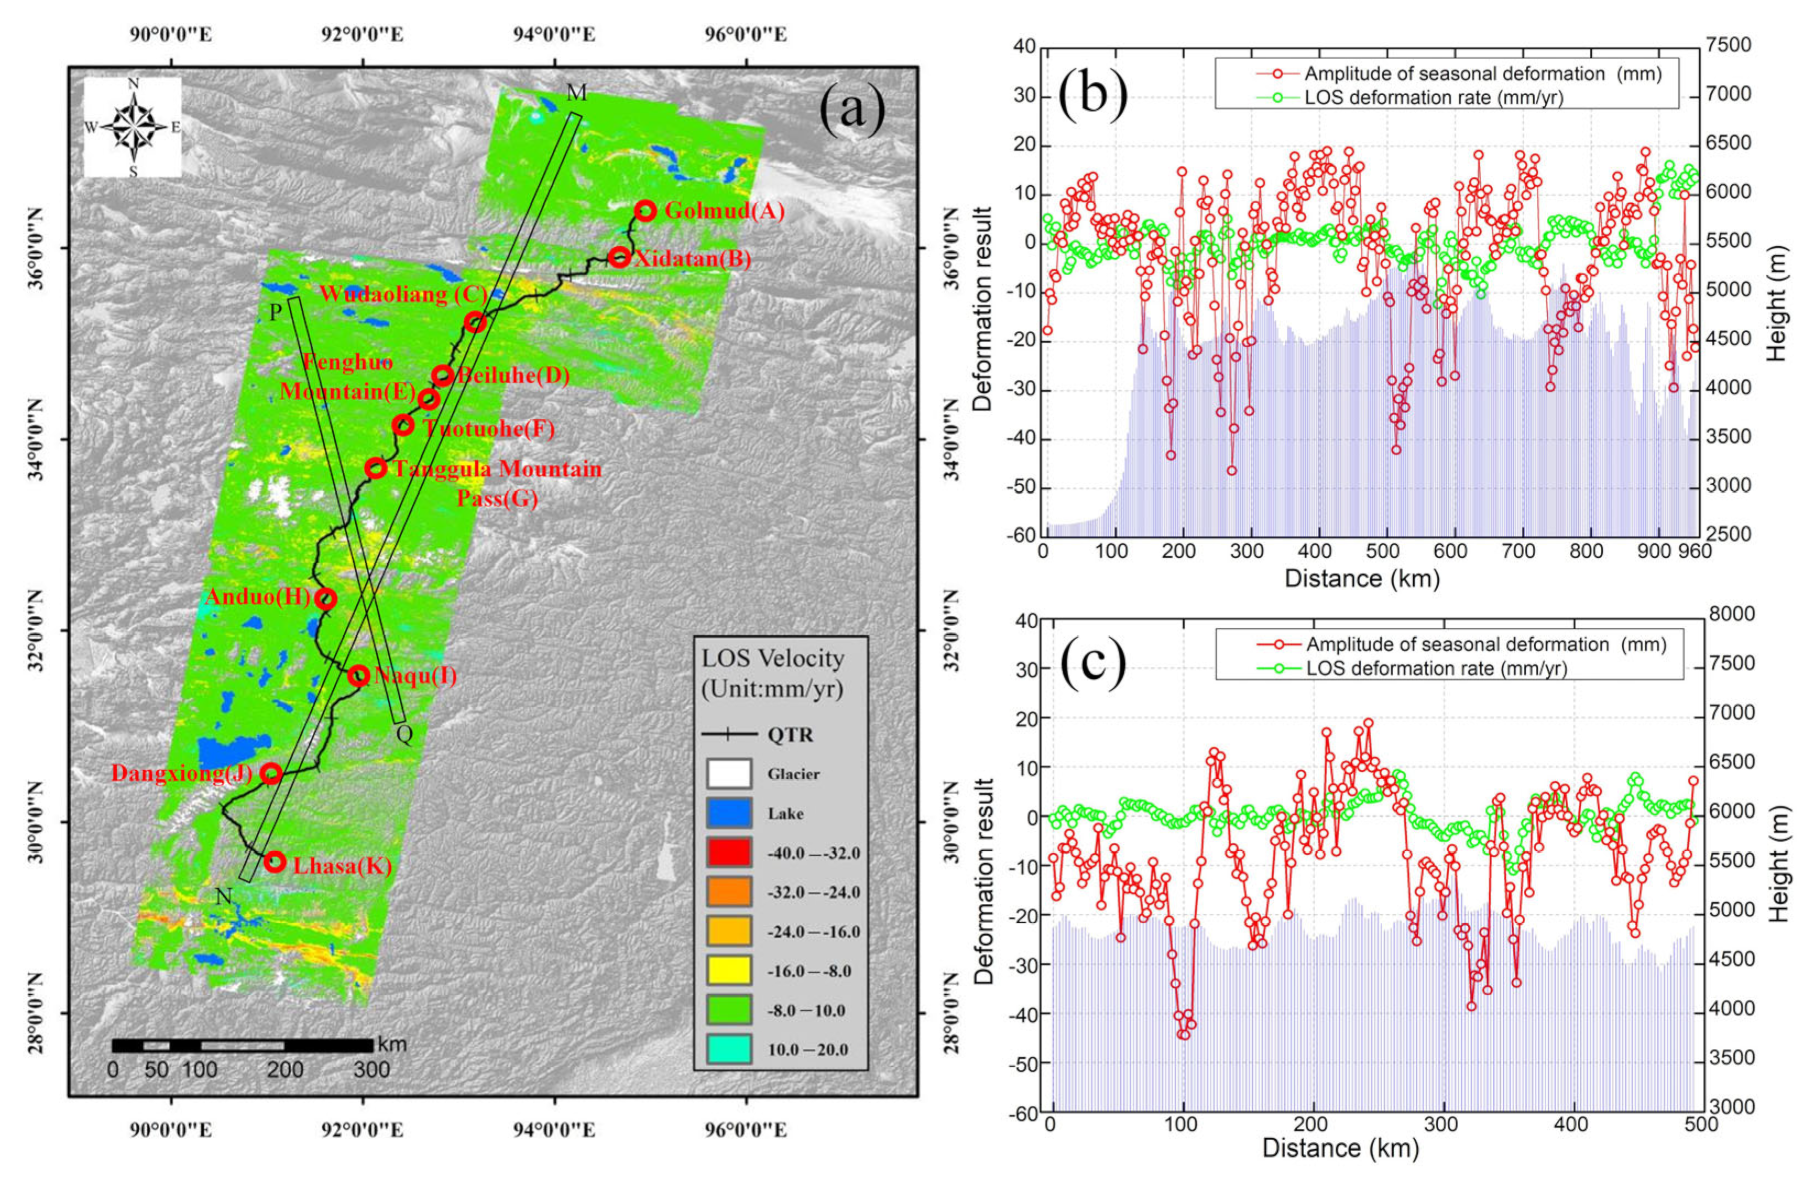
2.1. Study Area

Figure 1a shows that the study area is located in the eastern part of the QTP. The elevation ranges from 2700 to 7000 m (see Figure 1b), covering an area of approximately 8.97 × 10⁵ km2 (89.319–96.524° E, 27.838–37.938° N). The QTR starts in Golmud, passes through Xidatan Basin, Kunlun Mountain, Budongquan, Wudaoliang, Beiluhe, Fenghuoshan, Tuotuohe, crosses Tanggula Mountain, goes through Amdo, Naqu, Damxung of Tibet, and ends at Lhasa, with a total length of 1142 km, as shown in Figure 1b.
The study area has typical and complete types of landforms, including alpine meadows, alpine deserts, alpine steppes, floodplains, glaciers, and lakes. The terrain is complex, including high-altitude mountains, plateaus, and basins. The mean annual ground temperature is higher than −0.5 °C, exceptionally lower than −0.5 °C, and most of the active layer thickness is greater than 3 m. The climatic types in the study area are arid and semiarid, which are characterized by the subtle seasons, low temperature with high altitudes, and more diurnal sunlight hours. The average annual air temperature in this region is 0 °C, with the highest temperature recorded in July and the lowest temperature recorded in January or December. The freezing period lasts for 7–8 months. The annual precipitation in most areas along the QTR is 200–300 mm, the rainy season is from May to September, and the dry season is from October to April [55].

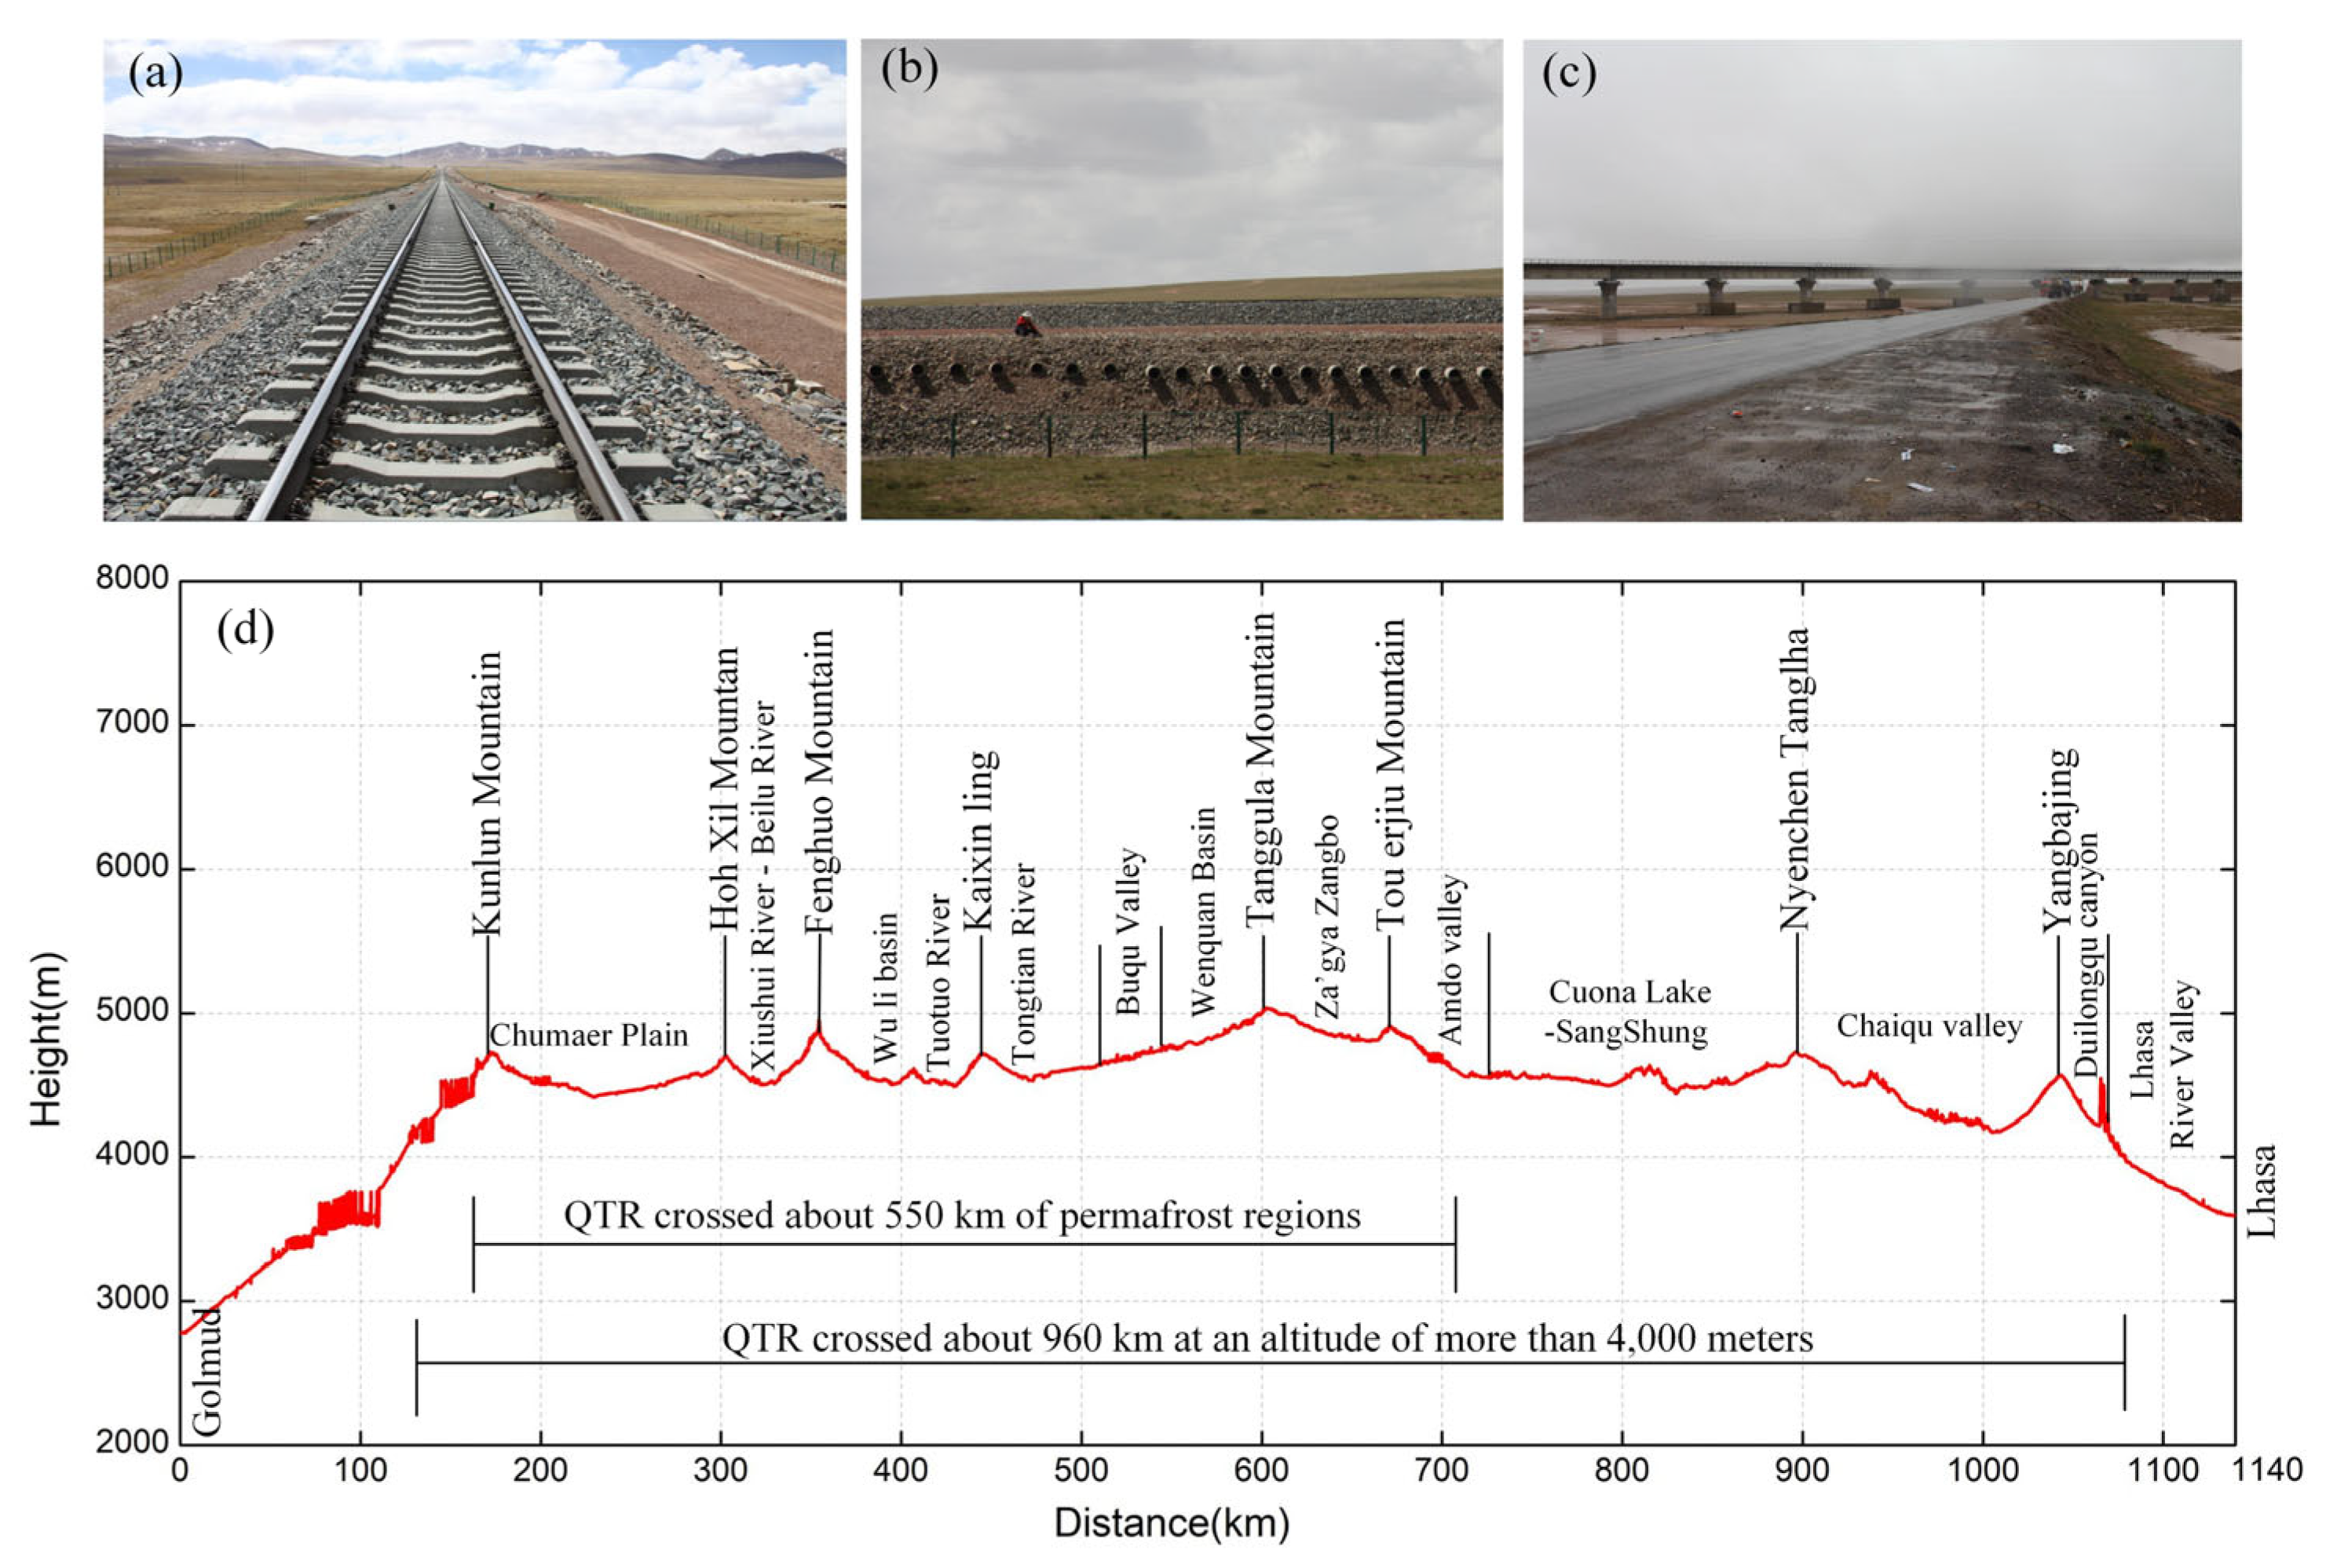
2.2. Qinghai-Tibet Railway

The QTR is one of the four major projects in China’s western development strategy. Figure 2 shows the QTR from Golmud to Lhasa, which started on 29 June 2001 and opened to traffic on 1 July 2006 [56]. Kunlun mountain tunnel with a length of 1686 m and an elevation of 4648 m is the longest plateau permafrost tunnel in the world. Tanggula station, with an altitude of 5072 m, is located in the permafrost area of Tanggula Mountain, and is the highest railway station in the world. Fenghuo Mountain tunnel is located on the Fenghuo Mountain at an altitude of 5010 m, with a total length of 1338 m. It is currently the world’s highest altitude tunnel across the permafrost region [57].
Figure 3 shows the elevation profile and field photos of the section from Golmud to Lhasa of the QTR. The QTR crosses many high-altitude mountains, such as Hoh Xil Mountain, Kaixin Mountain, Fenghuo Mountain, Tanggula Mountain, Tou Erjiu Mountain, and Nyenchen Tanglha, respectively, etc. [58]. Other sections of the QTR belong to high plain landform with flat terrain. The rivers across the QTR include the Kunlun River, Chumaer River, Beiluhe, Tuotuohe, Yangtze River, Buqu River, Za’gya Zangbo River, Tongtian River, Nujiang River, and Yarlung Zangbo River (Figure 2 and Figure 3).
The QTR has the following characteristics: active geological conditions, frequent tectonic movement, high altitude, strong sun radiation, and complex permafrost. The total length of the QTR in permafrost regions is approximately 550 km, and approximately 82 km passes through discontinuous permafrost (Figure 3). Along the QTR, the area at an altitude of 4000 m high is 960 km long, accounting for 84% of the total length of the QTR, and the temperature is below −10 °C in many places year-round [59]. The frozen soil layer thickness is greater than 60 m, and the average active layer thickness ranges from 1.2 m to 4.9 m [55,59].
The permafrost in Xidatan area is mostly island-shaped frozen soil. There are some glaciers and seasonal run-offs from the Kunlun Mountains. In recent years, due to rising temperatures and human activities, some glaciers have melted, and soil moisture has increased, causing subsidence in the area. The Budongquan-Hoh Xil section of the QTR, with an average elevation of approximately 4600 m, is located between the north side of the Tanggula Mountains and the south side of the Kunlun Mountains. The QTR surrounding the Salt Lake is deteriorating at an accelerated rate [45] in the Hoh Xil region. Some researches show that serious surface deformation has occurred in the Wudaoliang-Beiluhe section of the QTR, with amplitudes up to 40 mm in recent years [24]. The terrain in Naqu is relatively flat, and there are thaw lakes nearby. The degradation of frozen soil and the influence of soil moisture may cause settlement in the area. There are some glaciers and various geothermal fields, and the average annual precipitation is 617.5 mm in Yangbajing area. Abundant rainfall and the migration of geothermal fluids in geothermal fields may have an impact along the QTR. The long-term observation of permafrost along the QTR has indicated that permafrost subsidence is a common hazard affecting the stability of the railway embankment [60]. Therefore, it is necessary to conduct real-time deformation and geological hazard monitoring along the QTR.

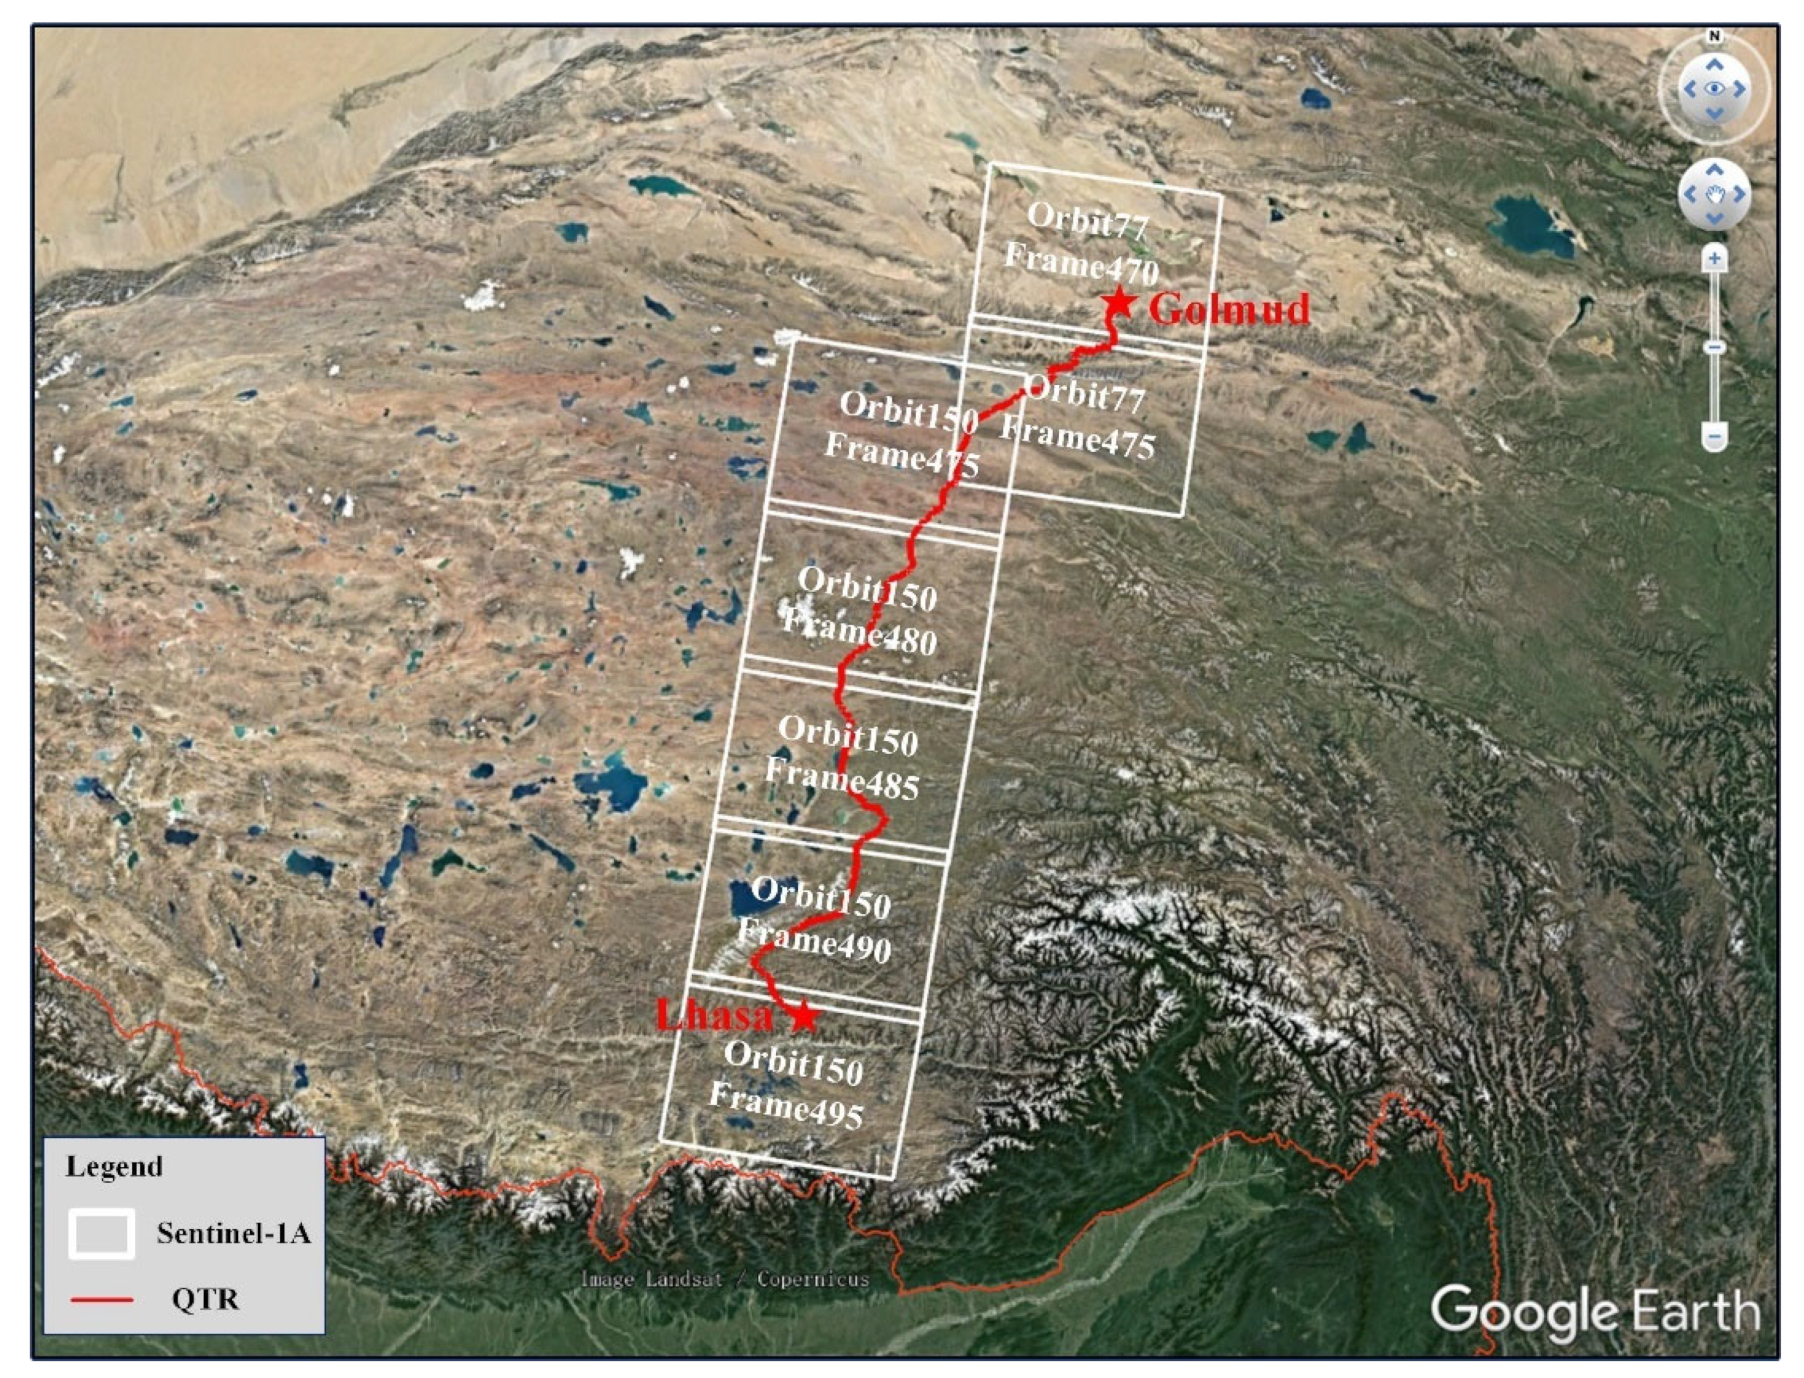
2.3. Sentinel-1 Dataset
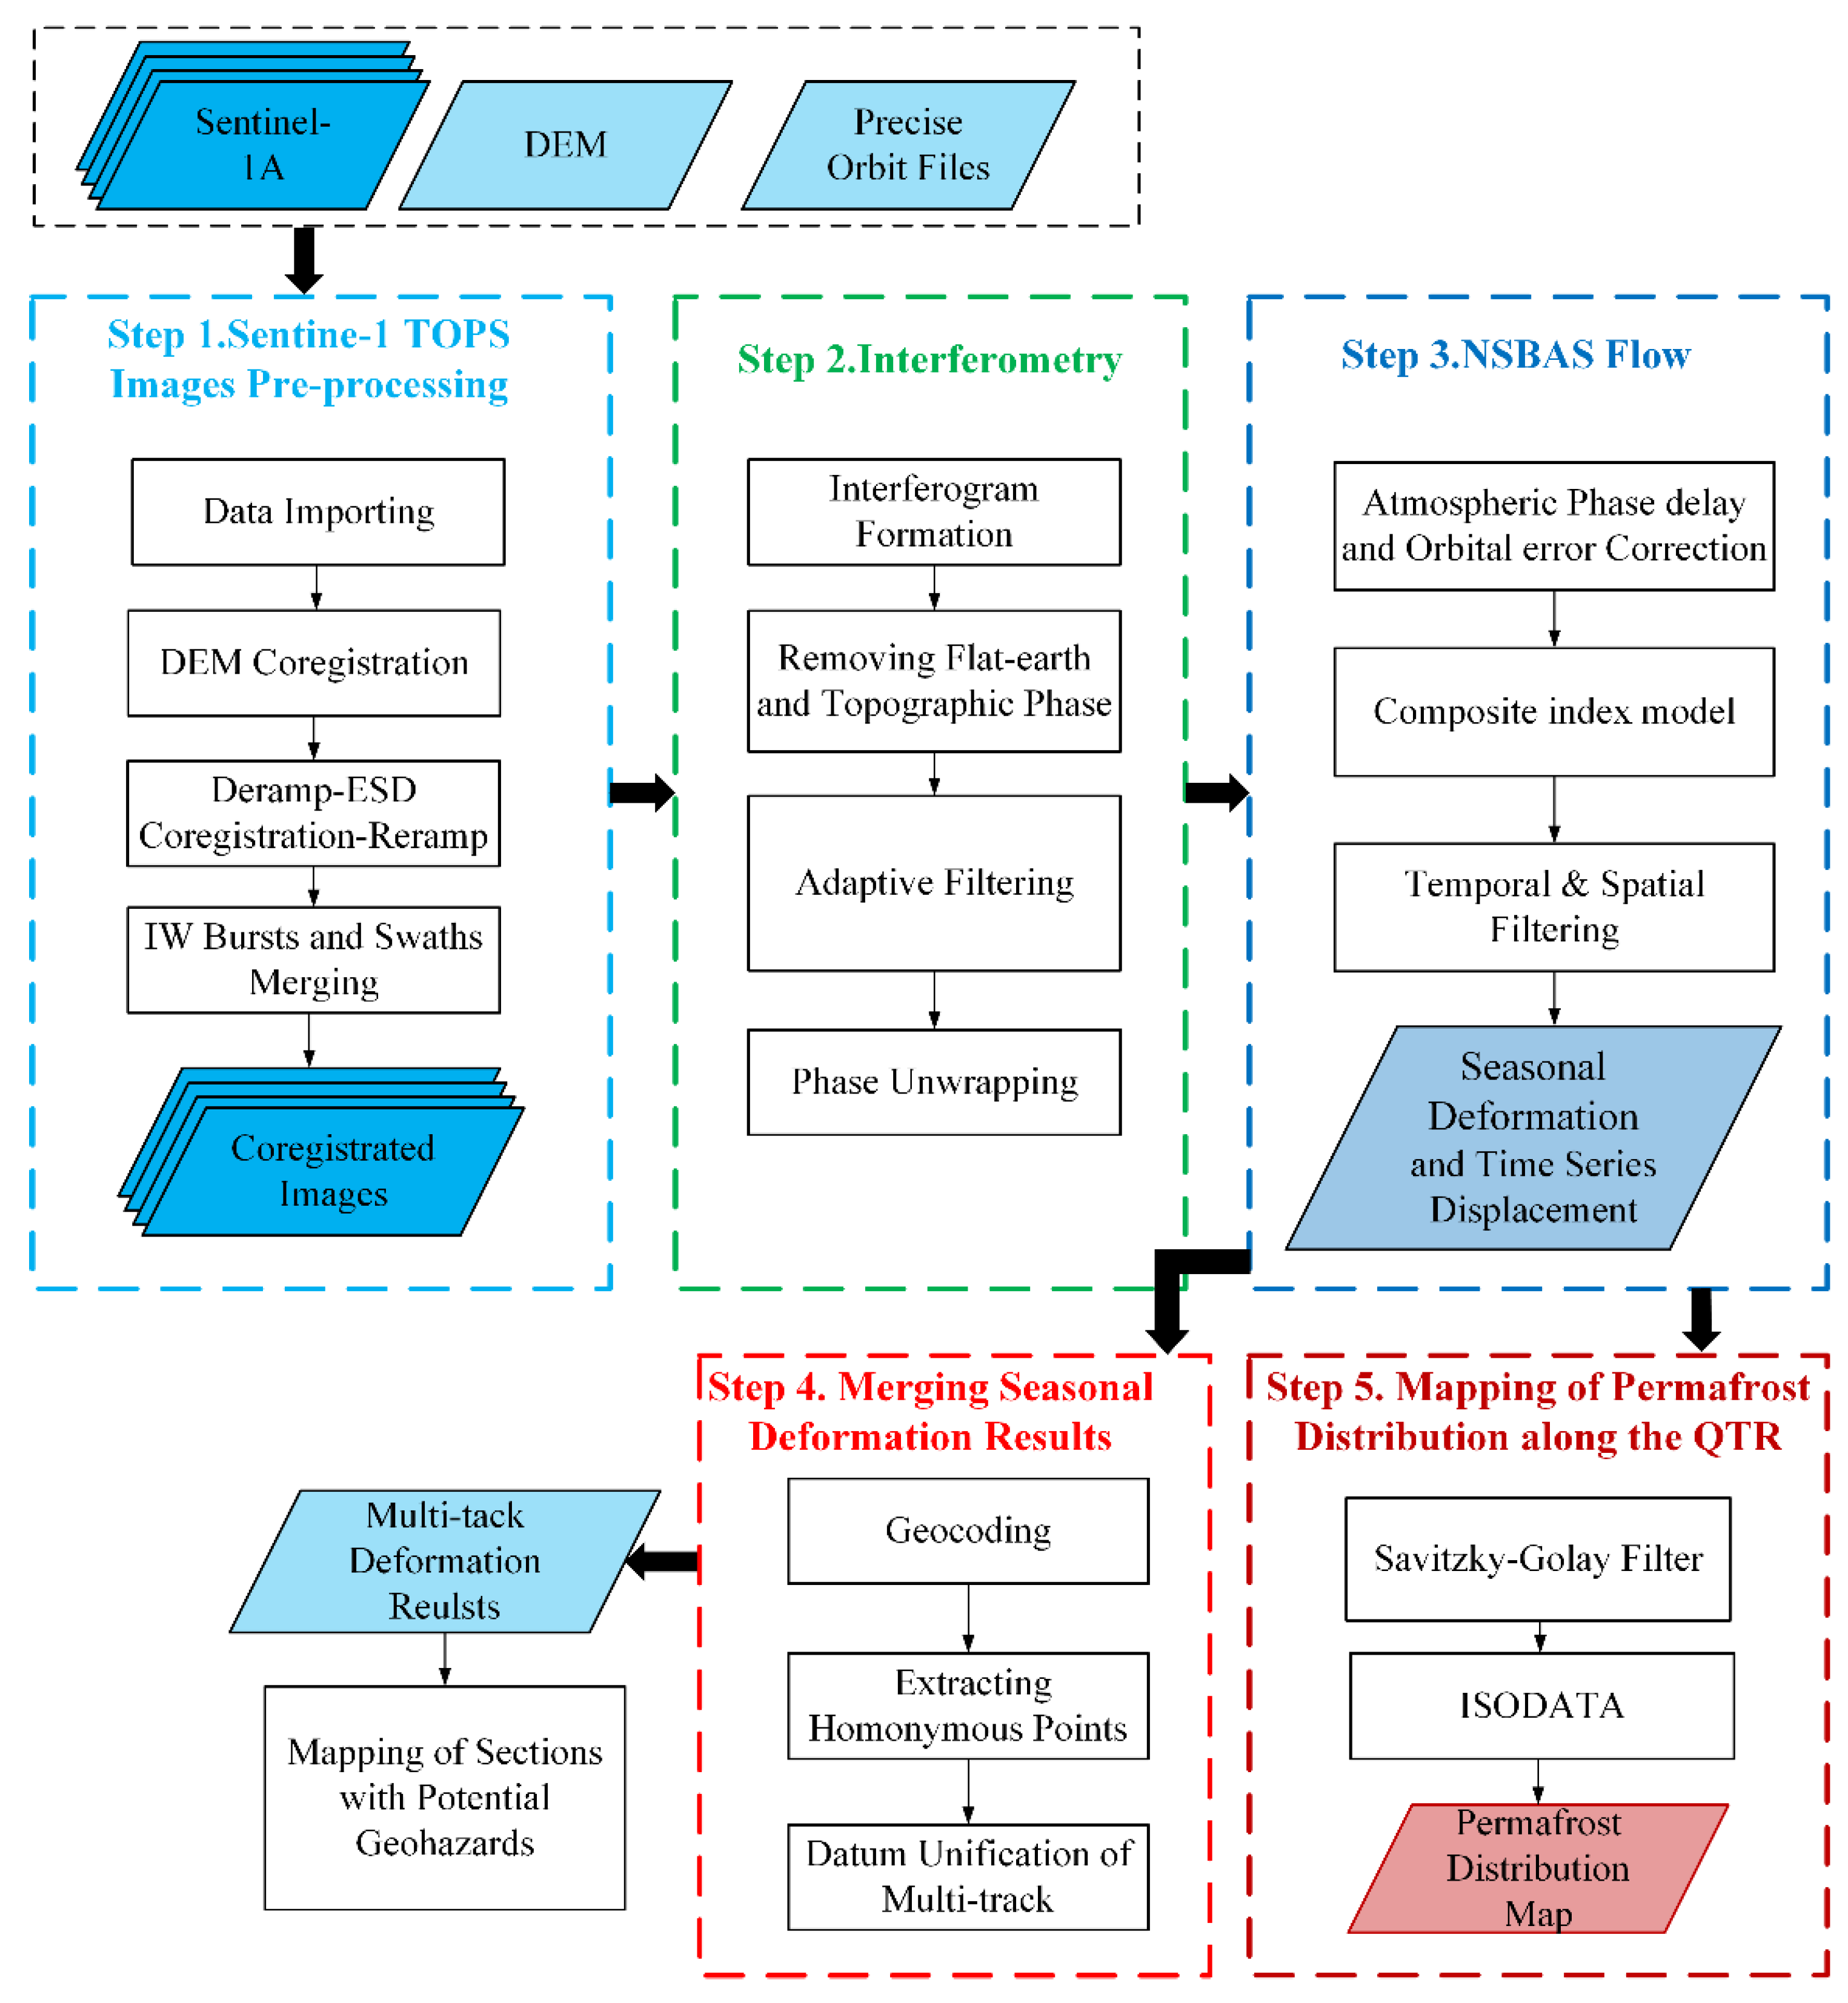
A total of 585 scenes of descending Sentinel-1A TOPS SAR images along two adjacent tracks covering seven frames from 16 March 2017 to 24 March 2020, were collected to monitor surface deformation along the QTR. The coverage of Sentinel-1 images was approximately 3.15 × 10⁵ km2, as shown in Figure 4. Sentinel-1 SAR datasets were acquired by the novel interferometric wide swath (IW) TOPS mode, with a total swath width of 250 km. The range and azimuth pixel spacing intervals were 2.33 m and 13.93 m, respectively. There are 80 to 86 scenes for each frame, and the total data volume of the data is about 2340 GB. The detailed data information is shown in Table 1.

3. Methodology

This study employs the new small baseline subset (NSBAS) approach based on the composite index model to investigate the surface deformation of the QTR. The Savitzky–Golay (SG) filter algorithm [61] is used to smooth InSAR time-series deformation, and the ISODATA method [62] is applied to map permafrost distribution along the QTR.
The five main steps of the process are shown in Figure 5. This flowchart includes the main processing steps: (1) Sentinel-1 TOPS Image Preprocessing—GMTSAR software is used to implement the DEM co-registration and ESD co-registration of Sentinel-1 data [63]; (2) interferometry—all the Sentinel-1 interferograms are multi-looked by factors of 12 and 3 along the range and azimuth directions, respectively; (3) NSBAS flow—the GIAnT toolbox is adopted to execute the NSBAS inversion [64]; (4) merging seasonal deformation results—finally, the geohazard-prone sections of the QTR based on the seasonal deformation results are determined; and (5) mapping of permafrost distribution along the QTR.

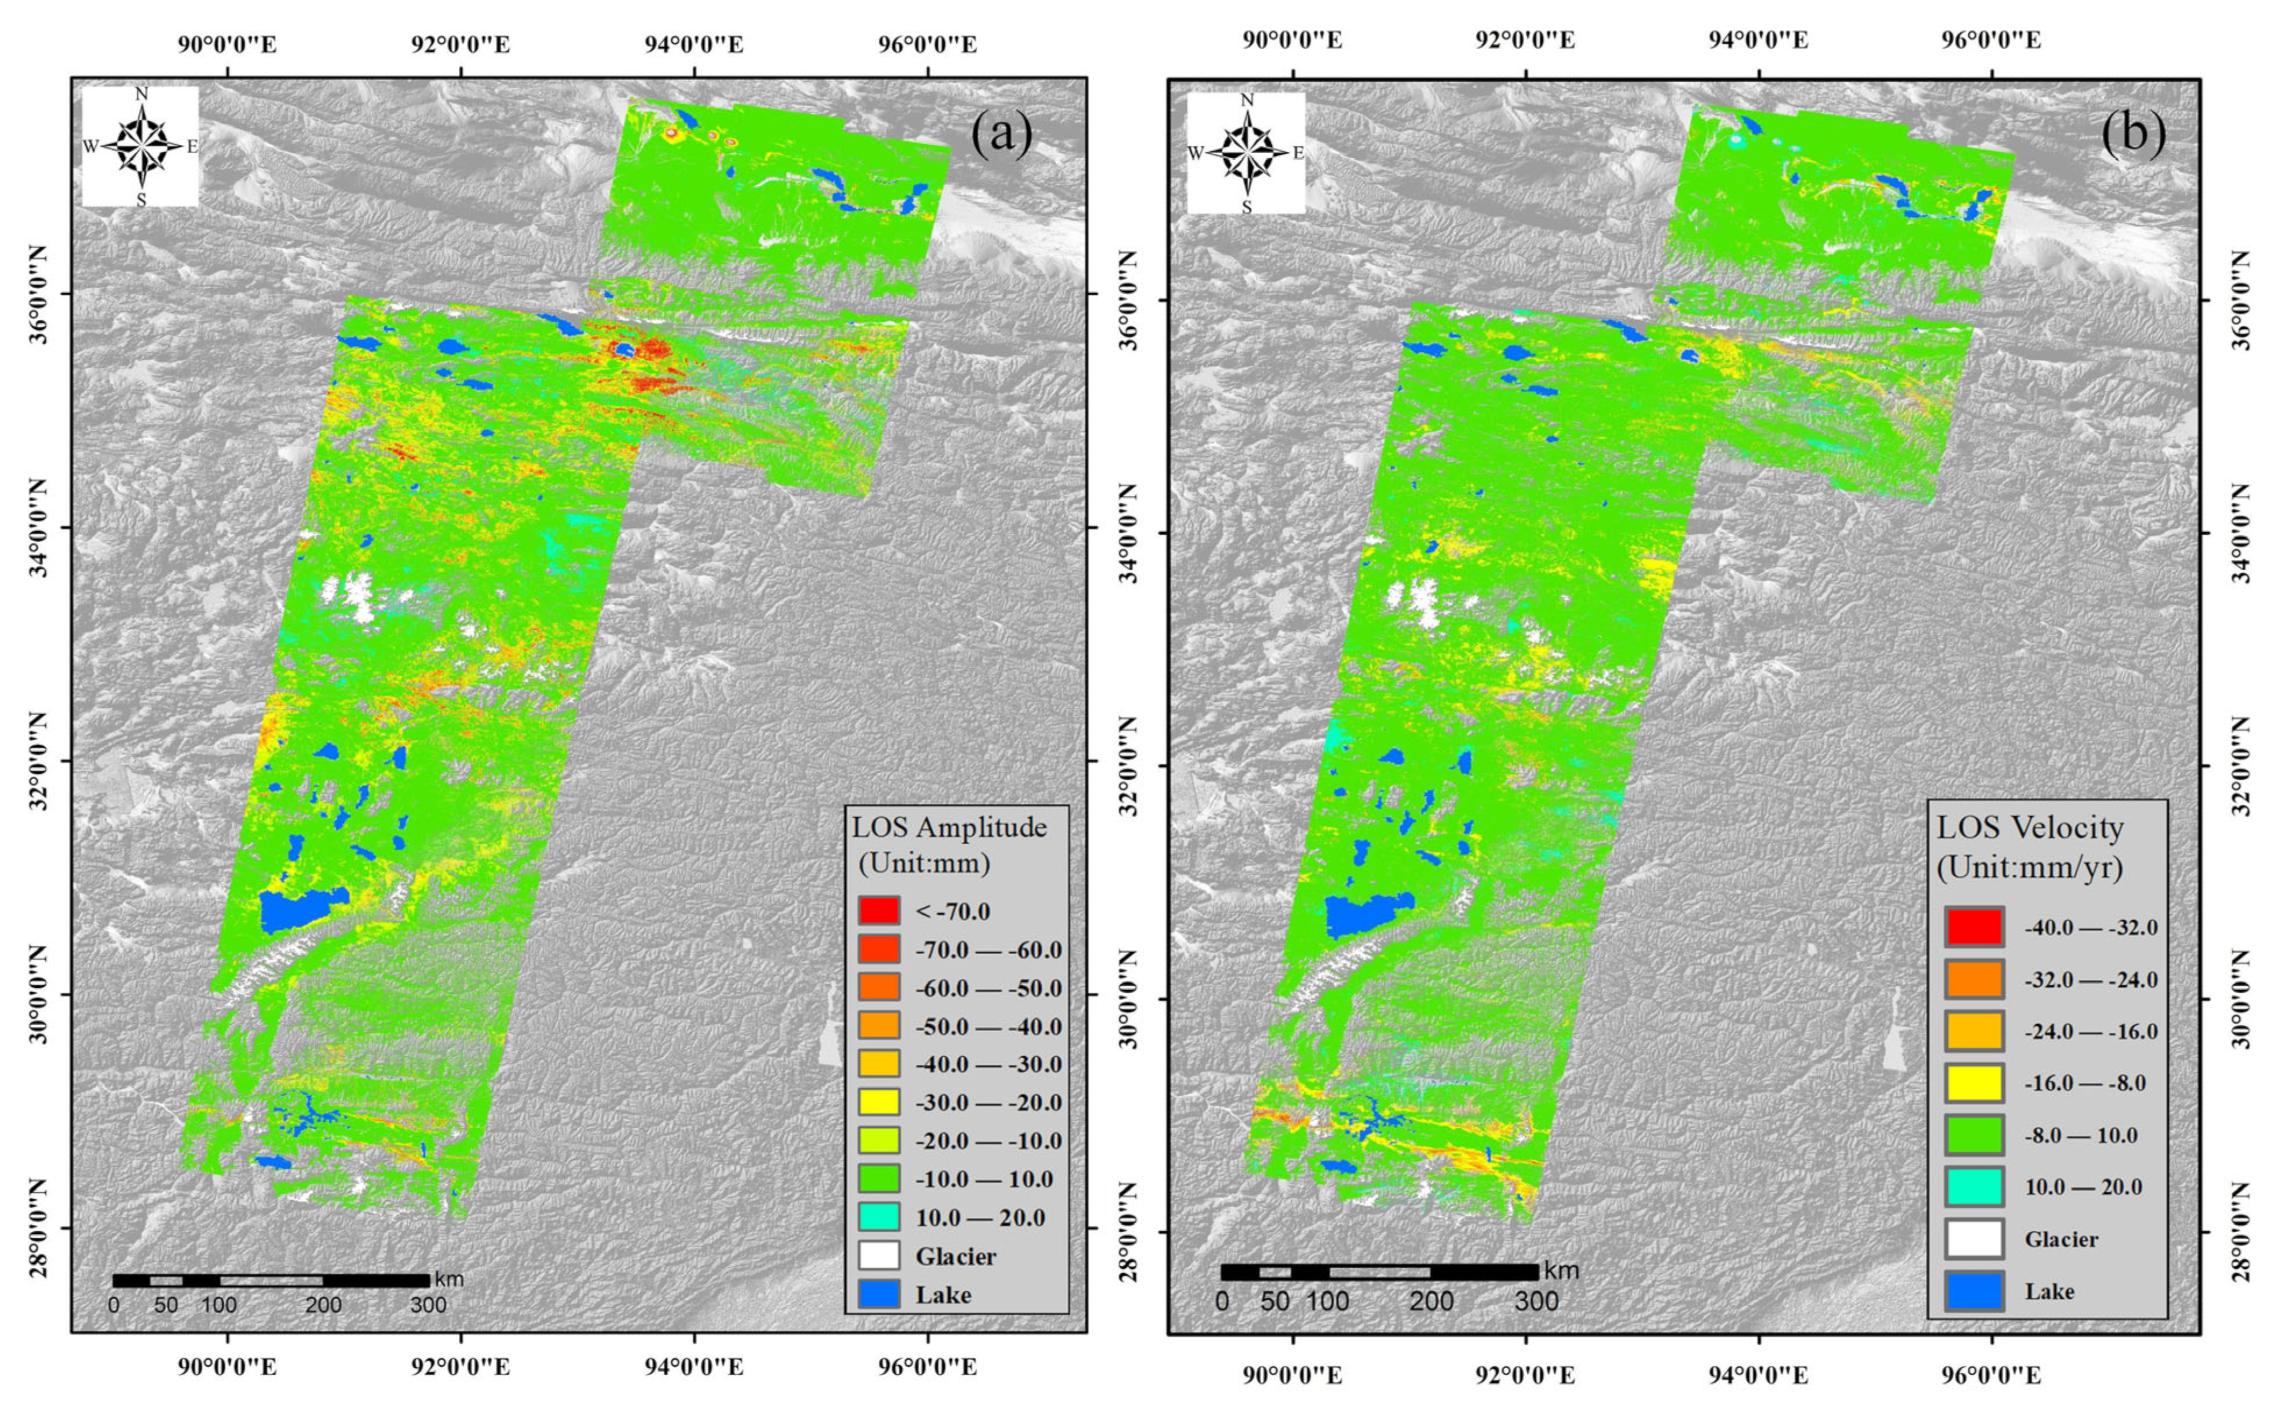
3.1. Composite Index Model Based on the NSBAS Method

The calculation of this composite index model is explained in detail by Hu et al. [65], and is based on the daily averaged air temperature data in our study area by downscaling the ERA5 monthly averaged reanalysis product. A composite index deformation model based on Stefan’s equation is used to approximate deformation of frozen soil. It includes thawing subsidence ( s ( t ) ) and freezing uplift ( u ( t ) ) and can be expressed as follows:
d s ( t ) = s ( t ) u ( t ) = E T A T ( t ) E F A F ( t )
where d s is the elevation at any given time t during the annual thaw-freeze cycle. E T and E F are time-invariant coefficients based on the soil thermal conductivity, n-factors (which are ratios accounting for the offset between the air temperature and the ground surface temperature), the accumulated degree days of thawing or freezing, the soil bulk density, the volumetric water content, and the specific latent heat of fusion for water [65].
Furthermore, the two seasonal coefficients E T and E F are related to a scaling factor α:
α = k F n F k T n T
where k F and k T are the soil thermal conductivities that can be obtained from the local soil type and volumetric water content [42]. n F and n T can be calculated as shown by Cao et al. [66].
Based on Equations (1) and (2), the composite index I(t) can be calculated as follows:
I ( t ) = A T ( t ) α A F ( t )
where A T ( t ) and A F ( t ) are the square roots of the accumulated degree of thawing and freezing days associated with seasonal deformation, respectively, which can be calculated according to the 2-m air temperature [37].
The linear deformation model is modified by adding seasonal deformation and residual deformation. The observed deformation during SAR image acquisition dates can be expressed as the sum of the seasonal deformation and linear deformation changes in the thawing and freezing period as follows:
d ( t ) = d s I ( t ) + d v t + c
where d ( t ) is the total surface deformation on any day t since the onset of thawing or freezing; d s is the maximum seasonal subsidence (mm); d v is the linear deformation rate (mm/yr); and c is the residual deformation between the observations and the fitted model.

3.2. NSBAS Method

For the given pixel x in N interferograms of M SAR images, the unwrapped interferogram set was written as a linear combination of the phase values of each pixel of Sentinel-1 images, as shown in the following equation [67]:
d x = G x m x Φ x i j = n = i j 1 δ φ n
where d x is the phase vector of pixel x of N x interferograms; G x is a N x × ( M x 1 ) matrix composed of 0, −1 and 1; and m x is the phase increment composed of pixel x, namely, the unwrapped interferometric phase to be solved. Φ x i j is the phase of the unwrapped interferometric phase composed of pixels x of the i-th and j-th SAR images, and δ φ n is the phase increment of pixel x between the SAR image acquisition times n and n + 1.
The above equation can be solved by least squares, and single value decomposition (SVD) can be used to solve when the matrix is singular [32]. However, the above equation has a rank defect problem; that is, a key link is missing in the interconnection of the interferogram network. In this case, the SAR data network connection is divided into two or more independent image groups, and some images or image groups are not connected. When SVD replaces the least square to invert the time series displacement, it sets the phase delay increment between successive image groups to zero [67]. Therefore, the time series deformation calculation will be biased. To overcome this defect, the NSBAS method adds constraints to optimize the deformation calculation in the deformation inversion process [67]. The cumulative phase delay φ x k of pixel x at time k is defined as follows:
φ x T = V x t ( t t T ) + I ( t ) S + e x B T + c x t φ x F = V x t ( t t F ) + I ( t ) S + e x B F + c x t
where V represents the long-term linear deformation rate; S represents the maximum seasonal subsidence; e x B is the DEM error associated with the perpendicular baseline; and I ( t ) is the composite index combining the freezing and thawing processes. t T and t F are the starting times of thawing and freezing, respectively. The following constraints can be added to the deformation inversion. The seasonal deformation model is applied to NSBAS technology to calculate the seasonal deformation.
d x 1 d x k d x N l 0 0 = G x 0 0 0 0 0 0 0 0 γ · 0 0 0 0 0 B 1 1 1 T t f I ( t ) B 2 1 0 1 1 1 0 T t f I ( t ) B M l 1 m x 1 m M x 1 V S e t c
When t T t t F , it is in the thawing period, then T t f = t t T ; when t > t F , T t f = t t F . According to Equations (6) and (7), the least squares algorithm can be used to calculate the deformation parameters of frozen soil.

3.3. Merging of Seasonal Deformation Results of Multi-Track Sentinel-1 Images

Once the InSAR deformation results of each SAR image are obtained by using the NSBAS method, the InSAR results of different frames will be merged in the latitude and longitude geographic coordinate systems. Firstly, the deformation results are geocoded by using the range-Doppler (RD) geolocation algorithm to convert the SAR image in the azimuth-range coordinate system into geographic latitude and longitude coordinates [68]. Since the reference points of the multitrack deformation results are not consistent, there may be some differences in the multitrack overlapping area. It is necessary to adjust and mosaic the deformation results of multitrack Sentinel-1 data. Secondly, the same measurement points in multitrack overlapping areas based on geographic coordinates are extracted. Thirdly, the datum offset is calculated using Equations (8) and (9) [43] by analyzing the distribution of the homonymous point difference of the multitrack [69]:
v ¯ = i = 1 n ( v a i v b i ) n
S ¯ = i = 1 n ( S a i S b i ) n
where n is the number of homonymous measurement points in the overlapping area; i is the i-th homonymous measurement point; and a, b represent the deformation results of Sentinel-1 image a and image b, respectively. v ¯ and S ¯ represent the average deformation rates and seasonal deformation of homonymous measurement points in the overlapping area of the adjacent tracks, respectively. v a i and S a i are the deformation rates and seasonal deformation results of the i-th homonymous measurement point of the Sentinel-1 image a, respectively. v b i and S b i are corresponding value of the Sentinel-1 image b.
Finally, the InSAR results of image a and image b by these equations are merged. The multitrack Sentinel-1 results of different frames are spliced together.

3.4. Permafrost Distribution Mapping Based on InSAR Time Series Deformation

In this study, the ISODATA algorithm is implemented to classify the permafrost along the QTR, based on the time series InSAR deformation results. The time series deformation of each pixel may have residual topographic phase error, phase unwrapping error, noise error, and so on, after the MTS-InSAR process, thus it needs to be smoothed. Firstly, SG filtering algorithm is used to preprocess the time series deformation, which can better retain the original characteristics of signals [61]. Then, the permafrost is classified according to the filtered time series deformation. Since the deformation law of permafrost and seasonally frozen ground is complex and unpredictable, the unsupervised classification ISODATA method is adopted to classify frozen soil [62]. Compared with the K-means algorithm, ISODATA algorithm has the following advantages: it does not need to artificially specify the number of permafrost clusters; and it can dynamically merge or split classes, automatically adjust the number of clusters, and divide sample data into good cluster results by iterative operation [70]. The detailed process of the ISODATA algorithm can be seen in the literature [62,70,71].

4. Results and Analysis

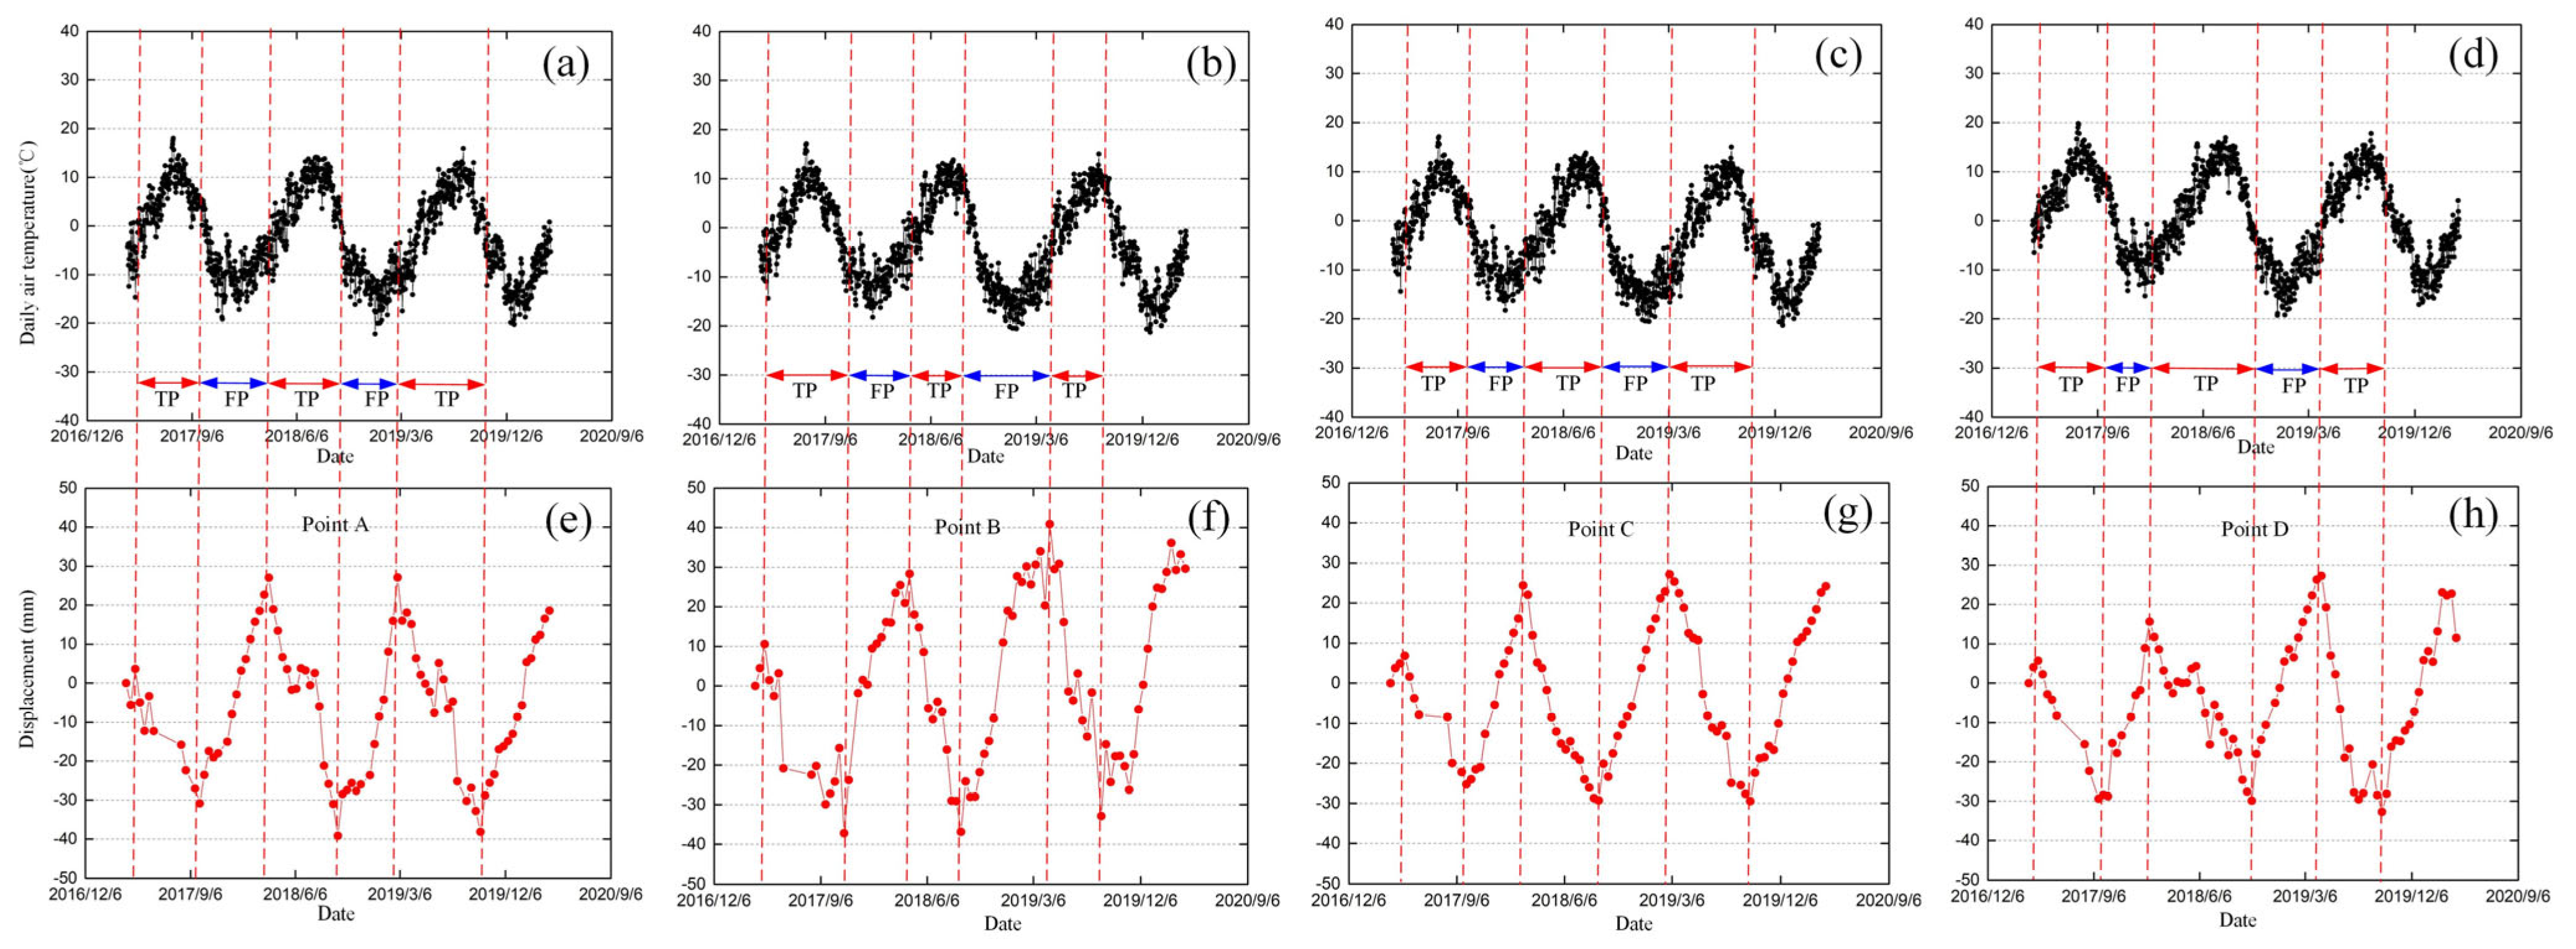
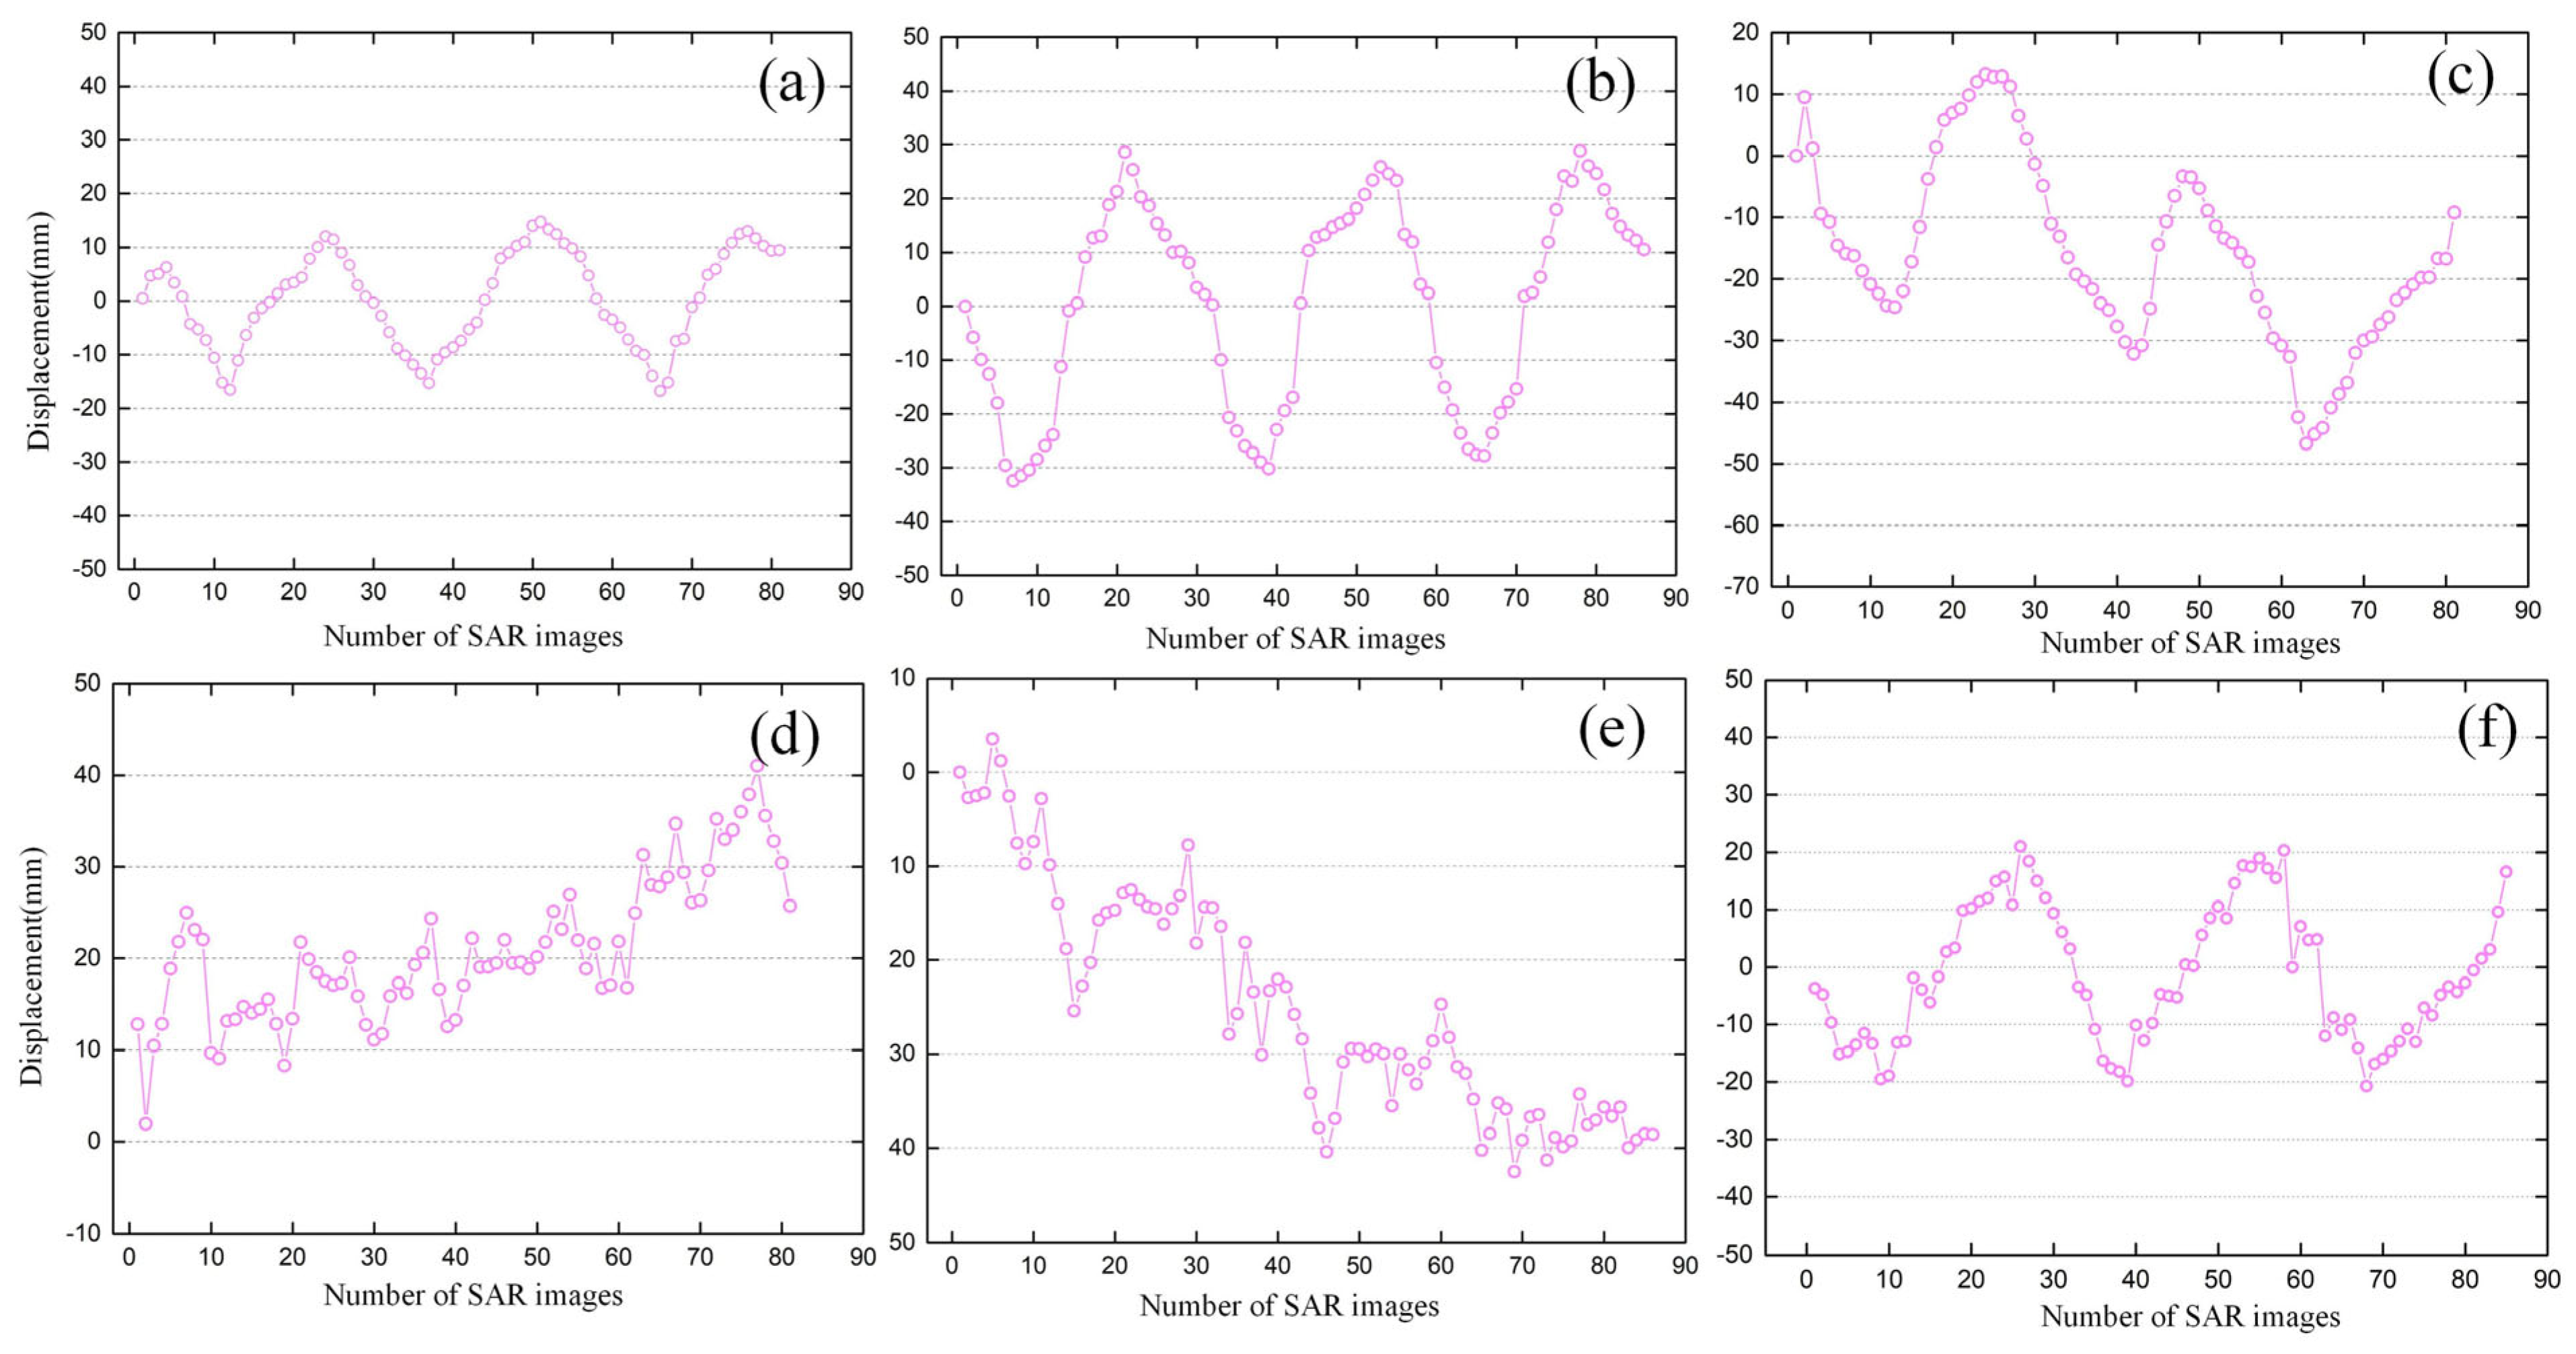
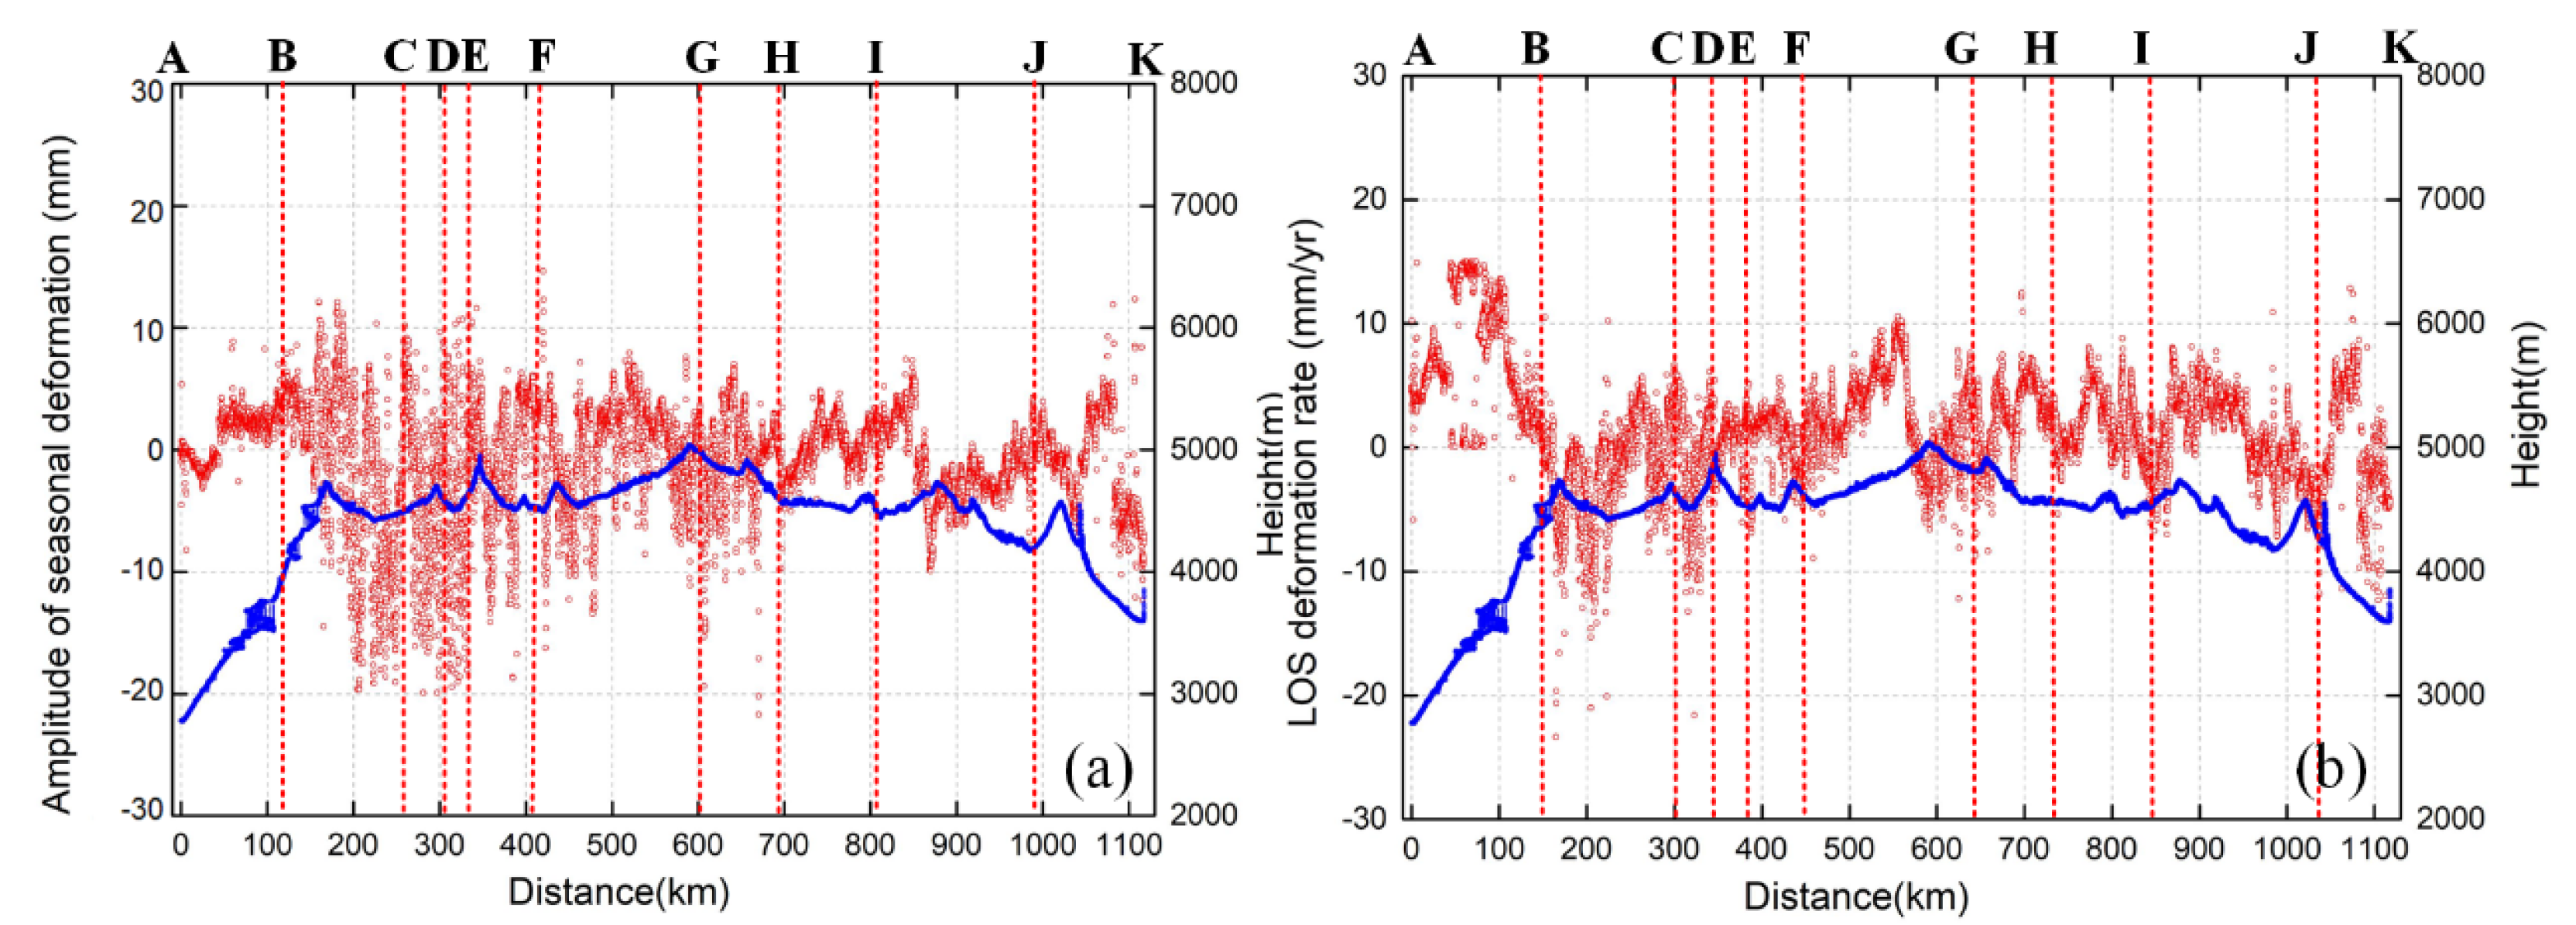
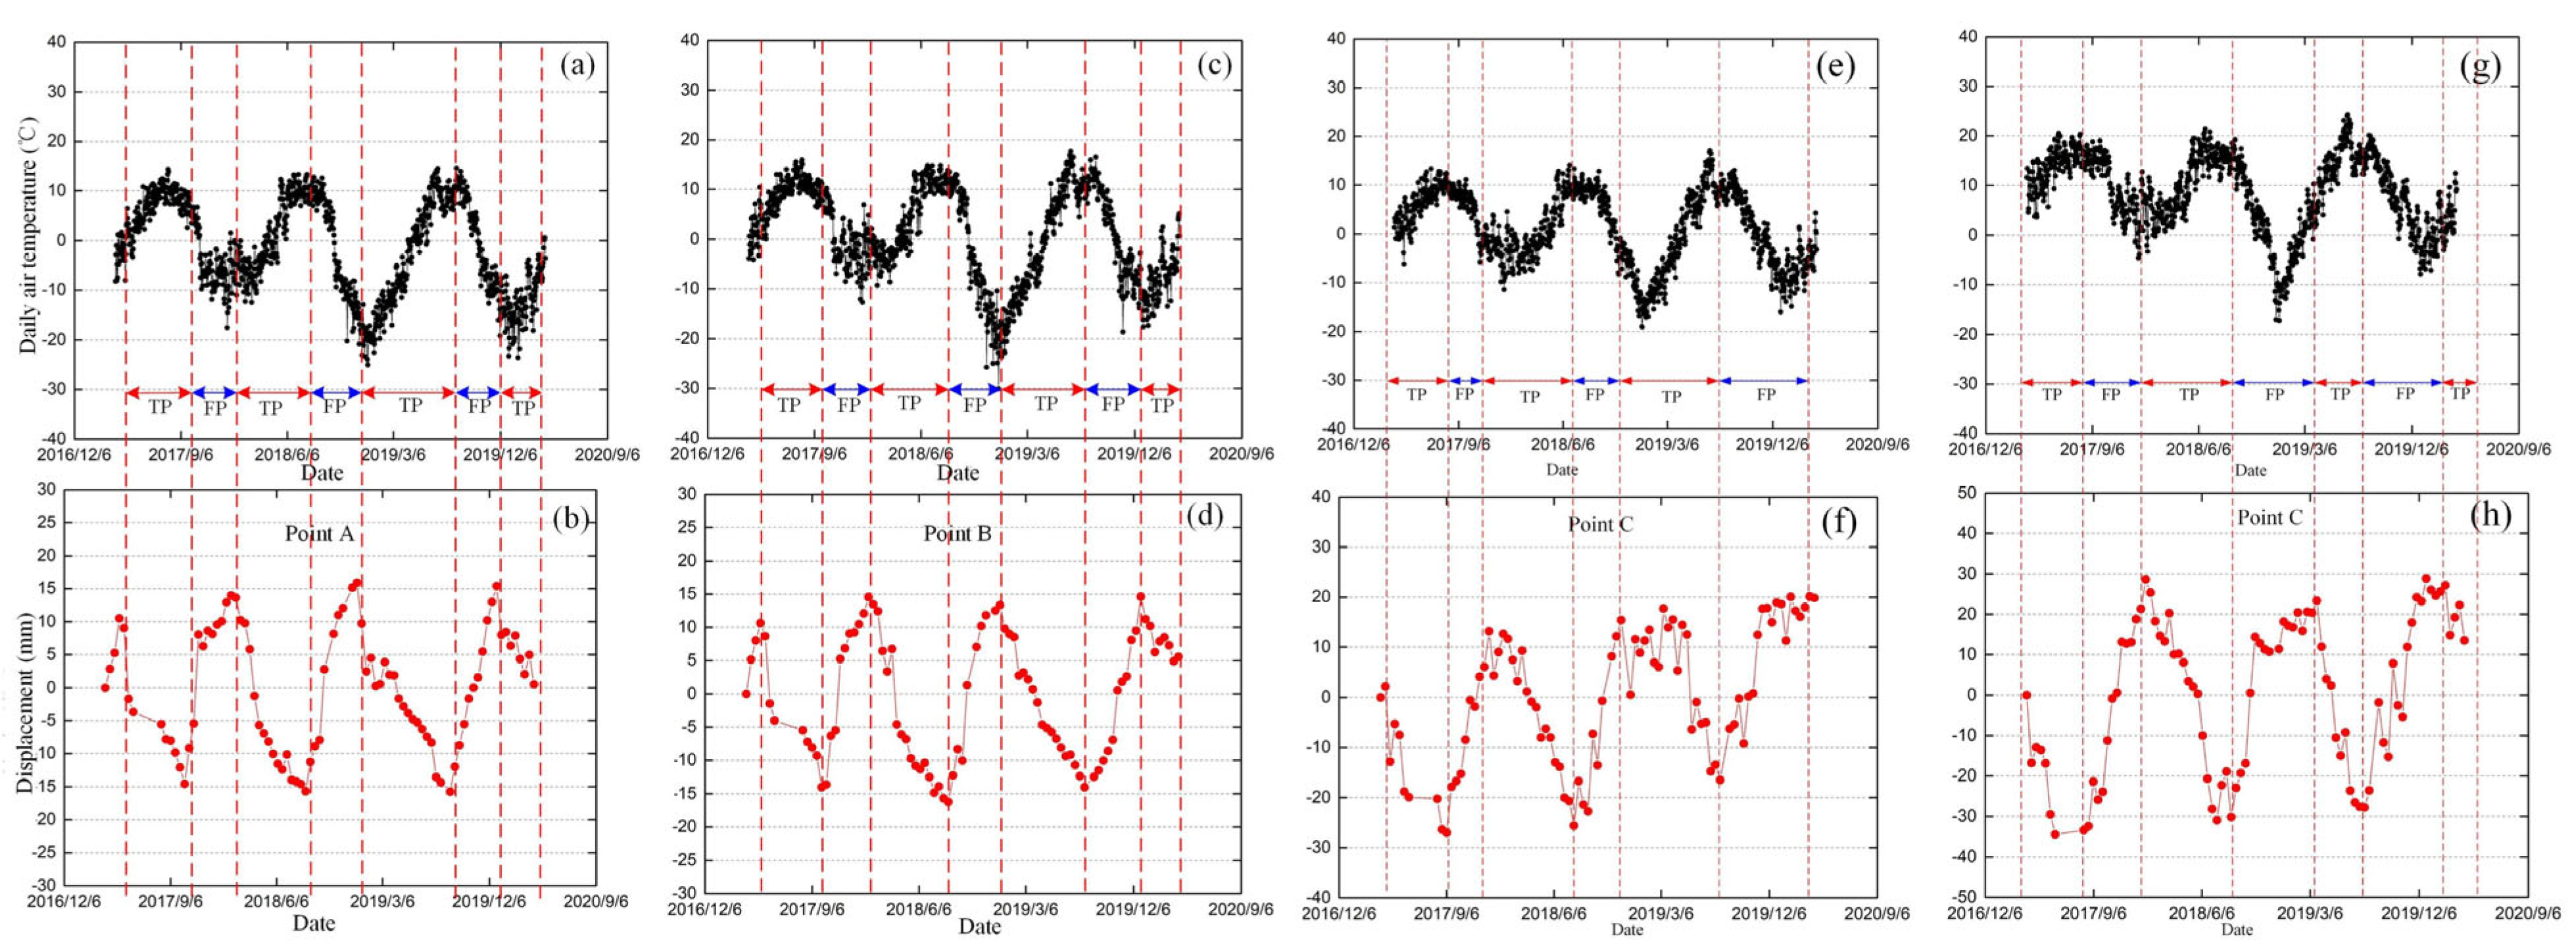
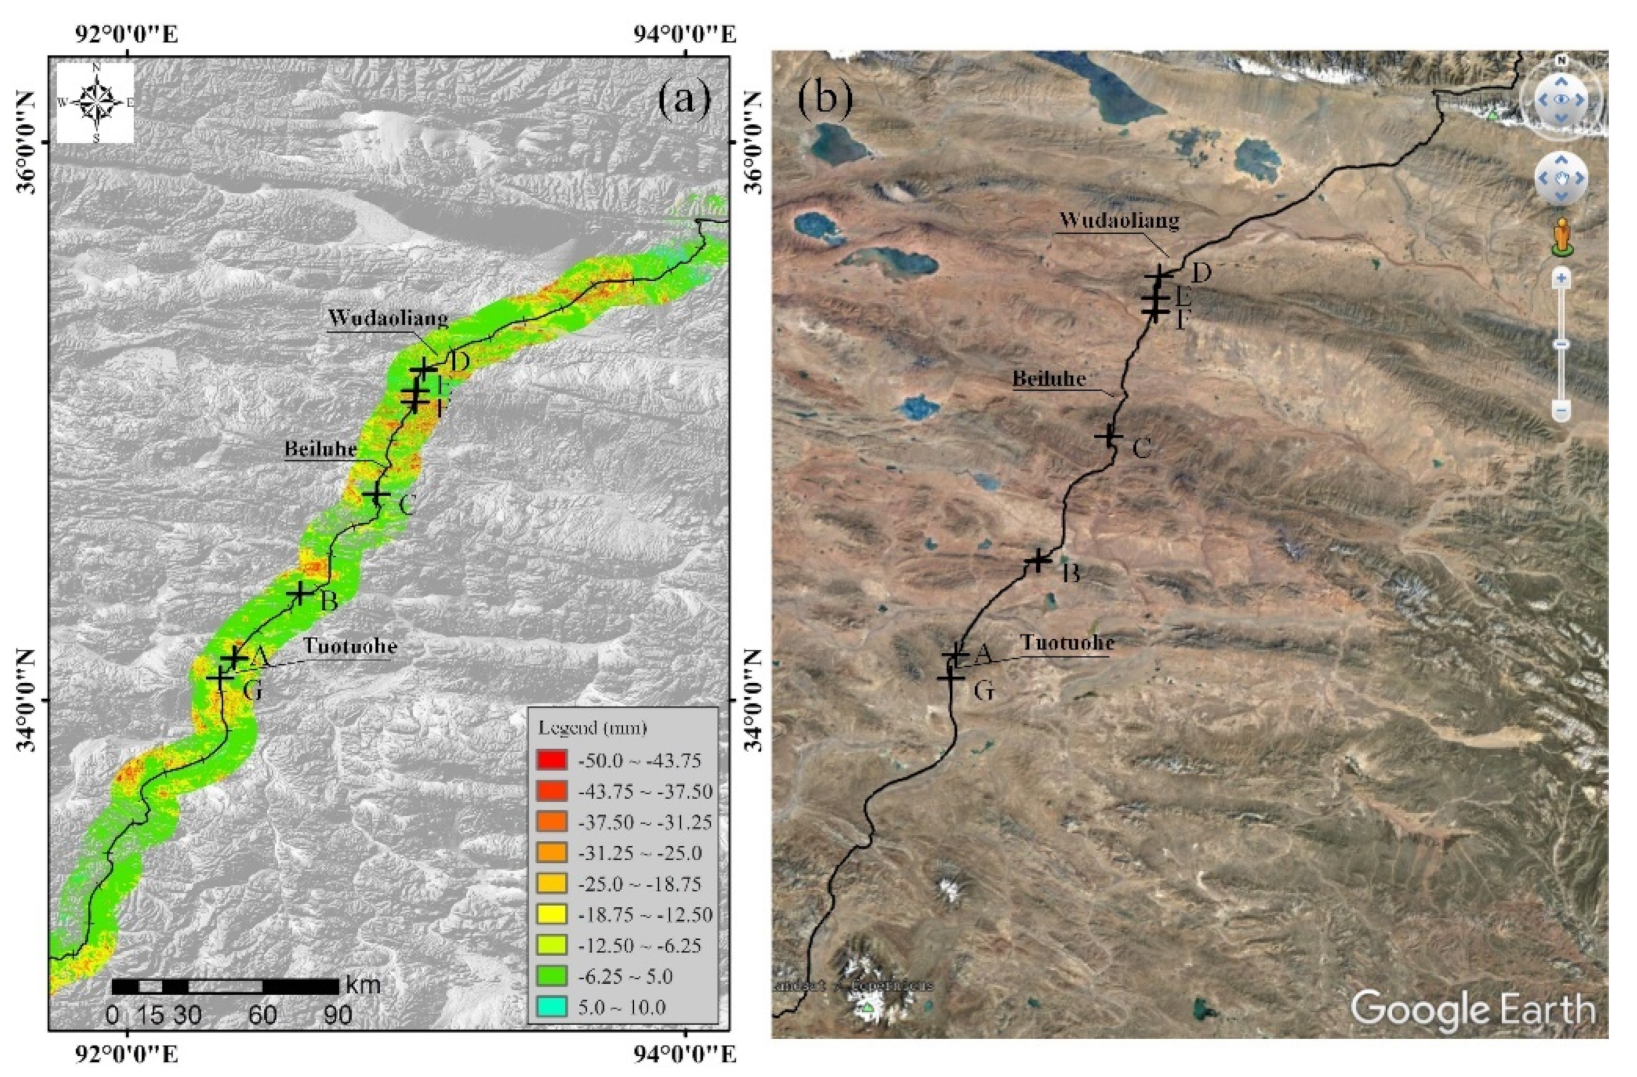
4.1. Seasonal Deformation Results along the QTR

The MTS-InSAR method based on the composite index model was used to retrieve the deformation of the QTR. The seasonal results are shown in Figure 6. Figure 6a shows that the amplitude range of the seasonal deformation of the study area is between −70 and 20 mm from 16 March 2017 to 24 March 2020. The seasonal deformation variation is mainly caused by the seasonal freezing uplift and thawing settlement of the active layer on the QTP [33]. The range of the seasonal deformation in most areas is between −30 and 10 mm. The areas with higher seasonal deformation are mainly distributed around Salt Lake in the Budongquan area, Wudaoliang, Beiluhe, Tuotuohe, Tanggula Mountain pass, and around Namco Lake. The LOS velocity shown in Figure 6b ranged from −40.0 to 20.0 mm/yr, and it is related to thawing of ice-rich permafrost near the permafrost table. The secular subsidence trend is stable. Figure 7 shows that the range of DEM error is between −60 and 60 m. The mean and standard deviation of the DEM error are −1.98 and 26.32, respectively. The DEM error estimation in most of the study areas is consistent with the relative accuracy of the SRTM DEM.
The DEM map, slope map, seasonal deformation map, and deformation rate map of the 10 km buffer zone along the QTR were extracted as shown in Figure 8. Figure 8a,b show that the average elevation of the QTR from Golmud to Xidatan is relatively low (2700 m) and that the slope is relatively steep. Starting from the Kunlun Mountain pass, the average elevation uplifts to approximately 4000 m. In the middle section of the QTR, the average elevation near the Tanggula Mountain Pass is approximately 5000 m, with a relatively large slope. In the Damxung and Yangbajing areas, the slope is 50–60°. The average elevation is 3600 m in Lhasa. Figure 8c shows that the seasonal deformation ranged from −50 to 10 mm/yr. Human activities, such as subgrade construction and railway operation, destroy the original thermal balance of the active layer, leading to obvious subsidence of the permafrost surface. The sections with high subsidence values include Golmud—Xidatan, Budongquan—Hoh Xili, Wudaoliang—Wuli, Tuotuohe—Yanshiping, Tanggula Mountain pass—Amdo, Naqu—Damxung, and Yangbajing—Lhasa. Figure 8d shows that the range of the deformation rate is between −30 and 15 mm/yr along the QTR, and its details are zoomed in Figure 9 for different sections of QTR.
To further analyze the spatial distribution characteristics and the trends of the deformation results in the study area, the spatial analysis tool of ArcGIS 10.6 software was used to conduct spatiotemporal analysis. The MN rectangular profile extends from northern Golmud city to the Lhasa area, while the PQ rectangular profile extends from the western foot of Kunlun Mountain to southern Naqu. The relationship between the amplitude of the seasonal deformation and LOS deformation rate and elevation are shown in Figure 10. The profile zones MN and PQ were divided into 300 and 200 subregions, and then the mean seasonal deformation results in these subregions were extracted. Figure 10 shows that the areas with high amplitudes of seasonal deformation are mainly concentrated in Xidatan (B), Wudaolang (C), Beiluhe (D), Fenghuo Mountain (E), Tuotuohe (F), Tanggula Mountain Pass (G), Amdo (H), Naqu (I) and Damxung (J). The amplitudes of seasonal deformation in Golmud (A) and Lhasa (K) are lower, and the corresponding deformation rates in these areas are also higher. Due to the uneven distribution of seasonal permafrost and permafrost in the study area, the seasonal deformation and deformation rate are different.
The deformation results are extracted along the QTR, as shown in Figure 11. The amplitude of the seasonal deformation along the QTR ranges from −30 to 15 mm. The LOS deformation rate ranges from −20 to 20 mm/yr. The sections with higher seasonal deformation are the BC section (Xidatan to Wudaolang), CD section (Wudaolang to Beiluhe), DE section (Beiluhe to Fenghuo Mountain), and EF section (Fenghuo Mountain to Tuotuohe), as shown in Figure 11. The sections with small seasonal deformation are the GH (Tanggula to Amdo), HI (Amdo to Naqu), IJ (Naqu to Damxung), and JK (Damxung to Lhasa) sections. There is a negative correlation between the seasonal deformation trend and elevation. Since solid precipitation or snowmelt leads to small changes in soil moisture, the hydrothermal properties remain stable, and the deformation values are low in these high-altitude areas. However, Daout et al. pointed out that frozen soil deformation has little relationship with elevation [44]. The reason for this trend is that most of the high-altitude areas are mountains, which are composed of stable bedrock, and the seasonal deformation is small, while the seasonal deformation in the low-altitude areas is related to soil moisture, soil properties, vegetation coverage, active layer thickness, etc.

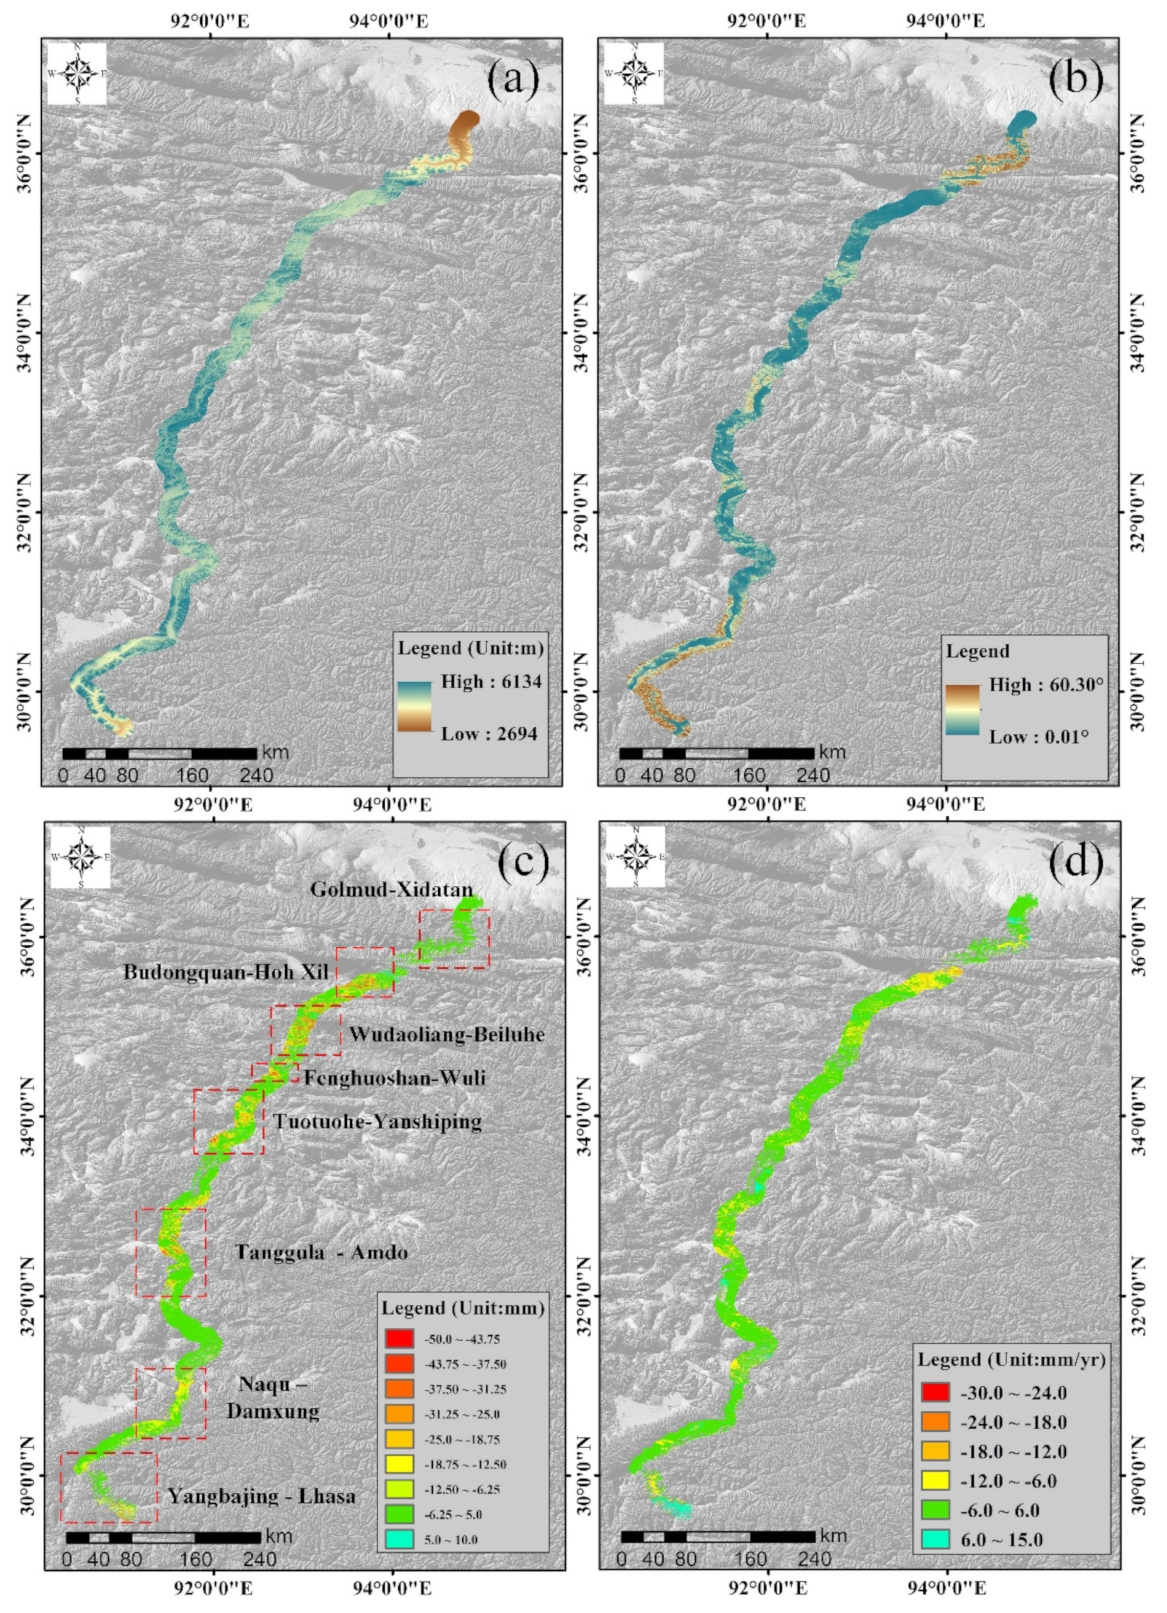
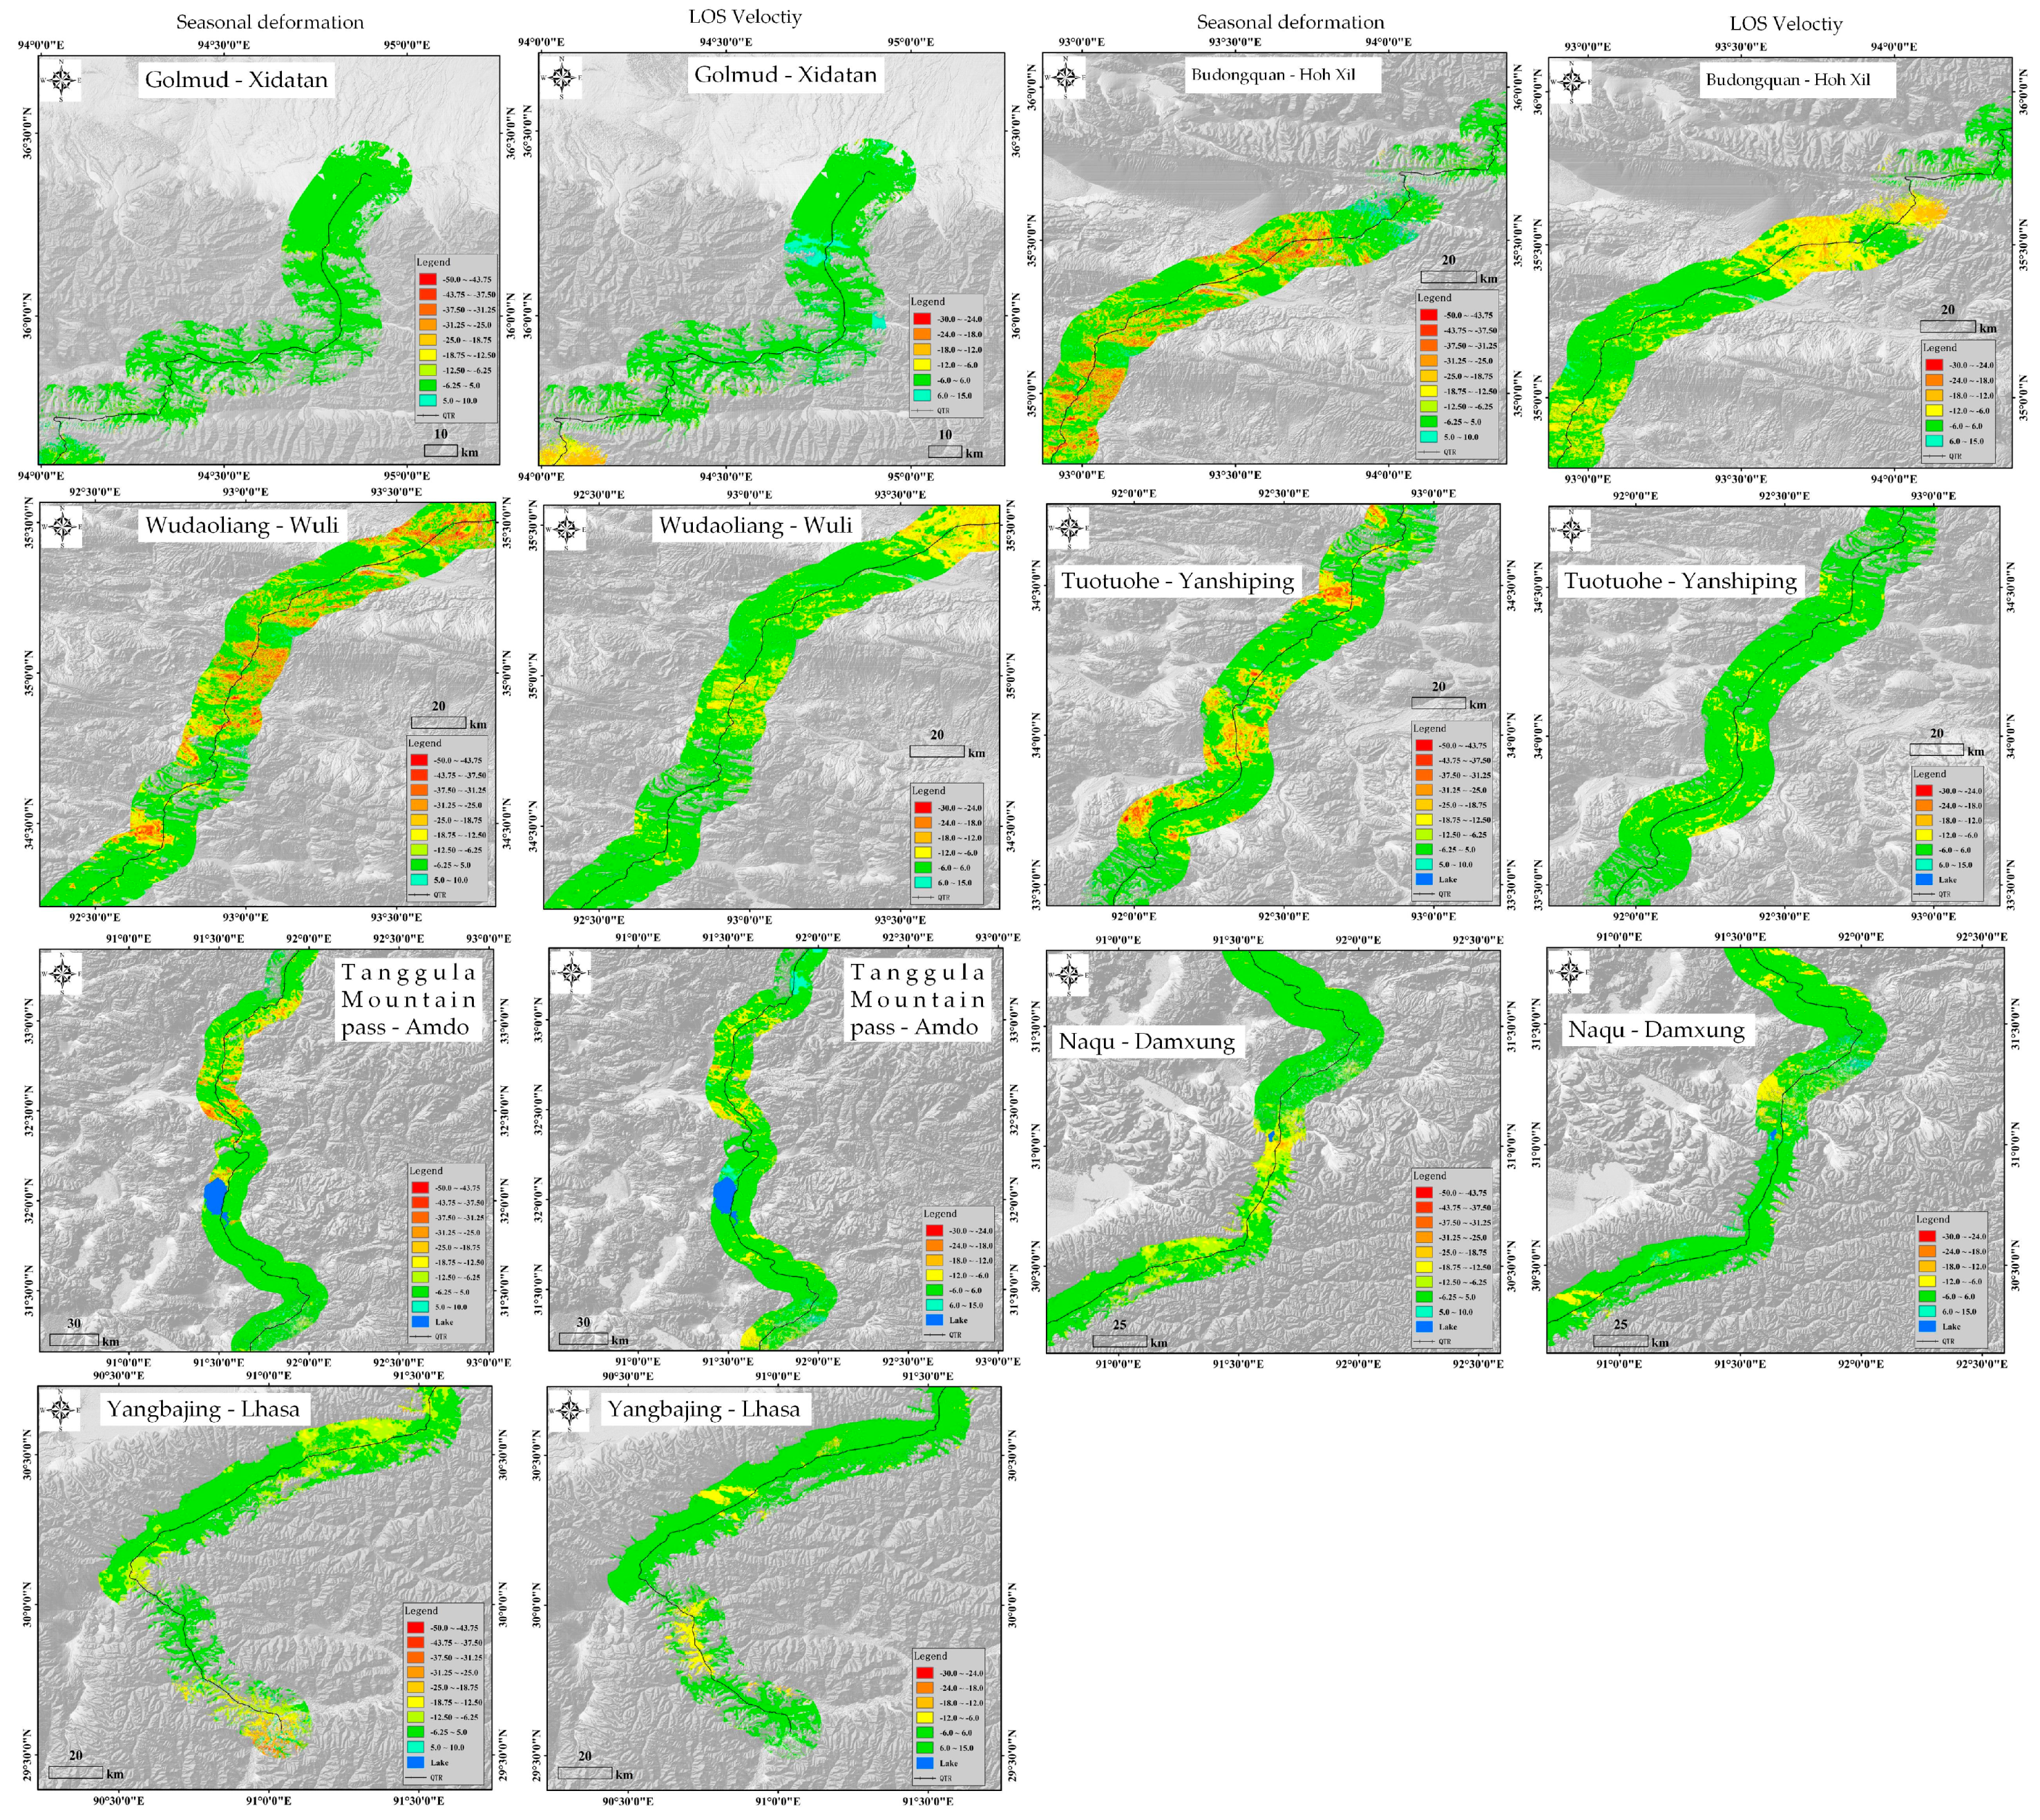
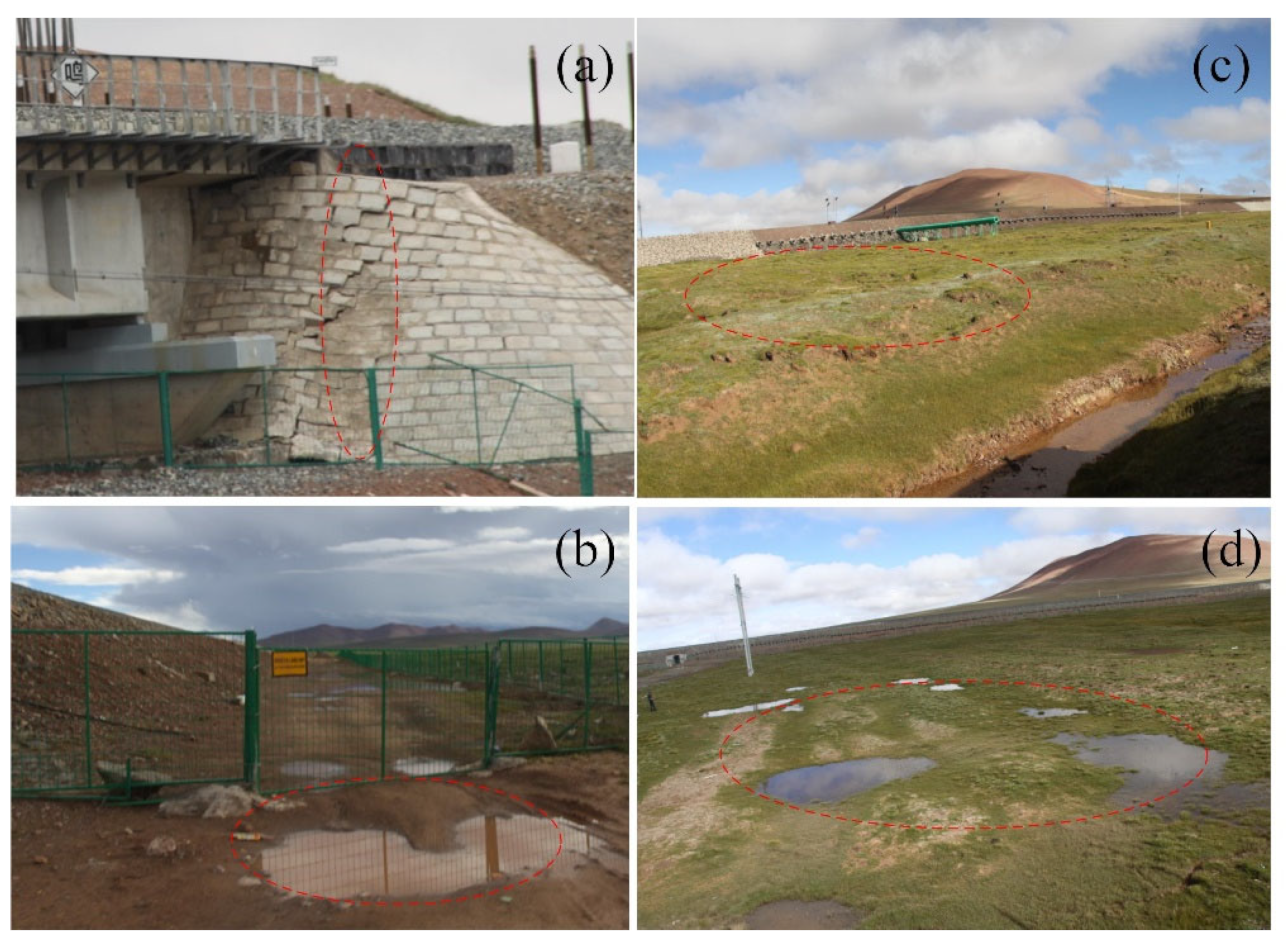
4.2. Spatial Distribution and Deformation Factors Analysis of the Geohazard-Prone Sections
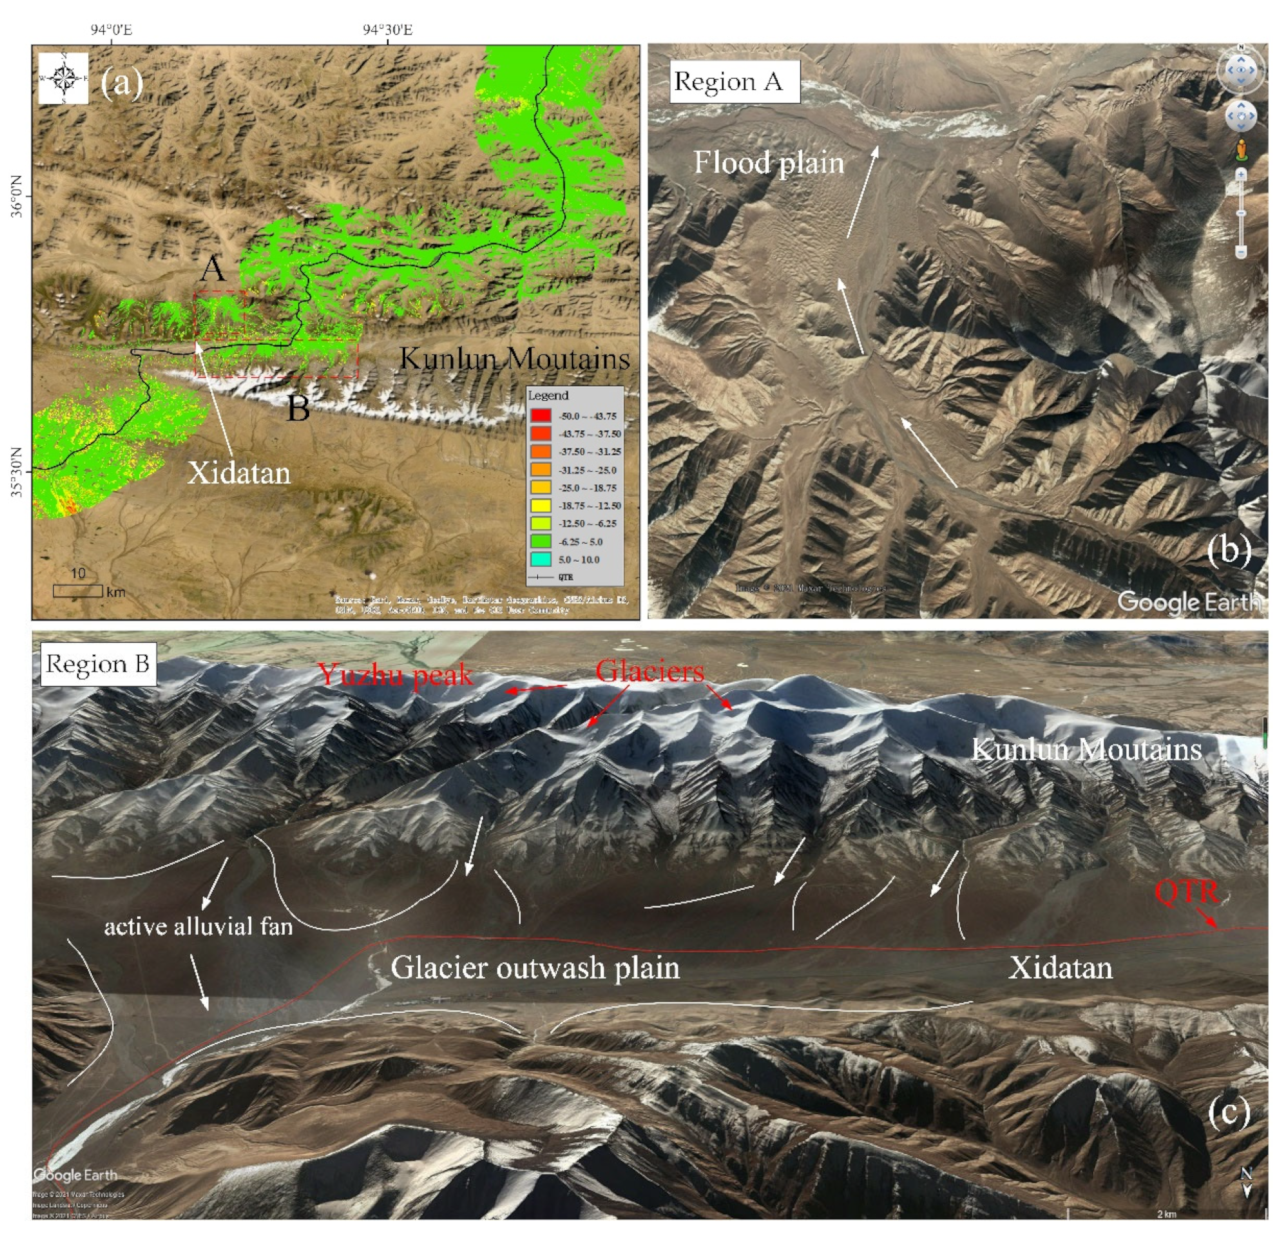
In this section, to explore the deformation factors of the 10 km buffer zone along the QTR, a detailed analysis of several geohazard-prone sections of the QTR is performed.

4.2.1. Xidatan

Figure 12 shows an enlarged view of the seasonal deformation and Google map in the Xidatan area, which is located in the glacial alluvial plain of Kunlun Mountain. The high seasonal deformation are mainly distributed on the glacier outwash plains and floodplain region, namely, region A and region B. Figure 12b shows the floodplain area with relatively seasonal amplitude of 31.50 mm, where the scouring of rivers forms a thawing zone around the riverbed. Yuzhu peak is the highest peak in the eastern part of the Kunlun Mountains. The melting of glaciers is greater than accumulation, and Yuzhu peak belongs to the retreating continental glaciers. The top of the mountain is covered by snow and ice, and there are several seasonal runoffs from Yuzhu peak caused by melting glacier water (see Figure 12c). Therefore, seasonal deformation factors may be likely associated with an increase of water or ice volume within areas characterized by high water accumulation, increased precipitation, permafrost thawing, or glacial recession.

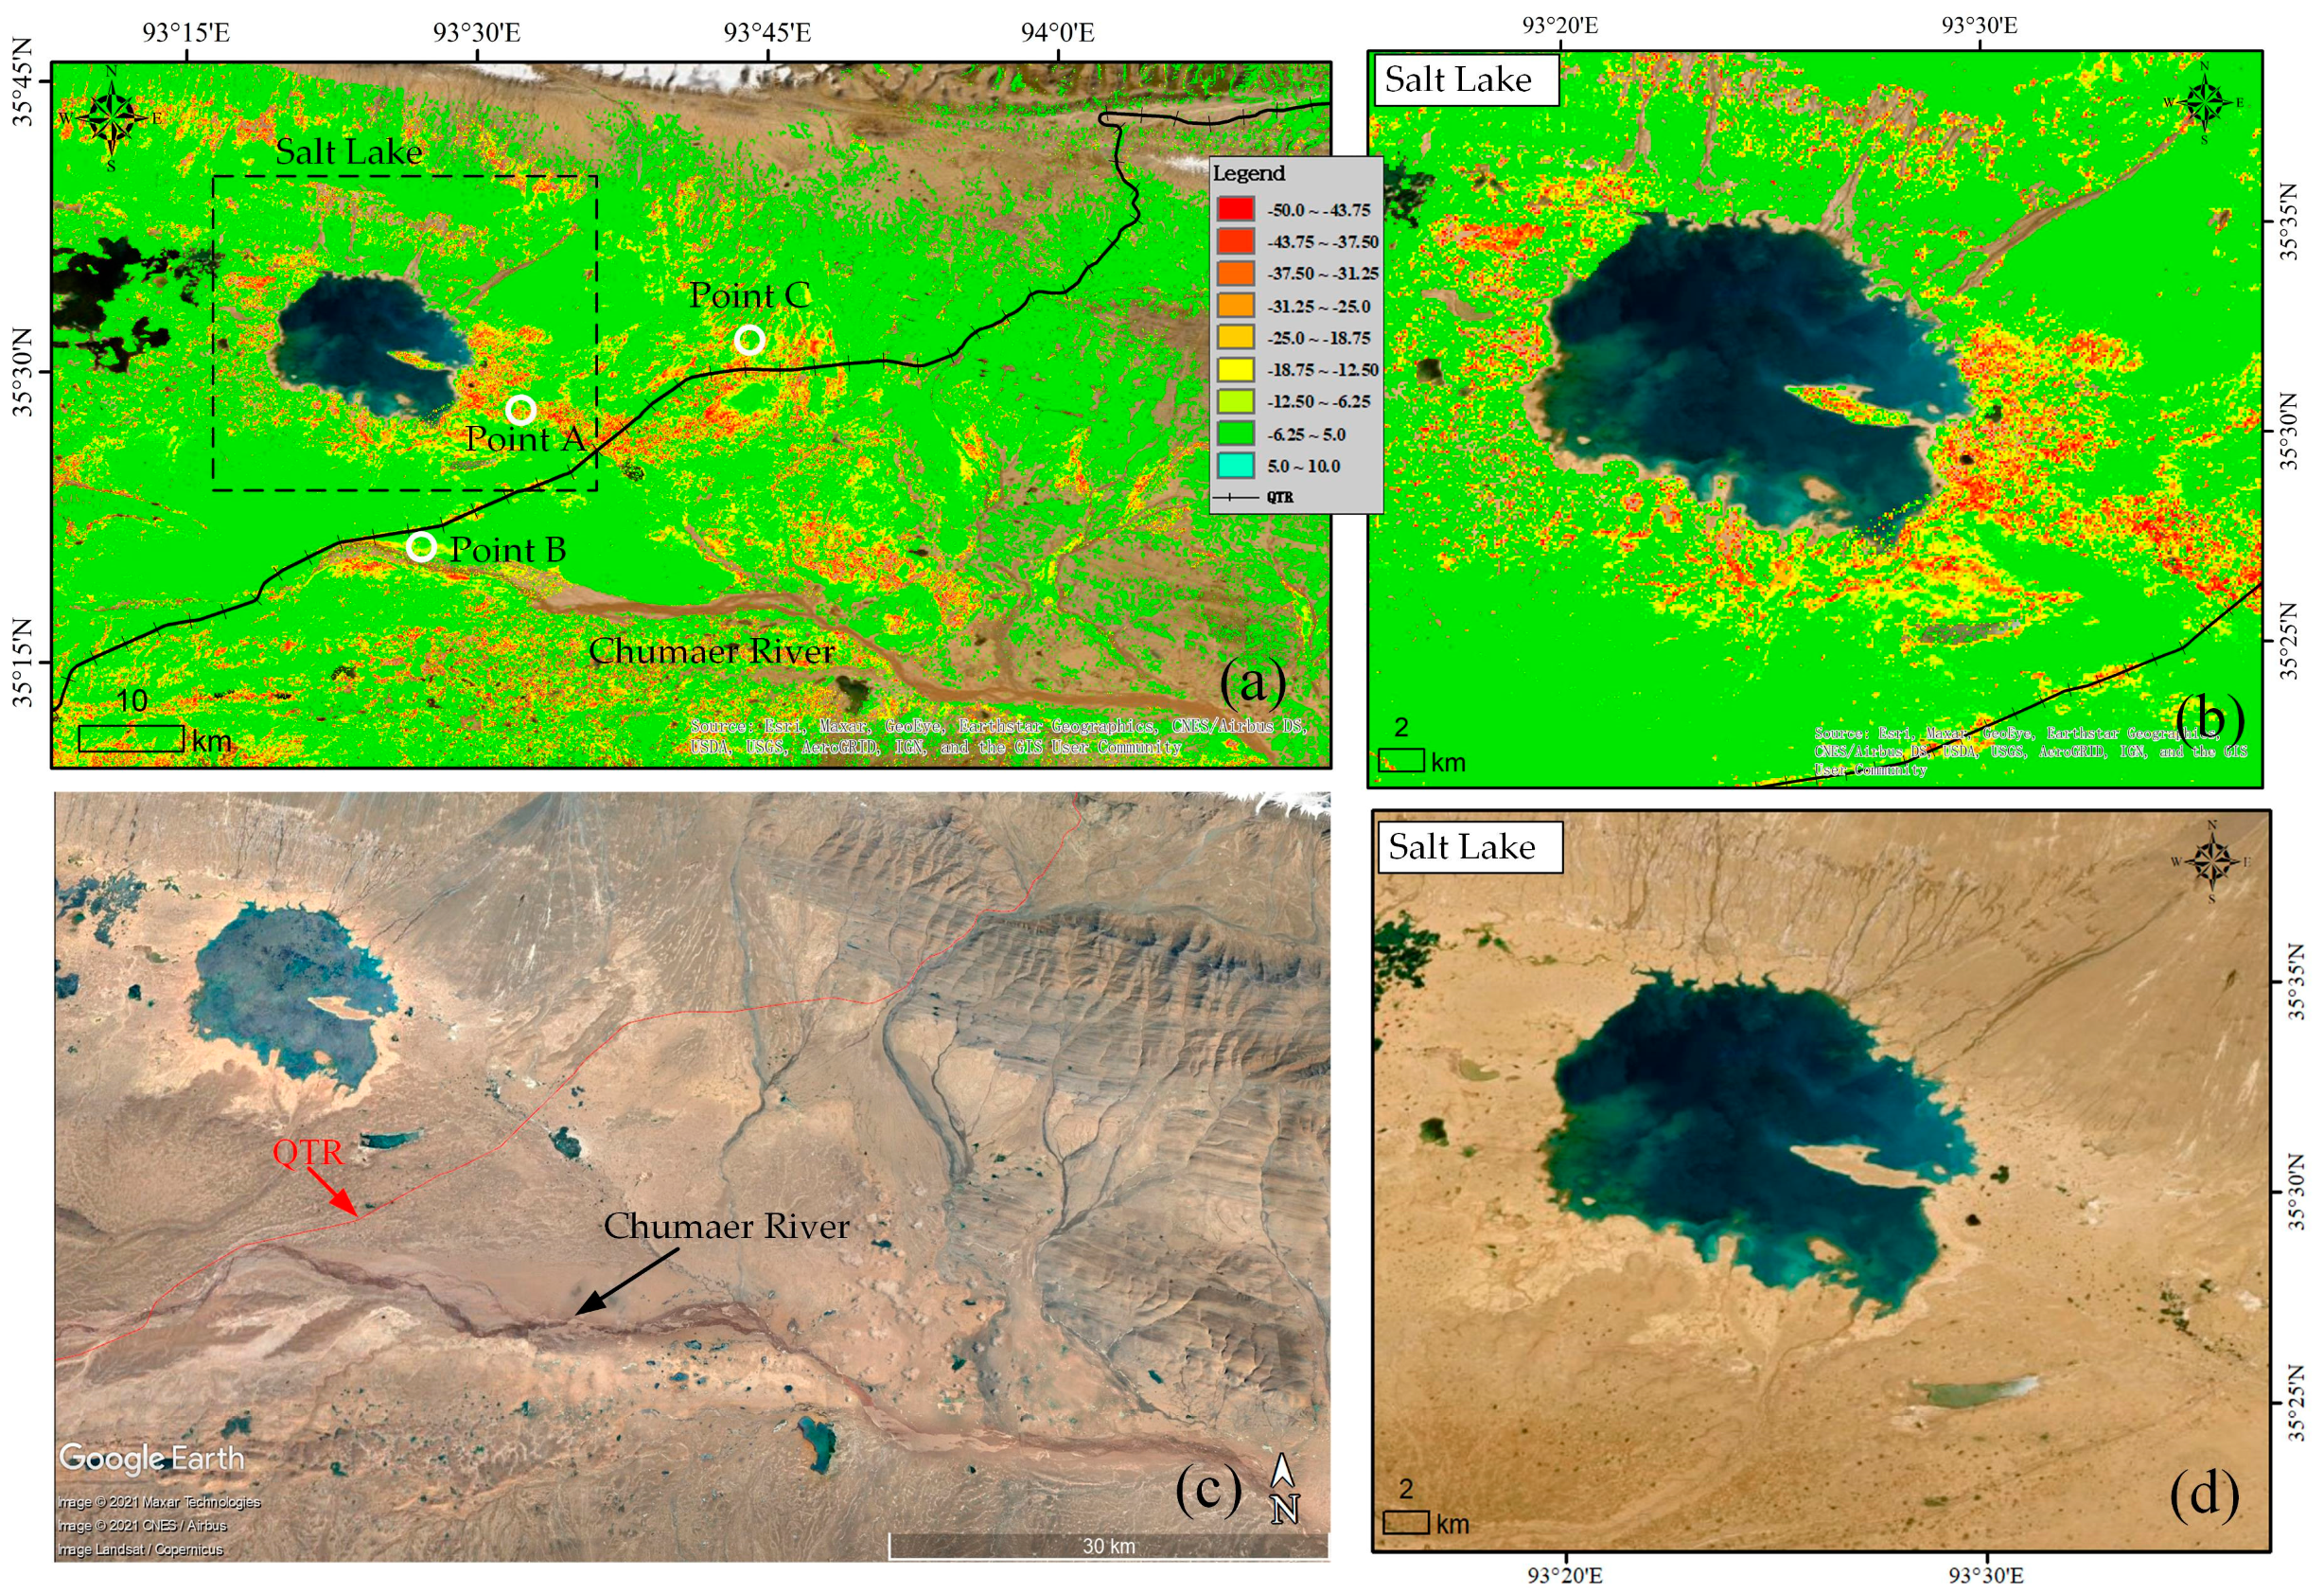
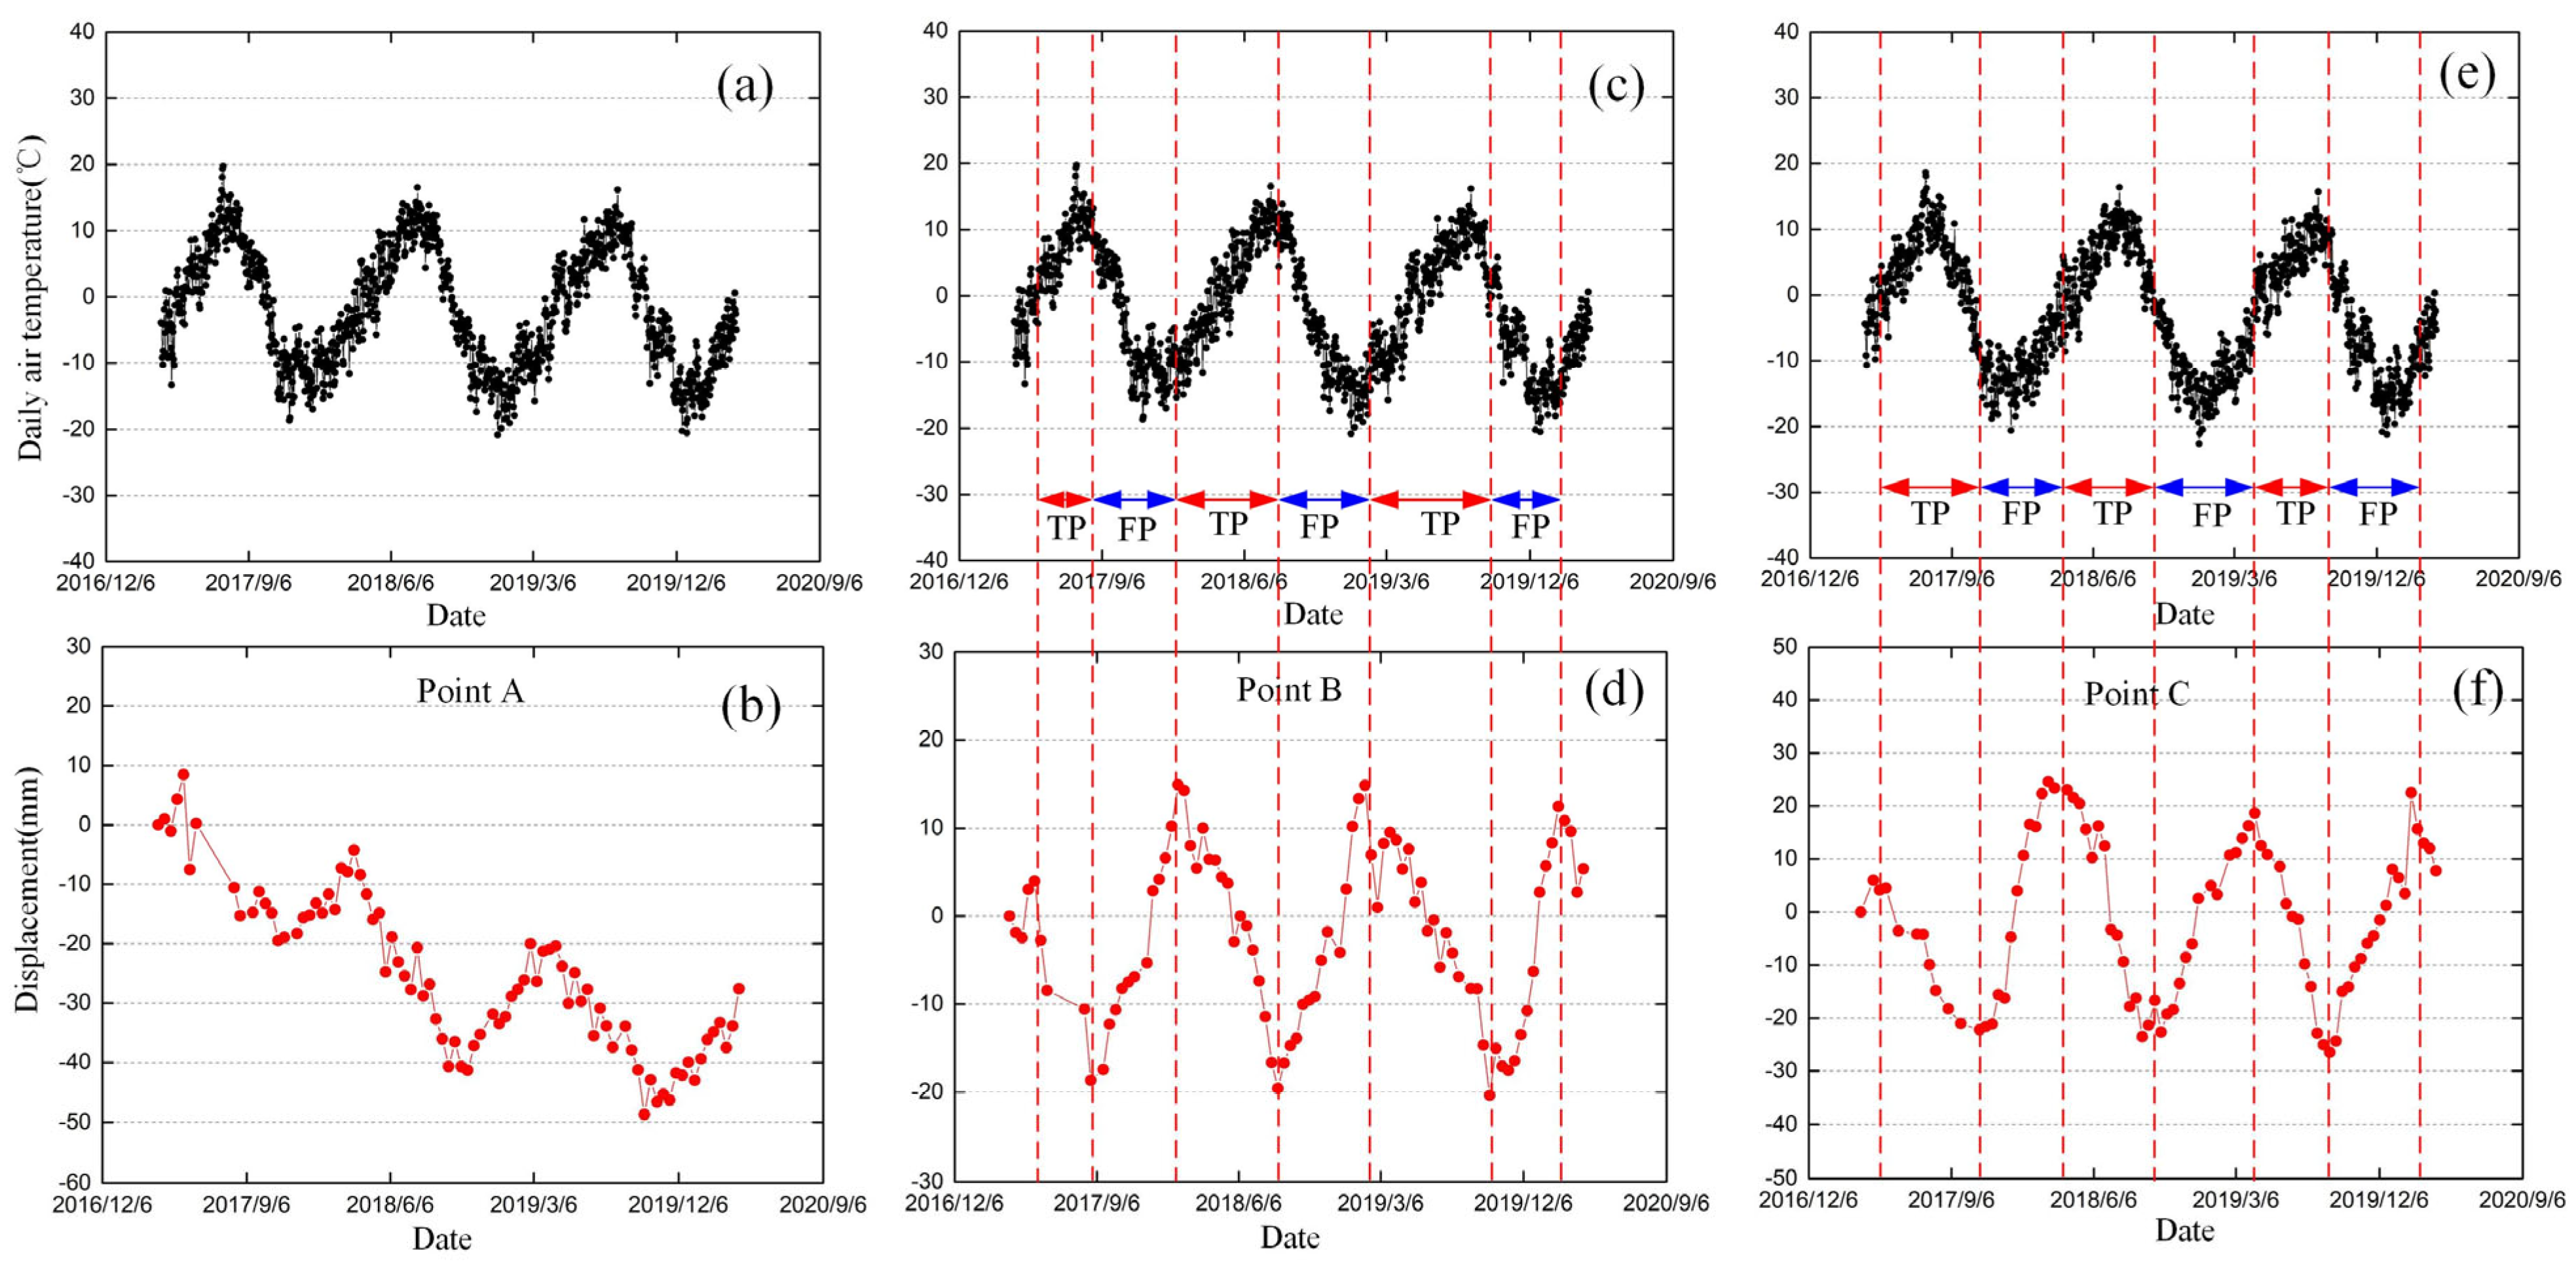
4.2.2. Braided Stream Plains and Salt Lake

The Chumaer River, which is the northern source of the Yangtze River, flows through the Hoh Xil region. Figure 13a shows that the range of the seasonal deformation is between 50.0 and 10 mm in the Hoh Xil area. Larger seasonal displacements are observed along the braided stream plains of Chumaer river and around Salt Lake (see Figure 13b). Some studies demonstrate the Salt Lake has started to expand significantly since 2011, and it confronts the rapidly accelerating degradation of permafrost [45].
The daily air temperature (2 m surface) of the ERA5 monthly averaged reanalysis product and time series deformations over 16 March 2017–24 March 2020 (reference to 16 March 2017) are presented in Figure 14. The ERA5 product can be downloaded from the ERA-5 repository of European Centre for Medium-Range Weather Forecasts [72]. Figure 14 shows that there are the time lags between the InSAR-observed displacement of the different points and the daily air temperature data. In addition, the thawing period (TP) and freezing period (FP) of each point are calculated according to the time series deformation and the temperature curves. Point A is located around Salt Lake, as shown in Figure 13d, and the range of the time series deformation is between −48.7 and 8.46 mm (see Figure 14b). From 2017 to 2020, the annual subsidence is 12 mm. Although the annual subsidence gradually decreased, the settlement trend is obvious. The thawing rate was faster in July and August, and the deformation reached its maximum at the end of August, with amplitudes up to 20 mm. It can be seen from the deformation curve that Salt Lake may continue in subsidence in the future, which may be caused by the degradation of permafrost to seasonal permafrost. With the permafrost around the Salt Lake showing a trend of degradation [73], the QTR, which is 8 km from Salt Lake, may be seriously threatened. In the braided stream plains of Chumaer river, the lower stream power of silt and fine sand transport is small, and they can retain water in the pores due to their highest susceptibilities to ice lens and frost heave. Therefore, in the braided Chumaer River plain (Point B) with a higher soil moisture, the displacement ranges from −20.38 to 14.94 mm (see Figure 14c,d). Figure 14e,f show that there is a delay of more than one month between the amplitude of deformation during the freeze-thaw cycle and the maximum/minimum values of temperature in the Hoh Xil (point C) area, and the deformation ranges from −26.5 to 24.6 mm.

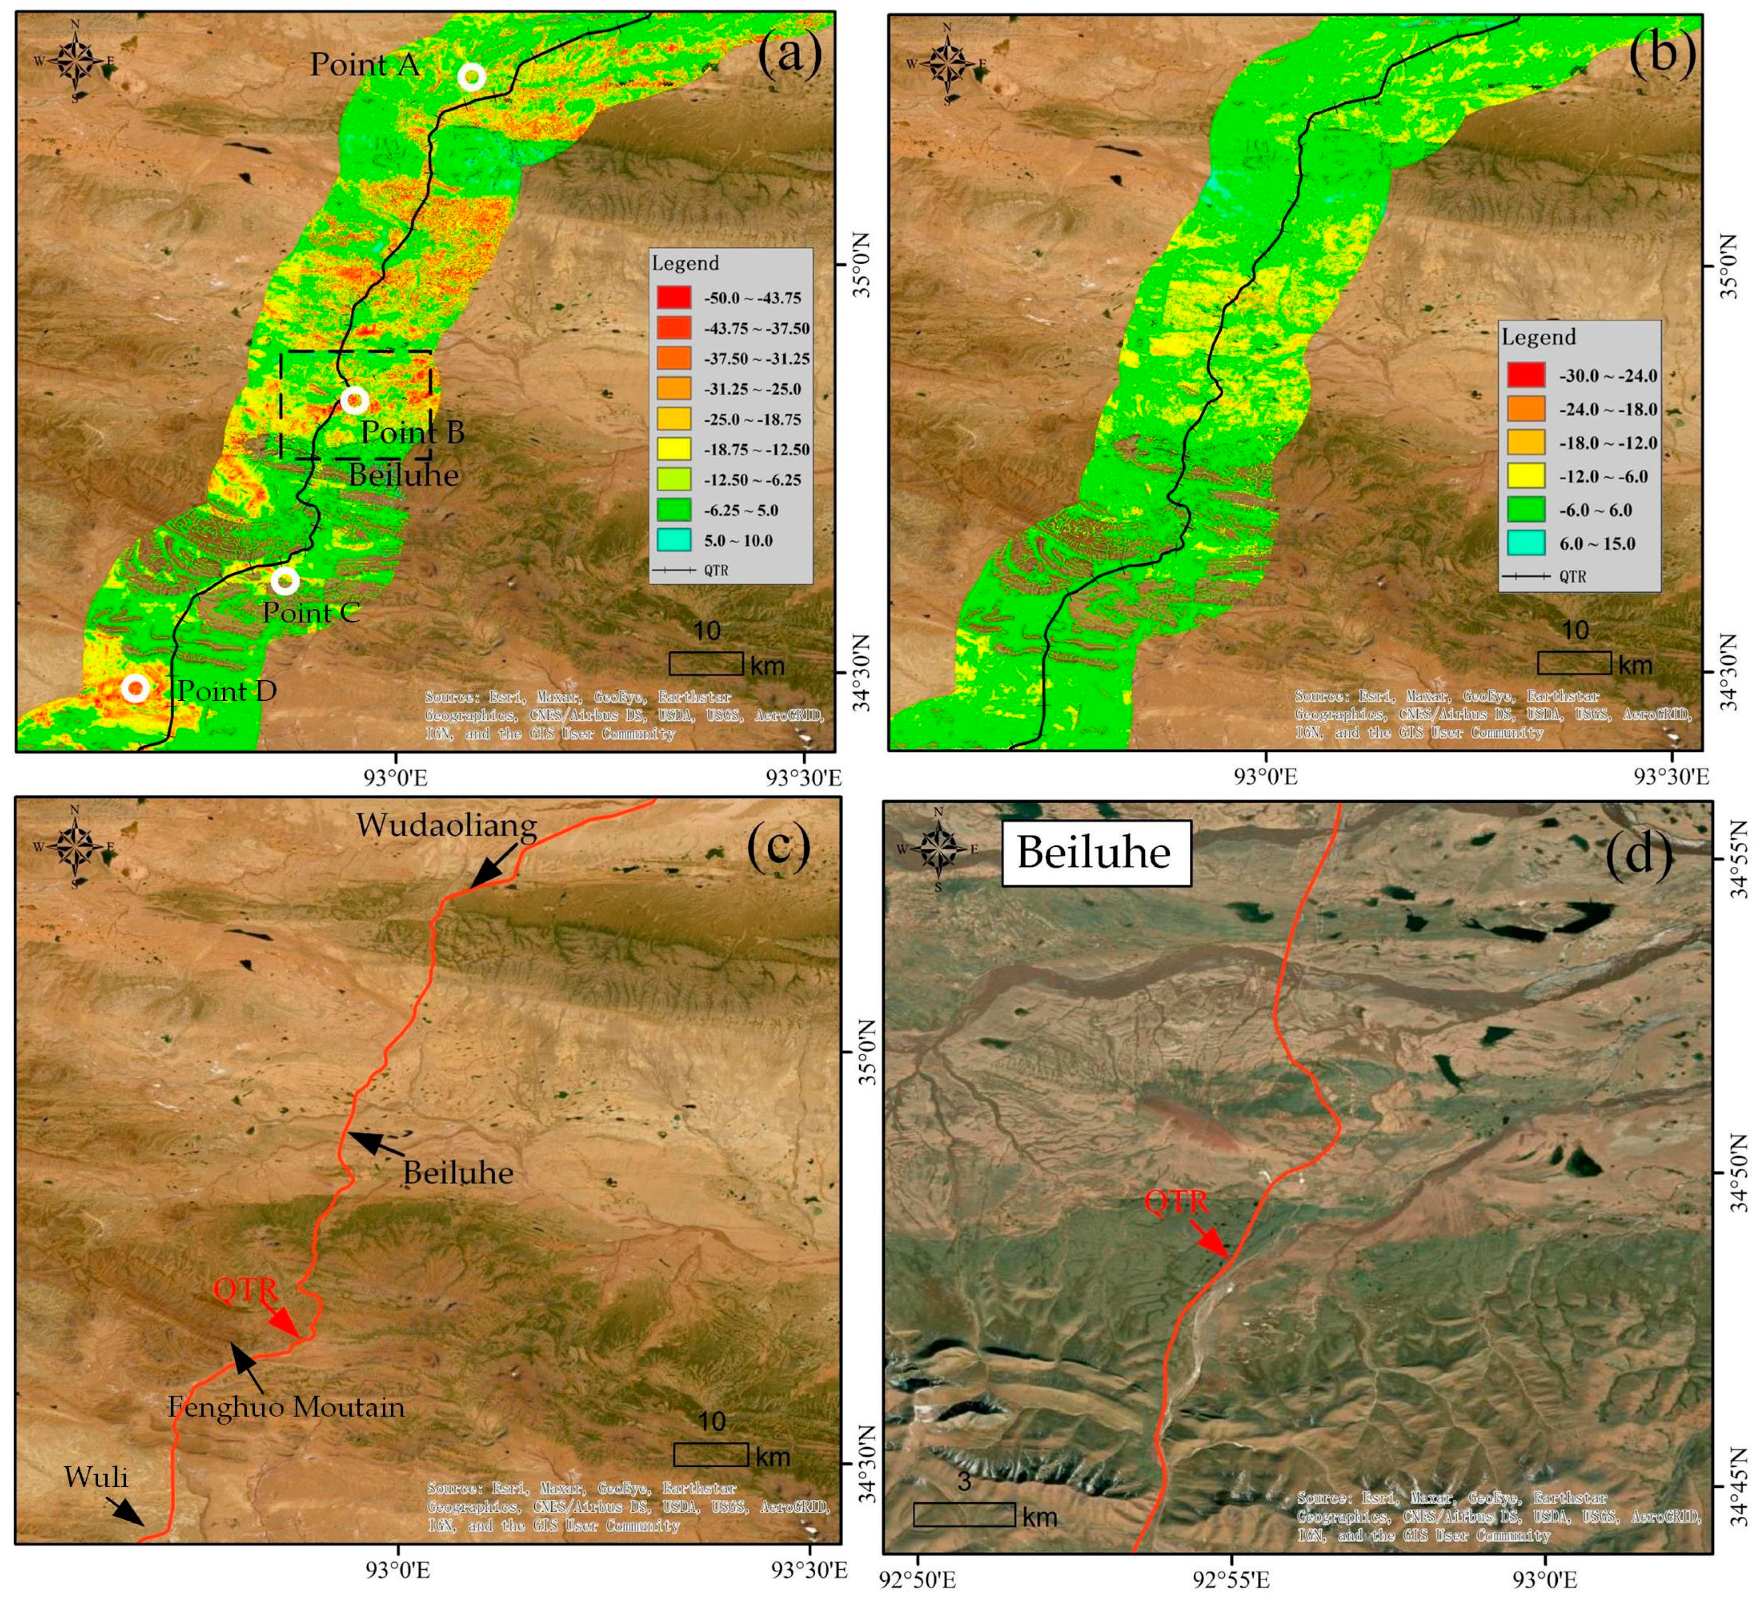
4.2.3. Wudaoliang to Wuli

The seasonal deformation of the Wudaolang- Wuli section of the QTR ranges from −50.0 to 10.0 mm, and the linear deformation rate ranges from −30.0 to 15.0 mm/yr (see Figure 15a,b). The deformation rate of Point A ranges from −9.7 to 12.0 mm/yr in Wudaoliang area, which is consistent with previous research results [74]. Figure 16a,e show that the range of the time series deformation of Point A is between 39.19 and 27.12 mm. The thawing period starts from the end of March to the beginning of April every year, and the thawing deformation reaches 23.2 mm at the end of August. Precipitation in the Wudaoliang area is also mainly concentrated from July to August, and the influence of the atmospheric troposphere may lead to a higher result. The freezing period begins at the end of September every year, and the freezing rate increases from October to November, with the amount of freezing reaching up to 17 mm. Figure 16b,f show that serious surface deformation has occurred in the Beiluhe area, with amplitudes up to 40 mm in recent years [24], and the deformation rate in this area ranges from −10 to 14 mm/yr [41,75]. The field investigation photos in September 2020 showed some subsidence zones along the QTR subgrade, and there was a large amount of water in some areas (Figure 17). The Fenghuo Mountain region (Point C) is located to the southeast of Hoh Xil with a deformation range of −29.43–27.13 mm during March 2017–March 2020. Figure 16c,g show that the thawing period in this region begins in mid-April each year, and the displacement reaches its maximum at the end of September. The freezing period begins in early October each year, and ends in late March of the following year. The Wuli area (Point D) is located in the upper reaches of Tuotuhe. The displacement range is between −29.43 and 27.13 mm. The thawing period in this region begins from early October to early April each year. The thawing rate is faster in July to August, with 10 mm cumulative deformation.

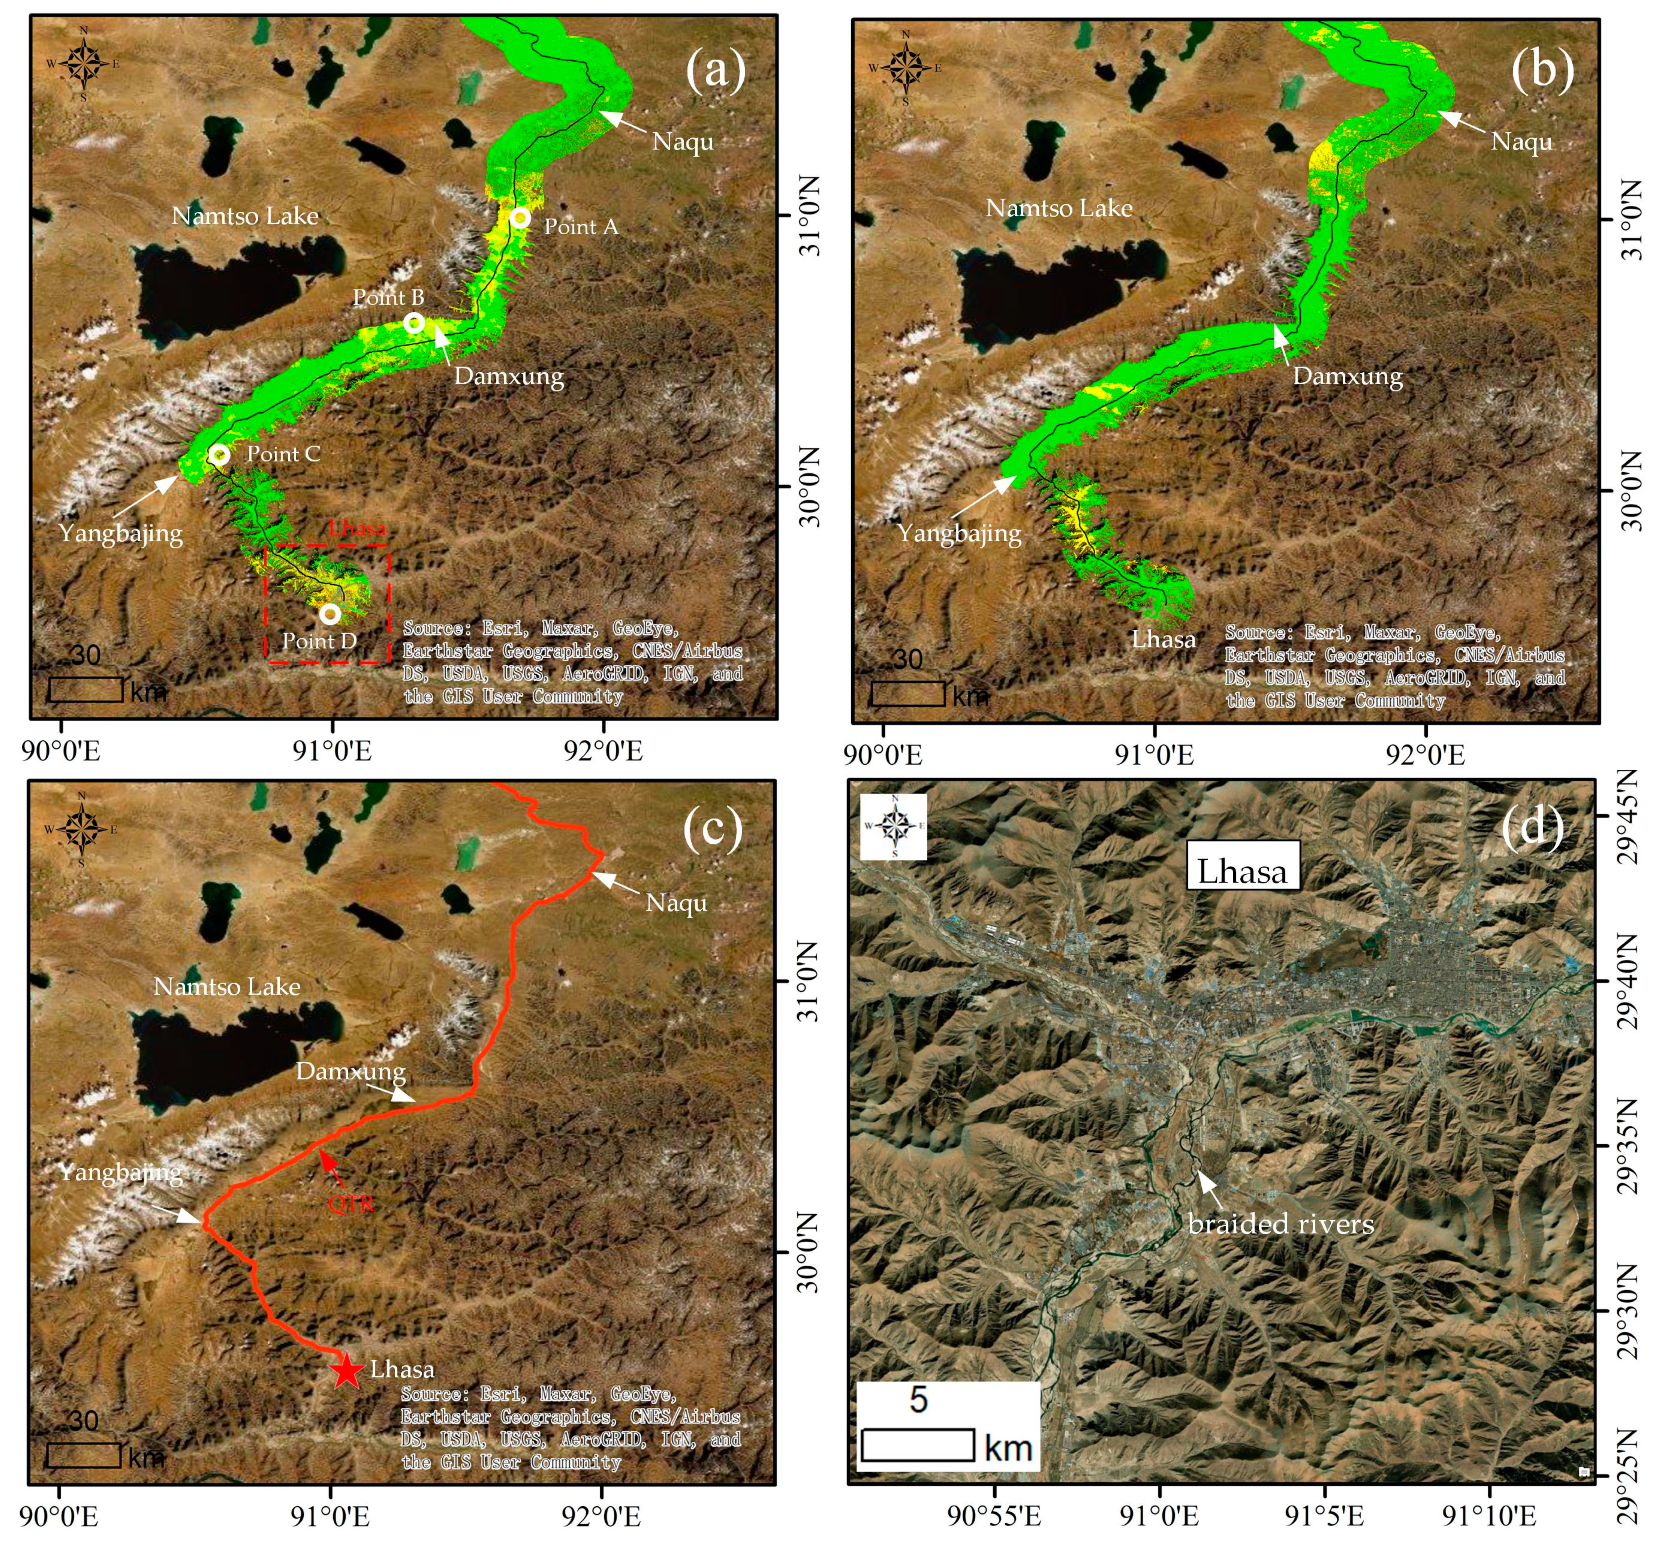
4.2.4. Naqu to Lhasa

The deformation result map of the Naqu to Lhasa section of the QTR area is shown in Figure 18. The seasonal deformation of the Naqu to Damxung section ranges from −25.0 to 10.0 mm, and the deformation rate ranged from −15.0 to 15.0 mm/yr. Figure 19a,b show that the time series displacement of Naqu (Point A) ranges from −15.76 to 15.88 mm. Damxung (Point B) is located in the vicinity of the bull, with a time-series displacement ranging from −16.23 to 14.59 mm (Figure 19c,d). At the end of August each year, the subsidence reached its maximum, and the annual average deformation rate was −12.0 mm/yr, which was consistent with a previous study in which the maximum subsidence rate after railway construction was −10 mm/yr in 2007 [12]. The seasonal deformation of the Yangbajing to Lhasa section of the QTR area ranges from −18.75 to −6.25 mm. Figure 19f shows that the time series deformation range is between −27.0 and 20 mm in the Yangbajing area (Point C), which has an average altitude of 4300 m, and the mountains on both sides of the basin range from 5000 to 6000 m. Glaciers and various geothermal fields are developed in this region, thus the high deformation trend is observed on the surface. Figure 18b shows that the deformation rate in the Lhasa area (Point D) is relatively small, with a range of −4.0–6.0 mm/yr, while the seasonal deformation ranges from −31.25 to −12.50 mm. Seasonal deformation shows the dynamic change of the ALT, and the Lhasa area is located in the seasonally frozen ground areas, so the seasonal deformation values are high. The QTR is far away from the deformation area, so it has little influence on the railway. Furthermore, Figure 18d shows that some braided rivers are distributed in the southern region of Lhasa with the higher soil moisture, leading to high deformation in this region.

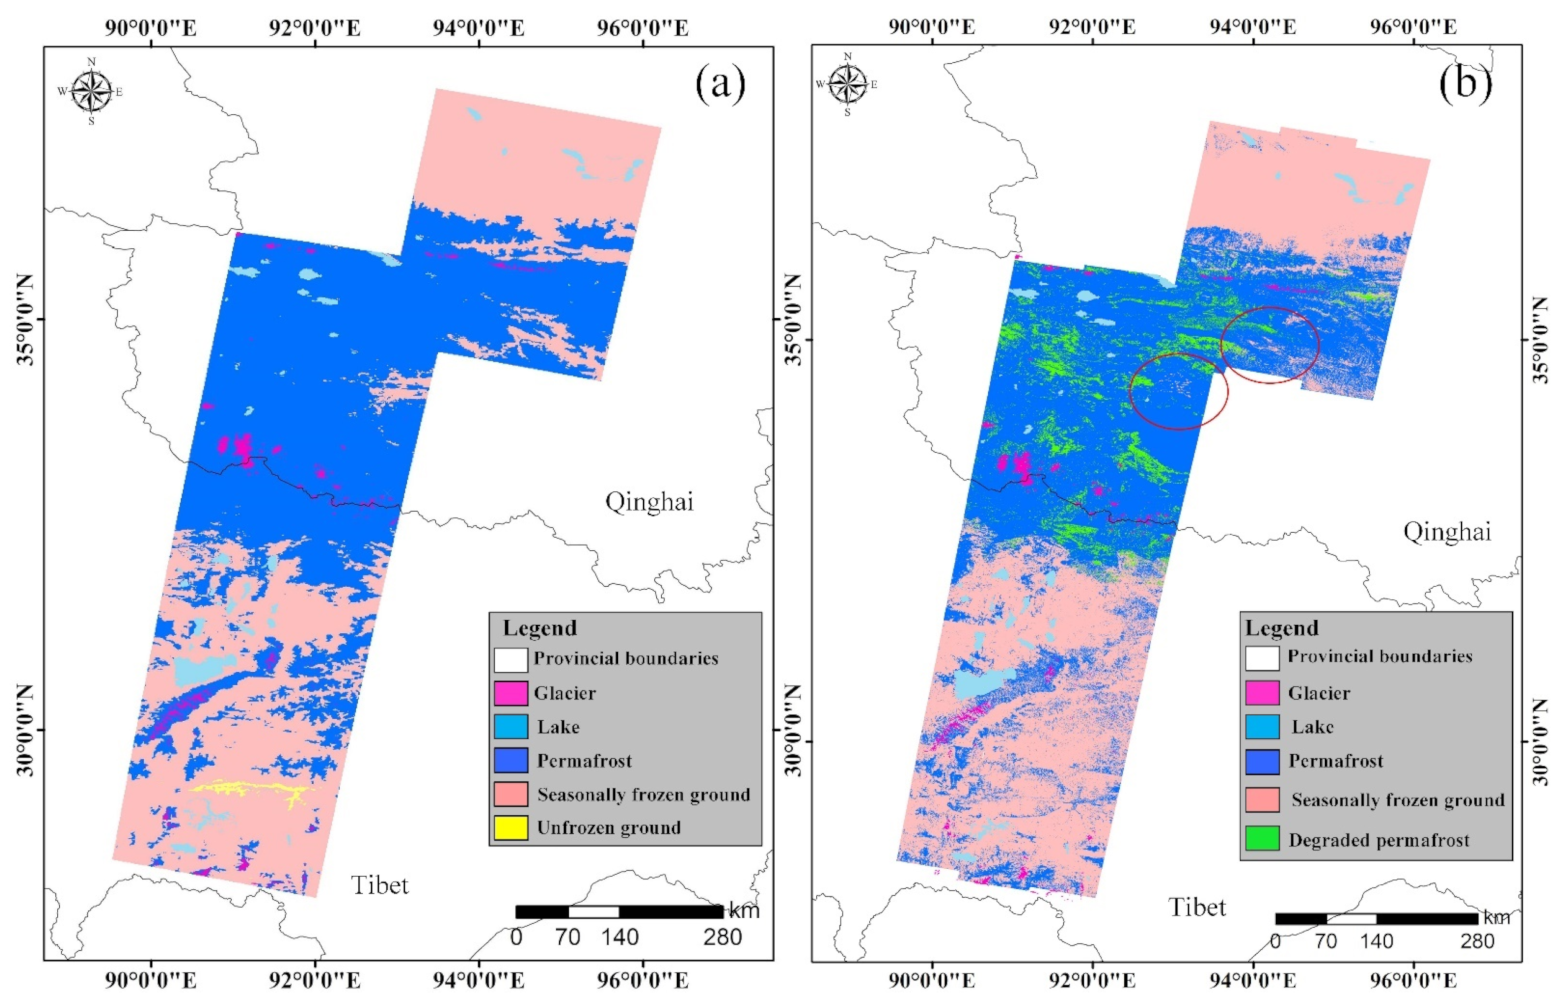
4.3. Permafrost Distribution Map along the QTR

Based on the InSAR time series deformation results, the permafrost distribution map is obtained by using the ISODATA classification method, which is compared to the permafrost classification map of 2017 on the QTP from the National Tibetan Plateau Data Center [53,75], shown in Figure 20. The results show that the classification results of Zou’s method are mostly consistent with those of InSAR method. However, there are some differences in the red circle regions in Figure 20b. Seasonally frozen ground areas in red circled regions are relatively small. The following are possible reasons for this: the InSAR method is based on the deformation law of frozen soil, and it reflects the actual time series deformation of frozen soil without other input data, while Zou’s method employs ground observations and soil investigated datasets based on TTOP model to estimate permafrost distribution. In addition, there are bias or errors of time series deformation estimation using the MTS-InSAR method.
InSAR can detect the deformation law of some permafrost areas, which are characterized by the seasonal oscillation and the increasing interannual settlement year by year. Therefore, the permafrost areas are divided into degraded permafrost, and stable permafrost areas with the same seasonal deformation trend. Few permafrost areas have been classified as seasonally frozen ground in recent years, due to the deterioration of permafrost.
The deformation curve of seasonally frozen ground is shown in Figure 21a,b. It can be found that the positive or negative seasonal amplitude of seasonally frozen ground is similar. In other words, the seasonal freezing uplift are almost the same as the thawing subsidence of permafrost. The annual deformation trend is stable. Due to the different of active layer thickness, the amplitude of seasonal deformation is different in different regions. The deformation law of permafrost is complex. It may show irregular annual increase year by year, namely uplift (Figure 21d), or irregular annual decline (Figure 21e). Such kind of deformation trends may exist in rock glaciers or high-altitude mountains. The annual subsidence shows a regular increasing trend year by year, which is classified as degraded permafrost (Figure 21c).
It should be noted that seasonal freezing-thawing processes may also occur in some permafrost areas with temperature change, and the deformation law of permafrost accords with that of seasonally frozen ground due to the different of active layer thickness (Figure 21f). For this kind of permafrost, the permafrost classification results of Zou’s method are adopted as prior knowledge in this study, and the seasonally frozen ground areas are first separated, then the rest of the frozen soil areas are classified again according to the annual average deformation rate. If the annual average deformation rate of some permafrost areas ranges from −20 to 20 mm/yr, it is classified as seasonally frozen ground, otherwise, these areas are classified as permafrost.

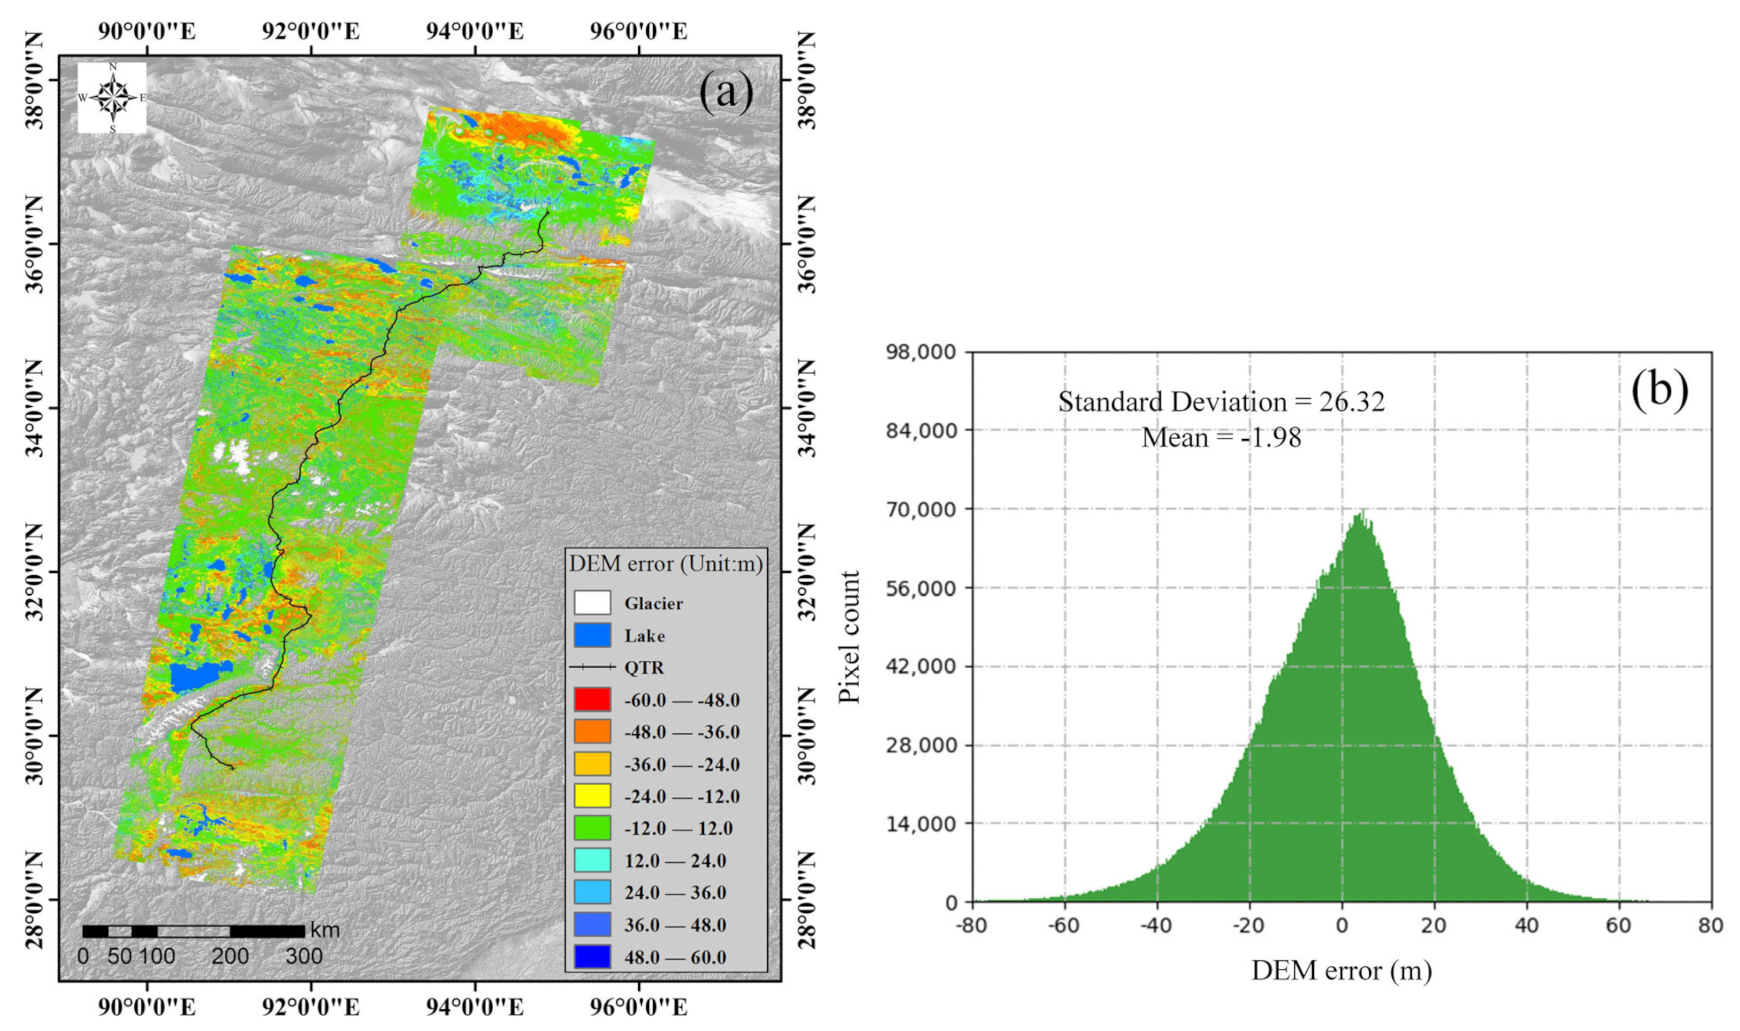
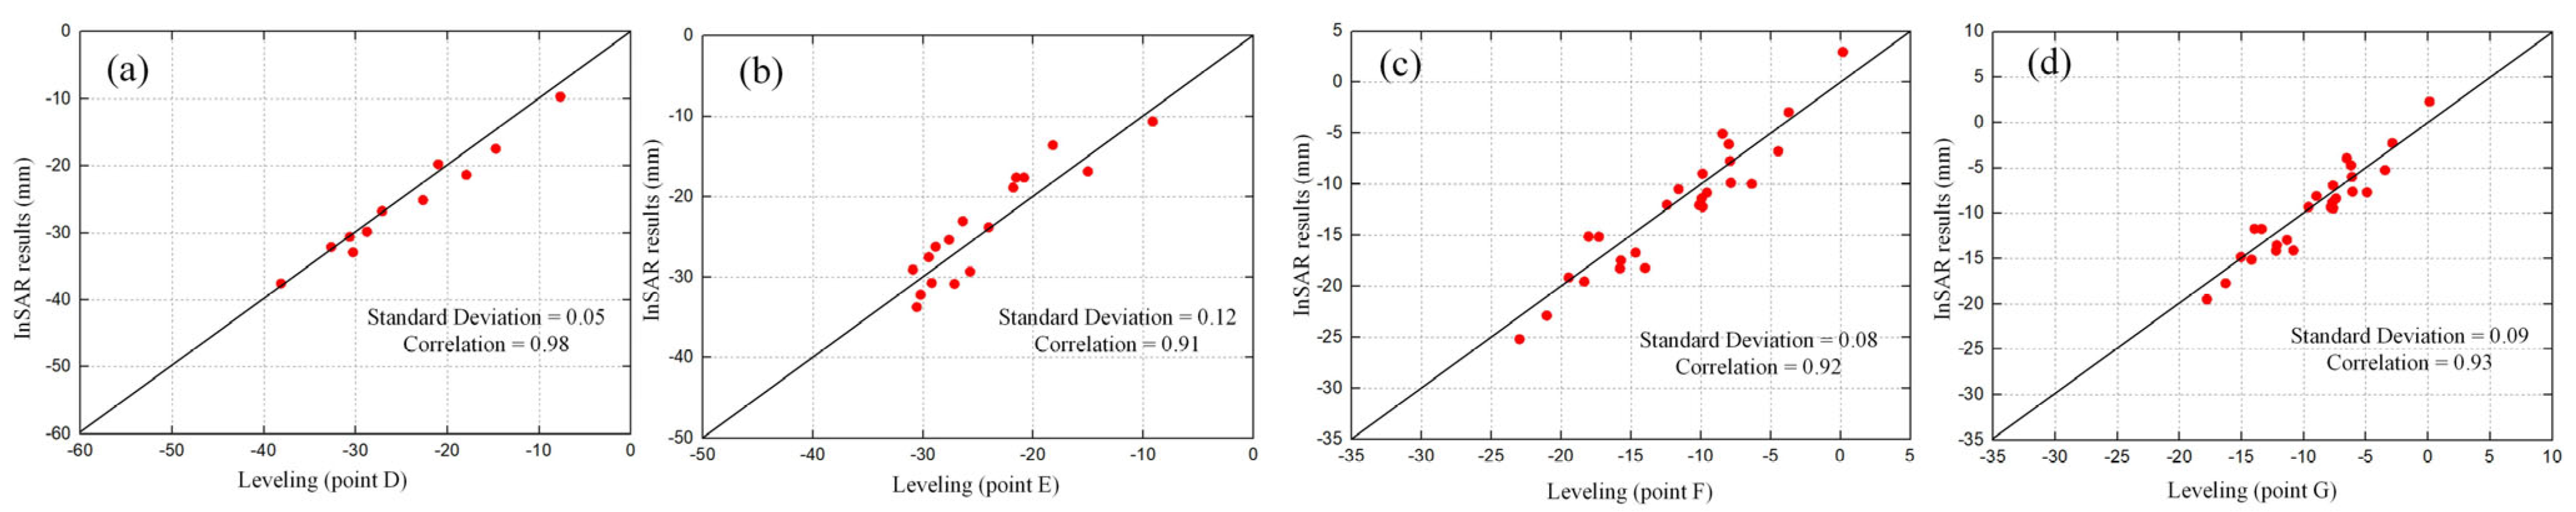
4.4. Validation of the InSAR Results

To evaluate the accuracy of the InSAR results in this paper, leveling data from other researchers were used for verification in some sections of the QTR [76,77]. The geographical locations of seven leveling points along the QTR passing through the Wudaoliang, Beiluhe and Tuotuohe areas are shown in Figure 22. The deformation results of 4 January 2018, and 9 February 2018, were extracted by using Frame 475 of Track 150 Sentinel data. Then, the leveling results were converted to the displacement of LOS direction based on the incident angle. Finally, they could be compared with the A, B, and C leveling points (see Table 2). Table 2 shows that the absolute errors of the leveling data and InSAR measurements at points A, B and C were 2.3, 3.3 and 2.9 mm, respectively, which were relatively small.
Meanwhile, time series InSAR deformation at the corresponding positions of the four leveling points D, E, F, and G were extracted for comparative verification, as shown in Figure 23. The absolute errors between the four leveling points and the InSAR results were 0.1–3.4 mm, 0.25–4.62 mm, 0.19–4.23 mm, and 0.14–3.28 mm, respectively. The correlations between D, E, F, G, and InSAR were 0.98, 0.91, 0.92, and 0.93, respectively.

5. Discussion

5.1. Comparison with Other Permafrost Deformation Studies along the QTR

To assess the deformation results along the QTR, the comparison among other findings that are shown in Table 3. Chen et al. [27] observed deformation rates of −20–20 mm/yr from 2007 to 2010. Chen et al. [22] reported that the QTR and its neighborhood experienced more obvious surface subsidence than surrounding features with a range of −25 to −10 mm/yr. Chang et al. [21] found seasonal displacements of over 15 mm, and inhomogeneous deformation along the track during 2007–2009. Wang et al. [39] collected TerraSAR-X ascending images from June 2014 to December 2015, and showed that the seasonal displacement of the QTR ranged from 20 to 90 mm. The amplitude of seasonal deformation in the Beiluhe area ranged from −50 mm to 10 mm, using our composite index model. Zhang et al. [45] obtained the Naqu-Lhasa section deformation results of the Qinghai-Tibet Railway from 2003 to 2012, using the full rank matrix SBAS method. Zhang et al. [17] used multisource SAR images to retrieve the Wudaoliang-Tuotuohe section deformation rate, which ranged from −20 to 10 mm/year, and most of the QTR appeared to be stable. Han et al. [46] adopted the StaMPS-InSAR method to detect ground displacements ranging from −12.80 to 7.20 mm without any a priori deformation models from March 2017 to June 2018. Recently, Li et al. [78] processed Envisat ASAR data from 2006 to 2009 in Wudaoliang, using SBAS-InSAR technique, with the result of the LOS deformation rate ranging from −15 to 15 mm/yr. The LOS deformation rate with a value range of −20 to 20 mm/yr were observed along the QTR in this study. This result is consistent with the above studies.

5.2. Advantages and Limitations of Permafrost Distribution Mapping

The InSAR method of permafrost distribution mapping is based on the real deformation law of the frozen soil, and the classification results reflect the surface deformation trend of different types of frozen soil. The ISODATA classification method is unsupervised, and the deformation law of permafrost is unknown in advance. The permafrost distribution mapping of the InSAR method is based on all kinds of frozen soil deformation curves, without temperature, annual average ground temperature, soil moisture, altitude, soil type, and other factors, and without the establishment of physical and empirical models of permafrost. It reduces the computation and complexity of permafrost classification. Therefore, it can be used as a new method for mapping permafrost distribution. Zou’s method employs the TTOP model to simulate permafrost distribution, based on measured data, and it needs many input parameters. The resolution of InSAR results in this experiment is approximately 60 m, so the spatial resolution of permafrost distribution map based on InSAR time series deformation is higher. Permafrost degradation is one of the most important problems in cryopedology, at present. This study divides some permafrost regions with decreasing annual deformation into degraded permafrost, which provides a new insight and theoretical basis for the study of permafrost degradation.
However, there are the following limitations in this study:
(1)
The deformation law of permafrost is complex, the deformation laws of some permafrost areas and seasonally frozen ground are similar.
To explain the deformation law of permafrost in more detail, the schematic diagram of the thawing process of permafrost is shown in Figure 24. The permafrost is mainly divided into two layers: the active layer is the first layer, and the permafrost is the second layer. Seasonal thawing subsidence and frost heaving occur in the upper layer of permafrost, that is, the active layer, which generally melts from April to September, and freezes from October to March. However, seasonally frozen ground has only active layer, which also experiences the seasonal freezing-thawing cycle, and completely melts in the thawing period. It is assumed that there is no water loss in the active layer during the freezing-thawing cycle of frozen soil, and the surface subsidence is completely caused by the change of ice to water in the active layer. During the freezing period, if no water is lost and no other surface runoff is mixed with the water, the water is completely converted to ice. Therefore, the surface deformation presents periodic curve of freezing uplift and thawing subsidence. Seasonally frozen ground will show a seasonal freezing-thawing cycle, the deformation amplitude is similar, and the deformation of permafrost will also appear like the deformation curve of seasonally frozen ground. Therefore, seasonally frozen ground based on some permafrost distribution results of the Zou’s method and annual average deformation rate is distinguished.
(2)
Unfortunately, the deformation law of unfrozen ground cannot be distinguished.
(3)
There are some errors in the calculation process of InSAR method, such as unwrapping phase errors, residual topographic phase errors, and residual atmospheric phase errors, etc. These errors may lead to the incorrect time series deformation results which are related to permafrost distribution.
(4)
Without combining other measured data, only time series deformation is used as the input data, and the classification basis is relatively simple.

6. Conclusions

In this paper, the large-scale seasonal deformation and annual average deformation rate maps (approximately 3.15 × 10⁵ km2), using the MTS-InSAR method, were obtained along the QTR, which can be used to analyze the seasonal displacement of freeze-thaw cycles and investigate sections of the QTR with potential geohazards. The seasonal deformation and the long-term displacements based on a composite index model were analyzed. The following conclusions can be drawn:
The seasonal amplitude in the study area ranged from −70 to 20 mm, and was generally smaller than 30 mm in most areas from 16 March 2017 to 24 March 2020. The LOS deformation rate ranged from −40 to 20 mm/yr, and was generally smaller than 16 mm/yr in most areas, and the secular subsidence trend was small. The higher values of seasonal deformation were mainly distributed on the glacier outwash plains of the Kunlun Mountains, located near Salt Lake, the Beiluhe areas, the braided stream plains of Tuotuohe, and downstream of the Chumar River, the Yangbajing area, and the southern region of Lhasa.
The seasonal deformation range of the 10 km buffer zone along the QTR was −50–10 mm, and the LOS deformation rate ranged from −30 to 15 mm/yr. Compared with the leveling data, the absolute error between the leveling points and the InSAR measurements was low, and the correlations were 0.98, 0.91, 0.92, and 0.93, respectively. The sections with high deformation of the subsidence area were mainly distributed on Golmud—Xidatan, Budongquan—Hoh Xili, Wudaoliang—Beiluhe, Fenghuo Mountain—Wuli, Tuotuohe—Yanshiping, Tanggula Mountain—Amdo, Naqu—Damxung, and Yangbajing—Lhasa. The whole railway was relatively stable. The amplitude of the seasonal deformation of the railway ranged from −30 to 15 mm. The LOS deformation rate ranged from −20 to 20 mm/yr.
The deformation of the frozen soil area along the Golmud-Xidatan section of the QTR was relatively low, and the Xidatan region with high seasonal deformation was mainly distributed on glacier outwash plains and floodplain regions. The Budongquan-Hoh Xil sections of the QTR with high seasonal deformation were distributed on the braided stream plains of Chumaer River, Salt Lake, and part of the Hoh Xil region. The degradation of permafrost around Salt Lake may have an impact along the QTR. Serious surface deformation has occurred in the Beiluhe area, with amplitudes of up to 40 mm in recent years. The QTR embankment may be less threatened by the Tanggula Mountain Pass to the Amdo and Naqu to Lhasa sections of the QTR.
Based on InSAR time series deformation results, a new mapping method for permafrost distribution was proposed along the QTR, which can classify the permafrost as permafrost, seasonally frozen ground, and degraded permafrost. The permafrost distribution map of InSAR method and Zou’s method were almost similar in most areas, and the classification of seasonally frozen ground was accurate, while there were differences in fewer areas of permafrost. Our method provides new insights for permafrost distribution mapping.
In the future work, multisource SAR data will be used to conduct surface deformation survey and retrieve active layer thickness on the QTP at a large scale. Meanwhile, other measurement data, remote sensing data, and InSAR data will be fused to study permafrost distribution.

Author Contributions

Conceptualization, J.W., C.W. and H.Z.; formal analysis, J.W.; methodology, J.W. and Y.T.; software, J.W., Y.T., W.D. and L.D.; validation, J.W., C.W. and L.D.; writing—original draft, J.W.; writing—review & editing, C.W. and H.Z.; visualization, J.W.; supervision, C.W.; project administration, H.Z.; funding acquisition, C.W. All authors have read and agreed to the published version of the manuscript.

Funding

This research was supported by the Strategic Priority Research Program of the Chinese Academy of Sciences, Grant No. XDA19090126 and the National Natural Science Foundation of China, Grant No. 41930110.

Institutional Review Board Statement

Not applicable.

Informed Consent Statement

Not applicable.

Data Availability Statement

Sentinel-1 data is provided by the European Space Agency (ESA) and available from the Alaska Satellite Facility (ASF) (https://vertex.daac.asf.alaska.edu, accessed on 19 November 2021). SRTM DEM data is available at https://srtm.csi.cgiar.org/srtmdata/, accessed on 19 November 2021. ERA5- daily air temperature is available at https://cds.climate.copernicus.eu/cdsapp#!/home, accessed on 19 November 2021. The permafrost distribution data set is provided by National Tibetan Plateau Data Center (http://data.tpdc.ac.cn, accessed on 19 November 2021).

Acknowledgments

The authors would like to thank the EU Copernicus Program for providing the Sentinel-1A SAR data, and NASA and CGIAR-CSI for providing SRTM DEM data. The authors wish to thank GIAnT toolbox for providing the InSAR and Time-series analysis tools. Special thanks go to National Tibetan Plateau Data Center (http://data.tpdc.ac.cn, accessed on 19 November 2021) for providing the new map of permafrost distribution on the Tibetan Plateau (2017). Qingbai Wu and Ji Chen and Beiluhe Station of Northwest Institute of Eco-Environment and Resources of CAS are acknowledged for field support. Zhengjia Zhang of China University of Geosciences and Xuefei Zhang of Institute of Tibetan Plateau Research of CAS are acknowledged for helpful discussions.

Conflicts of Interest

The authors declare no conflict of interest.

References

  1. Dobiński, W. International Encyclopedia of Geography: People, the Earth, Environment and Technology. In Permafrost: Definition and Extent; Wiley: Houston, TX, USA, 2016; pp. 1–10. [Google Scholar]
  2. Wang, T.; Wu, T.; Wang, P.; Li, R.; Xie, C.; Zou, D. Spatial distribution and changes of permafrost on the Qinghai-Tibet Plateau revealed by statistical models during the period of 1980 to 2010. Sci. Total Environ. 2019, 650, 661–670. [Google Scholar] [CrossRef] [PubMed]
  3. Cao, B.; Zhang, T.; Wu, Q.; Sheng, Y.; Zhao, L.; Zou, D. Permafrost zonation index map and statistics over the Qinghai–Tibet Plateau based on field evidence. Permafr. Periglac. Process. 2019, 30, 178–194. [Google Scholar] [CrossRef]
  4. Wu, T.; Zhao, L.; Li, R.; Wang, Q.; Xie, C.; Pang, Q. Recent ground surface warming and its effects on permafrost on the central Qinghai-Tibet Plateau. Int. J. Climatol. 2013, 33, 920–930. [Google Scholar] [CrossRef]
  5. Zhao, L.; Wu, T.; Xie, C.; Li, R.; Wu, X.; Yao, J.; Yue, G.; Xiao, Y. Support geoscience research, environmental management, and engineering construction with investigation and monitoring on permafrost in the Qinghai-Tibet Plateau, China. Bull. Chin. Acad. Sci. 2017, 32, 1159–1168. [Google Scholar]
  6. Cheng, G.; Zhao, L.; Li, R.; Wu, X.; Sheng, Y.; Hu, G.; Zou, D.; Jin, H.; Li, X.; Wu, Q. Characteristic, changes and impacts of permafrost on Qinghai-Tibet Plateau. Chin. Sci. Bull. 2019, 64, 2783–2795. [Google Scholar]
  7. Zhao, L.; Wu, Q.; Marchenko, S.; Sharkhuu, N. Thermal state of permafrost and active layer in Central Asia during the International Polar Year. Permafr. Periglac. Process. 2010, 21, 198–207. [Google Scholar] [CrossRef] [Green Version]
  8. Biskaborn, B.K.; Smith, S.L.; Noetzli, J.; Matthes, H.; Vieira, G.; Streletskiy, D.A.; Schoeneich, P.; Romanovsky, V.E.; Lewkowicz, A.G.; Abramov, A. Permafrost is warming at a global scale. Nat. Commun. 2019, 10, 264. [Google Scholar] [CrossRef] [Green Version]
  9. Jin-ping, L.; Yu, S. Analysis of the thermal stability of an embankment under different pavement types in high temperature permafrost regions. Cold Reg. Sci. Technol. 2008, 54, 120–123. [Google Scholar] [CrossRef]
  10. Wu, Q.; Niu, F. Permafrost changes and engineering stability in Qinghai-Xizang Plateau. Chin. Sci. Bull. 2013, 58, 1079–1094. [Google Scholar] [CrossRef] [Green Version]
  11. Zheng, B.; Zhang, J.; Qin, Y. Investigation for the deformation of embankment underlain by warm and ice-rich permafrost. Cold Reg. Sci. Technol. 2010, 60, 161–168. [Google Scholar] [CrossRef]
  12. Tai, B.; Wu, Q.; Zhang, Z.; Xu, X. Cooling performance and deformation behavior of crushed-rock embankments on the Qinghai-Tibet Railway in permafrost regions. Eng. Geol. 2020, 265, 105453. [Google Scholar] [CrossRef]
  13. Youhua, R.; Xin, L. Progress, Challenges and Opportunities of Permafrost Mapping in China. Adv. Earth Sci. 2019, 34, 1015–1027. (In Chinese) [Google Scholar]
  14. Qin, Y.; Zhang, J.; Li, G.; Qu, G. Settlement characteristics of unprotected embankment along the Qinghai–Tibet Railway. Cold Reg. Sci. Technol. 2010, 60, 84–91. [Google Scholar] [CrossRef]
  15. Chen, D.; Fu, Y.-S.; Cai, B.; Yuan, Y.-X. Modeling and algorithms of GPS data reduction for the Qinghai–Tibet railway. IEEE Trans. Intell. Transp. Syst. 2010, 11, 753–758. [Google Scholar] [CrossRef]
  16. Niu, F.; Luo, J.; Lin, Z.; Liu, M.; Yin, G. Thaw-induced slope failures and susceptibility mapping in permafrost regions of the Qinghai–Tibet Engineering Corridor, China. Nat. Hazards 2014, 74, 1667–1682. [Google Scholar] [CrossRef]
  17. Rouyet, L.; Lauknes, T.R.; Christiansen, H.H.; Strand, S.M.; Larsen, Y. Seasonal dynamics of a permafrost landscape, Adventdalen, Svalbard, investigated by InSAR. Remote Sens. Environ. 2019, 231, 111236. [Google Scholar] [CrossRef]
  18. Zhang, Z.; Wang, M.; Wu, Z.; Liu, X. Permafrost deformation monitoring along the qinghai-tibet plateau engineering corridor using InSAR observations with multi-sensor SAR datasets from 1997–2018. Sensors 2019, 19, 5306. [Google Scholar] [CrossRef] [PubMed] [Green Version]
  19. Daout, S.; Doin, M.P.; Peltzer, G.; Socquet, A.; Lasserre, C. Large-scale InSAR monitoring of permafrost freeze-thaw cycles on the Tibetan Plateau. Geophys. Res. Lett. 2017, 44, 901–909. [Google Scholar] [CrossRef]
  20. Rudy, A.C.; Lamoureux, S.F.; Treitz, P.; Short, N.; Brisco, B. Seasonal and multi-year surface displacements measured by DInSAR in a High Arctic permafrost environment. Int. J. Appl. Earth Obs. Geoinf. 2018, 64, 51–61. [Google Scholar] [CrossRef]
  21. Antonova, S.; Sudhaus, H.; Strozzi, T.; Zwieback, S.; Kääb, A.; Heim, B.; Langer, M.; Bornemann, N.; Boike, J. Thaw subsidence of a yedoma landscape in northern Siberia, measured in situ and estimated from TerraSAR-X interferometry. Remote Sens. 2018, 10, 494. [Google Scholar] [CrossRef] [Green Version]
  22. Chang, L.; Hanssen, R.F. Detection of permafrost sensitivity of the Qinghai–Tibet railway using satellite radar interferometry. Int. J. Remote Sens. 2015, 36, 691–700. [Google Scholar] [CrossRef]
  23. Chen, F.; Lin, H.; Zhou, W.; Hong, T.; Wang, G. Surface deformation detected by ALOS PALSAR small baseline SAR interferometry over permafrost environment of Beiluhe section, Tibet Plateau, China. Remote Sens. Environ. 2013, 138, 10–18. [Google Scholar] [CrossRef]
  24. Zhang, X.; Zhang, H.; Wang, C.; Tang, Y.; Zhang, B.; Wu, F.; Wang, J.; Zhang, Z. Time-series InSAR monitoring of permafrost freeze-thaw seasonal displacement over Qinghai–Tibetan Plateau using Sentinel-1 data. Remote Sens. 2019, 11, 1000. [Google Scholar] [CrossRef] [Green Version]
  25. Zebker, H.A.; Villasenor, J. Decorrelation in interferometric radar echoes. IEEE Trans. Geosci. Remote Sens. 1992, 30, 950–959. [Google Scholar] [CrossRef] [Green Version]
  26. Beck, I.; Ludwig, R.; Bernier, M.; Strozzi, T.; Boike, J. Vertical movements of frost mounds in subarctic permafrost regions analyzed using geodetic survey and satellite interferometry. Earth Surf. Dyn. 2015, 3, 409–421. [Google Scholar] [CrossRef] [Green Version]
  27. Wang, L.; Marzahn, P.; Bernier, M.; Jacome, A.; Poulin, J.; Ludwig, R. Comparison of TerraSAR-X and ALOS PALSAR differential interferometry with multisource DEMs for monitoring ground displacement in a discontinuous permafrost region. IEEE J. Sel. Top. Appl. Earth Obs. Remote Sens. 2017, 10, 4074–4093. [Google Scholar] [CrossRef]
  28. Chen, F.; Lin, H.; Li, Z.; Chen, Q.; Zhou, J. Interaction between permafrost and infrastructure along the Qinghai–Tibet Railway detected via jointly analysis of C-and L-band small baseline SAR interferometry. Remote Sens. Environ. 2012, 123, 532–540. [Google Scholar] [CrossRef]
  29. Wang, L.; Marzahn, P.; Bernier, M.; Ludwig, R. Sentinel-1 InSAR measurements of deformation over discontinuous permafrost terrain, Northern Quebec, Canada. Remote Sens. Environ. 2020, 248, 111965. [Google Scholar] [CrossRef]
  30. Ferretti, A.; Prati, C.; Rocca, F. Permanent scatterers in SAR interferometry. IEEE Trans. Geosci. Remote Sens. 2001, 39, 8–20. [Google Scholar] [CrossRef]
  31. Chen, J.; Liu, L.; Zhang, T.; Cao, B.; Lin, H. Using persistent scatterer interferometry to map and quantify permafrost thaw subsidence: A case study of Eboling Mountain on the Qinghai-Tibet Plateau. J. Geophys. Res. Earth Surf. 2018, 123, 2663–2676. [Google Scholar] [CrossRef]
  32. Berardino, P.; Fornaro, G.; Lanari, R.; Sansosti, E. A new algorithm for surface deformation monitoring based on small baseline differential SAR interferograms. IEEE Trans. Geosci. Remote Sens. 2002, 40, 2375–2383. [Google Scholar] [CrossRef] [Green Version]
  33. Wang, J.; Wang, C.; Zhang, H.; Tang, Y.; Zhang, X.; Zhang, Z. Small-Baseline Approach for Monitoring the Freezing and Thawing Deformation of Permafrost on the Beiluhe Basin, Tibetan Plateau Using TerraSAR-X and Sentinel-1 Data. Sensors 2020, 20, 4464. [Google Scholar] [CrossRef]
  34. Li, Z.; Zhao, R.; Hu, J.; Wen, L.; Feng, G.; Zhang, Z.; Wang, Q. InSAR analysis of surface deformation over permafrost to estimate active layer thickness based on one-dimensional heat transfer model of soils. Sci. Rep. 2015, 5, 1–9. [Google Scholar]
  35. Jia, Y.; Kim, J.-W.; Shum, C.; Lu, Z.; Ding, X.; Zhang, L.; Erkan, K.; Kuo, C.-Y.; Shang, K.; Tseng, K.-H. Characterization of active layer thickening rate over the northern Qinghai-Tibetan plateau permafrost region using ALOS interferometric synthetic aperture radar data, 2007–2009. Remote Sens. 2017, 9, 84. [Google Scholar] [CrossRef] [Green Version]
  36. Liu, L.; Zhang, T.; Wahr, J. InSAR measurements of surface deformation over permafrost on the North Slope of Alaska. J. Geophys. Res. Earth Surf. 2010, 115, F3. [Google Scholar] [CrossRef]
  37. Liu, L.; Schaefer, K.; Zhang, T.; Wahr, J. Estimating 1992–2000 average active layer thickness on the Alaskan North Slope from remotely sensed surface subsidence. J. Geophys. Res. Earth Surf. 2012, 117, F1. [Google Scholar] [CrossRef]
  38. Zhao, R.; Li, Z.-W.; Feng, G.-C.; Wang, Q.-J.; Hu, J. Monitoring surface deformation over permafrost with an improved SBAS-InSAR algorithm: With emphasis on climatic factors modeling. Remote Sens. Environ. 2016, 184, 276–287. [Google Scholar] [CrossRef]
  39. Zhang, Z.; Wang, M.; Liu, X.; Wang, C.; Zhang, H. Map and Quantify the Ground Deformation Around Salt Lake in Hoh Xil, Qinghai-Tibet Plateau Using Time-Series InSAR From 2006 to 2018. IEEE J. Sel. Top. Appl. Earth Obs. Remote Sens. 2020, 14, 858–869. [Google Scholar] [CrossRef]
  40. Wang, C.; Zhang, Z.; Zhang, H.; Wu, Q.; Zhang, B.; Tang, Y. Seasonal deformation features on Qinghai-Tibet railway observed using time-series InSAR technique with high-resolution TerraSAR-X images. Remote Sens. Lett. 2017, 8, 1–10. [Google Scholar] [CrossRef]
  41. Wang, C.; Zhang, Z.; Zhang, H.; Zhang, B.; Tang, Y.; Wu, Q. Active layer thickness retrieval of Qinghai–Tibet permafrost using the TerraSAR-X InSAR technique. IEEE J. Sel. Top. Appl. Earth Obs. Remote Sens. 2018, 11, 4403–4413. [Google Scholar] [CrossRef]
  42. Zhang, X.; Zhang, H.; Wang, C.; Tang, Y.; Zhang, B.; Wu, F.; Wang, J.; Zhang, Z. Active Layer Thickness Retrieval Over the Qinghai-Tibet Plateau Using Sentinel-1 Multitemporal InSAR Monitored Permafrost Subsidence and Temporal-Spatial Multilayer Soil Moisture Data. IEEE Access 2020, 8, 84336–84351. [Google Scholar] [CrossRef]
  43. Chen, J.; Wu, Y.; O’Connor, M.; Cardenas, M.B.; Schaefer, K.; Michaelides, R.; Kling, G. Active layer freeze-thaw and water storage dynamics in permafrost environments inferred from InSAR. Remote Sens. Environ. 2020, 248, 112007. [Google Scholar] [CrossRef]
  44. Daout, S.; Dini, B.; Haeberli, W.; Doin, M.-P.; Parsons, B. Ice loss in the Northeastern Tibetan Plateau permafrost as seen by 16 yr of ESA SAR missions. Earth Planet. Sci. Lett. 2020, 545, 116404. [Google Scholar] [CrossRef]
  45. Lu, P.; Han, J.; Li, Z.; Xu, R.; Li, R.; Hao, T.; Qiao, G. Lake outburst accelerated permafrost degradation on Qinghai-Tibet Plateau. Remote Sens. Environ. 2020, 249, 112011. [Google Scholar] [CrossRef]
  46. Zhang, Q.; Li, Y.; Zhang, J.; Luo, Y. InSAR technique applied to the monitoring of the Qinghai–Tibet Railway. Nat. Hazards Earth Syst. Sci. 2019, 19, 2229–2240. [Google Scholar] [CrossRef] [Green Version]
  47. Han, J.; Lu, P. Retrieving Surface Deformation of the Qinghai-Tibet Railway Across Permafrost Areas from InSAR. In Proceedings of the IGARSS 2020–2020 IEEE International Geoscience and Remote Sensing Symposium, Waikoloa, HI, USA, 26 September–2 October 2020; pp. 3074–3077. [Google Scholar]
  48. Youwu, Z.; Dongxin, G. Principal characteristics of permafrost in China. J. Glaciol. Geocryol. 1982, 4, 1–19. [Google Scholar]
  49. Li, X.; Cheng, G. A GIS-aided response model of high-altitude permafrost to global change. Sci. China Ser. D Earth Sci. 1999, 42, 72–79. [Google Scholar] [CrossRef]
  50. Qiu, G. The principle of geocryological regionalization and the compilation of frozen ground map. In Geocryology in China; Zhou, Y.W., Guo, D.X., Qiu, G.Q., Cheng, G.D., Li, S.D., Eds.; Science Press: Beijing, China, 2000; pp. 162–170. [Google Scholar]
  51. Wang, T.; Wang, N.; Li, S. Map of the Glaciers, Frozen Ground and Desert in China, 1:4,000,000; Chinese Map Press: Beijing, China, 2006. [Google Scholar]
  52. Ran, Y.; Li, X.; Cheng, G.; Zhang, T.; Wu, Q.; Jin, H.; Jin, R. Distribution of permafrost in China: An overview of existing permafrost maps. Permafr. Periglac. Process. 2012, 23, 322–333. [Google Scholar] [CrossRef]
  53. Zou, D.; Zhao, L.; Sheng, Y.; Chen, J.; Hu, G.; Wu, T.; Wu, J.; Xie, C.; Wu, X.; Pang, Q. A new map of permafrost distribution on the Tibetan Plateau. Cryosphere 2017, 11, 2527–2542. [Google Scholar] [CrossRef] [Green Version]
  54. Ran, Y.; Li, X.; Cheng, G. Climate warming over the past half century has led to thermal degradation of permafrost on the Qinghai–Tibet Plateau. Cryosphere 2018, 12, 595–608. [Google Scholar] [CrossRef] [Green Version]
  55. Wu, Q.; Zhang, T. Changes in active layer thickness over the Qinghai-Tibetan Plateau from 1995 to 2007. J. Geophys. Res. Atmos. 2010, 115, 115. [Google Scholar] [CrossRef]
  56. Xi, X.; Xu, Z. Ecological environment protection in the construction of Qinghai-Tibet railway. Environ. Sci Technol. 2005, 28, 119–121. [Google Scholar]
  57. Chen, D.; Cheng, R. Intelligent Processing Algorithms and Applications for GPS Positioning Data of Qinghai-Tibet Railway; Springer: Berlin/Heidelberg, Germany, 2019. [Google Scholar]
  58. Wu, Q.; Zhang, T.; Liu, Y. Thermal state of the active layer and permafrost along the Qinghai-Xizang (Tibet) Railway from 2006 to 2010. Cryosphere 2012, 6, 607–612. [Google Scholar] [CrossRef] [Green Version]
  59. Wu, Q.; Cheng, G.; Ma, W.; Niu, F.; Sun, Z. Technical approaches on permafrost thermal stability for Qinghai–Tibet Railway. Geomech. Geoengin. Int. J. 2006, 1, 119–127. [Google Scholar] [CrossRef]
  60. Ni, J.; Wu, T.; Zhu, X.; Wu, X.; Pang, Q.; Zou, D.; Chen, J.; Li, R.; Hu, G.; Du, Y. Risk assessment of potential thaw settlement hazard in the permafrost regions of Qinghai-Tibet Plateau. Sci. Total Environ. 2021, 776, 145855. [Google Scholar] [CrossRef]
  61. Savitzky, A.; Golay, M.J. Smoothing and differentiation of data by simplified least squares procedures. Anal. Chem. 1964, 36, 1627–1639. [Google Scholar] [CrossRef]
  62. Memarsadeghi, N.; Mount, D.M.; Netanyahu, N.S.; Le Moigne, J. A fast implementation of the ISODATA clustering algorithm. Int. J. Comput. Geom. Appl. 2007, 17, 71–103. [Google Scholar] [CrossRef]
  63. Xu, X.; Sandwell, D.T.; Tymofyeyeva, E.; González-Ortega, A.; Tong, X. Tectonic and anthropogenic deformation at the Cerro Prieto geothermal step-over revealed by Sentinel-1A InSAR. IEEE Trans. Geosci. Remote Sens. 2017, 55, 5284–5292. [Google Scholar] [CrossRef]
  64. Agram, P.; Jolivet, R.; Riel, B.; Lin, Y.; Simons, M.; Hetland, E.; Doin, M.P.; Lasserre, C. New radar interferometric time series analysis toolbox released. EOS Trans. Am. Geophys. Union 2013, 94, 69–70. [Google Scholar] [CrossRef] [Green Version]
  65. Hu, Y.; Liu, L.; Larson, K.M.; Schaefer, K.M.; Zhang, J.; Yao, Y. GPS interferometric reflectometry reveals cyclic elevation changes in thaw and freezing seasons in a permafrost area (Barrow, Alaska). Geophys. Res. Lett. 2018, 45, 5581–5589. [Google Scholar] [CrossRef]
  66. Cao, B.; Zhang, T.; Peng, X.; Mu, C.; Wang, Q.; Zheng, L.; Wang, K.; Zhong, X. Thermal characteristics and recent changes of permafrost in the upper reaches of the heihe river basin, Western China. J. Geophys. Res. Atmos. 2018, 123, 7935–7949. [Google Scholar] [CrossRef]
  67. López-Quiroz, P.; Doin, M.-P.; Tupin, F.; Briole, P.; Nicolas, J.-M. Time series analysis of Mexico City subsidence constrained by radar interferometry. J. Appl. Geophys. 2009, 69, 1–15. [Google Scholar] [CrossRef]
  68. Wang, C.; Tang, Y.; Zhang, H.; You, H.; Zhang, W.; Duan, W.; Wang, J.; Dong, L.; Zhang, B. First mapping of China surface movement using supercomputing interferometric SAR technique. Sci. Bull. 2021, 66, 1608–1610. [Google Scholar] [CrossRef]
  69. Zhou, C.; Gong, H.; Chen, B.; Gao, M.; Cao, Q.; Cao, J.; Duan, L.; Zuo, J.; Shi, M. Land subsidence response to different land use types and water resource utilization in Beijing-Tianjin-Hebei, China. Remote Sens. 2020, 12, 457. [Google Scholar] [CrossRef] [Green Version]
  70. Dik, A.; El Moujahid, A.; Jebari, K.; Ettouhami, A. A new dynamic algorithm for unsupervised learning. Int. J. Innov. Comput. Inf. Control. 2015, 11, 1325–1339. [Google Scholar]
  71. Ball, G.H.; Hall, D.J. ISODATA, A Novel Method of Data Analysis and Pattern Classification; Stanford Research Institute: Menlo Park, CA, USA, 1965. [Google Scholar]
  72. ERA Monthly Averaged Data on Pressure Levels from 1979 to Present. Available online: https://cds.climate.copernicus.eu/cdsapp#!/dataset/10.24381/cds.6860a573?tab=overview (accessed on 20 October 2021).
  73. Yao, X.; Sun, M.; Gong, P.; Liu, B.; Li, X.; An, L.; Yan, L. Overflow probability of the salt lake in Hoh Xil region. J. Geogr. Sci. 2018, 28, 647–655. [Google Scholar] [CrossRef] [Green Version]
  74. Zhou, H.; Zhao, L.; Tian, L.; Wu, Z.; Xie, M.; Yuan, L.; Ni, J.; Qiao, Y.; Gao, Z.; Shi, J. Monitoring and analysis of surface deformation in the permafrost area of Wudaoliang on the Tibetan Plateau based on Sentinel-1 data. J. Glaciol. Geocryol. 2019, 41, 525–536. (In Chinese) [Google Scholar]
  75. Zhao, L. A New Map of Permafrost Distribution on the Tibetan Plateau (2017); National Tibetan Plateau Data Center: Beijing, China, 2019. [Google Scholar] [CrossRef]
  76. Hong, Z.; Jin, S. Permafrost deformation in Qinghai-Tibet Plateau time-series PS-InSAR. Bull. Surv. Mapp. 2021, 1, 35–40. (In Chinese) [Google Scholar] [CrossRef]
  77. Zhao, T.; Zhang, M.; Lu, J.; Yan, Z. Correlation between the ground surface deformation and influential factors in permafrost regions. J. Harbin Inst. Technol. 2021, 53, 145–153. (In Chinese) [Google Scholar] [CrossRef]
  78. Li, R.; Li, Z.; Han, J.; Lu, P.; Qiao, G.; Meng, X.; Hao, T.; Zhou, F. Monitoring surface deformation of permafrost in Wudaoliang Region, Qinghai–Tibet Plateau with ENVISAT ASAR data. Int. J. Appl. Earth Obs. Geoinf. 2021, 104, 102527. [Google Scholar] [CrossRef]
Figure 1. The location of study area and QTR in China. (a) Study area superimposed on the color map from ArcMap software. (b) Study area superimposed on a one arc-second Shuttle Radar Topography Mission (SRTM) digital elevation model (DEM) shaded topography map along the QTR, China.
Remotesensing 13 04744 g001
Figure 2. Schematic diagram superimposed on the world imagery map from the ArcMap software along the Golmud-Lhasa section of the QTR. The figure in brackets indicates the station’s altitude.
Remotesensing 13 04744 g002
Figure 3. Vertical sectional profile graph and field photos of the QTR (from Golmud to Lhasa). (ac) are field photos of the QTR. (d) is vertical sectional profile graph of the QTR.
Remotesensing 13 04744 g003
Figure 4. Coverage of Sentinel-1A SAR images. The white box indicates the coverage of Sentinel-1 data. The red line represents the QTR. The background map is from Google Earth.
Remotesensing 13 04744 g004
Figure 5. Flowchart of the MTS-InSAR processing approach.
Remotesensing 13 04744 g005
Figure 6. Deformation results of the study area. (a) Amplitude of seasonal deformation. (b) LOS velocity.
Remotesensing 13 04744 g006
Figure 7. DEM error map in the study area. (a) DEM error distribution map. (b) Frequency distribution histogram of DEM error.
Remotesensing 13 04744 g007
Figure 8. Deformation results along QTR buffer. (a) DEM map along QTR buffer. (b) Slope map along QTR buffer. (c) Seasonal deformation map along QTR buffer. (d) LOS deformation rate map along QTR buffer.
Remotesensing 13 04744 g008
Figure 9. A magnified view of deformation results of these geohazard-prone sections.
Remotesensing 13 04744 g009
Figure 10. Relation between the height, amplitude of the seasonal deformation and LOS deformation rate along the MN\PQ\QTR profile. (a) Geographic location along MN\PQ\QTR profile. (b) Height and amplitude of the seasonal deformation and LOS deformation rate profile along M to N. (c) Height and amplitude of the seasonal deformation and LOS deformation rate profile along P to Q.
Remotesensing 13 04744 g010
Figure 11. Relationship between the height, amplitude of the seasonal deformation and LOS deformation rate along the QTR profile. (a) Height and amplitude of the seasonal deformation profile along the QTR profile. (b) Height and LOS deformation rate along QTR profile.
Remotesensing 13 04744 g011
Figure 12. Deformation analysis map for Xidatan superimposed on the world imagery map from the ArcMap software. (a) Seasonal deformation map. (b) Google earth images of Region A. (c) Google earth images of Region B.
Remotesensing 13 04744 g012
Figure 13. Deformation results superimposed on the world imagery map from the ArcMap software in the Hoh Xil area. (a) Seasonal deformation map. (b) A magnified view of Salt Lake in (a). (c) Google earth images of the Hoh Xil area. (d) Optical images of Salt Lake.
Remotesensing 13 04744 g013
Figure 14. The time series deformation and the ERA5 daily air temperature of extract point. Point A (a), Point B (c), Point C (e) are the daily air temperature. Point A (b), Point B (d), Point C (f) are the ERA5 product.
Remotesensing 13 04744 g014
Figure 15. Deformation results superimposed on the world imagery map from the ArcMap software from Wudaoliang to Wuli. (a) Seasonal deformation map. (b) Deformation rate map. (c) Optical images. (d) Optical images for Beiluhe.
Remotesensing 13 04744 g015
Figure 16. The time series deformation and the ERA5 daily air temperature of extract point. Point A (a), Point B (c), Point C (e), Point D (g) are the daily air temperature. Point A (b), Point B (d), Point C (f), Point D (h) are the ERA5 product.
Remotesensing 13 04744 g016
Figure 17. Field investigate photos in Beiluhe area. (a) QTR embankment. (b) Subsidence areas along the QTR. (c) The cut slope of the QTR. (d) Alpine meadow area.
Remotesensing 13 04744 g017
Figure 18. Deformation results superimposed on the world imagery map from the ArcMap software from Naqu to Lhasa. (a) Seasonal deformation map. (b) Deformation rate map. (c) Optical images. (d) Optical images for Lhasa.
Remotesensing 13 04744 g018
Figure 19. The time series deformation and the ERA5 daily air temperature of extract point. Point A (a), Point B (c), Point C (e), Point D (g) are the daily air temperature. Point A (b), Point B (d), Point C (f), Point D (h) are the ERA5 product.
Remotesensing 13 04744 g019
Figure 20. Comparison of frozen soil classification results between the InSAR method based on the InSAR time series deformation and (a) Zou’s method. (b) InSAR method.
Remotesensing 13 04744 g020
Figure 21. Deformation graphs of the frozen soil. (a,b) are the deformation curve of seasonally frozen ground. (c) is the deformation curve of degraded permafrost. (df) are the deformation curve of permafrost.
Remotesensing 13 04744 g021
Figure 22. Geographic location map of leveling points along the QTR. (a) The seasonal deformation map. (b) The Google Earth imagery.
Remotesensing 13 04744 g022
Figure 23. Correlation between leveling and InSAR measurements at points D, E, F, and G. (a) Point D. (b) Point E. (c) Point F. (d) Point G.
Remotesensing 13 04744 g023
Figure 24. Schematic diagram of permafrost during thawing period.
Remotesensing 13 04744 g024
Table 1. Detailed information for Sentinel-1A SAR data along the QTR.
Sentinel-1Number of SAR ImagesAngle of IncidenceMemory Occupied by Data
Track 77 Frame 4708039.844 G × 80 = 320 G
Track 77 Frame 4758139.374 G × 81 = 324 G
Track 150 Frame 4758239.314 G × 82 = 328 G
Track 150 Frame 4808439.804 G × 84 = 336 G
Track 150 Frame 4858739.824 G × 87 = 348 G
Track 150 Frame 4908539.864 G × 85 = 340 G
Track 150 Frame 4958639.844 G × 86 = 344 G
Table 2. The absolute error between the measured values of leveling points A, B, and C and the InSAR observed values along the QTR.
BenchmarkABC
Leveling(unit:mm)2.2−8.8−16.6
InSAR results(unit:mm)4.5−12.1−19.5
Absolute error(unit:mm)2.33.32.9
Table 3. Permafrost deformation studies along the QTR.
Study AreaInSAR MethodSAR DatasetObservation PeriodSeasonal Displacements or Deformation RateAuthors
Beiluhe-FenghuoshanIPTAALOS-1 PALSAR and Envisat ASAR2007–2010−20–20 mm/yrChen et al. (2012)
Beiluhe-FenghuoshanSBASALOS-1 PALSAR2007–2010−25–10 mm/yrChen et al. (2013)
Qiangtang terraneMTInSAREnvisat ASAR2007–2009−15–15 mmChang et al. (2015)
BeiluheMTInSARTerraSAR-X2014–201520–90 mmWang et al. (2017)
Naqu-LhasaSBASEnvisat ASAR and TerraSAR-X2003–2012−20–20 mm/yrZhang et al. (2018)
Wudaoliang-TuotuoheMT-InSARSentinel-1/Envisat ASAR/ERS-11997–2018−20–10 mm/yrZhang et al. (2019)
WudaoliangStaMPS-InSARSentinel-1 and TerraSAR-X2017–2018−12.80–7.20 mm/yrHan et al. (2020)
WudaoliangSBASEnvisat ASAR2006–20090–40 mm/−15–15 mm/yrLi et al. (2021)
Golmud-LhasaNSBASSentinel-12017–2020−20–20 mm/yrThis study
Publisher’s Note: MDPI stays neutral with regard to jurisdictional claims in published maps and institutional affiliations.

