Article

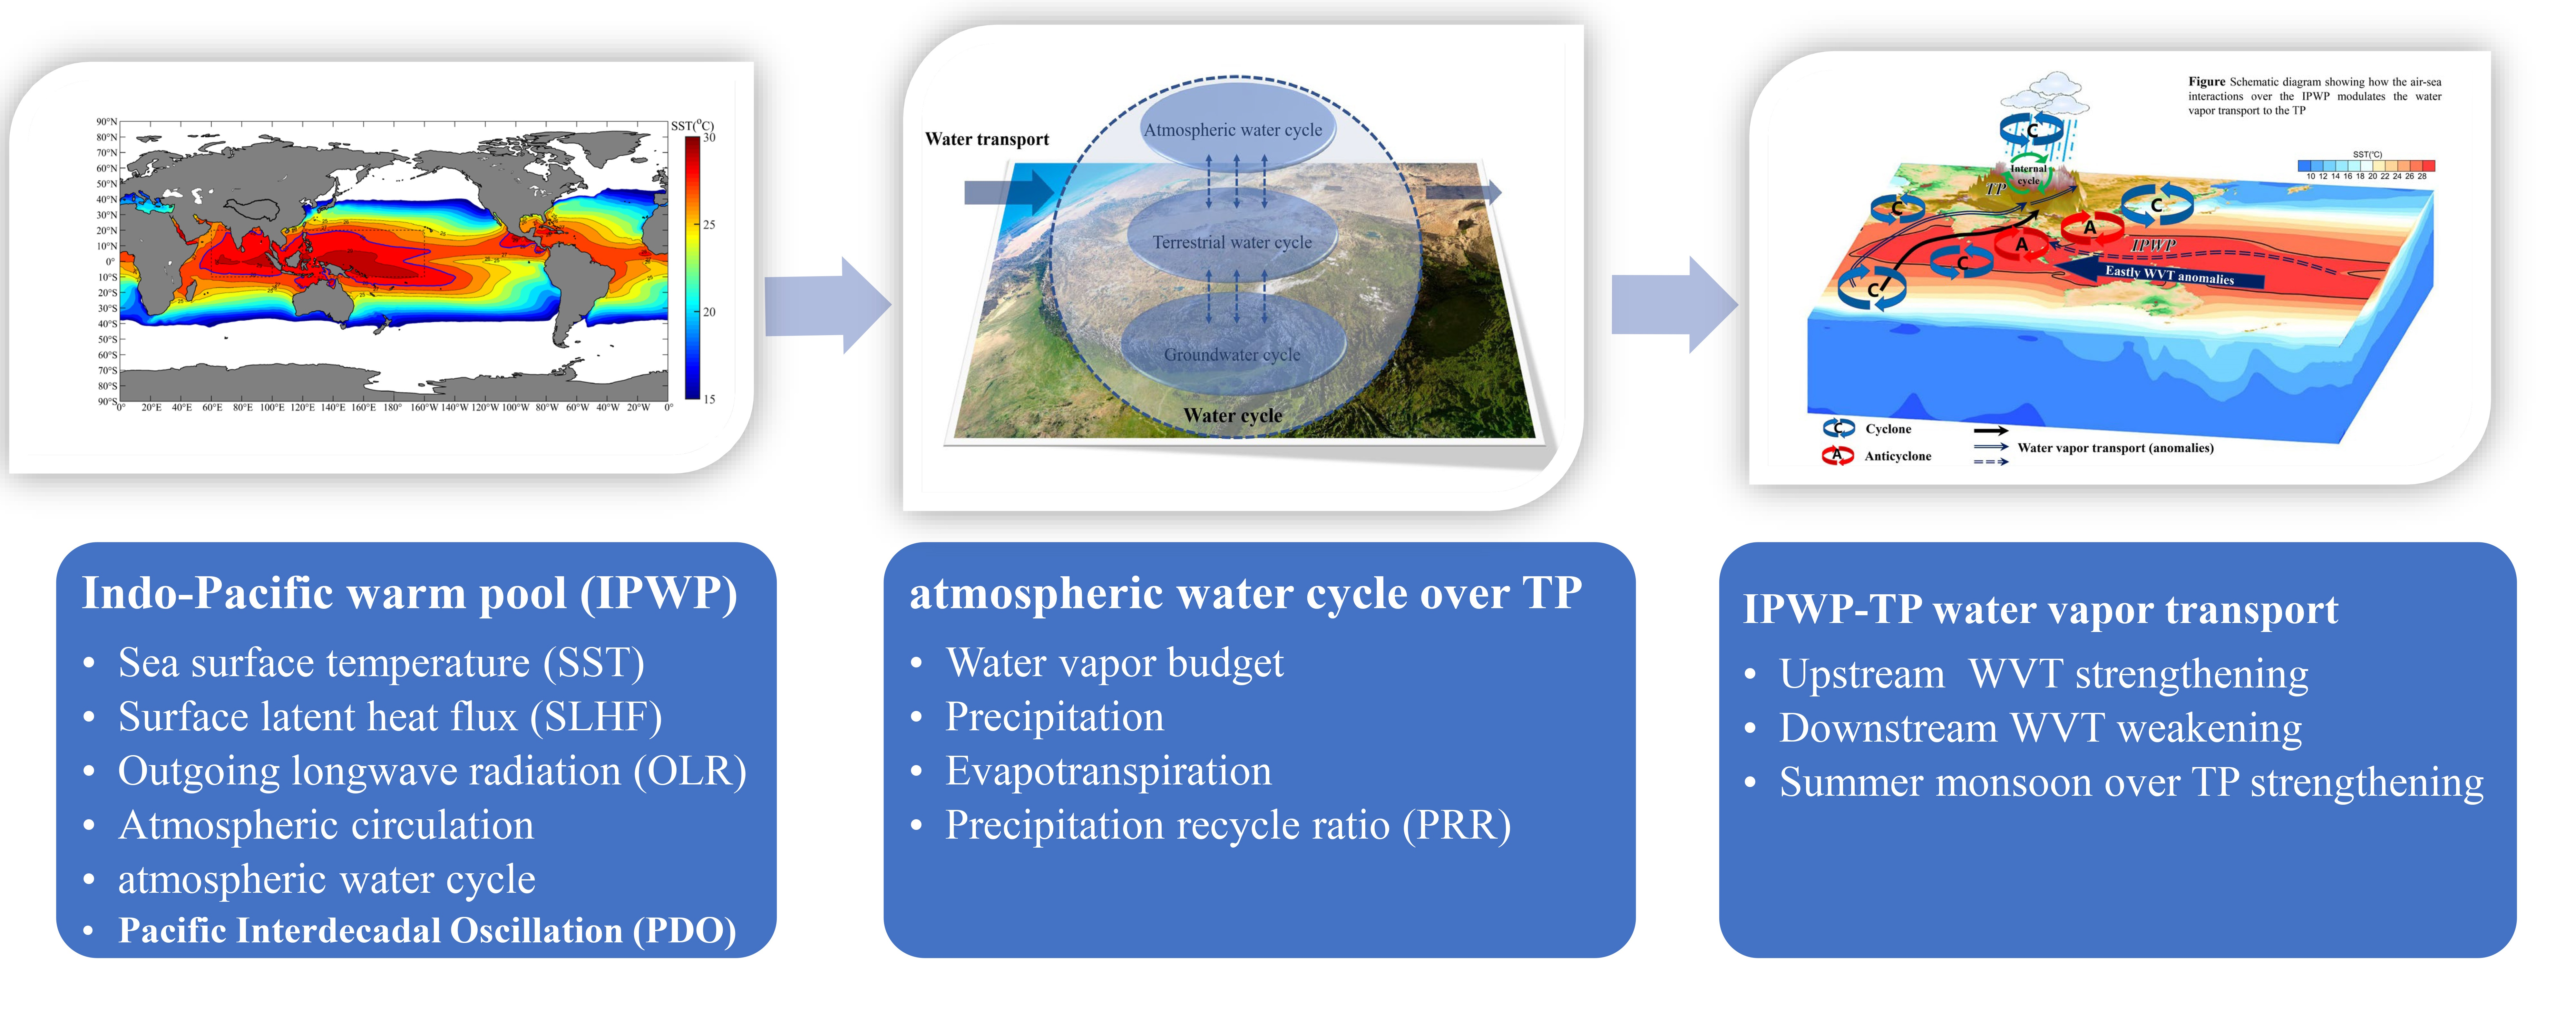
The Variability of Summer Atmospheric Water Cycle over the Tibetan Plateau and Its Response to the Indo-Pacific Warm Pool

1
Key Laboratory of Digital Earth Science, Aerospace Information Research Institute, Chinese Academy of Sciences, Beijing 100094, China
2
University of Chinese Academy of Sciences, Beijing 100049, China
3
National Satellite Meteorological Center, China Meteorological Administration, Beijing 100081, China
*
Author to whom correspondence should be addressed.
Remote Sens. 2021, 13(22), 4676; https://doi.org/10.3390/rs13224676
Submission received: 17 September 2021 / Revised: 12 November 2021 / Accepted: 18 November 2021 / Published: 19 November 2021

Abstract

:
The Tibetan Plateau (TP), atmosphere, and Indo-Pacific warm pool (IPWP) together constitute a regional land–atmosphere–ocean water vapor transport system. This study uses remote sensing data, reanalysis data, and observational data to explore the spatiotemporal variations of the summer atmospheric water cycle over the TP and its possible response to the air-sea interaction in the IPWP during the period 1958–2019. The results reveal that the atmospheric water cycle process over the TP presented an interannual and interdecadal strengthening trend. The climatic precipitation recycle ratio (PRR) over the TP was 18%, and the stronger the evapotranspiration, the higher the PRR. On the interdecadal scale, the change in evapotranspiration has a significant negative correlation with the Pacific Decadal Oscillation (PDO) index. The variability of the water vapor transport (WVT) over the TP was controlled by the dynamic and thermal conditions inside the plateau and the external air-sea interaction processes of the IPWP. When the summer monsoon over the TP was strong, there was an anomalous cyclonic WVT, which increased the water vapor budget (WVB) over the TP. The central and eastern tropical Pacific, the maritime continent and the western Indian Ocean together constituted the triple Sea Surface Temperature (SST) anomaly, which enhanced the convective activity over the IPWP and induced a significant easterly wind anomaly in the middle and lower troposphere, and then generated pronounced easterly WVT anomalies from the tropical Pacific to the maritime continent and the Bay of Bengal. Affected by the air-sea changes in the IPWP, the combined effects of the upstream strengthening and the downstream weakening in the water vapor transport process, directly and indirectly, increased the water vapor transport and budget of TP.

Graphical Abstract

1. Introduction

Water plays a vital role in maintaining the stability of ecosystems and social systems; in the context of global warming, the evolution of the regional water resources pattern and the water cycle under high mountain conditions show more significant response characteristics [1,2]. The Tibetan Plateau (TP), also known as the “Asian Water Tower,” not only stores a large amount of freshwater resources (lakes, glaciers, snow, etc.) but is also the birthplace of many rivers, and its water cycle is sensitive to the climate change [3,4]. Under the background of thermal and dynamic effects caused by complex topographic features, the water vapor transport (WVT) and water cycle system of TP are different from other regions at the same latitude, making the TP an important bridge connecting the land-atmosphere-ocean system in the northern hemisphere (covering Eurasia, Indian Ocean, and Pacific Ocean, etc.) [5,6]. The water cycle system of TP consists of three subsystems: atmospheric water cycle, terrestrial water cycle, and groundwater cycle, and atmospheric water cycle directly interacts with terrestrial water and groundwater cycle, which in turn has a vital impact on the security of resources and social and economic development of the surrounding continents [7,8,9]. In the past 50 years, under the background, the mean warming rate of the TP is twice the average of the world, the water cycle process of the TP and its key elements have undergone dramatic changes. For the plateau terrestrial water cycle, the accelerated melting and degradation of glaciers, degradation of permafrost, and significant expansion of lakes have jointly regulated the land water balance of many local and downstream rivers [2,10,11]. For the atmospheric water cycle, the increase in evapotranspiration and the increase in external water vapor transport will increase precipitation in the TP and finally affect the terrestrial water cycle [6,12,13]. Therefore, examining the evolution characteristics of the atmospheric water cycle of the TP provides indispensable theoretical support for revealing the evolution of the hydrological system of the TP and has great practical significance for the scientific utilization of water resources [14,15].
The summer precipitation accounts for approximately 60–70% of the annual precipitation on the TP [16,17]. The water vapor sources of precipitation can be divided into external WVT and local evapotranspiration [12,13,18]. The temporal and spatial changes in WVT and local evapotranspiration have an important impact on the evolution of the TP’s atmospheric water cycle, and their respective contributions to the TP’s precipitation have also changed in recent years [19,20,21]. The contribution rate of local evapotranspiration to precipitation is also known as the precipitation recycle ratio (PRR) [22], and the PRR is closely related to the precipitation and evapotranspiration on a regional scale and represents the intensity of the atmospheric water cycle [23]. The PRR varies greatly in different regions at different spatial scales. Arnault et al. used the weather research forecast (WRF) simulation to study the PRR in Northwest Africa and demonstrated the PRR was 1% and 7% at the scale of 100 km and 1000 km, respectively [24]. Many studies have pointed out that contributions of recycled moisture to local precipitation play an important role in regional water resource redistribution in western China [25,26,27]. Many have focused on the PRR over the TP, as shown in Table 1. The PRR of the TP in summer during the past forty years is approximately 23–28% [28,29], while the contribution rate of the southern TP to precipitation is 30% [30], and the central and western TP is nearly 14–18% [31,32]. Meanwhile, the PRR in the northern TP increased with the increase in precipitation, and the southern TP decreased with the decrease in precipitation [18]. For different areas of the TP and western China, the PRR is 9% in the Tianshan Mountains; 16% in the Urumqi Oasis as an arid region [33,34]; and 20–24% on the northern slope of the Qilian Mountains, which increases with elevation [35,36], by 20% and 19% for the Yangtze and Yellow River basins [37], and is about 14% in the Tarim River Basin [38].
Quantitative studies based on reanalysis datasets, stable isotopes of precipitation, and circulation simulations show the summer water vapor on the TP mainly comes from the long-distance transport channel from the equatorial western Indian Ocean to the Arabian Sea and the Bay of Bengal, and a small part comes from the westerly wind from Eurasia as shown in Figure 1a [42,43,44,45,46]. The interannual and interdecadal changes in the water vapor budget (WVB) over the TP are not only directly affected by large-scale circulations. Namely, the South Asian monsoon (SAM), the East Asian Summer Monsoon (EASM), and the westerly belts [47,48,49], but are also indirectly regulated by ocean and atmosphere conditions [50,51], including the Indian Ocean Dipole (IOD), El Niño-Southern Oscillation (ENSO) [52], Pacific Interdecadal Oscillation (PDO), and North Atlantic Oscillation (NAO) [53,54,55]. From the perspective of the entire process of WVT [56], the Indo-Pacific Warm Pool (IPWP) is the water vapor source and a key area that affects the TP’s WVT and the atmospheric water cycle, and the positive anomalies of sea surface temperature (SST) and surface latent heat flux (SLHF) in the IPWP will strengthen the local Hadley circulation, and trigger local anomalous anticyclones in the northern Bay of Bengal, transporting more water vapor to the TP [57,58]. The most important SST anomalies (SSTA) mode in the Indo-Pacific Ocean was a zonal tripolar mode that would affect the monsoon precipitation in southern China [59]. The seasonal and interannual variability of the IPWP may have a significant relationship with the climate changes on marine and atmospheric circulations [60], and Cai and Tian found the precipitation and water vapor in the IPWP display a V-shaped longitudinal pattern in their spatial variations, reflecting the enhanced precipitation and increase in convective intensity along water vapor transport routes [61].
At present, there is a broad understanding of the atmospheric water cycle (WVT, WVB, and PRR) of the TP, but the TP is often considered as a whole or simply divided it into several parts to study. Considering that the atmospheric water cycle characteristics of the basins within the TP are different from each other, how does their PRR change due to the combined effects of external WVT and internal evapotranspiration in the basins? What is the possible influence of air-sea action in the IPWP on the water vapor transport over the TP? Although there are some related studies, no more detailed studies have been conducted related works from the perspective of the entire process of water vapor transport of IPWP-TP. In this paper, we tried to study the influence of the changes in the air-sea changes in the IPWP on the summer atmospheric water cycle over the TP and the possible mechanism.
The paper is organized as follows, Section 2 describes the datasets and methods. The results discussed in Section 3 include: (1) the variations of the summer atmospheric water cycle characteristics of the basins within the TP, and the relative contribution of local evapotranspiration and external water vapor transport to the precipitation on the annual scale; (2) spatiotemporal changes in the outgoing longwave radiation (OLR) of the IPWP; (3) the possible mechanism of the IPWP air-sea effect on TP’s water vapor transport and cycle process. Finally, Section 4 presents the discussion and conclusions, respectively.

2. Data and Methodology

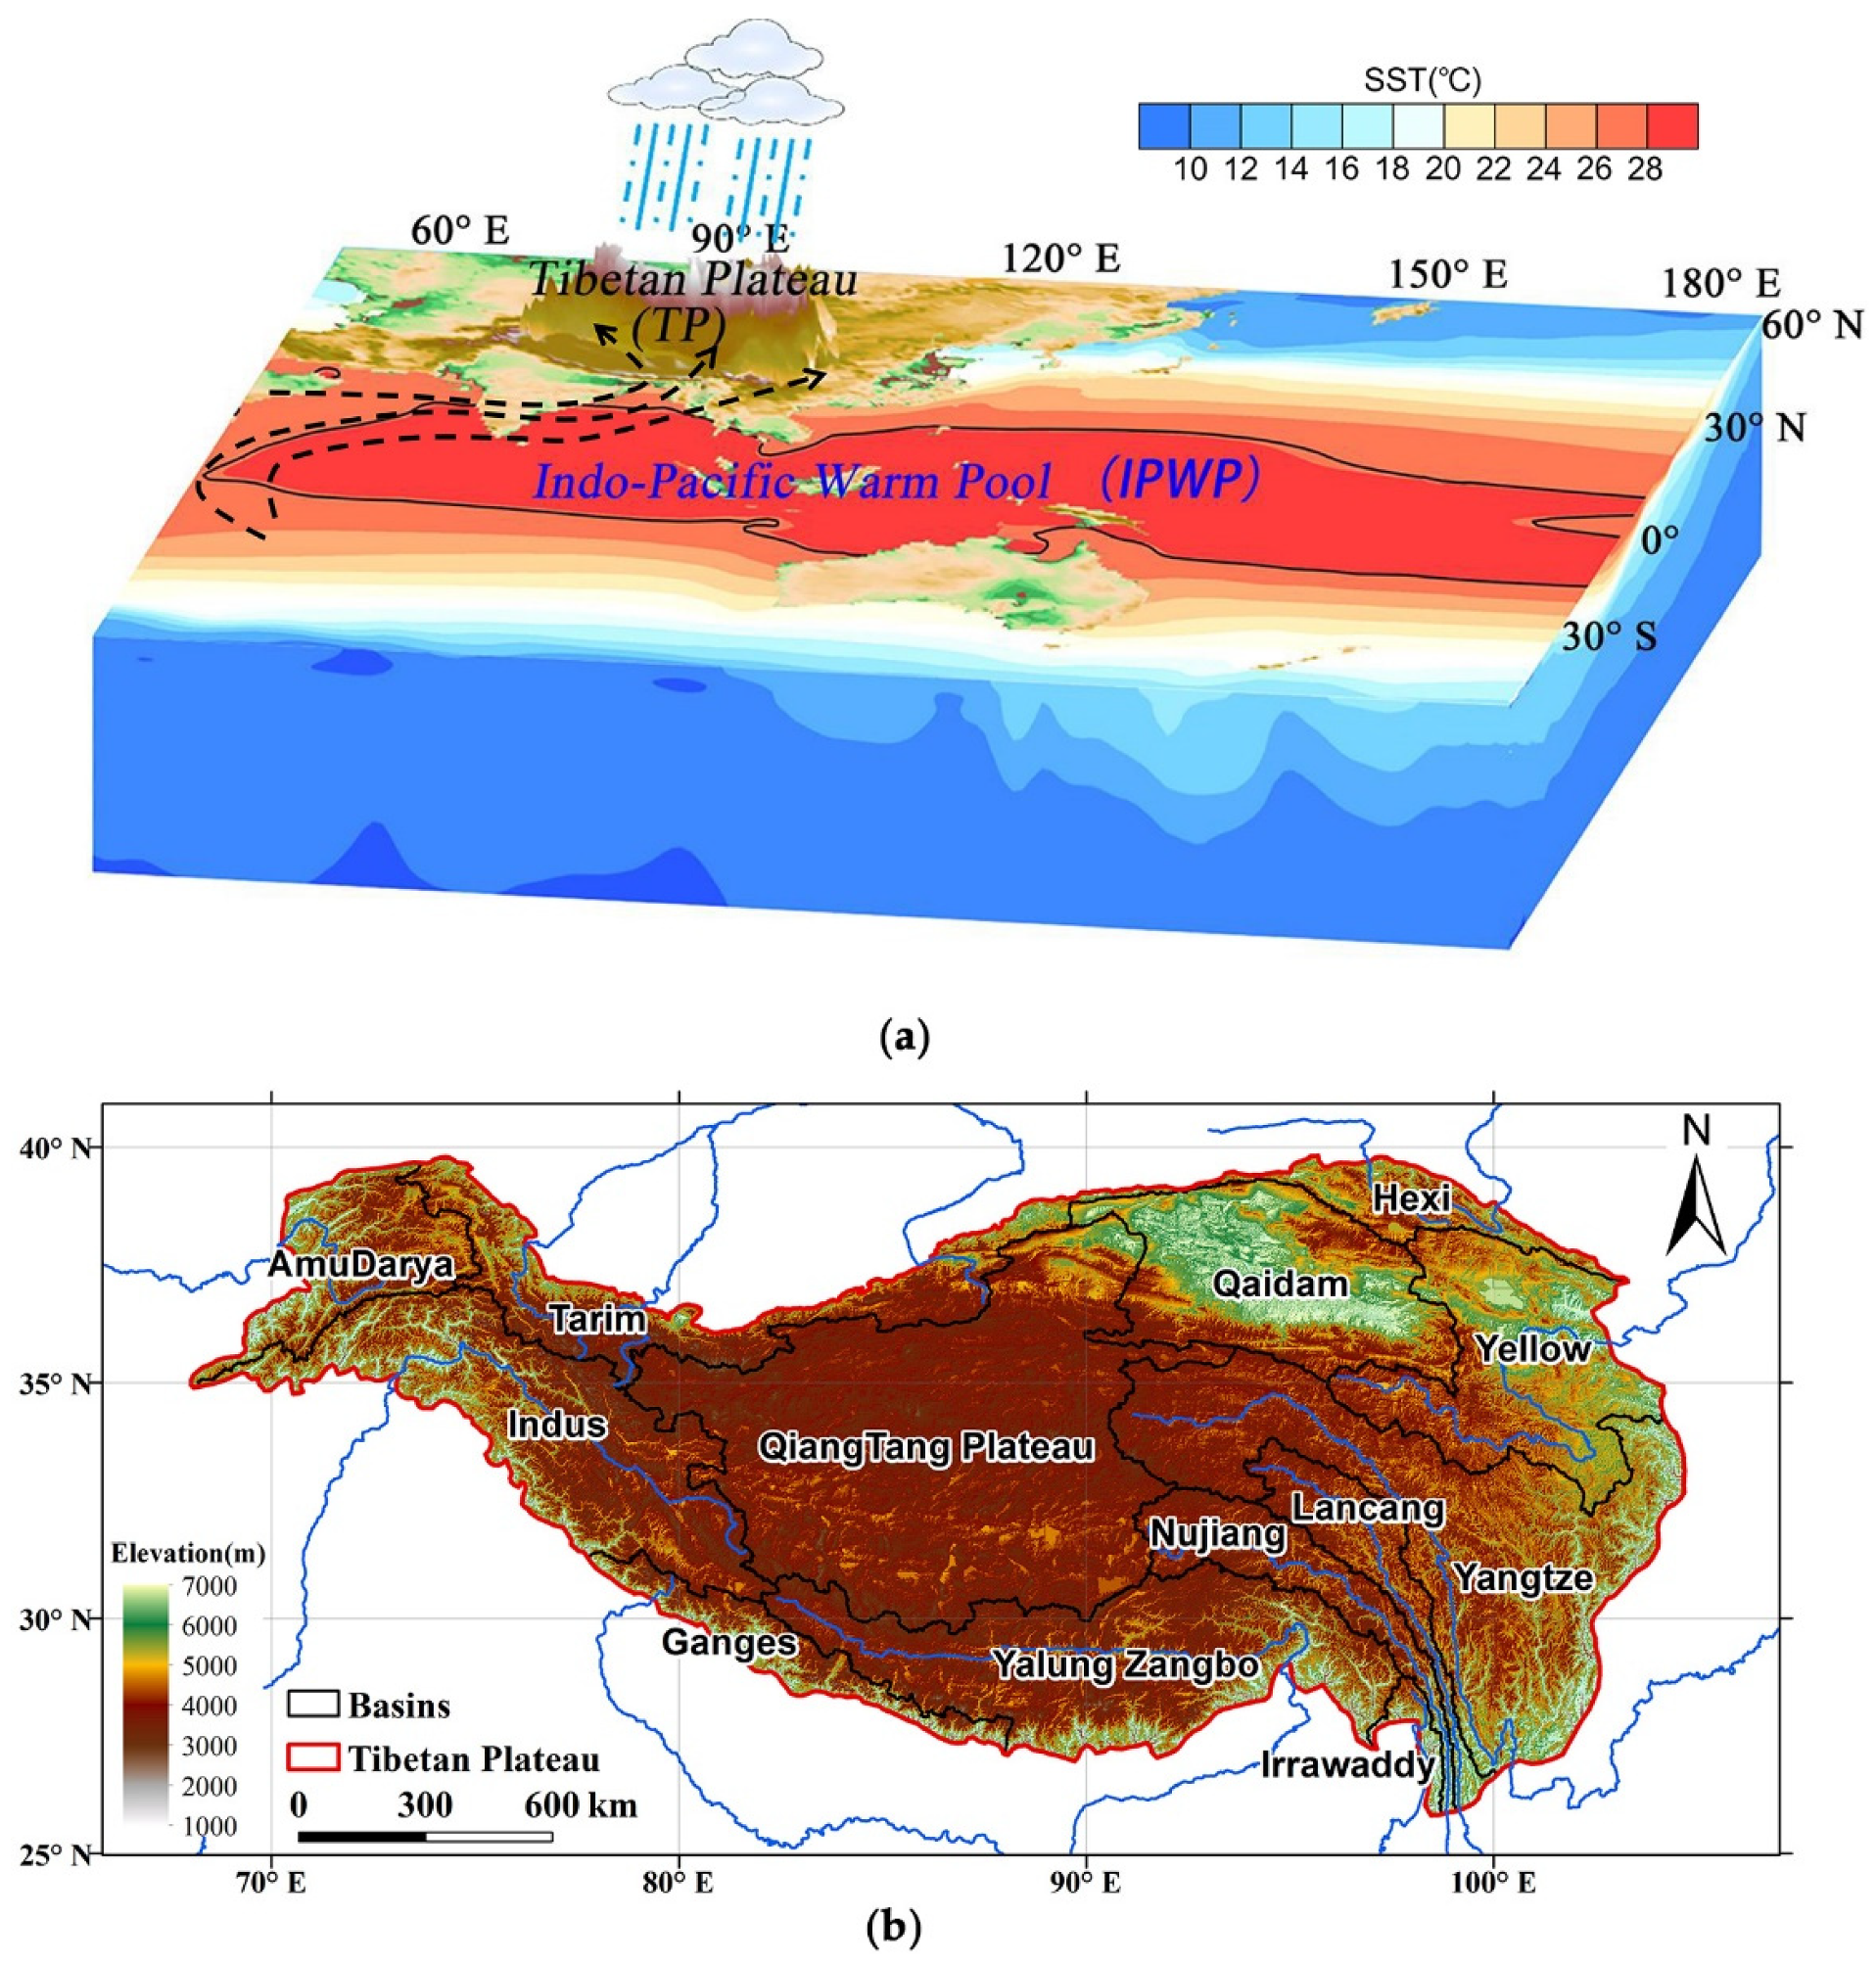
2.1. Data and Study Area
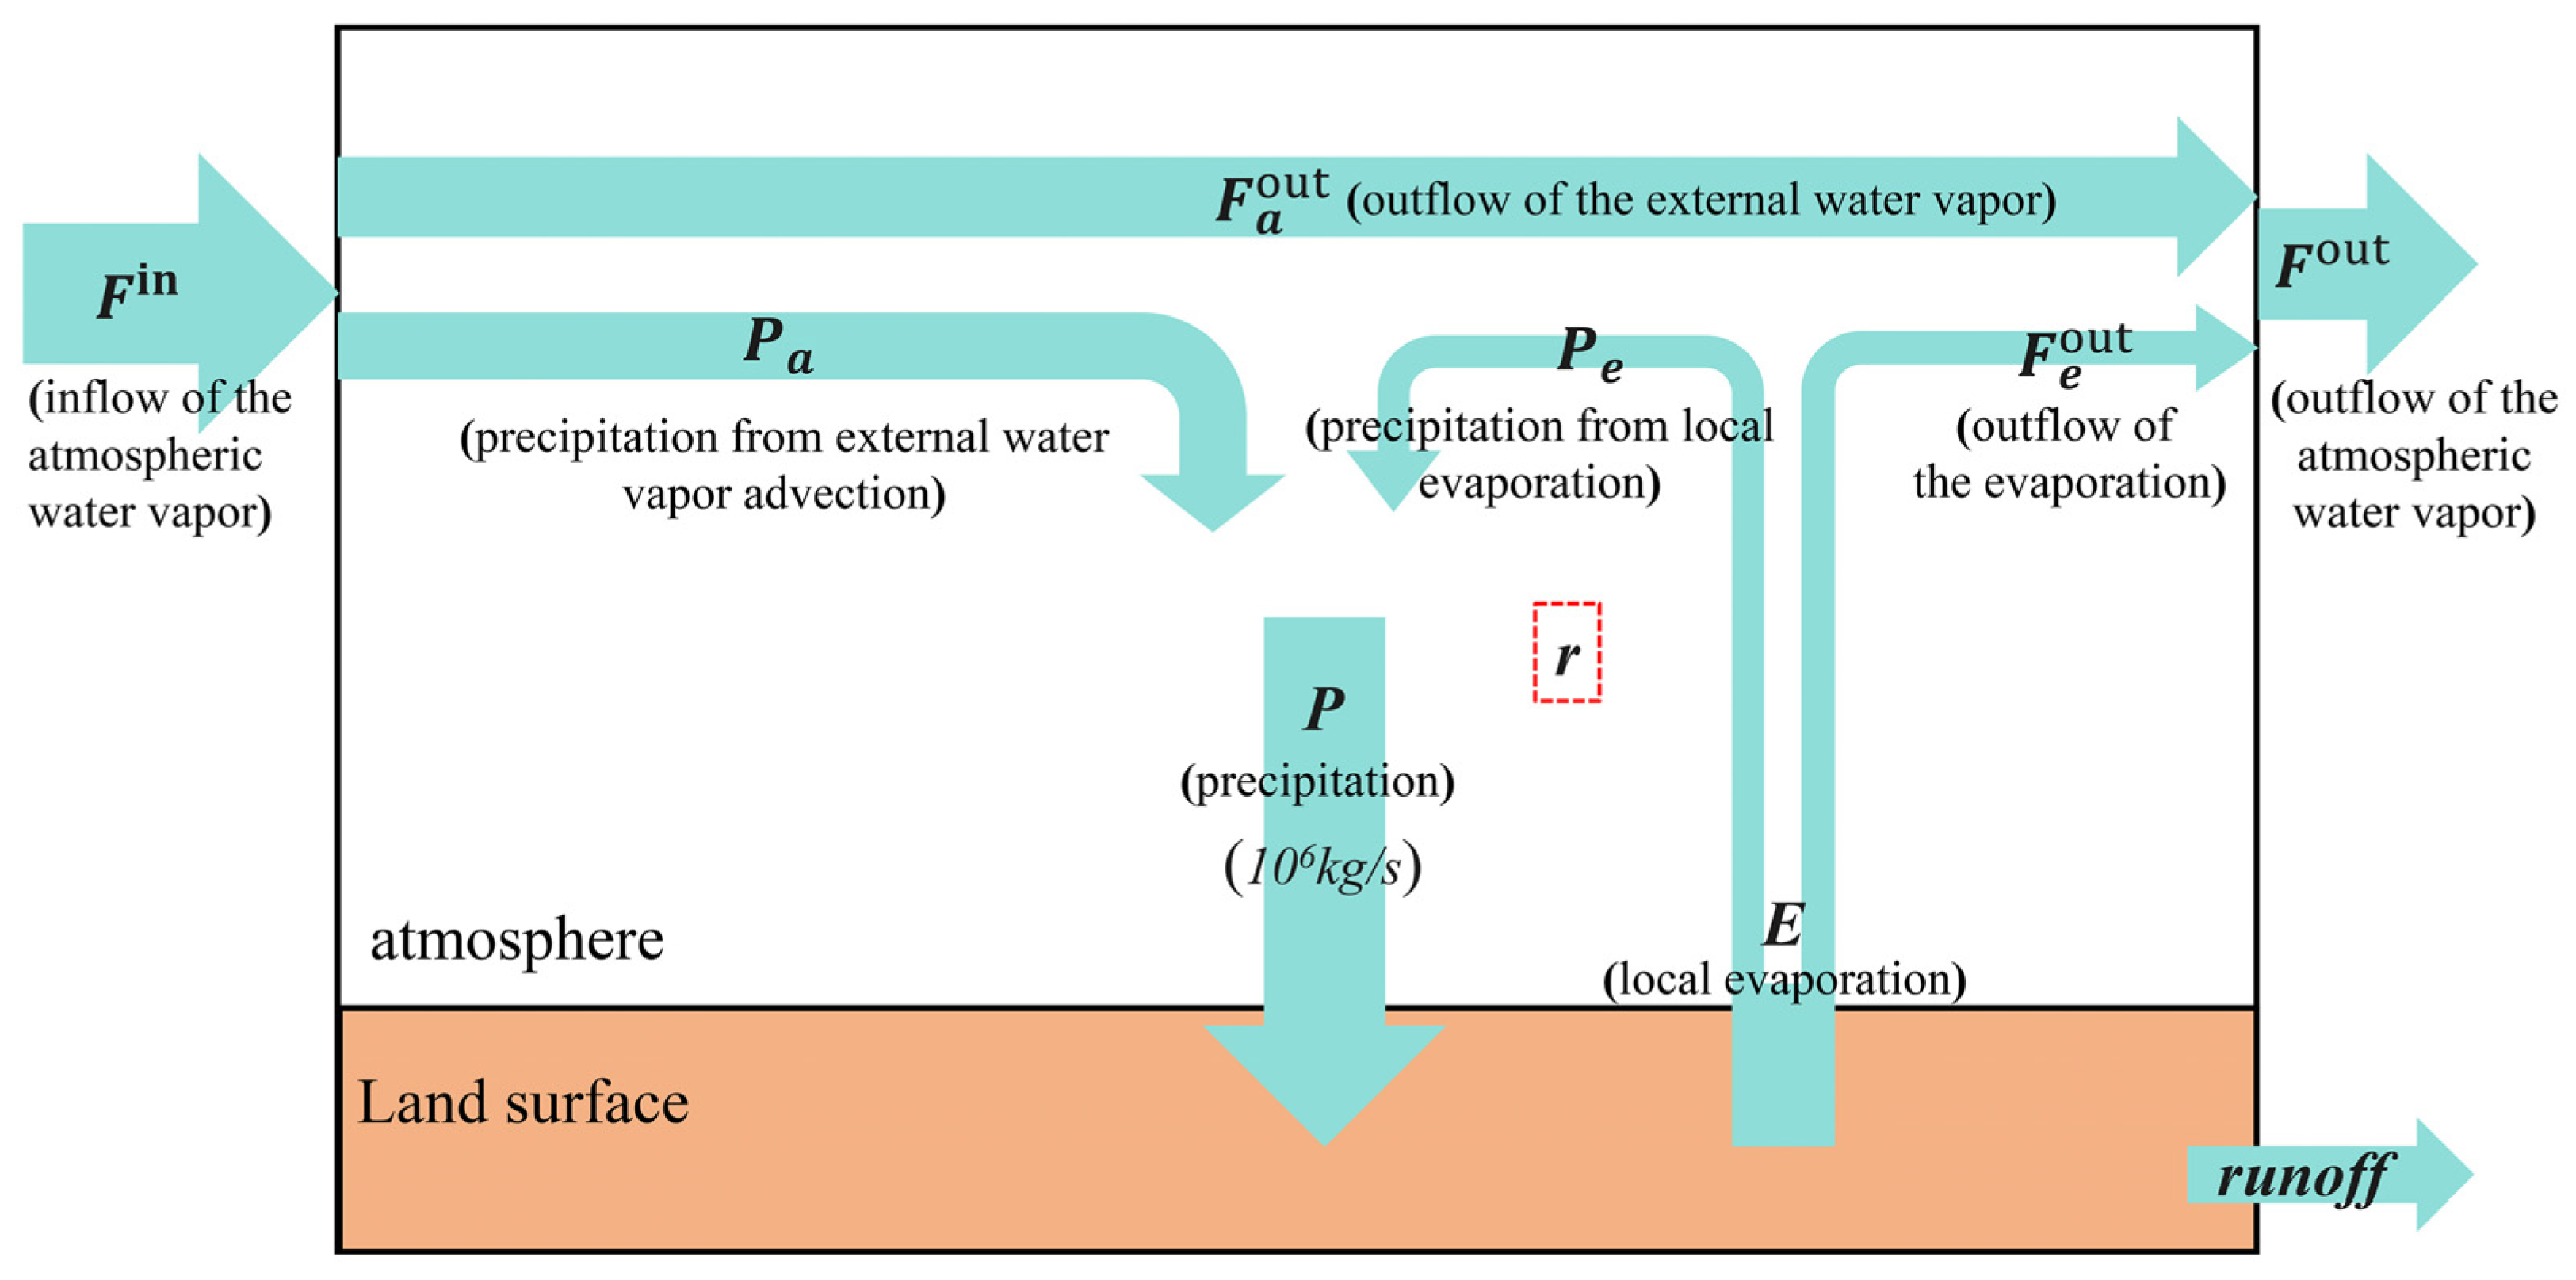
The data used in this paper were divided into 4 types, station observational precipitation data, reanalysis dataset, remote sensing data, and related climate indexes. The observed precipitation data were derived from the monthly average precipitation data (CN05.1) from 1961 to 2016 provided by the China Meteorological Administration (CMA), with a horizontal resolution of 0.5° [62] (http://data.cma.cn/ (accessed on 1 October 2020)). The reanalysis data used mainly included the Japanese 55-year Reanalysis (JRA-55) monthly dataset provided by the Japan Meteorological Agency (JMA), the time was from 1958 to 2019, and the spatial resolution was 1.25°. The variables include the meridional and zonal vertical integrated water vapor flux (Q), precipitation (Precip), evapotranspiration (Evp), horizonal wind, specific humidity, vertical velocity, geopotential height, surface pressure, and surface latent heat flux [63,64] (https://rda.ucar.edu/datasets/ds628.1/ (accessed on 1 October 2020)). To verify the reliability of the JRA-55, the ERA5 monthly dataset from 1950 to 2019 provided by the European Center for Medium-Range Weather Forecast (ECMWF) was also used, with a spatial resolution of 0.25° [65] (https://cds.climate.copernicus.eu (accessed on 1 December 2020)). The third reanalysis data used was the CMA global reanalysis (CRA-40) monthly dataset from 1979 to 2019 provided by the CMA, which is the first-generation global atmosphere and land reanalysis data produced by CMA (http://data.cma.cn/ (accessed on 1 July 2021)), which has a spatial resolution of 0.312° latitude × 0.312° longitude, with 64 levels in the vertical [66,67]. The remote sensing data used were the high-resolution satellite outgoing longwave radiation product (HIRS OLR) with a resolution of 1° from 1979 to 2019 [68] (https://www.ncei.noaa.gov/data/outgoing-longwave-radiation-daily/ (accessed on 23 June 2020)), where the data from May to September in 1985 are missing. The HIRS OLR was first used to verify the OLR data of ERA5, and then to study the temporal and spatial distribution of OLR and convective activities over the TP and the IPWP, and the relationship between the SLHF and summer convective activity and water vapor transport over the TP. The Hadley Centre Sea Ice and Sea Surface Temperature data set (HadISST) with a resolution of 1.0° from 1870 to date provided by the Met Office, Hadley Centre, was applied to the spatiotemporal variations of IPWP [69] (https://www.metoffice.gov.uk/hadobs/hadisst/data/download.html (accessed on 11 March 2020)). In addition, the Pacific Decadal Oscillation (PDO) index provided by the National Oceanic and Atmospheric Administration (NOAA) were also used [70] (https://psl.noaa.gov/pdo/, (accessed on 1 July 2021)).
To be consistent with the precipitation data, this study uniformly interpolated the spatial resolution of the JRA-55, ERA5, and CRA-40 reanalysis data sets to 0.5°, and the time resolution was on the monthly scale from 1958 to 2019. As shown in Figure 1a, the range of the IPWP was defined as 10°S–20°N, 60°E–160°W; the Indian Ocean Warm Pool (IOWP) rectangular boundary range is 10°S–20°N, 60°E–100°E; and the Western Pacific Warm Pool (WPWP) rectangular boundary range was 10°S–20°N, 120°E–160°W. The TP was further divided into 13 river basins, including 9 exorheic basins of the AmuDarya, Indus, Ganges, Yalung Zangbo, Irrawaddy, Nu Jiang, Lancang, Upper Yangtze, and Upper Yellow River Basins, and 4 endorheic basins of the Hexi Corridor and Tarim River, Qaidam Basin, and Qiangtang Plateau [71], as shown in Figure 1b.

2.2. Methodology

The vertically integrated water vapor flux (F) is calculated as:
F = 1 g p s p t q V d q
where g (unit: 9.8 m s−2) represents the gravity acceleration; p s and p t are the surface and top pressure (unit: hPa), respectively; and V is the horizontal wind (unit: m s−1), and q is the specific humidity (kg kg−1).
The water vapor budget (WVB) is defined as follows:
W V B = F d l
where l is the boundary curve of the TP or its internal basins.
This study was based on the Brubaker binary model to calculate the contribution of the external WVT and local evapotranspiration of the TP to precipitation [21,22,72]. The physical basis of the model (Figure 2) is the atmospheric water vapor balance equation. The derivation is as follows:
Q t = F u x + F v x   +   E P
where Q is the vertically integrated water vapor; F u and F v are the vertically integrated zonal and meridional WVT, respectively, and E and P are the surface evapotranspiration and precipitation, respectively. On a longer timescale (such as the scale above the month), the water vapor changes very little with time and can be ignored, which results in the following:
F u x + F v y   = E P
The atmospheric water vapor in an area can be divided into two types, namely, the water vapor content caused by external WVT ( Q a ) and the water vapor content formed by local land surface evapotranspiration ( Q e ). Assuming that the water vapor formed by evapotranspiration is fully mixed in the local atmosphere, and the two have the same chance of forming precipitation, thus P a P = Q a Q and P e P = Q e Q . P a and P e are the precipitation caused by external WVT and local evapotranspiration, respectively. The water vapor balance equation of the external WVT term is as follows:
F u a x + F v a y   = P a
where F u a and F v a present the zonal and meridional vertical integration of the external WVT input, respectively.
Assuming that during the process, the regional average E , P ,   P a and P e have the same characteristics of each grid point in the study area results in the following:
F | A = F out F in =   E P A
F a | A = F a out F in = P a A
where A is the area, F | A and F a | A represent the total water vapor of the study area and the convergent divergence of water vapor transported from the outside to the target area, respectively. F out and F a out represent the total water vapor flowing out of the area and the water vapor flowing out of the area from the external WVT input, respectively. F in represents the total water vapor transported from external advection. Formulas (4) and (5) can be further transformed into the following:
F ¯ =   F out + F in / 2 = F in +   E P A / 2
F a ¯ = F a out + F in 2 = F in P a A / 2
Assuming that the water vapor from the local evapotranspiration and the external transport is well mixed in the atmosphere, that is P a P = F a ¯ F ¯ , applying Equations (8) and (9), then the ratio of the amount of precipitation formed by local evapotranspiration can be defined as the precipitation recycle ratio (PRR):
r = E · A E · A + 2 F in
Furthermore, we obtained the amount of precipitation formed by evaporative water vapor ( P e = P · r ) and the amount of precipitation formed by external WVT ( P a = P P e ), as well as the external water vapor ( F a out = F in P a ) and from the evapotranspiration ( F e out = E P e ). Therefore, the precipitation caused by external WVT, and local evapotranspiration is obtained as P a =   1 r   ·   P and P e = r · P , respectively.
The main analysis methods in this paper included correlation analysis, empirical orthogonal function decomposition (EOF), and linear regression. The significance was tested by the t-test method. The average value from 1958 to 2019 was calculated as the climatological mean, and the linear trend was removed before the correlation and regression analysis.
In addition, we also used the TP summer monsoon (TPSM) index Div_PMI to examine the relationship between the summer monsoon and WVB of the TP and the IPWP defined by Zhou [73]. We selected the central area (30°N–35°N, 80°E–100°E) where the negative value of the winter and summer divergence was the most obvious in the 600 hPa on the TP as the main TP area and defined the TPSM index as the convergence over the region at 600 hPa in summer, and then the Div_PMI was reversed to obtain Neg(Div_PMI), which means that the greater the positive value, the stronger the TPSM.
Neg Div _ PMI   = div | 30 ° N 35 ° N ,   80 ° E 100 ° E

3. Results

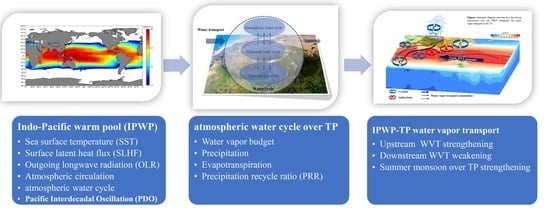
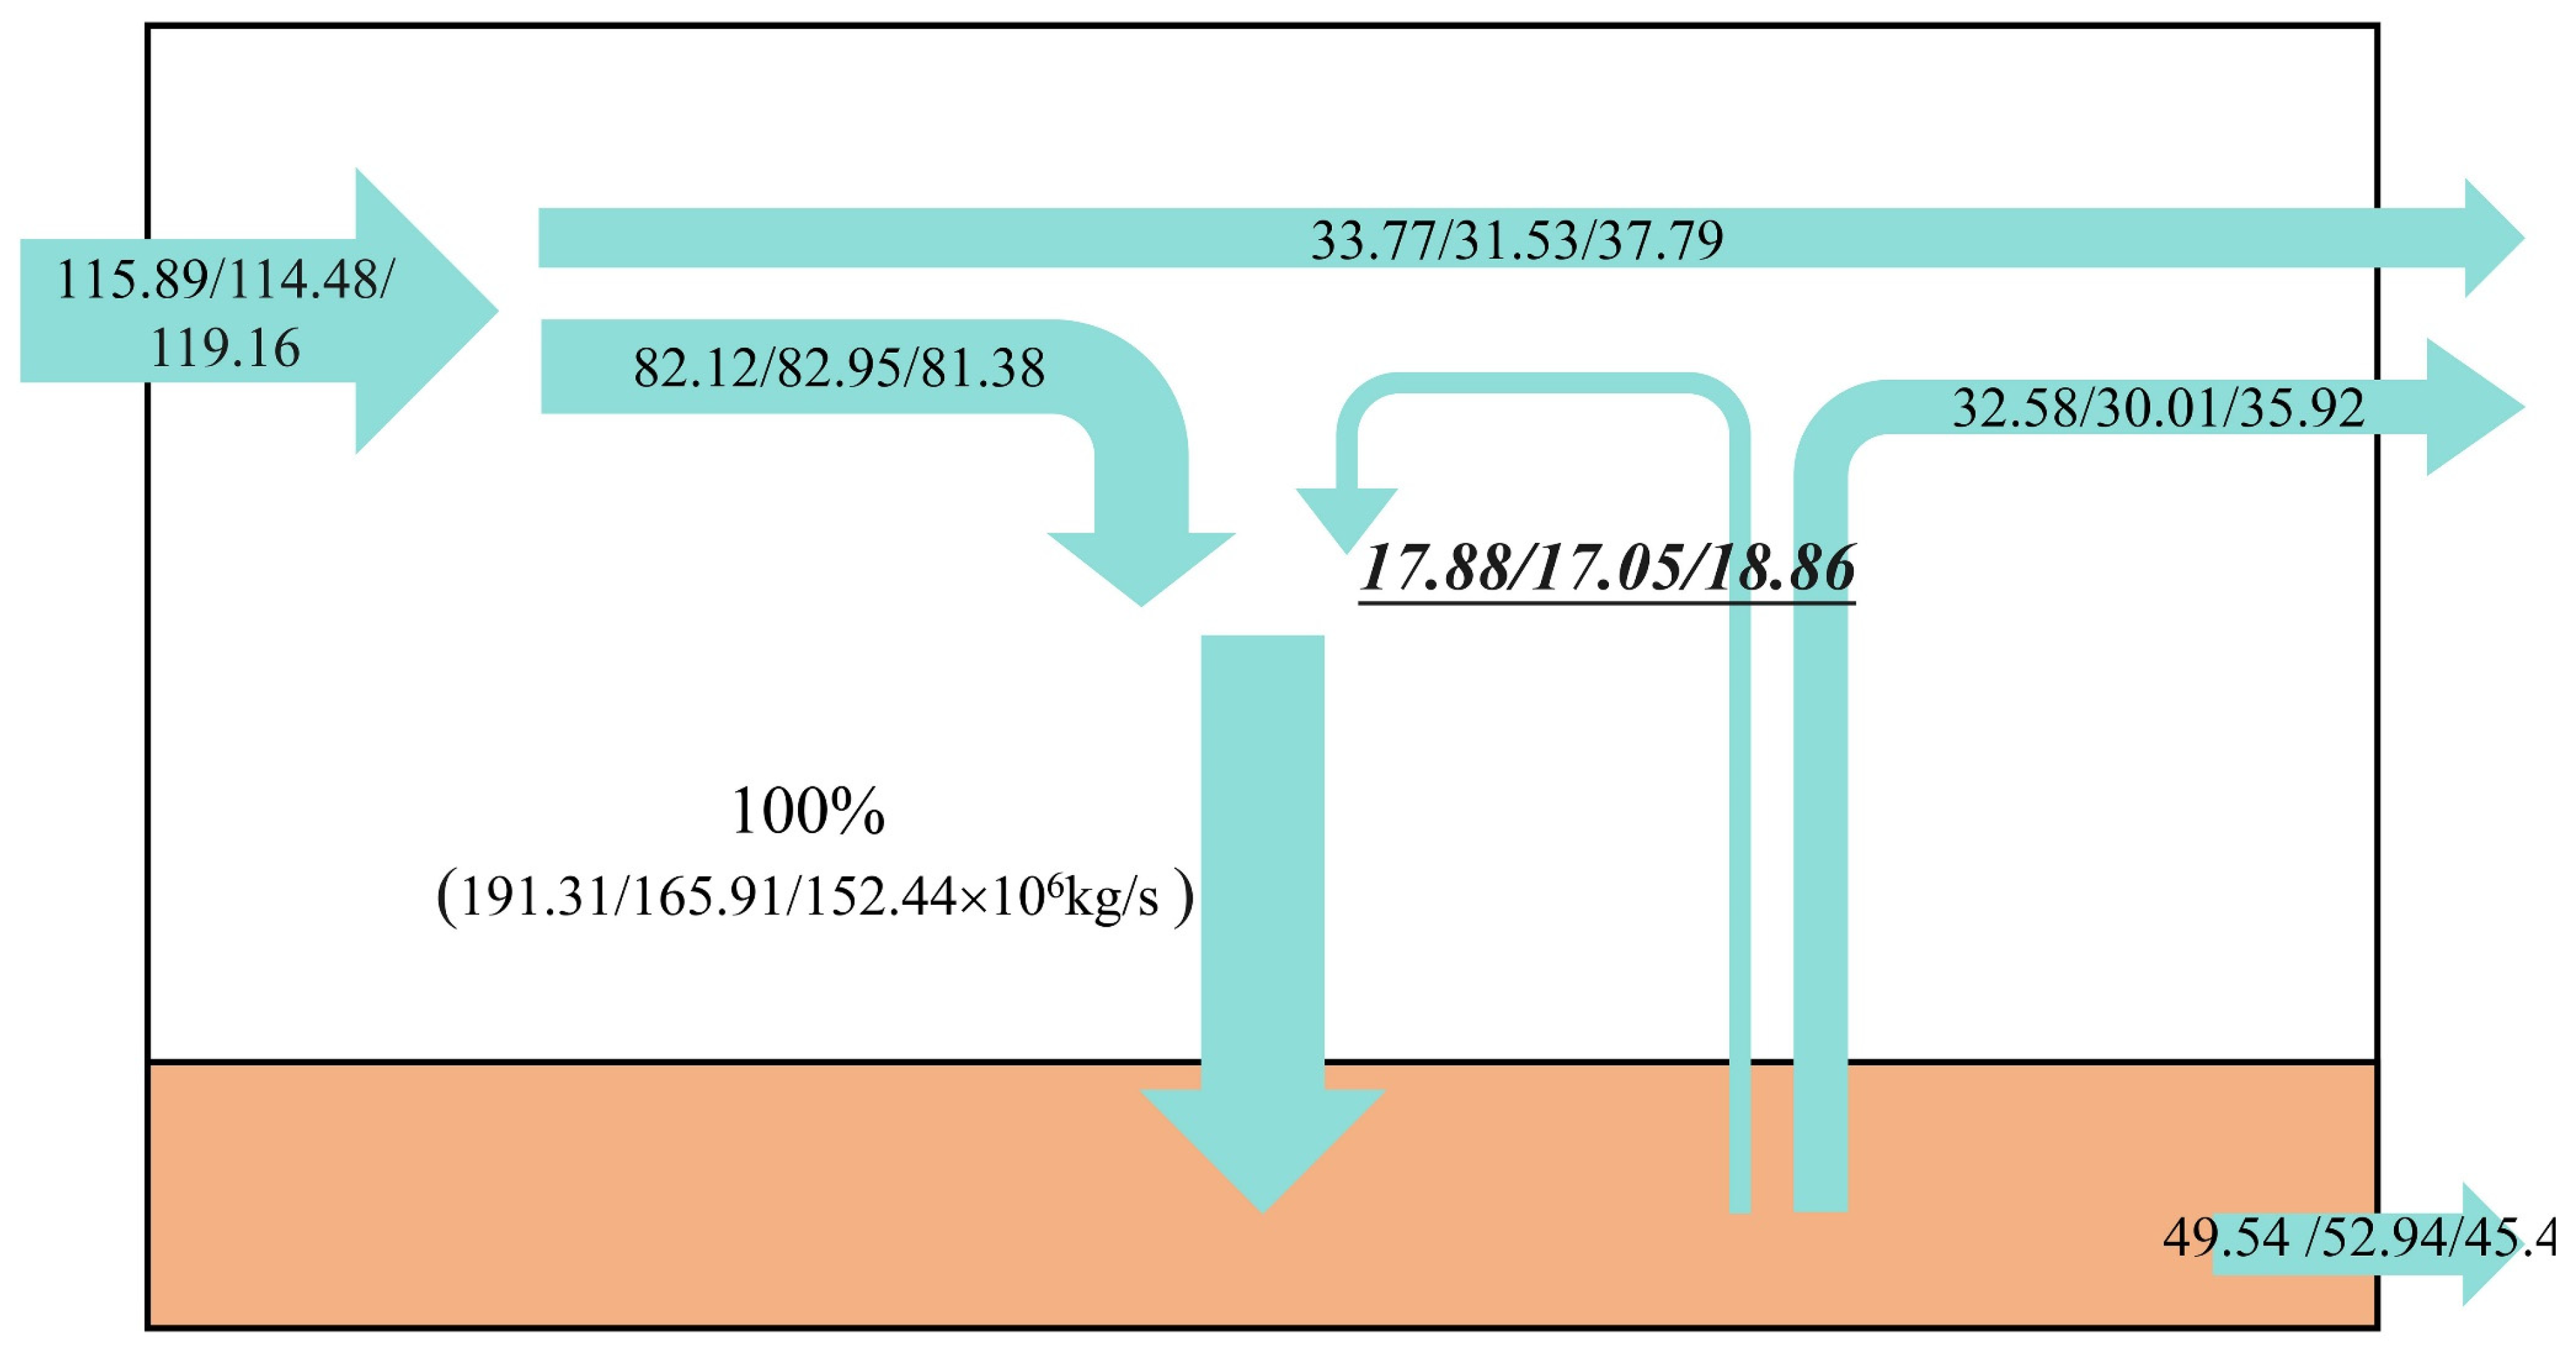
3.1. The WVT and Atmospheric Water Cycle on the TP

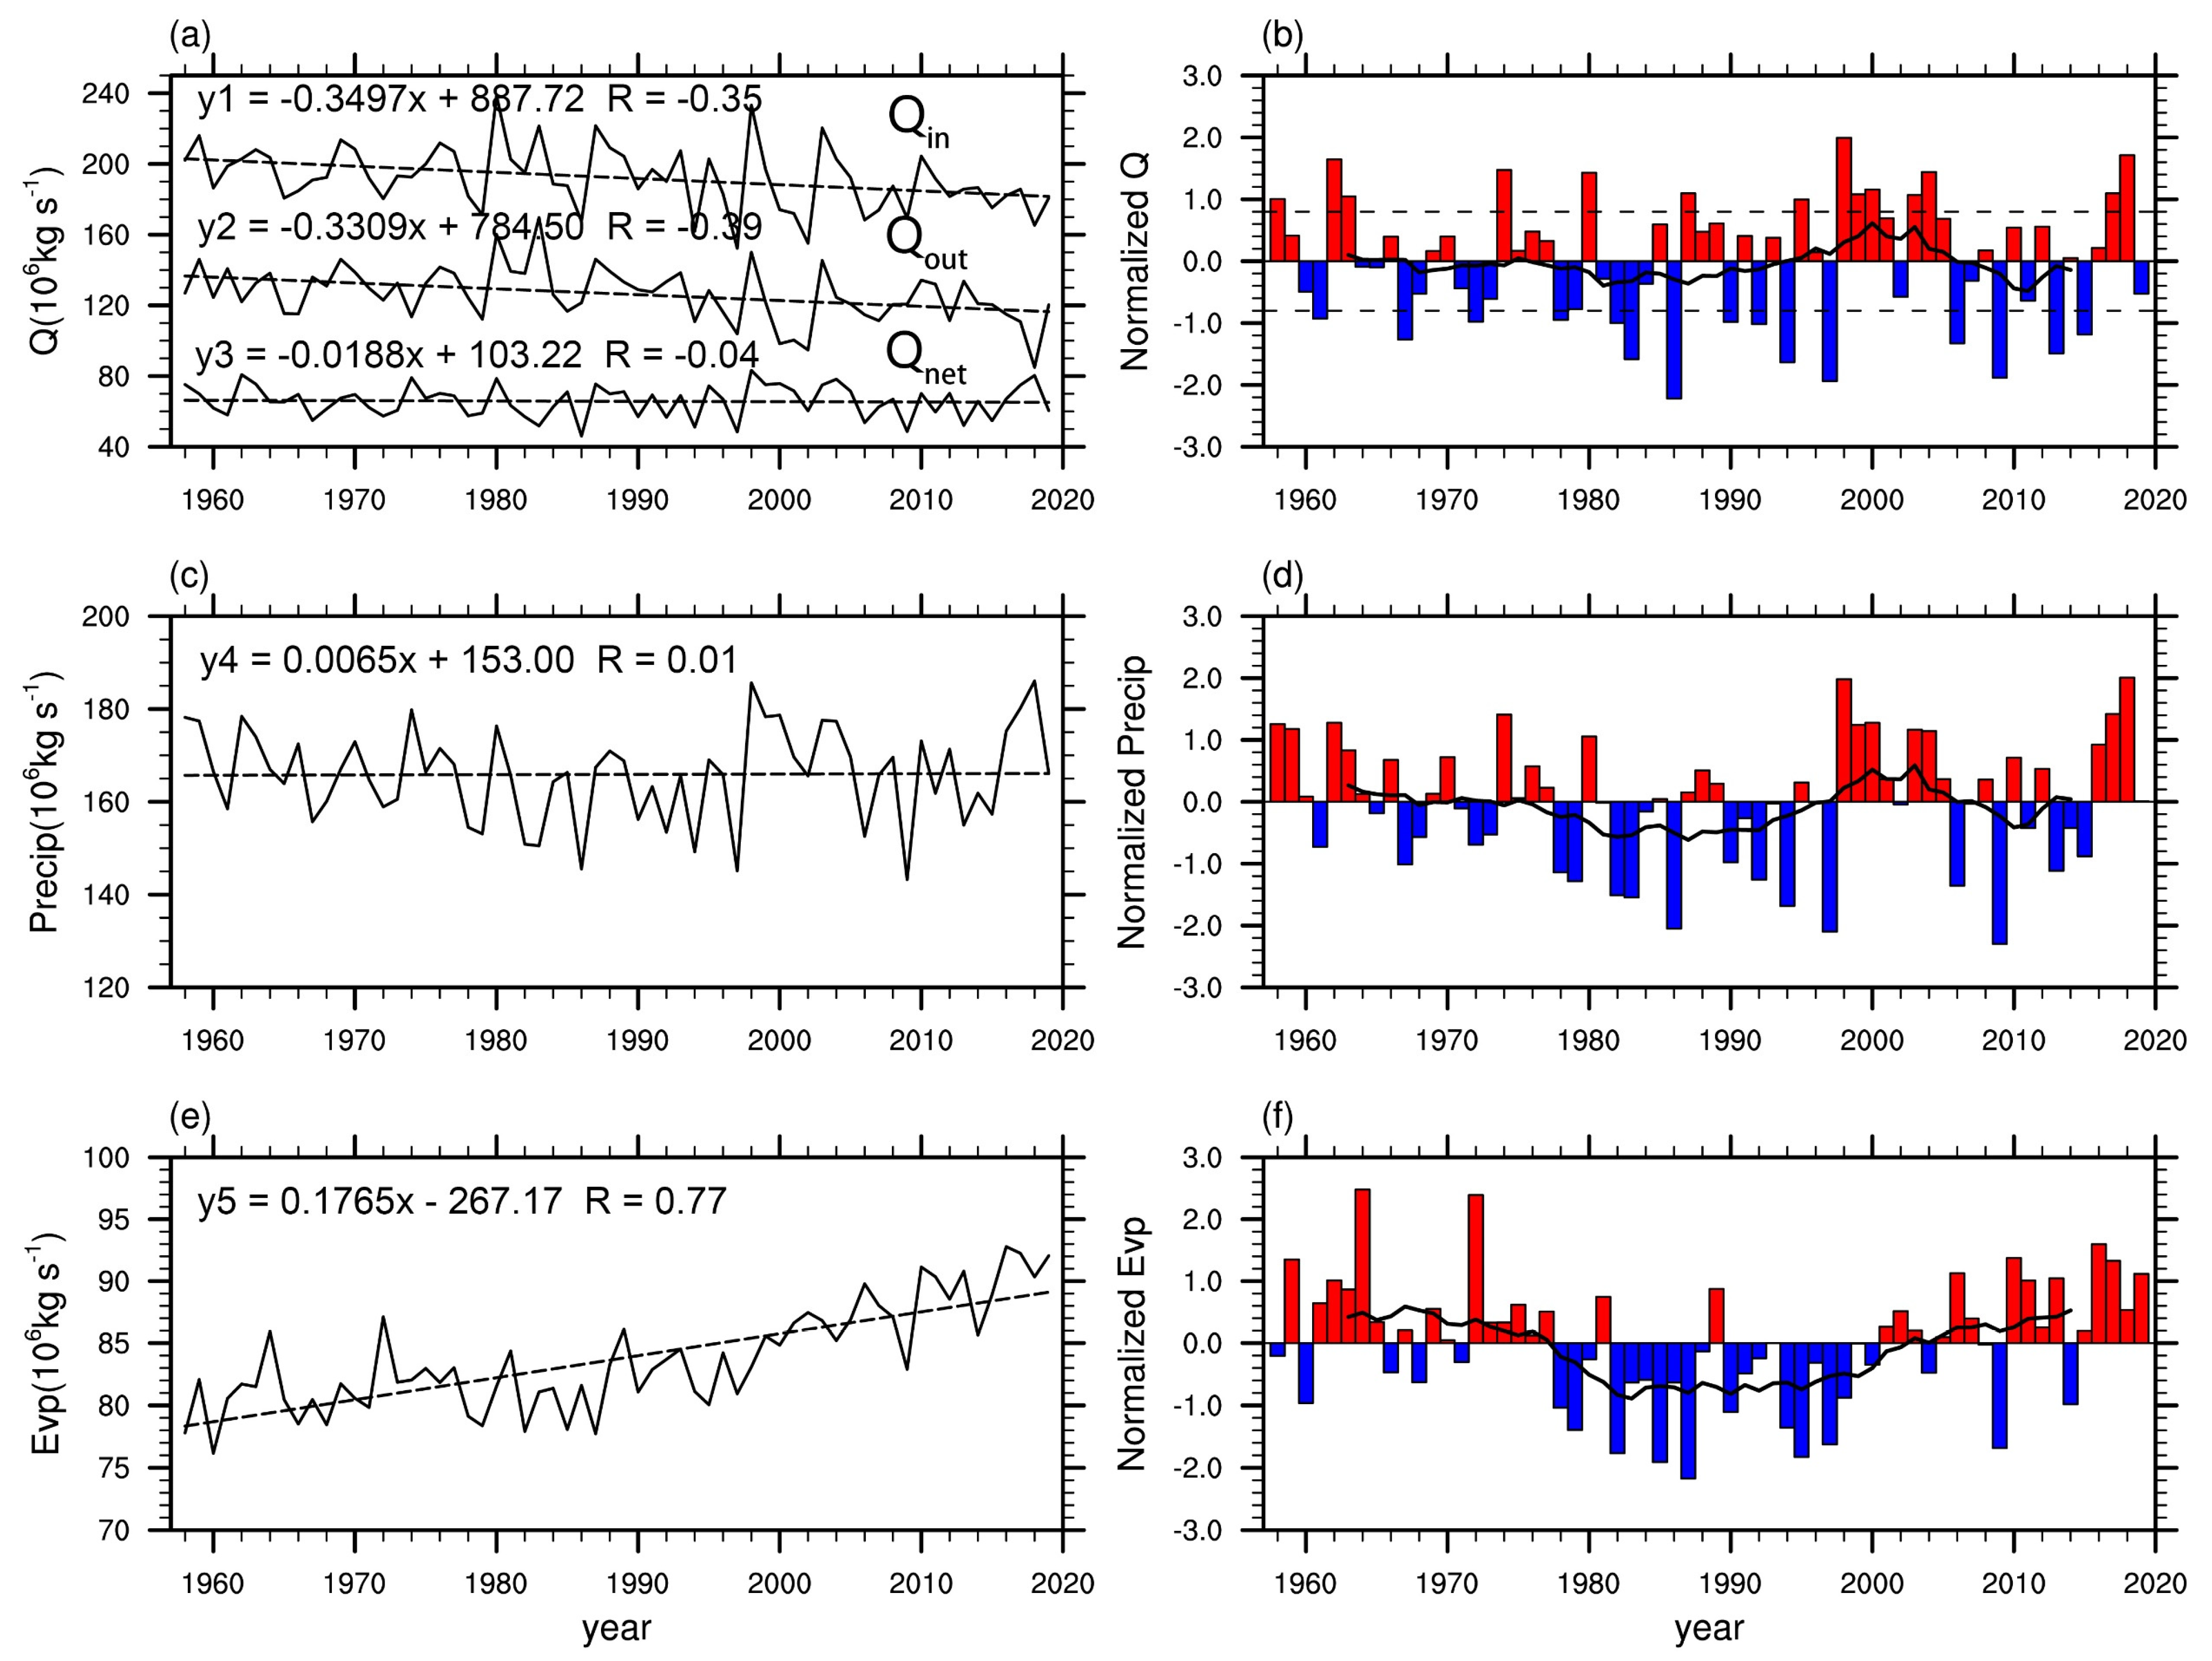
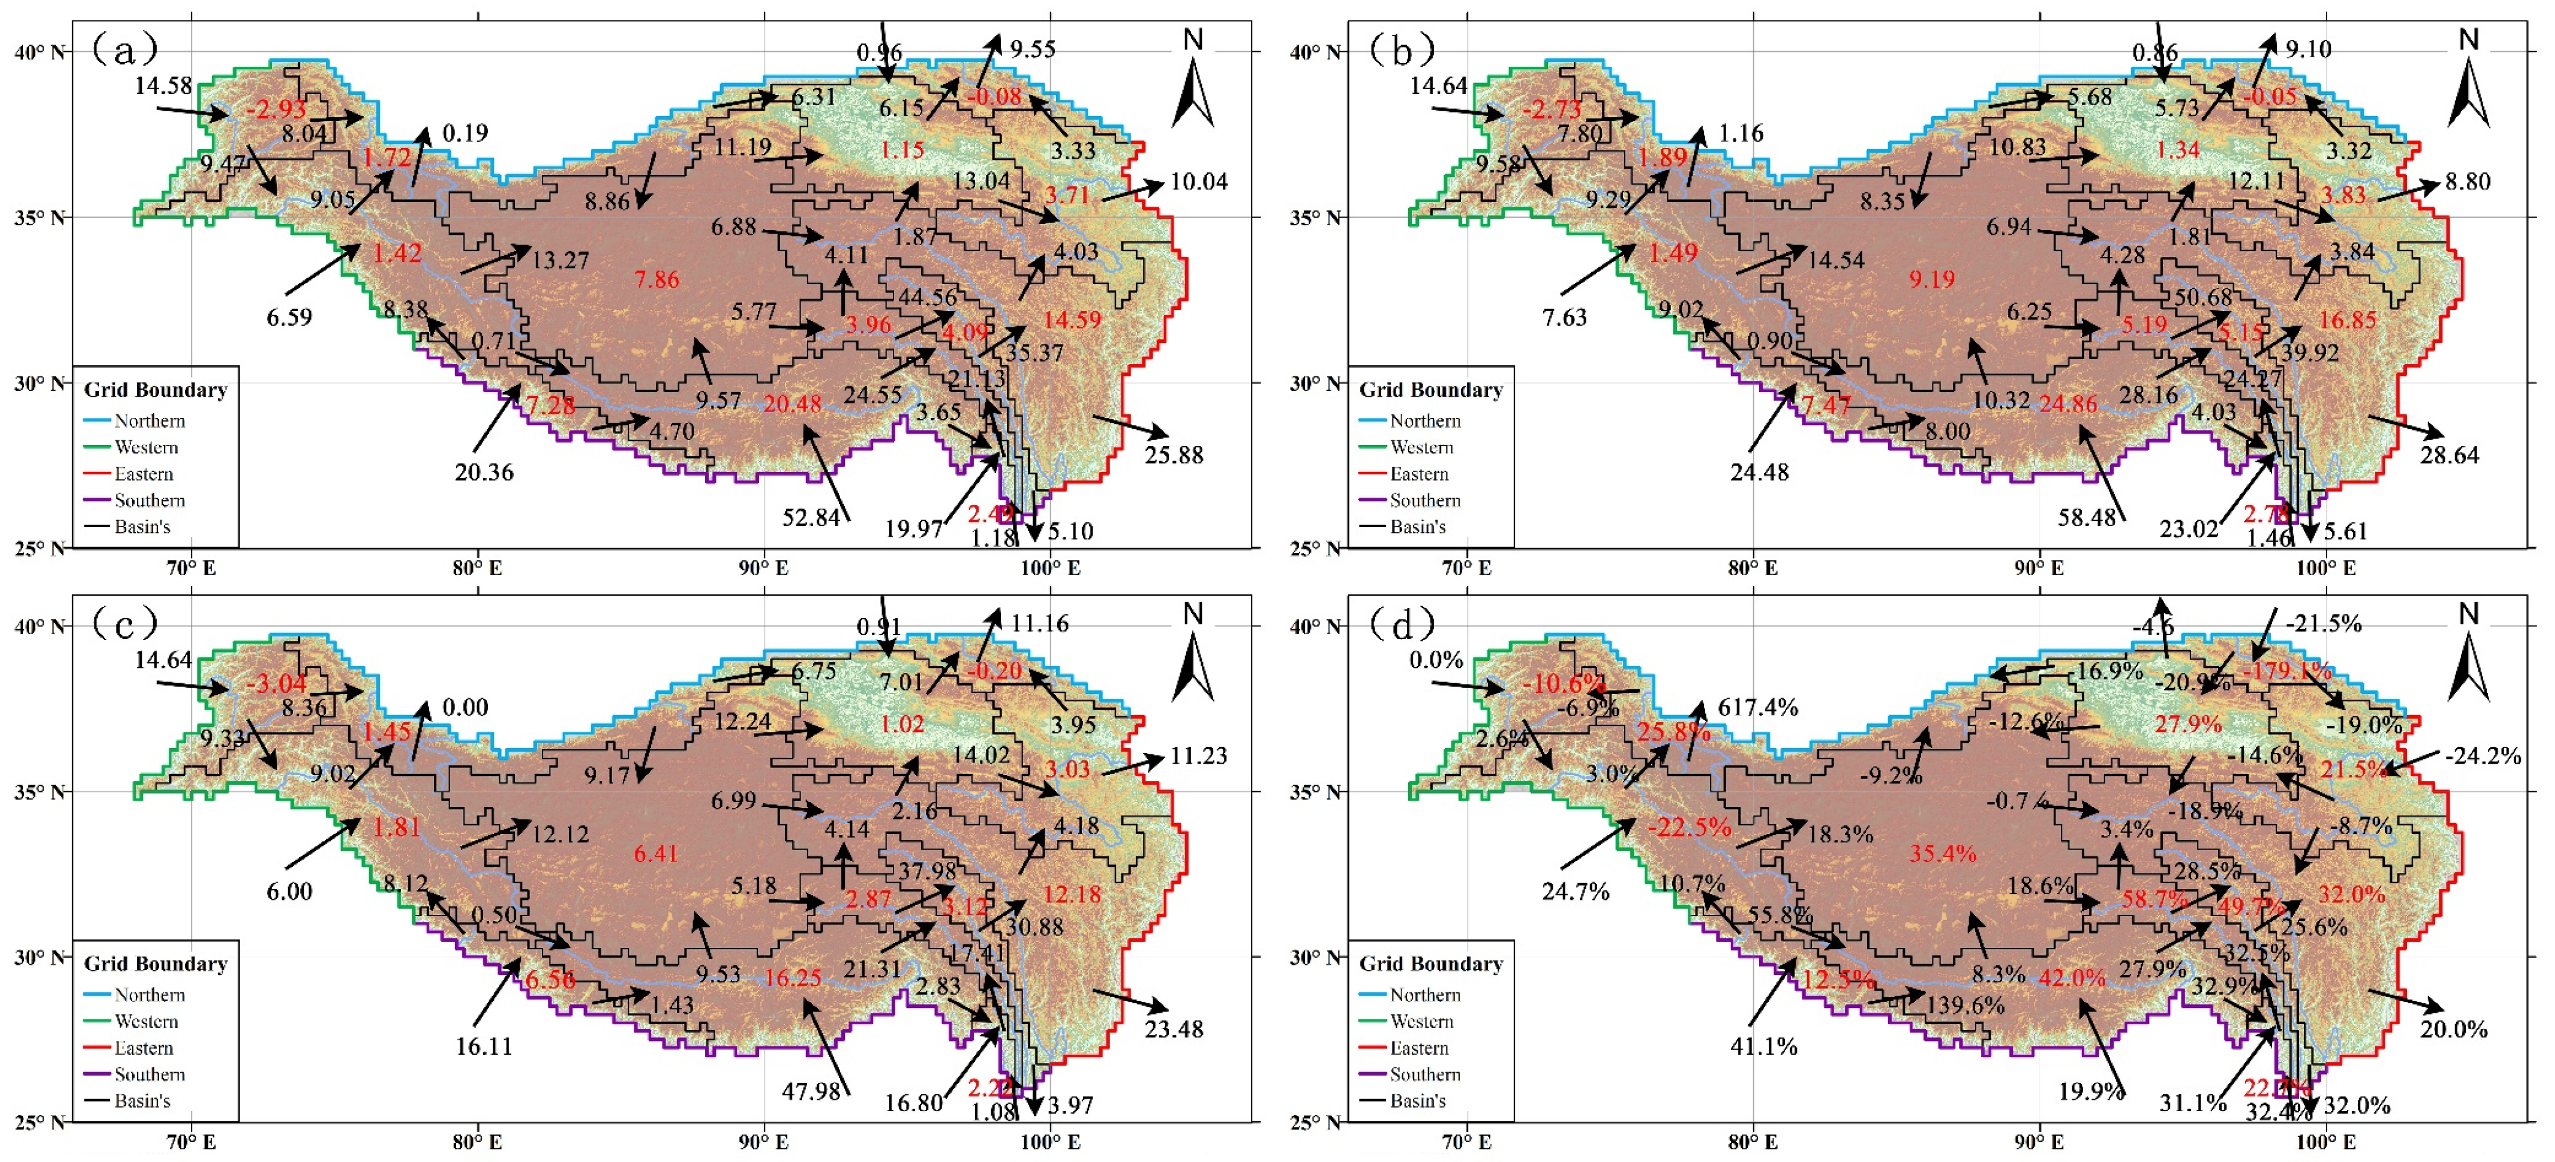
3.1.1. Temporal and Spatial Changes in Atmospheric Water Cycle Elements on the TP

In the past 62 years, the climatic summer WVB on the TP was 65.74 × 10⁶ kg∙s−1, and the climatology of total water vapor input and output were 192.28 × 10⁶ kg∙s−1 and 126.54 × 10⁶ kg∙s−1, respectively. Although the WVB had no obvious change trend (Figure 3a), the interannual change characteristics were obvious (Figure 3b), and the total water vapor input and output showed a significant decreasing trend (both passed the 95% confidence test), and the rate of change was 3.50 × 10⁶ kg∙s−1 and 3.33 × 10⁶ kg∙s−1. As shown in Table 2, the WVB was positively correlated with the total water vapor input (R = 0.52), indicating that changes in the total water vapor input would significantly and directly affect the WVB. It is worth noting that, in some years (such as 1962, 1974, and 2018), the total water vapor input (Qin) and output (Qout) both decreased, but the reduction of Qout was greater than the reduction of Qin, finally caused the increasing of the WVB; and in some years (such as 1961, 1967, and 1983), when the Qin and Qout both increased, while the increase of the Qin was smaller than the increase of the Qout, as a result, the WVB would decrease. There was no significant correlation between WVB and total water vapor output. There was a significant positive correlation between total water input and total water vapor output (R = 0.87), indicating that the decrease in the total output was mainly determined by the decrease in total input. On the interdecadal scale, the WVB had two interdecadal transitions, from a negative phase to a positive phase around the mid-1990s, and then to a negative phase around 2006.
It can be seen from Figure 3a–d that the trend of summer precipitation on the TP was very consistent with that of the WVB, and the correlation coefficient between the two was 0.94, indicating that the change in the WVB had a direct effect on precipitation changes. Moreover, on the interdecadal scale, the precipitation and WVB show the same phase transition characteristics, indicating that the change in the TP’s WVB was the main reason for the interannual and interdecadal changes in precipitation.
The evapotranspiration over the TP showed a significant increasing trend, with a rate of change of 1.765 kg∙s−1∙10a−1 (Figure 3e), mainly due to the significant increase in temperature of the TP [2]. However, on the interdecadal scale, evapotranspiration was characterized by a positive–negative–positive transition, with a negative phase during the period 1978–2003, and a positive phase during the period 1958–1977 and 2004–2019. It was more consistent with the interdecadal variation of PDO, and the correlation coefficient between the two was −0.76, which exceeds the 95% confidence test (Figure 4), indicating that after removing the climate warming, the changes in evapotranspiration are remotely correlated with the PDO index, and the cold (warm) phase of PDO would be beneficial to increase (reduce) the summer evapotranspiration on the TP.
Taking the absolute value of 0.8 standard deviations as the threshold [74], we obtained the strong and weak years of the TP’s WVB and found that during the past 62 years, there were 14 years in strong years and 15 years in weak years in Table 3. Next, we analyzed the strong and weak years of the WVB of the TP and the characteristics of WVT between the TP and the internal basins.
From Figure 5a,b, it can be seen that in the years when the WVB was strong, the WVT on the southern boundary of the Ganges, the Yarlung Zangbo River, and the Irrawaddy River in the south of the Himalayas was significantly higher, which made the WVB of the Yarlung Zangbo River basin increase by 4.38 × 10⁶ kg s−1 compared to the climatology and further strengthened the transport intensity of the WVT channel to the northeast of the Hengduan Mountain area of the Yarlung Zangbo-Nu Jiang-Lancang-Jinsha River, transporting more water vapor to the Three-River-Source (TRS). At the same time, the water vapor transported to the Qiangtang Plateau from the northern boundary of the Yarlung Zangbo River also increased correspondingly, resulting in a greater increase in the WVB of the Qiangtang Plateau. The water vapor entering the Indus River basin from the western boundary was also increasing, bringing more water vapor to the Qiangtang Plateau and the Tarim River Basin. However, the water vapor transported from the Yangtze River Basin and Qaidam Basin to the southwestern boundary of the Yellow River and Hexi Corridor River basins was less than the climatology, which reduced the water vapor output from the northeastern part of the TP. In weak years (Figure 5c), the boundary transport and WVB of the basins in the TP were the opposite of those in strong years. By calculating the ratio of the difference between strong and weak years to the climatic WVB (Figure 5d), it was found that the difference among the Yarlung Zangbo River, the Three-River-Source, and the Qiangtang Plateau in the southeast of the TP accounted for 30–60% of the difference between the strong and weak WVB, and the difference in WVB at the boundary accounted for 20–40%, indicating that these basins are the areas where WVT changes drastically on the TP. The Amu Darya and Indus rivers in the western TP and the Hexi Corridor Rivers in the northeast TP accounted for a negative proportion. In summary, when the TP’s WVB was strong (weak), the WVT in the basins east of the monsoon line and the Qiangtang Plateau was strengthened (weakened), and the budget increased (decreased), while the basin west of the monsoon line was the opposite.

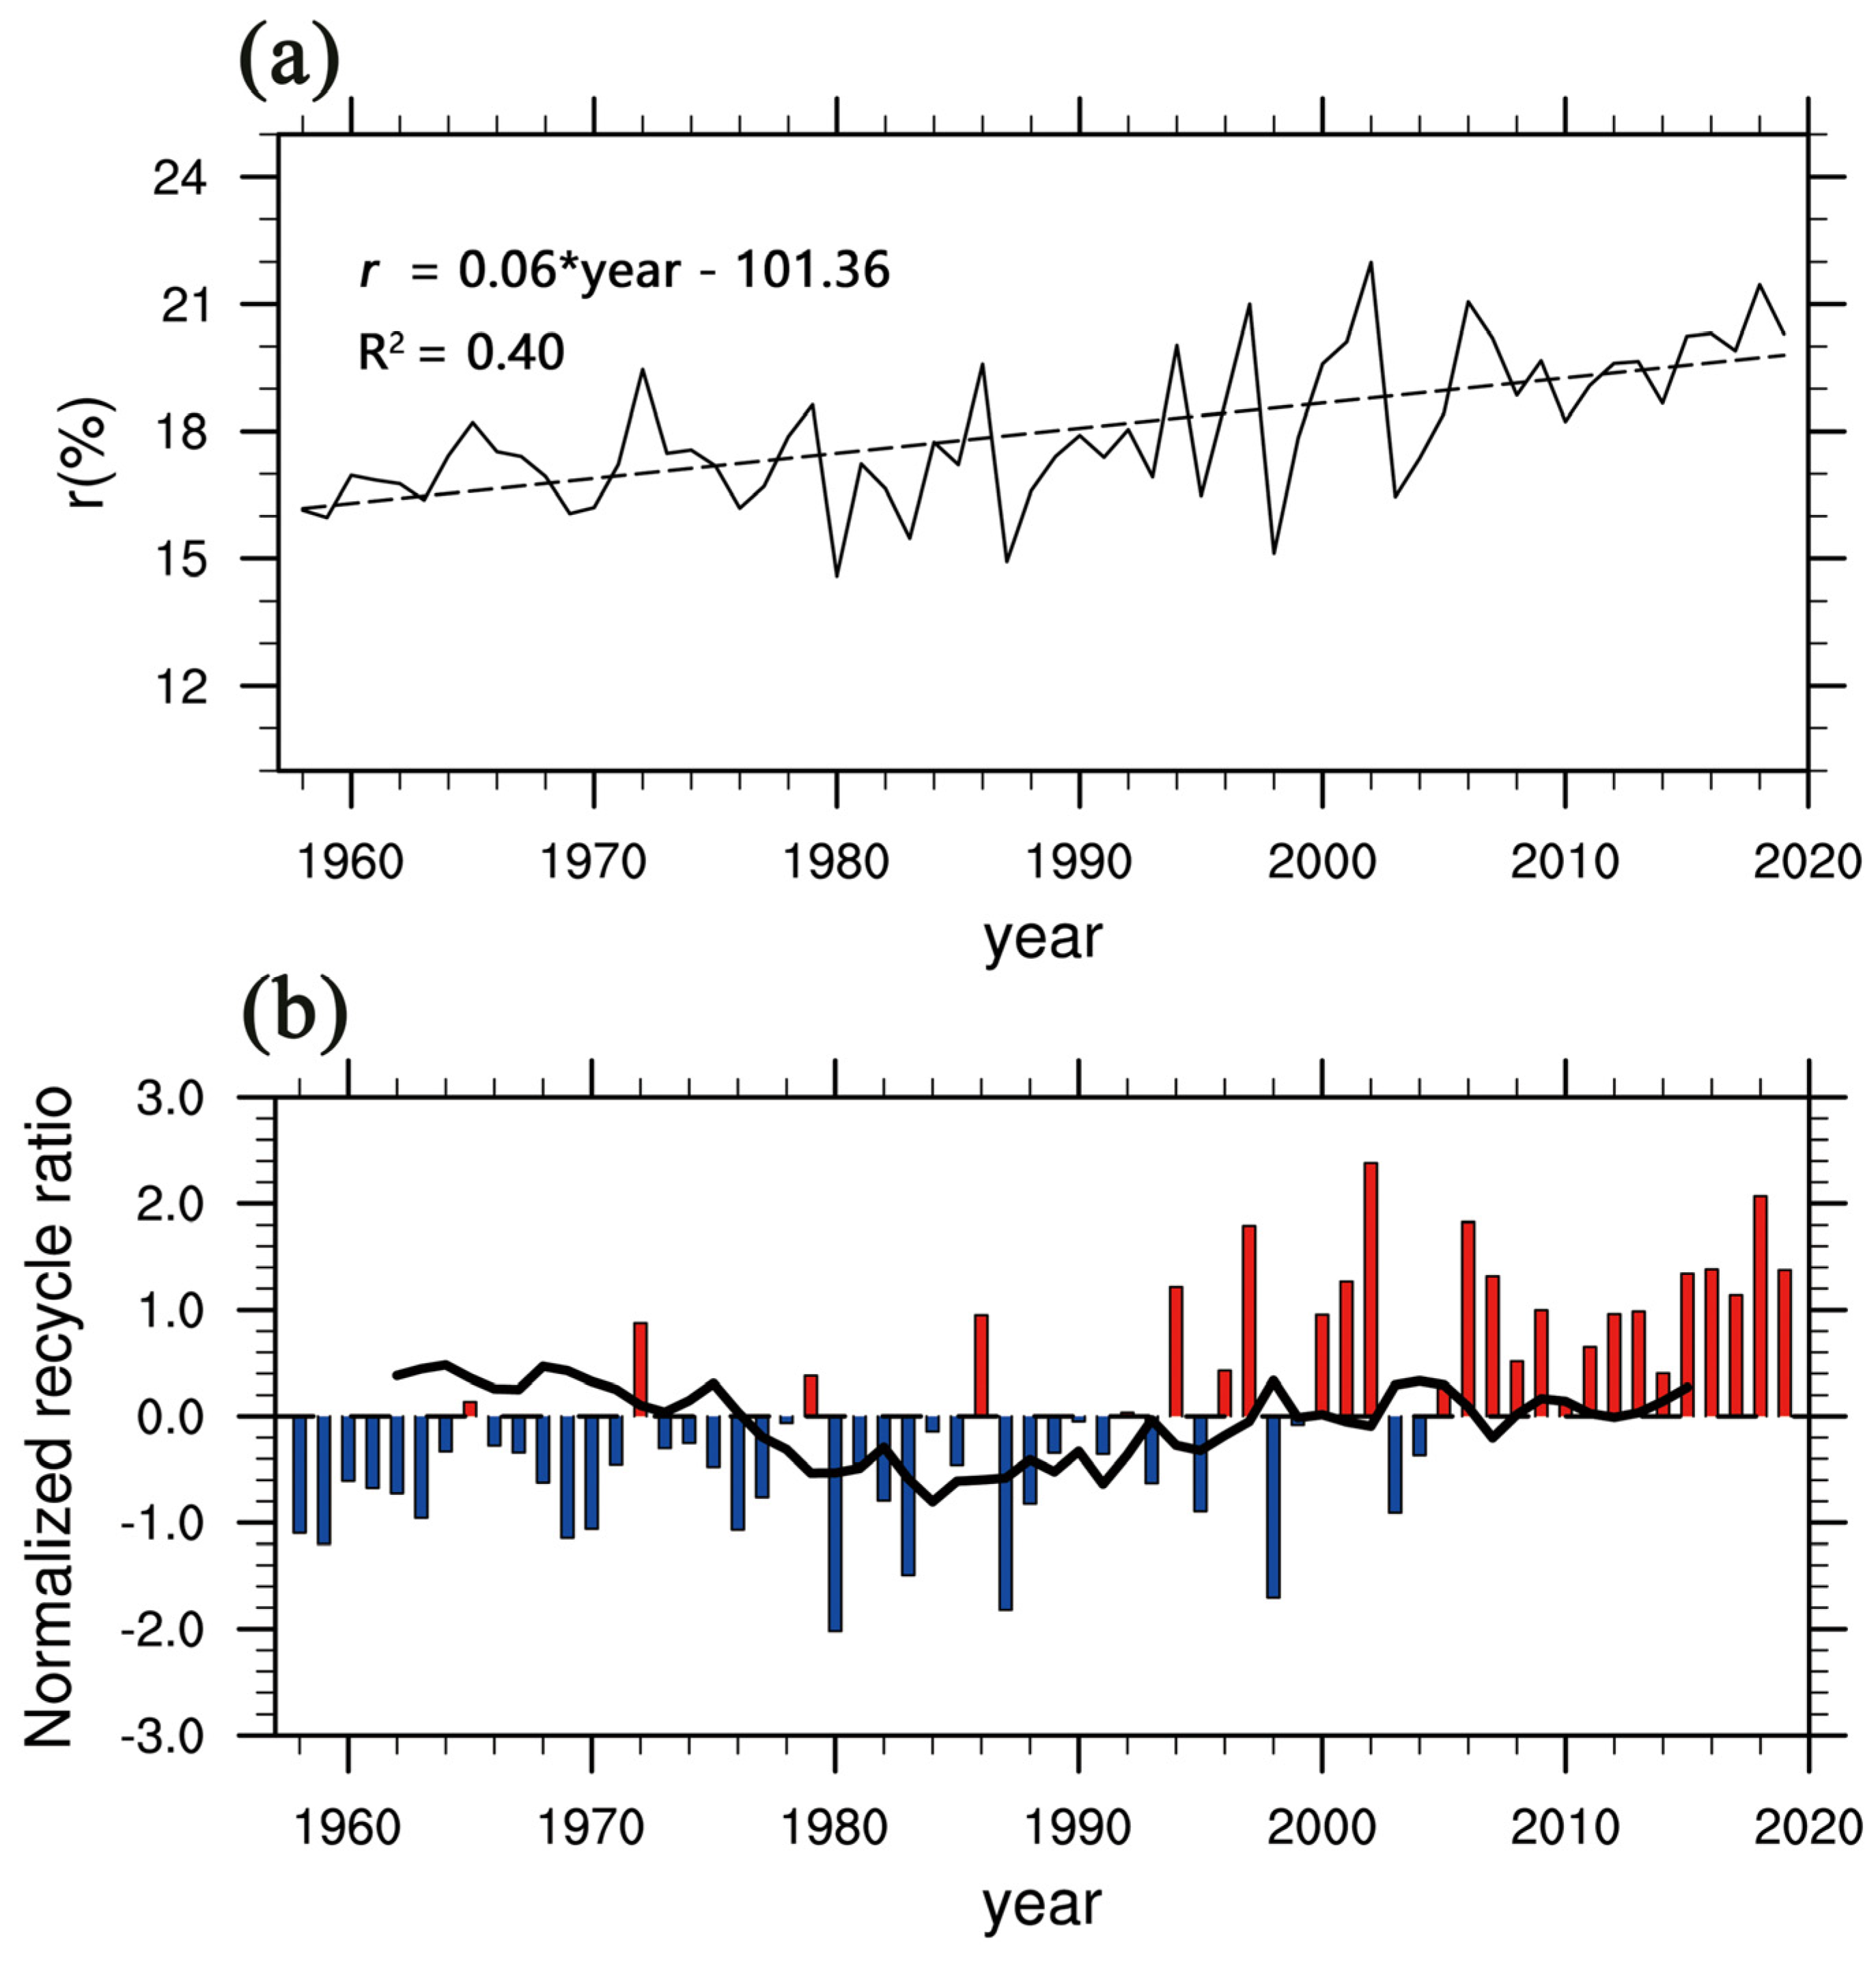
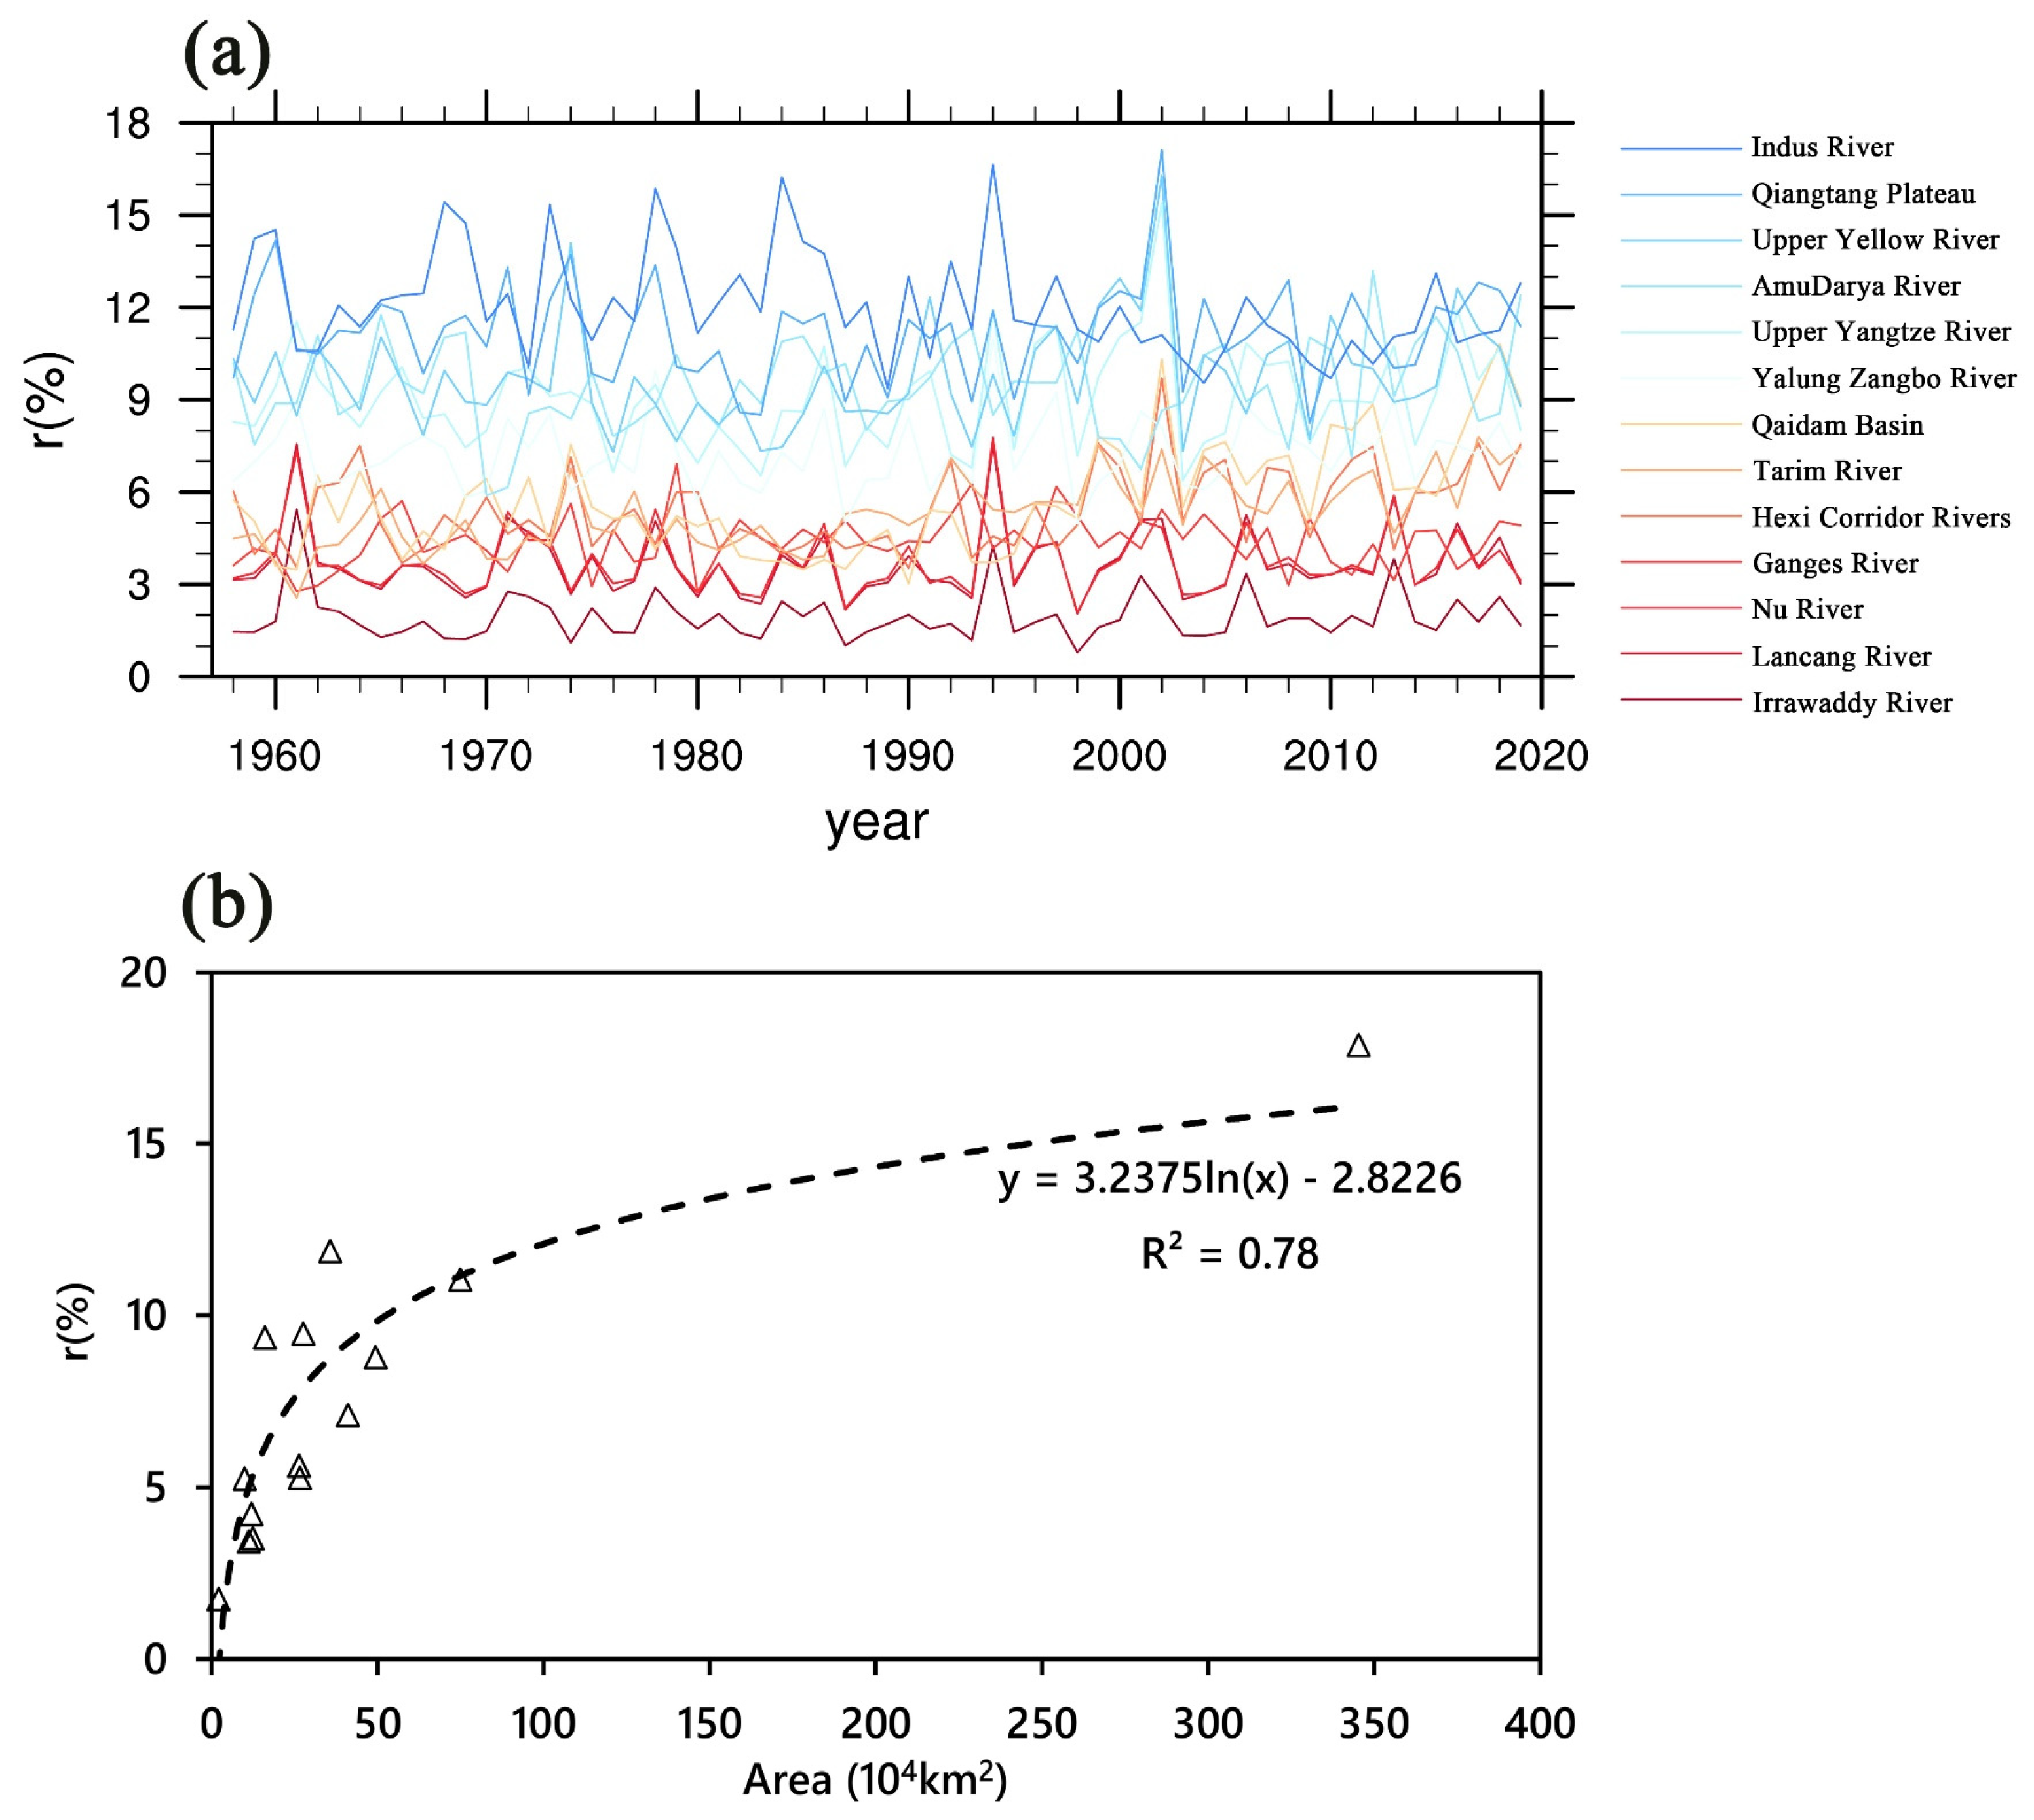
3.1.2. The Variability of PRR over the TP

Figure 6 shows the atmospheric water cycle elements of the TP and their contribution to precipitation. It was found that the contribution rates of local evaporative precipitation ( P e ) and external WVT ( P a ) to precipitation were 18% and 82%, respectively, and the PRR was significantly negatively correlated with the total water vapor input (R = −0.90), and positively correlated with evapotranspiration (R = 0.62), indicating that the external WVT has a stronger influence on the PRR than the evapotranspiration, and the external WVT plays a dominant role. In terms of external WVT, the total water vapor input into the TP was 1.16 times that of precipitation, 71% of the water vapor formed precipitation, and the remaining 29% of the water vapor flew out of the TP without precipitation; its ratio to precipitation was 34%. Concerning the interior of the TP, the total evapotranspiration was 51% of the precipitation, the precipitation formed by evapotranspiration accounted for 35% of the total evapotranspiration, and most of the precipitation flew out of the TP without precipitation. The runoff was represented by the difference between precipitation and evapotranspiration, which found that the ratio of runoff to precipitation was 50%, and the runoff accounts for approximately 43% of the total water vapor input on the TP.
Figure 7 presents the time series of the PRR on the TP. The overall PRR was increasing (0.6%/10a, Figure 7a), and the reason for the change was the decrease in total water vapor input and the increase in evapotranspiration on the TP (Figure 3). This also shows that the water vapor circulation inside the TP was also intensifying under the warming and humidification of the TP and its surrounding areas. After detrending and standardizing the PRR and 11-year moving average, it was found that the PRR underwent an interdecadal transition around the mid-1990s, and the increasing trend of the PRR was more obvious after the mid-1990s (Figure 7b). This also revealed that for the interdecadal strengthening characteristics of the atmospheric water cycle in the TP, especially for the years after the mid-1990s, the precipitation recirculation was stronger than the 30 years before the mid-1990s [51].
When the WVB was strong, the multi-year average PRR was 17%, and for the weak years, the PRR was 19%, the difference of the PRRs between strong and weak years was 2%. In particular, for the atmospheric water cycle elements of the adjacent weak and strong years of 1997/1998, the TP’s summer WVB was 48.41/83.23 × 106 kg s−1, the total water vapor input was 152.28/233.27 × 106 kg s−1, and the corresponding precipitation was 145.11/185.64 × 106 kg s−1; the evapotranspiration was 80.94/83.09 × 106 kg s−1, the PRR was 21/15%, and the difference of PRR between strong and weak years was 6%, indicating that the contribution of local evaporative to precipitation on the TP is especially important. It can be concluded that when the WVT on the TP increases (decreases), the precipitation and evapotranspiration increase (decrease), but the ratio of evapotranspiration to precipitation decreases (increases), and the PRR decreases (increases).
Next, we calculated the climatic state and the combined PRRs of the strong year and the weak year of the 13 basins in the TP. It can be seen from Table 4 that the PRR in the Indus River Basin is the largest (12%), followed by the Qiangtang Plateau (11%), and only these two basins exceeded 10%; followed by the Yellow River, Amu Darya, Yangtze River, and the Yarlung Zangbo River Basin (7~10%); then by the Qaidam Basin, Tarim River, and Hexi River Basins (5~6%); and finally the Ganges, Nu Jiang River, Lancang River, and Irrawaddy River Basins (<5%). We found that the Yarlung Zangbo River Basin has a large WVB and total input, resulting in a relatively low PRR; the Qiangtang Plateau has a relatively large PRR due to large evapotranspiration; and the Indus River Basin has a relatively high WVB. However, the river basins of Ganges, Nu Jiang River, Lancang River, and Irrawaddy River were small in area; although the WVB was relatively small, the total water vapor input was relatively large, which made the PRR of these river basins small.
Figure 8a shows the time series of PRRs in 13 basins on the TP. For different basins, the long-term PRR trends can be roughly divided into three types: slow increase, slow decrease, and relative stability. Considering that the PRR is related to the size of the basin area, we produced a correlation distribution map of the PRR and the basin area of the TP and its basins and found that the PRR and the area have a strong positive logarithmic correlation. The correlation coefficient between the two was 0.88, which exceeds the 95% confidence test (Figure 8b). The results showed that in the mid-latitude TP, the PRR was closely related to the scale of the basin; the larger the basin area, the greater the PRR, and the greater the contribution of evapotranspiration to precipitation. Conversely, the smaller the basin area, the smaller the PRR, and the greater the contribution of external WVB to precipitation, which is consistent with the results of Arnault et al. [24]. Specifically, on the scale of 100~500 km, the PRR was 5~10%; on the scale of 500~1000 km, the PRR was 10~15%; on the scale of 1000~1500 km, the PRR was 15~20%.

3.1.3. The Relationship between WVT and the TPSM on the TP

Figure 9 shows the standardized time series of the TP summer monsoon index Neg (Div-PMI) from 1958 to 2019. When Neg (Div-PMI) > 1, the corresponding year is defined as a strong TP summer monsoon year, and when Neg (Div-PMI) < −1, the corresponding year is defined as a weak TP summer monsoon year. The strong monsoon years were 1962, 1965, 1966, 1969, 1974, 1998, 2004, and 2012, a total of 8 years; and the weak monsoon years were 1977, 1978, 1984, 1986, 1990, 1994, 1996, 1997, 2001, 2013, 2015, and 2019, a total of 12 years.
The TP summer monsoon has obvious characteristics of interannual variability. The TP summer monsoon index has a significant correlation with the water vapor budget (RJRA-55 = 0.56, RERA5 = 0.66), and the strong (weak) years of the WVT are basically consistent with the strong (weak) TP monsoon years. This shows that when the TP’s summer monsoon is strong, there will be more water vapor and precipitation in the TP.

3.2. The Spatiotemporal Changes in the Indo-Pacific Warm Pool

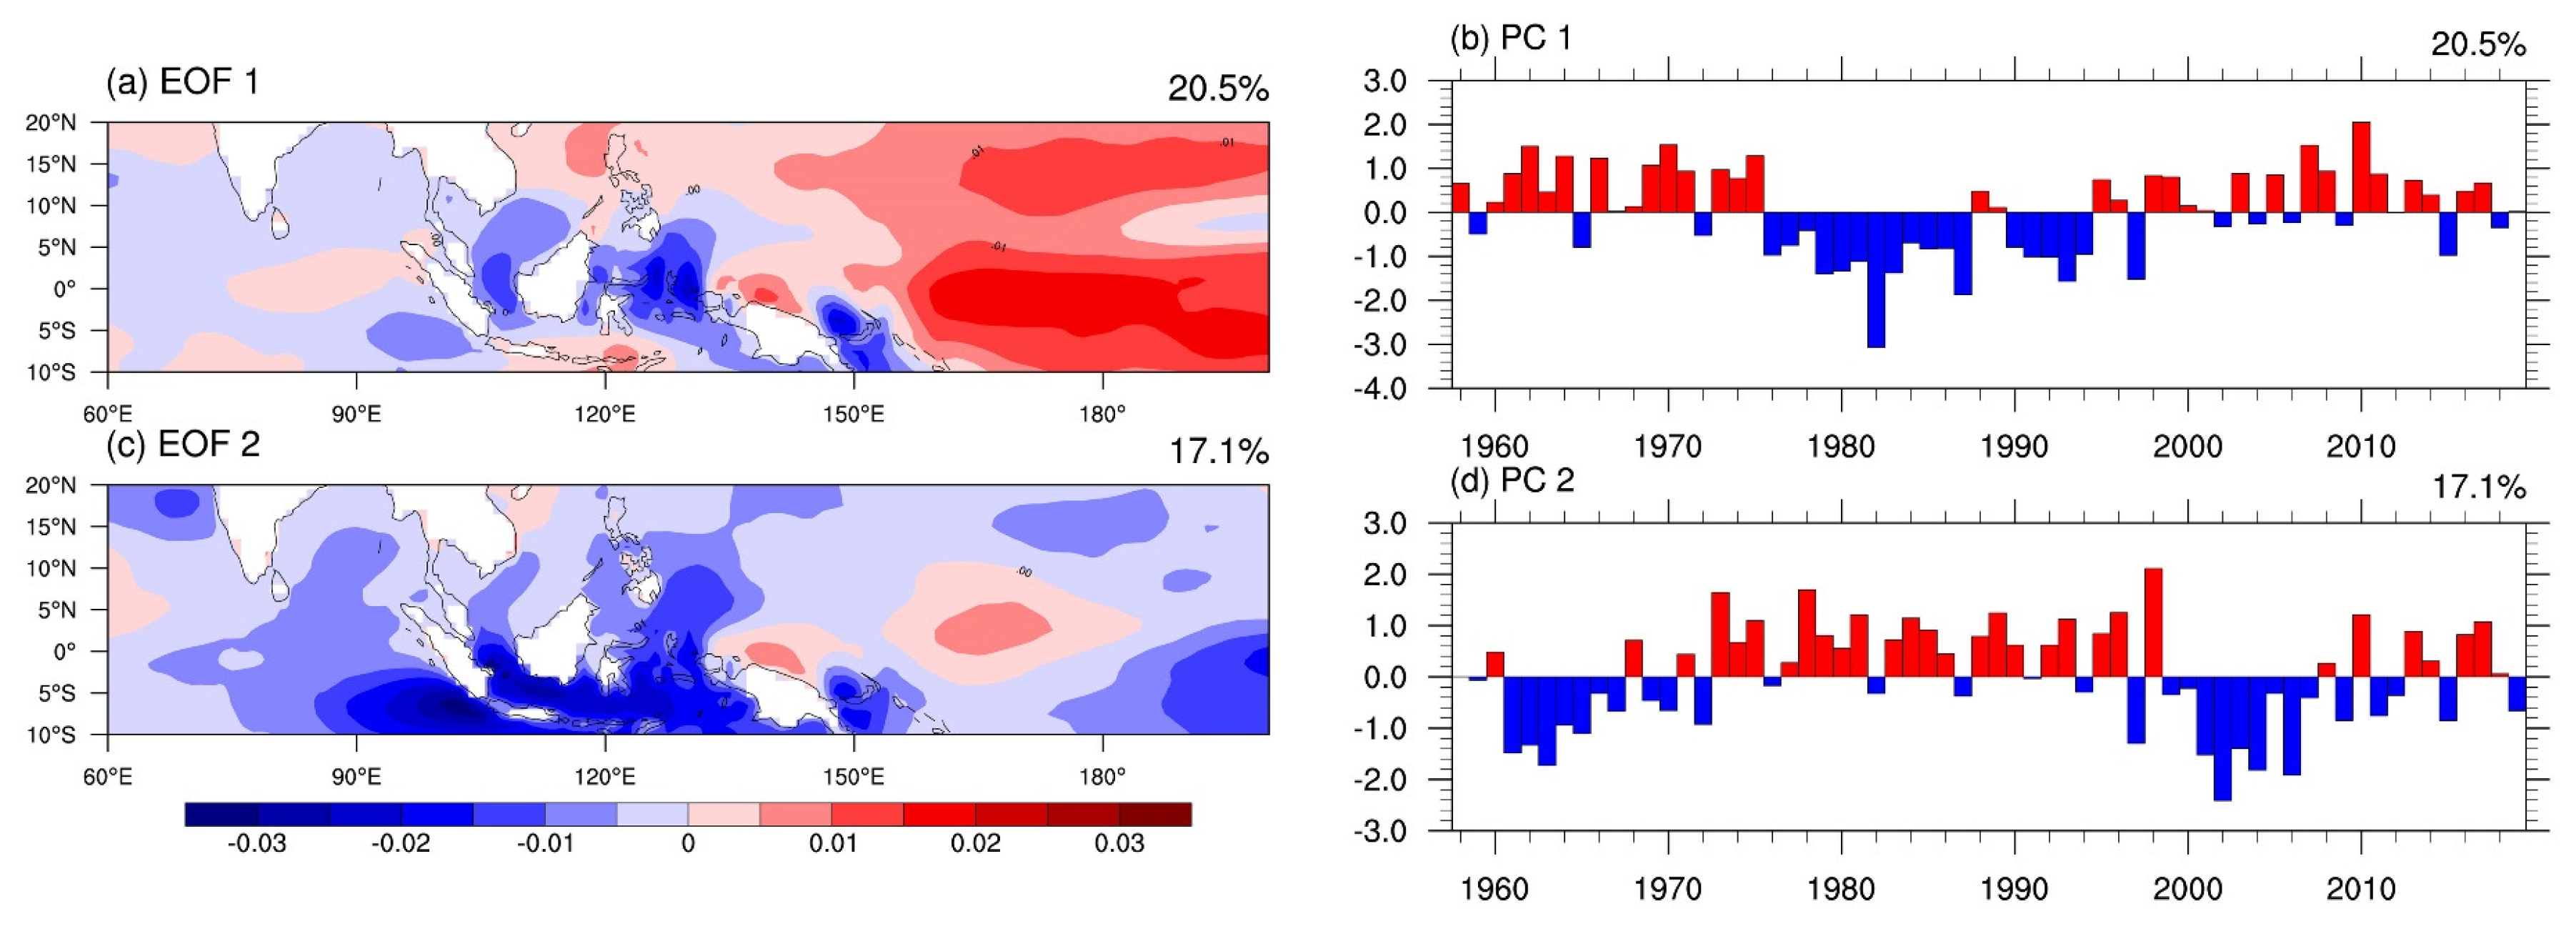
3.2.1. Spatiotemporal Changes in SST and SLHF in the IPWP

From Figure 10a, the first SLHF mode of the IPWP presents a positive east–west negative dipole distribution. There is a positive SLHF anomaly near the equatorial north and south Pacific, while a negative SLHF anomaly exists around the maritime continent. The first principal component (PC) of SLHF has two decadal transitions, as shown in Figure 10b. There was a positive phase from 1958 to 1975, a negative phase from 1976 to 1998, and a positive phase after 1999. The second mode explains 17.1% of total variance and exhibits a dipole between the equatorial Pacific in 160°E and the maritime continent and the eastern Indian Ocean (Figure 10c,d).
The WVT of the TP and the SLHF of the IPWP showed a weak interannual positive correlation, with a correlation coefficient of 0.33. There was a positive interannual correlation between precipitation on the TP and the SLHF of the IPWP, with a correlation coefficient of 0.45 (p < 0.05), indicating that when the surface latent heat activity over the southeastern IPWP was intense, the greater the difference in zonal latent heat and the higher the SLHF in the equatorial Pacific, while when the SLHF over the marine continental is low, the WVB on the TP will increase, which would lead to more precipitation on the TP.
On the decadal scale, the WVB of the TP was positively correlated with the PC1 of SLHF, with a correlation coefficient of 0.45 (p < 0.05). Especially since the 1980s, the interdecadal correlation coefficient reached 0.91, indicating that the IPWP underwent an interdecadal transition in the 1980s, and the impact of the IPWP’s latent heat activity on the WVB of the TP has been strengthened. However, the relationship between the WVB of the TP and the SST of the IPWP is not significant. The regression method was used to analyze how the change in the IPWP’s SLHF increases the WVB and precipitation on the TP.

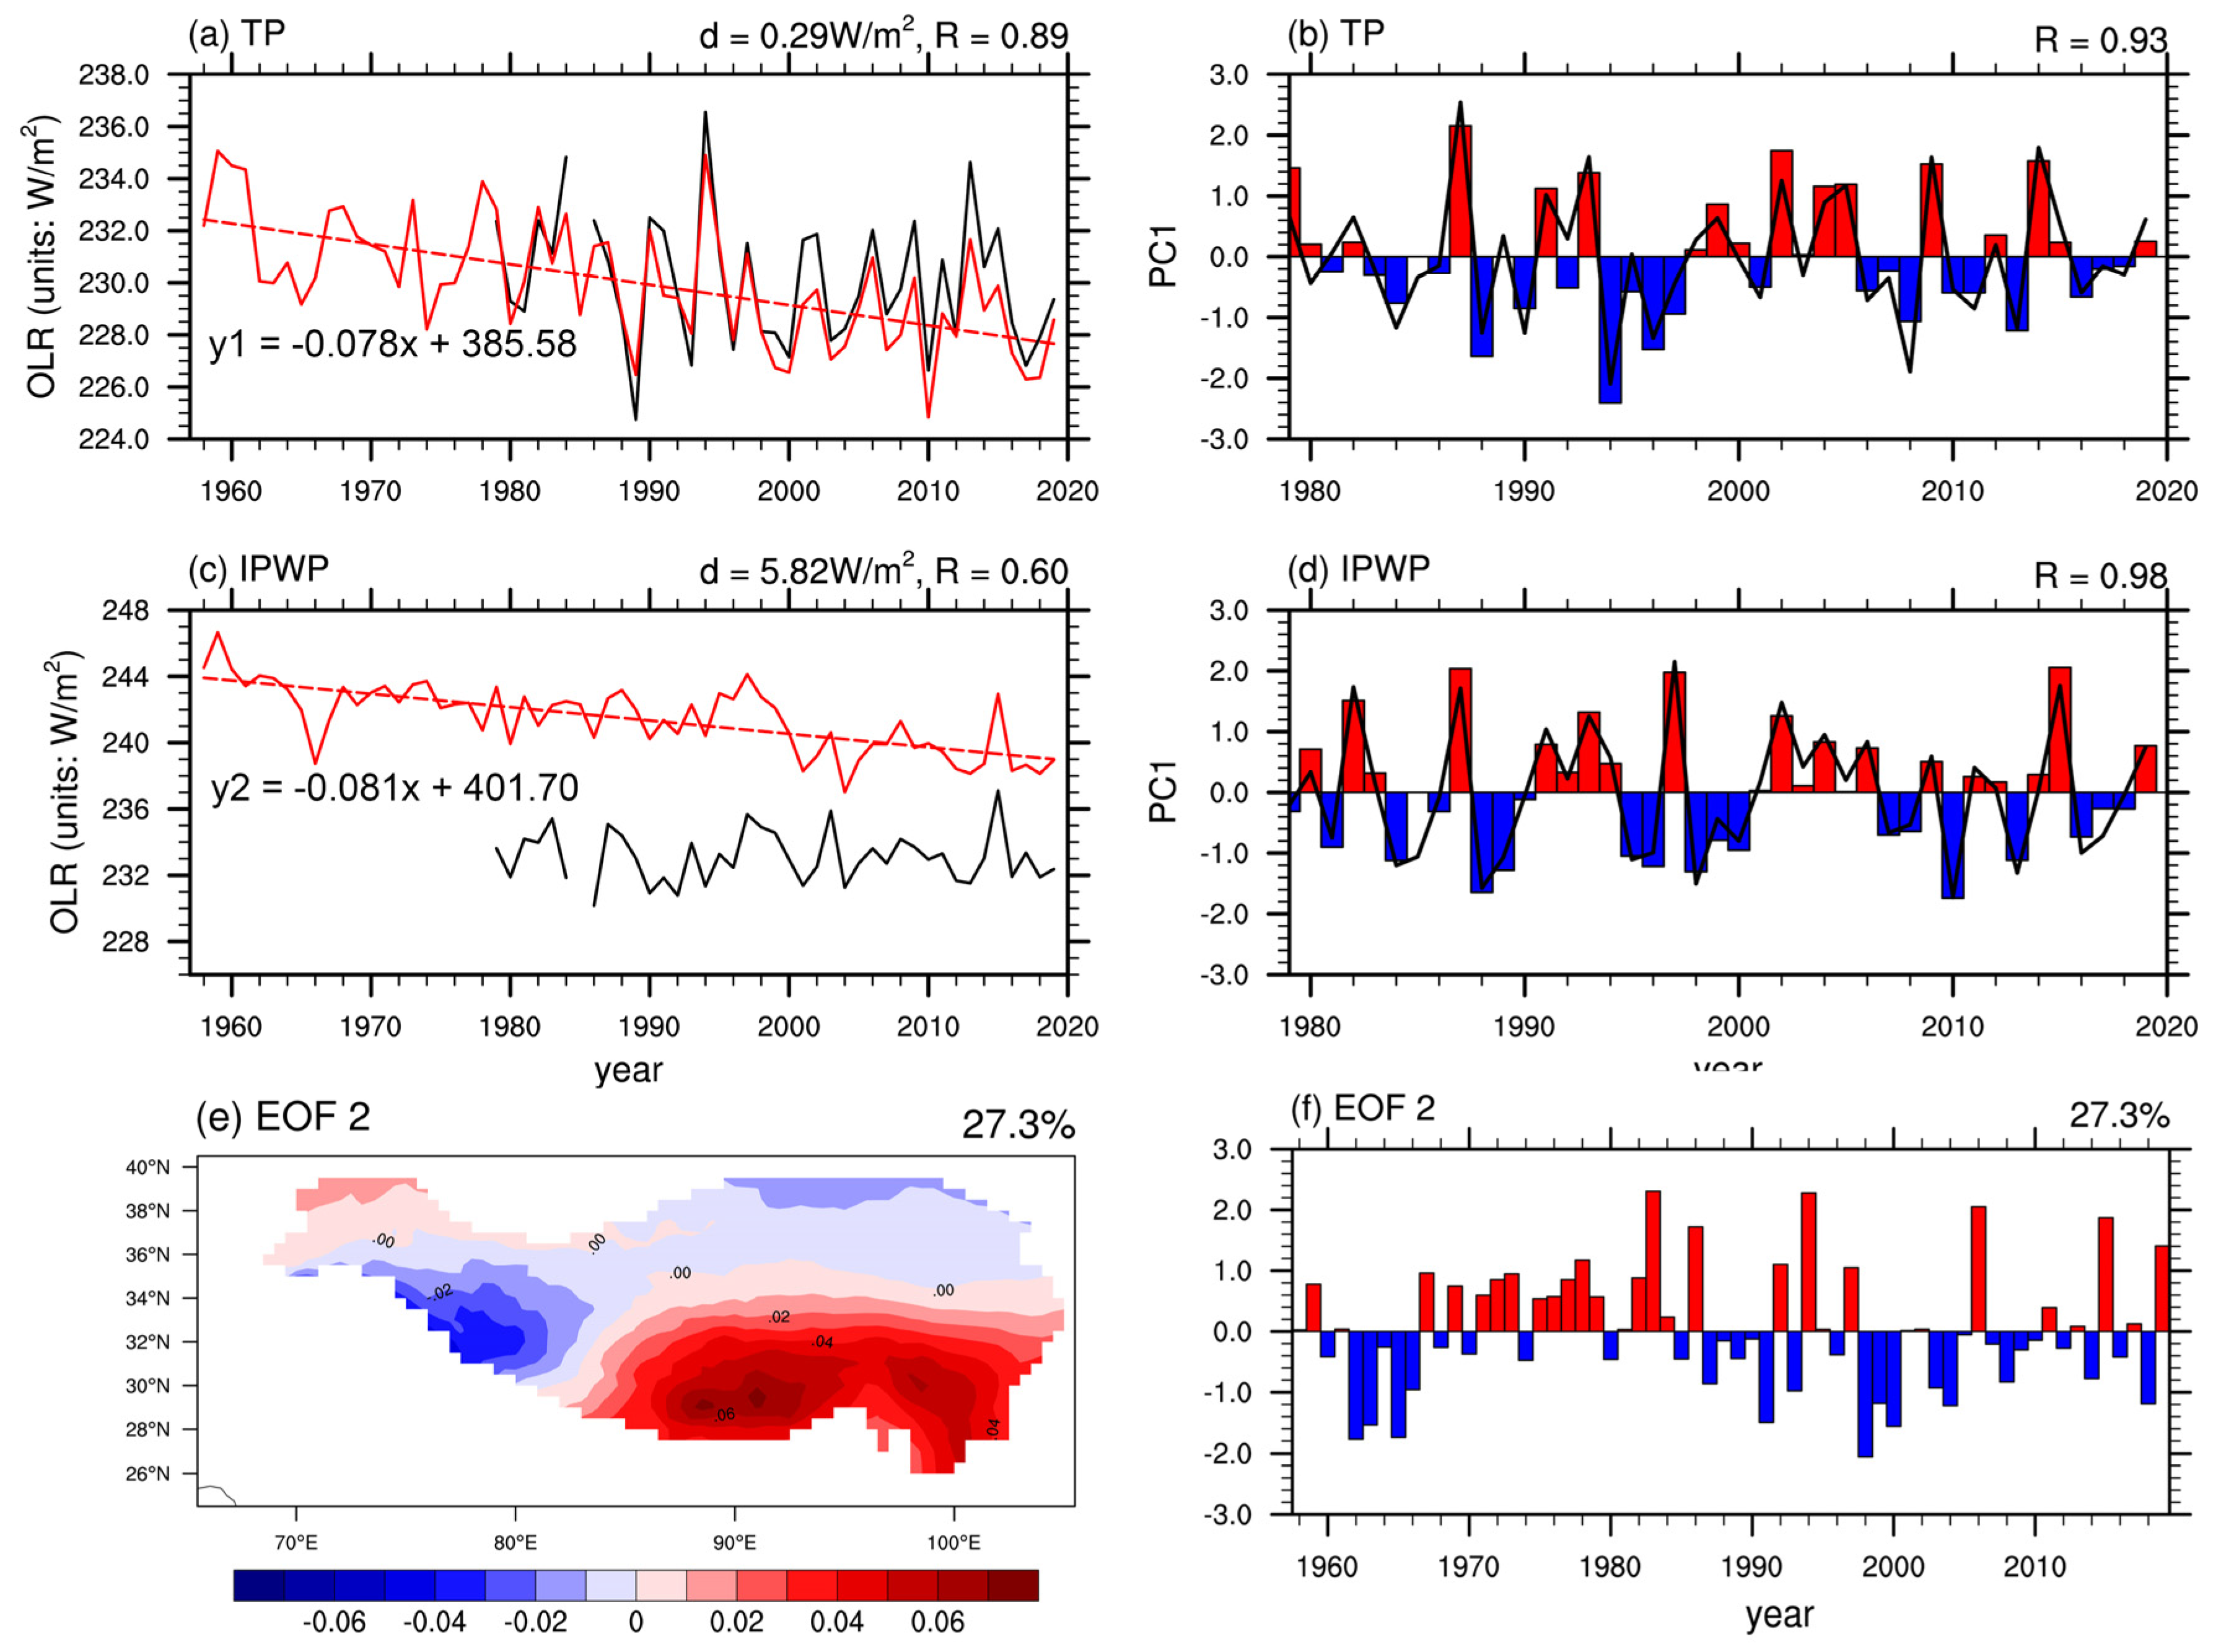
3.2.2. Spatiotemporal Changes in the OLR in the TP and IPWP

We first verified the OLR of ERA5 and HIRS in the IPWP and TP, respectively. The results found that during the summer from 1979 to 2019 (excluding 1985), for the TP, the correlation between ERA5 and HIRS OLR was 0.89, and ERA5 was close to OLR, with an average overestimation of 0.29 W m−2 for climatology (Figure 11a). Through EOF analysis, it was found that the PC1 correlation coefficient between ERA5 and HIRS OLR was 0.93 (Figure 11b); the temporal and spatial characteristics of the two were extremely consistent, indicating that ERA5 can better represent the temporal and spatial characteristics of OLR over the TP. For the IPWP, the correlation between ERA5 and HIRS OLR was 0.60, but ERA5 would overestimate OLR, with an average overestimation of 5.82 W m−2 for climatology (Figure 11c). Through EOF analysis, it was found that the PC1 correlation coefficient of ERA5 and HIRS OLR was 0.98 (Figure 11d), and the temporal and spatial variation characteristics of the two were extremely consistent, indicating that ERA5 can better represent the temporal and spatial variation characteristics of OLR in the IPWP. Therefore, we used the OLR data of ERA5 for subsequent analysis.
The spatial distribution of the second mode of OLR is north–south negative dipole type, and there is a high-value center in the Yarlung Zangbo River Basin and the upstream area of the Three-River-Source, while there is a low-value center in the Ganges River Basin in the southwest of the TP (Figure 11e), which shows that when the convection activity in the southern TP increases, it will increase the TP’s WVB. The summer WVB of the TP has no significant correlation with PC1 of OLR but has a strong correlation with PC2, with a correlation coefficient of R = −0.72 (Figure 11f). The first mode explains 29.0% of total variance and exhibits a east-west dipole between the equatorial Pacific and the maritime continent and the eastern Indian Ocean (Figure 12a,b), indicating that in marine continental areas, the convective upward movement is very strong. Meanwhile, the second mode only explains 12.8% and shows a tripole pattern between the southern Pacific, western Pacific and the eastern and northern Indian Ocean (Figure 12c,d).

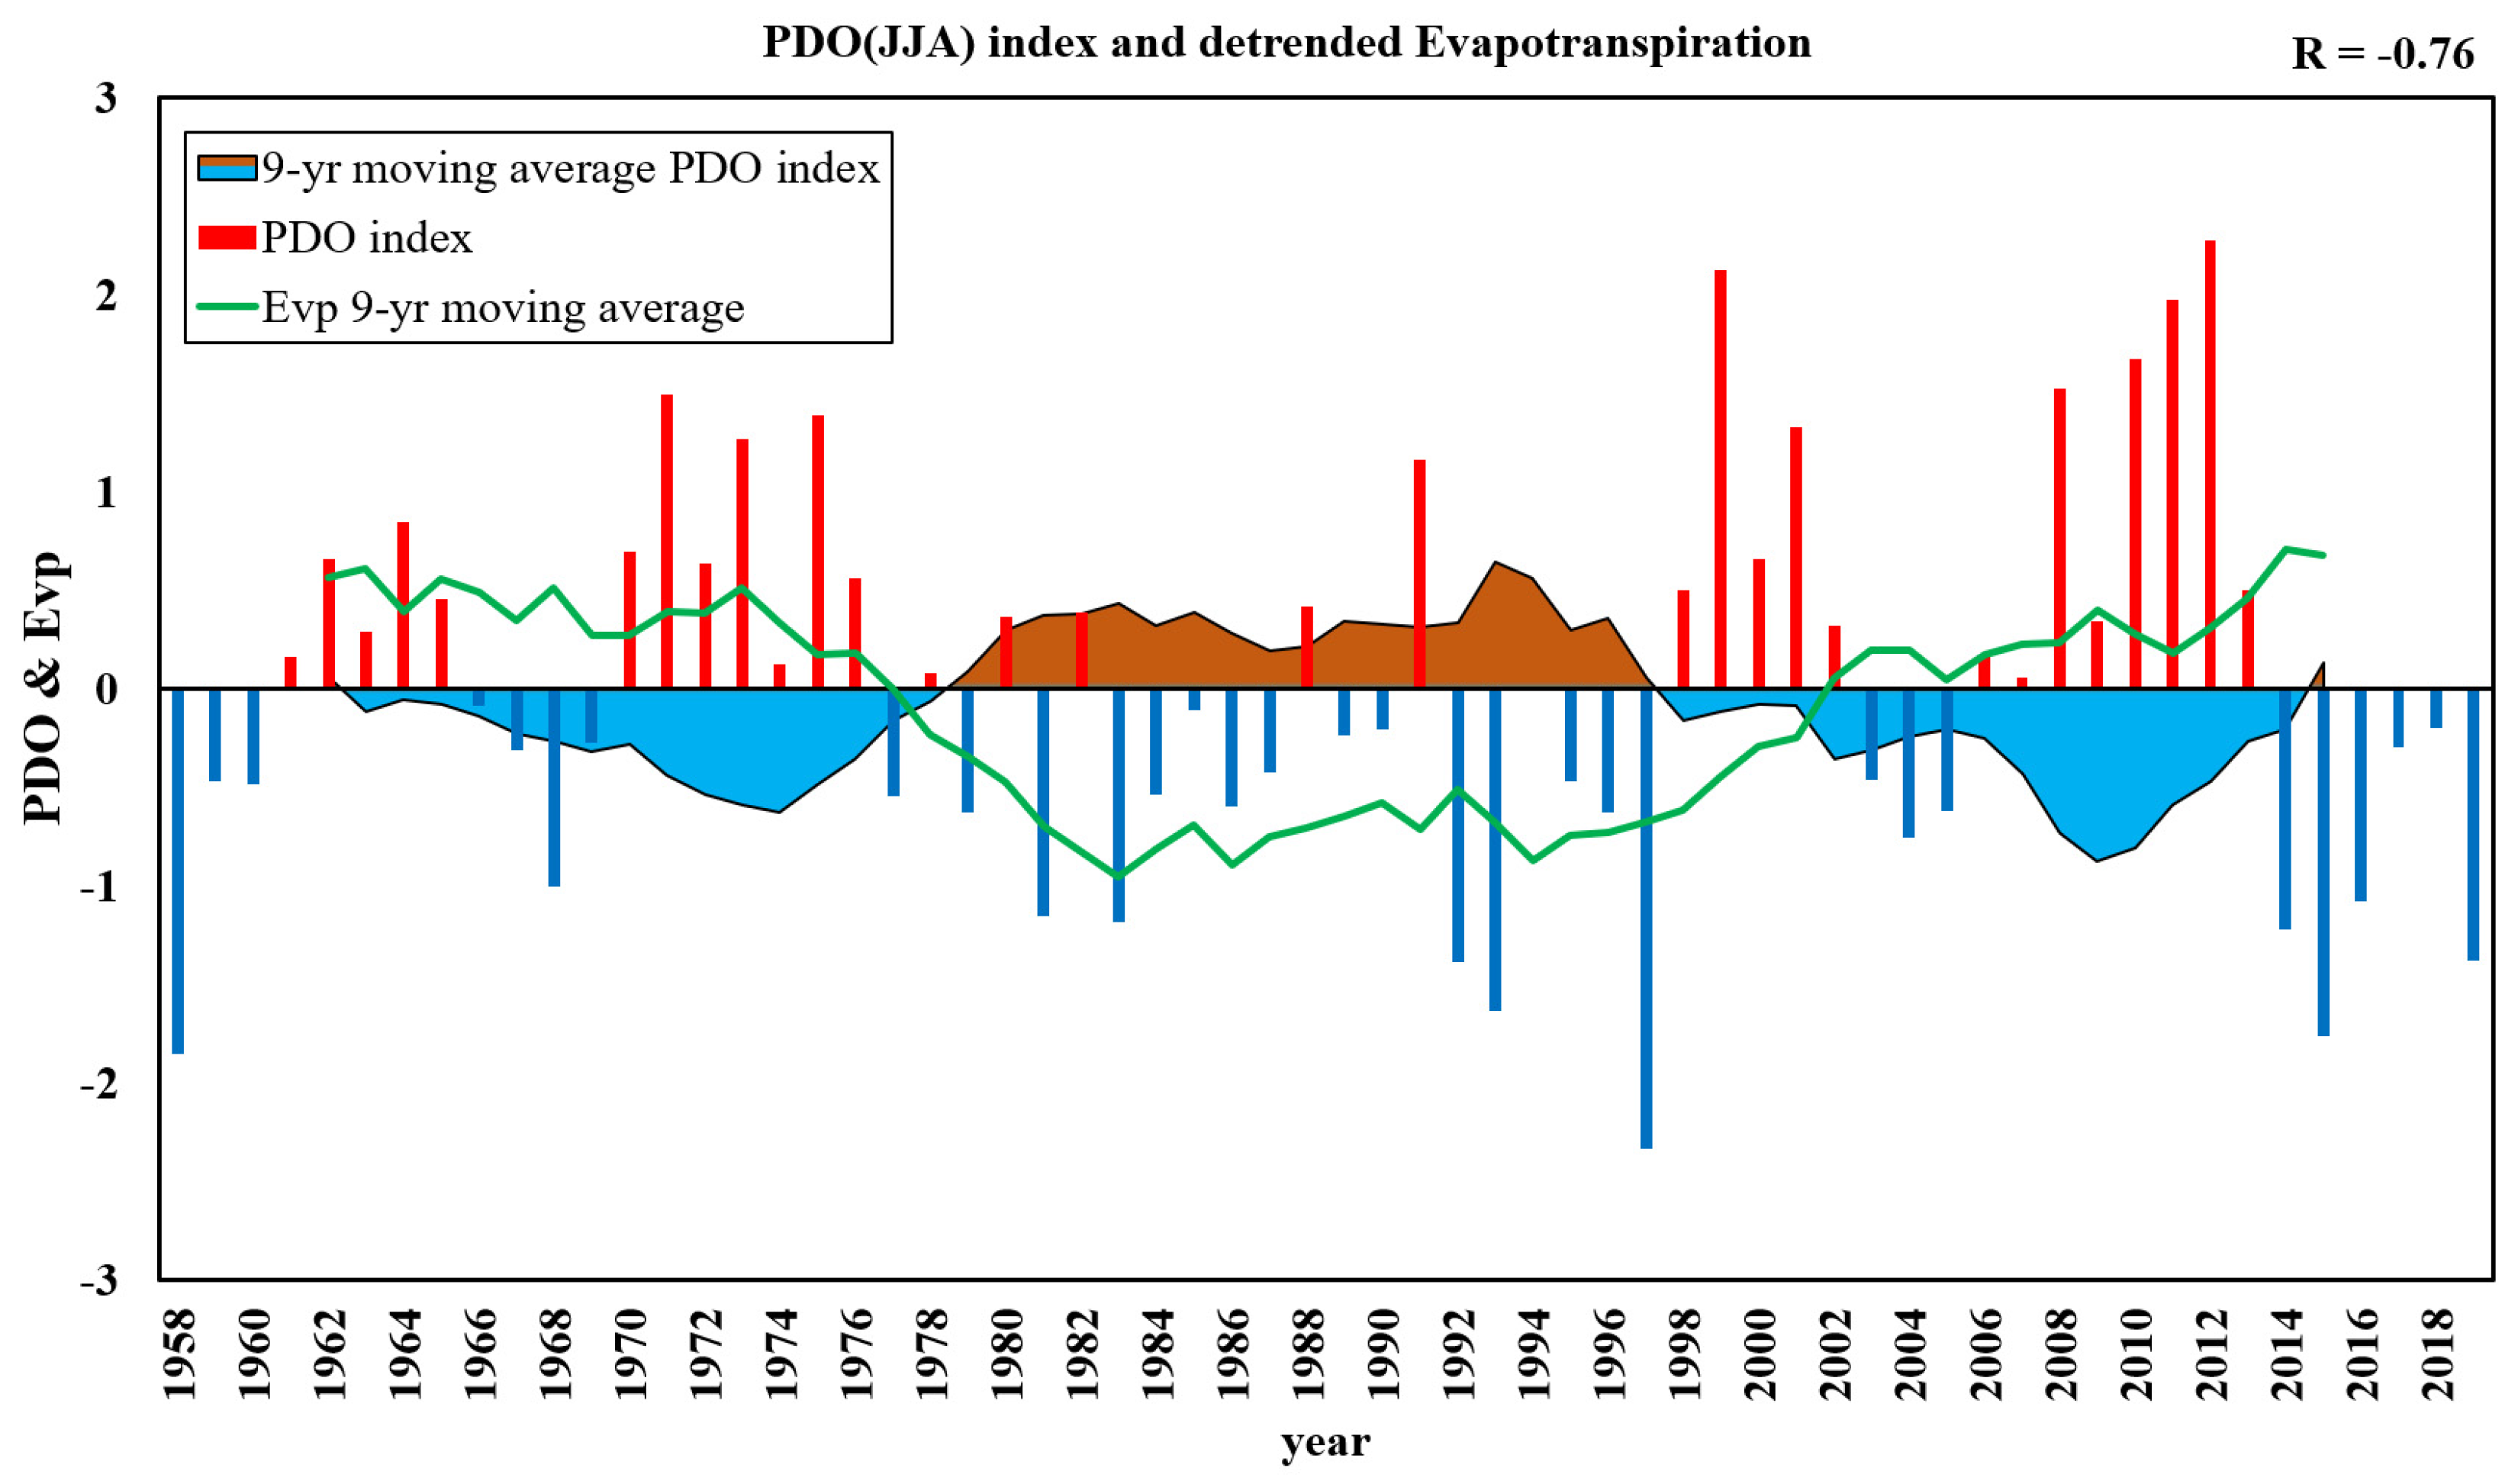
3.3. The Relationship between the Summer WVT of the TP and the Climate Index and the IPWP

To explain the influence of changes in air-sea activities on the summer WVB of the TP, Figure 13 shows the spatial regression distribution of the atmospheric circulation field and ocean elements and the WVB of the TP from 1958 to 2019.
When the summer WVT of the TP becomes stronger, positive sea level pressure (SLP) anomalies appeared in the Arabian Sea and Bay of Bengal, and negative SLP anomalies near the Indian Ocean southeast of the equator, while the WPWP was controlled by a significant positive SLP anomaly (Figure 13a). The sea area near the Arabian Sea and the southern Indian subcontinent showed positive anomalies of SLHF, while the warm pool area between Sumatra and the Philippine islands on the marine continent showed negative anomalies, and the central and eastern tropical Pacific showed positive anomalies. The east–west difference of the SLHF caused the easterly wind in the WPWP, and there was an abnormal surface wind cyclone in the southern Indian subcontinent (Figure 13b). The change in the horizontal wind at 850 hPa was similar to that of the surface wind, which strengthened the WVT from the WPWP to the South China Sea, the Bay of Bengal, and the Arabian Sea (Figure 13c,d). For the horizontal wind at 500 hPa, an anomaly of the anticyclone and easterly wind in the western equatorial warm pool formed near the Northwest Pacific, transporting more water vapor to the Bay of Bengal and the Arabian Sea, which is similar to that of the horizontal wind at 850 hPa (Figure 13e).
In the North Pacific region, there was a positive pressure anomaly, accompanied by a positive tropospheric geopotential height anomaly and an anomalous anticyclone, while the SST exhibited an abnormal dipole feature, which illustrated that the configuration of the tropical North Pacific SST and circulation have teleconnection characteristics with the TP WVT. Correlation calculations show that there is a strong negative correlation between the WVB of the TP and the PDO index.
For the TP, there was an abnormal cyclone near the ground (500 hPa) and an anomalous anticyclone in the middle and upper troposphere (200 hPa), which in turn enhanced the water vapor pumping of the TP, and then increased the TP WVB and precipitation (Figure 13f). When the WVB increased, the precipitation in the southeastern and western waters of the Indian Peninsula and the Jianghuai Basin region also increased, while the precipitation near the Arabian Sea and the coast of the Bay of Bengal decreased (Figure 14a), which was consistent with the results of previous studies [54,75,76].
From Figure 14b, we can see that the summer WVB on the TP and the regressed distribution of surface wind and precipitation indicate that there is a WVT anticyclonic anomaly in Southeast Asia (with the South China Sea as the center), while there is a WVT cyclonic anomaly in the Korean Peninsula and western Japan in East Asia, and they meet in the middle and lower reaches of the Yangtze River, causing local precipitation to increase.

4. Discussion

Previous studies have mainly focused on the variations of the atmospheric water cycle in the TP without considering the TP’s basin characteristics and the air-sea changes in the IPWP. The current study shows that the water cycle elements of TP have undergone significant changes and are directly related to the IPWP.
In this study, an evaluation on the atmospheric water cycle in TP and the air-sea interaction over the IPWP in reanalysis data is carried out in comparison with observation and remote sensing data, the quality of reanalysis data is in good agreement with the site observations and satellite remote sensing products on the inter-annual and inter-decadal levels, which means that the above results are relatively reliable [12,67].
The summer WVB on the TP showed no obvious change trend, but the total water input and output showed a significant decreasing trend, and changes in total water vapor input would significantly affect the WVB. The WVB had obvious characteristics of interannual variation [46], with 14 strong years and 15 weak years, and the WVB had a direct impact on changes in precipitation. On an interdecadal scale, the WVB and precipitation showed the same phase transition, with a negative phase transitioning to a positive phase in the mid-1990s [43,51] and a positive phase transition after 2006. When the summer WVB was strong (weak), it was mainly manifested in the WVT in the east of the monsoon line, and the Qiangtang Plateau intensified (weakened) and increased (decreased) in the WVB, while the watershed west of the TP’s monsoon line was the opposite. For the strong WVB’s years, the intensity of the water vapor transport channel (Yarlung Zangbo-Nu Jiang-Lancang-Jinsha River basins) was quantitatively strengthened by 40–60%. The channel is directly related to the large topography of the TP and the direction of the huge mountains [8], as shown in Figure 15a.
Under the rapid warming over the TP, the evapotranspiration showed a significant increasing trend, but after removing the warming trend, it had a positive–negative–positive phase transition on an interdecadal scale, and it was significantly negatively correlated with the interdecadal changes in PDO. The cold phase (warm phase) of PDO was beneficial to increase (decrease) the evapotranspiration of the TP in summer, and PDO could be used as a predictive signal of interdecadal changes in the TP evapotranspiration.
The climatic state of the summer PRR in the TP was 18%, and the external water vapor input played a leading role in the PRR, which was less than 23% [29]. The PRR showed an increasing trend, and evapotranspiration contributed the most to this change [39]. After the mid-1990s, the PRR underwent an interdecadal change, which once again illustrates the pattern of the intensified atmospheric water cycle within the TP. In strong and weak years, the PRR was 19% and 17%, and the difference between strong and weak years was 2%, indicating that the contribution of local evaporative water vapor to the TP precipitation is especially important.
The forcing factors that affect the TP’s WVB can be summarized as internal and external factors [12]. As shown in Figure 15a, in terms of internal factors, when the TPSM was strong, convection activities in the southern TP increased, which was conducive to bringing more water vapor and precipitation to the TP. Concerning external factors (Figure 15b), the critical air-sea zone in the Indo-Pacific Warm Pool, as well as the triple mode of SLHF and the triple mode of SST [6], caused anomalies in the easterly water vapor transport in the equatorial Pacific, resulting in anomalous cyclones in the Indian subcontinent, the Bay of Bengal, and the South China Sea. For the potential height at the 850 hPa, it showed the characteristics of dipoles in the central tropic Pacific and marine continents; for the potential height at the 500 hPa, it appeared as a positive anomaly of the Western Subtropic Pacific high (WSPH), which together caused a significant anomalous easterly wind at 850 hPa and 500 hPa and resulted in a positive anomaly of WVT from the central tropic Pacific Ocean to the marine continent to the Bay of Bengal. Meanwhile, in the water vapor source area and upstream of the WVT water vapor channel, the water vapor transport anomalous cyclones in the southern Indian Ocean Warm Pool, the coast of East Africa, and the Indian subcontinent directly compressed the water vapor transport width from the water vapor source area to the Arabian Sea and southwest TP, and at the same time strengthened the water vapor transport flux. In the downstream of the WVT water vapor channel, the water vapor transport anomalous anticyclone in the Bay of Bengal and the South China Sea, and the cyclone in North China would suppress the water vapor transport to reduce water vapor transport to Southeast Asia, the Yun-Gui Plateau, and South China, indirectly increased water vapor transported to TP. Due to the air-sea activity changes in the IPWP, the combined effects of the upstream strengthening and the downstream weakening in the water vapor transport process, directly and indirectly, increased the water vapor transport and budget of TP [18,54].

5. Conclusions

This study quantitatively analyzed the variability of the summer atmospheric water cycle over the TP from 1958 to 2019 and its possible response to the IPWP by using three reanalysis data, remote sensing data from NOAA, and the climate indices (Pacific Decadal Oscillation, PDO). The results indicate that in the past 62 years, the water cycle process of the TP and its key elements has intensified. The total water vapor input and output showed a decreasing trend, while the evapotranspiration showed a significant increasing trend. The change in the TP’s WVB is the main reason for the interannual and interdecadal changes in precipitation, and there exists a strong water vapor transport channel (Yarlung Zangbo-Nu River-Lancang River-Jinsha River) in southeastern TP, which is directly determined by the large topography of the TP and the direction of the huge mountains. On the interdecadal scale, the changes in evapotranspiration are remotely correlated with the PDO index. The climatic precipitation recycle ratio (PRR) in the TP during summer was 18%, it was dominated by the external water vapor input and the local evapotranspiration, and the PRRs over the TP and its 13 basins have a strong logarithmic correlation with areas. Both the internal (TP summer monsoon) and external forcing factors (IPWP) could affect the TP’s water vapor transport and cycle process. The strong TP summer monsoon would bring more water vapor and precipitation to the TP. For the Indo-Pacific Ocean, the tripole mode of SLHF and SST would cause the ascending movement of the troposphere, then caused a significant anomalous easterly wind at 850 hPa and 500 hPa and resulted in a positive anomaly of WVT from the central tropic Pacific Ocean to the marine continent to the Bay of Bengal. Meanwhile, due to the air-sea activity changes in the IPWP, the combined effects of the upstream strengthening and the downstream weakening in the water vapor transport channel would, directly and indirectly, enhance the water vapor transport process and increase more moisture to the TP.
The SSTA on the IPWP will induce abnormal atmospheric water vapor transport, which directly affects the entire process of water vapor transport from the IPWP to TP, and indirectly affects the atmospheric water cycle of TP. However, as a key area connecting the Western Indian Ocean and the Central and Eastern Pacific, the relationship between the SSTA on the IPWP and the SSTA on the Western Indian Ocean, the Central Eastern Pacific, and the North Pacific still need further research. In addition, the difference between the impact of coordinated changes in tropical Indo-Pacific’s SSTA on water vapor transport on the TP and the direct impact of the Indo-Pacific warm pool is also the focus of further research.

Author Contributions

D.M.: methodology, writing—original draft preparation and editing, and software. W.S. and Z.Y.: writing—review and editing. W.Z.: investigation and supervision. Q.D.: conceptualization and funding acquisition. All authors have read and agreed to the published version of the manuscript.

Funding

This research was funded by the National Natural Science Foundation of China (no. 41876210 and 41801355), National Key Research and Development Program of China (no. 2017YFA0603003), and Institute International Cooperation Projects (E03405020N).

Institutional Review Board Statement

Not applicable.

Informed Consent Statement

Not applicable.

Data Availability Statement

The ERA5 data were available from https://cds.climate.copernicus.eu (accessed on 1 December 2020), and the JRA-55 data were provided by the NCAR (https://rda.ucar.edu/, accessed on 1 December 2020). The CMA station data were obtained from the National Meteorological Information Center (http://data.cma.cn/, accessed on 1 October 2020). The PDO index was provided by the NOAA/OAR/ESRL PSD (https://www.esrl.noaa.gov/psd/, accessed on 1 July 2021).

Acknowledgments

We would like to offer special thanks to the Japanese Meteorological Agency (JMA) and the European Center for Medium-Term Numerical Forecasting (ECMWF) for providing us with the reanalysis datasets (JRA-55 and ERA5). We also express our gratitude to the China Meteorological Administration (CMA), who supplies the gridded precipitation data. Thanks for the technology support of the China-Sri Lanka Joint Center for Education and Research, Chinese Academy of Sciences. A special acknowledgment should be expressed to China-Pakistan Joint Research Center on Earth Sciences that supported the implementation of this study.

Conflicts of Interest

The authors declare no conflict of interest.

References

  1. Vörösmarty, C.J.; Green, P.; Salisbury, J.; Lammers, R.B. Global Water Resources: Vulnerability from Climate Change and Population Growth. Science 2000, 289, 284–288. [Google Scholar] [CrossRef] [PubMed] [Green Version]
  2. Yao, T.; Wu, G.; Xu, B.; Wang, W.; Gao, J.; An, B. Asian Water Tower Change and Its Impacts. Bull. Chin. Acad. Sci. 2019, 34, 1203–1209. [Google Scholar]
  3. Immerzeel, W.W.; Van Beek, L.P.H.; Bierkens, M.F.P. Climate change will affect the Asian Water Towers. Science 2010, 328, 1382–1385. [Google Scholar] [CrossRef] [PubMed]
  4. Seager, R.; Naik, N.; Vecchi, G. Thermodynamic and Dynamic Mechanisms for Large-Scale Changes in the Hydrological Cycle in Response to Global Warming. J. Clim. 2010, 23, 4651–4668. [Google Scholar] [CrossRef] [Green Version]
  5. Yang, K.; Ye, B.; Zhou, D.; Wu, B.; Foken, T.; Qin, J.; Zhou, Z. Response of hydrological cycle to recent climate changes in the Tibetan Plateau. Clim. Chang. 2011, 109, 517–534. [Google Scholar] [CrossRef]
  6. Liu, Y.; Lu, M.; Yang, H.; Duan, A.; He, B.; Yang, S.; Wu, G. Land–atmosphere–ocean coupling associated with the Tibetan Plateau and its climate impacts. Natl. Sci. Rev. 2020, 7, 534–552. [Google Scholar] [CrossRef] [Green Version]
  7. Zhang, G.; Yao, T.; Xie, H.; Yang, K.; Zhu, L.; Shum, C.; Bolch, T.; Yi, S.; Allen, S.; Jiang, L.; et al. Response of Tibetan Plateau lakes to climate change: Trends, patterns, and mechanisms. Earth-Sci. Rev. 2020, 208, 103269. [Google Scholar] [CrossRef]
  8. Zhao, Y.; Wang, Y.; Xu, X.; Dong, L. Effect of the Asian Water Tower over the Qinghai-Tibet Plateau and the characteristics of atmospheric water circulation. Chin. Sci. Bull. 2019, 64, 2830–2841. [Google Scholar] [CrossRef] [Green Version]
  9. Hao, D.; Wen, J.; Xiao, Q.; Lin, X.; You, D.; Tang, Y.; Liu, Q.; Zhang, S. Sensitivity of Coarse-Scale Snow-Free Land Surface Shortwave Albedo to Topography. J. Geophys. Res. Atmos. 2019, 124, 9028–9045. [Google Scholar] [CrossRef]
  10. Zhang, J.; Liu, J.; Jin, J.; Ma, T.; Wang, G.; Liu, H.; Min, X.; Wang, H.; Lin, J.; Bao, Z.; et al. Evolution and Trend of Water Resources in Qinghai-Tibet Plateau. Bull. Chin. Acad. Sci. 2019, 34, 1264–1273. [Google Scholar]
  11. You, Q.; Liu, J.; Pepin, N. Changes of summer cloud water content in China from ERA-Interim reanalysis. Glob. Planet. Chang. 2019, 175, 201–210. [Google Scholar] [CrossRef] [Green Version]
  12. Wang, Z.; Duan, A.; Yang, S.; Ullah, K. Atmospheric moisture budget and its regulation on the variability of summer precipitation over the Tibetan Plateau. J. Geophys. Res. Atmos. 2017, 122, 614–630. [Google Scholar] [CrossRef]
  13. Fu, Y.; Ma, Y.; Zhong, L.; Yang, Y.; Guo, X.; Wang, C.; Xu, X.; Yang, K.; Xu, X.; Liu, L.; et al. Land-surface processes and summer-cloud-precipitation characteristics in the Tibetan Plateau and their effects on downstream weather: A review and perspective. Natl. Sci. Rev. 2020, 7, 500–515. [Google Scholar] [CrossRef] [PubMed] [Green Version]
  14. Yao, T.; Xue, Y.; Chen, D.; Chen, F.; Thompson, L.; Cui, P.; Koike, T.; Lau, W.K.-M.; Lettenmaier, D.; Mosbrugger, V.; et al. Recent Third Pole’s Rapid Warming Accompanies Cryospheric Melt and Water Cycle Intensification and Interactions between Monsoon and Environment: Multidisciplinary Approach with Observations, Modeling, and Analysis. Bull. Am. Meteorol. Soc. 2019, 100, 423–444. [Google Scholar] [CrossRef]
  15. Gimeno, L.; Vázquez, M.; Eiras-Barca, J.; Sorí, R.; Stojanovic, M.; Algarra, I.; Nieto, R.; Ramos, A.; Durán-Quesada, A.M.; Dominguez, F. Recent progress on the sources of continental precipitation as revealed by moisture transport analysis. Earth-Sci. Rev. 2019, 201, 103070. [Google Scholar] [CrossRef]
  16. Cuo, L.; Zhang, Y. Spatial patterns of wet season precipitation vertical gradients on the Tibetan Plateau and the surroundings. Sci. Rep. 2017, 7, 5057. [Google Scholar] [CrossRef]
  17. Wang, Y.; Yang, K.; Zhou, X.; Chen, D.; Lu, H.; Ouyang, L.; Chen, Y.; Wang, B. Synergy of orographic drag parameterization and high resolution greatly reduces biases of WRF-simulated precipitation in central Himalaya. Clim. Dyn. 2020, 54, 1729–1740. [Google Scholar] [CrossRef]
  18. Zhang, C.; Tang, Q.; Chen, D.; van der Ent, R.; Liu, X.; Li, W.; Haile, G.G. Moisture Source Changes Contributed to Different Precipitation Changes over the Northern and Southern Tibetan Plateau. J. Hydrometeorol. 2019, 20, 217–229. [Google Scholar] [CrossRef]
  19. An, W.; Hou, S.; Zhang, Q.; Zhang, W.; Wu, S.; Xu, H.; Pang, H.; Wang, Y.; Liu, Y. Enhanced Recent Local Moisture Recycling on the Northwestern Tibetan Plateau Deduced from Ice Core Deuterium Excess Records. J. Geophys. Res. Atmos. 2017, 122. [Google Scholar] [CrossRef] [Green Version]
  20. Guo, Y.; Wang, C. Trends in precipitation recycling over the Qinghai–Xizang Plateau in last decades. J. Hydrol. 2014, 517, 826–835. [Google Scholar] [CrossRef]
  21. Guo, L.; Klingaman, N.P.; Demory, M.-E.; Vidale, P.L.; Turner, A.G.; Stephan, C.C. The contributions of local and remote atmospheric moisture fluxes to East Asian precipitation and its variability. Clim. Dyn. 2018, 51, 4139–4156. [Google Scholar] [CrossRef] [Green Version]
  22. Brubaker, K.L.; Entekhabi, D.; Eagleson, P.S. Estimation of Continental Precipitation Recycling. J. Clim. 1993, 6, 1077–1089. [Google Scholar] [CrossRef] [Green Version]
  23. Gao, Y.; Chen, F.; Miguez-Macho, G.; Li, X. Understanding precipitation recycling over the Tibetan Plateau using tracer analysis with WRF. Clim. Dyn. 2020, 55, 2921–2937. [Google Scholar] [CrossRef]
  24. Arnault, J.; Knoche, R.; Wei, J.; Kunstmann, H. Evaporation tagging and atmospheric water budget analysis with WRF: A regional precipitation recycling study for West Africa. Water Resour. Res. 2016, 52, 1544–1567. [Google Scholar] [CrossRef]
  25. Zhao, L.; Liu, X.; Wang, N.; Kong, Y.; Song, Y.; He, Z.; Liu, Q.; Wang, L. Contribution of recycled moisture to local precipitation in the inland Heihe River Basin. Agric. For. Meteorol. 2019, 271, 316–335. [Google Scholar] [CrossRef]
  26. Zhu, G.; Guo, H.; Qin, D.; Pan, H.; Zhang, Y.; Jia, W.; Ma, X. Contribution of recycled moisture to precipitation in the monsoon marginal zone: Estimate based on stable isotope data. J. Hydrol. 2018, 569, 423–435. [Google Scholar] [CrossRef]
  27. Yao, J.; Chen, Y.; Zhao, Y.; Guan, X.; Mao, W.; Yang, L. Climatic and associated atmospheric water cycle changes over the Xinjiang, China. J. Hydrol. 2020, 585, 124823. [Google Scholar] [CrossRef]
  28. Hua, L.; Zhong, L.; Ke, Z. Characteristics of the precipitation recycling ratio and its relationship with regional precipitation in China. Theor. Appl. Climatol. 2015, 127, 513–531. [Google Scholar] [CrossRef]
  29. Zhao, Y.; Zhou, T. Interannual Variability of Precipitation Recycle Ratio Over the Tibetan Plateau. J. Geophys. Res. Atmos. 2021, 126, e2020JD033733. [Google Scholar] [CrossRef]
  30. Yang, S.; Zhang, W.; Chen, B.; Xu, X.; Zhao, R. Remote moisture sources for 6-h summer precipitation over the Southeastern Tibetan Plateau and its effects on precipitation intensity. Atmos. Res. 2019, 236, 104803. [Google Scholar] [CrossRef]
  31. Liu, Z.; Tian, L.; Yao, T.; Yu, W. Seasonal deuterium excess in Nagqu precipitation: Influence of moisture transport and recycling in the middle of Tibetan Plateau. Environ. Earth Sci. 2007, 55, 1501–1506. [Google Scholar] [CrossRef]
  32. Zhu, X.; Wu, T.; Hu, G.; Wang, S.; Wu, X.; Li, R.; Wang, W.; Wen, A.; Ni, J.; Li, X.; et al. Long-distance atmospheric moisture dominates water budget in permafrost regions of the central Qinghai-Tibet Plateau. Hydrol. Processes 2020, 34. [Google Scholar] [CrossRef]
  33. Wang, S.; Zhang, M.; Che, Y.; Chen, F.; Qiang, F. Contribution of recycled moisture to precipitation in oases of arid central Asia: A stable isotope approach. Water Resour. Res. 2016, 52, 3246–3257. [Google Scholar] [CrossRef] [Green Version]
  34. Kong, Y.; Pang, Z.; Froehlich, K. Quantifying recycled moisture fraction in precipitation of an arid region using deuterium excess. Tellus B Chem. Phys. Meteorol. 2013, 65. [Google Scholar] [CrossRef]
  35. Zongxing, L.; Qi, F.; Wang, Q.; Song, Y.; Hongyi, L.; Yongge, L. The influence from the shrinking cryosphere and strengthening evopotranspiration on hydrologic process in a cold basin, Qilian Mountains. Glob. Planet. Chang. 2016, 144, 119–128. [Google Scholar] [CrossRef]
  36. Zongxing, L.; Qi, F.; Wang, Q.; Yanlong, K.; Aifang, C.; Song, Y.; Yongge, L.; Jianguo, L.; Xiaoyan, G. Contributions of local terrestrial evaporation and transpiration to precipitation using δ 18 O and D-excess as a proxy in Shiyang inland river basin in China. Glob. Planet. Chang. 2016, 146, 140–151. [Google Scholar] [CrossRef]
  37. Kang, H.; Yu, X.; Fu, X.; Xu, X. Precipitation Recycling over the Northern China. Q. J. Appl. Meteorol. 2005, 16, 139–147. [Google Scholar]
  38. Hai, H.E.; Guihua, L.U. Precipitation Recycling in Tarim River Basin. J. Hydrol. Eng. 2013, 18, 1549–1556. [Google Scholar] [CrossRef]
  39. Zhang, H.; Xu, Y.; Gao, Y. Simulation Study on Precipitation Recycling Ratio in the Tibetan Plateau from 1982 to 2005. Adv. Earth Sci. 2020, 35, 297–307. [Google Scholar]
  40. Pan, C.; Zhu, B.; Gao, J.; Kang, H.; Zhu, T. Quantitative identification of moisture sources over the Tibetan Plateau and the relationship between thermal forcing and moisture transport. Clim. Dyn. 2018, 52, 181–196. [Google Scholar] [CrossRef]
  41. Yang, M.; Yao, T.; Wang, H.; Tian, L.; Gou, X. Estimating the criterion for determining water vapour sources of summer precipitation on the northern Tibetan Plateau. Hydrol. Processes 2005, 20, 505–513. [Google Scholar] [CrossRef]
  42. Chen, B.; Zhang, W.; Yang, S.; Xu, X. Identifying and contrasting the sources of the water vapor reaching the subregions of the Tibetan Plateau during the wet season. Clim. Dyn. 2019, 53, 6891–6907. [Google Scholar] [CrossRef]
  43. Zhou, C.; Zhao, P.; Chen, J. The Interdecadal Change of Summer Water Vapor over the Tibetan Plateau and Associated Mechanisms. J. Clim. 2019, 32, 4103–4119. [Google Scholar] [CrossRef]
  44. Tang, Q.; Liu, X.; Zhou, Y.; Wang, J.; Yun, X. Cascading Impacts of Asian Water Tower Change on Downstream Water Systems. Bull. Chin. Acad. Sci. 2019, 34, 1306–1312. [Google Scholar]
  45. Zhang, Y.; Huang, W.; Zhong, D. Major Moisture Pathways and Their Importance to Rainy Season Precipitation over the Sanjiangyuan Region of the Tibetan Plateau. J. Clim. 2019, 32, 6837–6857. [Google Scholar] [CrossRef]
  46. Xu, K.; Zhong, L.; Ma, Y.; Zou, M.; Huang, Z. A study on the water vapor transport trend and water vapor source of the Tibetan Plateau. Theor. Appl. Clim. 2020, 140, 1031–1042. [Google Scholar] [CrossRef]
  47. He, B.; Liu, Y.; Wu, G.; Wang, Z.; Bao, Q. The role of air-sea interactions in regulating the thermal effect of the Tibetan–Iranian Plateau on the Asian summer monsoon. Clim. Dyn. 2018, 52, 4227–4245. [Google Scholar] [CrossRef] [Green Version]
  48. Wang, B.; Li, J.; He, Q. Variable and robust East Asian monsoon rainfall response to El Niño over the past 60 years (1957–2016). Adv. Atmos. Sci. 2017, 34, 1235–1248. [Google Scholar] [CrossRef]
  49. Wei, W.; Zhang, R.; Wen, M.; Yang, S. Relationship between the Asian Westerly Jet Stream and Summer Rainfall over Central Asia and North China: Roles of the Indian Monsoon and the South Asian High. J. Clim. 2017, 30, 537–552. [Google Scholar] [CrossRef]
  50. Sun, B.; Wang, H. Interannual Variation of the Spring and Summer Precipitation over the Three River Source Region in China and the Associated Regimes. J. Clim. 2018, 31, 7441–7457. [Google Scholar] [CrossRef]
  51. Sun, J.; Yang, K.; Guo, W.; Wang, Y.; He, J.; Lu, H. Why Has the Inner Tibetan Plateau Become Wetter since the Mid-1990s? J. Clim. 2020, 33, 8507–8522. [Google Scholar] [CrossRef]
  52. Xie, S.-P.; Kosaka, Y.; Du, Y.; Hu, K.; Chowdary, J.S.; Huang, G. Indo-western Pacific ocean capacitor and coherent climate anomalies in post-ENSO summer: A review. Adv. Atmos. Sci. 2016, 33, 411–432. [Google Scholar] [CrossRef] [Green Version]
  53. Sun, B.; Wang, H. Enhanced connections between summer precipitation over the Three-River-Source region of China and the global climate system. Clim. Dyn. 2018, 52, 3471–3488. [Google Scholar] [CrossRef]
  54. Wang, L.; Huang, G.; Chen, W.; Zhou, W.; Wang, W. Wet-to-dry shift over Southwest China in 1994 tied to the warming of tropical warm pool. Clim. Dyn. 2018, 51, 3111–3123. [Google Scholar] [CrossRef]
  55. Zhang, J.; Chen, H.; Zhao, S. A Tripole Pattern of Summertime Rainfall and the Teleconnections Linking Northern China to the Indian Subcontinent. J. Clim. 2019, 32, 3637–3653. [Google Scholar] [CrossRef]
  56. Sugimoto, S.; Ueno, K.; Sha, W. Transportation of Water Vapor into the Tibetan Plateau in the Case of a Passing Synoptic-Scale Trough. J. Meteorol. Soc. Jpn. 2008, 86, 935–949. [Google Scholar] [CrossRef] [Green Version]
  57. Kong, F.; Dong, Q.; Xiang, K.; Yin, Z.; Li, Y.; Liu, J. Spatiotemporal Variability of Remote Sensing Ocean Net Primary Production and Major Forcing Factors in the Tropical Eastern Indian and Western Pacific Ocean. Remote Sens. 2019, 11, 391. [Google Scholar] [CrossRef] [Green Version]
  58. Meng, D.; Dong, Q.; Kong, F.; Yin, Z.; Li, Y.; Liu, J. Spatio-Temporal Variations of Water Vapor Budget over the Tibetan Plateau in Summer and Its Relationship with the Indo-Pacific Warm Pool. Atmosphere 2020, 11, 828. [Google Scholar] [CrossRef]
  59. Lian, T.; Chen, D.; Tang, Y.; Jin, B. A theoretical investigation of the tropical Indo-Pacific tripole mode. Sci. China Earth Sci. 2013, 57, 174–188. [Google Scholar] [CrossRef]
  60. Yin, Z.; Dong, Q.; Kong, F.; Cao, D.; Long, S. Seasonal and Interannual Variability of the Indo-Pacific Warm Pool and its Associated Climate Factors Based on Remote Sensing. Remote Sens. 2020, 12, 1062. [Google Scholar] [CrossRef] [Green Version]
  61. Cai, Z.; Tian, L. Processes Governing Water Vapor Isotope Composition in the Indo-Pacific Region: Convection and Water Vapor Transport. J. Clim. 2016, 29, 8535–8546. [Google Scholar] [CrossRef]
  62. Wu, J.; Gao, X.J. A gridded daily observation dataset over China region and comparison with the other datasets. Chin. J. Geophys. 2013, 56, 1102–1111. [Google Scholar] [CrossRef]
  63. Kobayashi, S.; Ota, Y.; Harada, Y.; Ebita, A.; Moriya, M.; Onoda, H.; Onogi, K.; Kamahori, H.; Kobayashi, C.; Endo, H.; et al. The JRA-55 Reanalysis: General Specifications and Basic Characteristics. J. Meteorol. Soc. Jpn. 2015, 93, 5–48. [Google Scholar] [CrossRef] [Green Version]
  64. Harada, Y.; Kamahori, H.; Kobayashi, C.; Endo, H.; Kobayashi, S.; Ota, Y.; Onoda, H.; Onogi, K.; Miyaoka, K.; Takahashi, K. The JRA-55 Reanalysis: Representation of Atmospheric Circulation and Climate Variability. J. Meteorol. Soc. Jpn. 2016, 94, 269–302. [Google Scholar] [CrossRef] [Green Version]
  65. Hersbach, H.; Bell, B.; Berrisford, P.; Hirahara, S.; Horanyi, A.; Muñoz-Sabater, J.; Nicolas, J.; Peubey, C.; Radu, R.; Schepers, D.; et al. The ERA5 global reanalysis. Q. J. R. Meteorol. Soc. 2020, 146, 1999–2049. [Google Scholar] [CrossRef]
  66. Liu, Z.; Shi, C.; Zhou, Z.; Jiang, L.; Liang, X.; Zhang, T.; Liao, J.; Liu, J.; Wang, M.; Yao, S. CMA global reanalysis (CRA-40): Status and plans. In Proceedings of the 5th International Conference on Reanalysis, Rome, Italy, 13–17 November 2017; pp. 13–17. [Google Scholar]
  67. Zhao, D.; Zhang, L.; Zhou, T.; Liu, J. Contributions of Local and Remote Atmospheric Moisture Fluxes to East China Precipitation Estimated from CRA-40 Reanalysis. J. Meteorol. Res. 2021, 35, 32–45. [Google Scholar] [CrossRef]
  68. Schreck, C.; Lee, H.-T.; Knapp, K.R. HIRS Outgoing Longwave Radiation—Daily Climate Data Record: Application toward Identifying Tropical Subseasonal Variability. Remote Sens. 2018, 10, 1325. [Google Scholar] [CrossRef] [Green Version]
  69. Rayner, N.A.; Parker, D.E.; Horton, E.B.; Folland, C.K.; Alexander, L.; Rowell, D.P.; Kent, E.; Kaplan, A.L. Global analyses of sea surface temperature, sea ice, and night marine air temperature since the late nineteenth century. J. Geophys. Res. Space Phys. 2003, 108, D14. [Google Scholar] [CrossRef]
  70. Zhang, Y.; Wallace, J.M.; Battisti, D.S. ENSO-like interdecadal variability: 1900-93. J. Clim. 1997, 10, 1004–1020. [Google Scholar] [CrossRef]
  71. Zhang, G.; Yao, T.; Xie, H.; Kang, S.; Lei, Y. Increased mass over the Tibetan Plateau: From lakes or glaciers? Geophys. Res. Lett. 2013, 40, 2125–2130. [Google Scholar] [CrossRef]
  72. Li, R.; Wang, C. Precipitation recycling using a new evapotranspiration estimator for Asian-African arid regions. Theor. Appl. Clim. 2019, 140, 1–13. [Google Scholar] [CrossRef]
  73. Zhou, Y.; Fan, G.; Hua, W.; Wang, B.; Zhu, L.; Zhou, D. Distribution Characteristics of Plateau Monsoon and a Contrastive Analysis of Plateau Monsoon Index. Plateau Meteorol. 2015, 34, 1517–1530. [Google Scholar]
  74. Maoqiu, J.; Xiaohao, Q.; Yunting, Q.; Zhiping, W. Spatial and Temporal Variations of Large-scale Atmospheric Moisture Sinks over Southern China in Spring. Adv. Clim. Chang. Res. 2007, 2, 74–79. [Google Scholar]
  75. Jiang, X.; Ting, M. A Dipole Pattern of Summertime Rainfall across the Indian Subcontinent and the Tibetan Plateau. J. Clim. 2017, 30, 9607–9620. [Google Scholar] [CrossRef]
  76. Wang, Z.; Duan, A.; Yang, S. Potential regulation on the climatic effect of Tibetan Plateau heating by tropical air-sea coupling in regional models. Clim. Dyn. 2018, 52, 1685–1694. [Google Scholar] [CrossRef]
Figure 1. (a) Schematic diagram of the water vapor transport process from the Indo-Pacific Warm Pool (IPWP) to the Tibetan Plateau (TP) during boreal summer (June–July–August, JJA), where the black solid line denotes the boundary of IPWP, and the black dotted lines denote the water vapor transport channels and sub-channels. (b) The TP and its 13 internal basins.
Remotesensing 13 04676 g001
Figure 2. Atmospheric water cycle model.
Remotesensing 13 04676 g002
Figure 3. Time series of summer atmospheric water cycle elements on the TP from 1958 to 2019; the left column is the instantaneous value of the climatic state (unit: 106 kg s−1); the right column is the detrend standardized time series and the 11−year moving average. Among them: (a,b) the WVBs, (c,d) precipitations, (e,f) evapotranspirations. The black dashed lines indicate linear trend in (a,c,e).
Remotesensing 13 04676 g003
Figure 4. Time series of the evapotranspiration in the TP, and the PDO index during the period of 1958 to 2019.
Remotesensing 13 04676 g004
Figure 5. Distribution map of summer water vapor transport and budget on the TP, the arrow indicates the direction of water vapor flux, the black value is the net water vapor flux at the boundary of the basin, and the red value is the instantaneous WVB of the basin, unit: 106 kg s−1; (a) climatic state, (b) strong year, (c) weak years, and (d) proportion of the difference between strong and weak years.
Remotesensing 13 04676 g005
Figure 6. The contribution rate of local and external WVT on the TP to precipitation: for the three values of each atmospheric water cycle element, from left to right, they, respectively, represent the mean climatic value and the average value in strong and weak years.
Remotesensing 13 04676 g006
Figure 7. Time series of PRR on the TP (a), and its standardized series (b).
Remotesensing 13 04676 g007
Figure 8. (a) Time series of PRRs in different basins of the TP. (b) The relationship the PRRs and the basin areas of the TP and its basins.
Remotesensing 13 04676 g008
Figure 9. Standardized time series of the summer monsoon index on the TP, the black solid line is the JRA-55 reanalysis data result, and the black dashed line is the ERA5 reanalysis data result.
Remotesensing 13 04676 g009
Figure 10. (a,b) The first and second mode of the empirical orthogonal function (EOF) of the detrended SLHF in the IPWP. (c,d) The standardized time series of the PC1 and PC2, respectively.
Remotesensing 13 04676 g010
Figure 11. The climatology and trend of summer OLR over the (a) TP and (c) IPWP: the red solid and dotted lines denote the ERA5, and the black solid lines denote the HIRS OLR, respectively. The PC1 time series of EOF over the (b) TP and (d) IPWP: the bars denote the ERA5, and the black lines denote the HIRS OLR. (e,f) are the second mode and time series of the EOF2 for the detrended OLR over the TP.
Remotesensing 13 04676 g011
Figure 12. (a,b) The EOF1 and EOF2 of the detrended OLR in the IPWP. (c,d) The standardized time series of the PC1 and PC2, respectively.
Remotesensing 13 04676 g012
Figure 13. Anomalies of (a) sea level pressure (SLP, shadow, unit: hPa), (b) SLHF (shadow, unit: W m−2) and surface wind (vector, unit: m s−1), (c) water vapor transport flux (vector, unit: kg m− 1 s−1) and SST (shadow, unit: °C), (d) horizontal wind (vector, unit: m s−1) and geopotential height (shadow, unit: gpm) at 850 hPa, (e) horizontal wind (vector, unit: m s−1) and geopotential height (shadow, unit: gpm) at 500 hPa, (f) horizontal wind (vector, unit: m s−1) and vertical velocity (shadow, unit: Pa s−1) at 200 hPa regressed on the detrended and standardized time series of the summer WVB of the TP from 1958 to 2019.
Remotesensing 13 04676 g013
Figure 14. Anomalies of (a) the water vapor flux (vector, unit: kg m−1 s−1) and precipitation (colored shading, unit: mm d−1), (b) SLHF (colored shading, unit: W m−2), and sea surface wind field (vector, unit: m s−1) regressed on the detrended and standardized time series of summer WVB from 1958 to 2019.
Remotesensing 13 04676 g014
Figure 15. (a) The water vapor transport channel in the southeastern TP (Arrows) and its relationship with the topography. (b) Schematic diagram of summer WVT over the TP associated with the air-sea changes in the IPWP. The black line denotes the climatic WVT channel from the IPWP to the TP, and the blue solid line denotes the anomalous WVT of the channel, which directly enhances the WVT channel. The blue dotted line denotes the anomalous WVT, which indirectly suppresses the WVT channel. The letters A and C indicate anticyclone and cyclone, respectively.
Remotesensing 13 04676 g015
Table 1. Previous studies on the precipitation recycle ration (PRR) over the TP.
AreaPRRMethodsPeriodDataReference
TP18%Water Accounting Model (WAM)1979–2013ERA-Interim and NCEP 1[18]
TP21%Bulk model1979–2012ERA-Interim[20]
TP23%Bulk model1979–2018ERA5[29]
Southeastern TP35%QuasiIsentropic Back-Trajectory Method (QIBT)1982–2005ERA-Interim[39]
Northern TP20–24%Bulk model1960–2010NCEP 1[20]
Northern TP26%Community Atmosphere Model (CAM) 5.1 tagging1982–2014MERRA[40]
Northern TP15–25%Isotopic mixing modelJuly 2009, 2011, 2012, and 2014; July to September 1998Station Data[25,41]
Central TP14–32%Isotopic mixing modelJuly to September, 1996–1997Station Data[32]
Endorheic TP17–22%WAM-21979–2015ERA-Interim, MERRA-2, and JRA-55[25]
Table 2. The correlation coefficient between atmospheric water cycle factors.
CorQinQoutQnetPreEvpPRR
Qin1
Qout0.87 *1
Qnet0.52 *0.031
Pre0.45 *0.030.94 *1
Evp0.230.300.050.221
PRR−0.90 *0.82 *−0.40 *−0.260.62 *1
* Note: Those in bold with * are statistically significant above the 99% confidence level.
Table 3. Statistics of strong and weak years of summer WVB on the TP.
WVBYear
Strong years1958, 1962, 1963, 1974, 1980, 1987, 1995,
1998, 1999, 2000, 2003, 2004, 2017, 2018
Weak years1961, 1967, 1972, 1978, 1982, 1983, 1986,
1990, 1992, 1994, 1997, 2006, 2009, 2013, 2015
Table 4. The value of PRR under different WVT conditions (unit: %).
BasinsClimatologyStrong YearsWeak Years
TP17.8817.0518.62
Indus11.8611.1612.47
Qiangtang11.0410.9910.43
Yellow9.479.978.92
AmuDarya9.359.249.48
Yangtze8.788.319.19
Yalung Zangbo7.096.228.09
Qaidam5.636.304.78
Tarim5.275.734.83
Hexi Corridor5.245.924.53
Ganges4.224.174.25
Nu Jiang3.503.004.13
Lancang3.422.973.99
Irrawaddy1.741.462.17
Publisher’s Note: MDPI stays neutral with regard to jurisdictional claims in published maps and institutional affiliations.

