1. Introduction
The coastal areas of the world are undergoing significant changes, with 24% of sandy beaches eroding and 28% accumulating material, while the remaining 48% are stable [
1]. The formation of coastal zones is affected by climate change, with severe storms and sea level rise threatening coastal communities and natural habitats [
2].
Coastal dunes play an important role in coastal erosion risk management [
3], where they act as a dynamic natural sea defence [
3,
4,
5,
6,
7,
8]. Dunes also contribute to the resilience of the ecosystem by providing habitats that enrich coastal biodiversity [
6]. The morphology of coastal dunes depends mainly on four factors: (1) the beach morphology and shoreline dynamics which affect the sand supply; (2) the wind characteristics and speed and direction variability; (3) the vegetation cover along the coastal area, and (4) human activities such as planting trees, installing fences, etc. [
3].
Different measuring techniques have been used to detect the dynamics of coastal dunes. This involved the use of Airborne and terrestrial LiDAR techniques, in addition to GNSS techniques. Airborne LiDAR or laser scanning is an active remote sensing technique used in the application of modelling the surface of the earth [
9,
10,
11,
12,
13,
14]. Airborne LiDAR systems are based on a GNSS receiver and inertial measuring unit (IMU) for the determination of the position, and a laser system that emits and receives the transmitted and backscattered light pulses [
9]. It maps the earth’s surface and provides very dense and accurate three dimensional spatial data generated over a short period of time [
15]. Airborne LiDAR data have been used widely for monitoring coastal changes: sediment volumetric changes [
16], shorelines [
17,
18], coast morphology [
19,
20,
21,
22,
23], and vegetation growth on coastal dunes [
24]. The land surveying techniques (GNSS and terrestrial laser scanner) can be time consuming when surveying large areas, given the rough terrains of the coastal dunes. This limits the coverage and frequency of observations. Airborne LiDAR has the advantage of covering large areas in a very short time while also maintaining good accuracy of the spatial representation of the dunes. Repeated acquisition surveys for change detection analysis can be applied to study the morphodynamics of the dunes. However, this generates associated challenges of managing, analysing, and interpreting large data from repeated surveys [
14].
Coastal sand dunes can be found in most climatic environments [
7]. In England and Wales, coastal sand dunes cover an area of about 200 km
2 over 112 different sites [
6]. The largest in England is at Formby, along the Sefton coast [
25]. Many studies have been undertaken to understand the coastal changes at Formby, investigating the impact of changes in sea water and tidal levels [
26,
27,
28], storms [
27,
28,
29,
30], and determining the morphodynamic and volumetric changes in the coast [
3,
15,
29,
31,
32]. The dune system at Formby is predicted to have been established between 1400 AD and 1600 AD [
33]. The historical data suggest that the Formby coast has experienced several accretion and erosion episodes over the years [
28], where the coast saw significant erosion around 1906 due to a decrease in the rate of sand supply [
26] and, also, between 1977 and 1994 due to the combined impact of westerly winds and strong storms [
29]. High tides and strong winds resulted in the erosion of seaward facing frontal dunes [
29]. Such weather conditions continue to erode the coastlines of Formby and shift the sand dunes inland at a rate of four meters every year, mostly observed over the last decade [
26,
34,
35].
With rising global temperatures and sea level expected to lead to stronger storms [
36], coastal erosion and flooding are expected to occur more frequently. Moreover, climate change forecasts predict that in the next 50 to 100 years weather conditions will see an increase in temperature and precipitation, and a slight decrease in wind speed in Wales and northwest England, which could lead to the replacement of dune areas with fixed dune grassland and scrub, endangering the existence of rare species [
37]. Therefore, there is a strong need to understand the dynamic behavior of the dunes in these coasts and how much sand volume is lost or gained to the dune system over time. In this paper, we investigate the activity of sand dunes at Formby coast by using a time series of high-resolution LiDAR digital terrain models over a period of 21 years. We establish how much sand volume has been lost or deposited in the dune system during this time period as well as the rate of change in the elevation of sand dunes at Formby.
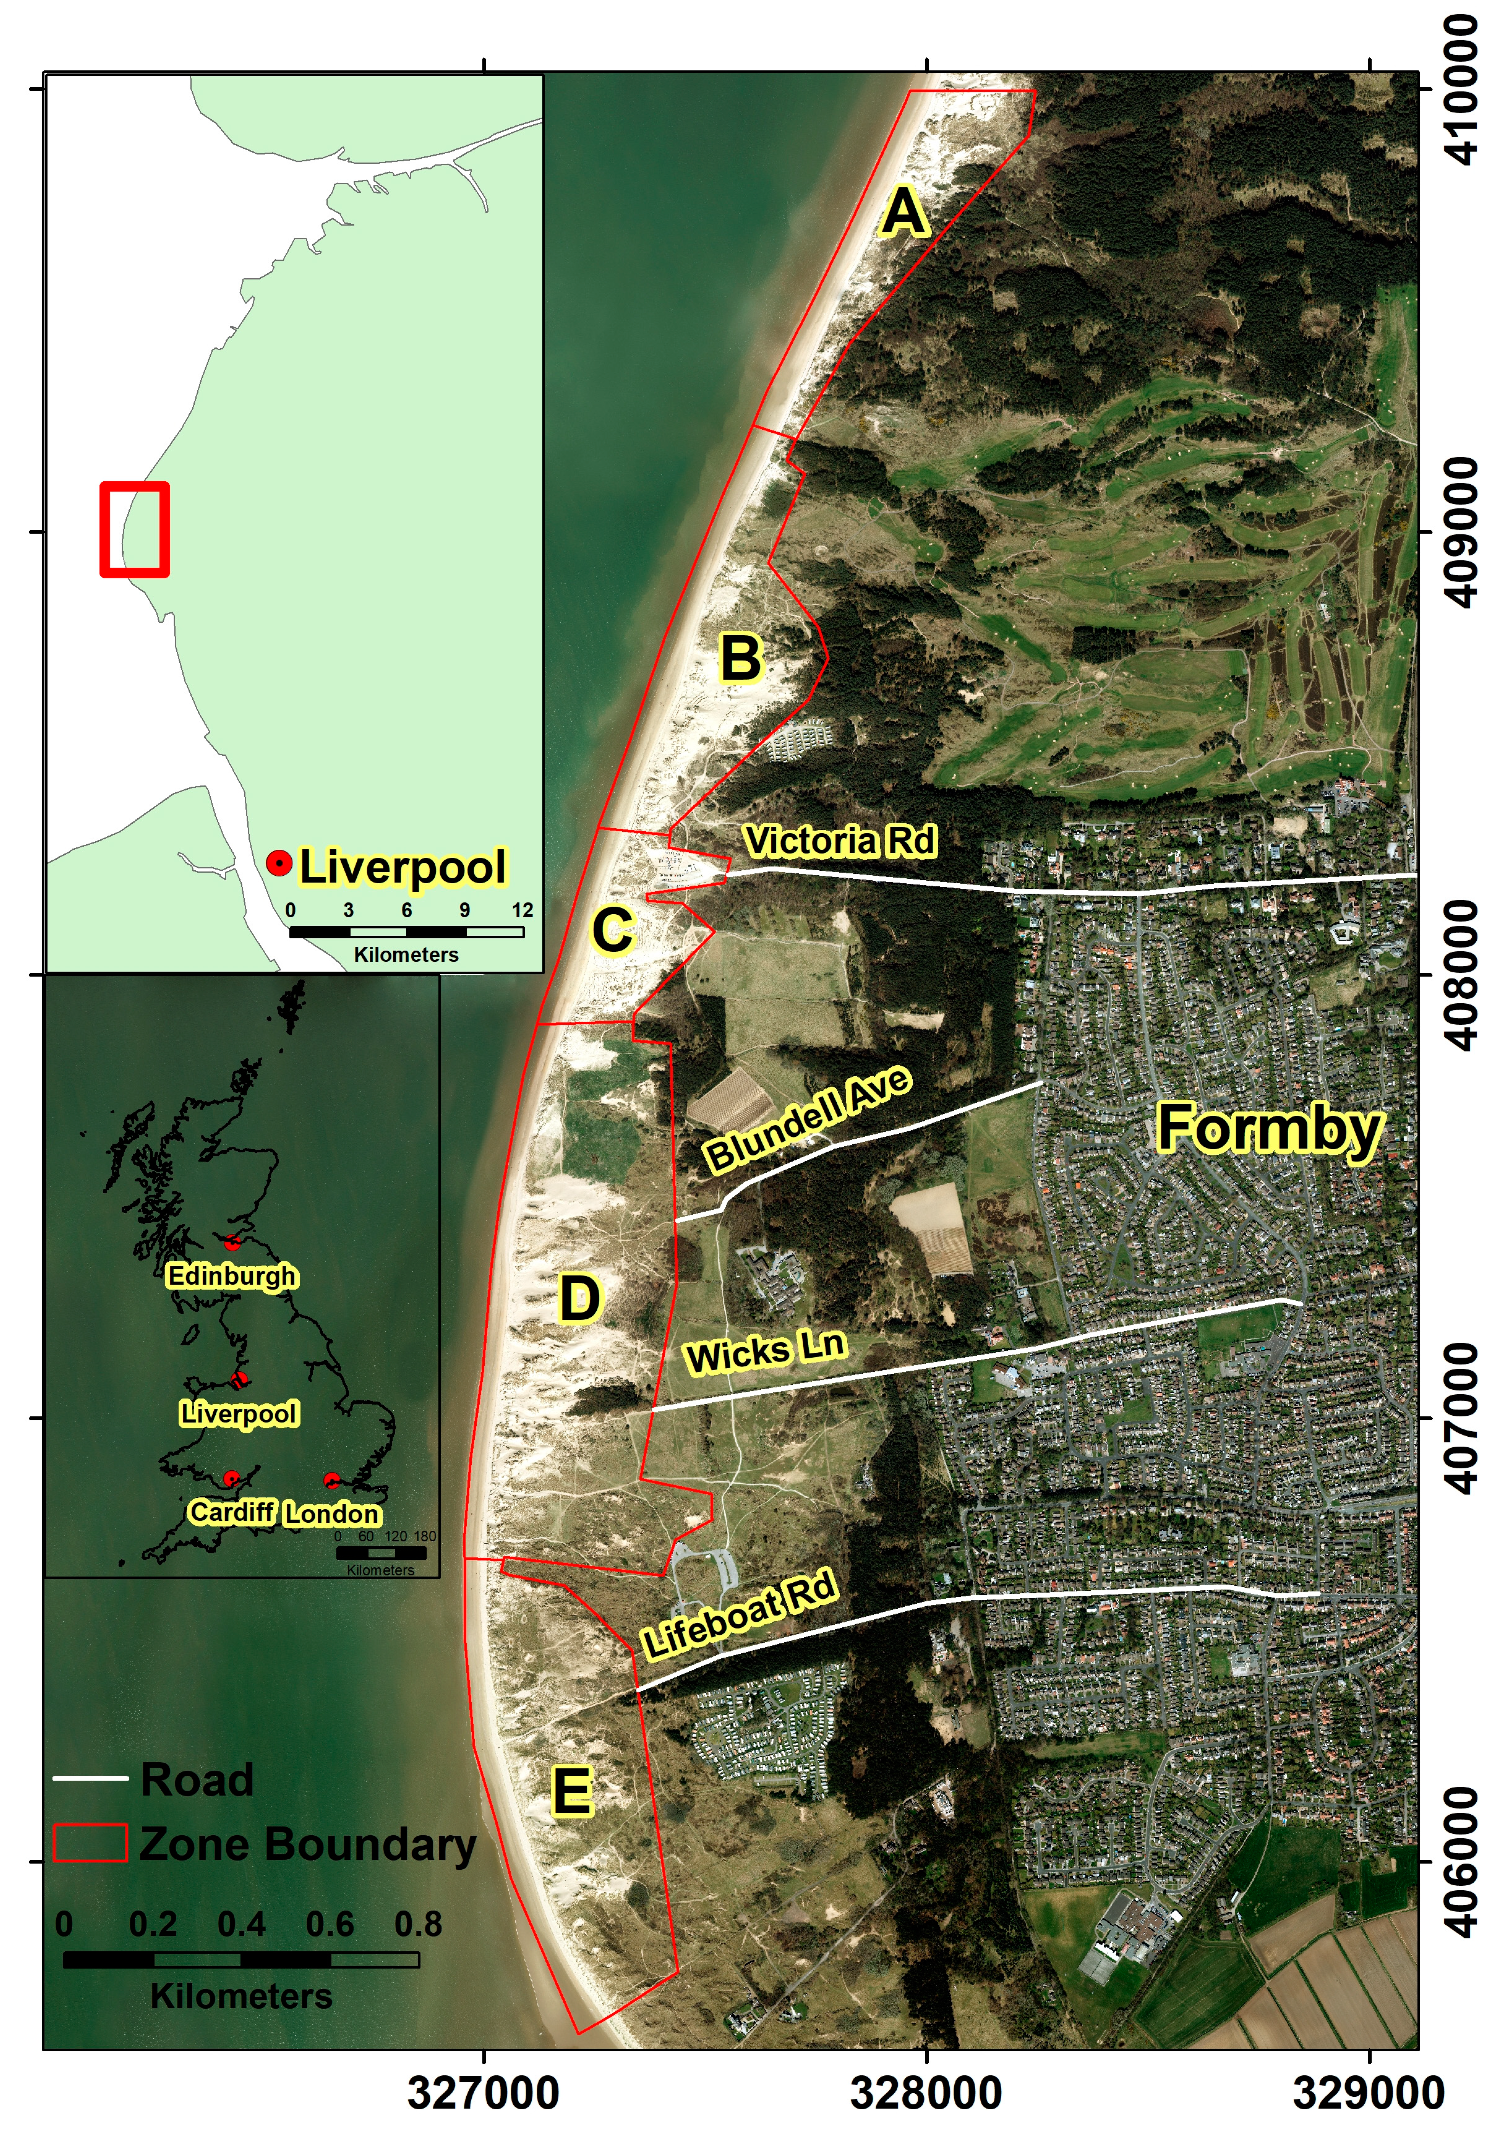
2. Study Area
The Formby site is owned by the National Trust. It is part of the Sefton coast that covers an area of approximately 20 km
2 [
6]. It consists of an evolving sandy beach and an inland dune field with frontal, semi-fixed, and fixed dunes. In this research, we investigate an area of about 1.3 km
2 with a coastline that stretches for about 5 km. The Formby site contains one of the largest and most rapidly evolving sand dune systems in England [
35]. The height of the inland dunes ranges from 6 m to 28 m above mean sea level, while the height of the beach ranges from 2.7 m to 6 m. This information is derived from the elevation data of the latest available LiDAR DTM acquired in 2020.
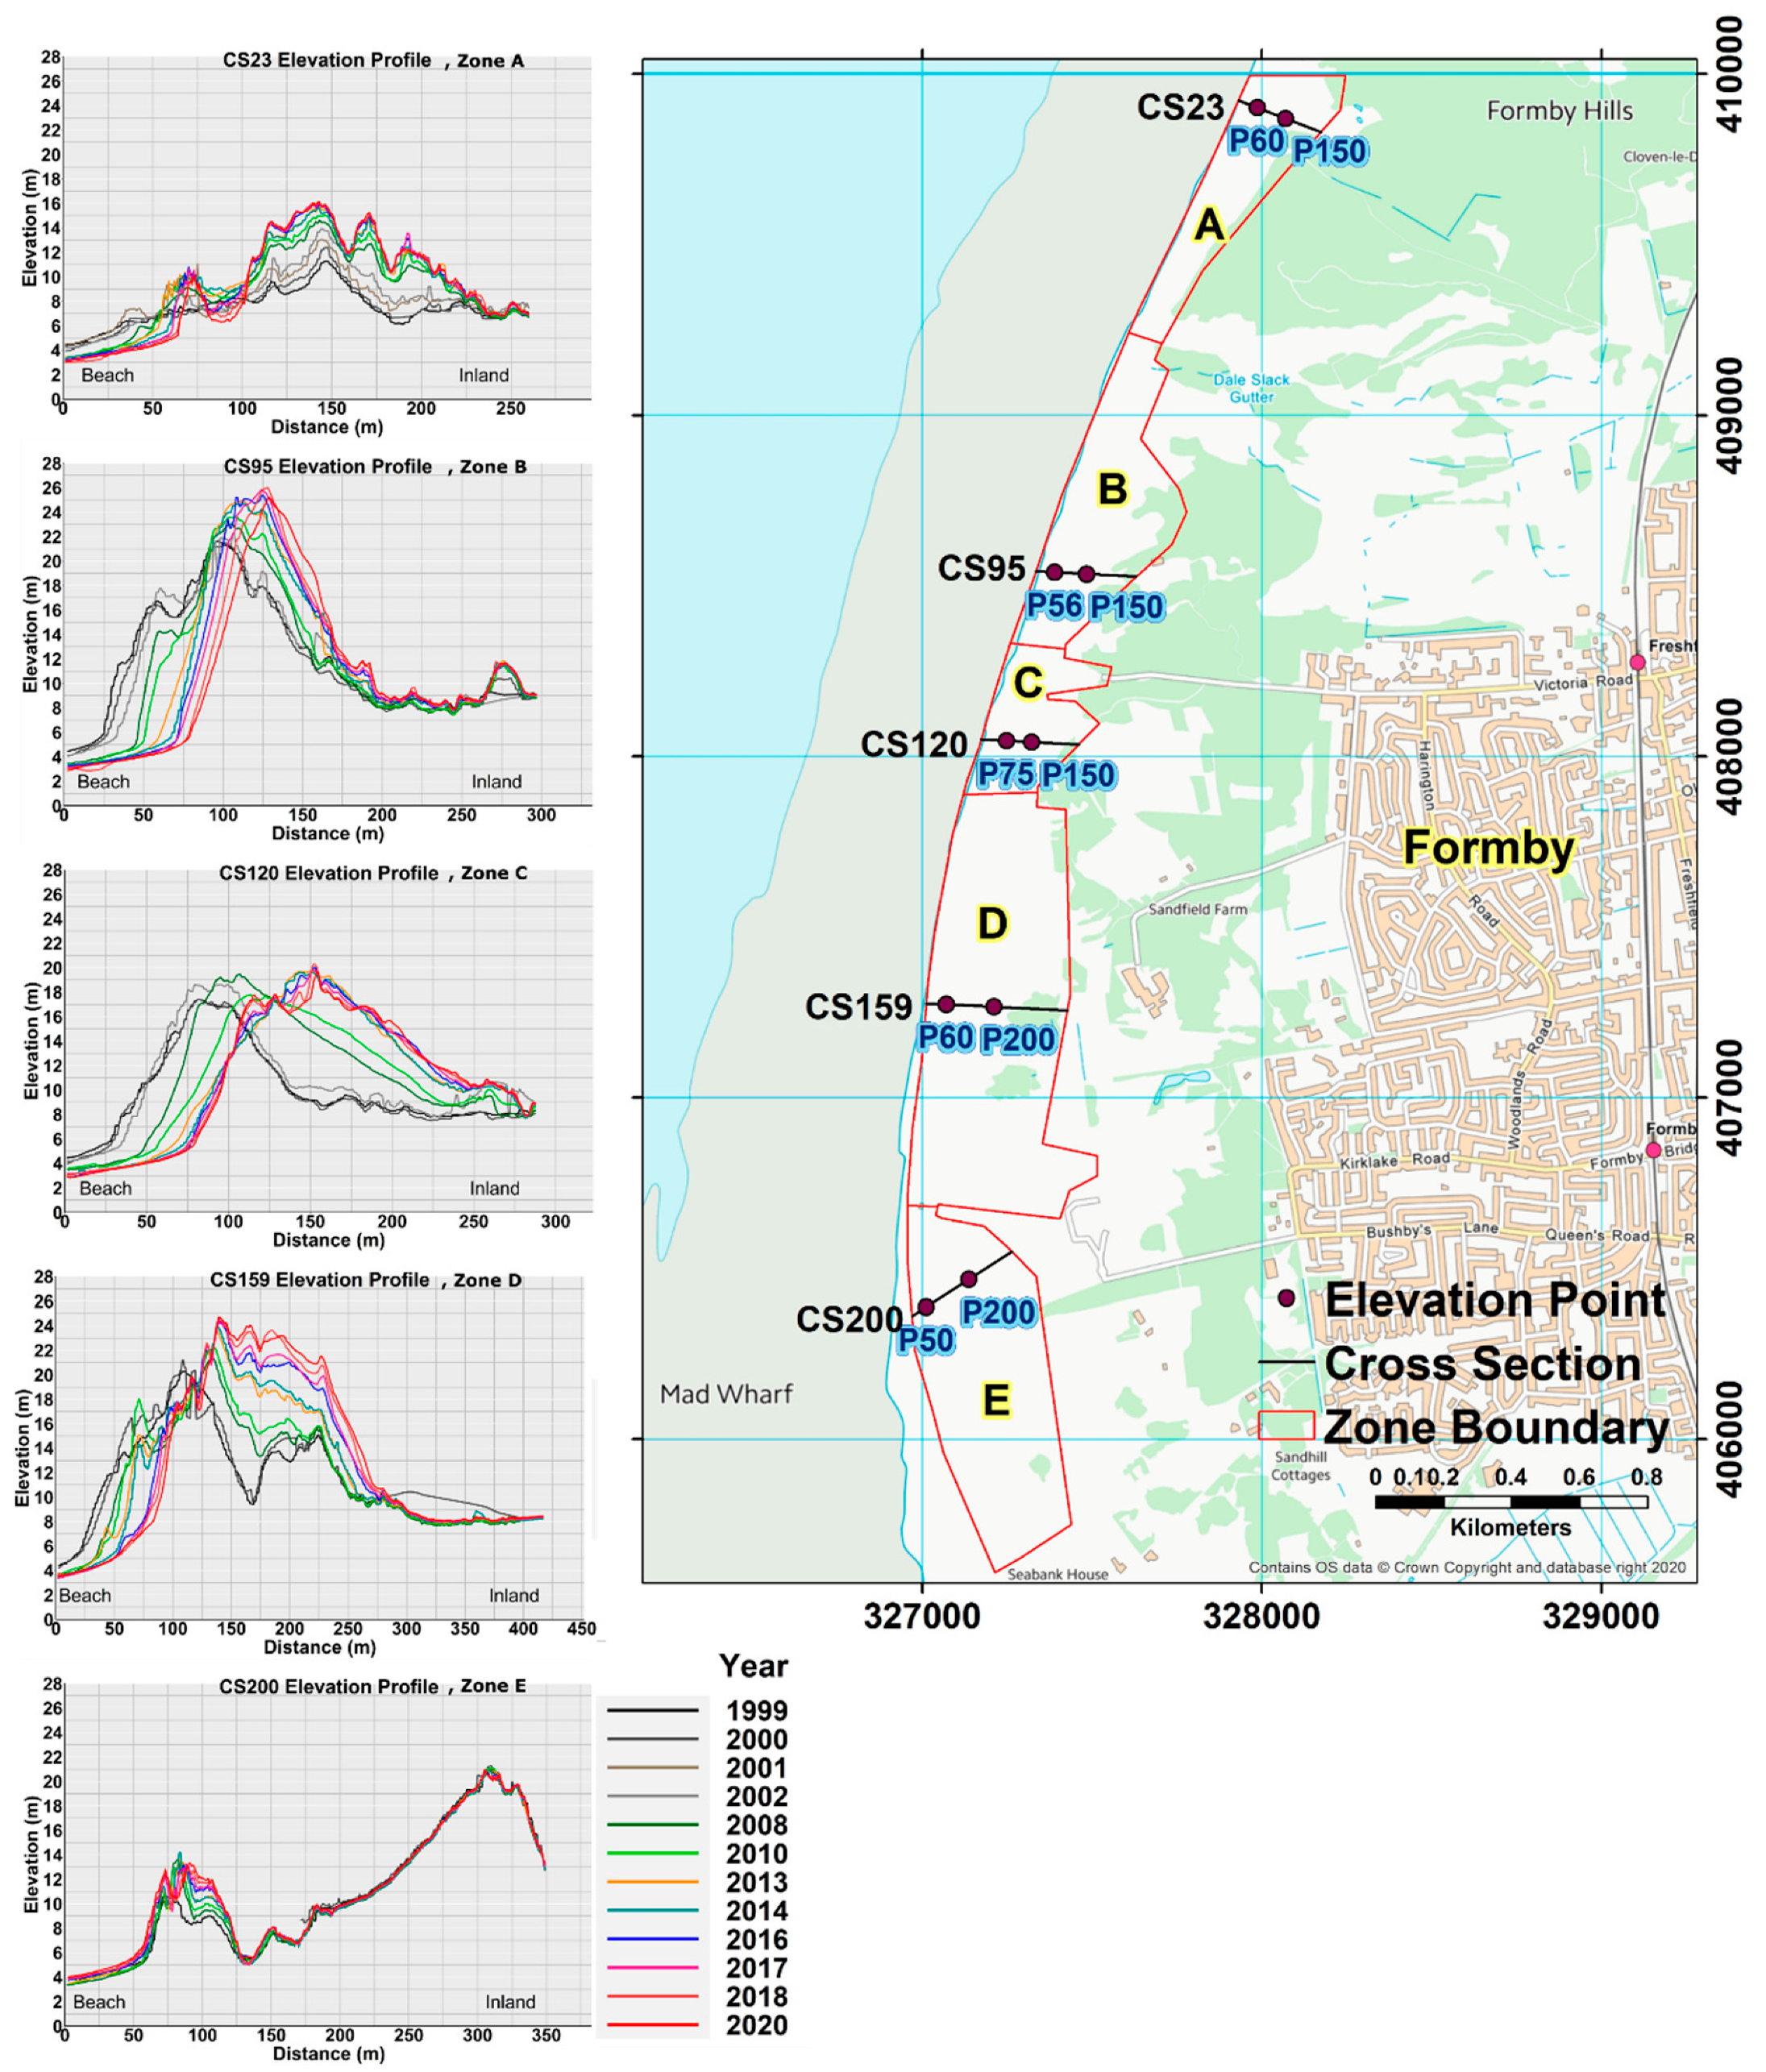
We divided the study area into five zones, A, B, C, D, and E, that have an area of 0.16 km
2, 0.22 km
2, 0.11 km
2, 0.48 km
2, and 0.33 km
2, respectively, based on location along the coast, geomorphological characteristics, and the presence/absence of vegetation (
Figure 1). Zones B, D, and E have a significant presence of vegetation. Zone A consists of a narrow dune system while zone C has a deep dune system extending up and over Victoria Road.
3. Data and Methods
3.1. Data
In this study, we used airborne LiDAR digital terrain models (DTMs) acquired by the Environment Agency and available at
https://environment.data.gov.uk/ (accessed on 17 August 2021), with a vertical accuracy less than ±15 cm [
38] and horizontal accuracy of ±40 cm [
39]. The accuracy of the LiDAR data was validated by ground truth points with a vertical accuracy of ±0.03 m. The LiDAR surveys were undertaken in the winter months [
40]. We used all the available LiDAR DTMs that cover our study area between 1999 and 2020. All data are projected to the OSGB 1936 British National grid coordinate system.
Table 1 illustrates the LiDAR DTMs and their coverage of the study area.
3.2. Methodology
Conservation and monitoring projects are carried out by the local authorities at Formby. This work involves the use of observation technologies, historical maps, and aerial imagery to improve the analysis and predictions of coastal changes [
31]. On the ground, the establishment of brushwood fences and beach grass planting to the North of Lifeboat Road, and wooden fences north of Victoria Road and Freshfield, are applied to nurture the dune accumulation process [
3]. In the UK, the removal of vegetation bushes on dunes is suggested in order to make the dune more hospitable for biodiverse natural habitats [
6]. All these measures have an impact on the dynamics of the dunes, and there is a strong need to take into consideration extreme assessments.
The study area was segmented into beach and dunes by manually digitizing the inflexion points in the boundary between the beach and the dunes. This allowed the authors to draw a much-detailed comparison of the dynamics of the coastal dunes at Formby.
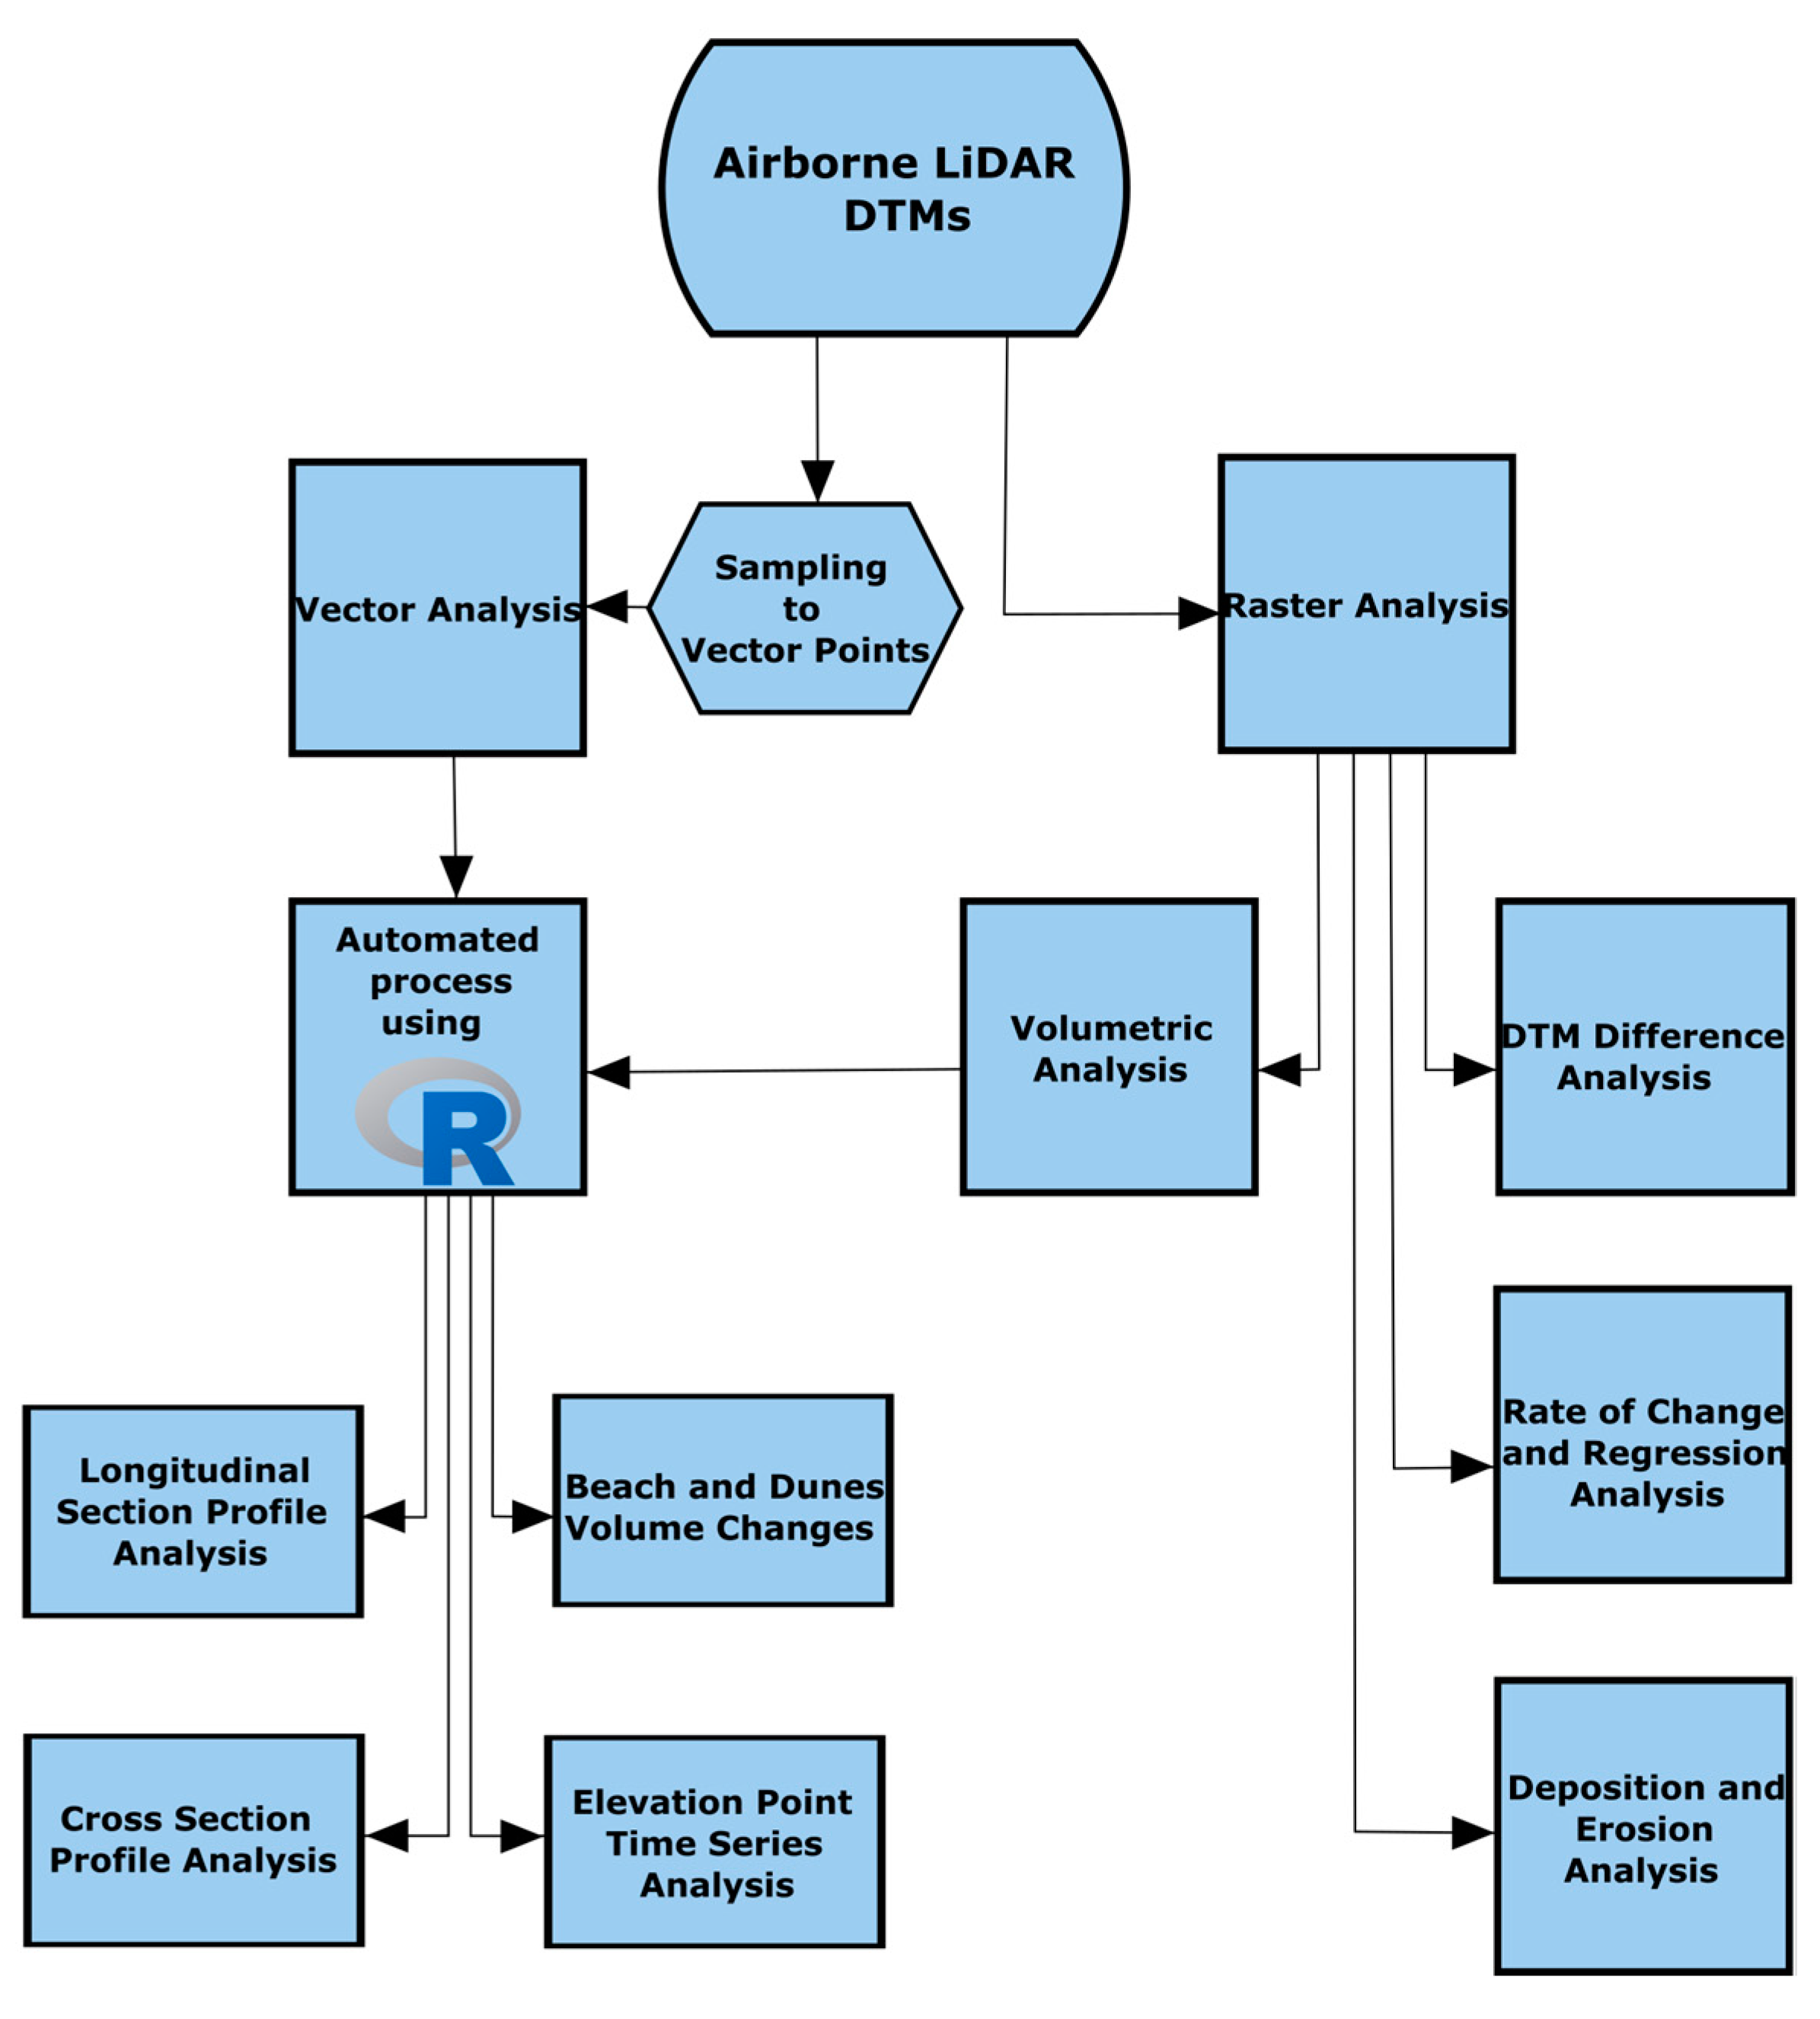
We developed a framework for monitoring dune changes from time series DTMs at all scales: dune point elevation changes, cross sectional profiles, longitudinal profiles, and deposition/erosion and volumetric changes for dune field elevations. This study aims to investigate the activity of sand dunes at Formby coast based on raster and vector analysis. To understand the actual changes in Formby dunes, we have used the actual elevation values of the DTMs. We used R and GIS software (QGIS and ArcGIS) to analyse the LiDAR data. The framework shown in
Figure 2 consists of two main steps: (1) raster analysis which includes DTM difference analysis, rate of change and regression analysis, deposition and erosion analysis, and volumetric analysis; (2) an automated process for vector analysis which involves carrying out elevation profile and time series analysis.
A preliminary step for the raster analysis consists of cropping the DTMs to the study area using the ‘extract by mask’ tool in ArcGIS and then calculating the DTM of difference (DoD) between a primary DTM (i.e., 1999) and a secondary DTM (i.e., 2008–2020) using the raster calculator tool. The DTMs of 2000, 2001, and 2002 are excluded from all the raster analysis steps due to the variation in the area they cover. We also resampled the DTMs to 2 m spatial resolution using the bilinear interpolation method to ensure that the raster analysis is executed consistently. The bilinear method calculates the new pixel value by computing a weighted distance average of the four nearest input pixel centres [
41].
We conducted a linear regression analysis to determine the rate of change in the elevation of the dune points at Formby and to assess the dynamics of the dunes in each zone in the study area. The rate of change and regression analysis was computed using the ‘curve fit’ tool, which is an ArcMap extension developed by Upper Midwest Environmental Sciences Center (UMESC) [
42] to perform a linear regression analysis on the resampled LiDAR DTMs. The curve fit tool is a computationally intense process, it works on the pixel level of the provided DTMs to produce a velocity map showing the rate of change in elevation for each pixel within the study area. This provides a statistical reference for the dynamic dune elevation changes at Formby, determining the deposition and erosion rate of change of the beach and dunes.
To compute the volumes of the study area in each year, we used the ‘raster surface volume’ tool in QGIS. The volume is calculated above the mean sea level. The result of this step is presented as bar charts drawn in R to show the beach and dune volume changes over the years. This was followed by another volumetric analysis using the spatial analysis ‘cut and fill’ tool in ArcGIS to calculate the volume erosion and deposition changes. The tool calculates the volume changes between corresponding areas in the prior DTM (i.e., 1999) and the post DTM inputs (i.e., 2008–2020). The result is a raster with its values showing the areas of erosion and deposition in the study area.
For the vector analysis, we used 237 east-west profiles with a north-south interval of 20 m between every cross section, and a sample point every 1 m along each cross section. These cross sections stretch over the beach and inland areas in a perpendicular direction to the shoreline. These provide information about the orientation and slope changes of the dunes. An initial step of the vector analysis requires converting the raster DTMs into points in ArcGIS using the ‘extract multi values to points’ tool. This tool assigns all the corresponding values from all the DTMs inputs to the cross-section vector point shapefiles. This process resulted in 67,400 points on all cross sections. The average length of the cross-sections is 185 m, 243 m, 257 m, 398 m, and 332 m in zones A, B, C, D, and E, respectively.
The longitudinal sections provide another view that reflects the south-north movement of the dunes due to longshore sand drifts. We present two longitudinal section profiles to show the impact of the waves and winds in changing the beach, and the south-north movement of the dunes. These also illustrated the variation in elevation along the whole beach and dunes, which provided a way of comparing the dynamics of the dunes in each zone.
An elevation point time series analysis is drawn from the cross-section vector data points. This analysis is separate from the regression results, which show the rate of elevation change in each pixel. The elevation point time series analysis is another way of displaying the changes in elevation for a single point of interest. Such a type of analysis is suitable for any time series application. It has been used here to illustrate the changes in elevation for individual points along the beach and dunes at Formby.
We developed an automated process using R to perform the elevation profile and time series analysis. The code analyzed 237 cross-section profiles, longitudinal section profiles, and elevation points by generating line charts that illustrate the changes in elevation over the study period, providing a detailed interpretation of Formby dune dynamics.
4. Results
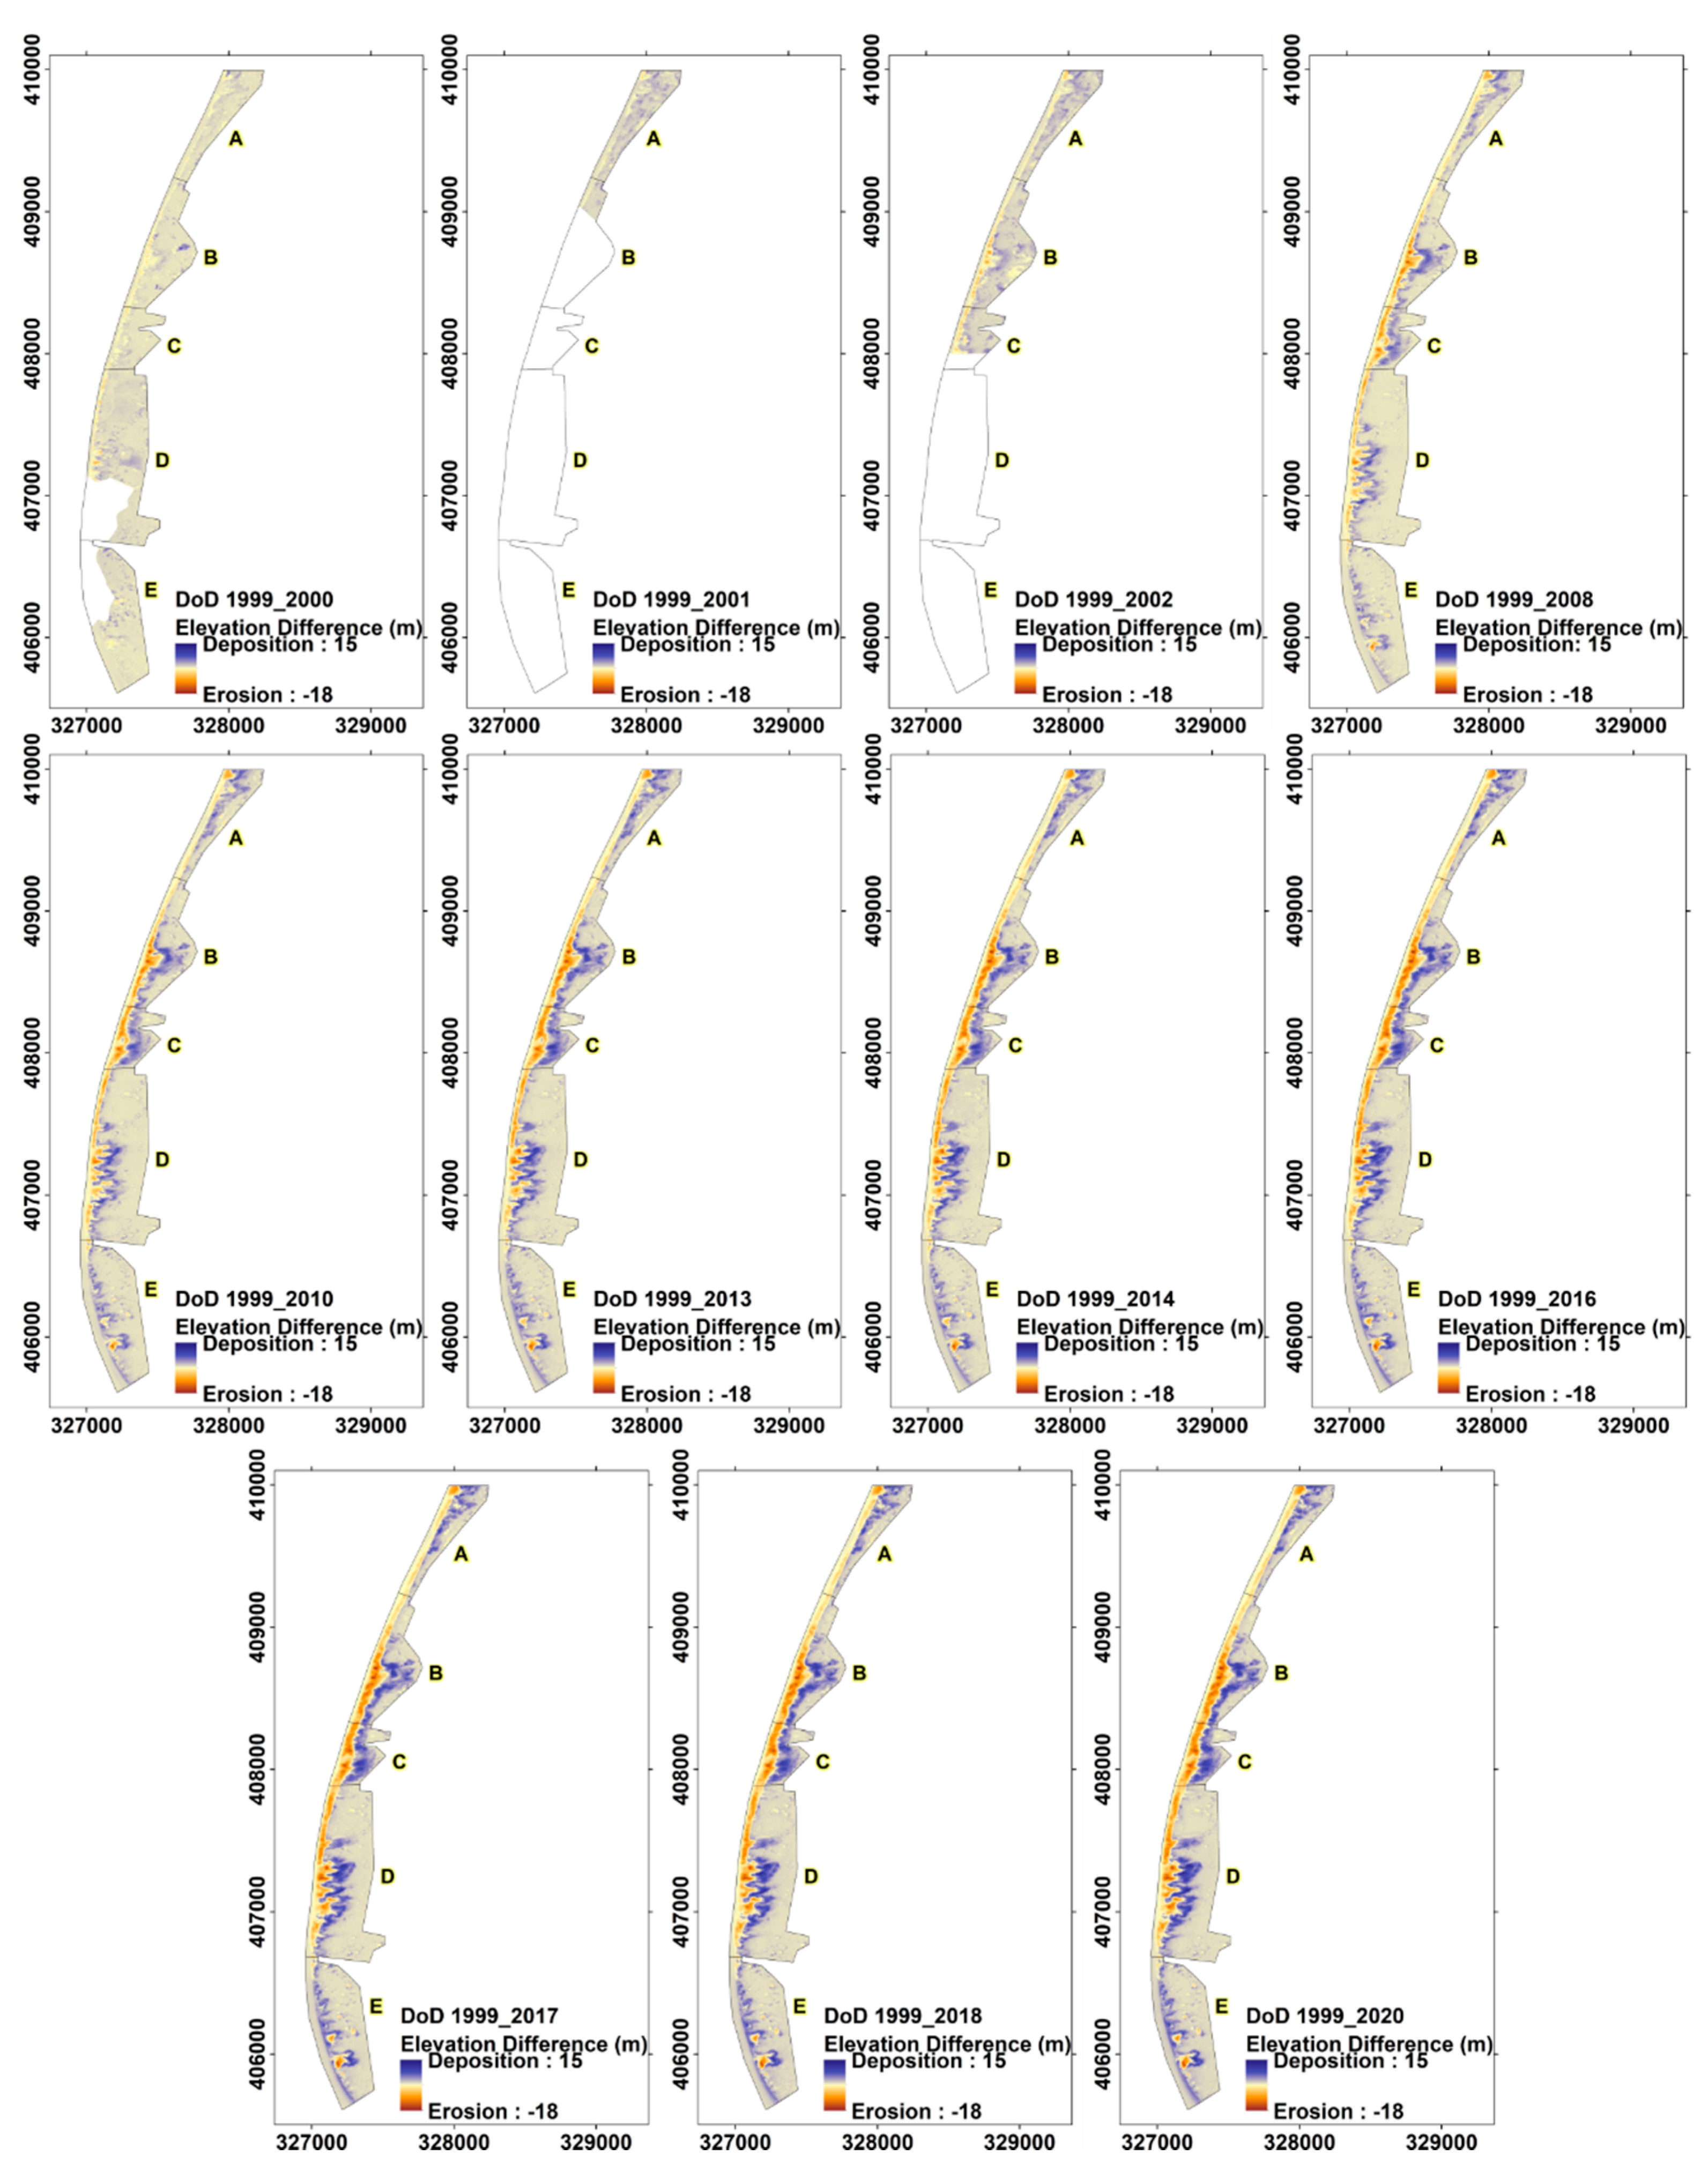
4.1. DTM of Difference (DoD)
In this section, we carried out an analysis using the available DTMs at Formby to understand the horizontal and vertical changes in the dunes that occurred over a duration of 21 years. The DTM of difference results show that the elevation changes in the study area varied between a maximum height increase of 18 m and a maximum decrease of 15 m (
Figure 3). Progressively increasing erosion is observed in the frontal dunes of zones B, C, and D, in addition to the north part of zone A, with an average elevation difference ranging from −11 m to −6 m (
Figure 3). Areas to the east of these frontal dunes have seen significant deposition, while the frontal dunes of zone E have also seen similar deposition with an average elevation difference ranging between 2 m and 5 m. Inland semi-fixed dunes with vegetation presence had minimal elevation differences ranging between −0.2 m and 0.3 m. The beach area of zone E has had a slight elevation increase with an elevation difference ranging between 0.05 m and 0.5 m.
Figure 3 shows the DTM of difference maps computed between each year DTM and the primary DTM of 1999.
To see detailed year-by-year changes, we carried out the DTM difference analysis on a sequential basis.
Figures S1–S5 show the difference maps for each zone. The high erosion of the frontal dunes in zones A, B, C, and D in 2014 was a result of the particularly strong storms that hit Formby coast in the winter between December 2013 and February 2014 [
28]. In general, we observed an elevation increase in inland dune areas which is due to the eastward migration of beach sand. Areas with presence of vegetation remained unchanged due to the impact of vegetation in stabilizing sand dunes [
35].
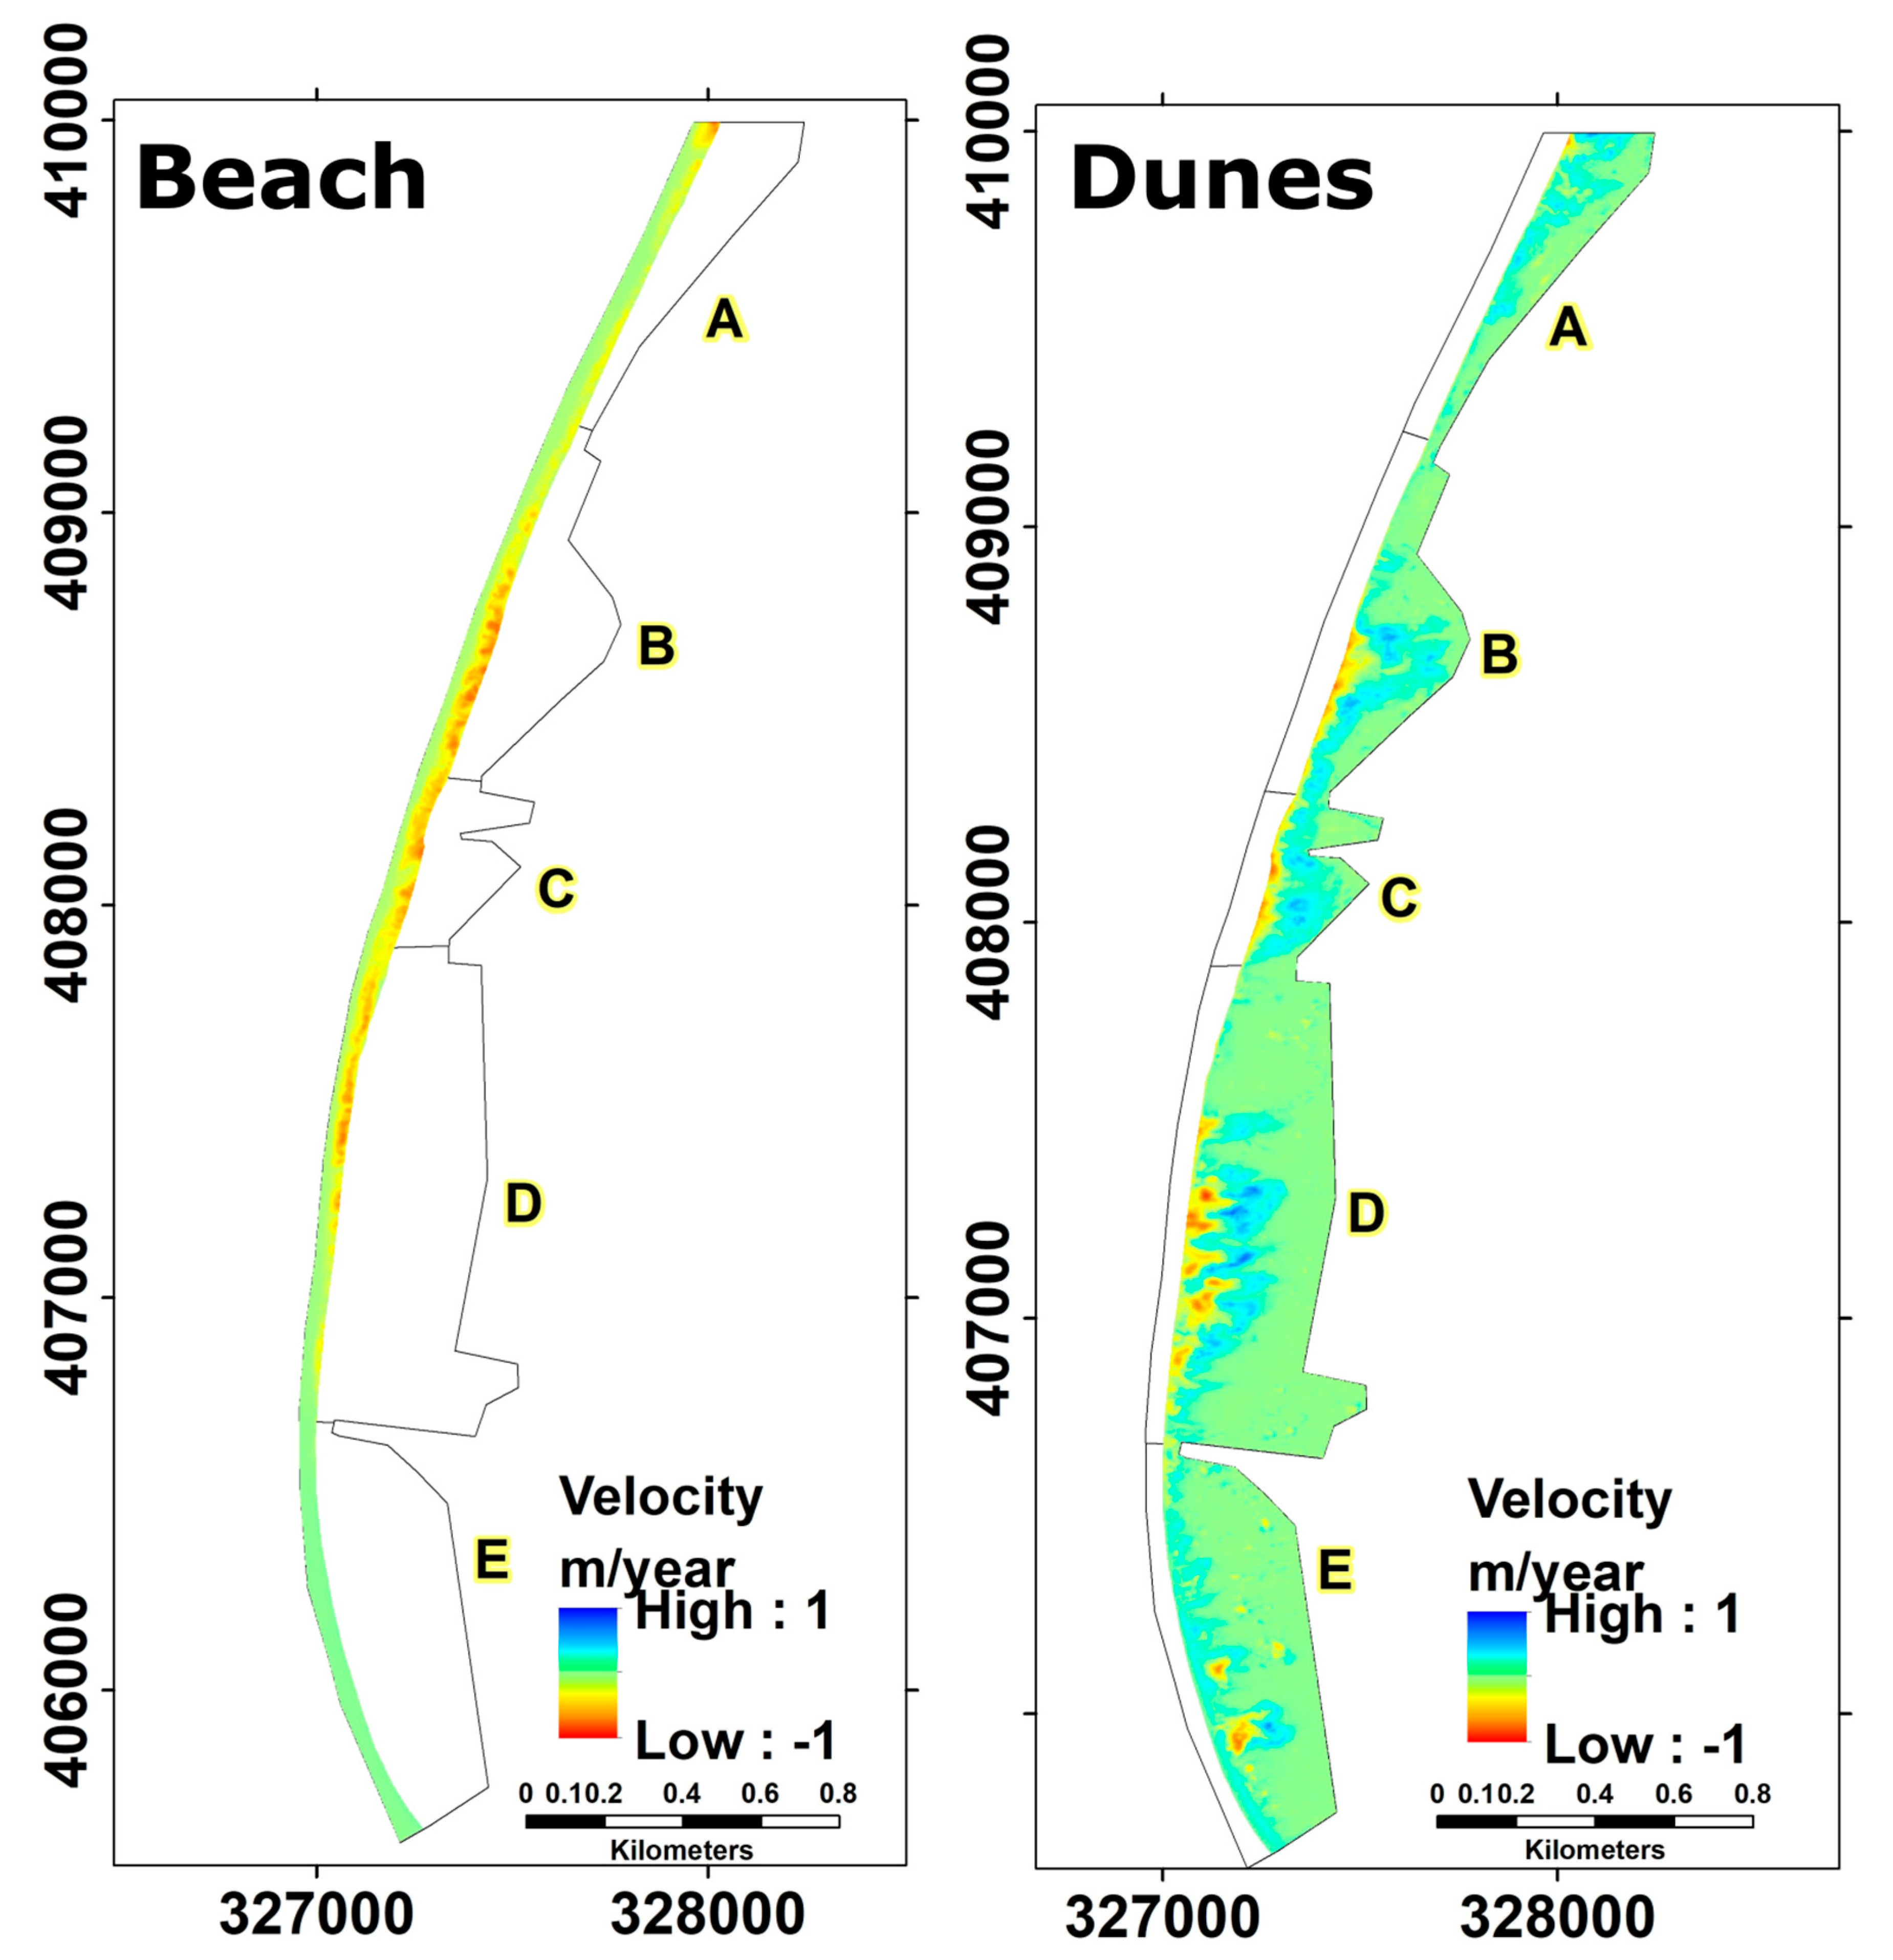
The results from the linear regression analysis computed between 1999 and 2020 illustrate the rate of elevation change ranging between −0.78 and 0.02 m/year and −0.92 and 0.73 m/year for the beach and the dunes, respectively (
Figure 4).
The rate of elevation change shows a significant loss in most of the beach areas and some parts of the frontal dunes, especially in zones B, C, and D. It also illustrates sand deposition in the inner dunes represented by high rates of elevation increase. The beach in zone E has a slight increase in elevation, ranging between 0.01 m and 0.08 m/year, in most of its parts. Areas with the presence of vegetation, mostly more towards inland, in all zones generally remain unchanged.
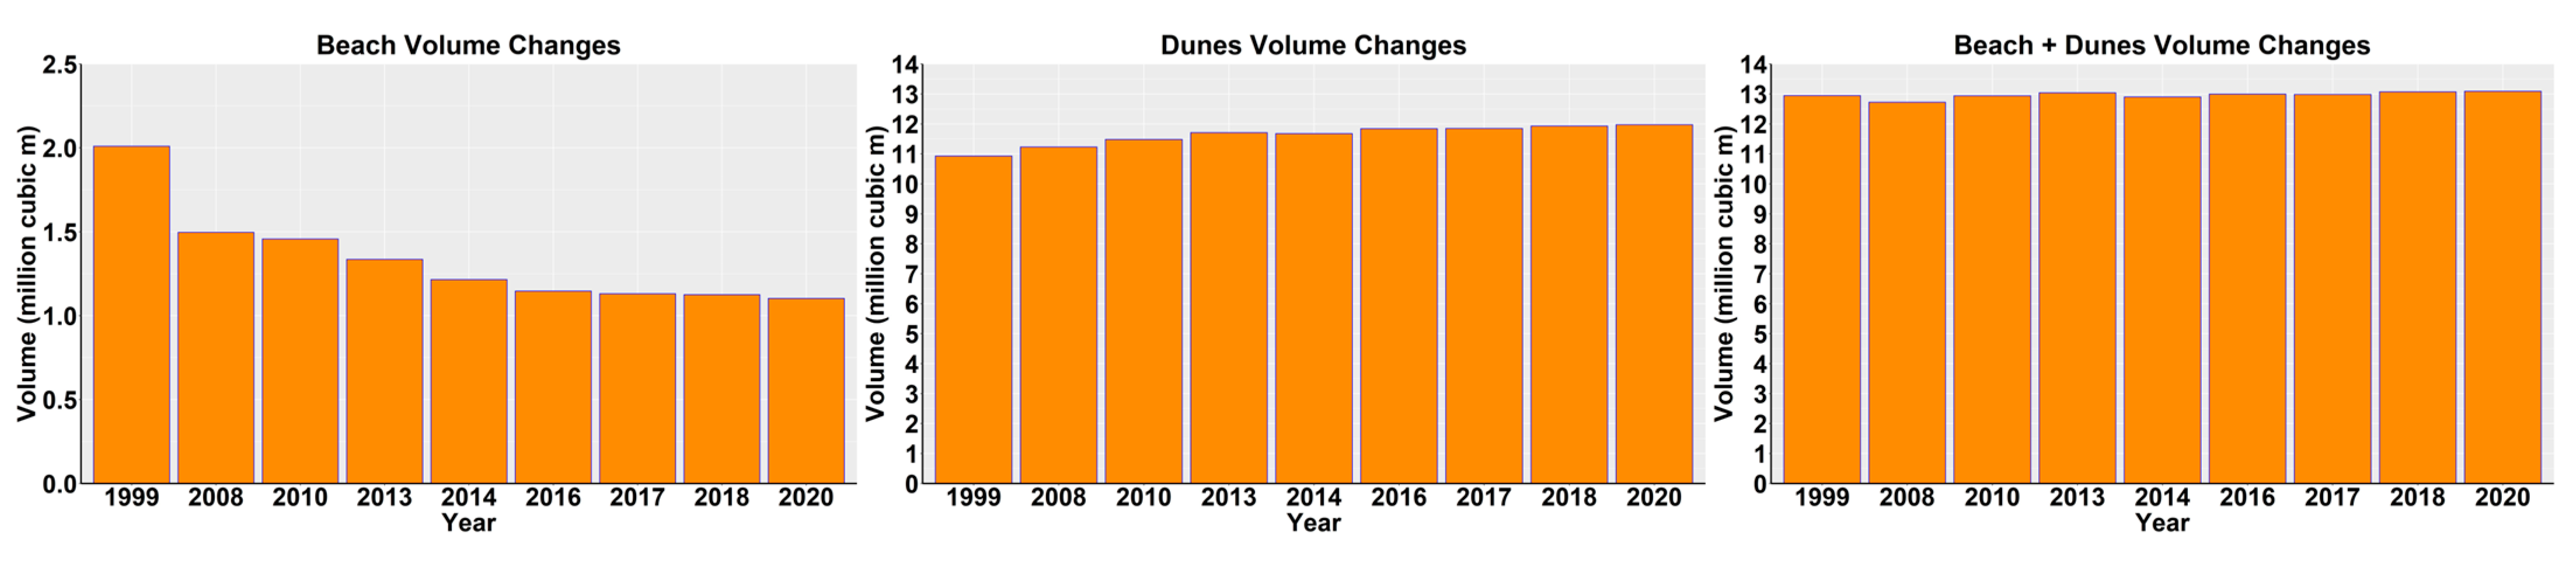
4.2. Volumetric Analysis
We used the raster surface volume tool in QGIS to calculate the volume above the mean sea level. We assumed that the land cover subsurface of all of the study area at Formby is sand that has developed over the years into dunes in some parts.
Figure 5 illustrates the volume changes in the beach and dunes of Formby over the 21 years of measurement.
Overall, Formby beach has had a significant volume loss of about 907,000 m3 in 21 years; about 500,000 m3 were lost between 1999 and 2008 and, in addition, more than 160,000 m3 were lost between 2008 and 2013, and 120,000 m3 were lost between 2013 and 2014. Since then, the beach has gradually continued losing sand with about 110,000 m3 lost between 2014 and 2020.
While Formby dunes saw a volume increase of about 1,049,000 m3 over a period of 21 years, about 306,000 m3 were deposited in the dunes between 1999 and 2008, and about 475,000 m3 were deposited between 2008 and 2013. A sand volume loss of about 32,000 m3 occurred between 2013 and 2014, and this is due to the stormy winter of 2013–2014, after which the dunes continued to grow again, gradually gaining sand, with about 300,000 m3 gained between 2014 and 2020.
The total volume of the entire dune system of Formby (beach + dunes) has seen a very slight increase of about 130,000 m3 over the 21 years.
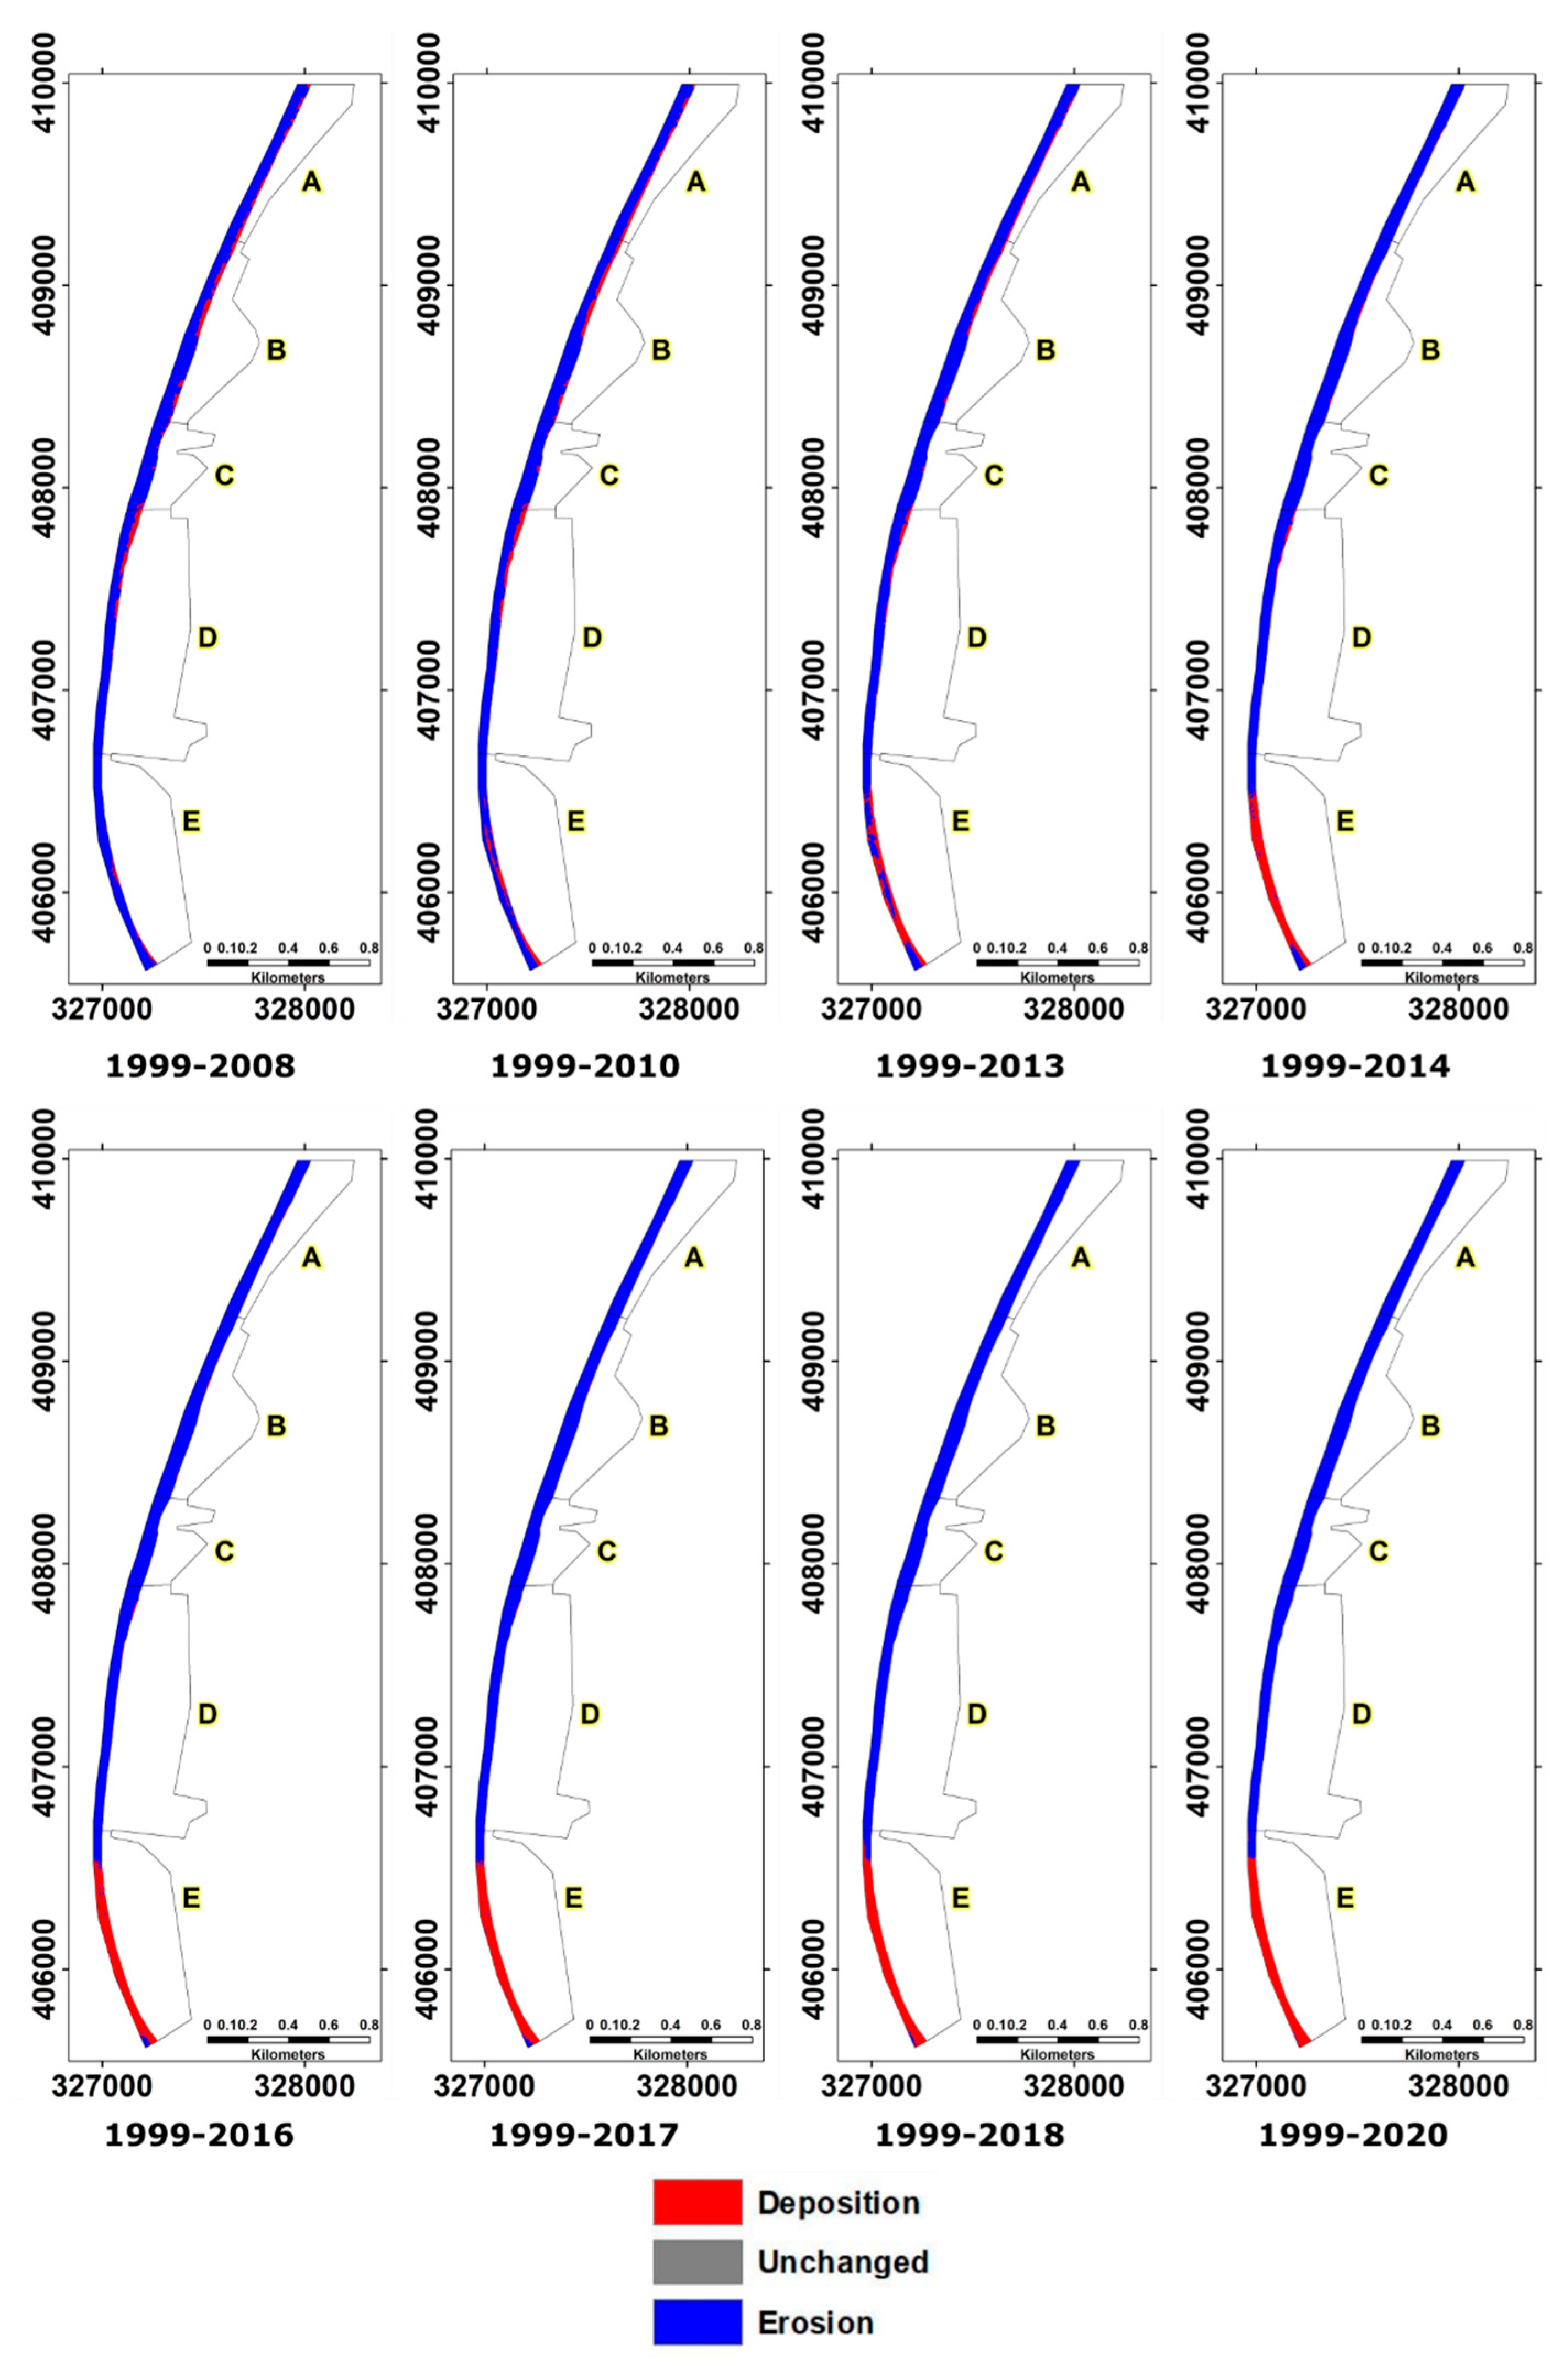
4.3. Deposition and Erosion Analysis
The deposition and erosion analysis provided a detailed map view of the spatial distribution of volume changes that occurred in the beach and dune areas over the study period. The results (
Figure 6) show that the beach areas in zone E had an increase in sand volume due to sand deposition. This started occurring from 2010 onwards, while the rest of the beach areas were losing sand. The erosion of the beach shows that any volume of sand lost from the beach is generally not being recovered, which means that site managers must undertake careful conservation work.
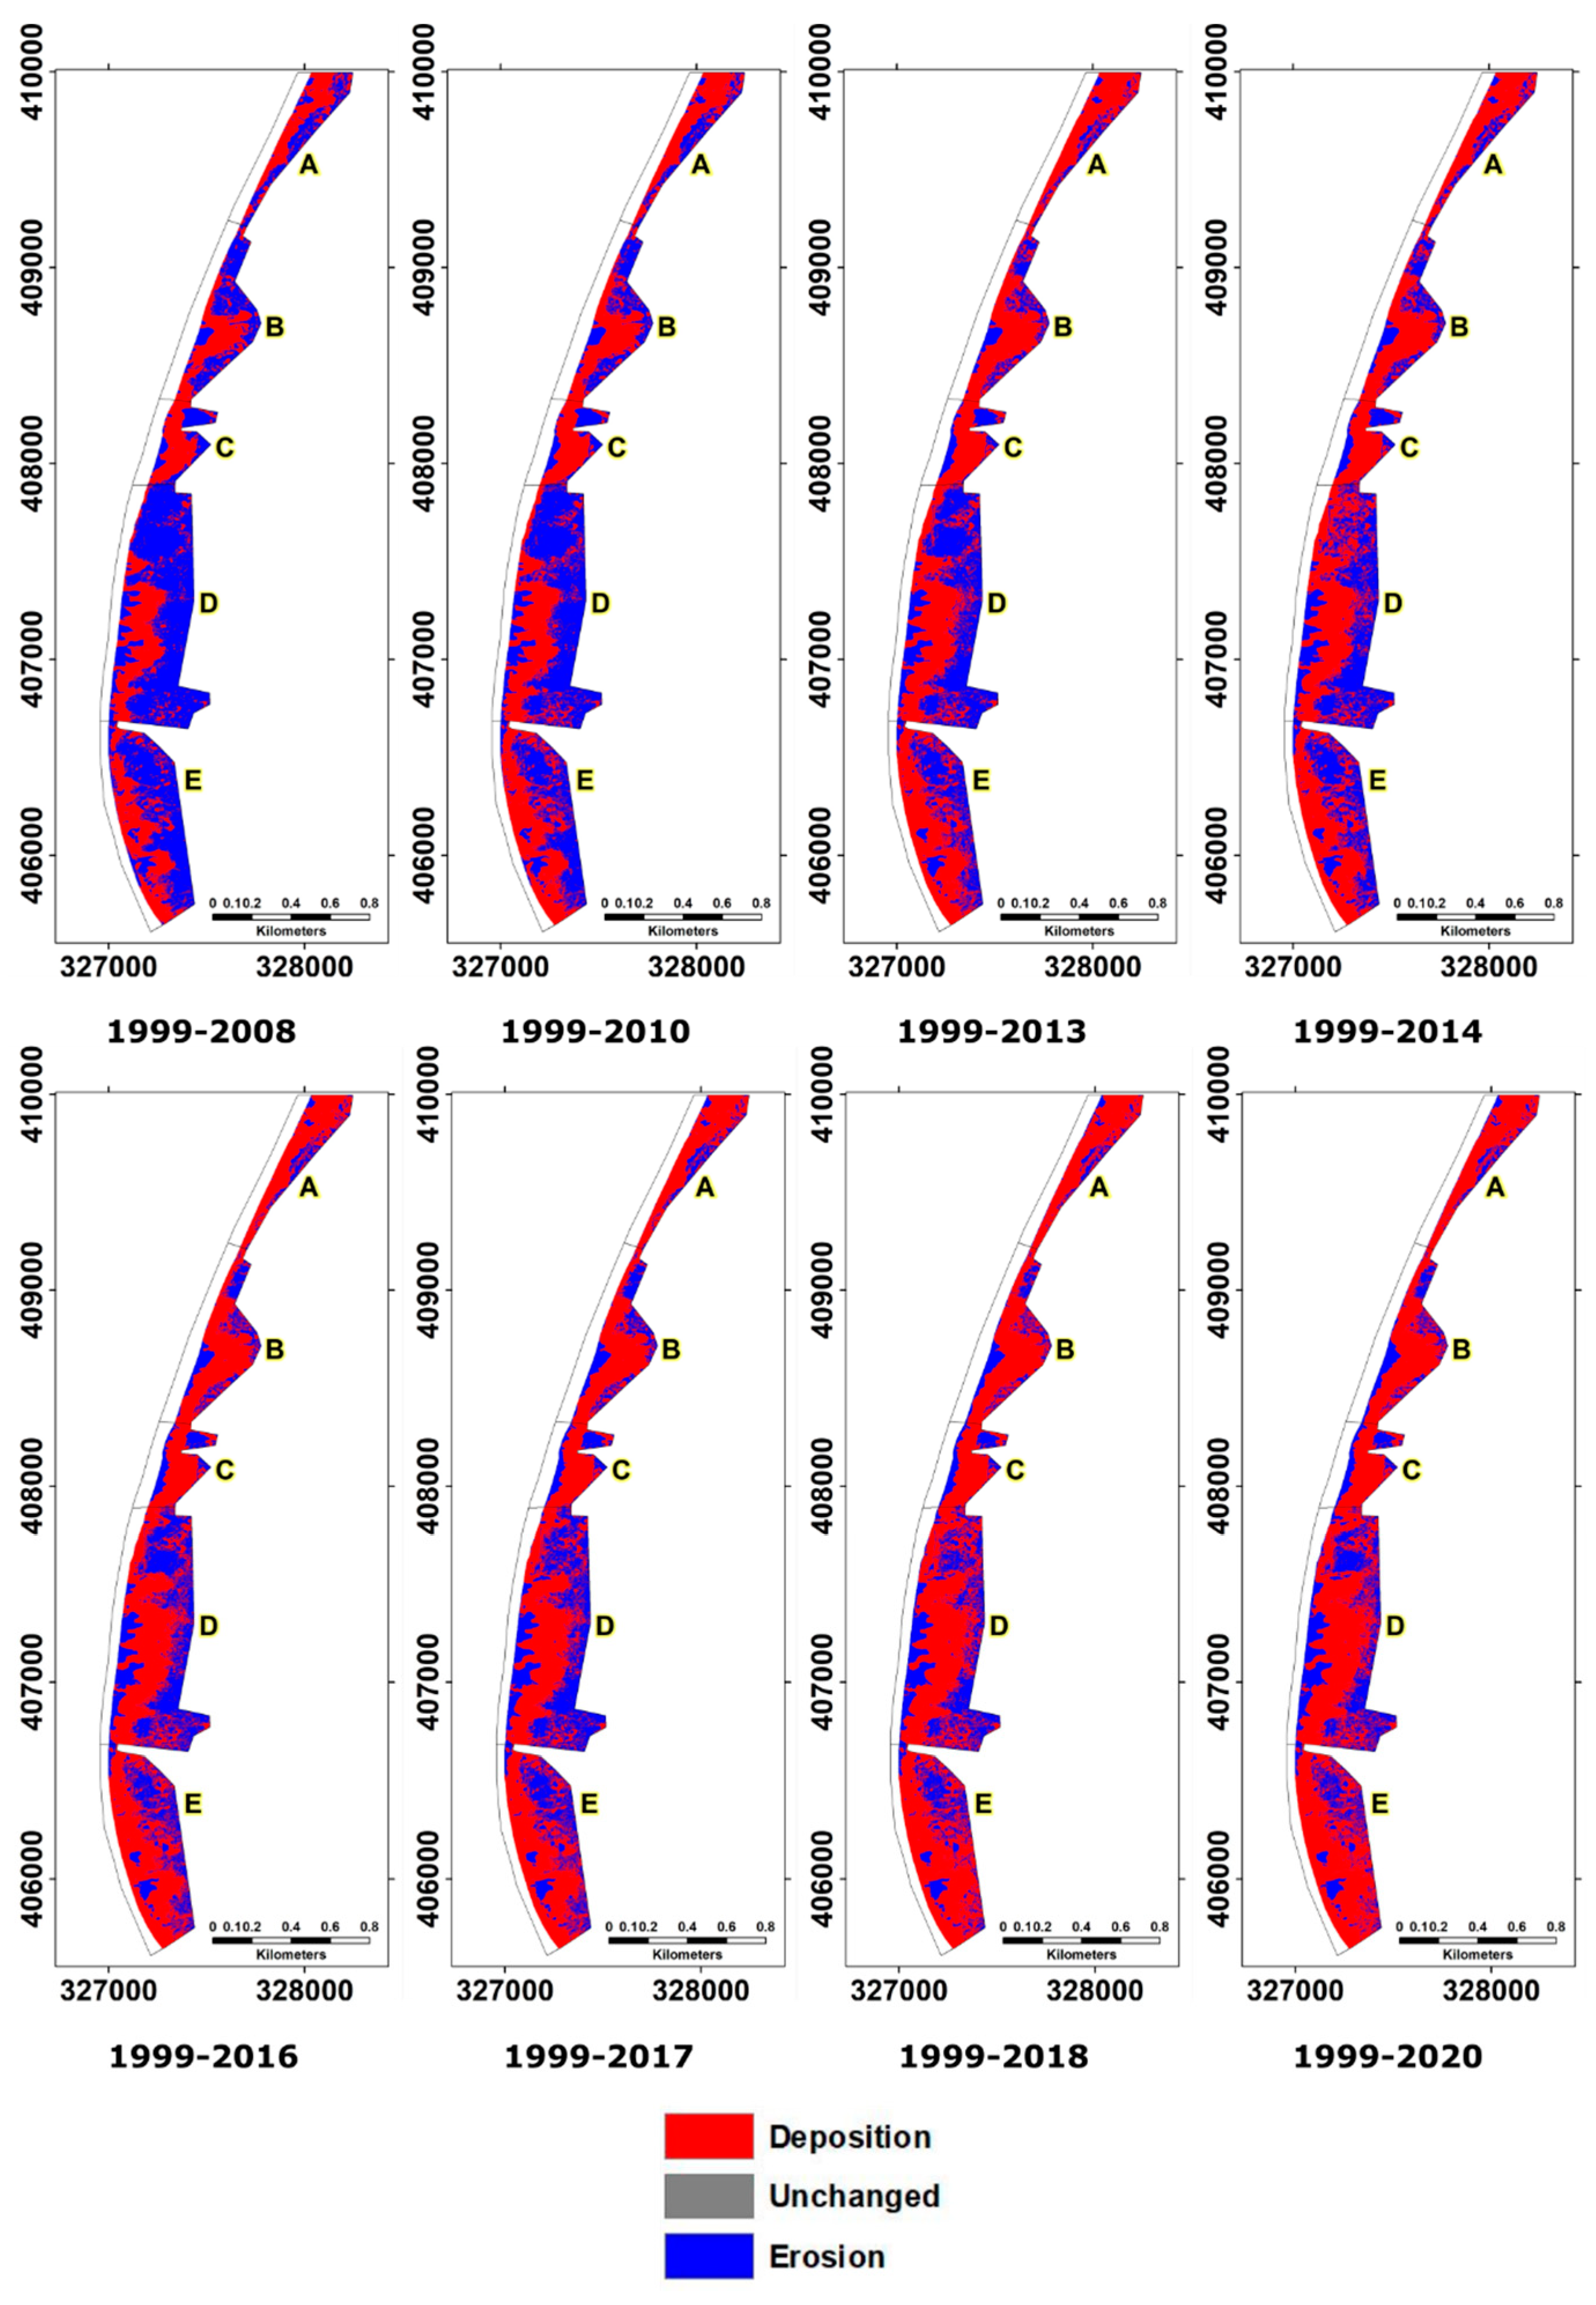
Generally, we can see that the dune areas in all zones have had sand deposition (
Figure 7). The vegetated dune areas also had sand deposition even if this deposition was considerably lower, which indicates that sand is moving inland. This emphasizes the outcome observation from the volumetric analysis (
Figure 5), with the beach losing sand while the dunes are gaining.
Areas classified as “unchanged” were not observed in the beach and dunes deposition/erosion maps. This indicates that the Formby sites dune system is constantly evolving.
4.4. Elevation Profile Analysis
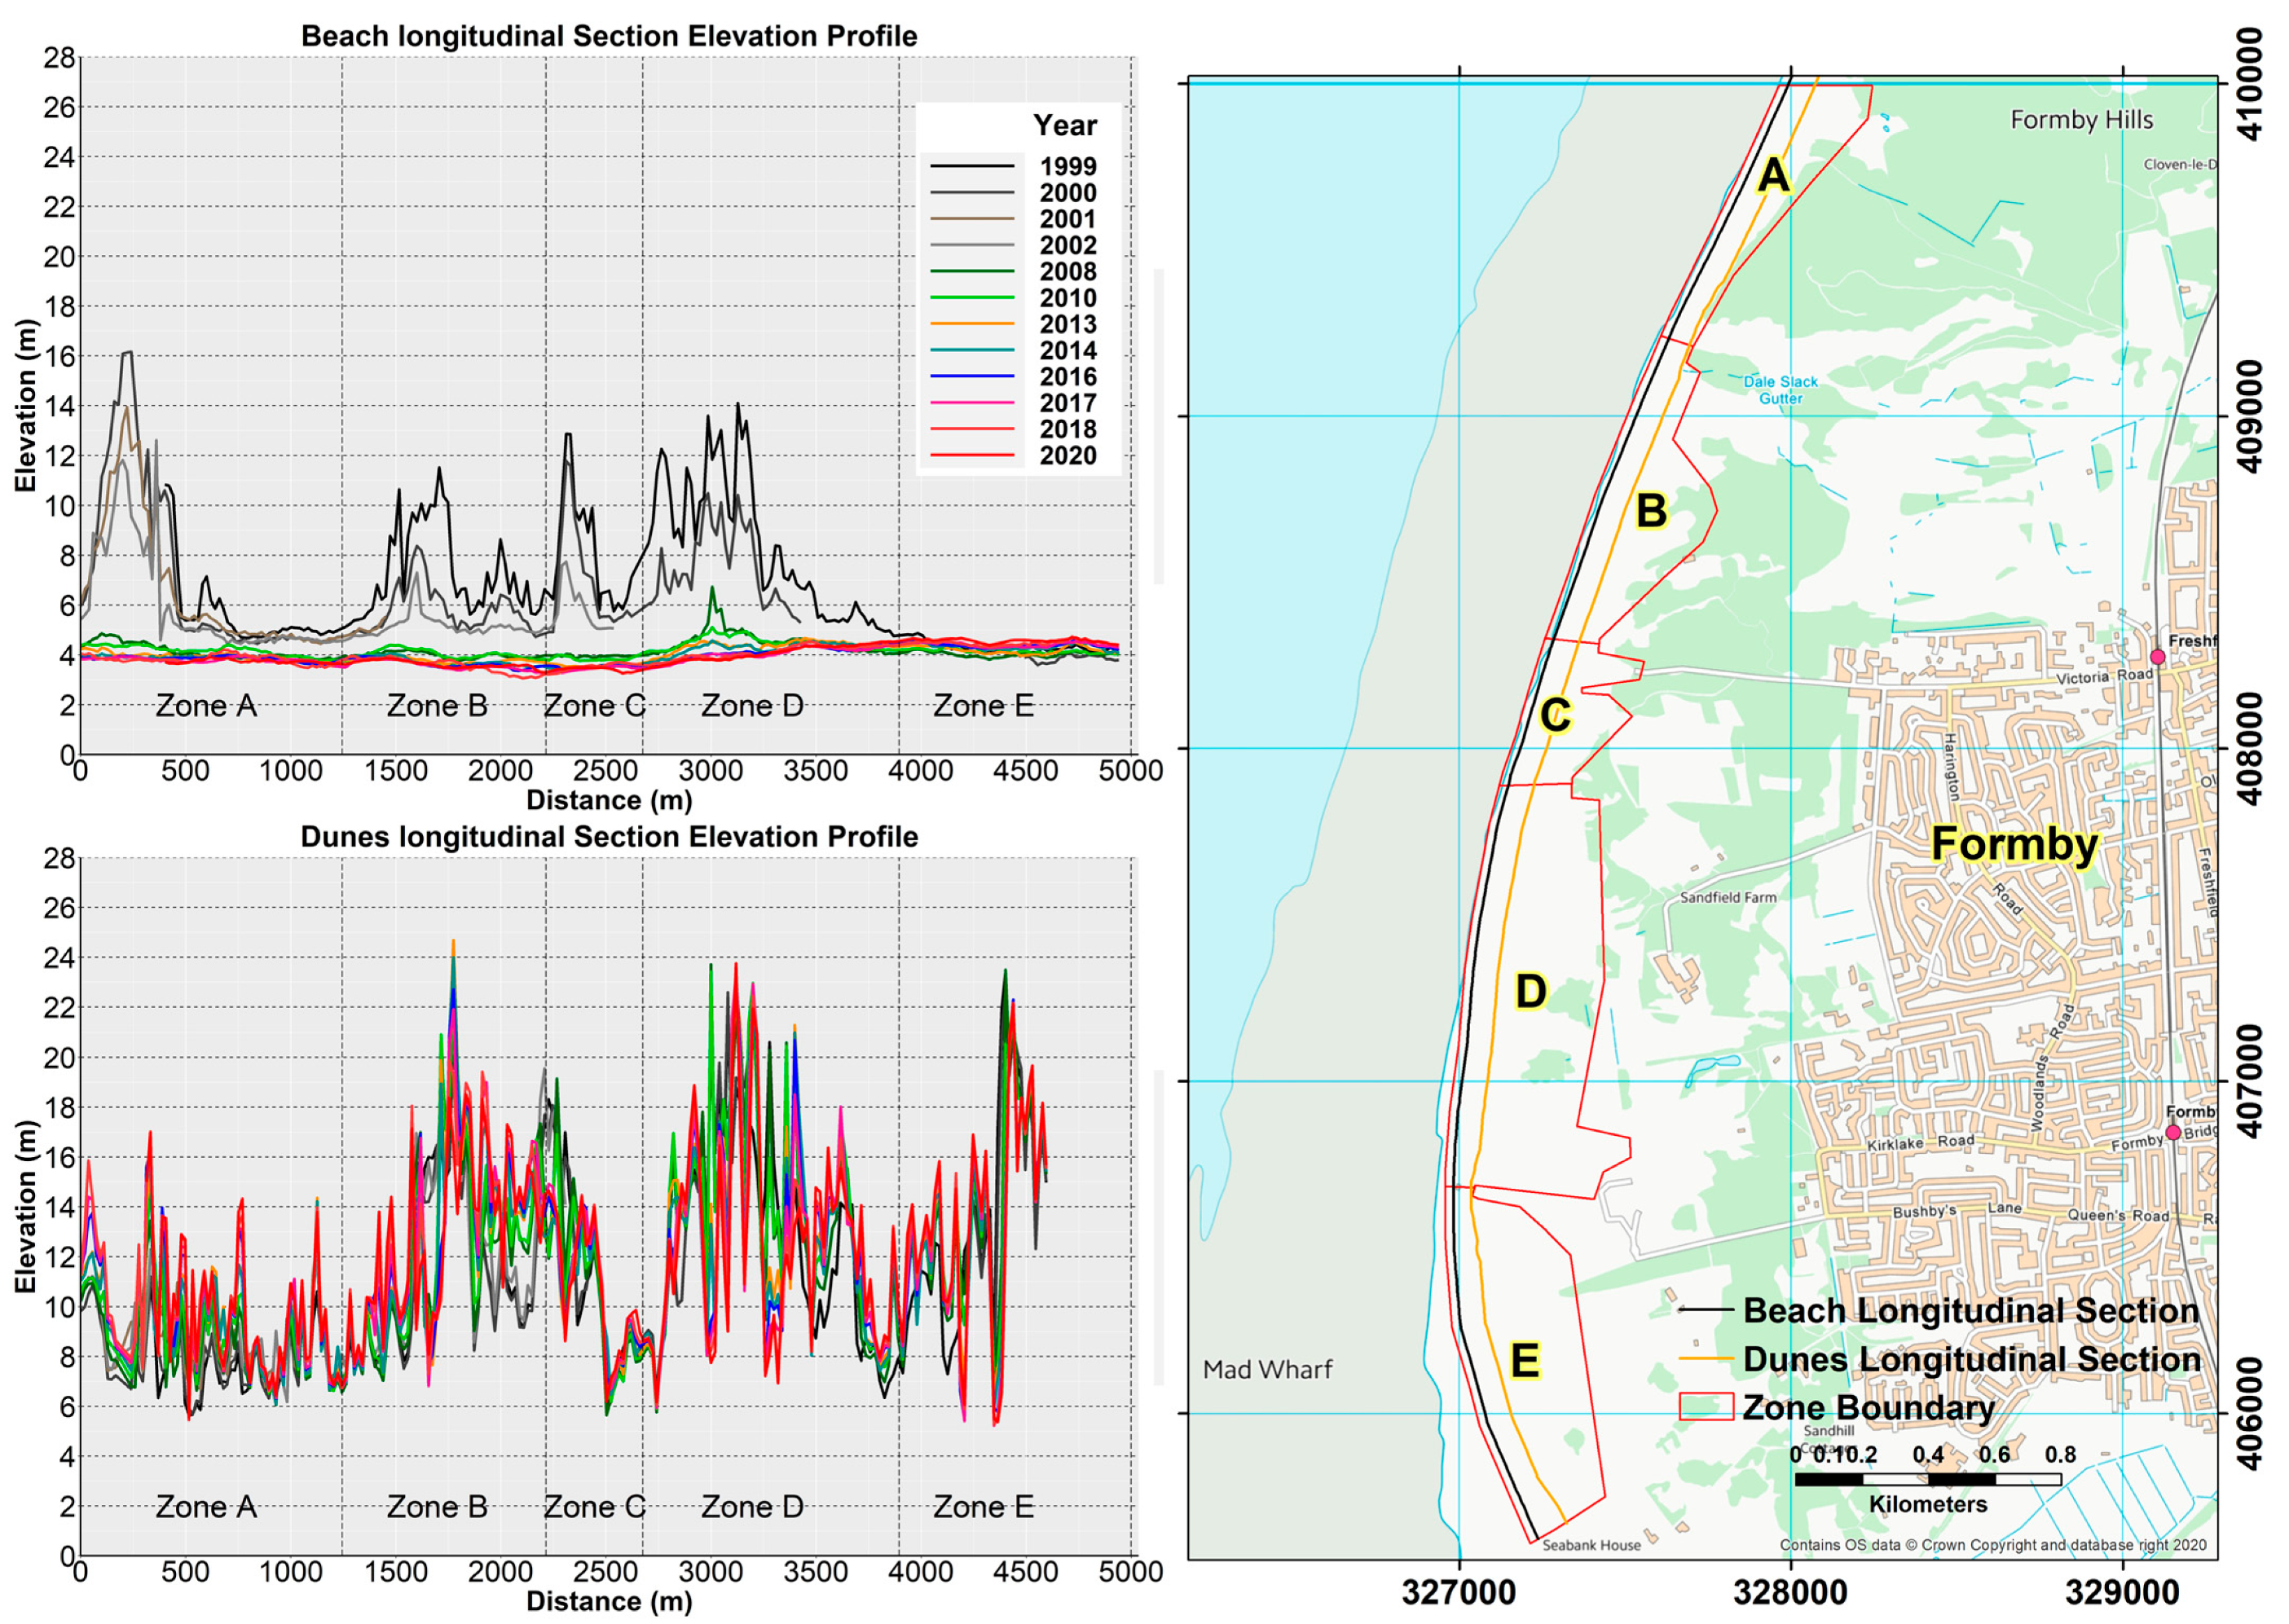
4.4.1. Longitudinal Profiles
The beach longitudinal profile is located at a distance of 25 m inland from the shoreline, while the longitudinal profile over the dunes is located 100 m from the shoreline. Both profiles contain an elevation point measurement every 20 m along the profile. The beach longitudinal profile shows that there has been a significant change in the beach elevation between 1999 and 2008, with a subsidence of 11 m, 6 m, 8 m, and 9 m, from zone A, zone B, zone C, and zone D, respectively (
Figure 8). Most of this change occurred between 1999 and 2008, while it has seen a decrease of about 0.5 m between 2008 and 2020. The elevation along zone E increased by about 0.5 m in 21 years.
The longitudinal profile over the dunes shows significant changes in the elevation of the inner dunes (
Figure 8). The irregularity of the dunes longitudinal elevation profile illustrates the dune’s topographical complexity. Generally, the dunes in zone A have increased by about 4 m. Dunes in zones B, D, and the more southerly parts of E tend to have higher elevations, ranging from (18 m to 25 m). The dunes in the southern part of zone C have the lowest height, ranging from (8 m to 10 m), and the dunes are seeing significant erosion and deposition in the northern part with elevation differences of about 6 m, while the dunes in the southern part of zone C have had a slight increase in elevation of about 2 m.
4.4.2. Cross Section Profiles
The cross-section profiles, which run perpendicular to the coastline, reveal information about the horizontal and vertical movement of the dunes.
Figure 9 shows selected cross sections to reflect the elevation changes in and along cross sections CS23, CS95, CS120, CS159, and CS200 in zones A, B, C, D, and E, respectively.
The dune profile changes over time show the horizontal migration of the frontal dunes during the measurement period (1999–2020). In zones A, B, C, and D, the dunes migrated by about 50 m inland, while the frontal dunes in zone E migrated about 10 m in the opposite direction towards the sea (
Figure 9). We can also see from CS23 in (
Figure 9) that the dunes had an elevation increase of 5 m between 1999 and 2020 in zone A, while dunes in CS159 had an increase of about 12 m in zone D. The elevation of the inner dunes in Zone E remained unchanged, while the frontal dunes had an increase of about 5 m. This is particularly the case in all the vegetated parts of CS23, CS95, CS159, and CS200.
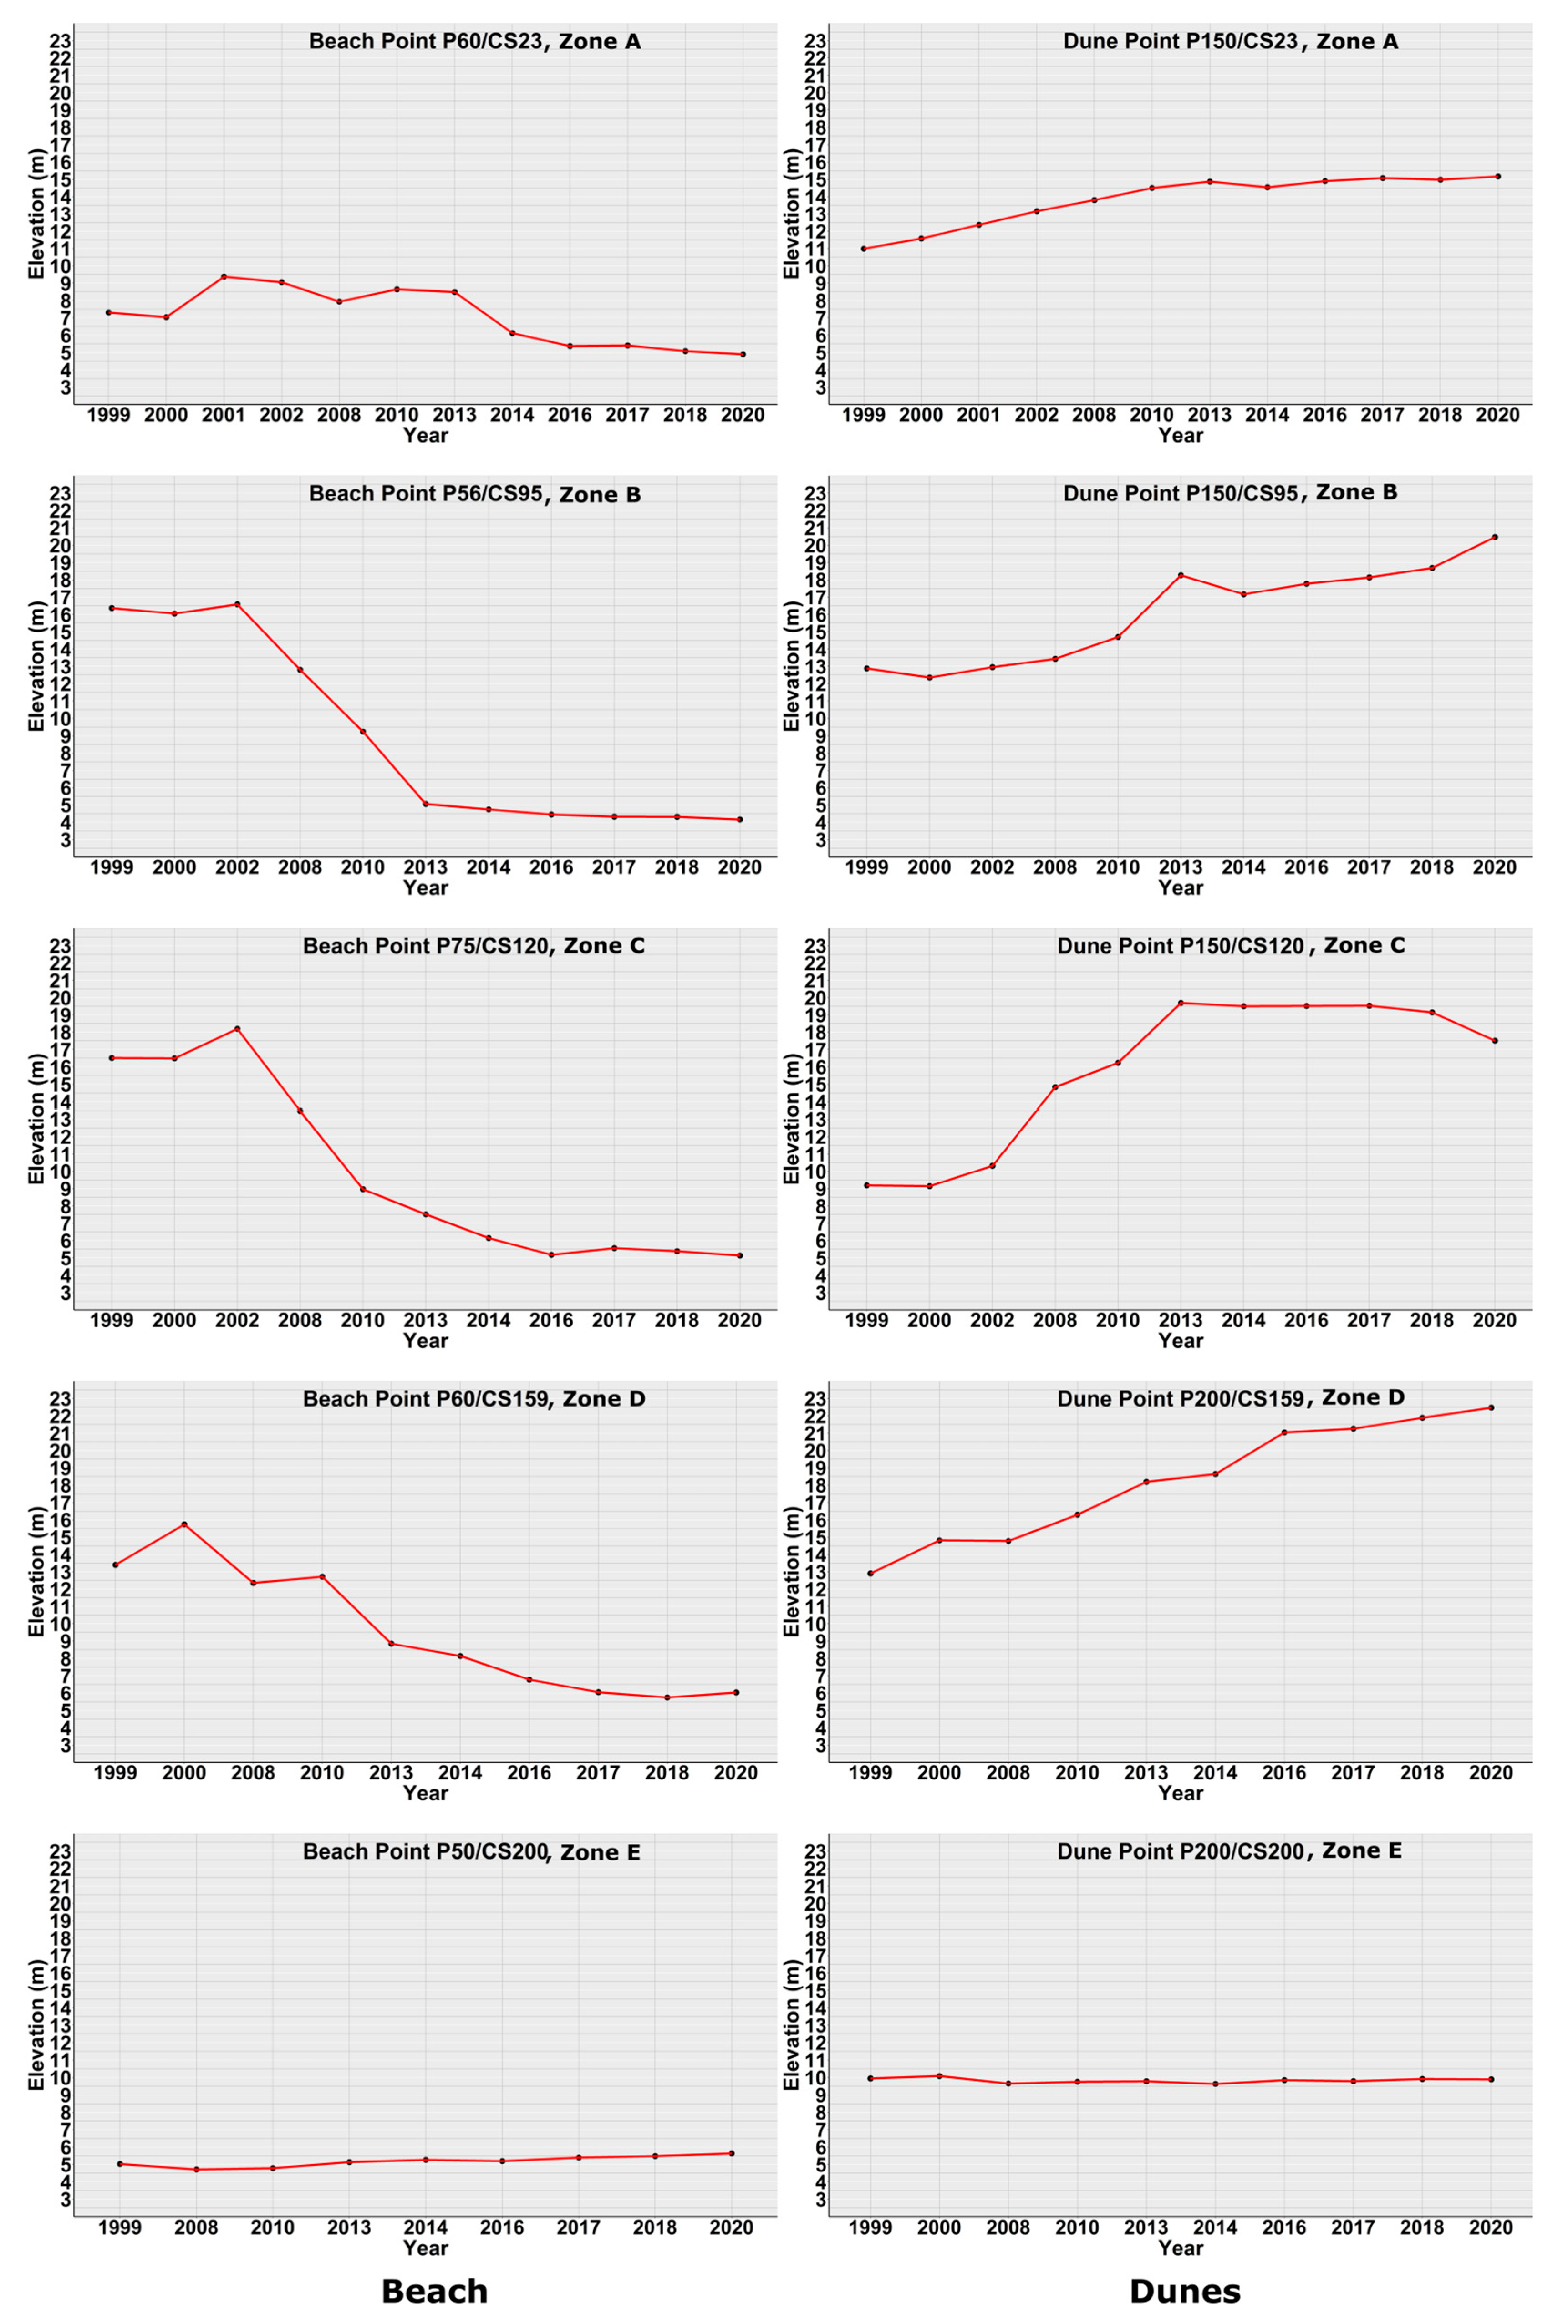
We present here (
Figure 10) selected points, (P60, P150/CS23), (P56, P150/CS95), (P75, P150/CS120), (P60, P200/CS159), and (P50, P200/CS200), that represent the elevation changes in points on the beach and the dunes from cross sections CS23, CS95, CS120, CS159, and CS200 in zones A, B, C, D, and E, respectively. The elevation time series of these selected points reflects the elevation changes for individual points on the beach and the dunes at Formby over the study period.
We can see that there is a significant elevation decrease in the points on the beach while there is an increase in the elevation of the points on the inland dunes; this applies to zone A, B, C, and D. While the elevation of the points on both the beach and the dunes in zone E is slightly increasing.
5. Discussion
The analysis carried out in this study from the DTM of differences, and the volumetric and elevation profile analysis provides a view of the dynamics of the dunes at Formby. We interpret from the cross-section profiles that frontal dunes face significant horizontal movement compared to inner dunes; this is because frontal dunes are affected more directly by waves and winds [
43]. Interpreting the horizontal movement of the inner dunes in a complex dune field is difficult, as all the inner dunes are one joined unit; nevertheless, the vertical elevation changes can be easily seen and interpreted. The horizontal decrease in the frontal dune lines is inversely related to the height of the dunes [
7].
From profile CS120 in zone C (
Figure 9), we can clearly see that the frontal dunes shifted eastwards by about 50 m during the 21-year observation period. This is due to the impact of the westerly wind blowing from the sea [
26], which has resulted in this eastward erosion and deposition; this is also seen in CS95 in zone B. This horizontal movement is associated with about 4 m height increase in the dunes, which suggests that there is a link between the horizontal movement and the change in height of the dunes. This vertical increase in the elevations of the dunes could be due to the vegetation impact limiting the eastwards migration of the dunes and acting as a barrier that forces the dunes to grow vertically.
The longitudinal section profiles (
Figure 8) demonstrate that the Formby beach in zones A, B, C, and D have generally lost a large volume of sandy area between 1999 and 2008, with minimum and maximum elevations ranging between 4 m–16 m. This significant material loss alerted the authorities in Formby to take action as they introduced some conservation measures, from planting trees to stabilize sand dunes to building fences to trap sand and control its movement [
33]. Also, paths were built to manage the access to the dunes and to prevent any erosion that could occur by visitors.
The volume loss in the beach area and the volume gain in the dunes (
Figure 5) indicates that those two processes are linked: loss of sand volume from the beach results in an increase in sand volume in the dunes. The volume of the whole dune system of Formby (beach + dunes) has had an increase of about 130,000 ± 280,000 m
3 over the 21 years, which means the total volume of sand in the Formby dune system remained unchanged within the uncertainty. Therefore, we interpret that all the volumetric changes were due to sand redistribution within the dune system, with erosion from the beach and outer dunes balanced by deposition in the inner dune areas.
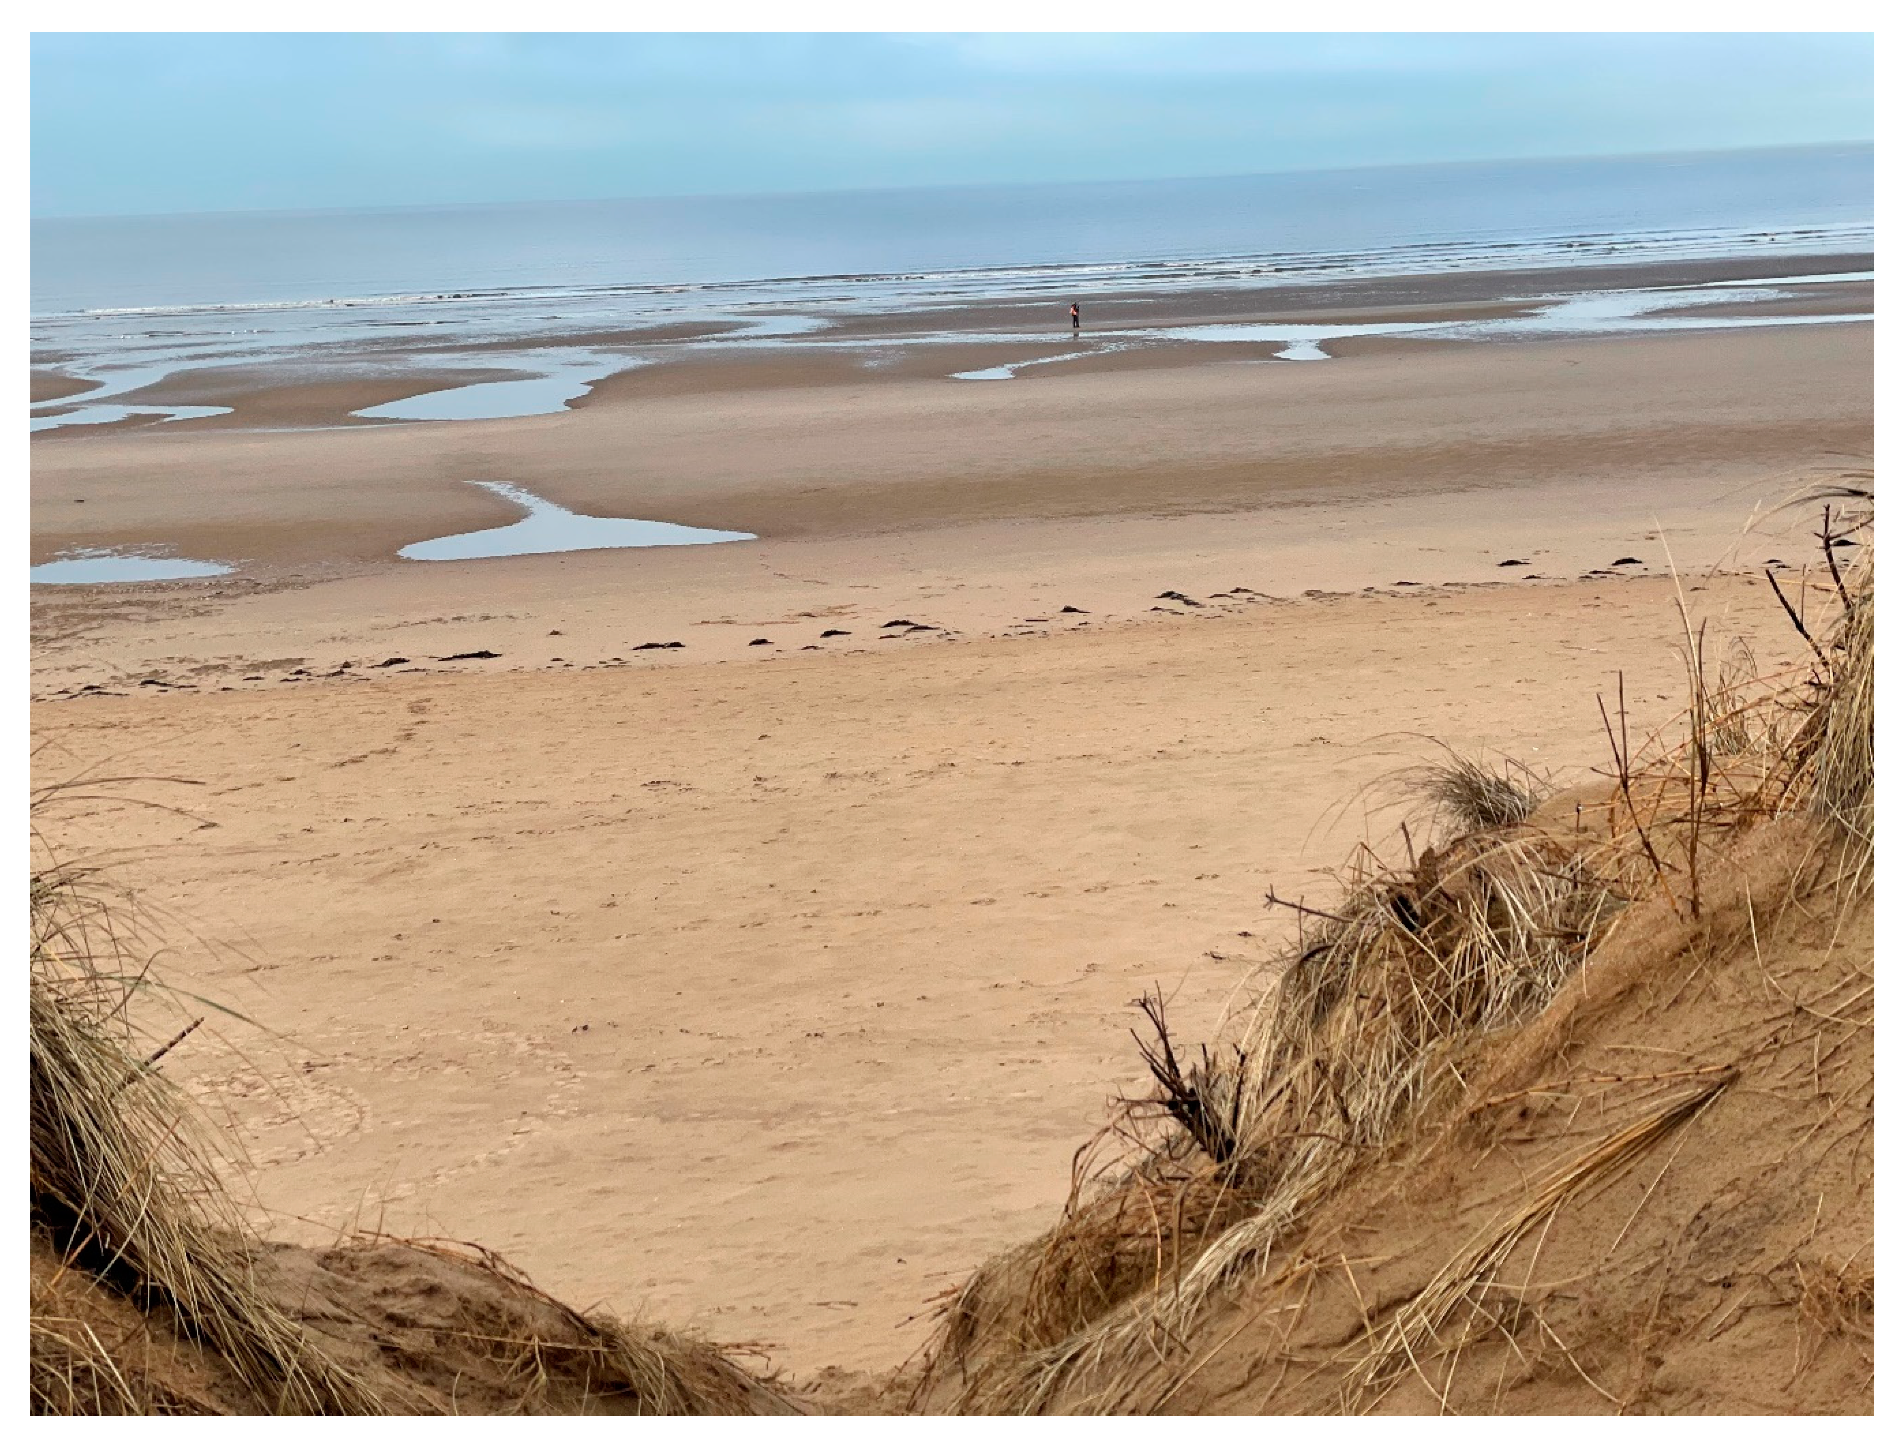
Determining the coastline is considered difficult due to the dynamics of sea water and tides. For example, in the early morning, the shoreline of Formby extends only for 40–50 m from the frontal dunes, while around midday the sea water recedes up to 250–300 m from the frontal dunes.
Figure 11 shows the effect of midday tides on sea water motion at the Formby coast. The impact of the predominant waves and blowing wind from the west and northwest at the Formby coast [
43] has resulted in forming these eastwardly frontal dunes. We can see, from the cross-section profile analysis (
Figure 9), the recession of the frontal dunes and the extension of the beach of about 50 m in zone A, B, C, and D.
Previous studies showed that the shorelines have shrunk significantly in the last decade and erosion of seaward facing frontal dunes occurred due to the westerly winds and strong storms [
29]. We found the highest rates of frontal dune recession in zones B and C as a result of the 2013–2014 Winter storms (
Figure 9). This has been also reported by [
28], with a net recession over the Winter period of about 12 m, and with a maximum dune toe recession of 20 m [
32]. Erosion of the frontal dunes near Victoria Road was reported in the early 1900s. This erosion has continued to the present day, occurring in the areas surrounding the Lifeboat Road up to Fisherman’s Path and the Freshfield/Ainsdale boundary [
33]. We can see the same erosion continuing in zones B, C, and D (
Figure 6).
Figure S6 illustrates further selected cross-sections, (CS15, CS40, CS55), (CS65, CS88, CS100), (CS110, CS117, CS125), (CS135, CS155, CS185), and (CS195, CS215, CS235), from zones A, B, C, D, and E, respectively, that reflect the profiles changes of the beach and dunes between 1999 and 2020 in the north, middle, and south sections of each zone. CS15 shows a significant dune toe recession in the frontal dunes of about 50 m in the north section of zone A between 1999 and 2020. This is also seen in the north sections (CS65, CS110, CS135) the middle sections from zones B, C, and D, and also from the south sections (CS100, CS125) from zones B and C. CS215, in the middle section of zone E, shows a buildup of new dunes with a height increase of about 7 m, while the old frontal dunes shift eastwards for about 50 m. CS195 and CS235 on the north and south sections of zone E show a 10–20 m seaward extension on its frontal dunes.
Although the longitudinal section profile does not represent the elevation changes in the whole study area, only the route selected, however, it reveals valuable information about the height differences in each zone and the changes that occurred over time. The beach longitudinal profile showed that there have been large changes in the beach elevation with a decrease of 12 m, 8 m, 9 m, and 10 m between 1999 and 2008 in zones A, B, C, and D (
Figure 8). The longitudinal profile over the dunes (
Figure 8) showed that the dunes in zones B, D, and the more southerly parts of E tend to have higher elevations, and this pattern appears to be stable over time. This could be due to the presence of vegetation in these zones acting as barriers, stabilizing the eastward horizontal movement of the deposited sand while contributing to the vertical growth of the dunes.
Coastal sand dune erosion tends to occur during winter with a loss in sand volume, while accretion occurs during the summer period, which, to some extent, balances the sand loss during winter [
28]. This interpretation of the relationship between the beach and the dunes can be supported by analyzing previous historic data (e.g., aerial imagery, field observation, etc.) to look for similar dune behaviour. Moreover, coastal sand dune monitoring campaigns must be undertaken at least twice a year, during the winter and summer periods, to fully understand the dynamics of the dunes over different weather conditions.
6. Conclusions
Coastal dunes are a primary natural flood defence in coastal risk management. In this study, we analyzed unique LiDAR DTM time series data collected over the Formby coast. Our findings show that the Formby coast dune system is highly dynamic regarding sand redistribution within the system. We found that the rate of elevation change for the beach and dunes was between −0.79 and 0.08 m/year and −0.91 and 0.73 m/year, respectively, during the 1999–2020 measurement period. The beach and the frontal dunes experienced erosion, however, this was balanced by sand accumulation in the inner dunes. Areas with a presence of vegetation remained largely unchanged due to the impact of vegetation in stabilizing the movement of the dunes.
Formby beach has seen a significant volume loss of about 907,000 m3 in 21 years, while the dunes have seen a volume increase of about 1,049,000 m3 over a period of 21 years. The volume of the entire dune system of Formby (beach + dunes) remained unchanged, which indicates that all the volumetric changes happened due to sand redistribution within the system, with erosion in the beach and frontal dunes compensated by deposition in the inner dune areas. Our DTM time series revealed that the Formby beach, marked by the frontal edge of the dunes, migrated by about 50 m inland during the measurement period.
We recommend investigations into the dune activity at nearby coastal sites to fully understand the dynamics links between dune fields on the northwest coast of England. This provides important information for local site managers and planners to preserve the local environment and for planning interventions and minimizing the risks to local infrastructure.


 ,
, 


