Article

Integrating Pixels, People, and Political Economy to Understand the Role of Armed Conflict and Geopolitics in Driving Deforestation: The Case of Myanmar

1
East-West Center, Honolulu, HI 96848, USA
2
terraPulse, Inc., Gaithersburg, MD 20878, USA
3
Smithsonian Conservation Biology Institute, Front Royal, VA 22630, USA
*
Author to whom correspondence should be addressed.
Remote Sens. 2021, 13(22), 4589; https://doi.org/10.3390/rs13224589
Submission received: 1 September 2021 / Revised: 29 October 2021 / Accepted: 6 November 2021 / Published: 15 November 2021
(This article belongs to the Special Issue Remote Sensing of Geopolitics)

Abstract

:
Armed conflict and geopolitics are a driving force of Land Use and Land Cover Change (LULCC), but with considerable variation in deforestation trends between broader and finer scales of analysis. Remotely-sensed annual deforestation rates from 1989 to 2018 are presented at the national and (sub-) regional scales for Kachin State in the north of Myanmar and in Kayin State and Tanintharyi Region in the southeast. We pair our multiscaled remote sensing analysis with our multisited political ecology approach where we conducted field-based interviews in study sites between 2018 and 2020. Our integrated analysis identified three common periods of deforestation spikes at the national and state/region level, but with some notable disparities between regions as well as across and within townships and village tracts. We found the rate and geography of deforestation were most influenced by the territorial jurisdictions of armed authorities, national political economic reforms and timber regulations, and proximity to national borders and their respective geopolitical relations. The absence or presence of ceasefires in the north and southeast did not solely explain deforestation patterns. Rather than consider ceasefire or war as a singular explanatory variable effecting forest cover change, we demonstrate the need to analyze armed conflict as a dynamic multisited and diffuse phenomenon, which is simultaneously integrated into broader political economy and geopolitical forces.

1. Introduction

Armed conflict is a critical driver in Land Use Land Cover Change (LULCC); yet, it is understudied and poorly understood. A recent global study by CIFOR found that an estimated 40% of tropical forests are currently located in countries with active violent conflict [1]. Despite such a high prevalence of tropical forests situated in armed conflict settings, few LULCC studies consider how widespread violence and other conflict-related drivers, such as economic concessions granted to armed actors, as well as wider geopolitical forces influence deforestation trends.
In cases where the role of armed conflict has been considered in LULCC analyses, the effects appear to be multidirectional and multiscalar [2,3,4,5,6,7,8,9,10,11]. For example, Baumann and Kuemmerle conducted an extensive literature review on armed conflict and LULCC and found that “armed conflict effects can lead to both more intensive and less intensive land use” [12]. This is because armed conflict itself is rarely a direct driver of LULCC. Armed conflict is shown to primarily effect other drivers and mechanisms that underlay land-use decisions, which explains the diverse LULCC outcomes of armed conflict [13]. The growing body of scholarship on the relationship between LULCC and armed conflict generally agrees, offering a list of variables and conditions that make land use transitions shift one way or another as domestic politics and regional geopolitics shift [14,15,16,17,18,19,20,21]. For instance, armed conflict’s direct role in the displacement of local populations [22,23], the use of landmines [24], natural resources financing warfare efforts [25], and unstable political institutions or insecure land tenure [26,27] exert a significant impact on deforestation drivers such as logging, agriculture production, infrastructure development, or mining.
These multidirectional and multiscalar dynamics of LULCC associated with armed conflict make the application of remote sensing analysis in these scenarios a challenging, yet nonetheless, helpful tool to investigate a range of war-related land use changes [28,29,30]. Some of these difficulties are associated with spatial characteristics of the armed conflict, which often are geographically diffuse and occur across multiple spatial and temporal scales. For example, LULCC analysis is often generally applied to encompass a large administrative region to understand the relationship between armed conflict and deforestation [9,19,31]. However, this broader spatial coverage of LULCC is frequently not commensurate with the finer-tuned dynamics of armed conflict behavior and its place-based drivers, which are often much more decentralized. As such, the exact outcomes of armed conflict on land use systems are complex and context-dependent.
To address these challenges, we point towards identifiable constellations that tend to produce certain land use transitions. Our study links remotely-sensed LULCC analysis to the various spatial scales at which armed conflict and geopolitics materially interact with forests, using Myanmar’s conflict-affected borderlands as a case study. We attempt to connect the spatial and analytical outcomes from LULCC using satellite imagery to “grounded” field research that allows for what Liverman et al. famously called “linking people and pixels” [32], or what more recently Tellman et al. described as how to “socialize the pixels” [33]. Our paper contributes to the scholarship on armed conflict’s role in LULCC with our political ecology approach to critical remote studies that offers a more nuanced multiscaled deforestation analysis that links broader-scaled national political economy and geopolitical phenomena with finer-scaled armed conflict behavior. We do this by pairing field-based research interviews and ethnography with remotely-sensed annual deforestation rates. This approach allows us to investigate and link the microconditions of armed conflict rooted in place-specific conditions with the broader political economy and geopolitics that together drive deforestation.
We test this mixed methods approach using Myanmar’s Kachin State in the north and Kayin (Karen) State and Tanintharyi (Tenasserim) Region in the southeast as a study case (Figure 1). Myanmar ranks among the top 10 countries in the world for forest loss and in the top three for the highest rate of deforestation [34]. The country lost nearly 550,000 ha (5500 km2) of forest per year between 2010 and 2015, amounting to a 1.7% annual rate of forest loss [35]. Other studies found that over the period of 2002 to 2014, Myanmar lost 11% of its total intact forests [36,37].
The country is also responsible for the world’s most protracted armed political conflict, stretching back seven decades since independence from British colonial rule. Armed conflict zones are located within the mountainous peripheral territories populated predominately by ethnic minorities (e.g., Shan, Kachin, Kayin, etc.). This geography of armed conflict significantly overlaps with remaining intact natural forest cover and the country’s highest rates of forest loss [37].
These armed conflict dynamics necessitate a finer spatial coverage of analysis to better understand deforestation patterns in Myanmar. The country’s armed political conflict is centered around common ethnic-based grievances against the military state, but nonetheless is highly fractured and decentralized. Hundreds of nonstate armed groups exist across ethnic territories, which include rebels in armed opposition to the state (commonly referred to in Myanmar as ethnic armed organizations, or EAOs) as well as different types of paramilitary organizations. EAOs and paramilitaries have carved out their respective territories of influence, oftentimes overlapping, that range in size from a collection of villages to entire regions of the country [38,39]. Some prominent EAOs that control larger territorial units are more centralized top-down outfits, such as the United Wa State Party (UWSP) and the Kachin Independence Organization (KIO). Others, however, are much more decentralized in how they govern, most notably the Karen National Union (KNU) [40]. Territories can also be what is known as “mixed administration”, where both the state and EAO contend for administrative and political power [41]. Moreover, these political relations between state and nonstate armed groups, and among various nonstate armed groups themselves, shift often, which in turn significantly impact forest environments in different ways. This devolved nature of the conflict in Myanmar necessitates that the scale at which deforestation rates are studied must be commensurate with the territorial unit at which these various armed groups operate.
In response to these multiscaled heterogeneous forces differentially impinging upon forests across geographies, we designed our study to advance a more grounded political ecology approach that connects pixels to people, political economies, and geopolitics to understand LULCC trends over time and in different geographies. Overall, we investigate the correlation among these multiscaled and multisited drivers of deforestation in relation to Myanmar’s ongoing civil war. We hypothesize that national political economies and geopolitical shifts explain remotely-sensed deforestation trends at broader scales (state/region and township level), but at finer scales (village tract and 3000 m village radius) deforestation rates are more heterogeneous in response to localized armed group behavior. We examine how the close of the Cold War and the subsequent shift in geopolitical relations with China and Thailand, together with Myanmar’s own domestic political economic reforms, have shaped Myanmar’s civil war and subsequently LULCC. We also test how the country’s decentralized armed conflict dynamics may shape finer-scaled forest loss and help explain spatial heterogeneity in deforestation patterns as compared to broader scales. We test how we can bridge these scales between broader- and finer-scaled forces that cause forest loss so as to better account for the spatial variegation of armed conflict and border geopolitics.
Below we describe our Landsat-based forest change product from 1984 to 2019 at different administrative jurisdictions (national, state/region, township, and village tract) for Kachin State in the north and Tanintharyi Region and Kayin State in the southeast. We collected field data from focus group discussions and key informant interviews in each village tract study site, complimented by a literature review and expert knowledge. In our findings section, we rely on our field-based data analysis to interpret our Landsat-based forest change data set. We identify three national deforestation trends, which we then compare to our findings at finer scales for Kachin State and Tanintharyi Region. We discuss how these data findings help us better understand how armed conflict, political economy, and geopolitics co-drive deforestation in two of Myanmar’s prominent ethnic conflict border regions.

2. Materials and Methods

2.1. Remote Sensing of Forest Cover and Change

Estimation of tree canopy cover was based on Landsat Collection-1 images from 1984 to 2019 downloaded from USGS/EROS Data Center (http://landsat.usgs.gov, accessed on 18 August 2021). Images were combined from level-1 Terrain Corrected (L1T) Landsat-4 and 5 Thematic Mapper (TM), Landsat-7 Enhanced Thematic Mapper Plus (ETM+), and Landsat-8 Operational Land Imager (OLI) sensors. Each image was converted to units of surface reflectance; the Landsat Ecosystem Disturbance Adaptive Processing System (LEDAPS) was used for TM/ETM+ images, and the Landsat Surface Reflectance (LaSRC) code was used for OLI images. The Fmask algorithm [42] was applied to identify clouds and their shadows in each Landsat image. A maximum of four images were selected per year per WRS-2 tile to avoid noise from clouds and phenological variation. All Landsat images were scored by cloud coverage, seasonality, and image quality (e.g., SLC-off, Landsat processing levels), and the images with the highest scores in each year were selected for analysis. Up to 144 images were selected for a WRS-2 tile to ensure complete temporal coverage.

2.1.1. Historical Retrieval of Tree Canopy Cover

Tree canopy cover (TCC) was estimated through a model f of remotely sensed variables X in any location i [43]:
c i ^ = f ( X ; β ^ ) + ε
where ci is the percentage of a pixel (i)’s area covered by woody vegetation taller than 3 to 5 m; β is a set of empirically estimated parameters; ε is residual error or uncertainty; and X is a set of measurements of surface reflectance, derived indices, image acquisition date, and sensor identification. The model was fit to spatiotemporally coincident training data composed of 250 m annual resolution estimates of tree cover between 2000 and 2019 [44] as response and spectral measurements from coincident Landsat images as covariates and then applied to each complete Landsat image to produce the map of estimates. Landsat-based covariates were aggregated to the spatial resolution of the response data following Feng et al. [45]; clouds and their shadows were removed following [42].
Model parameters were fit into 3 × 3 moving windows of Worldwide Reference System-2 (WRS-2) tiles by a gradient-boosted regression tree [46] and applied to the center image of the window to map tree cover estimates across the center image. Each model’s training sample was pooled from 2000 to 2019 to minimize overfitting to spurious inter-annual noise, instead incorporating phenological and atmospheric variance into ɛ. Each WRS-2 tile’s fitted model was applied to all Landsat images from 1984 and 2019 within the tile to retrieve a time series of tree canopy estimates at 30 m spatial resolution. The median estimate of cover and its uncertainty within each year was reported as the estimate (c, ε) for that pixel in that year. In addition to minimizing interannual noise, this compositing filled gaps due to clouds, snow, etc.

2.1.2. Validation

Tree cover estimates were calibrated and validated against reference observations from unmanned aerial vehicles (UAVs) and human interpreters, stratified by topographic elevation, slope, and aspect calculated from the 1 arc-second (~30-m) resolution ASTER Global Digital Elevation Model (GDEM) 3rd Version (NASA EarthData; https://earthdata.nasa.gov, accessed on 3 August 2021), as well as 19 bioclimatic covariates from WorldClim v2. These covariates represented the spatial variation in environmental determinants of canopy structure across the region.
Accuracy of tree canopy cover, disturbance year, and forest age, were quantified by Mean Bias Error (MBE) and precision by Root-Mean-Squared Error (RMSE):
M B E = i = 1 n L i M i n
R M S E = i = 1 n ( L i M i ) 2 n
where Li and Mi are ages derived from Landsat and the reference data, respectively, at a sample location i, and n is the count of joint observations in the sample. After modeling the relationship between L and M, the (squared) difference between L and M was disaggregated into systematic error (MSES) and unsystematic error (MSEU):
M S E S = i = 1 n ( L i ^ M i ) 2 n
M S E U = i = 1 n ( L i L i ^ ) 2 n
where L i ^ is an age or year value predicted by the modeled relationship (Y = a + b X) between L and M and where M i , M ¯ , L i , and L ¯ are the mean and sample variance of M and L respectively.
The resulting coefficient of determination (R2) between calibrated tree canopy cover estimates and reference data was 0.92, and the RMSE was 12.23%. The error was dominated by unsystematic noise (MSEU = 119.74, MSES = 29.95), and the estimates had a small negative bias of −1.21% compared to the reference data.

2.1.3. Trend Analysis, Change Detection, and Estimation of Forest Age

To estimate years of forest disturbance and establishment, the category “forest” was defined as a class of tree cover exceeding a predefined threshold value, c* = 30% in each pixel [47]. The probability of a pixel belonging to “forest”, p(F), is therefore the probability of c exceeding c*, i.e., the integral of the probability density function of c above c*:
p ( F ) p ( c > c * ) = c * 100 p ( c ) d c
where
p ( c ) N ( c ^ , σ 2 ) = 1 σ 2 π e ( c c ^ ) 2 2 σ 2
and σ = ε.
Using the 37-year time series of 30 m, annual-resolution estimates of forest probability in each pixel, forest losses, and gains were detected by applying a two-sample z-test in a moving kernel over time:
z = x ¯ 1 x ¯ 2 σ 1 2 n 1 σ 2 2 n 2
where x ¯ 1 and x ¯ 2 are antecedent and trailing means, respectively, σ 1 and σ 2 are their standard deviations, and n 1 and n 2 are the number of forest-probability estimates contributing to the values in all years. The test was applied with the kernel centered on each forest-probability value of 50% in the series that was also increasing over time, i.e., P ( F t 1 ) = x ¯ 1 < 50% and P ( F t 2 ) = x ¯ 2 >= 50%. If a statistically significant (p <= 0.05) difference was identified between the two ascending groups, the focal year was labeled as a forest gain or loss. If multiple significant losses or gains were detected in a pixel over the 37 years (1984–2019), up to three events were recorded. The age of the forest (A), in years, at any year t* and location (x, y) was calculated by subtracting the year of the most recent significant forest gain t+ from the focal year:
A = t * t +
The resulting Myanmar forest change map between 1984 and 2019 can be accessed freely through Smithsonian’s Figshare online repository [48].

2.1.4. Remote Sensing Processing

We used the Landsat-based Myanmar Forest Change Product described above to analyze the deforestation rate between 1989 and 2018. We delineated the boundaries of various administrative units and examined the aggregated deforestation rate within each unit. For individual villages, we created a 3000 m circular buffer area around the coordinate points recorded by the interview team. We downloaded village tracks, townships, and states boundaries from the Myanmar Information Management Unit (MIMMU) (http://themimu.info, accessed on 27 July 2021).
For each administrative unit (village, village tract, township, and state), we first aggregated the forest cover in the year 1989 as the baseline forest extent. The annual deforestation rate was calculated as deforested area for a particular year divided by the baseline forest extent within the unit.

2.2. Field-Based Data Collection

Methodologically, we combined the “grounded” approaches of political ecology and ethnography that rely on context- and place-dependent field-based research and analysis to critically engage in LULCC via satellite remote sensing [49]. Political ecology can be described as a multiscaled approach to studying the political economy of the environment [50]. This approach considers relations to place, space, scale, and time through ethnographic inquires, which help to link political economy forces to finer-grained situated environmental change. For us, our “critical” approach to remote sensing studies is in how we apply methods common to political ecology to interpret satellite imagery. For example, our field-based data collection investigated issues around who had power and control over which resources, and when and where, as well as investigating local land and forest tenure rights and access regimes [51].
We conducted field research in a total of 22 village tracts in 11 different townships in Kachin State, Kayin State, and Tanintharyi Region. The criteria for selected village tracts were they had to (1) be in areas of the country that have experienced decades of armed conflict; (2) be located within territories inhabited by different ethnic populations and armed groups; (3) have high remaining forest cover; and (4) have experienced high rates of deforestation and land use change. In Kachin State, located in the far north near to the Yunnan, China border, we studied a total of 5 village tracts in 4 different townships, all under mixed administration with the Kachin rebel group (the KIO), paramilitaries and government, from 2018 to 2019. In Kayin State, in the southeast close to the Thailand border, we studied 4 village tracts in 2 townships, all under control of the main Karen rebel group (the KNU) and paramilitaries, with limited to no government presence, from 2019 to 2020. In Tanintharyi Region, in the far southeast corner of Myanmar that also shares their entire eastern border with Thailand, we studied 10 village tracts in 4 townships, under KNU and mixed administration with the government, from 2018 to 2019. Our analysis presented here omits some village tracts and townships in the three states/region due to space limitations. See Table 1 for a list of all our study sites (indicating whether included or omitted in our analysis presented here) and their political authority attributes.
In each village tract study site, we conducted a focus group discussion drawing from a diverse set of male and female adult villagers from the surrounding villages who agreed to discuss our topic, numbering 10–25 attendees. The elected village headman and/or village tract leader attended too, as is protocol; the participants never expressed any security concerns since the headmen in our study sites are known to champion the rights of villagers and the environment. No other higher-level government or other officials attended for security reasons. Following these three-hour discussions, field research team leaders conducted semi-structured key informant interviews with well-regarded elders and other active village members, including the headman. No interviews were conducted with businessmen or militia leaders for security reasons. In Kayin State and Tanintharyi Region, our field research teams gained permission from the relevant KNU leaders to conduct research in our selected study sites. We conducted interviews with township-level forest department officials and other persons of authority at the township level in Kachin State and Tanintharyi Region, separately from our interviews with villagers, in order to better understand higher-scaled drivers and how they may interact with LULCC at the level of township and village tracts. Our field research team leader for each state/region led the discussions and interviews in the respective ethnic minority language (not Burmese). Field research leaders are community leaders of the same ethnic identity as those villagers interviewed, and who are already known by the village headman and/or village tract leader due to their history of environmental engagement in the area. In addition, the lead author of this paper leaned heavily on their 15 years of field-based ethnographic research in these armed conflict areas.

3. Results

3.1. National and Regional Deforestation Trends in Myanmar

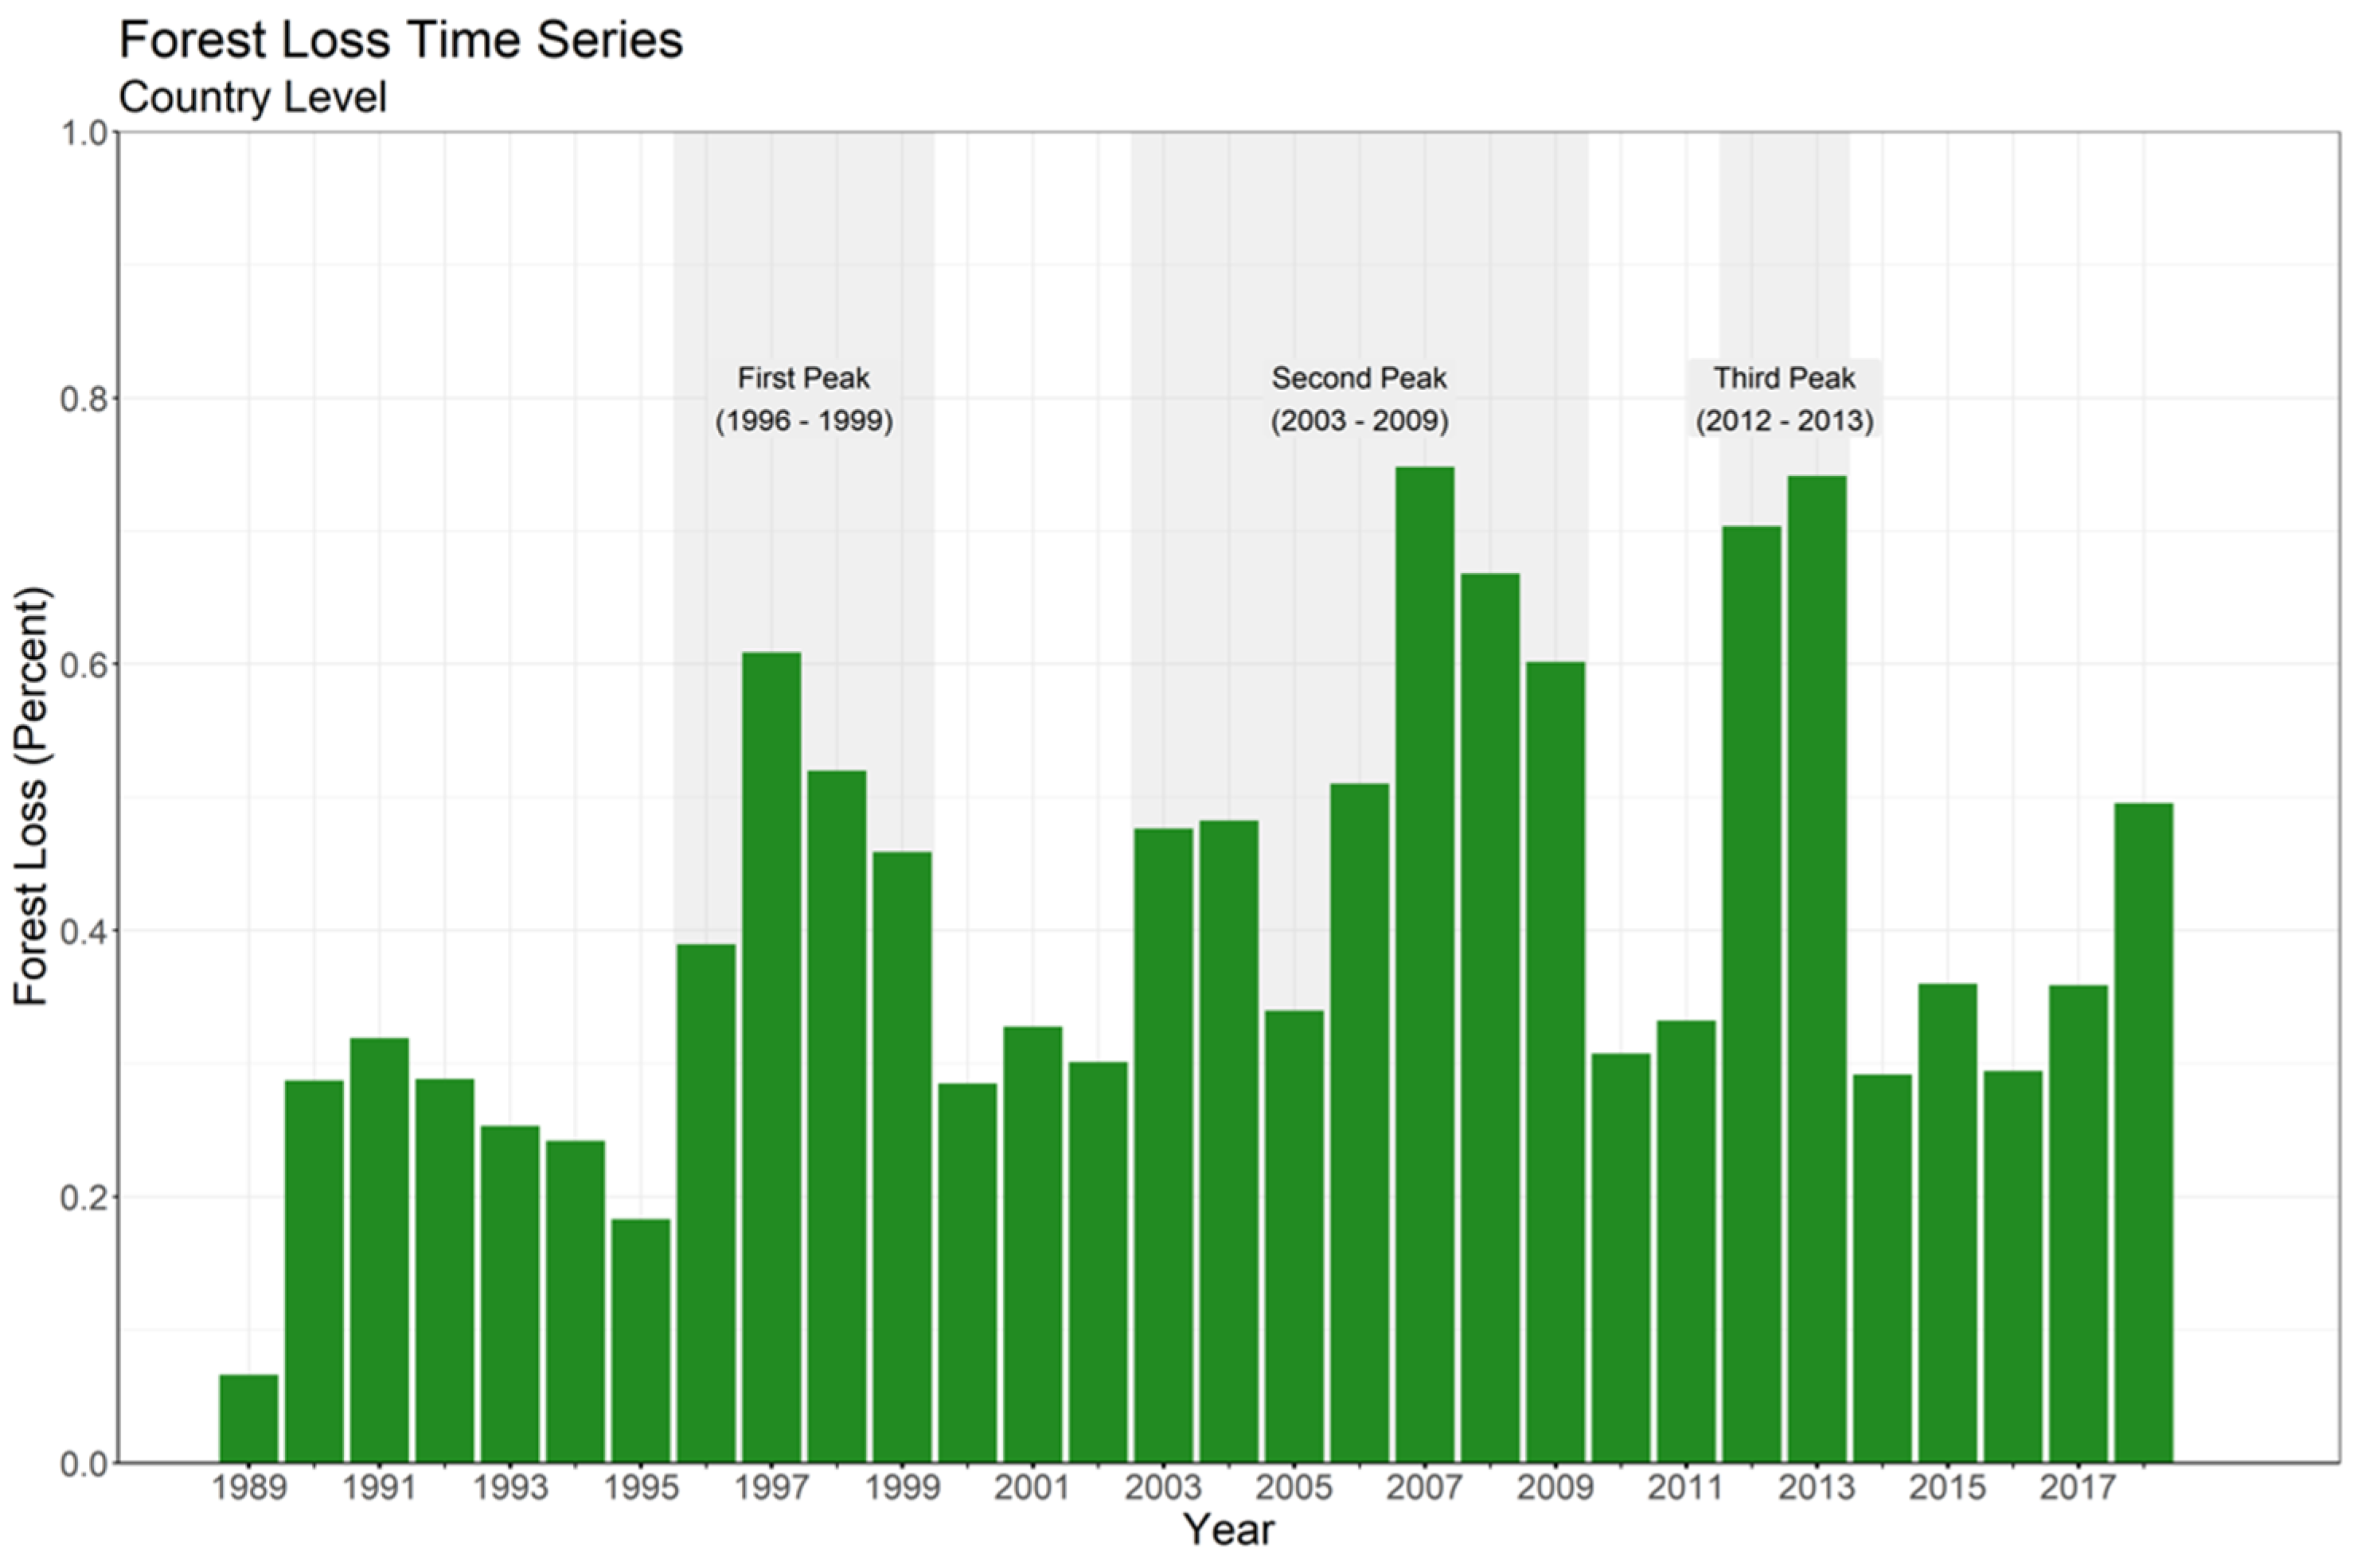
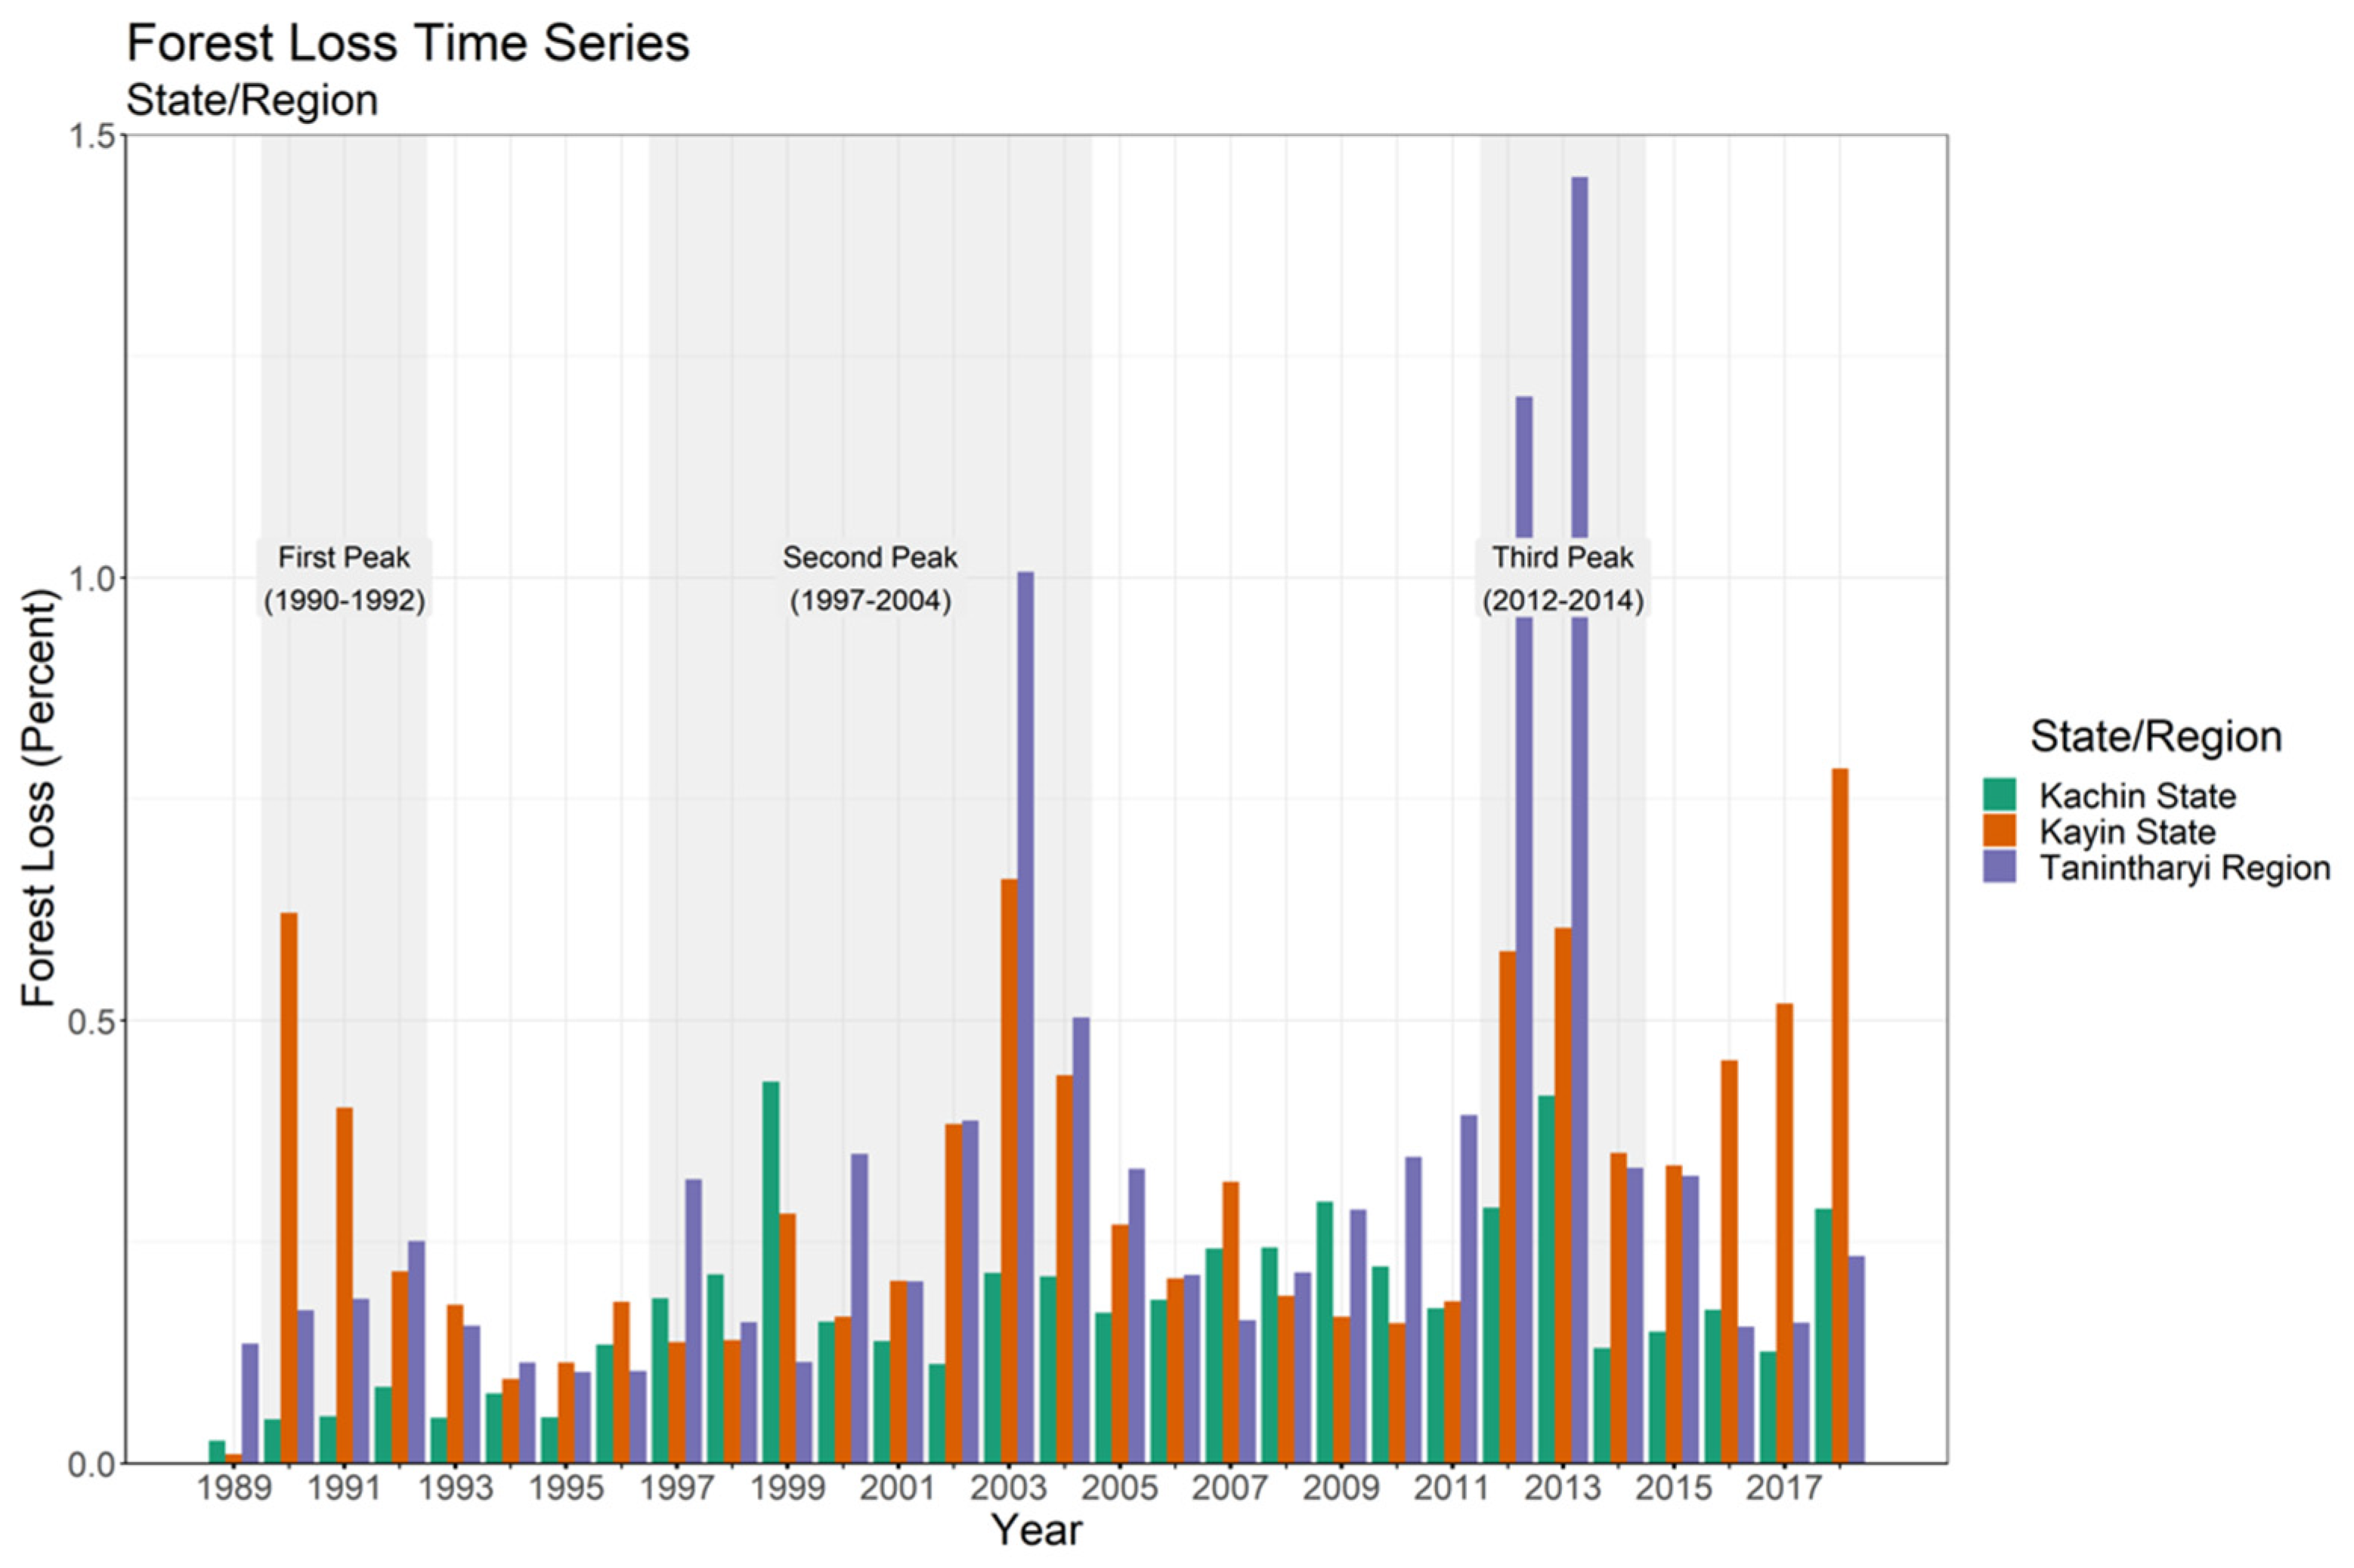
Our remotely-sensed annual deforestation analysis revealed three significant deforestation periods in Myanmar at the national level (Figure 2). This national deforestation trend was also reflected at the regional scale for Kachin State, Kayin State, and Tanintharyi Region, though with some notable variation (Figure 3). The deforestation peaks were based on a qualitative visual assessment of the general trends by plotting remotely-sensed annual deforestation rates for each administrative unit. Finer-scaled deforestation patterns at township and village tract level within and across regions showed a similar trend to broader scales but also with considerable variation.
This first subsection describes the three deforestation peaks we identified at the national level based on our remotely-sensed LULCC findings. The next section goes into greater detail on how these three national deforestation peaks manifested in Kachin State and Tanintharyi Region. We then explore significant divergences we found at finer-scales due to geographical and temporal variegation in armed territory and battles based on our field-based interviews.

3.1.1. First National Deforestation Peak (Mid- to Late-1990s)

The first deforestation spike we identified for Myanmar was from the mid- to late-1990s, which represented the first decade after the close of the Cold War era. We found this initial deforestation peak to be driven by two underlying forces. First and foremost, a dramatic shift in post-Cold War geopolitics defined by “turning battlefields to marketplaces”, coined by the then Thai Prime Minister, meant to capitalize on land and resources through bilateral business deals rather than remain captive to Cold War divisions [52]. Immediately following the end of the Cold War, Thai businessmen engaged in Myanmar’s resource extractives sector along their shared border, especially in oil/gas and timber. It took China a few more years to follow suit, such that by the late 1990s the national Chinese government more aggressively reoriented its foreign policy away from supporting Myanmar’s armed rebellions and instead focused on cross-border trade and resource extraction [53].
The second underlying driver of deforestation, in relation to the first, stemmed from logging bans in neighboring countries. Catastrophic flooding in Thailand in 1989, pinned on the logging of critical watersheds, subsequently led the Thai government to swiftly pass a domestic logging ban that same year. New scientific knowledge and recurrent politics that linked deforestation with floods [54], bolstered by a rising Thai middle class in Bangkok with corresponding environmental values, contributed to Thailand’s sudden change to forest conservation and the consequent shift of sourcing tropical timber from neighboring countries, especially Myanmar, rather than from their own country [55,56]. China also initiated a domestic logging ban (called the “Natural Forest Protection Program”) nearly a decade later in 1998 in response to their own tragic flood in the southwest, after which Chinese logging companies quickly began sourcing timber from across the border in Kachin State [57,58].

3.1.2. Second National Deforestation Peak (2003–2009)

The second deforestation spike we found at the national scale occurred approximately from 2003 to 2009. During this period, the material effects of the post-Cold War period, where Asian governments and companies facilitated resource extraction projects, greatly accelerated. These high annual deforestation rates during this period were explained by two main conflict-related drivers: a continuation of private logging concessions that initially led to the first deforestation peak, with the additional emerging pressure of forest conversion to private agribusiness estates.
As logging pressures mounted by Thai companies in the southeast and mainland Chinese companies in the north, the Thai and Chinese national governments began to implement cross-border timber trade regulations as one response to growing international and domestic pressures. Just as the timber sector in Myanmar came under increasing scrutiny for its unsustainability, the agribusiness sector entered its boom phase. Regional governments and investors, especially China, lent considerable financial and bilateral support to commercialize Myanmar’s agricultural sector, as well as the involvement of Myanmar’s own nascent crony companies [59,60]. Many recent studies on Myanmar’s deforestation crisis found commercial agricultural expansion since the mid-2000s to be a major driver of forest loss [61,62,63]. According to another study, agricultural expansion in Myanmar was found to be the most significant driver of deforestation, reducing intact forests by over 0.54 Mha from 2002 to 2014, representing 26% of all intact forest loss [36]. A study by Forest Trends, which evaluated several different data sets on the extent and nature of forest loss in Myanmar, estimated that two-thirds of the deforestation in Myanmar from 2010 to 2020 was driven by commercial agriculture [64]. According to government-sourced data, between 2004 and 2005, 716,293 ha of forests (protected forest reserves, unclassified forests, and “other” forests) were degazetted and shifted to industrial agriculture and mining uses [65].

3.1.3. Third National Deforestation Peak (2012–2013)

The third deforestation spike we identified in Myanmar was from 2012 to 2013. It was during this period that Myanmar had the third highest deforestation rate in the world, after Brazil and Indonesia [35]. This short period was just a few years after Myanmar’s political transition to what the military government called “disciplined and flourishing democracy”. In 2010 the country’s first national elections took place, and a year later the first parliamentary government in six decades took office. As the country began to open to outside markets and investment for the first time, a rush of land grabbing resulted. Land allocations for large-scale private agriculture concessions increased 170 percent (from 809,371 ha to 2,104,365 ha) between 2010 and 2013 [65]. Kachin State and Tanintharyi Region comprised 68 percent of all allocated agribusiness concessions [65]. Many cronies and armed elites tried to cash in on their land and resource assets (e.g., agricultural and logging concessions) in fear of losing them to further democratic reforms and a subsequent shift away from the political system they most benefited from. Analysis by Forest Trends estimated that forest conversion for agribusiness estates was likely responsible for the clearance of 1.3 Mha of forests nationwide between 2013 and 2019 [64].

3.1.4. Decreased National Deforestation Rate (2014–2017)

After this third deforestation spike, there was a sudden marked decrease in the deforestation rate from 2014 to 2017. The beginning of this period was marked by several noteworthy timber regulation initiatives passed by the outgoing government that sought to curb logging and associated timber export trade, such as a temporary log export ban in 2014 [64]. The National League for Democracy (NLD) administration who governed from 2016 to 2020 also initiated several new forestry legislations to curb illegal deforestation and timber export, building on reforms from the previous administration, such as a one-year moratorium on logging starting in 2016 and a reduction in the Annual Allowable Cut (AAC) in 2019, among other sustainable forest management measures [64]. The effect took hold immediately, with a significant reduction in the production and trade of roundwood, even when considering significant discrepancies between different reporting agencies [64,66]. Studies also indicated through remote sensing analysis the drastic overharvesting of preferred high-value tree species, leading to low availability of accessible remaining timber with commercial value by the mid-2010s [36,37].

3.2. Variation in Deforestation Trends at Finer Scales

Deforestation trends at the state/region level and at finer scales (township, village tract, and 3000-m village radius) for Kachin State and Tanintharyi Region were found to be similar to what we analyzed at the national level, as described above. However, we also found a significant degree of heterogeneity in deforestation rates across and within townships and village tracts, which we describe in greater detail below. This variability was a result of a combination of more localized armed conflict drivers, such as an administrative unit under paramilitary authority, flareups in active fighting, or a concentration of logging and agribusiness concessions to cronies and armed elites in those jurisdictions. Below we describe the commonalities and divergences in these deforestation trends between the national level and the (sub-) regional level in Tanintharyi Region and Kachin State.

3.2.1. Tanintharyi Region

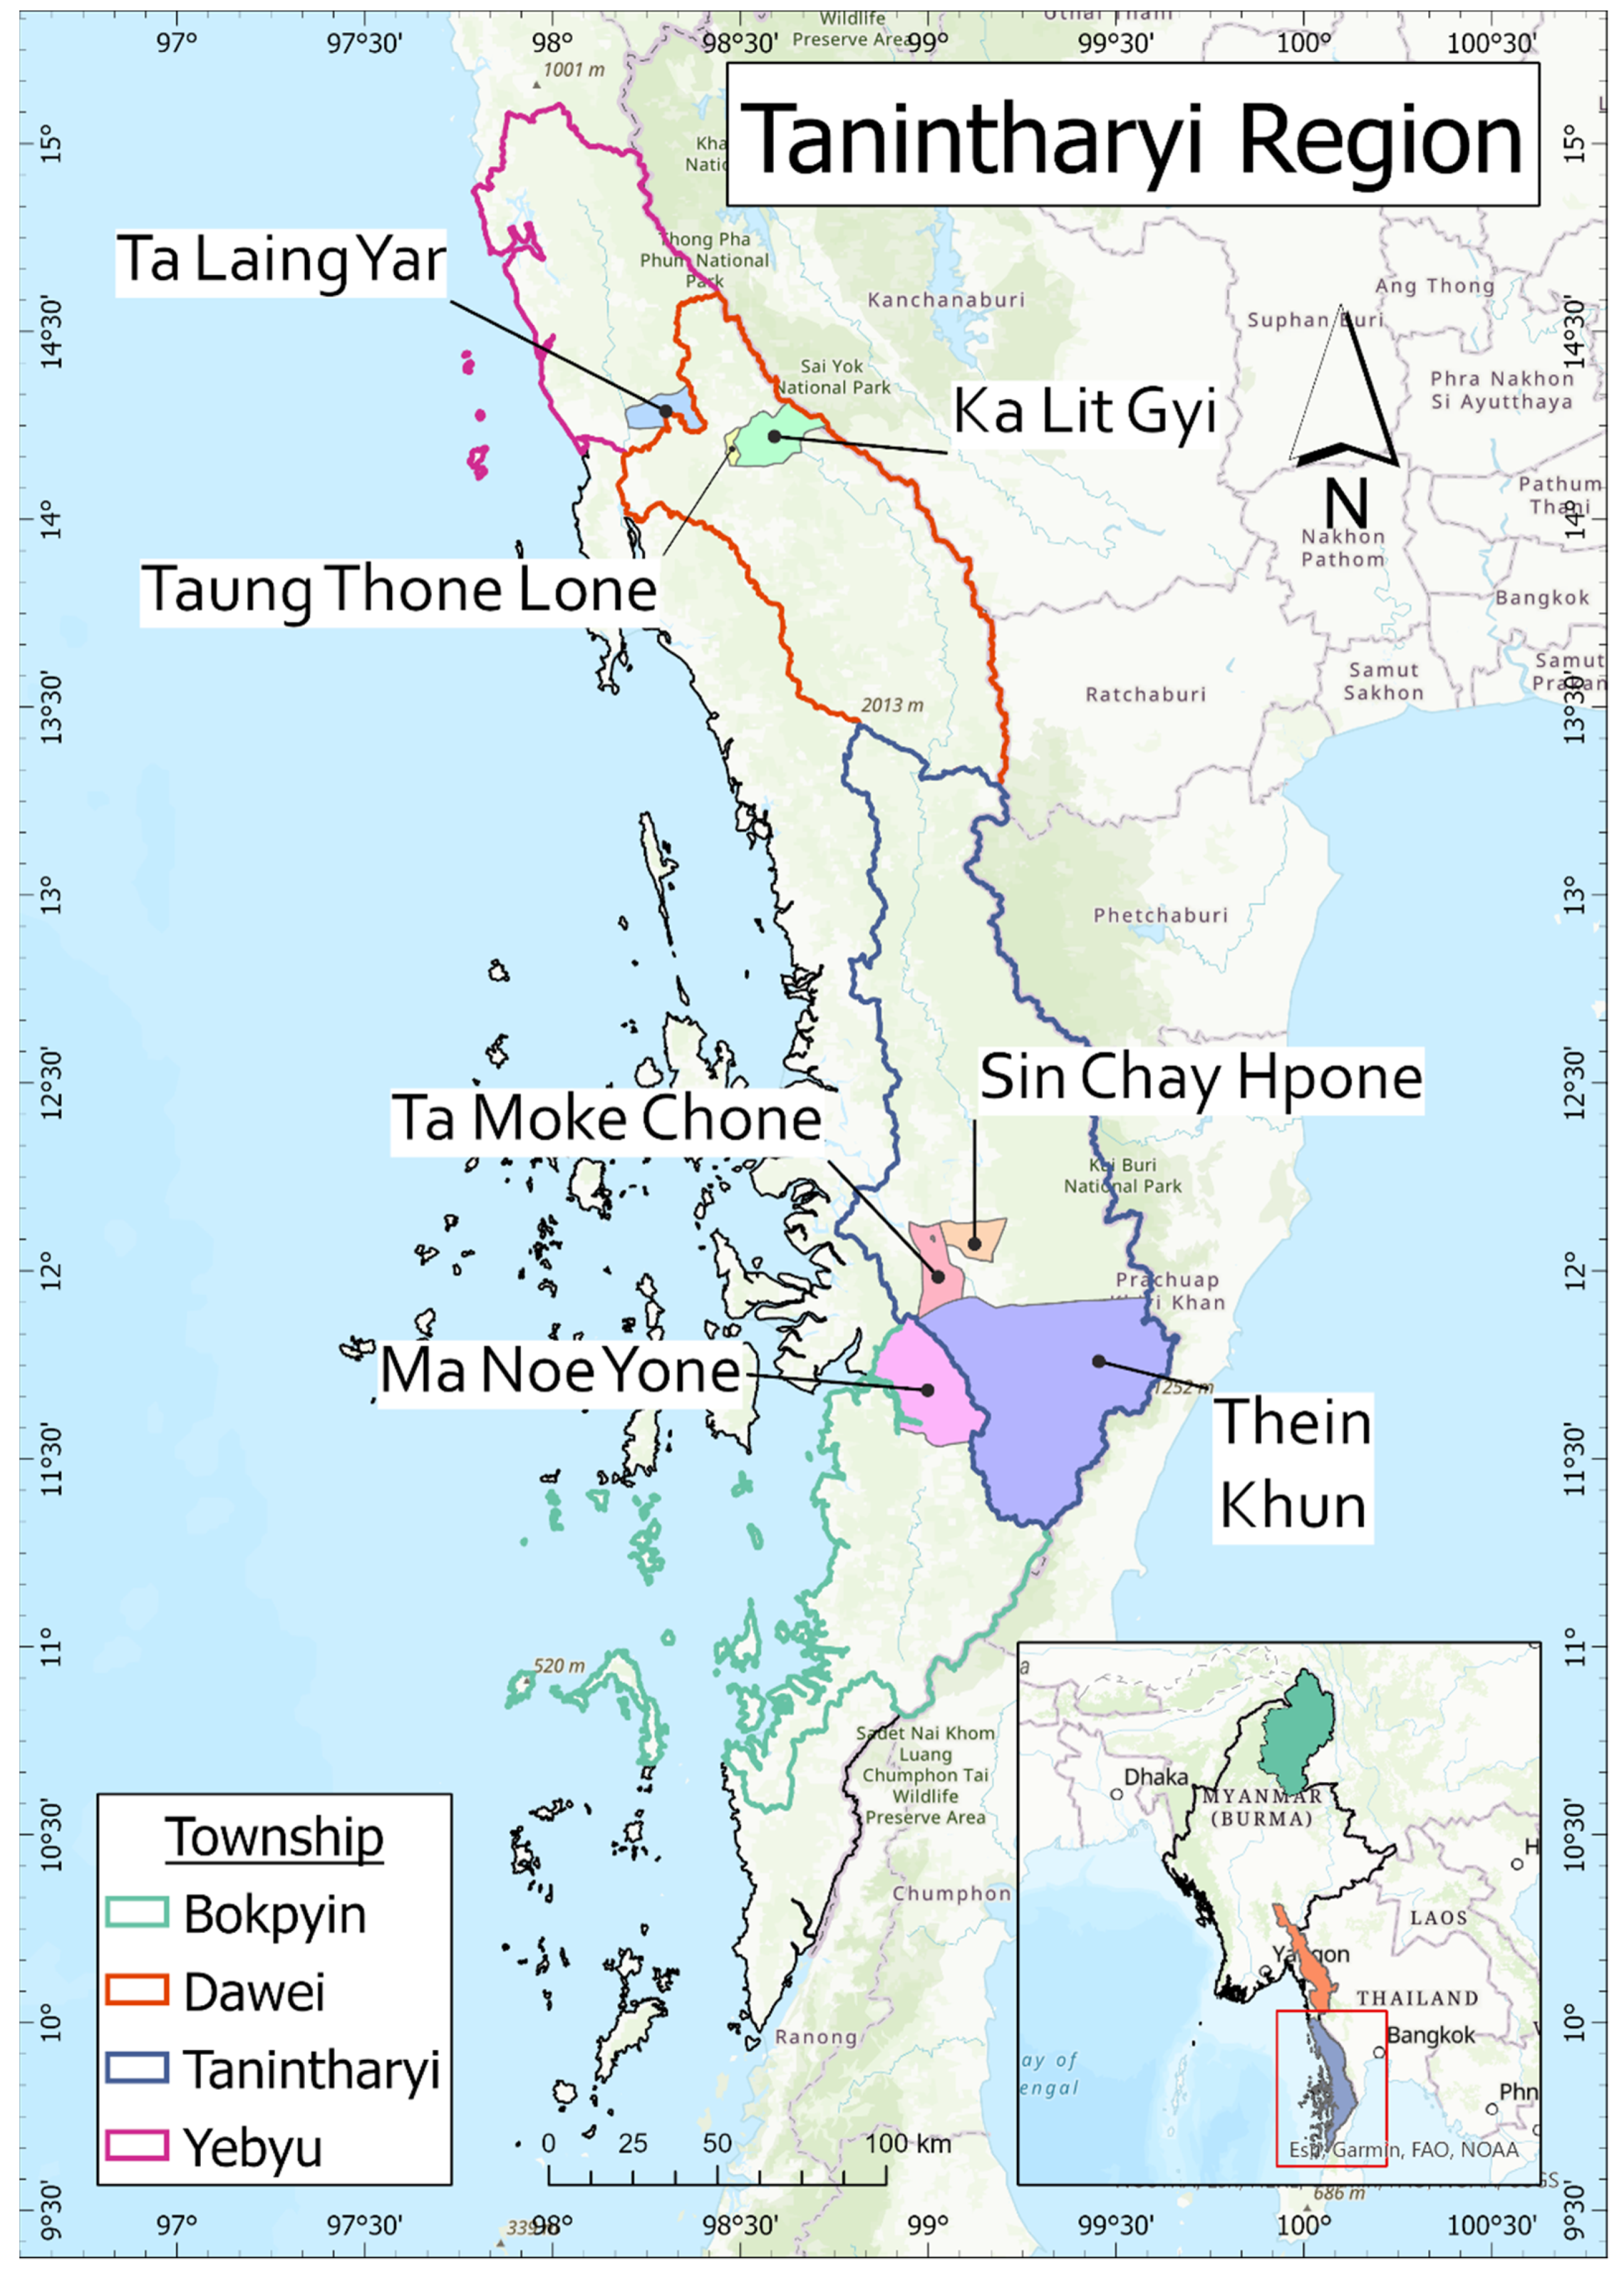
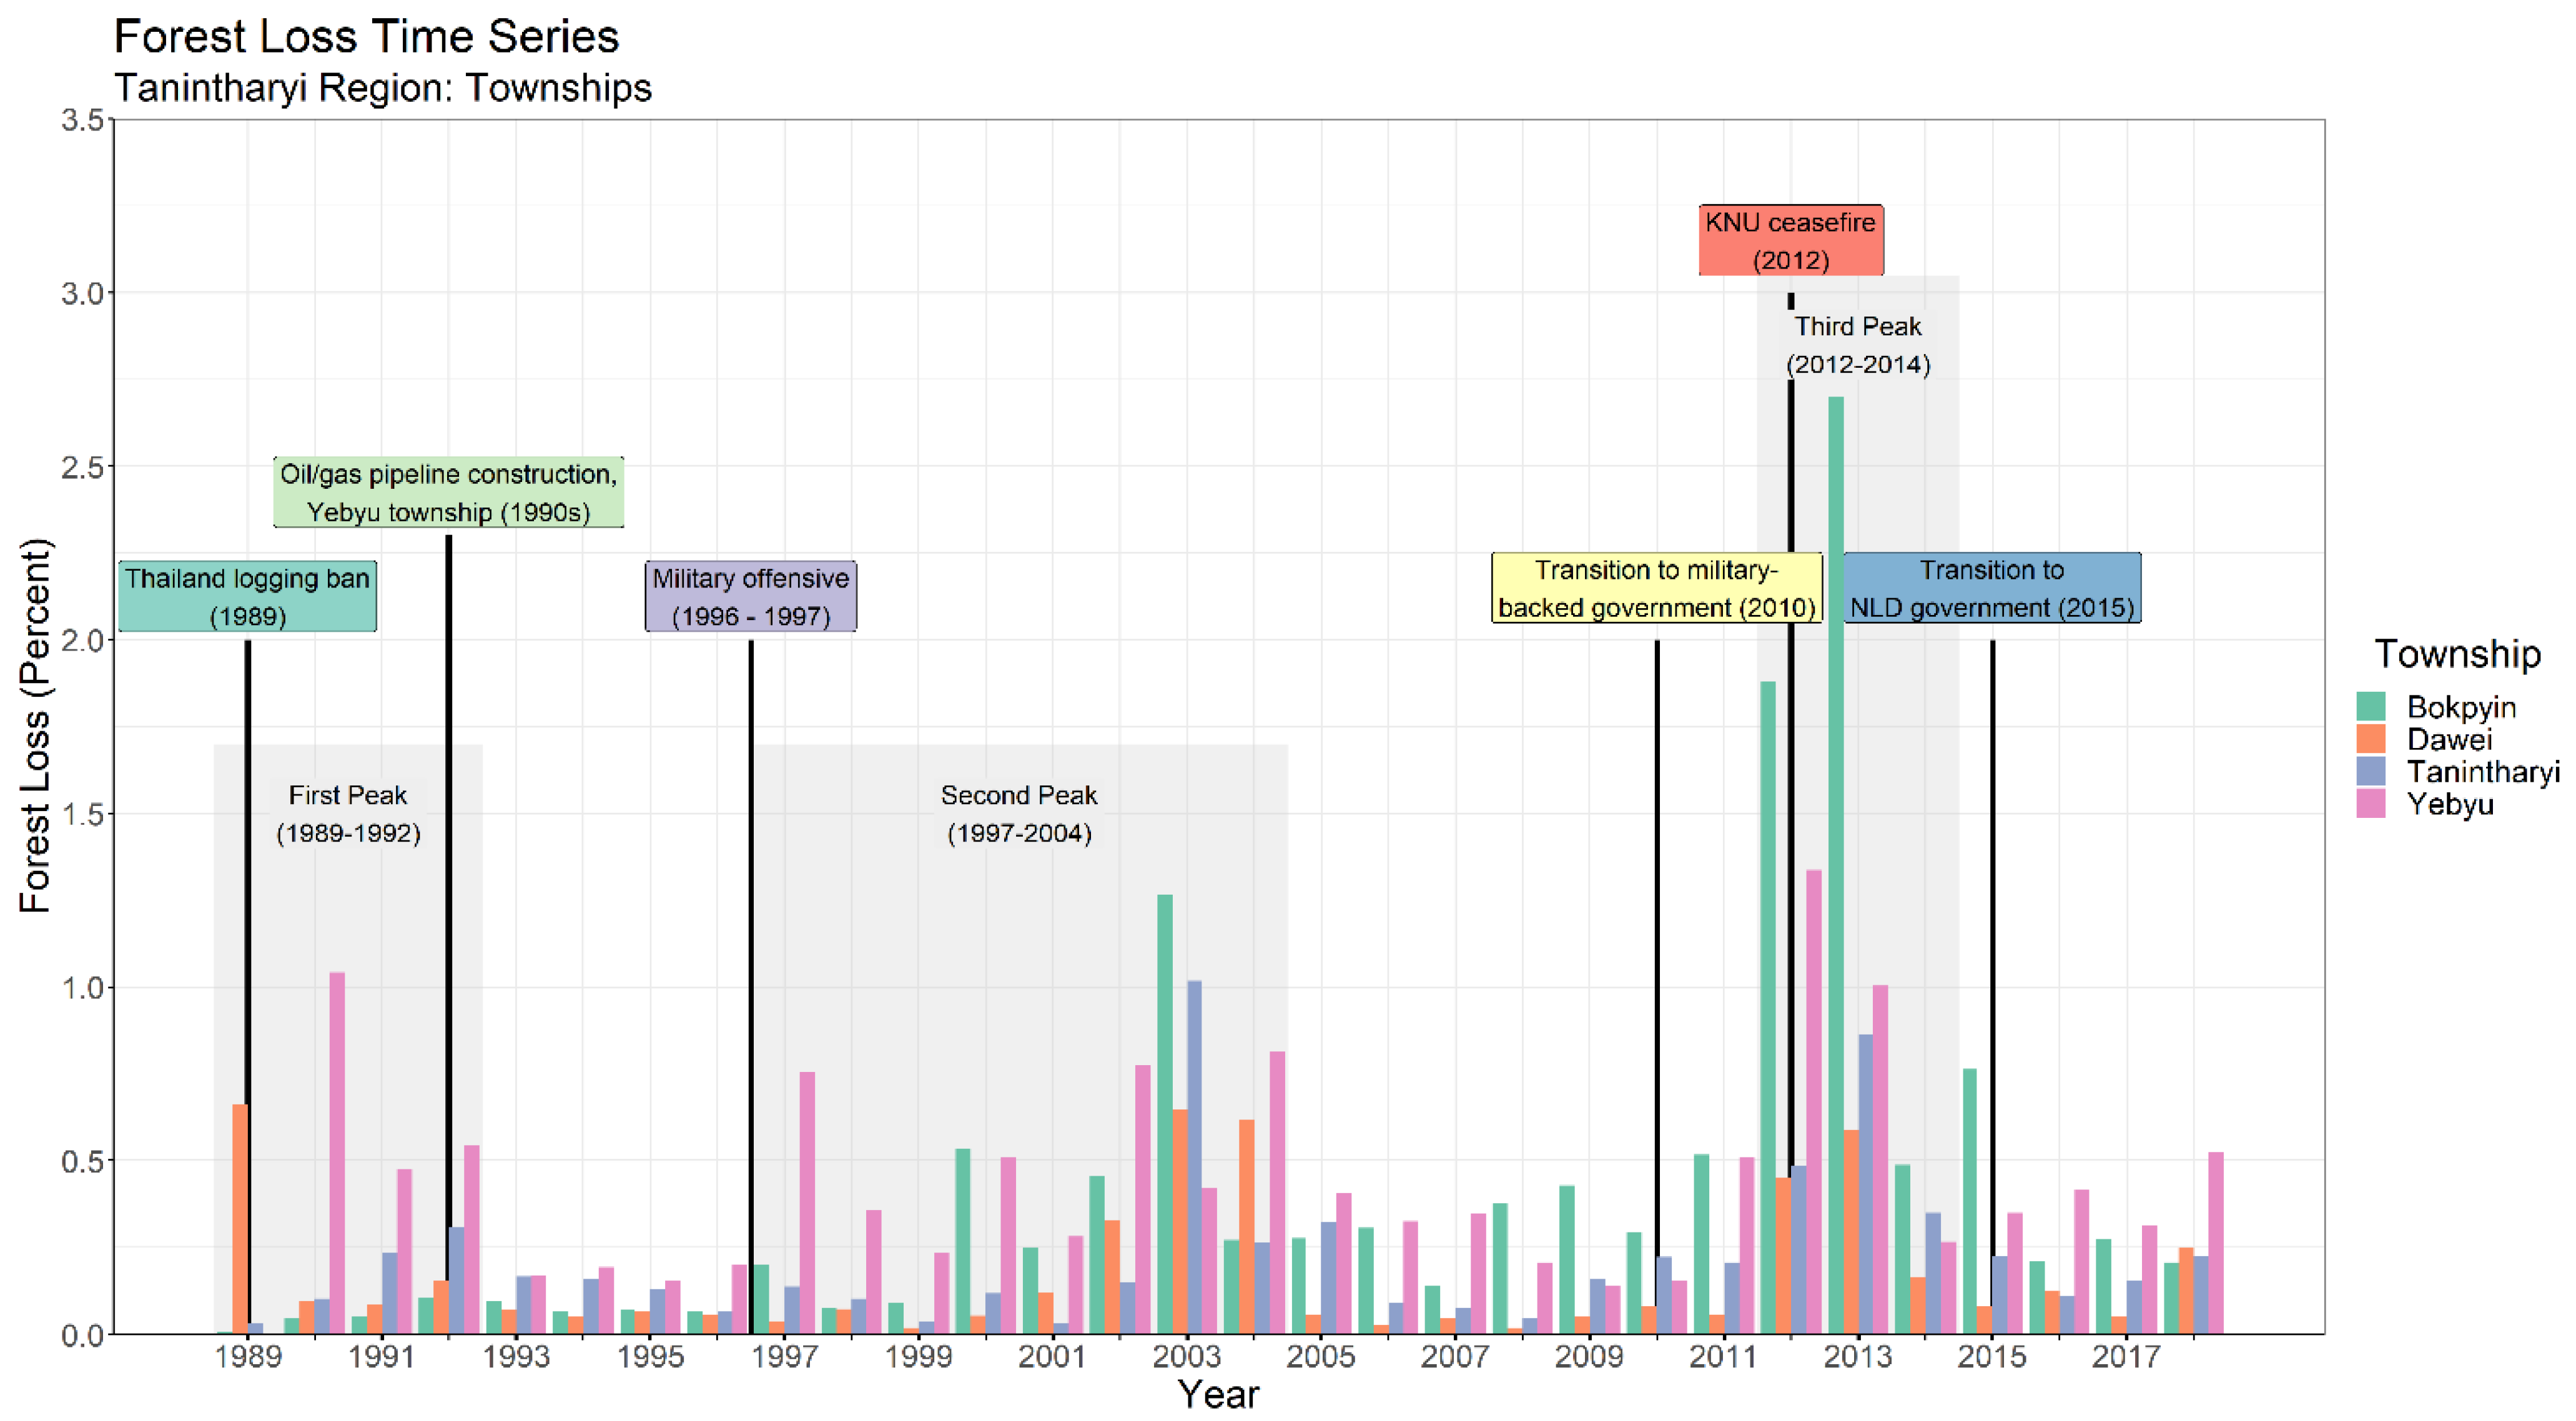
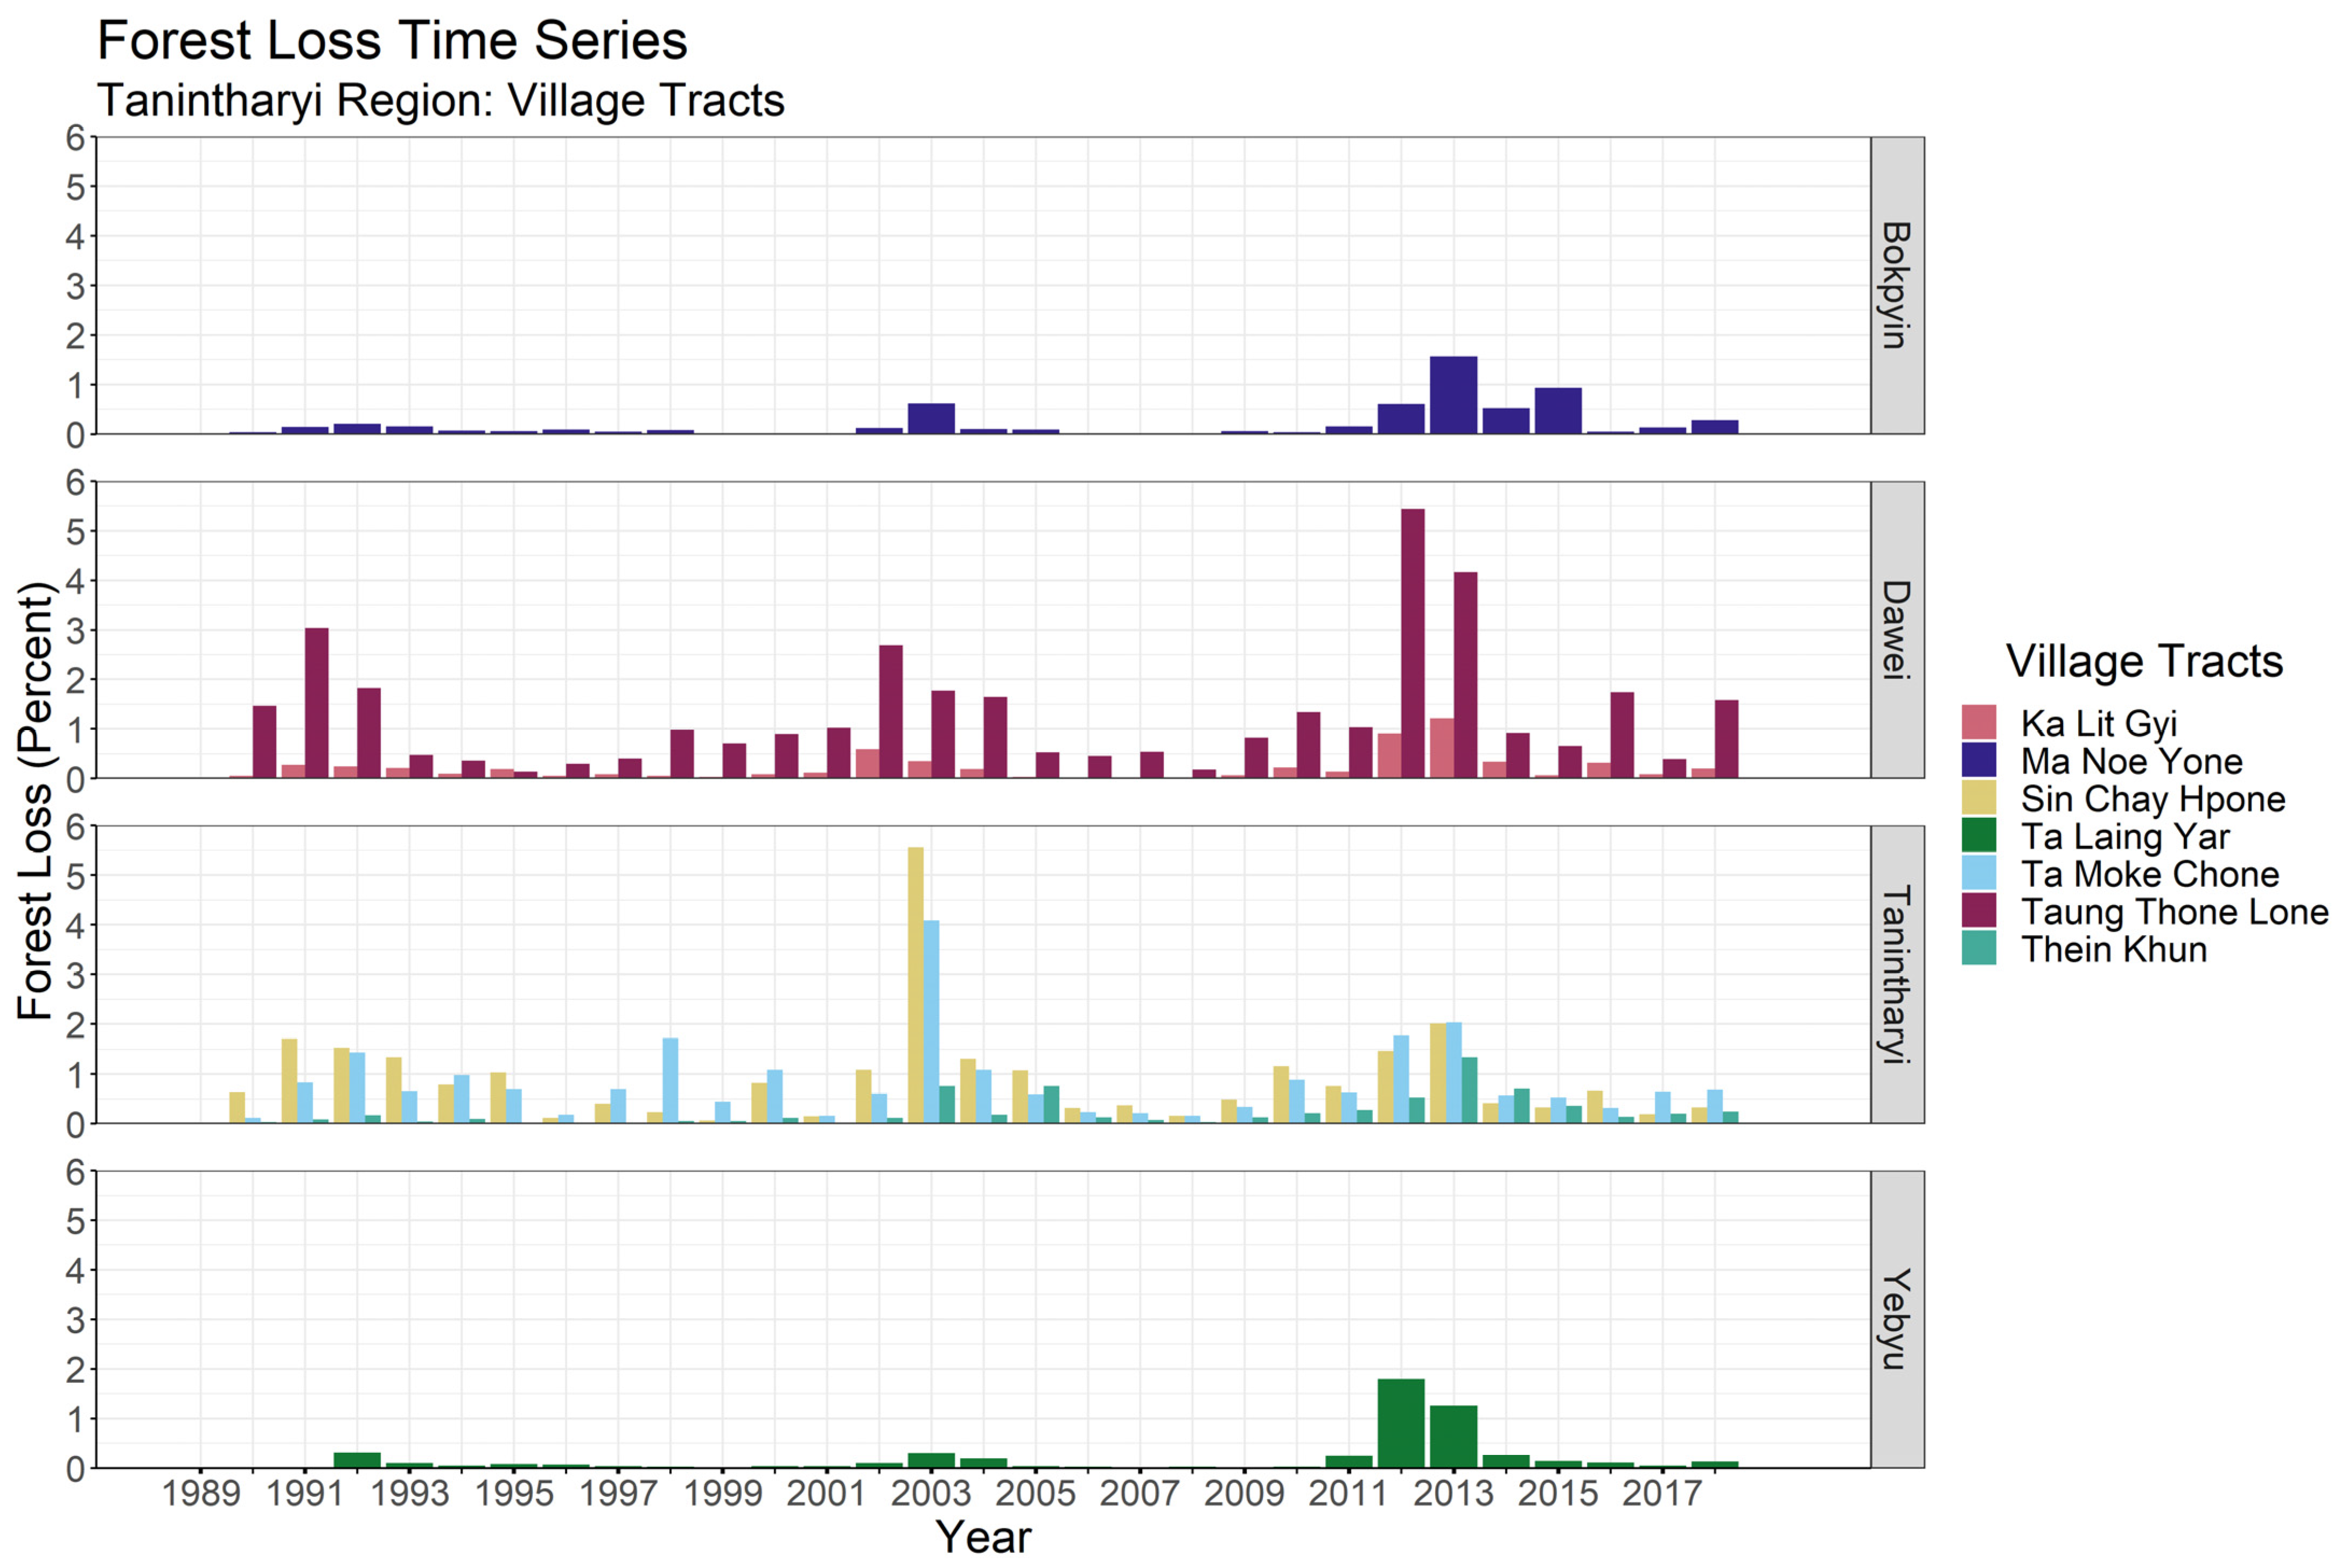
Tanintharyi Region is home to the Mekong Region’s last extensive lowland dipterocarp rainforests [67]. The region also has the most agribusiness concessions allocated in the country, with over 2 Mha designated as private oil palm estates [59]. What is known as KNU’s 4th Brigade (Myeik-Dawei) governs considerable territory here, mostly along the eastern half towards the border with Thailand where Kayin villagers reside in forest environments. Apart from a few village militias, this territory is administered by the government, KNU, or oftentimes both. Thailand’s geopolitical and business relations with Myanmar are tightly intertwined with Tanintharyi Region given their long border and proximity to Bangkok. We describe below how Tanintharyi Region’s deforestation trend is congruent with our national analysis, but with some variation that reflects the region’s particular ecology, armed setting, and relations with Thailand. Figure 4 is a map of Tanintharyi Region highlighting study townships and village tracts. Figure 5 shows annual forest loss for each study township and labeled with major multiscaled events influencing deforestation trends, and Figure 6 shows annual forest loss for each study village tract.

First National Deforestation Peak (Mid- to Late-1990s)

The initial deforestation spike we saw in Myanmar during the mid- to late-1990s began in Tanintharyi Region more than a half decade earlier. Apart from a single-year spike in Dawei Township in 1989, we found this initial period of higher deforestation rates from 1990 to 1992 for Yepyu Township, which is the most northern township in the region. The detection of change in forest cover only for this township during this time was tied to Myanmar’s then-military government signing their first major foreign investment deal after their major crush of democracy protests in cities across the country in the late 1980s. Led by Thailand, a consortium of global corporate oil and gas companies agreed to construct and operate an offshore pipeline overland across the northern portion of Tanintharyi Region on its way to Bangkok, Thailand. Constructing the Yetagon and Yadana pipelines posed an immediate security challenge, however, as the KNU (and a Mon EAO, the New Mon State Party, or NMSP) controlled much of the territory the pipeline would pass through [68]. Myanmar’s Union Armed Forces (commonly known as the Tatmadaw) first had to secure the wider pipeline area in much of northern Yepyu Township from possible rebel attack. Counterinsurgency resulted in roads built, Tatmadaw offensives against villagers and rebel soldiers who were forcibly cleared from the area, and forests cleared [69].
However, we also saw a lot of variation in LULCC in village tracts within Yepyu Township that did not correspond to this elevated deforestation rate in this township during this initial deforestation peak. The deforestation spike in the early 1990s in Yepyu Township was quite isolated to its northern portion and, therefore, we did not see a uniformly high deforestation rate for village tracts across the township. For example, Ta Laing Yar Village Tract on the southern boundary of Yepyu Township with Dawei Township did not register any significant deforestation in the early 1990s, according to our satellite data analysis.
Logging deals took place along the Thai borderlands throughout the 1990s in this region. However, logging operations did not extend the entire length of the borderlands; interviews indicated only the northern half of Tanintharyi Region and closer to the Thai border experienced this first wave of logging [70]. Indeed, we found elevated deforestation rates for the three northern townships bordering Thailand (Yepyu, Dawei, and Tanintharyi) during this period. Deforestation spikes in Ta Moke Chone Village Tract and Sin Chay Hpone Village Tract in Tanintharyi Township during this period supported this trend. Field interviews in these two village tracts confirmed a spate of logging operations during this time in and along the government’s Tanintharyi Nature Reserve (a proposed national park) in relation to the oil/gas pipeline [71,72].

Second National Deforestation Peak (2003–2009)

The second deforestation spike in Tanintharyi Region was considerably earlier than what our data findings showed for Myanmar and for the other states we studied. The military conducted a major military offensive against the KNU’s army in 1996–1997 in northern Tanintharyi Region, which resulted in KNU army bases swept aside by Tatmadaw soldiers. The military government and paramilitary groups, as well as KNU and their army leaders, began to engage in widespread logging operations from the Thailand border and along the widening road network. Remote sensing analysis demonstrated the sudden rise in deforestation rates during this second deforestation peak for Tanintharyi Region for the two townships easily accessible from Thailand (Yepyu and Dawei townships) and for those village tracts located in these two townships.
Taung Thone Lone Village Tract and the bordering Ka Let Gyi Village Tract in Dawei Township experienced high deforestation during this period. This pattern is explained by a Thai company who started to build a road in 1989 through this area and the surrounding plentiful forests, according to villagers’ testimonies. Villagers explained how they believed the actual purpose of the road was to access and cut down the forests it passed through. Once the road reached the Thai border in 1994, villagers described how Thai workers transported the timber across the border until the military offensive a few years later. Only once Thai workers fled for their safety back to Thailand did the logging operations temporarily cease. Remote sensing analysis supports this narrative with the sudden spike in deforestation rate for Taung Thone Lone Village Tract in the early 1990s (less so for Ka Let Gyi, however), but it then quickly dropped once the Tatmadaw commenced counterinsurgent activities in this area.
This second deforestation spike in Tanintharyi Region also strongly corresponded to the military state proclaiming in 1999 that Tanintharyi Region will be the “edible oil palm big pot of the nation” [65]. The government recorded at that time approximately 465,000 ha of forestlands in Tanintharyi Region as legally available for agribusiness concessions [65]. Most of the oil palm concessions were allocated in Bokpyin and Kawthaung townships located in the southern half of the region, although some very large concessions also became established in Tanintharyi Township as well. The military government allocated oil palm concessions of various sizes to over 50 national crony companies (and a few foreign-leased concessions), some upwards of hundreds of thousands of hectares. According to one estimate, the oil palm estates cover 18 percent of the total land area of Tanintharyi Region, which is the highest concentration of agribusiness acreage in the country [65]. The military government allocated many of these oil palm concessions inside state forest reserves. Villagers subsequently reported widespread logging inside oil palm concessions, as well as beyond concession boundaries [73]. According to interviews, logging in and around oil palm concessions picked up considerably by the early to mid-2000s, which is also supported by government data [65] and remote sensing studies [74]. Although some concessions did not get cleared (or planted in oil palm) [75,76], our deforestation data show that the large number of allocated concessions correlated with a high level of forest clearing during this period at the corresponding township and region level.
In addition to forest conversion from oil palm concessions, the state-owned Myanmar State Enterprise (MTE) conducted logging operations, as well as granted logging concessions to local cronies, in state forest reserves in surrounding areas, according to village testimonies. State-sponsored logging was much more rampant in the 2000s because the military government gained greater control over the area as a result of the 1996–1997 offensive and the expanding road network.
The twin drivers of logging concessions and forest conversion to oil palm caused a deforestation surge during the early to mid-2000s, as shown by our remote sensing data for both Tanintharyi and Bokpyin townships where many of these large concessions are located. We saw this trend for all the village tracts we studied in Tanintharyi Township (Sin Chay Hpone, Ta Moke Chone, Tha Kyet, and Thein Khun), despite their geographical distance from each other and their varied local conditions. We also found an uptick in deforestation for Ma Noe Yone Village Tract in Bokpyin Township during this same period due to the allocation of logging concessions in the bordering state forest reserve, on the heels of three consecutive counterinsurgency sweeps through this strategic village tract area that straddles the southern stretch of KNU’s territory.

Third National Deforestation Peak (2012–2013)

The third peak we found for Myanmar from 2012 to 2013 closely aligned for Tanintharyi Region and its townships, although with notable variation among village tracts. KNU’s ceasefire in early 2012 came at the same time (and not unrelatedly) to the new government’s political economic reforms. This set of conditions sparked a boom in capricious investment in land and resource-based industries, predominately from Thailand [77,78]. This new spate of land and resource grabs coincided with a government-sponsored push for physical infrastructure development in rural forested areas. An expanding road network began to better link the interior of Tanintharyi Region to Thailand, cutting roads through forested mountains that previously only had dirt tracks. This led to another phase of concentrated logging operations along infrastructure corridors [79,80]. KNU’s ceasefire improved human security and political stability, which subsequently allowed many Kayin villagers to return to their agricultural livelihoods. However, the ceasefire condition and road building also encouraged in-migration by non-Kayin landless farmers and other opportunists from other areas of the country.
For example, a significant road upgrade passed through the heart of the heavily forested Tanintharyi Township on the way to the new border town of Mawdaung. The road is economically very important to both Thailand and Myanmar since it links the port town of Myeik on the region’s Andaman coast, with its thriving fishing industry long connected to Thailand by their robust seafood trade. Construction of this two-lane all-weather road, which traverses through the government-demarcated Thein Khun Forest Reserve and alongside the village tract of the same name, began in 2013. Timber companies logged much of the intact forest along its corridor within a few years. Migrants poured into this area thanks to greater accessibility and promises of new opportunities the road offered to this remote outpost. Land parcels along the road were established in some places by landless migrants looking for cash cropping opportunities, or by businessmen from Myeik looking to open small shops and offer credit to this new cash economy. This loosely-run frontier town attracted many “get rich quick” schemes that resulted in illegal forest conversion within the Thein Khun Forest Reserve. Our remote sensing data analysis confirmed this narrative, with a sudden peak in deforestation rates for Thein Khun Village Tract for this period.
Further north in Dawei Township, the infamous Ital-Thai Co. (ITD), Thailand’s largest construction company, started building a large road in 2011 that would connect the KNU-controlled border at Htee Kee village to the Dawei Special Economic Zone (SEZ), which is advertised as the Mekong region’s next largest port [81]. The two-lane paved road and plans for the Dawei SEZ proceeded throughout the 2010s, clearing timber and villagers’ agricultural and tree plantations fanning out from the site of the port [79]. Villagers in both Taung Thone Lone and Ka Let Gyi village tracts in Dawei Township near to Myitar town, and in Ta Laing Yar Village Tract in Yepyu Township on the border with Dawei Township, described significant land cover change at this time in association with the development of the Dawei SEZ and its extensive road linkages through forested hills inhabited by largely subsistence agricultural households. This explains the resurgence in deforestation registered by our satellite imagery for these village tracts from 2011 until the SEZ project stalled five years later due to uncertain finances [82].

3.2.2. Kachin State

Kachin State is along the Yunnan, China border, in the opposite corner of the country as Tanintharyi Region. Along with Tanintharyi Region, Kachin State has the largest remaining intact forests and the highest percentage of agribusiness estates by total acreage in the country [59,65]. Kachin State has experienced a long history of ethnic-based armed political conflict, but of a different political configuration compared to the southeast. The KIO, the most prominent EAO here, has been leading Kachin-based armed rebellion and rebel governance institutions since the 1960s. There are also several prominent paramilitary organizations here that are established by leaders who broke off from the KIO, but who struck a deal to fall under the tutelage of the Tatmadaw, at times fighting against the KIO [39]. These paramilitary groups control their own territory and soldiers they can call upon in times of need. This political status allows them to conduct their own business in natural resource extraction, agribusiness, and illicit drugs within and beyond their territories of influence [83]. These ecological and political conditions located in Yunnan’s back door set the stage from the late 1990s for continuous logging and forest conversion.
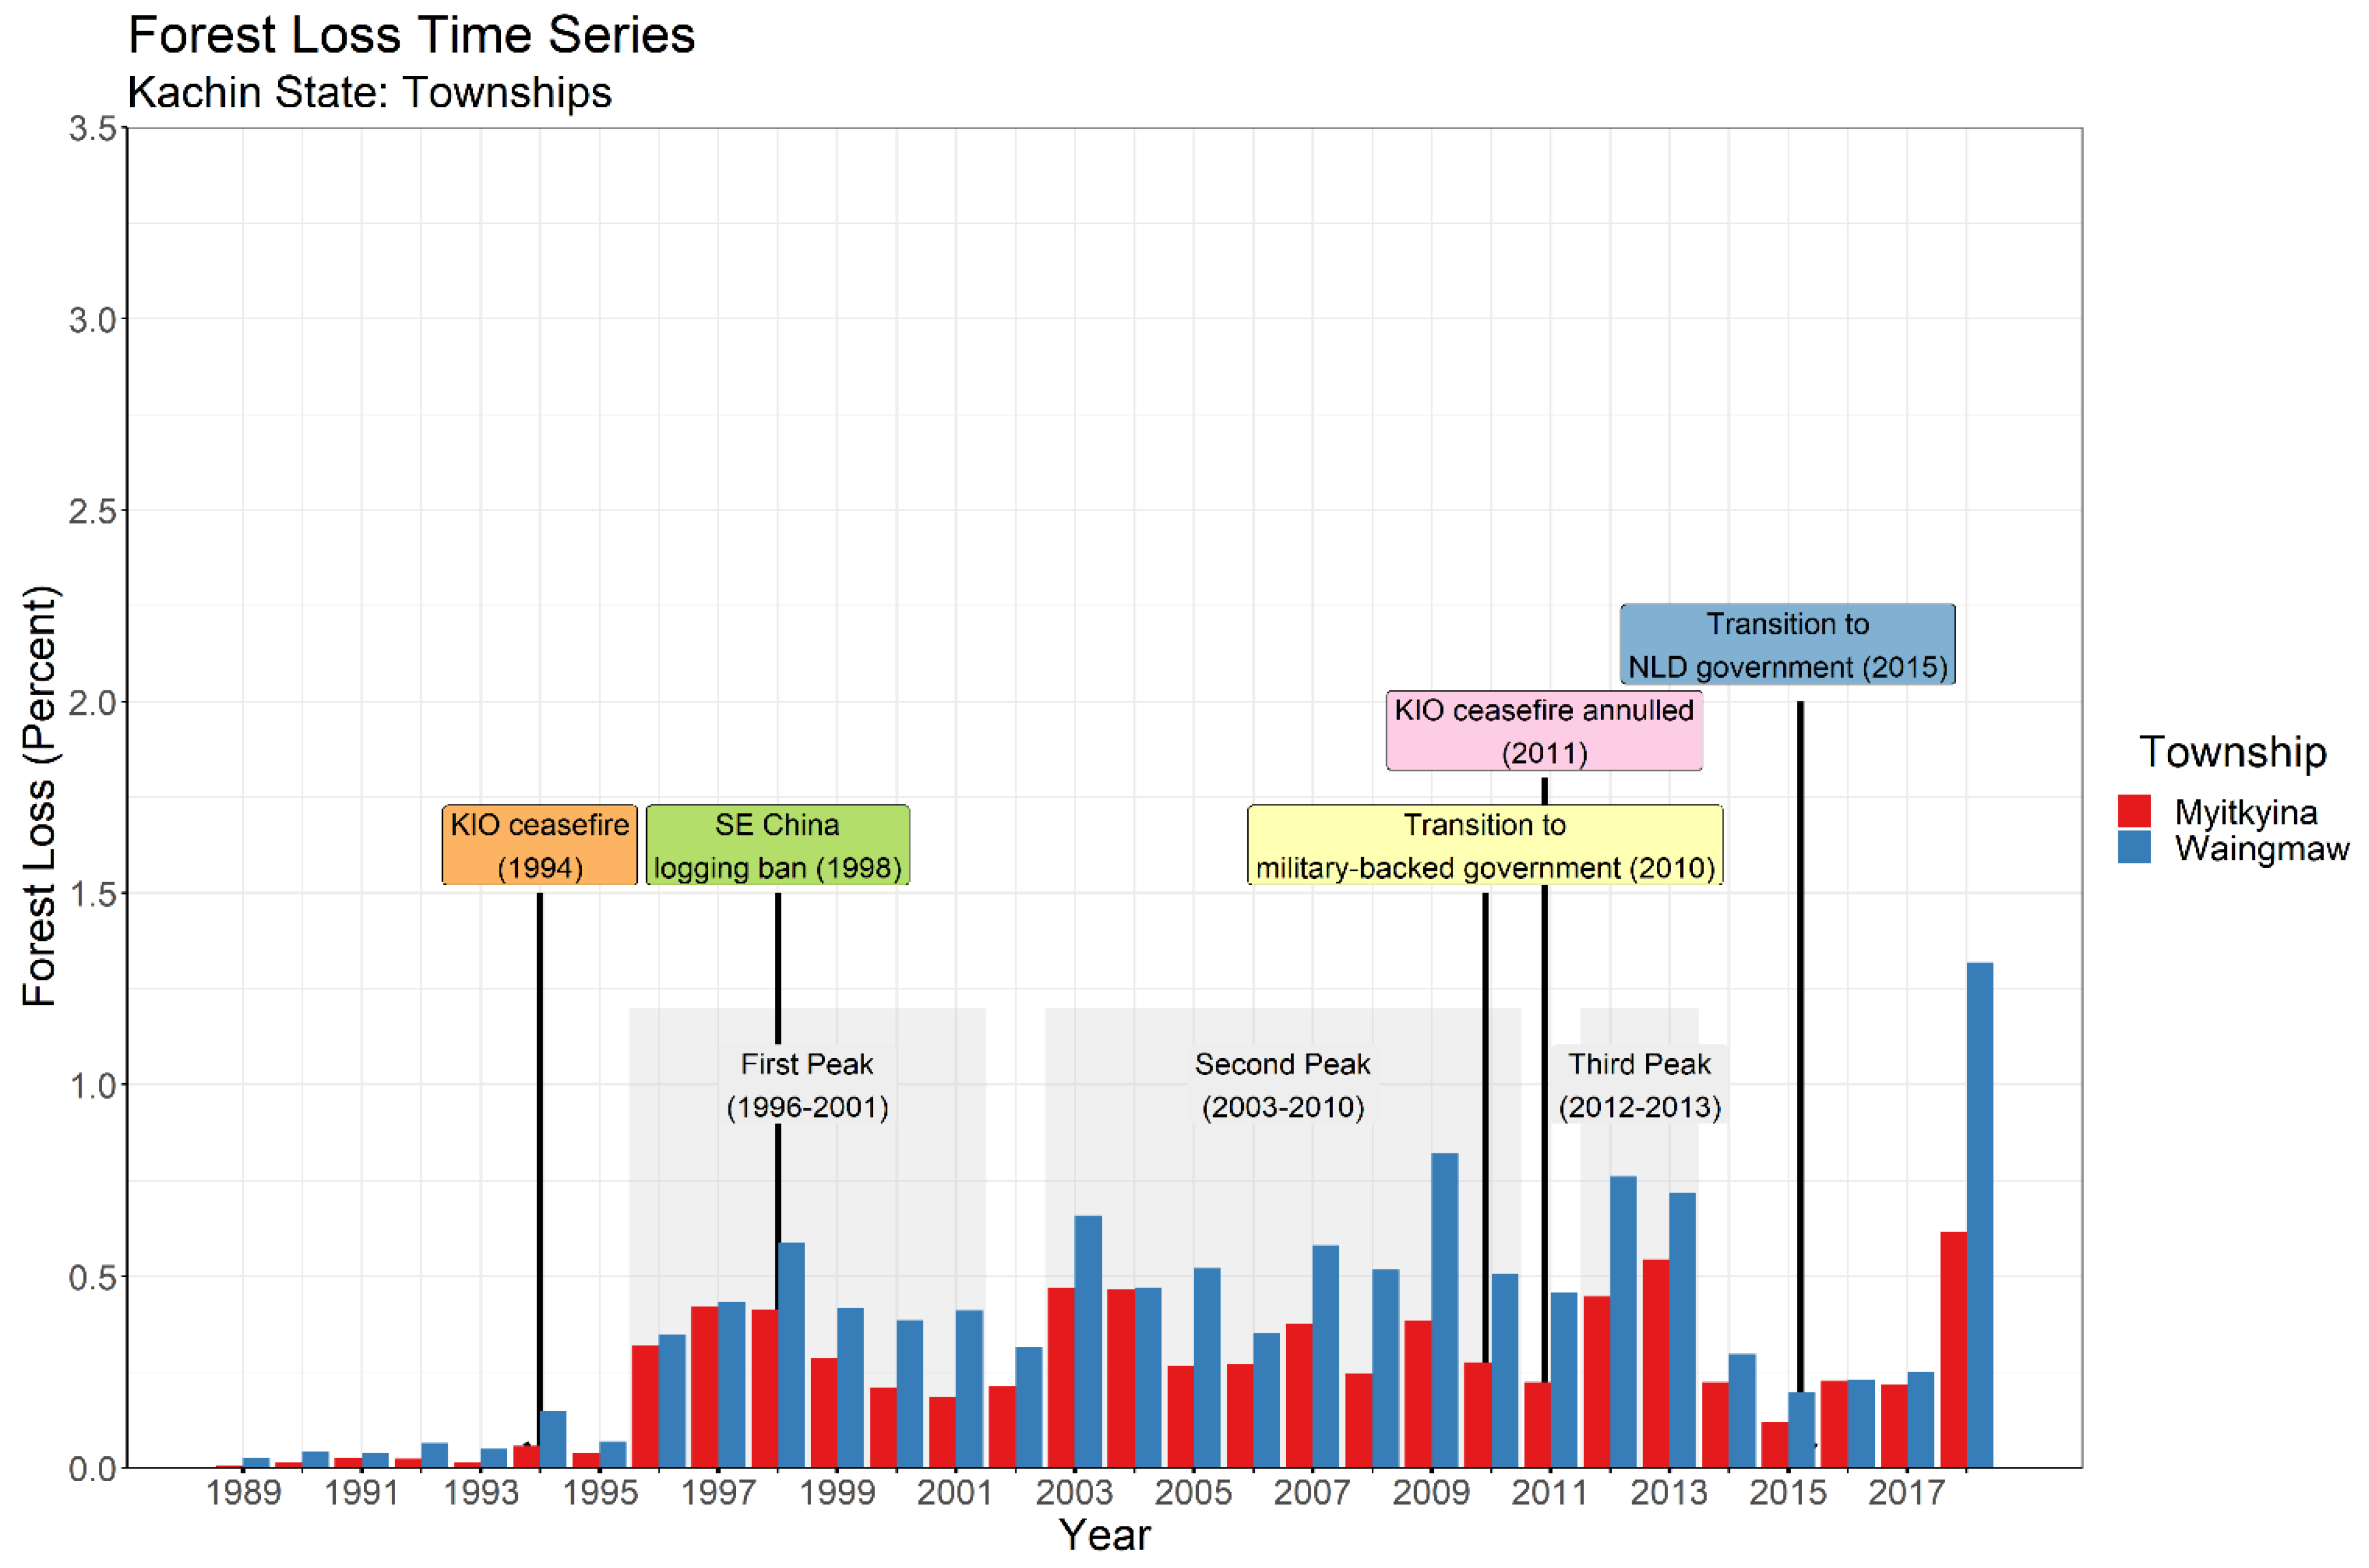
We describe below how Kachin State’s deforestation crisis in many ways paralleled the country’s trend, but with considerable variation due to its armed conflict and geopolitical dynamics that were specific to the north. We found even greater heterogeneity at the village tract level, with an example of a 3000-m village radius to demonstrate the difference finer-scaled analysis can make in our understanding of armed conflict-related factors driving deforestation. Figure 7 is a map of Kachin State highlighting study townships and village tracts, Figure 8 shows annual forest loss for each township labeled with major events, and Figure 9 shows annual forest loss for each village tract.

First National Deforestation Peak (Mid- to Late-1990s)

The first deforestation peak in Kachin State shown by our remote sensing analysis was similar to the period we saw for the national trend for the mid- to late-1990s, unlike for the southeast that began five years earlier. The KIO ceasefire in 1994 and China’s shifted geopolitical relations with these borderlands explain this trend.
During the early 1990s, Kachin State (and the rest of the China borderlands) were still dealing with the political chaos of the end of the Cold War. The Communist Party of Burma (CPB) fell in 1989, resulting in a fracturing of EAOs, many of whom subsequently signed ceasefires with the military government immediately thereafter. The KIO at first resisted such a truce, but eventually agreed to ceasefire in 1994. It was not until several years after KIO’s ceasefire that security began to incrementally improve, which soon proved sufficient for orchestrating logging deals.
During the first half of the 1990s, the national Chinese and provincial Kunming governments remained cautious with how to engage with Myanmar’s military government after the fall of the CPB. By the latter part of the 1990s, China shifted their support from armed rebellion to doing resource-based business deals with many of these ethnic armed leaders, and increasingly with the Tatmadaw too. Meanwhile, the KIO, along with paramilitary organizations and other EAOs in the north who signed ceasefires, transitioned from war to economic pursuits, mostly in jade mining and logging [84]. Once those new geopolitical and ceasefire conditions took hold, Kachin State experienced a marked increase in deforestation [57,58], as shown by our remote sensing data analysis for the state.
By 1996, Waingmaw and Myitkyina townships started to lose significant forest cover, as can be seen in our remote sensing data analysis. These two townships are most central to Kachin State’s economy and are easily accessible to the nearby Yunnan border by a network of roads, some paved. Only four years after the KIO’s ceasefire, the World Resources Institute (WRI) estimated that the rate of deforestation in Kachin State had more than doubled [85].
The collection of villages that encompass Mong Nar and Man Wein village tracts in Waingmaw Township are strewn along a road that leads to Myitkyina, the state’s capital city in the township of the same name. In the near distance to Mong Nar Village Tract rise two mountains that are state protected forest reserves: Washaung and Hkang Bum. Man Wein Village Tract is near to Ragu Bum mountain but is not designated as a state forest reserve. During the mid- to late-1990s, field interviews uncovered how logging was rampant in these mountains by KIO leaders and a paramilitary group. These logging activities were shown by our satellite imagery with slightly higher deforestation rates in these village tracts during this time.
Ta Law Gyi Village Tract is located in the adjacent Myitkyina Township, north of the capital of the same name. The collection of villages that comprise the village tract are along a historical road that links Myitkyina town to the Yunnan border, which has long been used as an artery of communication, resource trade and migration. During the mid- to late-1990s, logging operations began in this village tract, especially in the Ta Law Gyi Forest Reserve nearby, as well as just to the east in unreserved forests, due to its proximity to the capital city and its connectivity to the China border. KIO’s Buga Company orchestrated most of these logging activities in this area with Tatmadaw leaders and Chinese businessmen. We discuss our findings for the 3000-m village radius in Ta Law Gyi Village Tract for the second deforestation peak further below.
During this first deforestation period, farming households also started to re-establish and expand their agricultural fields due to greater political stability and human security offered by the ceasefire condition. These new farms oftentimes opened new lands along the forest edge, according to interviews, with some local elite entrepreneurs beginning to establish some rubber plantations as the rubber price rose.

Second National Deforestation Spike (2003–2009)

By 2003, China imported 1.3 Mm3 of timber from Myanmar, more than a six-fold increase from just over 200,000 m3 imported in 1997 [86]. In response to increased scrutiny and international condemnation of the rampant Sino-Myanmar timber trade, the Yunnan provincial government, in cooperation with the Chinese People’s Armed Police Force for Border Affairs, declared it illegal in 2006 for Chinese to enter Myanmar for logging (and mining) purposes. Subsequently, the Kunming provincial government clamped down on the major border crossings to curtail the timber trade [87]. These timber trade restrictions appeared to have significantly decreased Chinese logging operations in Kachin State immediately following this regulation, according to field interviews and timber trade data [58].
The logging frenzy since the late-1990s quickly transitioned, however, into an agribusiness frontier in the mid-2000s as the next primary driver of deforestation during this second sustained peak in Kachin State. Faced by growing obstacles to log and transport timber into Yunnan due to this new timber regulatory environment, Yunnan-based companies looked for new business opportunities in northern Myanmar. During the same year as the implementation of these new cross-border timber regulations, China’s national government revamped their national opium crop substitution program to promote Chinese agribusiness in northern Myanmar (and Laos) to, as the reasoning went, help shift the economy away from the illicit drug production that plagues these borderlands [88]. China’s government revised their national opium substitution program in 2006 so that Chinese companies themselves implemented agricultural projects rather than as bilateral government projects as had previously been the case [88]. The Chinese government offered financial subsidies and tariff-free import quotas to mainland Chinese companies who invested in agricultural production in northern Myanmar (and Laos) [89].
The global rubber price in the mid-2000s was very high, which contributed to a lucrative rubber latex market–augmented by China’s short supply of rubber latex to meet their rapidly expanding automobile market. When China’s opium substitution program got underway, Chinese companies worked with their business partners in Kachin State (and northern Shan State) to establish rubber estates subsidized by this program [83,90]. Chinese companies’ business partners across the border were predominately ethnic Burmese strongmen in the locales where they received a concession. Ironically, this often meant Chinese companies backing paramilitary leaders who were involved in the illicit drugs economy [83]. Chinese investment in agribusiness, along with lower-level logging operations, drove elevated deforestation rates in Kachin State throughout the 2000s.
Kachin State and Myitkyina Township had continuously elevated forest loss during the latter part of the 2000s, whereas Waingmaw Township had a gradually increasing deforestation rate, as shown by our remote sensing data analysis. This trend can be explained by the greater restrictions on cross-border timber trade, but it was replaced by a surge in conversion to rubber concessions. A 3000-m radius analyzed around the village where interviews took place (anonymous for security reasons) within Ta Law Gyi Village Tract showed very elevated deforestation rates (5–8% per year) during the late 1990s until the mid-2000s, the period villagers reported logging operations most rampant. The rate of forest loss at this finer scale was considerably higher than for the village tract (<0.5%) it is located within. However, our remotely-sensed deforestation analysis did not register logging hotspots in this township or village tract during this period of time. This very high rate of forest loss for the 3000-m radius suddenly dropped in 2005, after which it maintained a lower rate until 2011, similar to the village tract it is located in. This is explained by our methodological choice of a focus group discussion that included villagers mostly from the village nearest to where logging activities had been most severe, and which had been uniformly heavily impacted by China’s new logging and timber trade restrictions in 2006.

Third National Deforestation Spike (2012–2013)

The third deforestation peak period for Kachin State and the townships under study was found to have several notable differences compared to the national level. In Kachin State, this final deforestation peak commenced several years earlier, in 2009, and continued until 2014. The loss of forest rapidly increased in Kachin State for the first two years after KIO’s ceasefire fell apart in 2011. Although the high deforestation rate dropped around the same time as the rest of the country, the reasons for this in Kachin State were more closely associated to a resumption of war following the collapse of KIO’s ceasefire in 2011. Sino-Myanmar relations, cross-border timber regulations, an emerging agribusiness sector in response to the region’s illicit drugs economy, and a resurgence in armed conflict all interactively shaped deforestation trends during this period.
After the global rubber price bust in 2008 and the plummeting of Myanmar’s rubber latex price several years later [91], the third deforestation spike began for Kachin State and the townships under study. The rubber price crash prompted Chinese companies operating rubber plantations in Kachin State to look for a more profitable alternative crop. Beginning in the late 2000s and quickly gaining popularity into the early 2010s, Chinese companies started to convert large swaths of land to growing tissue culture banana for export to China. Most conversion to banana plantations was in Waingmaw Township, much like for the rubber industry earlier, as well as somewhat across its administrative border with Myitkyina Township (and Momauk Township) [92]. Waingmaw Township exhibited this elevated deforestation trend. The somewhat lower rates for 2010 and 2011 can be explained by the transition to the new national government administration and the return to war in the north that resulted in a return to high political instability.
At finer scales, however, we saw significant divergences from these broader-scaled trends. Variation among scales is explained by the territorial effects of KIO’s lapse in ceasefire and a return to war. For example, Lasang Awng Wa, who absconded from the KIO in 2006, formed a paramilitary organization known by his name. As a Tatmadaw reward for breaking away from the KIO, his militia organization gained control of the area that includes Mong Nar Village Tract in Waingmaw Township. His company subsequently operated many agribusiness concessions here with Chinese financing. We saw annual increases in the deforestation rate for Mong Nar Village Tract starting in 2007, with a gradual decrease after its peak in 2012. These elevated deforestation rates were able to be maintained throughout the return to war in Kachin State because Lasang Awng Wa could continue his logging and agribusiness operations due to his protective status as a paramilitary group. These high rates of forest loss are further corroborated with the national trend in the lead up to and just after the 2010 national elections.
Another paramilitary group, the New Democratic Army-Kachin (NDA-K), broke off from the KIO decades ago. The NDA-K wields considerable authority in certain territories and maintains their leader’s strong roots in Yunnan (Baoshan). Companies directly linked to the NDA-K leader and his children were heavily involved in logging during the 2000s. They began to diversify into the agribusiness sector since the mid-2000s, following China’s opium substitution subsidies. For example, interviews described how the NDA-K leader’s company switched from logging to banana concessions in Man Wein Village Tract, Waingmaw Township, starting in 2008, which is known to be one of the first Chinese-financed banana plantations in Kachin state. This may be due to very little accessible valuable timber that remained in the vicinity of this village tract by that time due to NDA-K’s extensive logging operations the past decade here. The NDA-K’s companies continued to expand banana in this village tract every year thereafter. Much like for Lasang Awng Wa’s agribusiness investments in Mong Nar Village Tract, the NDA-K were also able to continue their operations in Man Wein Village Tract even after KIO’s ceasefire ended since both these paramilitary outfits had Tatmadaw protection and kept KIO from claiming this territory.
We found a divergent deforestation trend when we examined our other two village tract study sites in Myitkyina Township, however, owning to a different set of armed conflict dynamics in relation to agribusiness. For example, remote sensing data for Ta Law Gyi Village Tract shows a sudden drop in deforestation in 2011, several years before we saw a more gradual decrease at the township and state level. Field interviews discussed very intense fighting between the Tatmadaw and the KIO’s soldiers in this village tract, but it did not spread throughout the township. For this reason, we saw a drastic reduction in deforestation starting in 2011 in Ta Law Gyi Village Tract since agribusiness and illegal logging operations closed as workers fled the fighting, and which remained paused for several years thereafter. We registered a slightly higher deforestation rate during this period at the 3000-m radius scale around the village study site, which was again understood as more fully encompassing the hotspots of logging and forest conversion to banana. Remote sensing data for Myitkyina Township indicated an uptick in deforestation from 2011 to 2013, the opposite for Ta Law Gyi Village Tract, presumably from an expanding Chinese agribusiness sector in areas where fighting did not disrupt concession expansion activities. This is a good example of how finer-scaled remote sensing analysis can better capture localized armed conflict dynamics and the corresponding effects on forest loss.

4. Discussion

Lambin et al., who are largely responsible for the initial methodological innovation on drivers of deforestation, later argued for moving beyond the myths and simplifications around the causes of LULCC [93]. They believed this could only be achieved by employing multiple scales of analyses and different spatial resolution imagery, and by the inclusion of the social, economic, and political processes underlying the generation of observed spatial patterns. Relatedly, they and others stressed the importance of understanding the multifaceted interaction of agroecology and the sociopolitical history in specific locations under particular contexts [13,94].
In our case study, we stressed the importance of geopolitics, insurgency, and ceasefires as the underlying political context that influenced LULCC. Scholars who study the relationship between insurgency and LULCC, most recently on the FARC in Colombia, prioritize studying the effects of ceasefires or peace deals on forest cover change as a measure of postwar development indexes [8,14,16,20]. In our study, however, we did not find a singular strong correlation between deforestation rates and ceasefire conditions. The KIO in Kachin State held to ceasefire terms from 1994 to 2011, whereas the KNU in Tanintharyi Region and Kayin State did not agree to a ceasefire until 2012, which held through the end of our study. These two different armed conflict scenarios, one region with a ceasefire and the other without, provided a helpful comparative case in two different parts of the country that were each under strong deforestation pressures. Despite these alternating ceasefire arrangements, we found all three states/region experienced relatively similar trends for all three periods of high national deforestation rates.
The exception was that Kachin State did not have its first deforestation peak until after KIO signed a ceasefire, pointing to the degree of a ceasefire’s material effect on forest loss. Ceasefires are not the primary driver of deforestation, but they can exert influence on deforestation among an amalgam of armed conflict and geopolitical drivers. It is not possible to fully disentangle KIO’s ceasefire in 1994, China’s logging ban in 1998, and the material impacts of China’s “Go West” and “Go Out” policies [95] in the Myanmar borderlands.
We found further evidence of ceasefires not being the primary driver of environmental change in the southeast. We discovered a comparatively high initial deforestation peak in Kayin State starting in 1989 that gradually decreased over several years, and a slighter lower deforestation rate in Tanintharyi Region that started in 1990 but which increased over the next several years, despite no ceasefire with the KNU at that time. In fact, the logging (and oil/gas pipeline construction) in the early 1990s occurred within a context of (and contributed to) heightened militarization and counterinsurgency, which continually derailed ceasefire talks with the KNU. Moreover, in Kachin State we saw a surge in deforestation just after KIO’s ceasefire was annulled, the same third deforestation peak period as we saw in the southeast when KNU reached their ceasefire.
Rather than examine ceasefire (or war) as a singular deforestation driver, we argue for the need to examine armed conflict as a dynamic multisited and diffuse phenomenon that is also simultaneously integral to broader forces. The variables that we identified as directing the rate and geography of deforestation were the (1) territorial jurisdictions of armed authorities and their political relation to the Tatmadaw (EAO vs. paramilitary), (2) national political economy reforms and timber regulations, and (3) proximity to national borders and their respective geopolitical relations. For those village tracts under paramilitary control in Kachin State, for example, the return to war sustained land conversion operations, and even may have propelled further expansion in cases where Kachin villagers in those areas fled to camps as internally displaced persons (IDPs) and could no longer protect their lands. However, those village tracts under mixed administration with the KIO oftentimes experienced heavy fighting, causing commercial land conversion activities to temporarily cease. This is how we understood elevated deforestation rates after 2011 in Man Wein and Mong Nar village tracts in Waingmaw Township under paramilitary control but, during the same period, a sudden drop in the deforestation rate for Ta Law Gyi Village Tract in Myitkyina Township where KIO had a presence and consequently experienced battles. These divergent deforestation trends were not expressed at broader scales because they eclipsed these decentralized and more localized dynamics of armed conflict.
In addition to how changes in armed conflict, political economy, and geopolitics shaped forest loss dynamics at varied scales, our interviews also pointed to how land tenure insecurity played a fundamental role in LULCC. The allocation of logging and agribusiness concessions by the military state and nonstate armed authorities throughout the country was made possible by the lack of tenure security for rural farmers, especially ethnic minorities practicing upland agriculture. Under the 2008 Constitution, the state retained ownership of all land and the right to withdraw land use rights if certain conditions were unmet. However, farmers’ land rights and tenure security are especially under threat if they engage in upland shifting cultivation or other types of customary mixed-use forest practices, as they are not officially recognized land uses by the state. Additionally, the bureaucratic and financial costs of obtaining land use titles have effectively limited their acquisition to a small fraction of farmers [96], predominantly who are lowland Bamar (ethnic majority) [60,97]. Land tenure security thereby differentially overlays onto race/ethnicity, ecology and associated agricultural land use practices, such that upland ethnic minority farmers in forest environments are denied statutory land rights. These are the same agroecological areas where armed conflict persists. For this reason, tenure rights is closely associated with armed conflict and deforestation [98], although LULCC research rarely gives attention to customary tenure rights insecurity as an underlying driver of deforestation.

5. Conclusions

Based on our remotely-sensed LULCC data set, we identified and described three deforestation peaks between 1989 and 2018 at the national level for Myanmar: (1) 1996–1999, (2) 2003–2009, and (3) 2012–2013. This temporal forest loss trend was similarly demonstrated at subnational levels, although with some significant discrepancies at finer scales. While a township may reflect regional and national deforestation trends, village tracts and villages may show different forest loss trajectories, as our data analysis demonstrated.
We found these divergent LULCC transitions between finer- and broader-scales to be due to localized armed group behavior and its intersection with the resource economy in those locales. National political economies and the wider geopolitical currents of that region clearly shape the broader-scaled deforestation patterns, such as Asia’s post-Cold War pivot to capitalism, Myanmar’s elections and economic liberalization, and domestic timber regulations in the region. However, within the same region, we may, for example, also see a finer-scaled surge in deforestation in territory under paramilitary control because they are engaged in rent seeking behavior backed by the military state. Or we may find a lull in forest conversion activities in territory under mixed administration due to a flareup in fighting against an EAO by the Tatmadaw and/or paramilitary groups.
Our study demonstrates how we can tease apart some of the intricacies of the relationship among armed conflict, political economy, and geopolitics with that of forest loss. To do this we jointly employed both finer- and broader-scaled remotely-sensed LULCC, which we paired with ethnographic field-based data to interpret remote sensing findings. Methodologically, our study demonstrated how a mixed-methods, multiscaled and multisited LULCC study is needed to accurately explain deforestation trends, especially in armed conflict settings. For the remote sensing component, we recommend pairing broader- and finer-scaled data analysis to best capture these various forces that impinge on LULCC, in this case armed group behavior, political economy, and geopolitics. A political ecology approach using field-based ethnography to help interpret remotely-sensed LULCC is well-suited to connect multisited and multiscaled relations among a combination of deforestation drivers with varying influences.
The methodological design and data findings of our study raise new questions that require further investigation on how different configurations of war and peace, bilateral and multilateral ceasefires, a national peace process, and armed group type and behavior interact with forest environments over time and at different scales. For Myanmar, future studies should expand geographical coverage to capture other agroecologies and armed conflict dynamics, such as in Rakhine State, Chin State, and Shan State, which would enable further testing of the robustness of our findings. Moreover, the effect of different armed conflict dynamics on forest change could be tested by a comparative study with other countries experiencing armed conflict. Detailed remote sensing analysis that can quantitatively attribute forest loss to specific land use types after deforestation events will also help to systematically identify direct drivers of deforestation related to armed conflicts.

Author Contributions

Conceptualization, K.M.W. and Q.H.; methodology, K.M.W. and J.O.S.; satellite data analysis, J.O.S. and P.W.; interview data collection, K.M.W.; forest change data analysis, J.W.; writing—original draft preparation, K.M.W.; writing—review and editing, K.M.W., P.L., Q.H., J.O.S., P.W.; visualization, J.W.; project administration, Q.H.; funding acquisition, Q.H., P.L., K.M.W., J.O.S. Field research collaborators in Myanmar are kept anonymous for security reasons, and therefore are not included as authors, upon their request. All authors have read and agreed to the published version of the manuscript.

Funding

This research was funded by the NASA Land Cover and Land Use Change Program, grant number NNX17AI14G.

Institutional Review Board Statement

The study was conducted according to the guidelines of the Declaration of Helsinki, and approved by the Institutional Review Board (IRB) of Smithsonian Institute (protocol ID code HS18042, approved on 24 August 2018).

Informed Consent Statement

Informed verbal consent was obtained from all subjects involved in the study.

Data Availability Statement

Our Myanmar forest change map between 1984 and 2019 can be accessed freely through Smithsonian’s Figshare online data repository.

Acknowledgments

The authors wish to thank our Myanmar field researchers, whose experience and knowledge of the places we studied is profound. For security reasons, they wish to remain anonymous and not be included as authors. The lead author is very appreciative of this research opportunity initiated by Smithsonian’s Conservation Biology Institute.

Conflicts of Interest

The authors declare no conflict of interest.

References

  1. Center for International Forestry Research (CIFOR). Forests and Conflict; CIFOR: Bogor, Indonesia, 2018. [Google Scholar]
  2. Álvarez, M.D. Forests in the Time of Violence. J. Sustain. For. 2003, 16, 47–68. [Google Scholar] [CrossRef]
  3. Burgess, R.; Miguel, E.; Stanton, C. War and Deforestation in Sierra Leone. Environ. Res. Lett. 2015, 10, 095014. [Google Scholar] [CrossRef] [Green Version]
  4. Butsic, V.; Baumann, M.; Shortland, A.; Walker, S.; Kuemmerle, T. Conservation and Conflict in the Democratic Republic of Congo: The Impacts of Warfare, Mining, and Protected Areas on Deforestation. Biol. Conserv. 2015, 191, 266–273. [Google Scholar] [CrossRef]
  5. Gorsevski, V.; Geores, M.; Kasischke, E. Human Dimensions of Land Use and Land Cover Change Related to Civil Unrest in the Imatong Mountains of South Sudan. Appl. Geogr. 2013, 38, 64–75. [Google Scholar] [CrossRef]
  6. Hanson, T.; Brooks, T.M.; Da Fonseca, G.A.; Hoffmann, M.; Lamoreux, J.F.; Machlis, G.; Mittermeier, C.G.; Mittermeier, R.A.; Pilgrim, J.D. Warfare in Biodiversity Hotspots. Conserv. Biol. 2009, 23, 578–587. [Google Scholar] [CrossRef]
  7. Gorsevski, V.; Kasischke, E.; Dempewolf, J.; Loboda, T.; Grossmann, F. Analysis of the Impacts of Armed Conflict on the Eastern Afromontane Forest Region on the South Sudan—Uganda Border Using Multitemporal Landsat Imagery. Remote Sens. Environ. 2012, 118, 10–20. [Google Scholar] [CrossRef]
  8. Machlis, G.E.; Hanson, T. Warfare Ecology. BioScience 2008, 58, 729–736. [Google Scholar] [CrossRef]
  9. Nackoney, J.; Molinario, G.; Potapov, P.; Turubanova, S.; Hansen, M.C.; Furuichi, T. Impacts of Civil Conflict on Primary Forest Habitat in Northern Democratic Republic of the Congo, 1990–2010. Biol. Conserv. 2014, 170, 321–328. [Google Scholar] [CrossRef]
  10. Reuveny, R.; Mihalache-O’Keef, A.S.; Li, Q. The Effect of Warfare on the Environment. J. Peace Res. 2010, 47, 749–761. [Google Scholar] [CrossRef]
  11. Stevens, K.; Campbell, L.; Urquhart, G.; Kramer, D.; Qi, J. Examining Complexities of Forest Cover Change during Armed Conflict on Nicaragua’s Atlantic Coast. Biodivers. Conserv. 2011, 20, 2597–2613. [Google Scholar] [CrossRef]
  12. Baumann, M.; Kuemmerle, T. The Impacts of Warfare and Armed Conflict on Land Systems. J. Land Use Sci. 2016, 11, 672–688. [Google Scholar] [CrossRef]
  13. Landholm, D.M.; Pradhan, P.; Kropp, J.P. Diverging Forest Land Use Dynamics Induced by Armed Conflict across the Tropics. Glob. Environ. Chang. 2019, 56, 86–94. [Google Scholar] [CrossRef]
  14. Clerici, N.; Armenteras, D.; Kareiva, P.; Botero, R.; Ramírez-Delgado, J.P.; Forero-Medina, G.; Ochoa, J.; Pedraza, C.; Schneider, L.; Lora, C.; et al. Deforestation in Colombian Protected Areas Increased during Post-Conflict Periods. Sci. Rep. 2020, 10, 4971. [Google Scholar] [CrossRef] [Green Version]
  15. Fergusson, L.; Romero, D.; Vargas, J.F. The Environmental Impact of Civil Conflict: The Deforestation Effect of Paramilitary Expansion in Colombia; CEDE: Bogota, Colombia, 2014. [Google Scholar]
  16. Grima, N.; Singh, S.J. How the End of Armed Conflicts Influence Forest Cover and Subsequently Ecosystem Services Provision? An Analysis of Four Case Studies in Biodiversity Hotspots. Land Use Policy 2019, 81, 267–275. [Google Scholar] [CrossRef]
  17. Murillo-Sandoval, P.J.; Van Dexter, K.; Van Den Hoek, J.; Wrathall, D.; Kennedy, R. The End of Gunpoint Conservation: Forest Disturbance after the Colombian Peace Agreement. Environ. Res. Lett. 2020, 15, 034033. [Google Scholar] [CrossRef]
  18. Negret, P.J.; Sonter, L.; Watson, J.E.M.; Possingham, H.P.; Jones, K.R.; Suarez, C.; Ochoa-Quintero, J.M.; Maron, M. Emerging Evidence That Armed Conflict and Coca Cultivation Influence Deforestation Patterns. Biol. Conserv. 2019, 239, 108176. [Google Scholar] [CrossRef]
  19. Ordway, E.M. Political Shifts and Changing Forests: Effects of Armed Conflict on Forest Conservation in Rwanda. Glob. Ecol. Conserv. 2015, 3, 448–460. [Google Scholar] [CrossRef] [Green Version]
  20. Prem, M.; Saavedra, S.; Vargas, J.F. End-of-Conflict Deforestation: Evidence from Colombia’s Peace Agreement. World Dev. 2020, 129, 104852. [Google Scholar] [CrossRef]
  21. Yin, H.; Butsic, V.; Buchner, J.; Kuemmerle, T.; Prishchepov, A.V.; Baumann, M.; Bragina, E.V.; Sayadyan, H.; Radeloff, V.C. Agricultural Abandonment and Re-Cultivation during and after the Chechen Wars in the Northern Caucasus. Glob. Environ. Chang. 2019, 55, 149–159. [Google Scholar] [CrossRef] [Green Version]
  22. Hagenlocher, M.; Lang, S.; Tiede, D. Integrated Assessment of the Environmental Impact of an IDP Camp in Sudan Based on Very High Resolution Multi-Temporal Satellite Imagery. Remote Sens. Environ. 2012, 126, 27–38. [Google Scholar] [CrossRef]
  23. Witmer, F.D.W.; O’Loughlin, J. Detecting the Effects of Wars in the Caucasus Regions of Russia and Georgia Using Radiometrically Normalized DMSP-OLS Nighttime Lights Imagery. GISci. Remote Sens. 2011, 48, 478–500. [Google Scholar] [CrossRef]
  24. Berhe, A.A. The Contribution of Landmines to Land Degradation. Land Degrad. Dev. 2007, 18, 1–15. [Google Scholar] [CrossRef]
  25. Billon, P.L. Fuelling War: Natural Resources and Armed Conflicts; Routledge: London, UK, 2013; ISBN 978-1-315-01952-9. [Google Scholar]
  26. Dávalos, L.M. The San Lucas Mountain Range in Colombia: How Much Conservation Is Owed to the Violence? Biodivers. Conserv. 2001, 10, 69–78. [Google Scholar] [CrossRef]
  27. Brottem, L.; Unruh, J. Territorial Tensions: Rainforest Conservation, Postconflict Recovery, and Land Tenure in Liberia. Ann. Assoc. Am. Geogr. 2009, 99, 995–1002. [Google Scholar] [CrossRef]
  28. Witmer, F.D.W. Remote Sensing of Violent Conflict: Eyes from Above. Int. J. Remote Sens. 2015, 36, 2326–2352. [Google Scholar] [CrossRef]
  29. Jiang, W.; He, G.; Long, T.; Liu, H. Ongoing Conflict Makes Yemen Dark: From the Perspective of Nighttime Light. Remote Sens. 2017, 9, 798. [Google Scholar] [CrossRef] [Green Version]
  30. Li, X.; Li, D.; Xu, H.; Wu, C. Intercalibration between DMSP/OLS and VIIRS Night-Time Light Images to Evaluate City Light Dynamics of Syria’s Major Human Settlement during Syrian Civil War. Int. J. Remote Sens. 2017, 38, 5934–5951. [Google Scholar] [CrossRef]
  31. Sánchez-Cuervo, A.M.; Aide, T.M. Consequences of the Armed Conflict, Forced Human Displacement, and Land Abandonment on Forest Cover Change in Colombia: A Multi-Scaled Analysis. Ecosystems 2013, 16, 1052–1070. [Google Scholar] [CrossRef]
  32. Liverman, D.; Moran, E.; Rindfuss, R.; Stern, P. (Eds.) People and Pixels: Linking Remote Sensing and Social Science; National Academy Press: Washington, DC, USA, 1998.
  33. Tellman, B.; Sesnie, S.E.; Magliocca, N.R.; Nielsen, E.A.; Devine, J.A.; McSweeney, K.; Jain, M.; Wrathall, D.J.; Dávila, A.; Benessaiah, K.; et al. Illicit Drivers of Land Use Change: Narcotrafficking and Forest Loss in Central America. Glob. Environ. Chang. 2020, 63, 102092. [Google Scholar] [CrossRef]
  34. FAO. Global Forest Resources Assessment 2020: Main Report; FAO: Rome, Italy, 2020; ISBN 978-92-5-132974-0. [Google Scholar]
  35. Food and Agriculture Organization of the United Nations. Global Forest Resources Assessment 2015; FAO: Rome, Italy, 2015. [Google Scholar]
  36. Treue, T.; Springate-Baginski, O.; Htun, K. Legally and Illegally Logged Out; ALARM and Danish Church Aid (DCA): Yangon, Myanmar, 2016; p. 44. [Google Scholar]
  37. Bhagwat, T.; Hess, A.; Horning, N.; Khaing, T.; Thein, Z.M.; Aung, K.M.; Aung, K.H.; Phyo, P.; Tun, Y.L.; Oo, A.H.; et al. Losing a Jewel—Rapid Declines in Myanmar’s Intact Forests from 2002–2014. PLoS ONE 2017, 12, e0176364. [Google Scholar] [CrossRef] [Green Version]
  38. Smith, M. Burma: Insurgency and the Politics of Ethnicity; Zed Books: New York, NY, USA, 1999. [Google Scholar]
  39. Buchanan, J. Militias in Myanmar; The Asia Foundation: Yangon, Myanmar, 2016; p. 84. [Google Scholar]
  40. Jolliffe, K. Ceasefires, Governance and Development: The Karen National Union in Times of Change; The Asia Foundation: Yangon, Myanmar, 2016. [Google Scholar]
  41. Kyed, H.M. Frontier Governance: Contested and Plural Authorities in a Karen Village after the Ceasefire. Mod. Asian Stud. 2021, 1–36. [Google Scholar] [CrossRef]
  42. Zhu, Z.; Woodcock, C.E. Object-Based Cloud and Cloud Shadow Detection in Landsat Imagery. Remote Sens. Environ. 2012, 118, 83–94. [Google Scholar] [CrossRef]
  43. Sexton, J.O.; Song, X.-P.; Feng, M.; Noojipady, P.; Anand, A.; Huang, C.; Kim, D.-H.; Collins, K.M.; Channan, S.; DiMiceli, C.; et al. Global, 30-m Resolution Continuous Fields of Tree Cover: Landsat-Based Rescaling of MODIS Vegetation Continuous Fields with Lidar-Based Estimates of Error. Int. J. Digit. Earth 2013, 6, 427–448. [Google Scholar] [CrossRef] [Green Version]
  44. DiMiceli, C.; Carroll, M.; Sohlberg, R.; Kim, D.; Kelly, M.; Townshend, J. MOD44B MODIS/Terra Vegetation Continuous Fields Yearly L3 Global 250m SIN Grid V006; USGS: Sioux Falls, SD, USA, 2015.
  45. Feng, M.; Huang, C.; Channan, S.; Vermote, E.F.; Masek, J.G.; Townshend, J.R. Quality Assessment of Landsat Surface Reflectance Products Using MODIS Data. Comput. Geosci. 2012, 38, 9–22. [Google Scholar] [CrossRef] [Green Version]
  46. Dorogush, A.V.; Ershov, V.; Gulin, A. CatBoost: Gradient Boosting with Categorical Features Support. arXiv 2018, arXiv:1810.11363. [Google Scholar]
  47. Sexton, J.O.; Noojipady, P.; Anand, A.; Song, X.-P.; McMahon, S.; Huang, C.; Feng, M.; Channan, S.; Townshend, J.R. A Model for the Propagation of Uncertainty from Continuous Estimates of Tree Cover to Categorical Forest Cover and Change. Remote Sens. Environ. 2015, 156, 418–425. [Google Scholar] [CrossRef] [Green Version]
  48. Wang, P.; Feng, M.; Sexton, J.; Huang, Q.; Biswas, S.; Leimgruber, P. Myanmar Forest Change Product 1979–2019; Smithsonian: Front Royal, VA, USA, 2021. [Google Scholar]
  49. Bennett, M.M.; Faxon, H.O. Uneven Frontiers: Exposing the Geopolitics of Myanmar’s Borderlands with Critical Remote Sensing. Remote Sens. 2021, 13, 1158. [Google Scholar] [CrossRef]
  50. Robbins, P. Political Ecology: A Critical Introduction, 3rd ed.; Wiley-Blackwell: Hoboken, NJ, USA, 2019; ISBN 978-1-119-16744-0. [Google Scholar]
  51. Ribot, J.C.; Peluso, N.L. A Theory of Access. Rural Sociol. 2003, 68, 153–181. [Google Scholar] [CrossRef]
  52. Um, K. Thailand and the Dynamics of Economic and Security Complex in Mainland Southeast Asia—ProQuest. Contemp. Southeast Asia 1991, 13, 245–270. [Google Scholar] [CrossRef]
  53. Steinberg, D.I.; Fan, H. Modern China-Myanmar Relations: Dilemmas of Mutual Dependence; NIAS Press: Copenhagen, Denmark, 2012. [Google Scholar]
  54. Forsyth, T. Deforestation in Thailand: The battle in politics and science. In Deforestation, Environment, and Sustainable Development: A Comparative Analysis; Vajpeyi, D., Ed.; Praeger: Westport, CT, USA, 2001; pp. 139–154. [Google Scholar]
  55. Acharya, A. Partners in Plunder: Deforestation in Mainland Southeast Asia Following the 1989 Logging Ban in Thailand. Ph.D. Thesis, Duke University, Durham, NC, USA, 1994. [Google Scholar]
  56. Daniel, R. (Ed.) After the Logging Ban: Politics of Forest Management in Thailand; Foundation for Ecological Recovery: Bangkok, Thailand, 2005; ISBN 978-974-93391-8-3. [Google Scholar]
  57. Global Witness. A Conflict Of Interest: The Uncertain Future of Burma’s Forests; Global Witness: London, UK, 2003. [Google Scholar]
  58. Woods, K. Conflict Timber along the China-Burma Border: Connecting the Global Timber Consumer with Violent Extraction Sites. In Chinese Circulations: Capital, Commodities, and Networks in Southeast Asia; Tagliacozzo, E., Chang, W., Eds.; Duke University Press: Durham, NC, USA, 2011; pp. 480–506. [Google Scholar]
  59. Thein, S.; Diepart, J.-C.; Moe, H.; Allaverdian, C. Large-Scale Land Acquisitions for Agricultural Development in Myanmar: A Review of Past and Current Processes; Mekong Region Land Governance (MRLG): Vientiane, Laos, 2018. [Google Scholar]
  60. Scurrah, N.; Woods, K.M.; Hirsch, P. The Political Economy of Land Governance in Myanmar; Mekong Region Land Governance (MRLG): Vientiane, Laos, 2015; p. 27. [Google Scholar]
  61. Yang, R.; Luo, Y.; Yang, K.; Hong, L.; Zhou, X. Analysis of Forest Deforestation and Its Driving Factors in Myanmar from 1988 to 2017. Sustainability 2019, 11, 3047. [Google Scholar] [CrossRef] [Green Version]
  62. Zhang, Y.; Prescott, G.W.; Tay, R.E.; Dickens, B.L.; Webb, E.L.; Htun, S.; Tizard, R.J.; Rao, M.; Carrasco, L.R. Dramatic Cropland Expansion in Myanmar Following Political Reforms Threatens Biodiversity. Sci. Rep. 2018, 8, 16558. [Google Scholar] [CrossRef]
  63. Zaehringer, J.G.; Lundsgaard-Hansen, L.; Thein, T.T.; Llopis, J.C.; Tun, N.N.; Myint, W.; Schneider, F. The Cash Crop Boom in Southern Myanmar: Tracing Land Use Regime Shifts through Participatory Mapping. Ecosyst. People 2020, 16, 36–49. [Google Scholar] [CrossRef]
  64. Forest Trends. Illegal Logging and Associated Trade in Myanmar: Impacts of Government Measures to Address Illegal Logging; Forest Trends: Washington, DC, USA, 2021; p. 53. [Google Scholar]
  65. Woods, K. Commercial Agriculture Expansion in Myanmar: Links to Deforestation, Conversion Timber, and Land Conflicts; Forest Trends: Washington, DC, USA, 2015; p. 53. [Google Scholar]
  66. MEITI. Myanmar Extractive Industries Transparency Initiative (MEITI): Fourth EITI Report for the Fiscal Year 2017/18; Ministry of Planning and Finance: Naypyitaw, Myanmar, 2020; p. 219.
  67. Donald, P.F.; Round, P.D.; Aung, T.D.W.; Grindley, M.; Steinmetz, R.; Shwe, N.M.; Buchanan, G.M. Social Reform and a Growing Crisis for Southern Myanmar’s Unique Forests. Conserv. Biol. 2015, 29, 1485–1488. [Google Scholar] [CrossRef]
  68. Barbesgaard, M. Ocean and Land Control-Grabbing: The Political Economy of Landscape Transformation in Northern Tanintharyi, Myanmar. J. Rural Stud. 2019, 69, 195–203. [Google Scholar] [CrossRef]
  69. Earthrights International; Southeast Asian Information Network (SAIN). Total Denial: A Report on the Yadana Pipeline Project in Burma; Southeast Asian Information Network (SAIN): Chiangmai, Thailand, 1996. [Google Scholar]
  70. Innes-Brown, M.; Valencia, M. Thailand’s Resource Diplomacy in Indochina and Myanmar. Contemp. Southeast Asia 1993, 14, 332–351. [Google Scholar] [CrossRef]
  71. Pollard, E. Review of the Tanintharyi Nature Reserve Project as a Conservation Model in Myanmar; The Biodiversity Consultancy: Cambridge, UK, 2014. [Google Scholar]
  72. Woods, K.M. Green Territoriality: Conservation as State Territorialization in a Resource Frontier. Hum. Ecol. 2019, 47, 217–232. [Google Scholar] [CrossRef]
  73. ALARM; Southern Youth Organization; Myeik Lawyers Network; Future Light. Behind the Oil Palm: Consequences of International Investment in Oil Palm Plantations; ALARM: Yangon, Myanmar, 2018. [Google Scholar]
  74. Connette, G.M.; Oswald, P.; Thura, M.K.; Connette, K.J.L.; Grindley, M.E.; Songer, M.; Zug, G.R.; Mulcahy, D.G. Rapid Forest Clearing in a Myanmar Proposed National Park Threatens Two Newly Discovered Species of Geckos (Gekkonidae: Cyrtodactylus). PLoS ONE 2017, 12, e0174432. [Google Scholar] [CrossRef] [Green Version]
  75. Nomura, K.; Mitchard, E.T.A.; Patenaude, G.; Bastide, J.; Oswald, P.; Nwe, T. Oil Palm Concessions in Southern Myanmar Consist Mostly of Unconverted Forest. Sci. Rep. 2019, 9, 11931. [Google Scholar] [CrossRef] [Green Version]
  76. Hunt, G.; Oswald, P. Tanintharyi Regional Oil Palm Assessment: Macro-Level Overview of Land Use in the Oil Palm Sector; Centre for Development and Environment, University of Bern: Bern, Switzerland, 2020; p. 66. [Google Scholar]
  77. Karen Human Rights Group (KHRG). Losing Ground: Land Conflict and Collection Action in Eastern Myanmar; KHRG: Mae Sot, Thailand, 2013. [Google Scholar]
  78. Karen Human Rights Group (KHRG). Do Not Trespass: Land Confiscations and Armed Actors in Southeast Myanmar. Thailand; KHRG: Mae Sot, Thailand, 2019. [Google Scholar]
  79. Helsingen, H.; Kelly, A.S.; Connette, G.; Soe, P.; Bhagabati, N.; Pairojmahakij, R.; Jayasinghe, S. Nature in Peril: The Risk to Forests and Wildlife from the Dawei-Htee Khee Road; WWF: Yangon, Myanmar, 2019. [Google Scholar]
  80. Helsingen, H.; Nay Won Myint, S.; Bhagabati, N.; Dixon, A.; Olwero, N.; Kelly, A.; Tang, D. A Better Road to Dawei: Protecting Wildlife, Sustaining Nature, Benefiting People; WWF: Yangon, Myanmar, 2015. [Google Scholar]
  81. Dawei Development Association (DDA). Voices from the Ground: Concerns over the Dawei Special Economic Zone and Related Projects; DDA: Dawei, Myanmar, 2014.
  82. Thai PBS The Inside Story of Thailand and Myanmar’s Troubled Dawei Mega-Project. 2021. Available online: https://www.thaipbsworld.com/the-inside-story-of-thailand-and-myanmars-troubled-dawei-mega-project/ (accessed on 8 August 2021).
  83. Woods, K. Rubber out of the Ashes: Locating Chinese Agribusiness Investments in ‘Armed Sovereignties’ in the Myanmar–China Borderlands. Territ. Polit. Gov. 2019, 7, 79–95. [Google Scholar] [CrossRef]
  84. Woods, K. Ceasefire Capitalism: Military–Private Partnerships, Resource Concessions and Military–State Building in the Burma–China Borderlands. J. Peasant Stud. 2011, 38, 747–770. [Google Scholar] [CrossRef]
  85. Brunner, J. Logging Burma’s Frontier Forests: Resources and the Regime; World Resources Institute (WRI): Washington, DC, USA, 1998; p. 55. [Google Scholar]
  86. Kahrl, F. Navigating the Border: An Analysis of the China-Myanmar Timber Trade; Forest Trends: Washington, DC, USA, 2004. [Google Scholar]
  87. Xinhua News Agency. Beijing Yunnan Frontier Defense Brigade Takes Actions to Ensure the Yunnan-Burma Timber and Mineral Trading Cooperation; Xinhua News Agency: Beijing, China, 2006. [Google Scholar]
  88. Su, X. Nontraditional Security and China’s Transnational Narcotics Control in Northern Laos and Myanmar. Polit. Geogr. 2015, 48, 72–82. [Google Scholar] [CrossRef]
  89. Lu, J.; Schönweger, O. Great Expectations: Chinese Investment in Laos and the Myth of Empty Land. Territ. Polit. Gov. 2019, 7, 61–78. [Google Scholar] [CrossRef]
  90. Kramer, T.; Woods, K.M. Financing Dispossession: China’s Opium Substitution Programme in Northern Burma; Transnational Institute: Amsterdam, The Netherlands, 2012. [Google Scholar]
  91. World Wildlife Fund (WWF). Rubber Production in Tanintharyi Region of Myanmar; WWF: Yangon, Myanmar, 2017. [Google Scholar]
  92. Hayward, D.; Lwin, U.K.; Bin, Y.; Kyu, U.H. Chinese Investment into Tissue-Culture Banana Plantations in Kachin State, Myanmar; Mekong Region Land Governance (MRLG): Vientiane, Laos, 2020; p. 56. [Google Scholar]
  93. Lambin, E.F.; Turner, B.L.; Geist, H.J.; Agbola, S.B.; Angelsen, A.; Bruce, J.W.; Coomes, O.T.; Dirzo, R.; Fischer, G.; Folke, C.; et al. The Causes of Land-Use and Land-Cover Change: Moving beyond the Myths. Glob. Environ. Chang. 2001, 11, 261–269. [Google Scholar] [CrossRef]
  94. Temudo, M.P.; Silva, J.M.N. Agriculture and Forest Cover Changes in Post-War Mozambique. J. Land Use Sci. 2012, 7, 425–442. [Google Scholar] [CrossRef]
  95. Elizabeth Economy. China’s Go West Campaign: Ecological Construction or Ecological Exploitation; China Environment Series; Elizabeth Economy: Washington, DC, USA, 2004.
  96. Displacement Solutions. Land Acquisition Law and Practice in Myanmar: Overview, Gap Analysis with IFC PS1 and PS5 and Scope of Due Diligence Recommendations; Displacement Solutions: Geneva, Switzerland, 2015; p. 67. [Google Scholar]
  97. Faxon, H.O. “Form 7”: Seven Case Studies of Farmland Registration in Kachin State; Spectrum SDKN: Yangon, Myanmar, 2015; p. 21. [Google Scholar]
  98. Karen Peace Support Network (KPSN). Burma’s Dead End Peace Negotiation Process: A Case Study of the Land Sector; KPSN: Chiangmai, Thailand, 2018; p. 46. [Google Scholar]
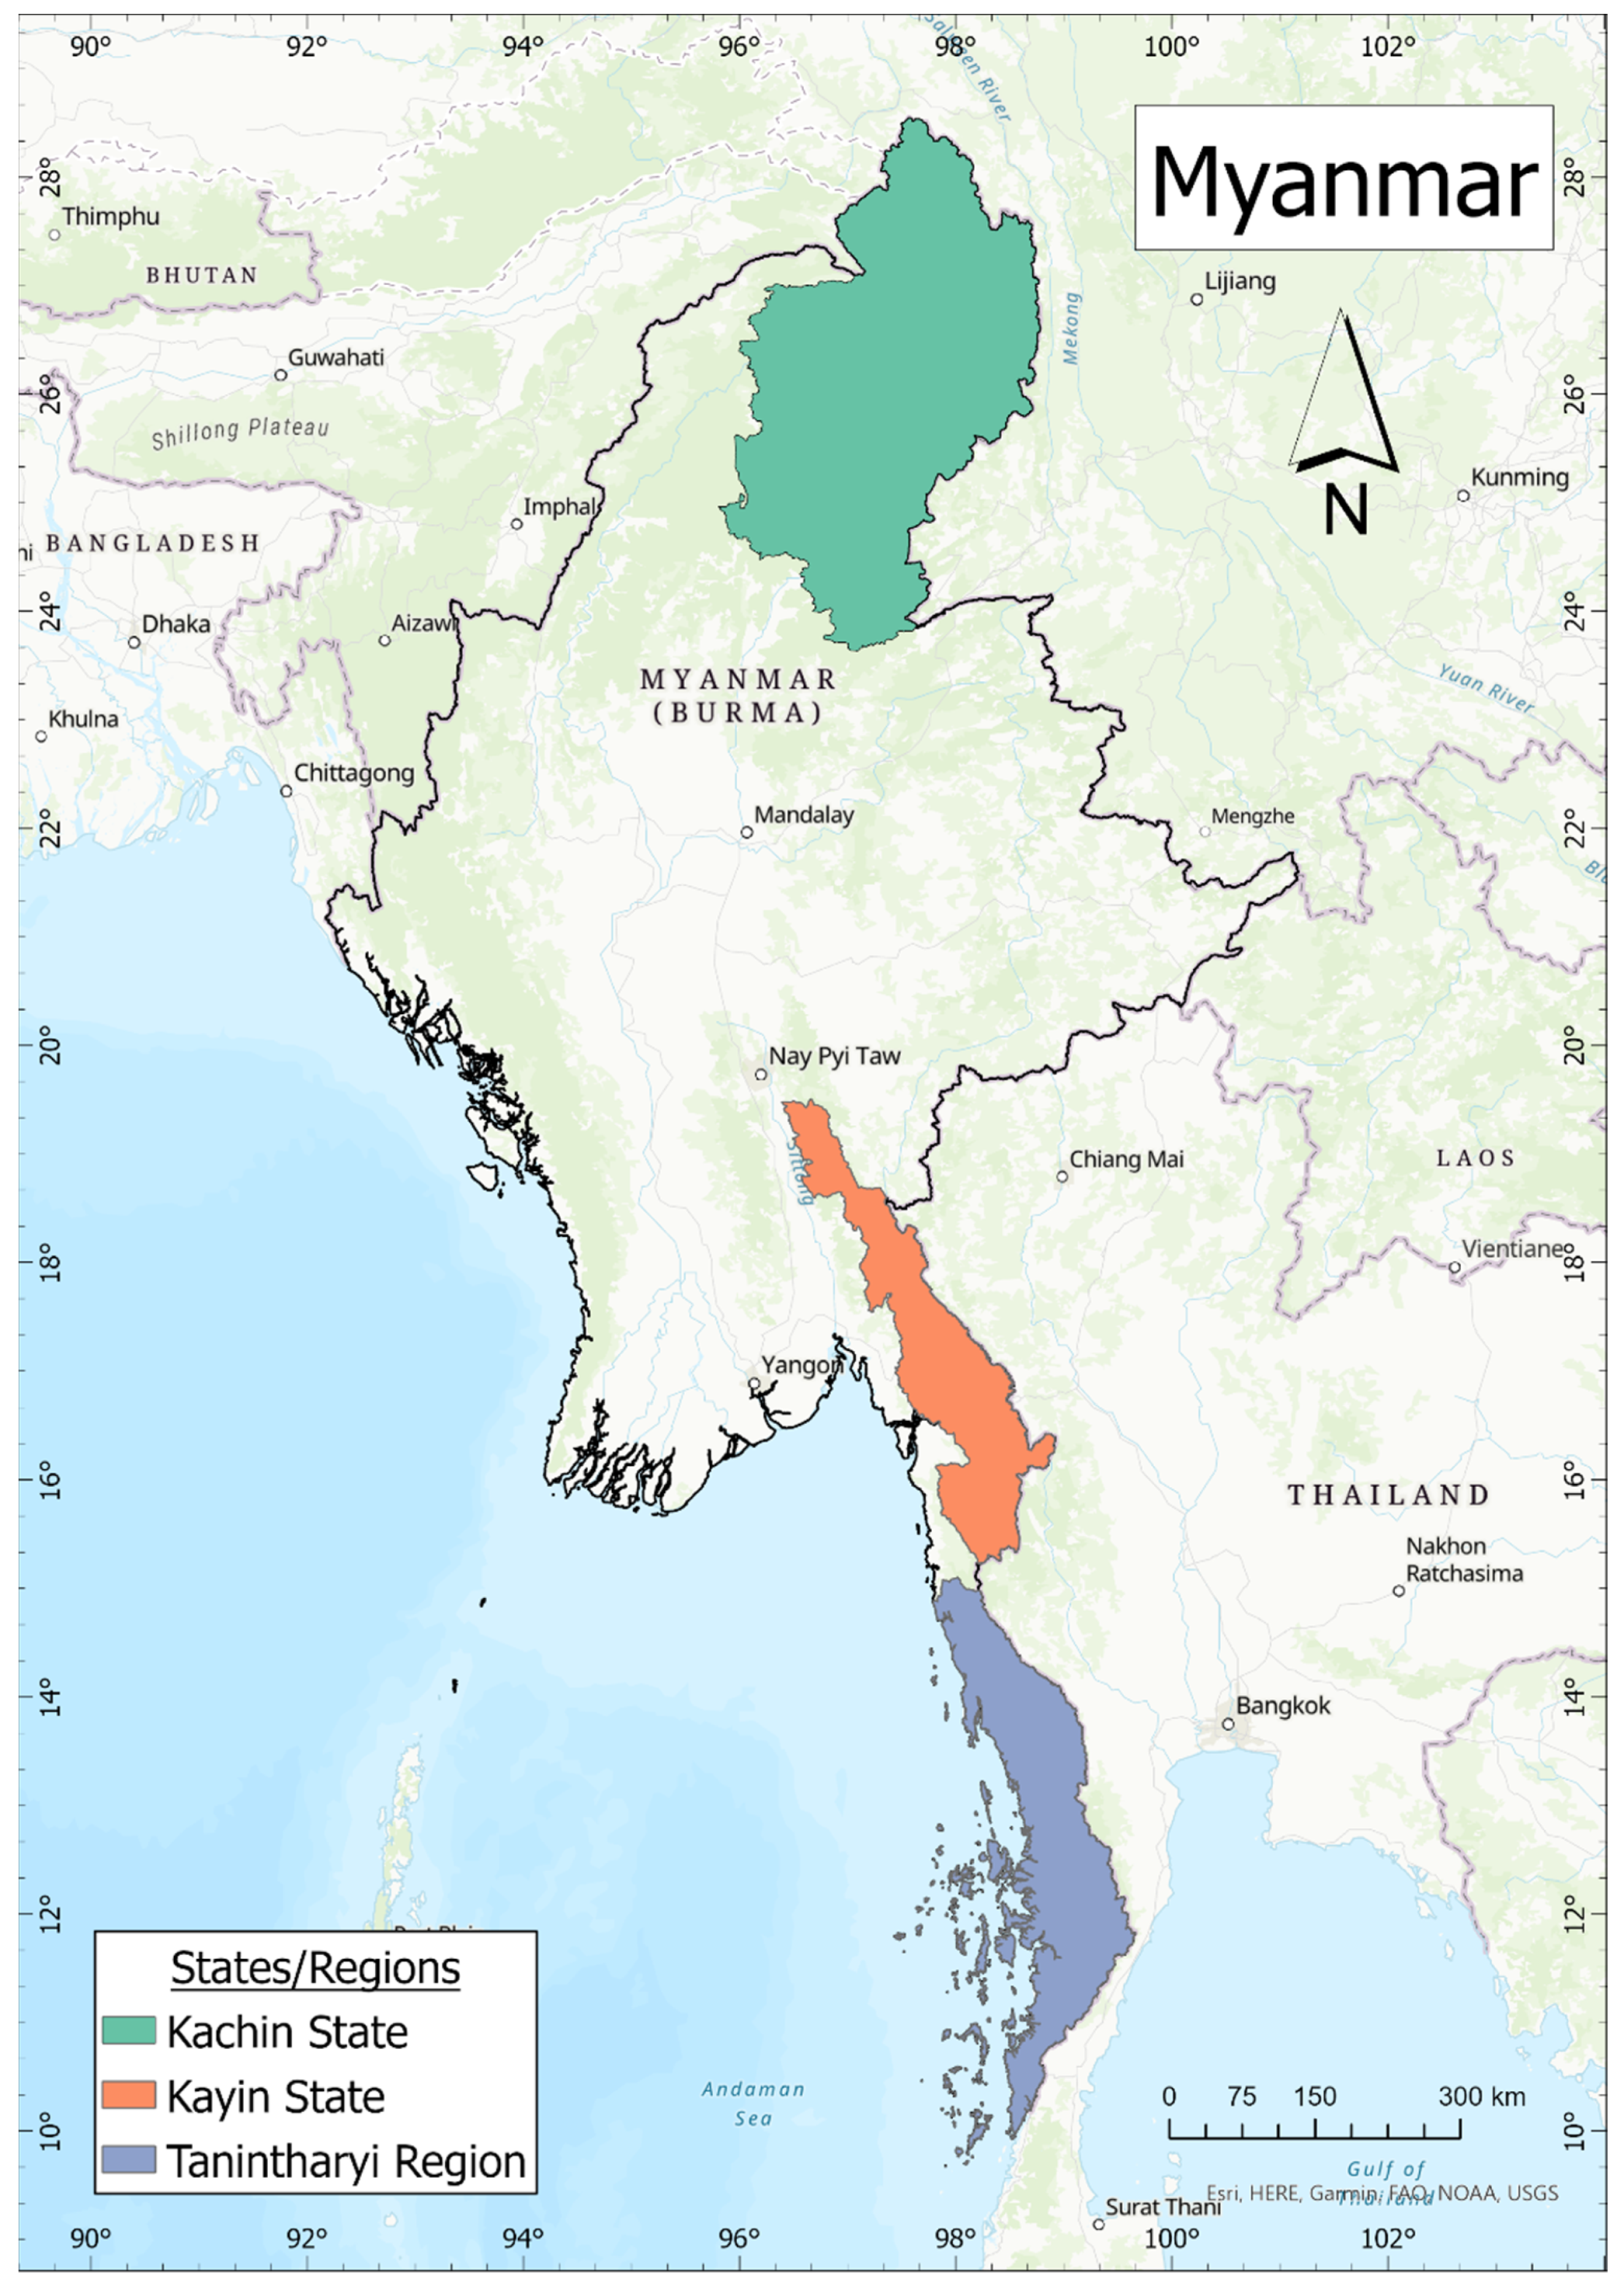
Figure 1. Map of Myanmar and the states/region under study.
Remotesensing 13 04589 g001
Figure 2. National deforestation trends in Myanmar, 1989–2018.
Remotesensing 13 04589 g002
Figure 3. Regional deforestation trends for Kachin State, Kayin State, and Tanintharyi Region, 1989–2018.
Remotesensing 13 04589 g003
Figure 4. Map of Tanintharyi Region with township and village tract study sites.
Remotesensing 13 04589 g004
Figure 5. Deforestation trend for townships in Tanintharyi Region with major events, 1989–2018.
Remotesensing 13 04589 g005
Figure 6. Deforestation trend for village tracts in Tanintharyi Region, 1989–2018.
Remotesensing 13 04589 g006
Figure 7. Map of Kachin State with township and village tract study sites.
Remotesensing 13 04589 g007
Figure 8. Deforestation trend for townships in Kachin State with major events, 1989–2018.
Remotesensing 13 04589 g008
Figure 9. Deforestation trend for village tracts in Kachin State, 1989–2018.
Remotesensing 13 04589 g009
Table 1. Study sites by state/region, township, village tract, and political authority.
State/RegionTownshipVillage TractEAO (Year of Ceasefire)/Paramilitary (Year Established)
Kachin StateMyitkyinaTa Law GyiKIO (1994-2011) + Red Shan militia (2011) + gov’t
WaingmawMan WaingLasang Awng Wa militia (2005) + NDA-K militia (1989) + gov’t
WaingmawMaing NaLasang Awng Wa militia (2005) + gov’t
Denai *Ma Kaw *Lisu militia (2016) + gov’t
Denai *Draone *KIO (1994-2011) + gov’t
Kayin StateMyawaddyMe Htaw Tha Lay *KNU (2012) + DKBA militia (1995)
MyawaddyMi Hpar *KNU (2012) + DKBA militia (1995)
MyawaddyTi The Lei *KNU (2012) + DKBA militia (1995)
HlaingbweTar Le *KNU (2012) + DKBA militia (1995) + DKBA-5 militia (2010)
Tanintharyi
Region
Yay PhyuAy Ka Ni *KNU (2012) + gov’t
Yay PhyuTa Line YarKNU (2012) + gov’t
DaweiKa Let GyiKNU (2012) + gov’t
DaweiTha Pyu Chaung *KNU (2012) + gov’t
BokepyinPyi Gyi Mandaing City *KNU (2012) + gov’t
BokpyinBan Ga Lar *KNU (2012) + gov’t
BokpyinMa Noe YoneKNU (2012) + gov’t
TanintharyiThein KhunKNU (2012) + gov’t
Tanintharyi Pa Wa Pho Mae *KNU (2012) + gov’t
TanintharyiTha Kyat *KNU (2012) + gov’t
Note: An asterix (*) denotes data omitted from analysis for this paper.
Publisher’s Note: MDPI stays neutral with regard to jurisdictional claims in published maps and institutional affiliations.