Article

Properties of Cirrus Clouds over the European Arctic (Ny-Ålesund, Svalbard)

by
Konstantina Nakoudi
1,2,
Christoph Ritter
1,* and
Iwona S. Stachlewska
3
1
Alfred Wegener Institute, Helmholtz Centre for Polar and Marine Research, Telegrafenberg A45, 14473 Potsdam, Germany
2
Institute of Physics and Astronomy, University of Potsdam, Karl-Liebknecht 24/25, 14476 Potsdam, Germany
3
Faculty of Physics, University of Warsaw (FUW), 00-927 Warsaw, Poland
*
Author to whom correspondence should be addressed.
Remote Sens. 2021, 13(22), 4555; https://doi.org/10.3390/rs13224555
Submission received: 20 September 2021 / Revised: 29 October 2021 / Accepted: 9 November 2021 / Published: 12 November 2021

Abstract

:
Cirrus is the only cloud type capable of inducing daytime cooling or heating at the top of the atmosphere (TOA) and the sign of its radiative effect highly depends on its optical depth. However, the investigation of its geometrical and optical properties over the Arctic is limited. In this work the long-term properties of cirrus clouds are explored for the first time over an Arctic site (Ny-Ålesund, Svalbard) using lidar and radiosonde measurements from 2011 to 2020. The optical properties were quality assured, taking into account the effects of specular reflections and multiple-scattering. Cirrus clouds were generally associated with colder and calmer wind conditions compared to the 2011–2020 climatology. However, the dependence of cirrus properties on temperature and wind speed was not strong. Even though the seasonal cycle was not pronounced, the winter-time cirrus appeared under lower temperatures and stronger wind conditions. Moreover, in winter, geometrically- and optically-thicker cirrus were found and their ice particles tended to be more spherical. The majority of cirrus was associated with westerly flow and westerly cirrus tended to be geometrically-thicker. Overall, optically-thinner layers tended to comprise smaller and less spherical ice crystals, most likely due to reduced water vapor deposition on the particle surface. Compared to lower latitudes, the cirrus layers over Ny-Ålesund were more absorbing in the visible spectral region and they consisted of more spherical ice particles.

1. Introduction

Over the last decades, the rate of near-surface warming in the Arctic has been at least double than elsewhere on our planet (Arctic amplification) [1]. However, the relative contribution of different feedback processes to Arctic amplification is a topic of ongoing research. Clouds are a major modulator of the Arctic energy flow and surface energy budget [2]. Huang et al. [3] suggested that clouds are a driving force for sea ice melt from April to June, following the active coupling between the atmosphere and sea ice in early spring. Still clouds are a challenging puzzle, both within the Arctic climate system and through their role in Arctic amplification [2].
Generally, ice clouds cause a warming effect within the lower atmosphere, while a cooling effect occurs in higher levels [4]. At the top of the atmosphere (TOA) the global effect of ice clouds was approximated at 5.1± 3.8   Wm 2 , while the globally averaged surface effect was negative [4]. Cirrus is the only cloud type capable of inducing daytime cooling or heating at TOA [5]. In contrast, the rest of the clouds produce solely daytime cooling at TOA. The relative magnitude of short-wave (SW) cooling and infrared warming depends on the cloud properties, solar geometry, thermal contrast to the surface and surface albedo [6]. Moreover, cirrus clouds affect the redistribution of water vapor in the upper troposphere and its exchange with the lower stratosphere [7]. However, cirrus clouds are among the most uncertain components of general circulation models due to their wide range of cloud optical depth (COD) and occurrence altitudes [8]. There are quite a few studies on cirrus properties derived from aircraft campaigns (e.g., Gultepe and Starr [9]). Following the air masses by plane allows the detailed investigation of cirrus formation and evolution. Contrary, by ground-based remote sensing, the advection and temporal evolution of air masses are generally hard to study.
Over the European Arctic site of Ny-Ålesund, a negative annual average cloud radiative effect (CRE) ( 16   Wm 2 ) is estimated at TOA [10]. This region is characterized by a strong winter warming of up to 3 C per decade [11]. While liquid-containing clouds dominate the surface CRE in summer, the effect of ice clouds is dominant during polar nights. However, the contribution of Arctic cirrus clouds to the local radiation budget has not been quantified yet. To this end, the first necessary step is a better understanding of the cirrus geometrical and optical properties under different ambient conditions. Passive radiometric sensors often fail to detect optically-thinner cirrus due to their low cloud mask sensitivity [12,13]. Using lidar observations over the sub-Arctic site of Fairbanks, Alaska, the daytime CRE at TOA was investigated for each cirrus regime [14]; opaque (0.3 < COD < 3), optically-thin (0.03 < COD < 0.3) and sub-visible (COD < 0.03) [15]. Opaque cirrus induced an exclusively negative CRE (from 3.4 to 0.3   Wm 2 ) [14]. However, a fluctuating CRE between positive and negative values (from 1.1 to + 0.8   Wm 2 ) was derived when the optically-thin and sub-visible cirrus were considered. Thus, the sign of the cirrus cloud CRE is highly dependent on their COD. Therefore, the reliable detection of optically-thinner cirrus is crucial for the improvement of cirrus CRE estimates. The role of lidar observations is essential in this respect. Comprehensive statistics on the occurrence frequency of high-level ice clouds have been reported over different Arctic sites. Over Barrow, Eureka, and SHEBA ice clouds accounted for 30% of the total cloudiness above 6 km (Figure 3 from Shupe [16]), while over Ny-Ålesund the respective contribution was lower than 20% (Figure 8 from Nomokonova et al. [17]). However, the geometrical and optical properties of Arctic cirrus clouds are under-explored. Cloud-Aerosol lidar with Orthogonal Polarization (CALIOP) and Cloud Profiling Radar have partially filled the observational deficit in the last 15 years by providing observations up to 82 N [18]. Devasthale et al. [19] investigated the geometrical properties of optically-thin clouds over the Arctic using CALIOP observations. The authors found that the geometrical thickness (GT) of ice clouds fluctuated mainly between 0.4 and 1 km, with thicker clouds appearing in winter. Moreover, the cirrus cloud base ( C b a s e ) and top ( C t o p ) occurrences peaked at 6–8 km and 7–9 km, respectively.
Placing emphasis on optically- and geometrically-thinner cirrus, Nakoudi et al. [20] developed an extended lidar-based retrieval scheme (more details in Section 2.2). In this work, this scheme is applied on a 10 year cirrus lidar data set over Ny-Ålesund, Svalbard. This work focuses on the long-term geometrical properties of cirrus clouds but also expands on their optical properties, which are investigated for the first time over an Arctic site. The aim of this work is to give an overview of cirrus geometrical and optical properties, as obtained by lidar, in different seasons over the European Arctic.

2. Methods and Measurement Site

2.1. Lidar and Radiosonde Measurements

The geometrical and optical properties of cirrus layers were retrieved from Koldewey Aerosol Raman lidar (KARL) observations between 2011 and 2020. KARL is installed at the Alfred Wegener Institute–Institute Paul Emile Victor (AWIPEV) research base, Ny-Ålesund (78.9 N, 11.9 E), Svalbard. KARL is well-suited for cloud investigations, as it can provide observations on high vertical (7.5 m) and temporal resolution (1.5 min—4096 pulses). KARL emits light at 1064, 532, and 355 nm (after frequency doubling and tripling) with 200 mJ of power per pulse. The light at 355 and 532 nm is analyzed in two orthogonal polarization planes (perpendicular and parallel with respect to the polarization of the emitted light) and the resulting light components are detected and recorded separately. Additionally, the rotational vibrational Raman lines of nitrogen can be detected (at 387 and 607 nm), allowing for the independent retrieval of the particle backscatter and extinction coefficient. It should be noted that KARL is not in 24-7 operation and its laser beam is not tilted due to its large receiving telescope (diameter of 70 cm). The field of view (FOV) of the telescope is 2.28 mrad. A detailed technical description of KARL can be found in Hoffmann [21].
In order to distinguish layers of ice crystals from those of supercooled liquid-water, a C t o p temperature threshold (< 37 C) was used following Campbell et al. [22] and Shupe [16]. The temperature information was obtained from collocated radiosonde ascents. Radiosondes (type Vaisala RS92 before 2018 and RS41 afterwards) are launched daily from AWIPEV or four times per day during dedicated measurement campaigns. The radiosonde manufacturer provides estimates of the combined uncertainties, these being 0.2–0.4 C for temperature. An additional source of uncertainty, which affects the investigation of cirrus properties’ meteorological dependencies, is the horizontal drift of the radiosondes and the temporal discrepancy to the lidar observations. The radiosonde measurements are available via the Pangea data repository (e.g., Maturilli [23]). Furthermore, information on the horizontal wind speed and wind direction were obtained from the radiosondes in order to investigate the dependence of cirrus properties on the meteorological conditions. By choosing this low temperature limit of 37 C for ice clouds, possible temperature changes due to drift of the radiosondes or time difference between the nearest radiosonde and the lidar observations should not compromise the cloud phase. The relative humidity over ice was calculated from radiosonde measurements using the Goff-Gratch equation. It should be noted that we carefully distinguished cirrus clouds from polar stratospheric clouds, which occur at lower temperatures (below 78 C) and high altitudes (mainly between 20 and 24 km) [24].

2.2. Retrieval of Cirrus Properties

The retrieval of cirrus geometrical and optical properties was based on a newly developed scheme [20]. The detection scheme extended the Wavelet Covariance Transform (WCT) method [25] by dynamic thresholds (dynamic WCT) so as to provide the cirrus C b a s e and C t o p . The WCT profile is sensitive to signal gradients, which may designate the geometrical boundaries of aerosol [26] or cloud layers [27]. Additionally, the dynamic WCT is adaptable to the cloud strength, ambient conditions and lidar specifications. Therefore, the dynamic WCT proved sensitive to thin and faint cirrus layers that would have been partly or completely omitted by static thresholds.
The optical characterization scheme (constrained Klett) extended the Klett–Fernald retrieval [28,29] by an iterative lidar ratio (LR) selection. The iterative process was constrained by a reference value, which indicated the aerosol concentration beneath the cirrus layers (Section 2.3 and Figure 4 of Nakoudi et al. [20]). Contrary to existing approaches (e.g., double-ended Klett [30]), the aerosol-free assumption was not adopted, but the aerosol conditions were approximated by an initial guess. Thanks to the more realistic reference value, the accuracy of the optical properties was increased. The scheme is described in detail in Nakoudi et al. [20] and it is publicly available [31].
The constrained Klett yielded the vertically-constant LR of cirrus layers and subsequently their COD (Equation (4) Nakoudi et al. [20]). Additionally, the linear particle depolarization ratio (LPDR) and color ratio (CR) were derived for each cirrus layer. The LPDR was estimated from the ratio of the particle backscatter coefficients in the perpendicular over the parallel polarization plane (with respect to the polarization of the emitted light). The CR was obtained from the ratio of the total particle backscatter coefficient at two wavelengths (355 over 532 nm). The LPDR (proportional to the particle asphericity) provides qualitative information on the particle shape, while the CR (inversely proportional to the particle radius) offers qualitative information on the particle size.
Overall, the uncertainties in geometrical and optical properties are higher for thin cirrus layers. More specifically, for optically thin cirrus, the inherent uncertainties of the optical retrieval algorithm reached 50% (60–74%) in terms of COD (LR). However, for opaque cirrus COD (LR) uncertainties were lower than 10% (15%). Errors are also introduced due to statistical signal noise of the lidar signals and the procedure of temporal averaging. The aforementioned uncertainties affect the derived particle backscatter coefficient, which is used for the calculation of the LPDR and the CR.

2.3. Quality Assurance of Optical Properties

In cirrus layers with COD lower than 0.02, the constrained Klett could not perform a robust LR adjustment as the light attenuation was not strong enough to scale the solution [20]. Therefore, in this work only the optical properties of layers with COD higher than the constrained Klett sensitivity limit are further analyzed. However, it should be noted that the geometrical properties were reliably derived in both COD regimes.
In lidar systems, where the laser beam is not tilted by some degrees off-nadir, the potential effect of specular reflections should be considered. Specular reflections appear in the presence of horizontally-oriented hexagonal ice crystals and they can be identified by local maxima in the backscatter coefficient together with local minima in the LPDR profiles [32]. According to simulations, the LPDR of horizontally-oriented crystals is lower than 10% (Figures 8b and 9b from Okamoto et al. [33]). Accordingly, we identified LPDR profiles with local minima lower than 10% coincident with local maxima in the backscatter coefficient. The areas suspected of horizontal crystal orientation appeared mostly as thin filaments. Nevertheless, the whole cirrus layers were discarded since a distorted backscatter coefficient profile would impact on the LR and, by extension, on the COD. In total, we screened out 38% of the layers (319 out of 832), indicating a significant presence of hexagonal plate and column ice crystals over Ny-Ålesund.
Additionally, cirrus layers with unexpectedly high LR were screened out. Based on the simulations of Okamoto et al. [33], apparent LR values (before accounting for the multiple-scattering effect) higher than 50 sr are not expected. The exploration of such high values revealed a higher occurrence in spring and for vertically-inhomogeneous layers. The solar elevation is lower in spring compared to summer but the surface albedo is higher as the ground around Ny-Ålesund is still partly snow- or ice-covered [34]. Thus, the background illumination conditions can be relatively high in spring, resulting in lower lidar signal quality. In total, 301 out of 832 cirrus layers passed the quality assurance procedure.
As a final step, the multiple-scattering correction (MSC) was applied using the analytical model of Eloranta [35]. Big particles, such as ice crystals, exhibit a strong forward-scattering peak due to light diffraction. Thereby, the forward-scattered photons remain within the receiving telescope FOV and travel with the laser pulse. As a result, some of the backscattered photons can experience further forward-scattering (one or multiple times) before reaching the lidar detector. The multiple-scattering effect needs to be corrected as the lidar equation assumes that each detected photon originates from a single-scattering event in the atmosphere. The Eloranta model [35] simulates the ratio of photon power from higher order scattering events over single-scattering ones and provides a MSC factor. In this work, the vertically-averaged MSC factor was applied to the LR and COD of each quality assured cirrus layer. The multiple-scattering effect was found equally important for all cirrus regimes in terms of LR. The effect on the COD was higher for the opaque regime. More details are given in Section 2.4 of Nakoudi et al. [20].

2.4. Measurement Site

The analysis of this work is focused on Ny-Ålesund, a site in the west coast of Svalbard, between the Greenland and Barents Sea (Figure 1). Ny-Ålesund is embedded in the complex orography of fjord, glaciers, and mountain ranges of up to 800 m altitude. Micrometeorology plays an important role, especially in the lower troposphere [36,37]. The surrounding mountains create a wind channeling effect along the Kongsfjord with SE flow throughout the year and less frequently flow of the opposite NW direction. Above the orography the free troposphere is characterized by a general westerly flow [38]. Moreover, the warm West Spitsbergen current affects the local conditions through diabatic heating [39]. The Svalbard region is the focal point of winter warming with up to 3 C decadal near-surface temperature increase in the past 20 years [11,40]. The positive temperature and humidity trends extend in the winter-time free troposphere, accompanied by an increasing occurrence of southerly flow [38]. The current conditions over Ny-Ålesund might be representative of a future warming Arctic. However, the Arctic cannot be treated as a uniform environment. The properties of short-lived climate forcing agents depend on several parameters such as the special characteristics of each site in terms of local and synoptic meteorological conditions, aerosol concentration, and proximity to the marginal ice zone.

3. Results

3.1. Cirrus Occurrence and Geometrical Properties

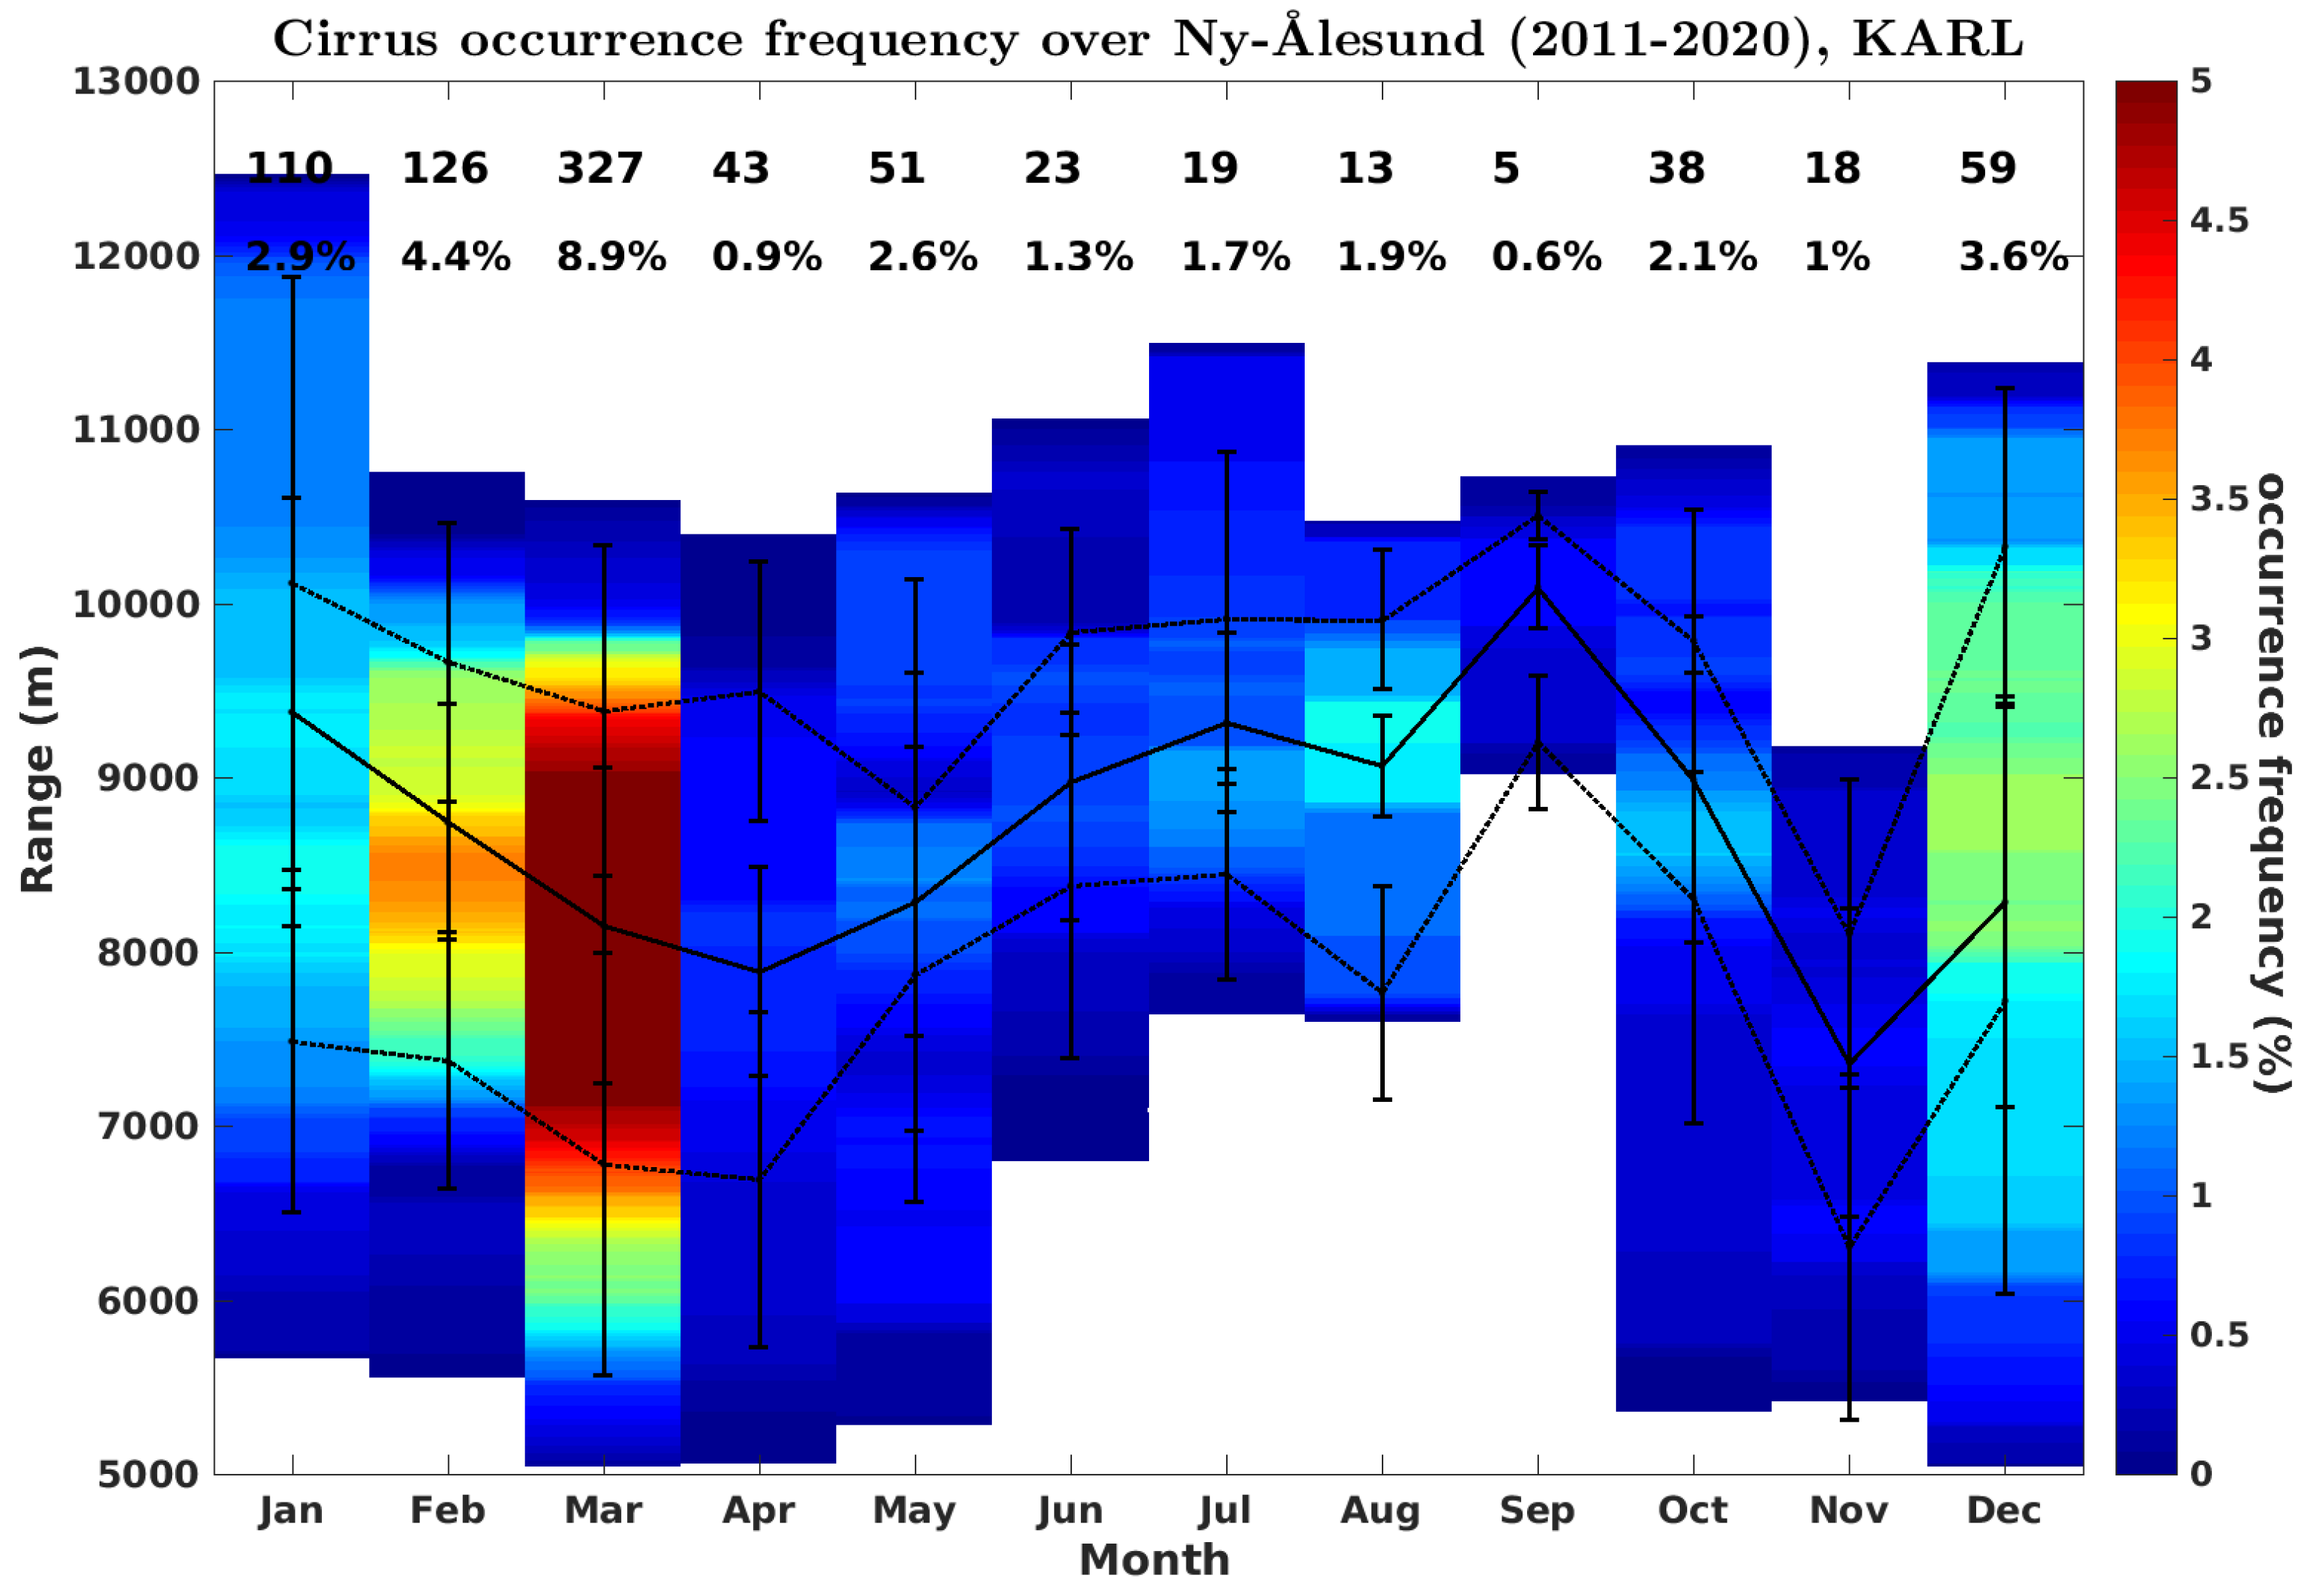
The vertically-resolved occurrence of cirrus (cirrus observations over lidar observation time) is presented on a monthly basis in Figure 2. The cirrus occurrence frequency was higher in winter (3.6 ± 0.7%) and spring (4.1 ± 4.3%) relative to summer (1.6 ± 0.3%) and autumn (1.2 ± 0.8%). This seasonality is in accordance with Nomokonova et al. [17], who reported higher occurrence of ice clouds over Ny-Ålesund in winter and spring using continuous remote sensing observations. The RH over ice (RHice) from the radiosondes revealed fairly constant conditions over seasons in the altitude range 5.5 km to 9.5 km, with mean RHice about 62%. From summer to autumn (July to November), a maximum of 65% was measured. However, the probability of finding moist conditions (defined by RHice > 75%) was highest in October (23%), followed by March (18%). Hence, the RHice from one radiosonde per day is not sufficient to explain the measured cirrus occurrence frequency in the lidar data. It should be noted that the highest occurrence frequency in March is possibly associated with the intensive measurement campaigns that take place at AWIPEV each year. In the rest of the year, the measurements are only performed in the absence of low-level clouds, while in March under a breadth of conditions.
The annual mean occurrence frequency amounted to 2.7 ± 1.8%. The occurrence frequencies reported here are negatively biased as they only include reliably detected layers. More specifically, neither weak or highly opaque cirrus (no C t o p detection) nor cirrus with directly underlying mid-level clouds or multi-layered cirrus were analyzed. The cirrus occurrence frequencies reported here should not be confused with the total cloud cover, which is approximately 80% over Ny-Ålesund as reported by Yeo et al. [41] andNomokonova et al. [17].
An overview of the cirrus geometrical properties for each season is presented in Figure 3 as well as in Table A1. Thicker layers were observed in winter and spring (Figure 3a). The total GT of cirrus layers amounted to 2 ± 1.2 km and their majority was thinner than 4.5 km. Cirrus layers down to a thickness of 158 m were detected (in July), while the thickest layer extended over 6.3 km (in January). The distribution of GT was broader compared to mid-latitudes. Broader distributions have also been demonstrated from satellite observations during the local winter of the Polar regions [19,42].
The cirrus C b a s e ( C t o p ) varied from 5.5 to 8.5 km (from 8.5 to 10.5 km). The C b a s e followed the seasonal cycle of the cirrus temperature regime (below 37 C, Section 2.1) and appeared lower in winter and spring. The C t o p was higher during summer, which is in accordance with the seasonality of the tropopause height. However, in December and January, the C t o p appeared in comparable or even higher altitudes than summer (Figure 2). This at first sight paradox is related to the frequently poorly-defined polar night tropopause. Maturilli and Kayser [38], using 22 years of radiosonde measurements over Ny-Ålesund, demonstrated that the winter-time thermal tropopause is often indistinguishable due to very low static stability. This regime is connected to radiative cooling in the absence of solar radiation and the governing polar vortex dynamics, while during the sun-lit period a well-defined tropopause regime appears [38]. On a more detailed analysis (not shown), we found that for a well-defined tropopause the relative humidity (RH) declined rapidly to nearly-zero levels due to positive temperature gradients, whereas for a poorly-defined tropopause the RH decrease was smoother in connection with nearly-neutral temperature gradients. A poor separation between the troposphere and the stratosphere is more likely to favor the intrusion of water vapor into the lowermost stratosphere, which, in turn, fosters cloud formation and persistence. Concerning the relation between cirrus occurrence and a poorly-defined tropopause, the following can be stated: the poorly-defined regime is necessary but not sufficient for cirrus to extend within the tropopause as the availability of water vapor is also a crucial factor for cloud occurrence. Cirrus clouds up to 12 km over the Arctic have also been observed by CALIOP (Figure 7 from Devasthale et al. [19]).

3.2. Meteorological Conditions

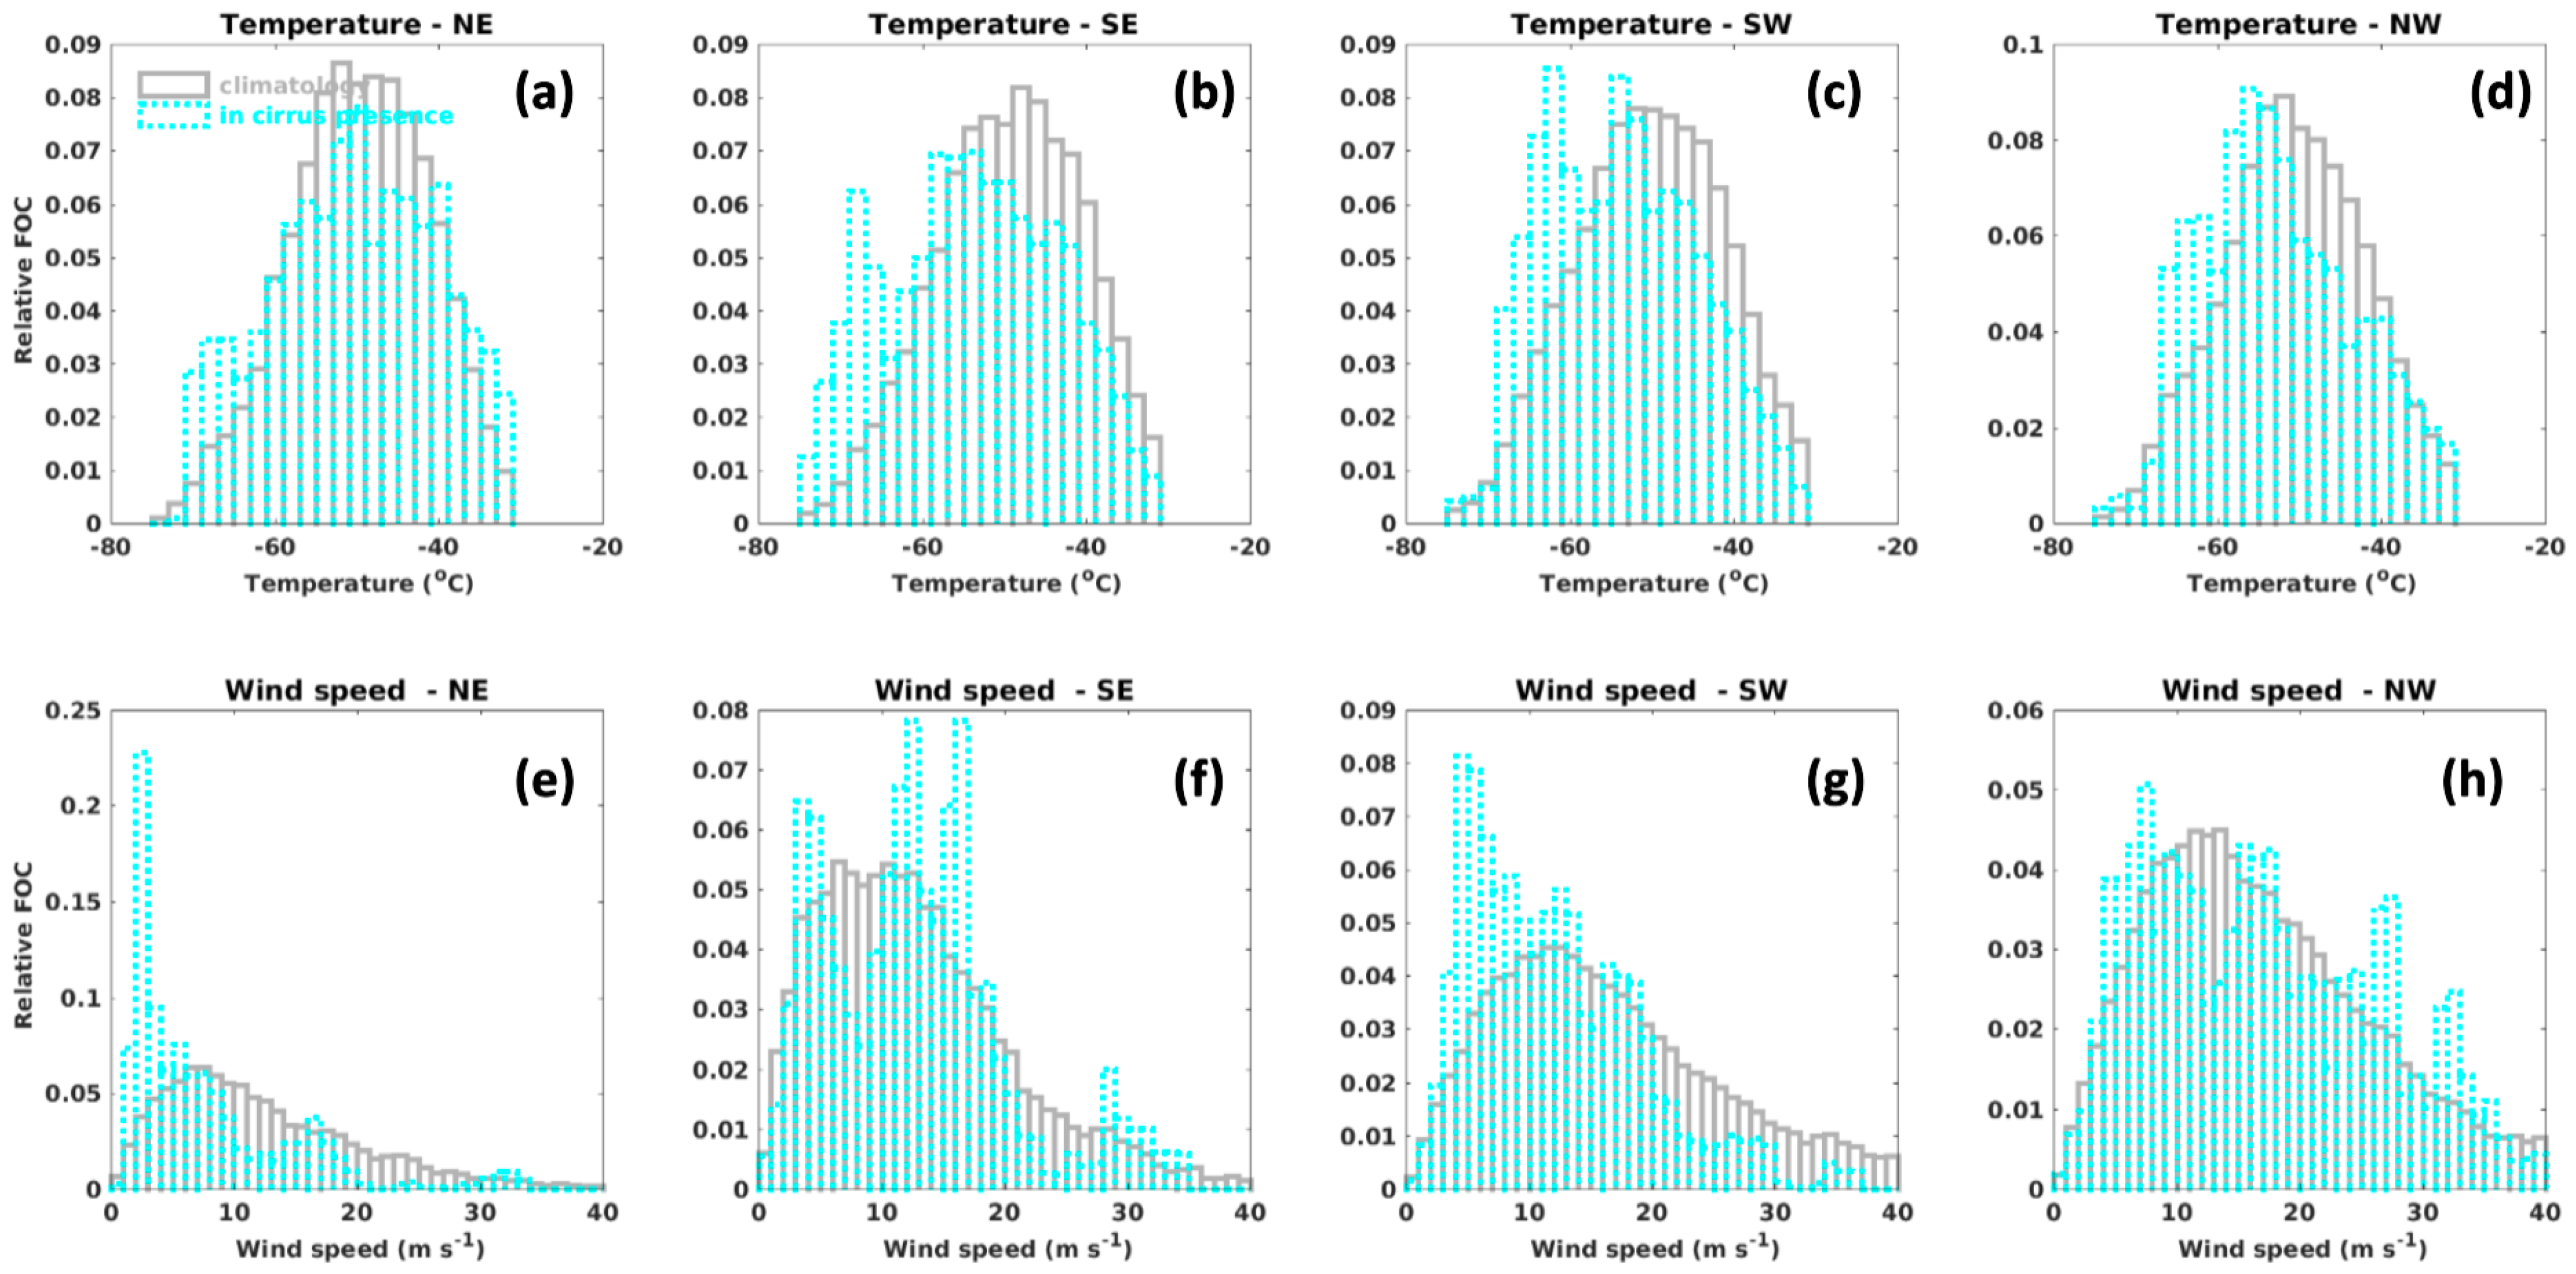
The meteorological parameters were derived from radiosonde ascents (Section 2.1). For days with multiple launches, each cirrus layer was matched with the temporally-closest radiosonde. Thereby, an overview of the meteorological conditions in the presence of the detected cirrus can be obtained. Moreover, the meteorological conditions throughout the study period (2011–2020) were examined. To this end, all available radiosonde ascents (4691 in total) were used and the measurements within the monthly cirrus envelope heights (as given in Figure 2) were extracted. It should be noted that the detected cirrus as well as those appearing when KARL was switched off are part of the climatological dataset. However, this approach can still assess the conditions in the presence of detected cirrus with respect to the overall meteorological conditions (Figure 4). Cirrus clouds were generally associated with colder and calmer wind conditions compared to the 2011–2020 climatology. However, under SE and NW flow strong winds also seemed conducive for cirrus occurrence.
In order to increase our confidence in the representativeness of radiosonde measurements for the meteorological conditions in the presence of cirrus, a temporal criterion was applied. Limiting the temporal difference between radiosonde and lidar measurements to 2 h, 148 layers remained for analysis and an overview of the meteorological conditions within their altitude range is presented in Figure 5. The median temperature ranged between 65 and 50 C, while the T C b a s e ( T C t o p ) varied from 55 to 38 C (from 70 to 55 C). A broad range of wind conditions was found (mostly between 1 and 15 ms 1 ), with an increasing wind speed tendency from the C b a s e towards the C t o p . A similar tendency was also reported over mid-latitude (Utah [43]) and sub-tropical sites (Wuhan [44]). Concerning wind direction, the majority of cirrus was connected to SW flow, followed by NW and NE contributions. Apparently, the warmer and moister Atlantic air masses can provide the reservoir of humidity for cirrus formation when advected northwards. Hence, the cirrus occurrence frequency may increase over Svalbard if the advection from SW continues to rise as reported by Maturilli and Kayser [38]. Yeo et al. [41] showed that warm and moist air masses from the North Atlantic were also conducive for cloud occurrence below 2 km over Ny-Ålesund. Gierens et al. [45] reported that low-level mixed-phase clouds were most common under westerly winds over Ny-Ålesund. It should be noted, however, that for low-level clouds the role of orography and surface coupling is important. This is the first work that tries to shed light on the relation of cirrus occurrence with temperature and wind conditions over Ny-Ålesund. A more extended and statistically robust analysis is desirable in the future, for example using satellite lidar observations. Finally, a seasonal overview of the meteorological conditions is presented in Table A2. Colder cirrus tended to appear in winter and spring and winter-time cirrus were accompanied by markedly stronger wind conditions. Winter- and spring-time cirrus were associated with W–SW flow, whereas a E–NE flow appeared in summer. The most variable wind conditions appeared in autumn.

3.3. Cirrus Optical Properties

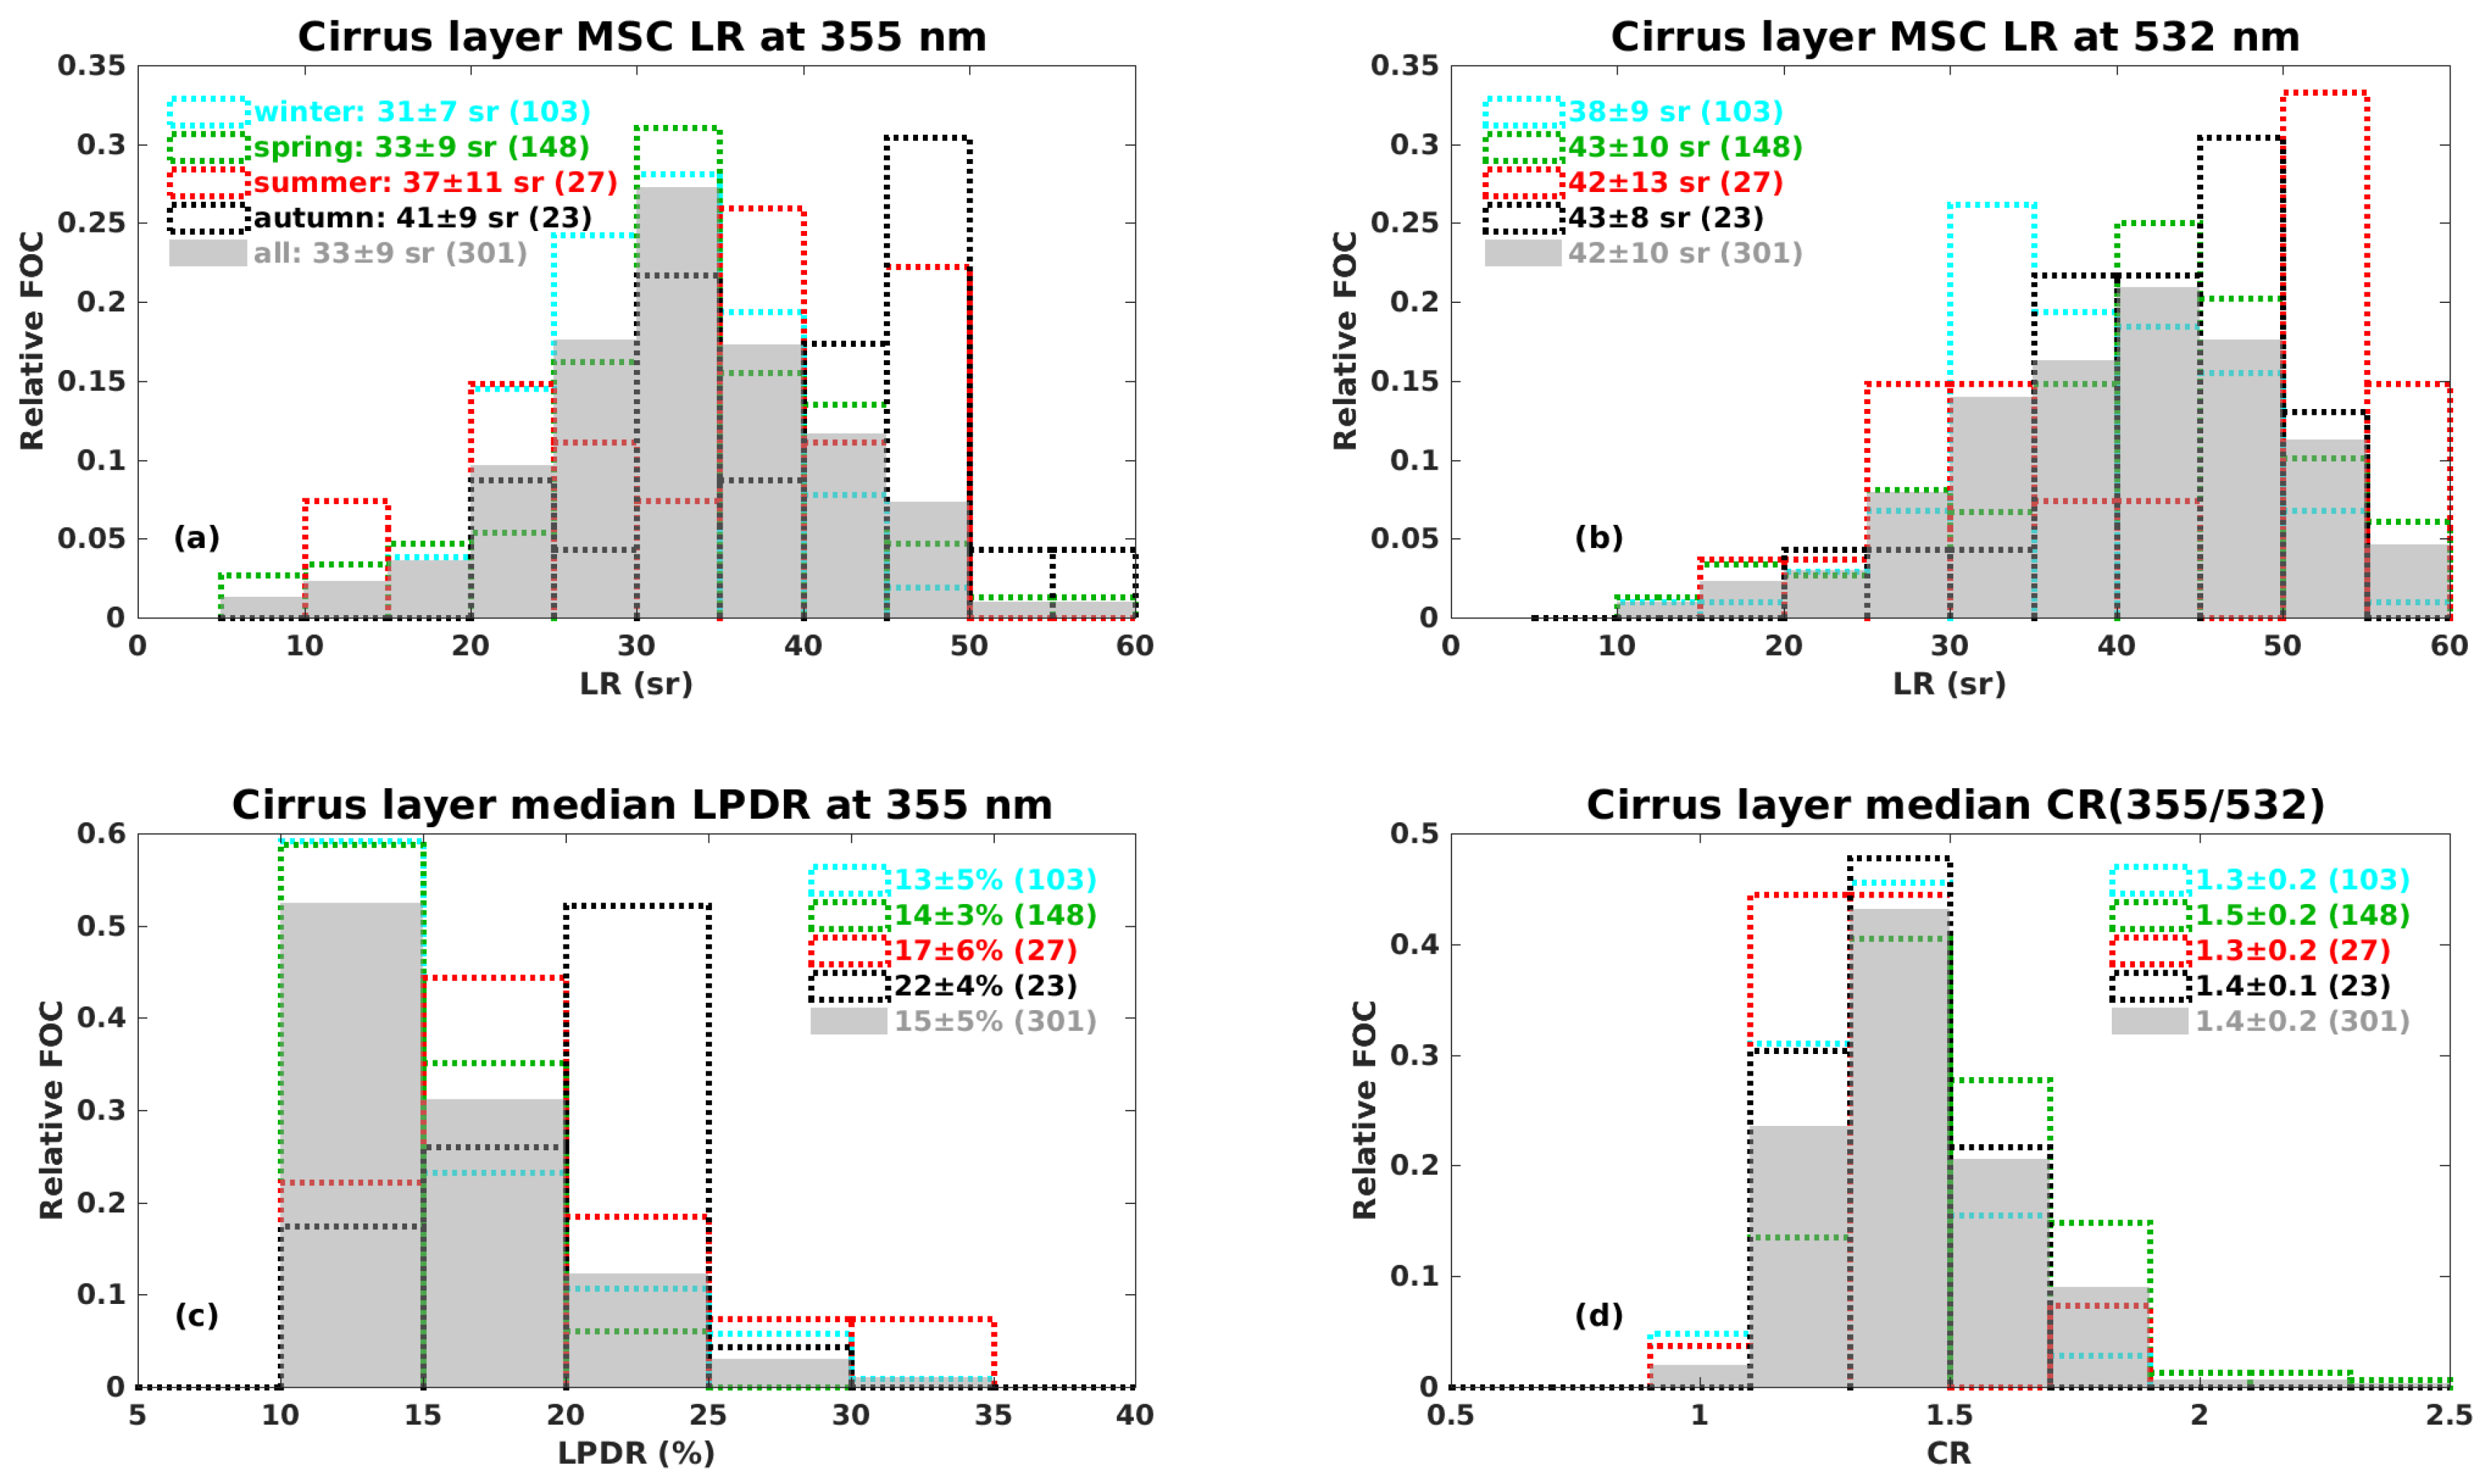
An overview of the cirrus layer optical properties is presented in Figure 6 and Table A3. The MSC LR is given along with the layer median LPDR and CR. Data points that passed the quality assurance (Section 2.3) were only taken into account. Therefore, only a subset of the layers shown in Figure 2 are presented here. The L R 532 was shifted to higher values in comparison to the L R 355 (Figure 6a,b), indicating that the cirrus layers were more absorbing in the visible spectral region. The L R 355 (33 ± 9 sr) over Ny-Ålesund was in great agreement with the average L R 355 (33 ± 7 sr) over the sub-Arctic site of Kuopio [27].
The L P D R 355 mainly varied between 10 and 20% (Figure 6c). The LPDR was higher in summer and autumn. However, compared to other cirrus studies, the presented LPDR values are lower. For instance, over Kuopio an annual mean L P D R 355 of 38 ± 7% was reported but the analysis was limited to clouds with LPDR higher than 25% [27]. Wang et al. [44] found an annual mean LPDR of 30 ± 9% over Wuhan, China. For cirrus clouds, which originated from heavy air traffic sectors over the Atlantic Ocean and Europe, higher LPDR (47 ± 7%) was reported compared to cirrus from clearer regions (38 ± 6% [46]). The decreasing LPDR tendency for clearer origin cirrus is in the same direction with the lower LPDR over Ny-Ålesund.
Regarding the CR, it mainly varied between 1.2 and 1.6 (Figure 6d). The corresponding Ångström exponent, which is an alternative size indicating property, amounted to 0.8 ± 0.4. Unfortunately, it is hard to find comparable literature for the cirrus CR as various definitions and wavelength pairs are used. Voudouri et al. [27] used the same CR definition and the same wavelength pair (355–532 nm) as here. They reported an average CR of 1.1 ± 0.8 over Kuopio, indicating the presence of slightly bigger ice crystals compared to Ny-Ålesund. Finally, according to the simulations of Okamoto et al. [33] the CR ranged mainly between 0.7 and 2 (values from Figure 9a of Okamoto et al. [33] were inverted to match our definition).
The majority of cirrus observed by lidar over Ny-Ålesund were optically-thin (73%), followed by the sub-visible regime (20%). The domination of optically-thin cirrus was also observed over Kuopio [27] and Fairbanks [14]. However, it should be noted that the derived distribution of this study is likely to be positively biased towards optically-thin cirrus. Concerning sub-visible cirrus, their detection and optical evaluation was the most challenging [20]. Regarding the opaque regime, its underestimation is related to the instrumental limitations of lidar. More specifically, the lidar laser beam can be partly or completely attenuated within highly opaque layers. Sassen and Cho [15] suggested a COD of 3 as an upper lidar attenuation limit for cirrus layers. In this study the maximum COD, which was reliably derived, reached 1.8. Additionally, KARL is usually switched off in the presence of highly opaque clouds because the strong backscattered signal can damage its detectors. Keeping the aforementioned possible bias sources in mind, the mean ± standard deviation (median) MSC COD over Ny-Ålesund was equal to 0.17 ± 0.26 (0.1) at 355 nm. Similar values were found at 532 nm. In winter the COD over Ny-Ålesund was higher compared to the rest of the year (Table A3). Optically-thicker cirrus layers were observed over Kuopio ( C O D 355 = 0.25 ± 0.2 [27]) due to the lower contribution of sub-visible cirrus (only 3%) in that dataset.

3.4. Inter-Relations of Cirrus Properties

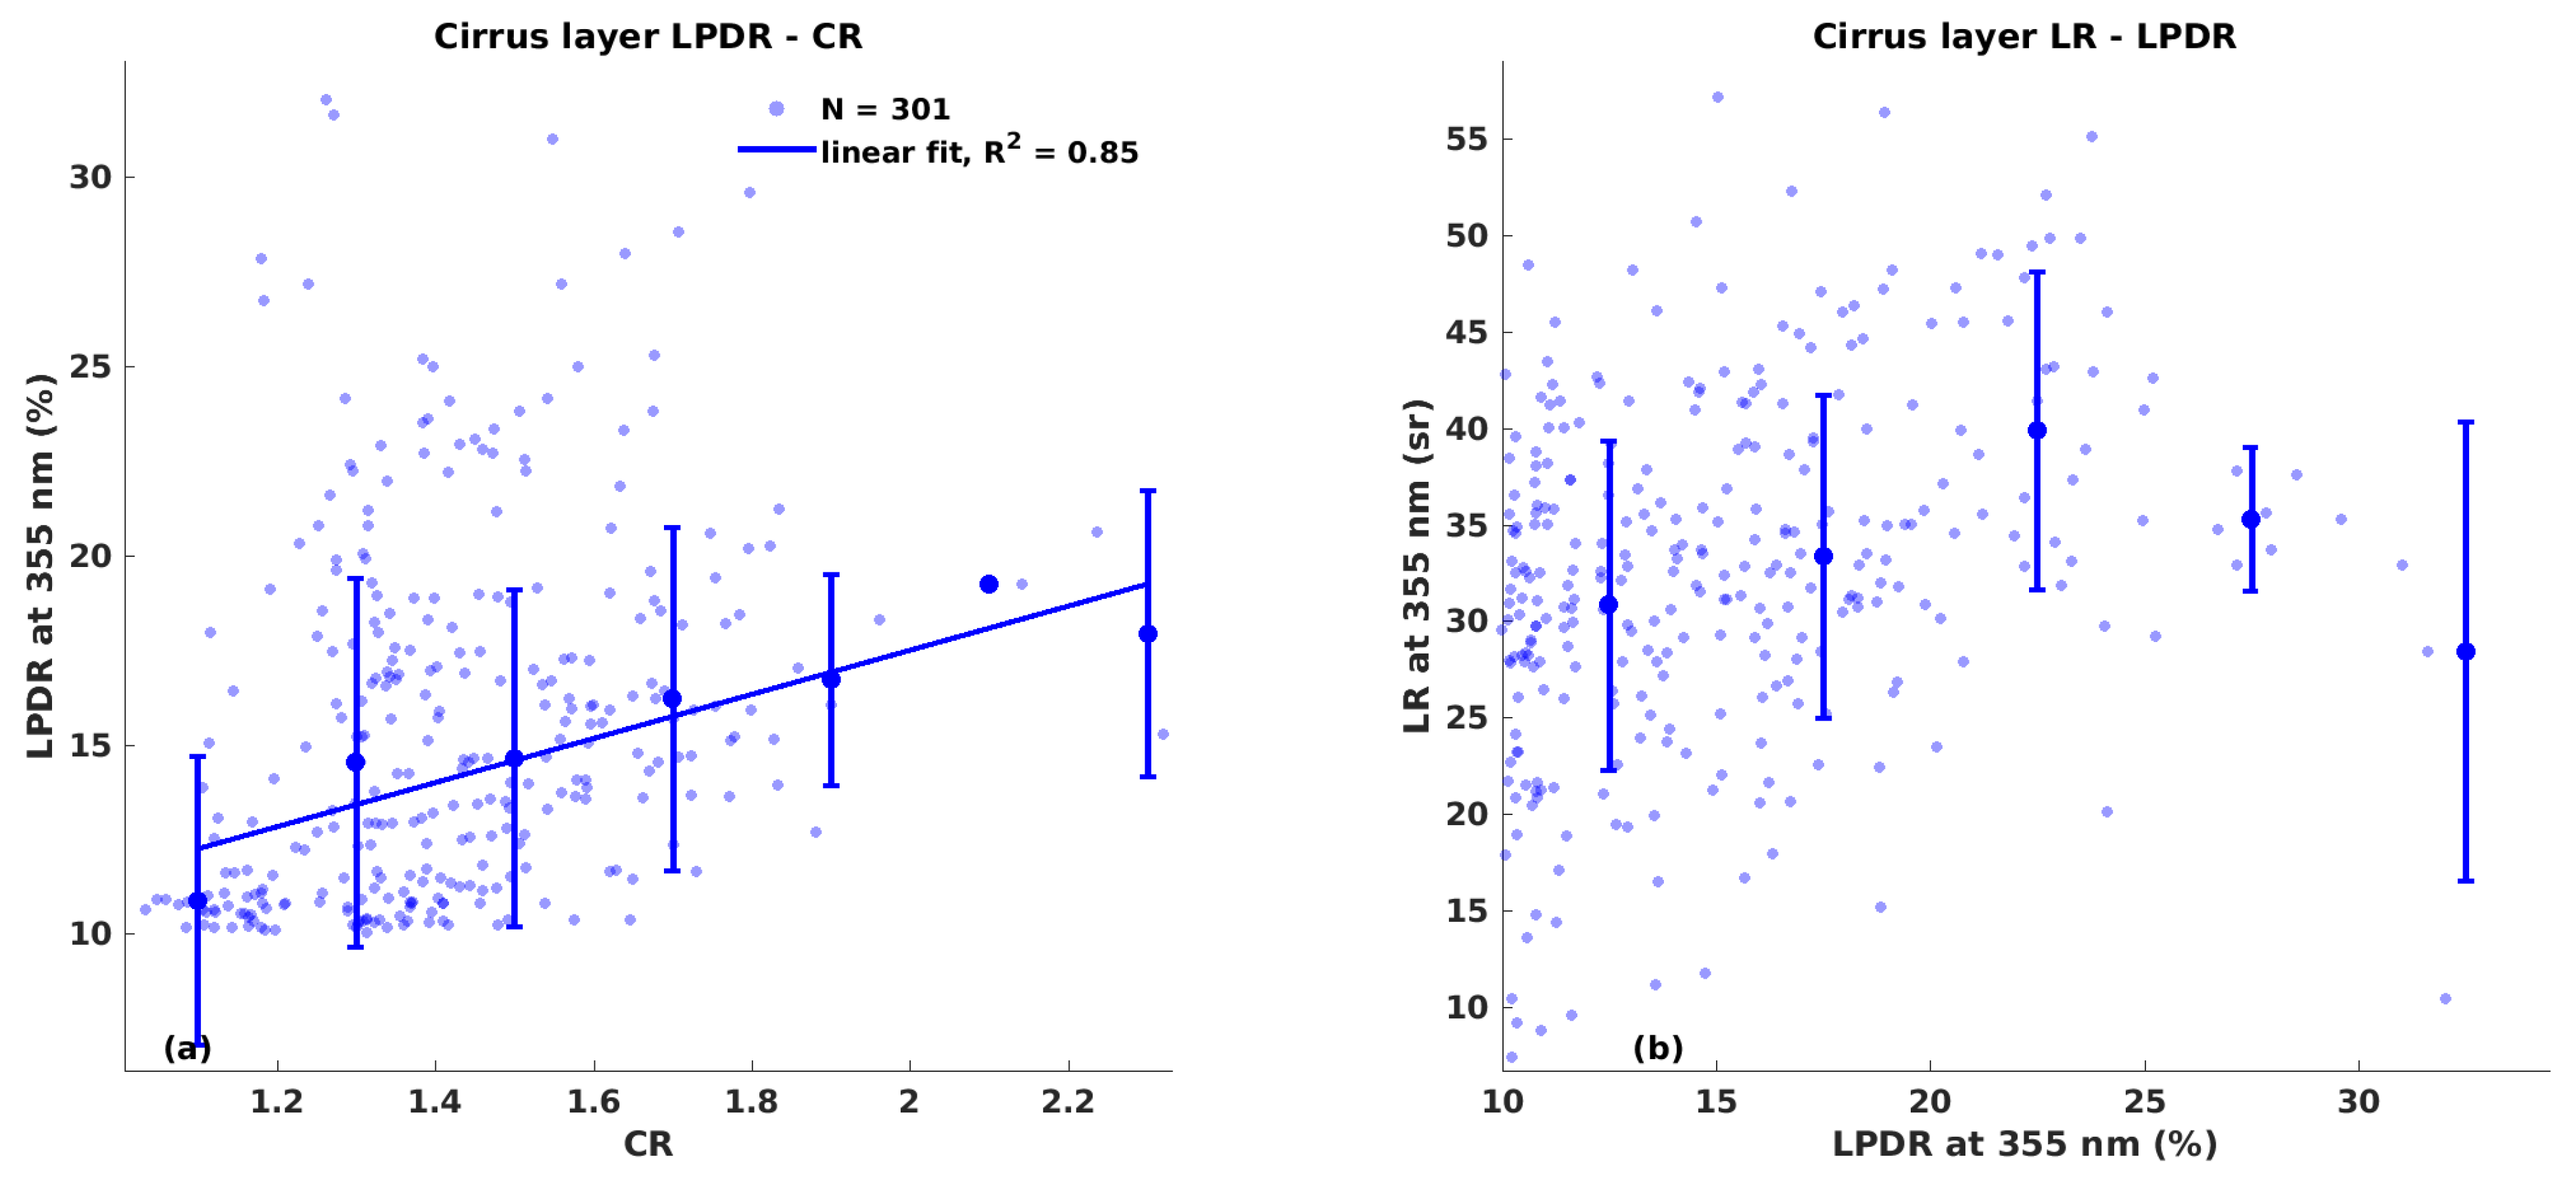
In this section, the cirrus properties are investigated in relation to one another. The relation of LPDR with CR and LR is examined (Figure 7a,b). Individual measurements are presented together with the median ± standard deviation of different CR and LPDR classes. In order to facilitate visual guidance, linear regression lines are overlaid on the median values and only in cases where the coefficient of determination ( R 2 ) exceeded 0.5. However, looking at individual observation points it is evident that the relations of cirrus properties are more complex than linear. The LPDR and CR exhibited an overall proportional relation (Figure 7a), which translates into bigger ice particles (lower CR) being more spherical (lower LPDR). Increased deposition of water vapor is more likely to have occurred on the surface of bigger particles, rendering their shape more spherical. For LPDR below 25%, the LR and LPDR were proportional (Figure 7b), while for higher LPDR an inversely proportional relation was displayed.
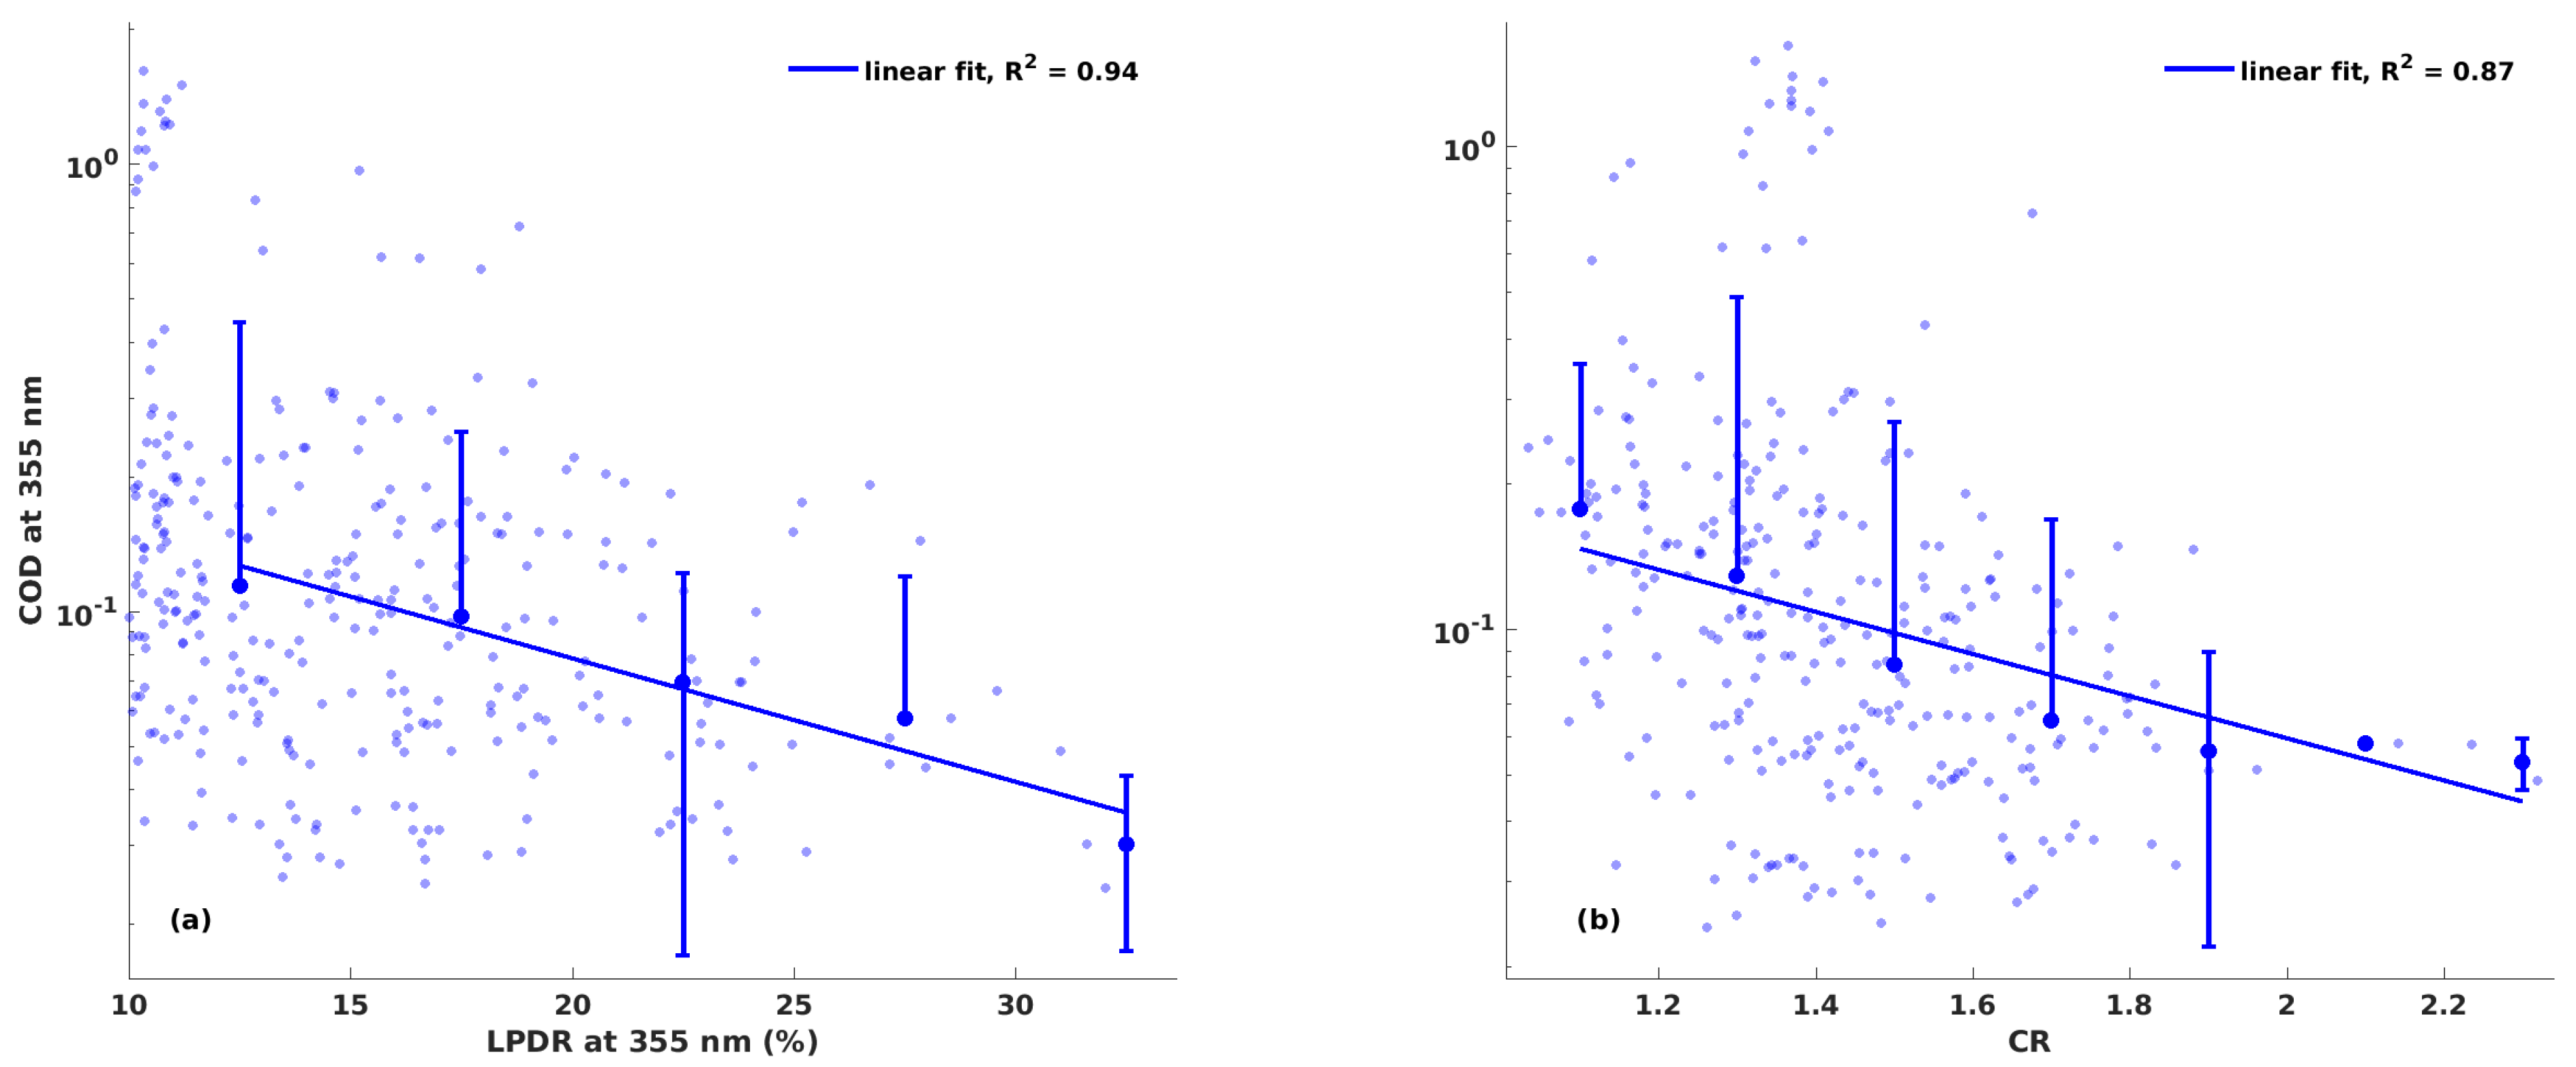
Subsequently, the dependence of COD on LPDR and CR (Figure 8a,b) was investigated. The dependence on LR and GT is not presented as these parameters affect the COD by definition. An inversely proportional relation was indicated between COD and LPDR as well as CR. This means that the COD tended to decrease for smaller (increasing CR) and less spherical ice particles (increasing LPDR), most likely due to reduced water vapor deposition on the ice particle surface. Similar results were obtained for C O D 532 (not shown).
The aforementioned relations were also investigated on a seasonal basis, but no clear difference was found (Figure A1). It should be noted that the distribution of observation points is not uniform across the created LPDR and CR classes, which also limits the statistical robustness of the presented relations. Finally, the relations discussed above may also depend on the ice particle shape, aerosol load, air mass origin, cirrus formation mechanism, relative humidity over ice, vertical wind speed and other parameters. However, such dependencies need to be investigated in the context of case studies, which is out of the scope of this work.

3.5. Meteorological Dependence of Cirrus Properties

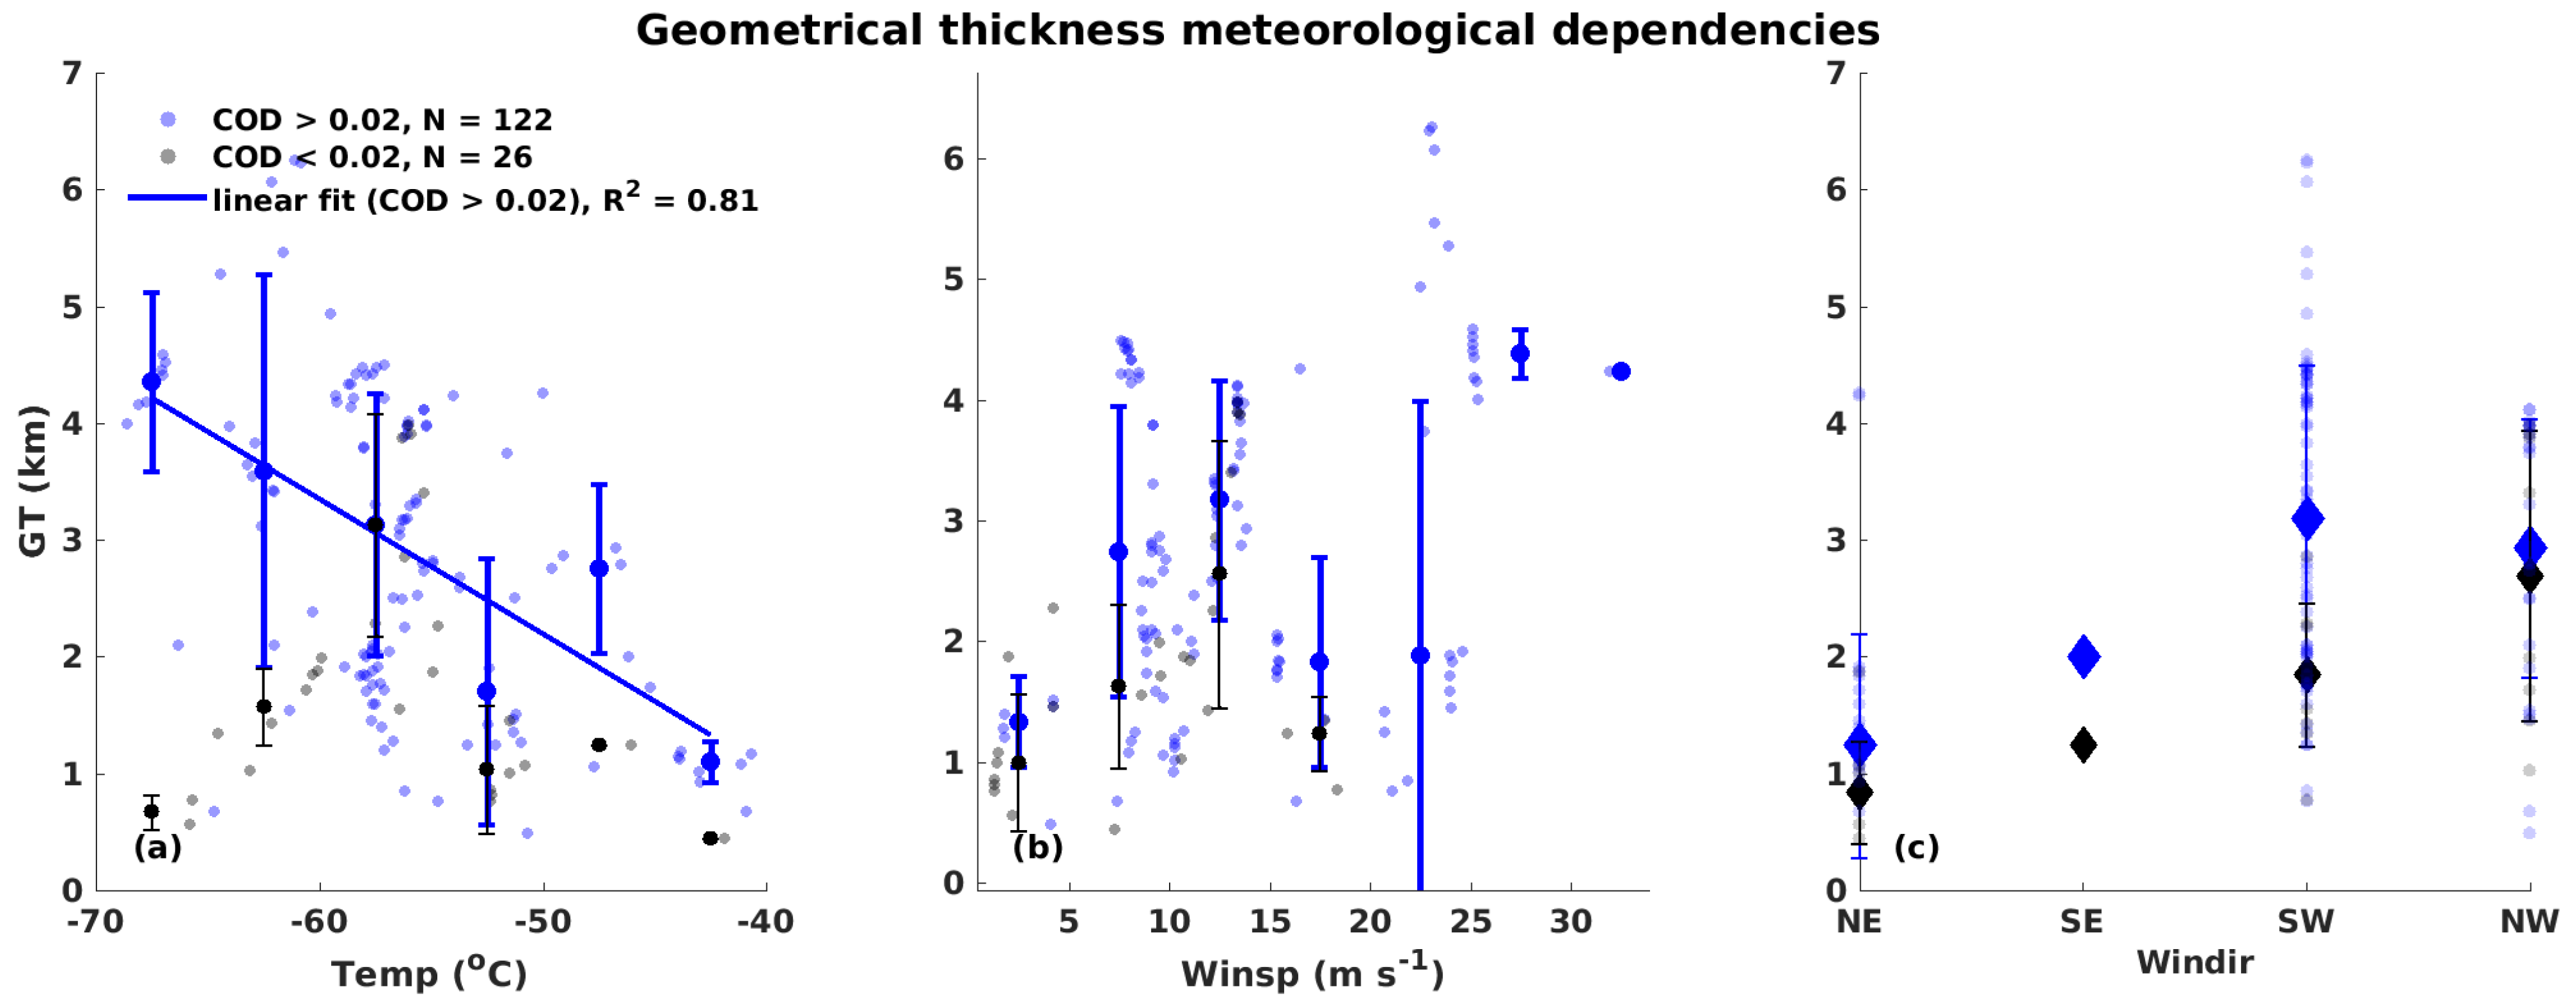
The dependence of cirrus geometrical and optical properties on the meteorological conditions is examined here. The dependency of GT on the meteorological conditions is explored in Figure 9. The observations correspond to the high and low COD regimes (above and below the constrained Klett sensitivity limit, respectively), with the GT reliably derived in both regimes. In the high COD regime (blue), the GT decreased with temperature, which is surprising since layers forming at higher temperatures (lower altitudes) are generally expected to be geometrically-thicker due to their greater distance from the tropopause [44,47]. However, the high GT branch comprised mainly winter and spring cirrus, with those being thicker than 3 km and colder than 50 C related to the poorly-defined tropopause regime discussed in Section 3.1. A decreasing GT with temperature has also been observed over Kuopio below 50 C [27]. Only the GT of layers thinner than 2.5 km and colder than 55 C increased with temperature.
Concerning wind speed, a proportionality to GT was observed, especially for wind lower than 15 ms 1 (Figure 9b). This can be explained considering that wind speed is a proxy for advection of air masses. Assuming air masses of equal RH advected towards a region with similar ice nucleating particle type, number concentration, and size distribution, a stronger wind regime will result in intensified ice nucleation. During intensified condensation and deposition of water vapor, higher amounts of latent heat are released, which promote ascending air motion within the cirrus and, thus, lead to higher vertical extent. Regarding wind direction, geometrically-thicker cirrus appeared under westerly flow but the different GT classes fell within each other’s variability (Figure 9c).
In the following, the dependence of cirrus optical properties on temperature (Figure 10) and wind speed (Figure 11) is investigated. The dependency of COD and LPDR was not clear (Figure 10a,c), similar to Kuopio [27]. However, over lower latitudes the COD–temperature relation was closer to linearly proportional [44,47,48] and the LPDR decreased with temperature [44,49]. Concerning the L R , a clear dependence on temperature has not been observed at any site yet [27,44,50], similarly to Ny-Ålesund (Figure 10b). Below 55 C the CR increased slightly (smaller ice particles) with temperature, while the opposite was observed between 55 and 45 C (Figure 10d).
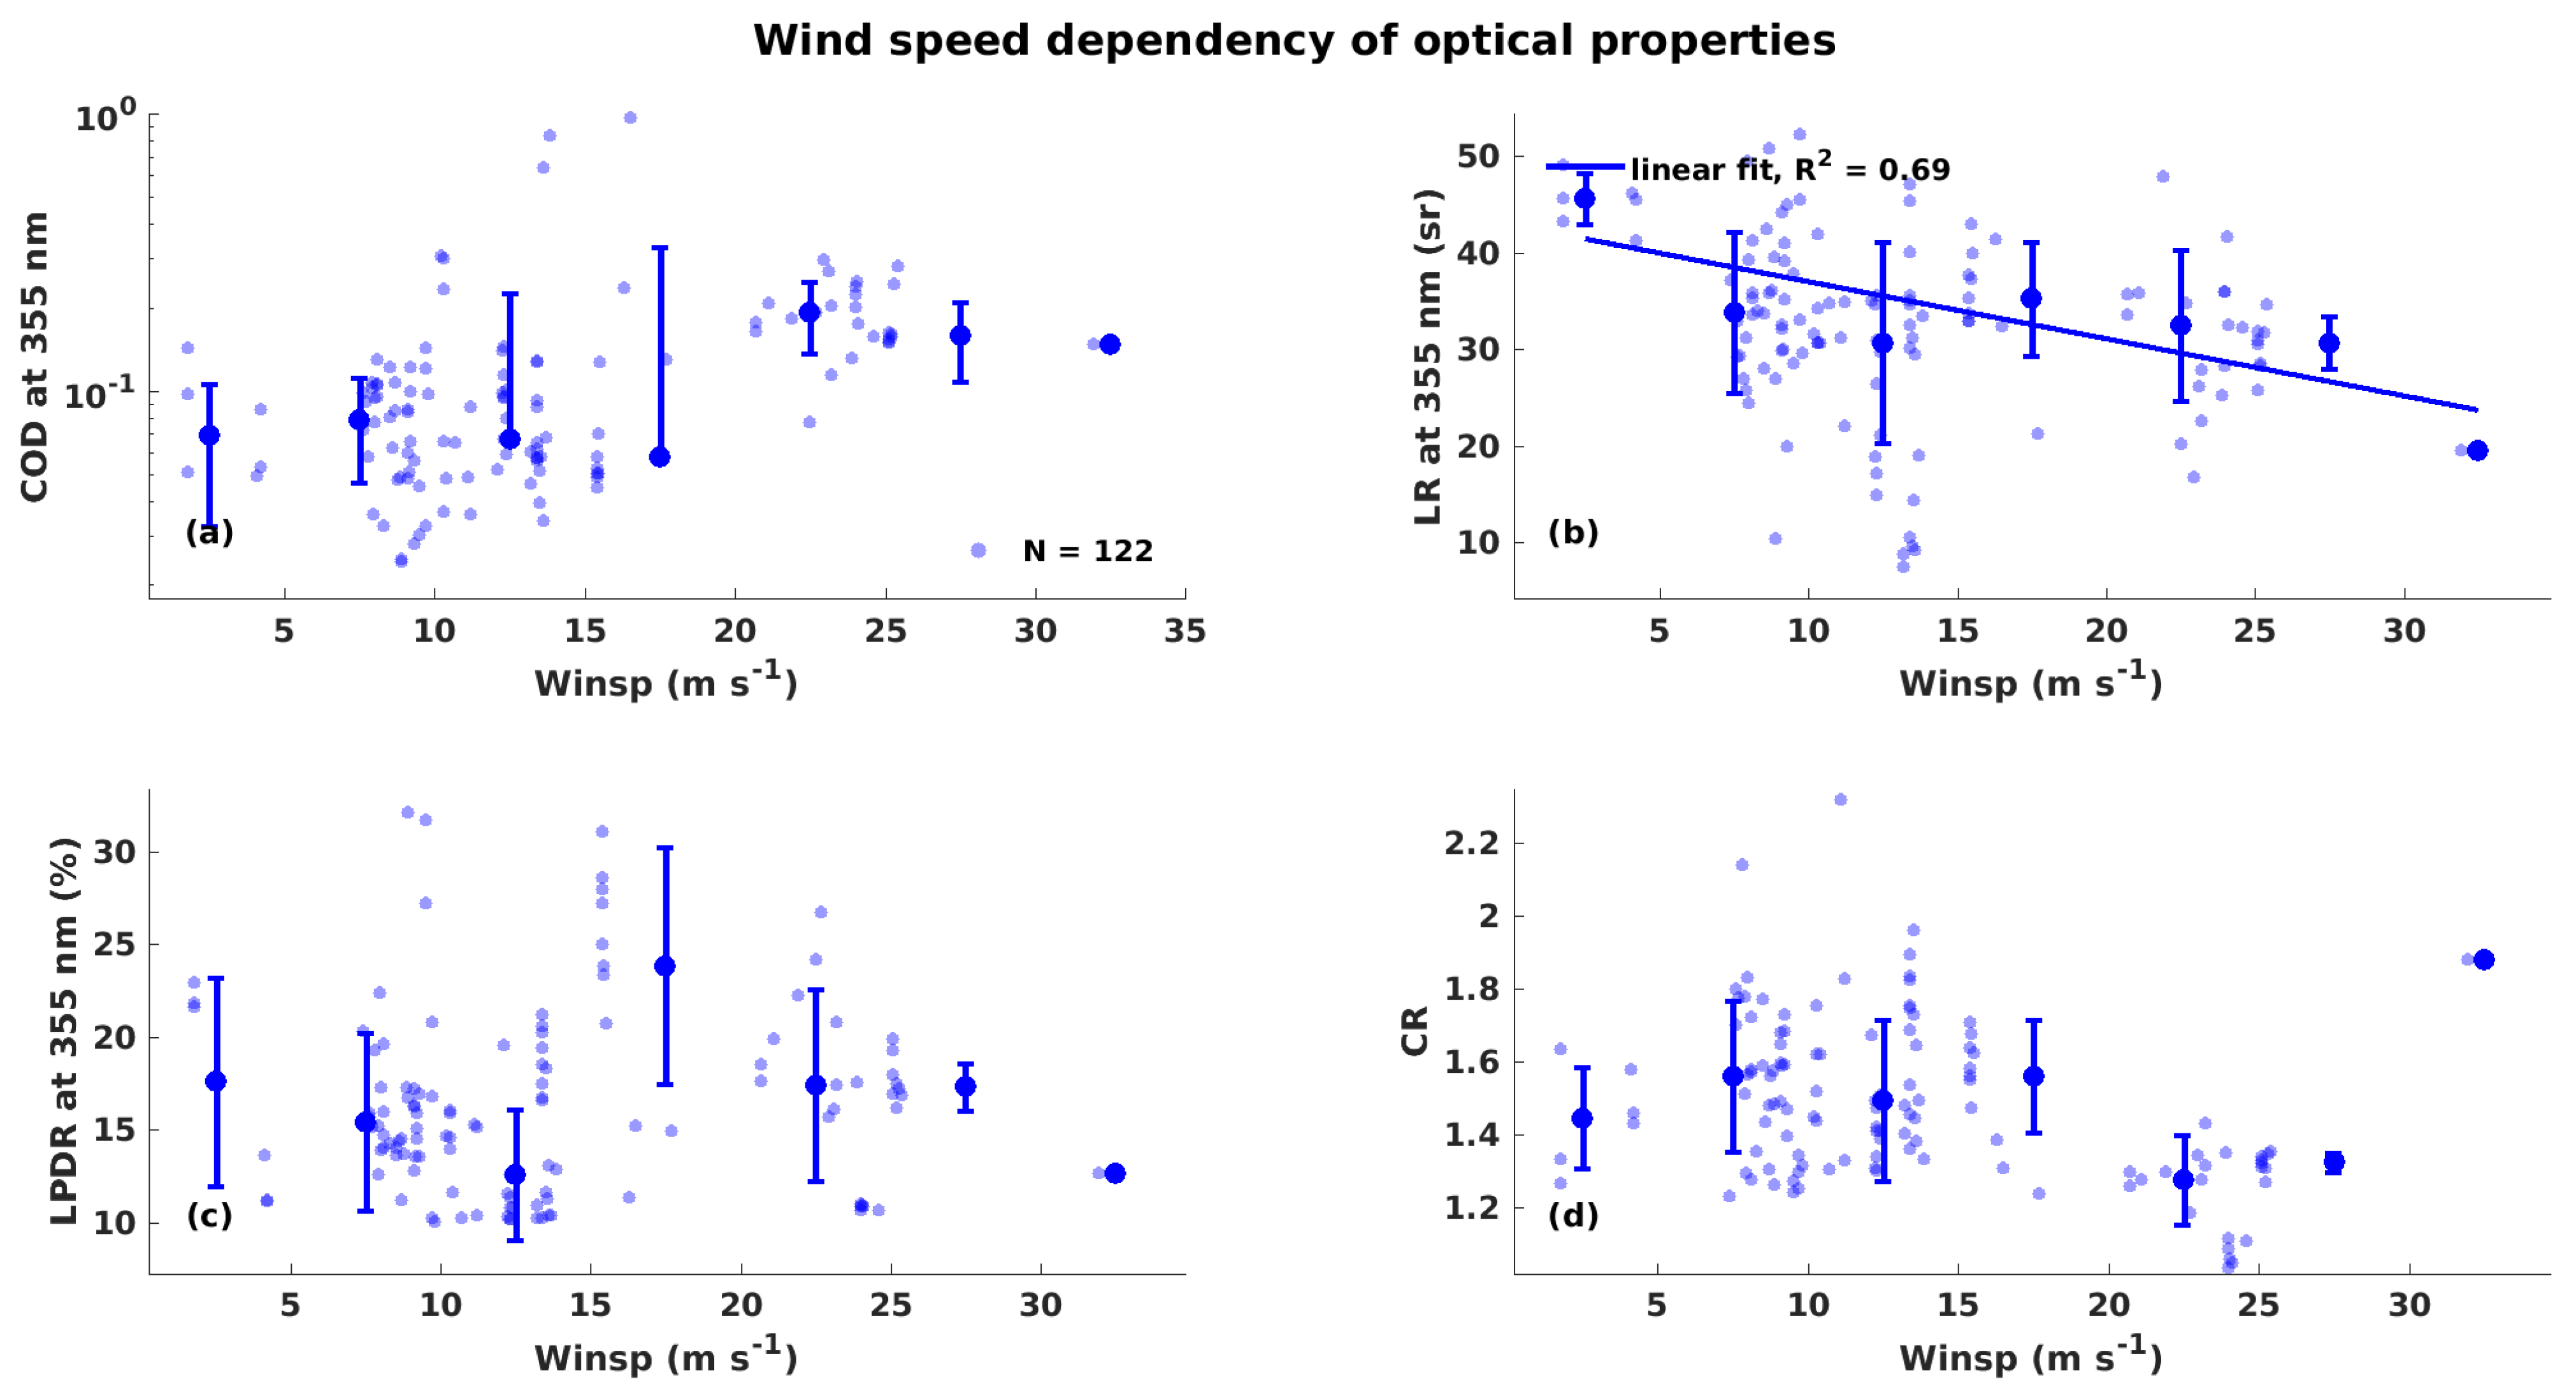
The relation of COD with wind speed was weakly proportional (Figure 11a), while the L R decreased with wind speed (Figure 11b). The respective LPDR and CR relations were not clear. However, more spherical ice particles tended to appear for stronger winds. More specifically, the LPDR decreased (more spherical particles) in the wind regimes of 1–15 ms 1 and 15–35 ms 1 (Figure 11c,d). Stronger wind could be a proxy of intensified water vapor deposition on the ice particles, which increases their sphericity and the cirrus layer COD. Finally, the optical properties were similar for different wind sectors (not shown). It should be noted that the number of cloud observations is still small in order to draw statistically robust conclusions. However, the presented results can be a useful benchmark for relevant future studies.

4. Discussion

The occurrence of winter-time cirrus clouds at high altitudes might have implications for the CRE. In the era of Arctic Amplification, an increasing thermal contrast between the warming surface and the higher and, thus, colder cirrus may drive a positive feedback process [14]. Cirrus clouds will receive more long-wave irradiance from the warmer surface but they will re-emit less irradiance towards the TOA, due to their lower temperature, and, thereby, intensify the positive CRE. By performing simplified calculations of the TOA CRE using the Corti–Peter model [51], we found a positive effect throughout the year. The CRE was maximum in winter ( + 9.4   Wm 2 ) and minimum in summer ( + 2.5   Wm 2 ) due to the higher contribution of the SW cooling term in the latter case. The overall TOA CRE over Ny-Ålesund is also positive in spring, autumn and winter (approximately + 10   Wm 2 per month) but gets negative (varying from 180 to 10   Wm 2 ) in the summer [10]. Thus, cirrus are expected to contribute to the warming CRE signal in spring, autumn, and winter but to counterbalance the summer-time cooling signal. A further CRE sensitivity analysis was performed with the COD, surface albedo, T C t o p and surface temperature perturbed within representative ranges for the site of Ny-Ålesund. A predominantly positive effect was revealed and the effect turned negative only for highly opaque cirrus (COD higher than 10) and over tundra. Thus, over the high European Arctic, the COD along with the surface albedo seem to be the most critical parameters in determining the cirrus CRE sign at TOA. It should be noted that the discussed CRE are first order estimates. Comprehensive radiative transfer simulations are necessary to accurately estimate the cirrus contribution to the local radiative budget. However, this is a task for a dedicated future study.
The cirrus clouds observed over Ny-Ålesund seem colder compared to those over sub-Arctic sites. Over Fairbanks the T C t o p rarely dropped below 60 C. Over Kuopio the temperature was 50 ± 10 C (for C m i d of 9.2 km), while over Ny-Ålesund the median layer temperature amounted to 57 ± 6 C (for C m i d of 8.3 km). It should be noted, however, that the analysis for Fairbanks and Kuopio a priori considered warmer cirrus, as the T C b a s e threshold was set to 27 C (for Ny-Ålesund this was set at 40 C). Compared to tropical sites, the Ny-Ålesund cirrus tended to be slightly warmer due to their lower occurrence altitudes, constrained by the meridionally sloping tropopause. For instance, T C m i d of 65 ± 12 C was reported at 14.1 ± 2 km over tropical India [52]. During aircraft campaigns over different regions, more than half of the cirrus clouds were observed above 48 C, except for the Tropics [53]. Therefore, the presented cirrus properties can be considered as more representative for cold cirrus. In the present study, the dependence of COD and LPDR on temperature seems to be weaker compared to tropical [49] and sub-tropical studies [44].
The L R 532 over Ny-Ålesund seems to follow the latitudinally increasing L R tendency, which is reported by Voudouri et al. [27] (their Figure 7c). Nevertheless, an asymptotic behavior was found for L R 355 . A poleward increase of the L R has been reported over the Northern Hemisphere for opaque ice clouds (Young et al. [54], using CALIOP observations). More specifically, the L R 532 (following an increasing gradient of centroid temperature) started from approximately 25 sr over the Tropics and reached about 40 sr over the Arctic, with higher values in its Canadian and Russian parts (Young et al. [54], their Figure 7). However, a stable L R 532 of 33 ± 5 sr has been derived over the 50 S–50 N ocean zone for semi-transparent cirrus (Josset et al. [55], using CALIOP–CloudSat observations).
As cirrus layers suspected of horizontal crystal orientation were screened out (Section 2.3), an attempt will be made to interpret the lower LPDR values compared to lower latitudes. Low LPDR values similar to Ny-Ålesund have been observed over Antarctica, Dumont d’Urville [56] and Sondakyla, north Finland [57]. The L P D R 532 was quite constant (13–23%, Figure 7 from Del Guasta [57]) as attributed to small and possibly columnar ice crystals, after excluding the presence of horizontal crystals and super-cooled droplets. Sassen and Zhu [58] investigated the geographical distribution of linear volume depolarization ratio at 532 nm in ice clouds (using off-nadir CALIOP observations). Although the present findings cannot be quantitatively compared to Sassen and Zhu [58], the latitudinal depolarization changes are worth mentioning. Sassen and Zhu [58] highlighted a depolarization decrease towards the high latitudes of both hemispheres, attributing the differences to possible changes in the ice nucleation mechanisms. Over the high latitudes, ice clouds occur at lower heights and, thus, the availability and properties of aerosol that serve as ice nucleating particles may differ [58].
Cirrus layers were carefully distinguished from aerosol layers in the upper troposphere— lower stratosphere region. Noteworthy are the Siberian fires’ smoke layers of summer 2019. These layers were observed from 7–8 km up to 17–18 km between August 2019 and May 2020 over Ny-Ålesund as well as the central Arctic [59]. Thus, they partly overlapped with the cirrus occurrence altitude range. However, the optical properties of the smoke layers were different to those expected for cirrus clouds. The smoke layers consisted of nearly-spherical particles (LPDR lower than 4% both at 355 and 532 nm) that were in general more absorbing (LR355 = 55 sr and LR532 = 85 sr) than ice particles [59].

5. Conclusions

In this work, the long-term properties of cirrus clouds were analyzed for the first time over an Arctic site (Ny-Ålesund, Svalbard), using lidar and radiosonde observations from 2011 to 2020. The inter-relations of properties were examined together with their dependence on meteorological conditions. The main findings can be summarized as follows:
  • In winter and spring cirrus layers were geometrically-thicker, they occurred more frequently and their C b a s e appeared lower compared to the rest of the year (Figure 2). The tropopause thermodynamic structure seemed to control the seasonality of cirrus C t o p altitude.
  • Cirrus clouds were generally associated with colder and calmer wind conditions compared to the 2011–2020 climatology. Their majority was associated with westerly flow and westerly cirrus tended to be geometrically-thicker.
  • The lidar ratio ( L R ) in the ultraviolet spectral region (33 ± 9 sr) was in good agreement with a sub-Arctic study [27], while the L R in the visible region (42 ± 10 sr) was higher compared to lower latitudes. In winter, optically-thicker cirrus of lower LR were observed compared to the rest of the year (Figure 6 and Table A3). In summer and autumn the linear particle depolarization ratio (LPDR) was higher, indicating less spherical ice particles (Figure 6c). Overall, more spherical particles were inferred compared to lower latitudes.
  • Overall, the LPDR and color ratio (CR) were found to be proportional (Figure 7a), reflecting a tendency of bigger ice particles being more spherical. Increased deposition of water vapor had most likely occurred on the surface of bigger particles, rendering their shape more spherical. Conversely, the cloud optical depth (COD) tended to be lower for less spherical and smaller ice particles (Figure 8) most likely due to reduced deposition of water vapor on the particle surface. The aforementioned relations were also investigated on a seasonal basis but no clear difference was found (Figure A1). These relations need to be investigated with respect to ice particle shape, aerosol load, air mass origin, cirrus formation mechanism, relative humidity over ice, vertical wind speed, and other parameters in order to gain a better understanding of the underlying physical processes. Such processes need to be investigated in the context of future case studies.
  • The overall dependency of cirrus optical properties on temperature and wind speed was not pronounced (Figure 10 and Figure 11). However, the properties of winter-time cirrus were distinctive, accompanied by colder conditions and stronger winds (Table A2).
Over the 10 years of the analysis, the cirrus properties have not exhibited any clear temporal trend. Micro-pulse lidar measurements might be more suitable for detecting trends of cirrus occurrence and properties as they are conducted on a continuous basis. The lidar-derived cirrus properties can be compared to those from the cloud radar, which is installed at AWIPEV. More specifically, the geometrical boundary discrepancies between lidar and radar can be examined as well as discrepancies in the extinction coefficient.
This work aimed at providing a first-time overview of cirrus geometrical and optical properties over a site in the European part of the Arctic. However, there is still a need for more Arctic cirrus investigations, which can be based on satellite observations from CALIOP aboard CALIPSO or the upcoming ATLID aboard EarthCare [60]. Furthermore, similar studies to ours from other sites, in the American and Russian part of the Arctic, are necessary in order to assess possible intra-Arctic differences in cirrus properties.

Author Contributions

Conceptualization, C.R. and I.S.S.; data curation, K.N.; formal analysis, K.N.; funding acquisition, C.R. and I.S.S.; investigation, K.N.; methodology, K.N., C.R. and I.S.S.; resources, C.R.; software, K.N.; supervision, C.R. and I.S.S.; validation, I.S.S.; visualization, K.N.; writing—original draft, K.N.; writing—review & editing, K.N., C.R. and I.S.S. All authors have read and agreed to the published version of the manuscript.

Funding

This work was funded by the Deutsche Forschungsgemeinschaft (DFG, German Research Foundation)–Project-ID 268020496–TRR 172.

Data Availability Statement

The dataset related to this publication has been submitted to the PANGEA data repository and is expected to appear online soon.

Acknowledgments

This work was partly performed during the research stay of K. Nakoudi in the Faculty of Physics, University of Warsaw, funded by the Helmholtz Graduate School for Polar and Marine Research (POLMAR). We acknowledge the support of KARL by Wilfried Ruhe and Ingo Beninga at Impres GmbH. We gratefully acknowledge the funding by the Deutsche Forschungsgemeinschaft (DFG, German Research Foundation)—Project Number 268020496—TRR 172, within the Transregional Collaborative Research Center—ArctiC Amplification: Climate Relevant Atmospheric and SurfaCe Processes, and Feedback Mechanisms ( A C ) 3 .

Conflicts of Interest

The authors declare no conflict of interest.

Appendix A. Seasonal Cirrus Properties

Figure A1. Inter-relation of cirrus optical properties on a seasonal basis. Cirrus layer LPDR-CR (a), cirrus layer COD-LPDR (b) and cirrus layer COD-LPDR (c).
Remotesensing 13 04555 g0a1
The geometrical, optical, and meteorological cirrus properties over Ny-Ålesund are summarized in the following tables. The total along with the seasonal properties are given as median ± standard deviation unless stated otherwise.
Table A1. Total and seasonal descriptive statistics of cirrus layer geometrical properties, including both COD regimes.
TotalWinterSpringSummerAutumn
GT (km)2 ± 1.22.1 ± 1.42.1 ± 1.11.7 ± 0.91.4 ± 0.9
C b a s e (km)7.1 ± 1.27.1 ± 16.7 ± 1.28.2 ± 0.78 ± 1.3
C t o p (km)9.5 ± 1.39.3 ± 1.69.4 ± 1.19.8 ± 0.69.2 ± 1
Table A2. Total and seasonal descriptive statistics of cirrus layer meteorological properties, including both COD regimes.
TotalWinterSpringSummerAutumn
Median temperature ( C) 57  ± 6 61  ± 5 56  ± 5 44  ± 4 53  ± 3
Temperature at C b a s e ( C) 48  ± 6 51  ± 7 47  ± 5 38  ± 3 48  ± 4
Temperature at C t o p ( C) 65  ± 7 66  ± 6 66  ± 6 49  ± 5 57  ± 3
Median wind speed ( ms 1 )12 ± 623 ± 510 ± 49 ± 14 ± 9
Wind speed at C b a s e ( ms 1 )9 ± 618 ± 68 ± 49 ± 15 ± 8
Wind speed at C t o p ( ms 1 )14 ± 728 ± 613 ± 49 ± 110 ± 9
Median wind direction ( )238 ± 85243 ± 87242 ± 7757 ± 88108 ± 216
Median wind sectorW/SWW/SWW/SWE/NEE/SE
Table A3. Total and seasonal descriptive statistics of cirrus layer optical properties for the high COD regime.
TotalWinterSpringSummerAutumn
C O D 355 0.1 ± 0.260.16 ± 0.390.09 ± 0.130.08 ± 0.070.1 ± 0.17
Mean C O D 355 0.170.30.110.110.16
L R 355 (sr)33 ± 931 ± 733 ± 937 ± 1141 ± 9
L R 532 (sr)42 ± 1038 ± 943 ± 1042 ± 1343 ± 8
L P D R 355 (%)15 ± 513 ± 514 ± 317 ± 622 ± 4
C R 1.4 ± 0.21.3 ± 0.21.5 ± 0.21.3 ± 0.21.4 ± 0.1

References

  1. Serreze, M.C.; Barry, R.G. Processes and impacts of Arctic amplification: A research synthesis. Glob. Planet. Chang. 2011, 77, 85–96. [Google Scholar] [CrossRef]
  2. Wendisch, M.; Macke, A.; Ehrlich, A.; Lüpkes, C.; Mech, M.; Chechin, D.; Dethloff, K.; Velasco, C.B.; Bozem, H.; Brückner, M.; et al. The Arctic cloud puzzle: Using ACLOUD/PASCAL multiplatform observations to unravel the role of clouds and aerosol particles in Arctic amplification. Bull. Am. Meteorol. Soc. 2019, 100, 841–871. [Google Scholar] [CrossRef]
  3. Huang, Y.; Dong, X.; Bailey, D.A.; Holland, M.M.; Xi, B.; DuVivier, A.K.; Kay, J.E.; Landrum, L.L.; Deng, Y. Thicker clouds and accelerated Arctic sea ice decline: The atmosphere-sea ice interactions in spring. Geophys. Res. Lett. 2019, 46, 6980–6989. [Google Scholar] [CrossRef] [Green Version]
  4. Hong, Y.; Liu, G.; Li, J.L. Assessing the radiative effects of global ice clouds based on CloudSat and CALIPSO measurements. J. Clim. 2016, 29, 7651–7674. [Google Scholar] [CrossRef]
  5. Lolli, S.; Campbell, J.R.; Lewis, J.R.; Gu, Y.; Marquis, J.W.; Chew, B.N.; Liew, S.C.; Salinas, S.V.; Welton, E.J. Daytime top-of-the-atmosphere cirrus cloud radiative forcing properties at Singapore. J. Appl. Meteorol. Climatol. 2017, 56, 1249–1257. [Google Scholar] [CrossRef] [Green Version]
  6. Kienast-Sjögren, E.; Rolf, C.; Seifert, P.; Krieger, U.K.; Luo, B.P.; Krämer, M.; Peter, T. Climatological and radiative properties of midlatitude cirrus clouds derived by automatic evaluation of lidar measurements. Atmos. Chem. Phys. 2016, 16, 7605–7621. [Google Scholar] [CrossRef] [Green Version]
  7. Kraemer, M.; Rolf, C.; Luebke, A.; Afchine, A.; Spelten, N.; Costa, A.; Meyer, J.; Zoeger, M.; Smith, J.; Herman, R.L.; et al. A microphysics guide to cirrus clouds—Part 1: Cirrus types. Atmos. Chem. Phys. 2016, 16, 3463–3483. [Google Scholar] [CrossRef] [Green Version]
  8. Heymsfield, A.J.; Krämer, M.; Luebke, A.; Brown, P.; Cziczo, D.J.; Franklin, C.; Lawson, P.; Lohmann, U.; McFarquhar, G.; Ulanowski, Z.; et al. Cirrus clouds. Meteorol. Monogr. 2017, 58, 2.1–2.26. [Google Scholar] [CrossRef] [Green Version]
  9. Gultepe, I.; Starr, D.O. Dynamical structure and turbulence in cirrus clouds: Aircraft observations during FIRE. J. Atmos. Sci. 1995, 52, 4159–4182. [Google Scholar] [CrossRef] [Green Version]
  10. Ebell, K.; Nomokonova, T.; Maturilli, M.; Ritter, C. Radiative effect of clouds at Ny-Ålesund, Svalbard, as inferred from ground-based remote sensing observations. J. Appl. Meteorol. Climatol. 2020, 59, 3–22. [Google Scholar] [CrossRef] [Green Version]
  11. Dahlke, S.; Maturilli, M. Contribution of atmospheric advection to the amplified winter warming in the Arctic North Atlantic region. Adv. Meteorol. 2017, 2017, 4928620. [Google Scholar] [CrossRef] [Green Version]
  12. Holz, R.E.; Platnick, S.; Meyer, K.; Vaughan, M.; Heidinger, A.; Yang, P.; Wind, G.; Dutcher, S.; Ackerman, S.; Amarasinghe, N.; et al. Resolving ice cloud optical thickness biases between CALIOP and MODIS using infrared retrievals. Atmos. Chem. Phys. 2016, 16, 5075–5090. [Google Scholar] [CrossRef] [Green Version]
  13. Marquis, J.W.; Bogdanoff, A.S.; Campbell, J.R.; Cummings, J.A.; Westphal, D.L.; Smith, N.J.; Zhang, J. Estimating infrared radiometric satellite sea surface temperature retrieval cold biases in the tropics due to unscreened optically thin cirrus clouds. J. Atmos. Ocean. Technol. 2017, 34, 355–373. [Google Scholar] [CrossRef]
  14. Campbell, J.R.; Dolinar, E.K.; Lolli, S.; Fochesatto, G.J.; Gu, Y.; Lewis, J.R.; Marquis, J.W.; McHardy, T.M.; Ryglicki, D.R.; Welton, E.J. Cirrus cloud top-of-the-atmosphere net daytime forcing in the Alaskan subarctic from ground-based MPLNET monitoring. J. Appl. Meteorol. Climatol. 2021, 60, 51–63. [Google Scholar] [CrossRef]
  15. Sassen, K.; Cho, B.S. Subvisual-thin cirrus lidar dataset for satellite verification and climatological research. J. Appl. Meteorol. 1992, 31, 1275–1285. [Google Scholar] [CrossRef] [Green Version]
  16. Shupe, M.D. Clouds at Arctic atmospheric observatories. Part II: Thermodynamic phase characteristics. J. Appl. Meteorol. Climatol. 2011, 50, 645–661. [Google Scholar] [CrossRef]
  17. Nomokonova, T.; Ebell, K.; Löhnert, U.; Maturilli, M.; Ritter, C.; O’Connor, E. Statistics on clouds and their relation to thermodynamic conditions at Ny-Ålesund using ground-based sensor synergy. Atmo. Chem. Phys. 2019, 19, 4105–4126. [Google Scholar] [CrossRef] [Green Version]
  18. Winker, D.M.; Vaughan, M.A.; Omar, A.; Hu, Y.; Powell, K.A.; Liu, Z.; Hunt, W.H.; Young, S.A. Overview of the CALIPSO Mission and CALIOP Data Processing Algorithms. J. Atmos. Ocean. Technol. 2009, 26, 2310–2323. [Google Scholar] [CrossRef]
  19. Devasthale, A.; Tjernstrã-M, M.; Karlsson, K.G.R.; Thomas, M.A.; Jones, C.; Sedlar, J.; Omar, A.H. The vertical distribution of thin features over the Arctic analysed from CALIPSO observations. Tellus Ser. B Chem. Phys. Meteorol. B 2011, 63, 77–85. [Google Scholar] [CrossRef] [Green Version]
  20. Nakoudi, K.; Stachlewska, I.S.; Ritter, C. An extended lidar-based cirrus cloud retrieval scheme: First application over an Arctic site. Opt. Express 2021, 29, 8553–8580. [Google Scholar] [CrossRef]
  21. Hoffmann, A. Comparative Aerosol Studies Based on Multi-Wavelength Raman LIDAR at Ny-Ålesund, Spitsbergen. Ph.D Thesis, Universität Potsdam, Potsdam, Germany, 2011. [Google Scholar]
  22. Campbell, J.; Vaughan, M.; Oo, M.; Holz, R.; Lewis, J.; Welton, E. Distinguishing cirrus cloud presence in autonomous lidar measurements. Atmos. Meas. Tech. 2015, 8, 435–449. [Google Scholar] [CrossRef] [Green Version]
  23. Maturilli, M. High resolution radiosonde measurements from station Ny-Ålesund (2017-04 et seq). PANGAEA 2020. [Google Scholar] [CrossRef]
  24. Massoli, P.; Maturilli, M.; Neuber, R. Climatology of Arctic polar stratospheric clouds as measured by lidar in Ny-Ålesund, Spitsbergen (79° N, 12° E). J. Geophys. Res. Atmos. 2006, 111. [Google Scholar] [CrossRef] [Green Version]
  25. Gamage, N.; Hagelberg, C. Detection and analysis of microfronts and associated coherent events using localized transforms. J. Atmos. Sci. 1993, 50, 750–756. [Google Scholar] [CrossRef] [Green Version]
  26. Nakoudi, K.; Giannakaki, E.; Dandou, A.; Tombrou, M.; Komppula, M. Planetary boundary layer height by means of lidar and numerical simulations over New Delhi, India. Atmos. Meas. Tech. 2019, 12, 2595–2610. [Google Scholar] [CrossRef] [Green Version]
  27. Voudouri, K.A.; Giannakaki, E.; Komppula, M.; Balis, D. Variability in cirrus cloud properties using a PollyXT Raman lidar over high and tropical latitudes. Atmos. Chem. Phys. 2020, 20, 4427–4444. [Google Scholar] [CrossRef] [Green Version]
  28. Klett, J.D. Stable analytical inversion solution for processing lidar returns. Appl. Opt. 1981, 20, 211–220. [Google Scholar] [CrossRef] [Green Version]
  29. Fernald, F.G. Analysis of atmospheric lidar observations: Some comments. Appl. Opt. 1984, 23, 652–653. [Google Scholar] [CrossRef]
  30. Ansmann, A.; Wandinger, U.; Riebesell, M.; Weitkamp, C.; Michaelis, W. Independent measurement of extinction and backscatter profiles in cirrus clouds by using a combined Raman elastic-backscatter lidar. Appl. Opt. 1992, 31, 7113–7131. [Google Scholar] [CrossRef]
  31. Nakoudi, K.; Ritter, C. AWI Cirrus Cloud Retrieval Scheme (v1.0.0); Zenodo: Geneve, Switzerland, 2020. [Google Scholar] [CrossRef]
  32. Borovoi, A.; Balin, Y.; Kokhanenko, G.; Penner, I.; Konoshonkin, A.; Kustova, N. Layers of quasi-horizontally oriented ice crystals in cirrus clouds observed by a two-wavelength polarization lidar. Opt. Express 2014, 22, 24566–24573. [Google Scholar] [CrossRef]
  33. Okamoto, H.; Sato, K.; Borovoi, A.; Ishimoto, H.; Masuda, K.; Konoshonkin, A.; Kustova, N. Wavelength dependence of ice cloud backscatter properties for space-borne polarization lidar applications. Opt. Express 2020, 28, 29178–29191. [Google Scholar] [CrossRef]
  34. Maturilli, M.; Herber, A.; König-Langlo, G. Surface radiation climatology for Ny-Ålesund, Svalbard (78.9 N), basic observations for trend detection. Theor. Appl. Climatol. 2015, 120, 331–339. [Google Scholar] [CrossRef] [Green Version]
  35. Eloranta, E. Practical model for the calculation of multiply scattered lidar returns. Appl. Opt. 1998, 37, 2464–2472. [Google Scholar] [CrossRef]
  36. Jocher, G.; Schulz, A.; Ritter, C.; Neuber, R.; Dethloff, K.; Foken, T. The sensible heat flux in the course of the year at Ny-Ålesund, svalbard: Characteristics of eddy covariance data and corresponding model results. Adv. Meteorol. 2015, 2015, 852108. [Google Scholar] [CrossRef]
  37. Rader, F.; Traversi, R.; Severi, M.; Becagli, S.; Müller, K.J.; Nakoudi, K.; Ritter, C. Overview of Aerosol Properties in the European Arctic in Spring 2019 Based on In Situ Measurements and Lidar Data. Atmosphere 2021, 12, 271. [Google Scholar] [CrossRef]
  38. Maturilli, M.; Kayser, M. Arctic warming, moisture increase and circulation changes observed in the Ny-Ålesund homogenized radiosonde record. Theor. Appl. Climatol. 2017, 130, 1–17. [Google Scholar] [CrossRef] [Green Version]
  39. Walczowski, W.; Piechura, J. Influence of the West Spitsbergen Current on the local climate. Int. J. Climatol. 2011, 31, 1088–1093. [Google Scholar] [CrossRef]
  40. Gjelten, H.M.; Nordli, Ø.; Isaksen, K.; Førland, E.J.; Sviashchennikov, P.N.; Wyszynski, P.; Prokhorova, U.V.; Przybylak, R.; Ivanov, B.V.; Urazgildeeva, A.V. Air temperature variations and gradients along the coast and fjords of western Spitsbergen. Polar Res. 2016, 35, 29878. [Google Scholar] [CrossRef]
  41. Yeo, H.; Park, S.J.; Kim, B.M.; Shiobara, M.; Kim, S.W.; Kwon, H.; Kim, J.H.; Jeong, J.H.; Park, S.S.; Choi, T. The observed relationship of cloud to surface longwave radiation and air temperature at Ny-Ålesund, Svalbard. Tellus B Chem. Phys. Meteorol. 2018, 70, 1–10. [Google Scholar] [CrossRef] [Green Version]
  42. Nazaryan, H.; McCormick, M.P.; Menzel, W.P. Global characterization of cirrus clouds using CALIPSO data. J. Geophys. Res. Atmos. 2008, 113. [Google Scholar] [CrossRef]
  43. Sassen, K.; Campbell, J.R. A midlatitude cirrus cloud climatology from the Facility for Atmospheric Remote Sensing. Part I: Macrophysical and synoptic properties. J. Atmos. Sci. 2001, 58, 481–496. [Google Scholar] [CrossRef]
  44. Wang, W.; Yi, F.; Liu, F.; Zhang, Y.; Yu, C.; Yin, Z. Characteristics and Seasonal Variations of Cirrus Clouds from Polarization Lidar Observations at a 30° N Plain Site. Remote Sens. 2020, 12, 3998. [Google Scholar] [CrossRef]
  45. Gierens, R.; Kneifel, S.; Shupe, M.D.; Ebell, K.; Maturilli, M.; Löhnert, U. Low-level mixed-phase clouds in a complex Arctic environment. Atmos. Chem. Phys. 2020, 20, 3459–3481. [Google Scholar] [CrossRef] [Green Version]
  46. Urbanek, B.; Groß, S.; Wirth, M.; Rolf, C.; Krämer, M.; Voigt, C. High depolarization ratios of naturally occurring cirrus clouds near air traffic regions over Europe. Geophys. Res. Lett. 2018, 45, 13–166. [Google Scholar] [CrossRef] [Green Version]
  47. Sassen, K.; Comstock, J.M. A Midlatitude Cirrus Cloud Climatology from the Facility for Atmospheric Remote Sensing. Part III: Radiative Properties. J. Atmos. Sci. 2001, 58, 2113–2127. [Google Scholar] [CrossRef]
  48. Wang, Z.; Sassen, K. Cirrus Cloud Microphysical Property Retrieval Using Lidar and Radar Measurements. Part II: Midlatitude Cirrus Microphysical and Radiative Properties. J. Atmos. Sci. 2002, 59, 2291–2302. [Google Scholar] [CrossRef]
  49. Sunilkumar, S.V.; Parameswaran, K. Temperature dependence of tropical cirrus properties and radiative effects. J. Geophys. Res. Atmos. 2005, 110. [Google Scholar] [CrossRef]
  50. Gouveia, D.A.; Barja, B.; Barbosa, H.M.; Seifert, P.; Baars, H.; Pauliquevis, T.; Artaxo, P. Optical and geometrical properties of cirrus clouds in Amazonia derived from 1 year of ground-based lidar measurements. Atmos. Chem. Phys. 2017, 17, 3619–3636. [Google Scholar] [CrossRef] [Green Version]
  51. Corti, T.; Peter, T. A simple model for cloud radiative forcing. Atmos. Chem. Phys. 2009, 9, 5751–5758. [Google Scholar] [CrossRef] [Green Version]
  52. Pandit, A.K.; Gadhavi, H.; Venkat Ratnam, M.; Raghunath, K.; Rao, S.; Jayaraman, A. Long-term trend analysis and climatology of tropical cirrus clouds using 16 years of lidar data set over Southern India. Atmos. Chem. Phys. 2015, 15, 13833–13848. [Google Scholar] [CrossRef] [Green Version]
  53. Krämer, M.; Rolf, C.; Spelten, N.; Afchine, A.; Fahey, D.; Jensen, E.; Khaykin, S.; Kuhn, T.; Lawson, P.; Lykov, A.; et al. A microphysics guide to cirrus—Part 2: Climatologies of clouds and humidity from observations. Atmos. Chem. Phys. 2020, 20, 12569–12608. [Google Scholar] [CrossRef]
  54. Young, S.A.; Vaughan, M.A.; Garnier, A.; Tackett, J.L.; Lambeth, J.D.; Powell, K.A. Extinction and optical depth retrievals for CALIPSO’s Version 4 data release. Atmos. Meas. Tech. 2018, 11, 5701–5727. [Google Scholar] [CrossRef] [Green Version]
  55. Josset, D.; Pelon, J.; Garnier, A.; Hu, Y.; Vaughan, M.; Zhai, P.W.; Kuehn, R.; Lucker, P. Cirrus optical depth and lidar ratio retrieval from combined CALIPSO-CloudSat observations using ocean surface echo. J. Geophys. Res. Atmos. 2012, 117. [Google Scholar] [CrossRef] [Green Version]
  56. Del Guasta, M.; Morandi, M.; Stefanutti, L.; Brechet, J.; Piquad, J. One year of cloud lidar data from Dumont d’Urville (Antarctica): 1. General overview of geometrical and optical properties. J. Geophys. Res. Atmos. 1993, 98, 18575–18587. [Google Scholar] [CrossRef]
  57. Del Guasta, M. Simulation of LIDAR returns from pristine and deformed hexagonal ice prisms in cold cirrus by means of “face tracing”. J. Geophys. Res. Atmos. 2001, 106, 12589–12602. [Google Scholar] [CrossRef] [Green Version]
  58. Sassen, K.; Zhu, J. A global survey of CALIPSO linear depolarization ratios in ice clouds: Initial findings. J. Geophys. Res. Atmos. 2009, 114. [Google Scholar] [CrossRef]
  59. Ohneiser, K.; Ansmann, A.; Chudnovsky, A.; Engelmann, R.; Ritter, C.; Veselovskii, I.; Baars, H.; Gebauer, H.; Griesche, H.; Radenz, M.; et al. The unexpected smoke layer in the High Arctic winter stratosphere during MOSAiC 2019–2020. Atmos. Chem. Phys. 2021, 21, 15783–15808. [Google Scholar] [CrossRef]
  60. Illingworth, A.J.; Barker, H.; Beljaars, A.; Ceccaldi, M.; Chepfer, H.; Clerbaux, N.; Cole, J.; Delanoë, J.; Domenech, C.; Donovan, D.P.; et al. The EarthCARE satellite: The next step forward in global measurements of clouds, aerosols, precipitation, and radiation. Bull. Am. Meteorol. Soc. 2015, 96, 1311–1332. [Google Scholar] [CrossRef] [Green Version]
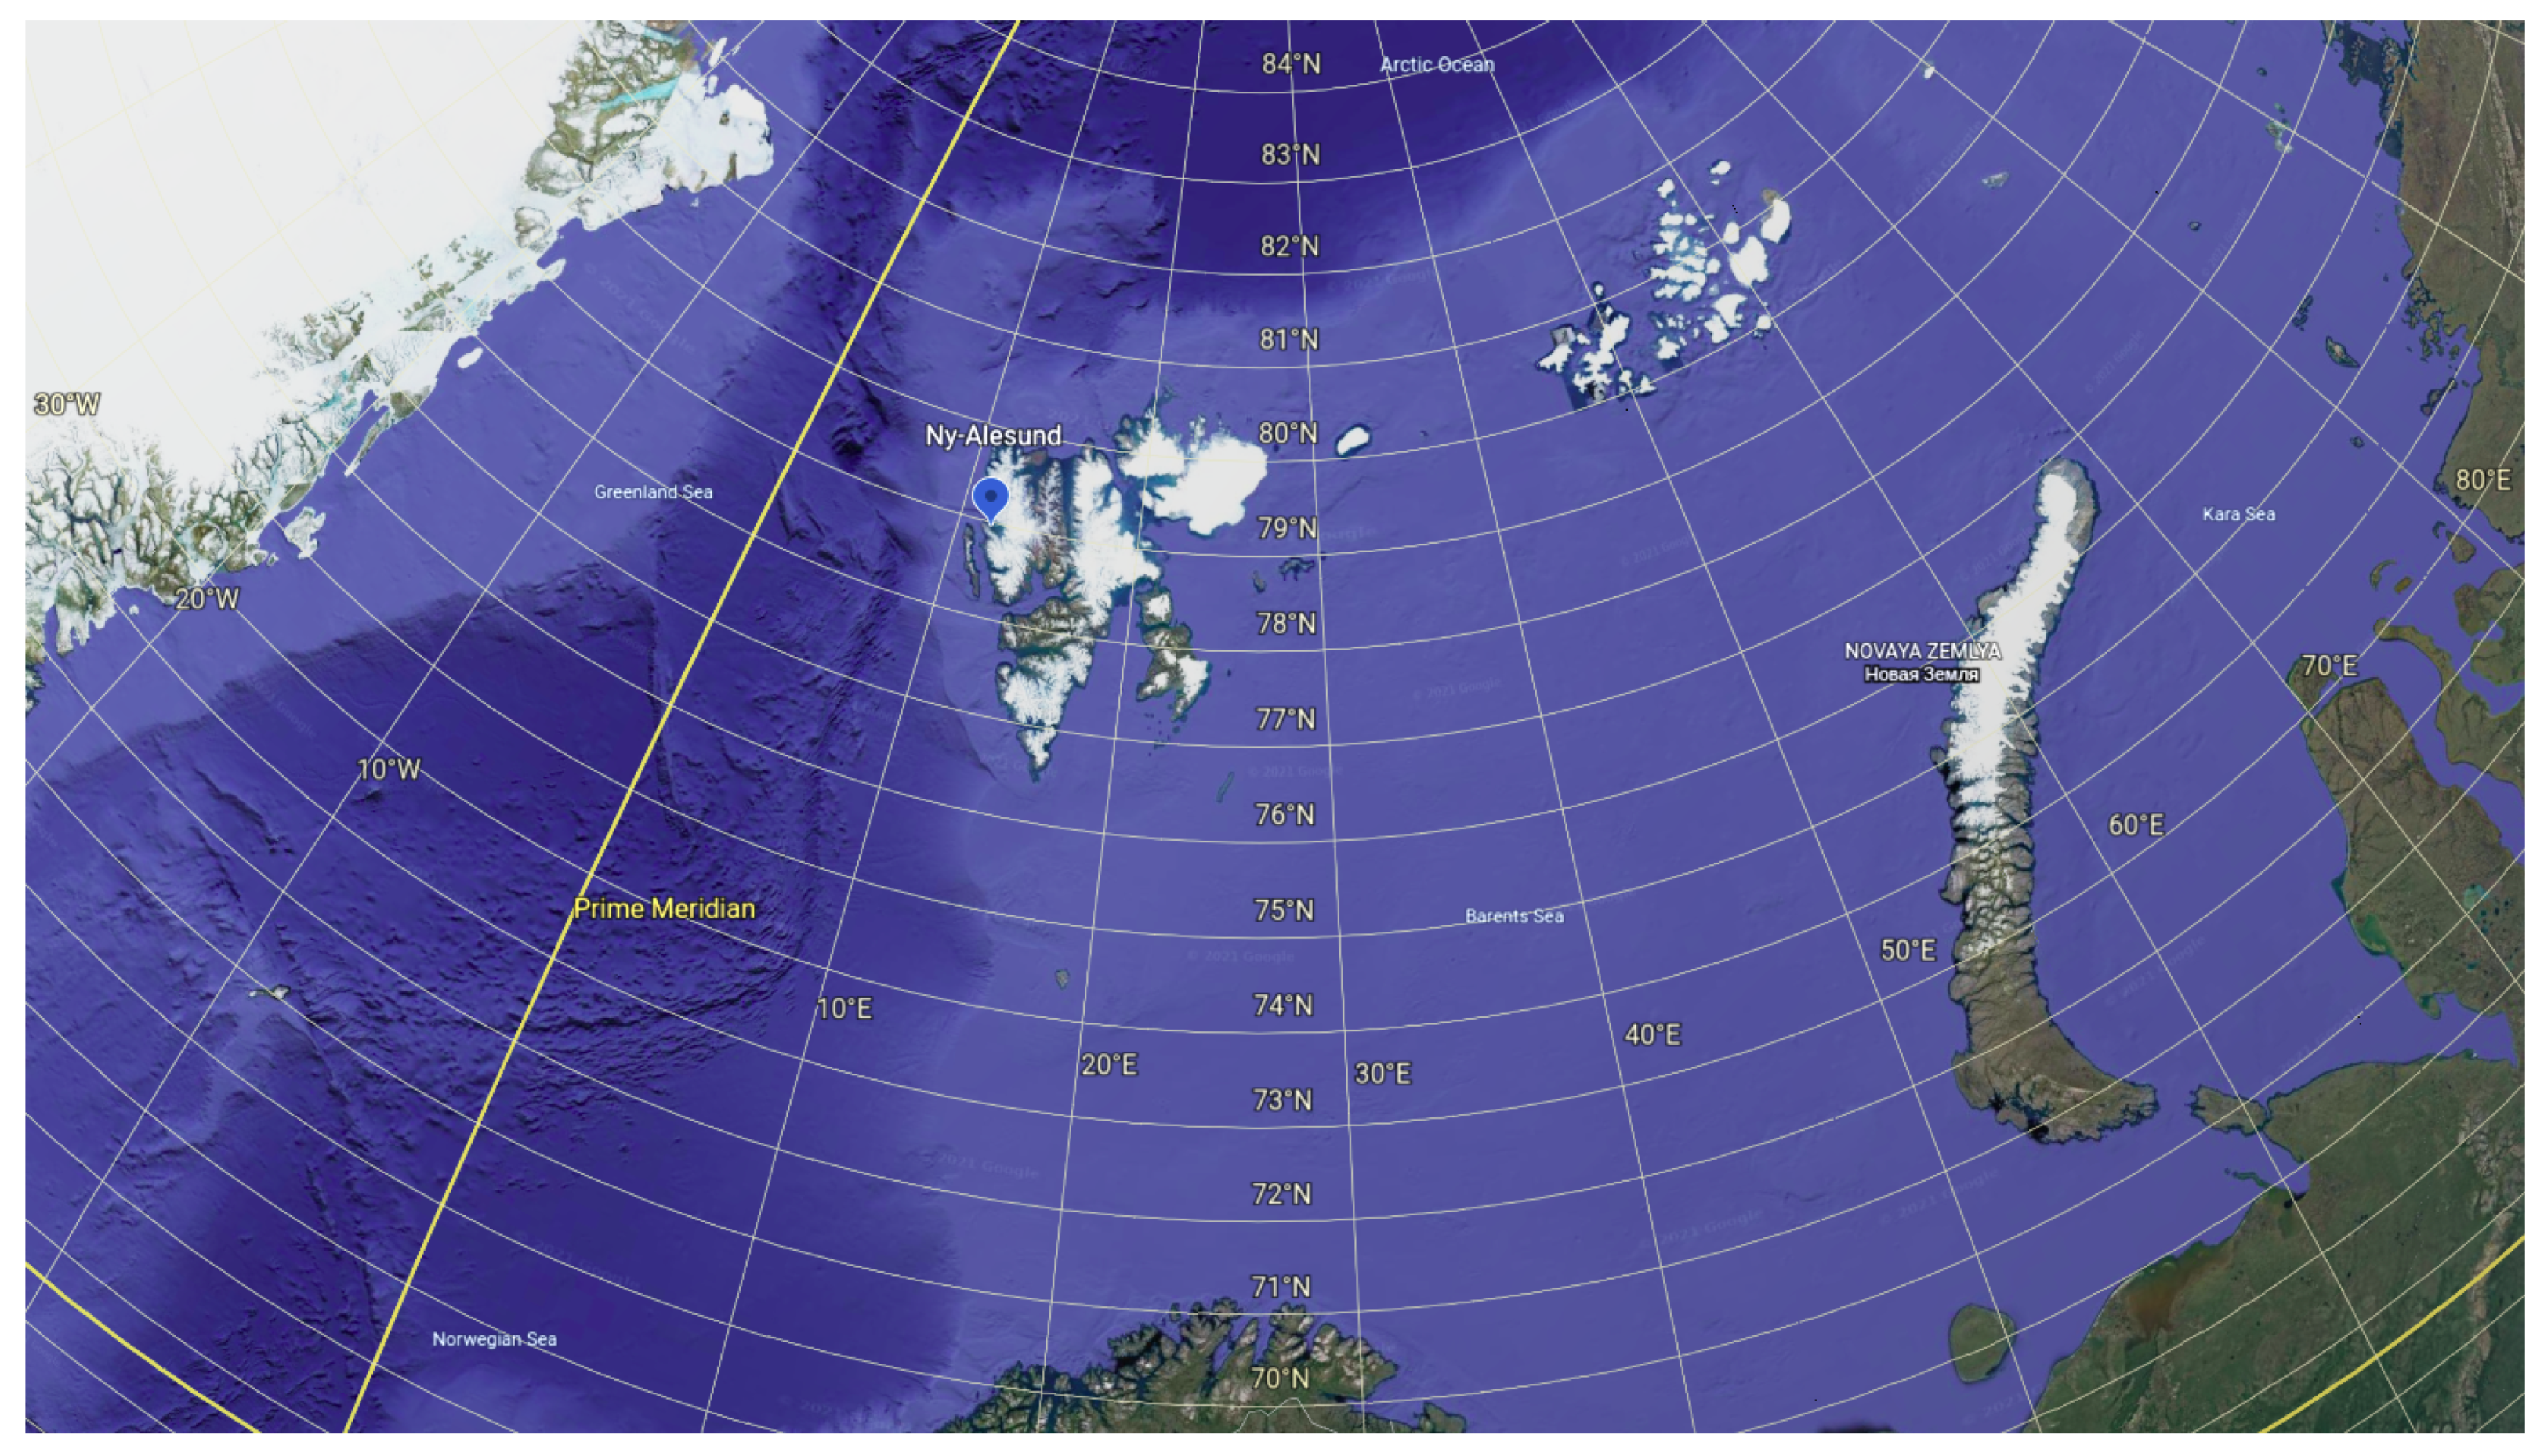
Figure 1. Map of the European Arctic. The site of Ny- Ålesund, which is located on the west coast of the Spitsbergen island, Svalbard archipelago, is indicated on the map. The map was produced with Google Earth.
Remotesensing 13 04555 g001
Figure 2. Cirrus monthly occurrence frequency (9 min–7.5 m) cirrus observations normalized to KARL observation hours). The numbers on top denote the detected cirrus layers and the cirrus occurrence frequency. The C b a s e , effective C m i d and C t o p are overlaid (median and standard deviation).
Remotesensing 13 04555 g002
Figure 3. Relative frequency of occurrence (FOC) distribution of geometrical thickness (GT, (a)), C b a s e (b) and C t o p (c). The median ± std (number of observations) is given in the legend.
Remotesensing 13 04555 g003
Figure 4. Relative FOC distribution of climatological meteorological conditions (gray) and conditions in the presence of cirrus (cyan). Temperature (ad) and wind speed (eh) within the monthly cirrus envelope (as given in Figure 2) are presented per wind sector, without any temporal restriction between the radiosonde and lidar measurements.
Remotesensing 13 04555 g004
Figure 5. Absolute occurrence distribution of temperature (a), wind speed (b) and wind direction (c) within the cirrus layer altitude range, presented as layer median, at the C b a s e and at the C t o p . The median ± standard deviation is given in the legend. Only observations satisfying the 2 h temporal criterion are considered.
Remotesensing 13 04555 g005
Figure 6. FOC distribution of MSC L R (a,b), LPDR (c) and CR (d). The median ± std (number of observations) is given in the legend. Only quality assured observations are considered.
Remotesensing 13 04555 g006
Figure 7. LPDR versus CR (a) and LR versus LPDR (b). The median ± standard deviation of LPDR (LR) in 0.2 CR (5% LPDR) classes is also given. The linear regression curve on the median values is overlaid only if the coefficient of determination ( R 2 ) exceeded 0.5.
Remotesensing 13 04555 g007
Figure 8. COD versus LPDR (a) and CR (b). The median ± standard deviation of COD in 5% LPDR and 0.2 CR classes is also given. The linear regression curve on the median values is overlaid only if the coefficient of determination ( R 2 ) exceeded 0.5.
Remotesensing 13 04555 g008
Figure 9. Cirrus layer GT versus layer median temperature (a), wind speed (b) and wind direction (c). Overlaid is the median ± standard deviation of GT per temperature (5 C), wind speed (5 ms 1 ) and wind direction classes. Observations corresponding to both COD regimes are shown. Only observations satisfying the 2 h temporal criterion are considered.
Remotesensing 13 04555 g009
Figure 10. Cirrus layer optical properties versus median temperature. Overlaid are the median ± standard deviation optical properties per temperature (5 C classes). Only observations satisfying the 2 h temporal criterion are considered.
Remotesensing 13 04555 g010
Figure 11. Same as Figure 10, except for dependence on wind speed (5 ms 1 classes). Only observations satisfying the 2 h temporal criterion are considered.
Remotesensing 13 04555 g011
Publisher’s Note: MDPI stays neutral with regard to jurisdictional claims in published maps and institutional affiliations.