
North to South Variations in the Suspended Sediment Transport Budget within Large Siberian River Deltas Revealed by Remote Sensing Data


Abstract
1. Introduction
2. Materials and Methods
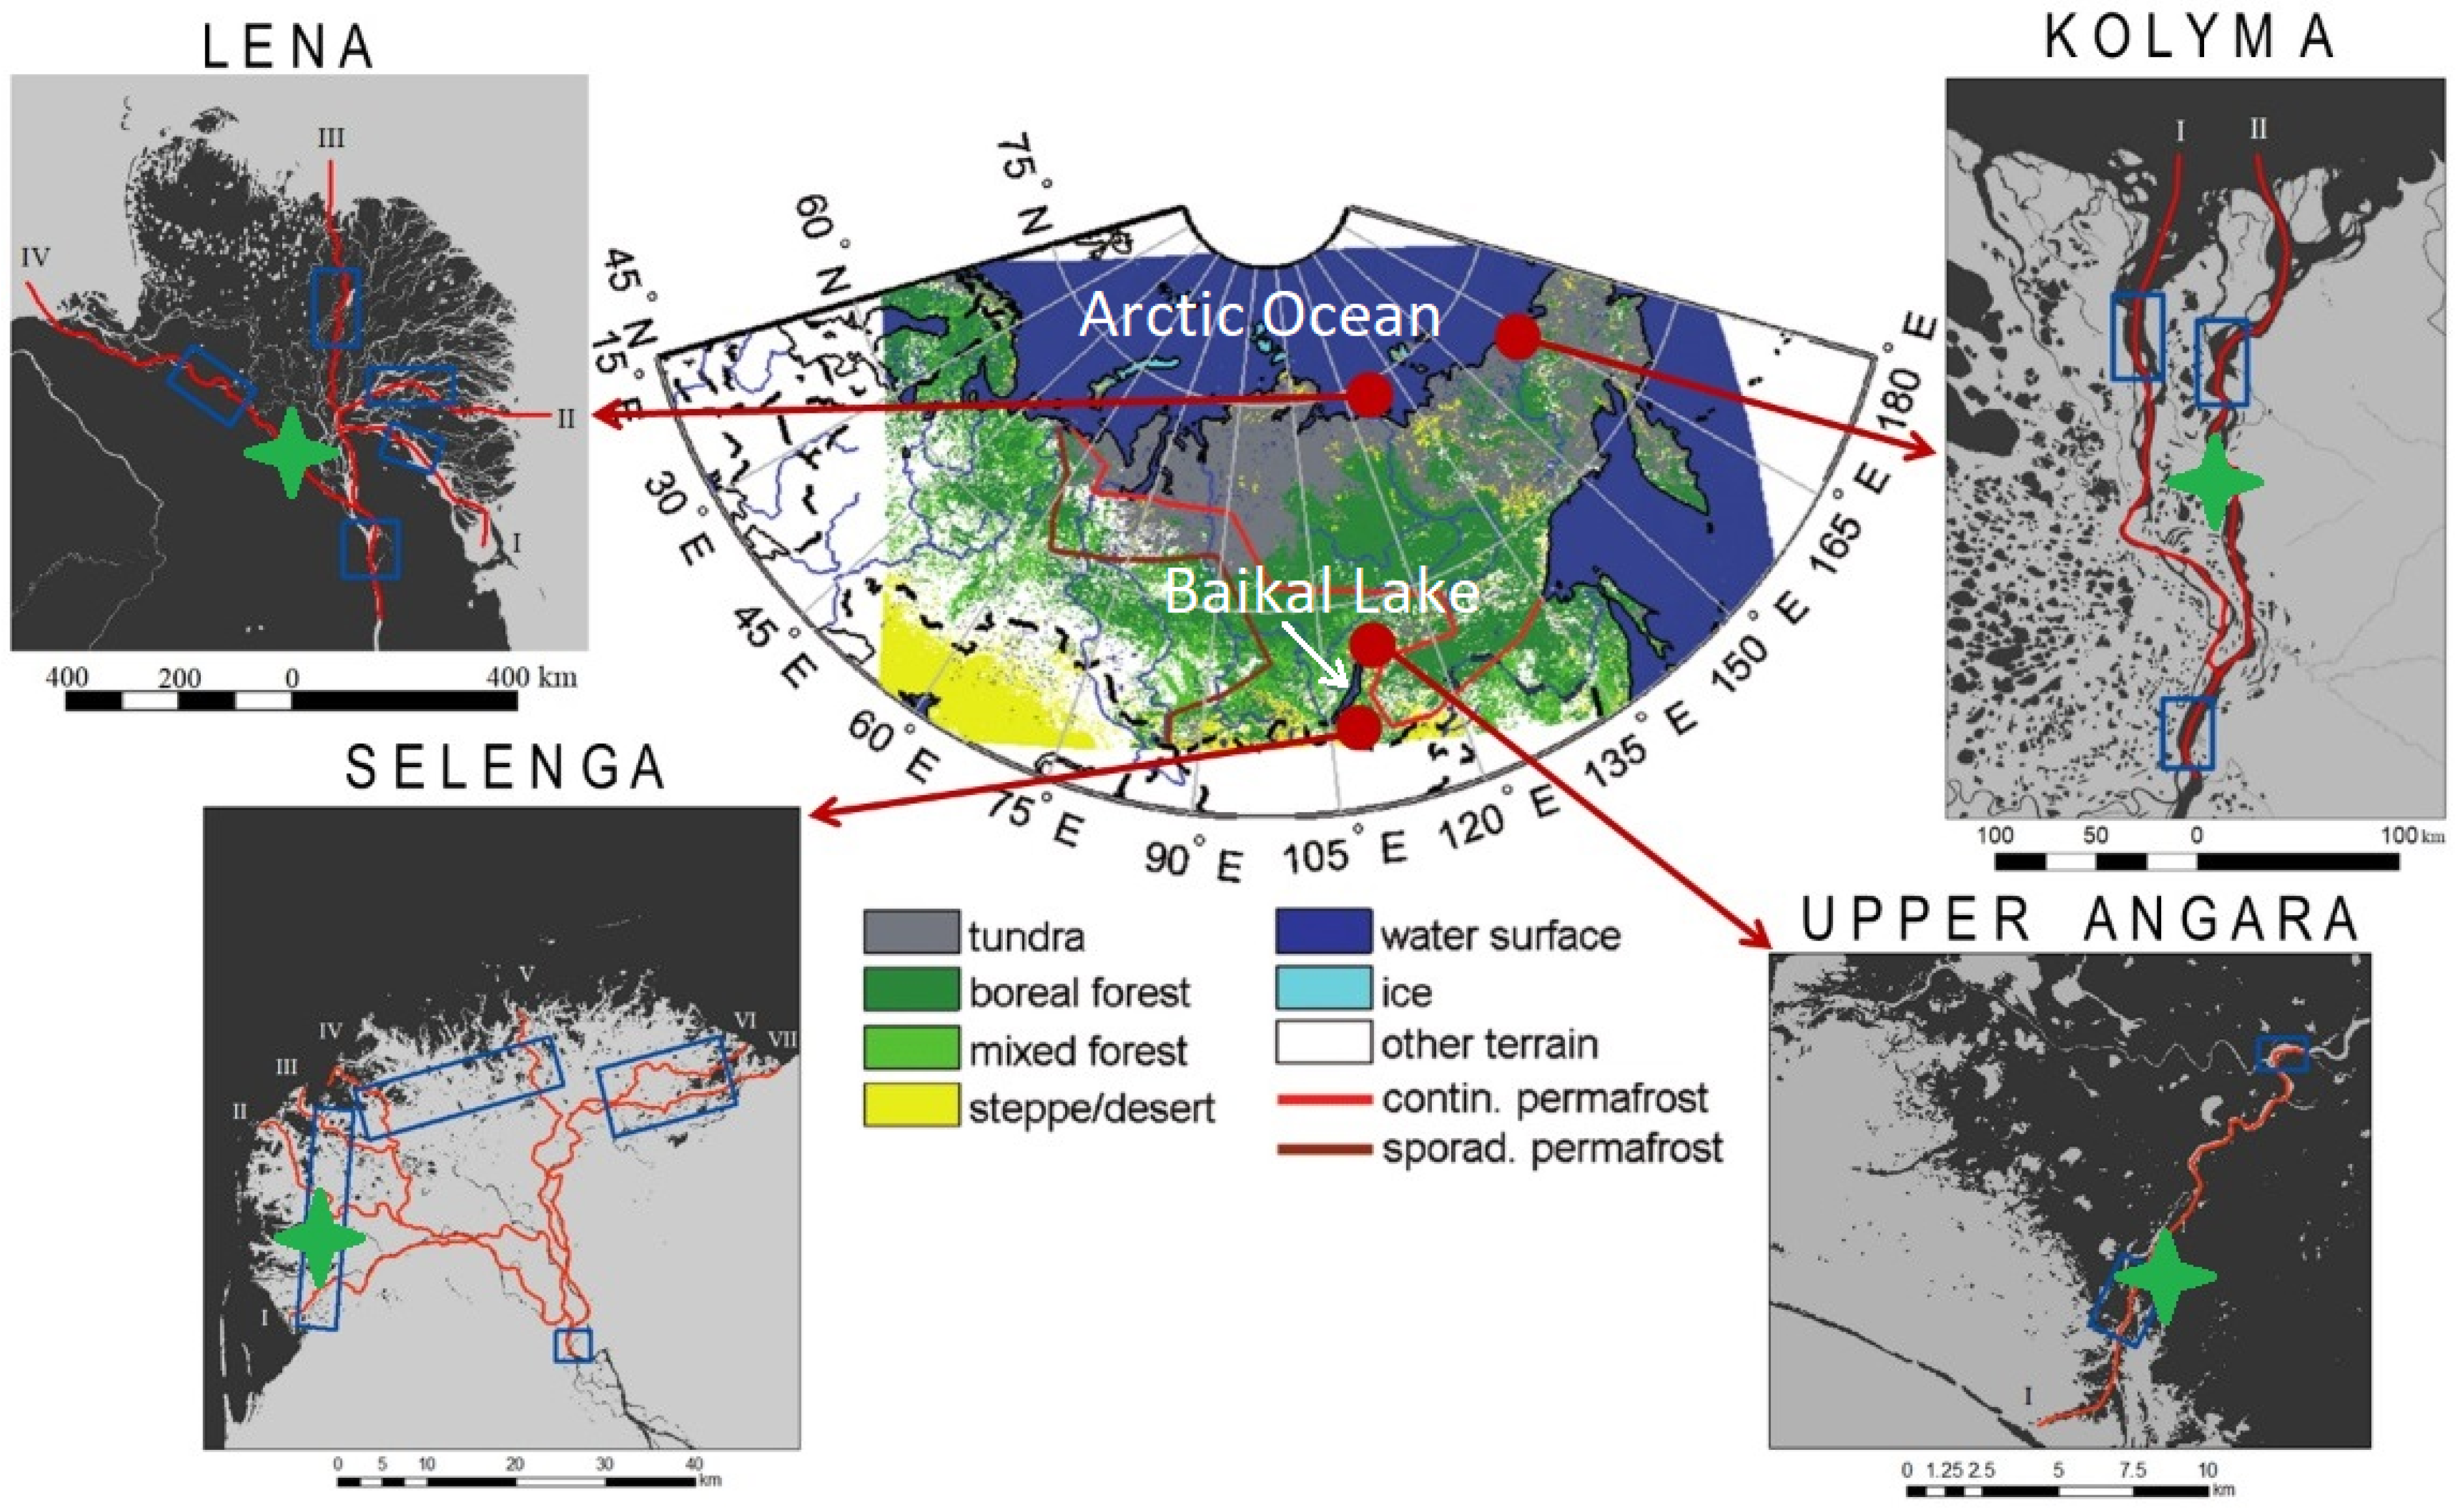
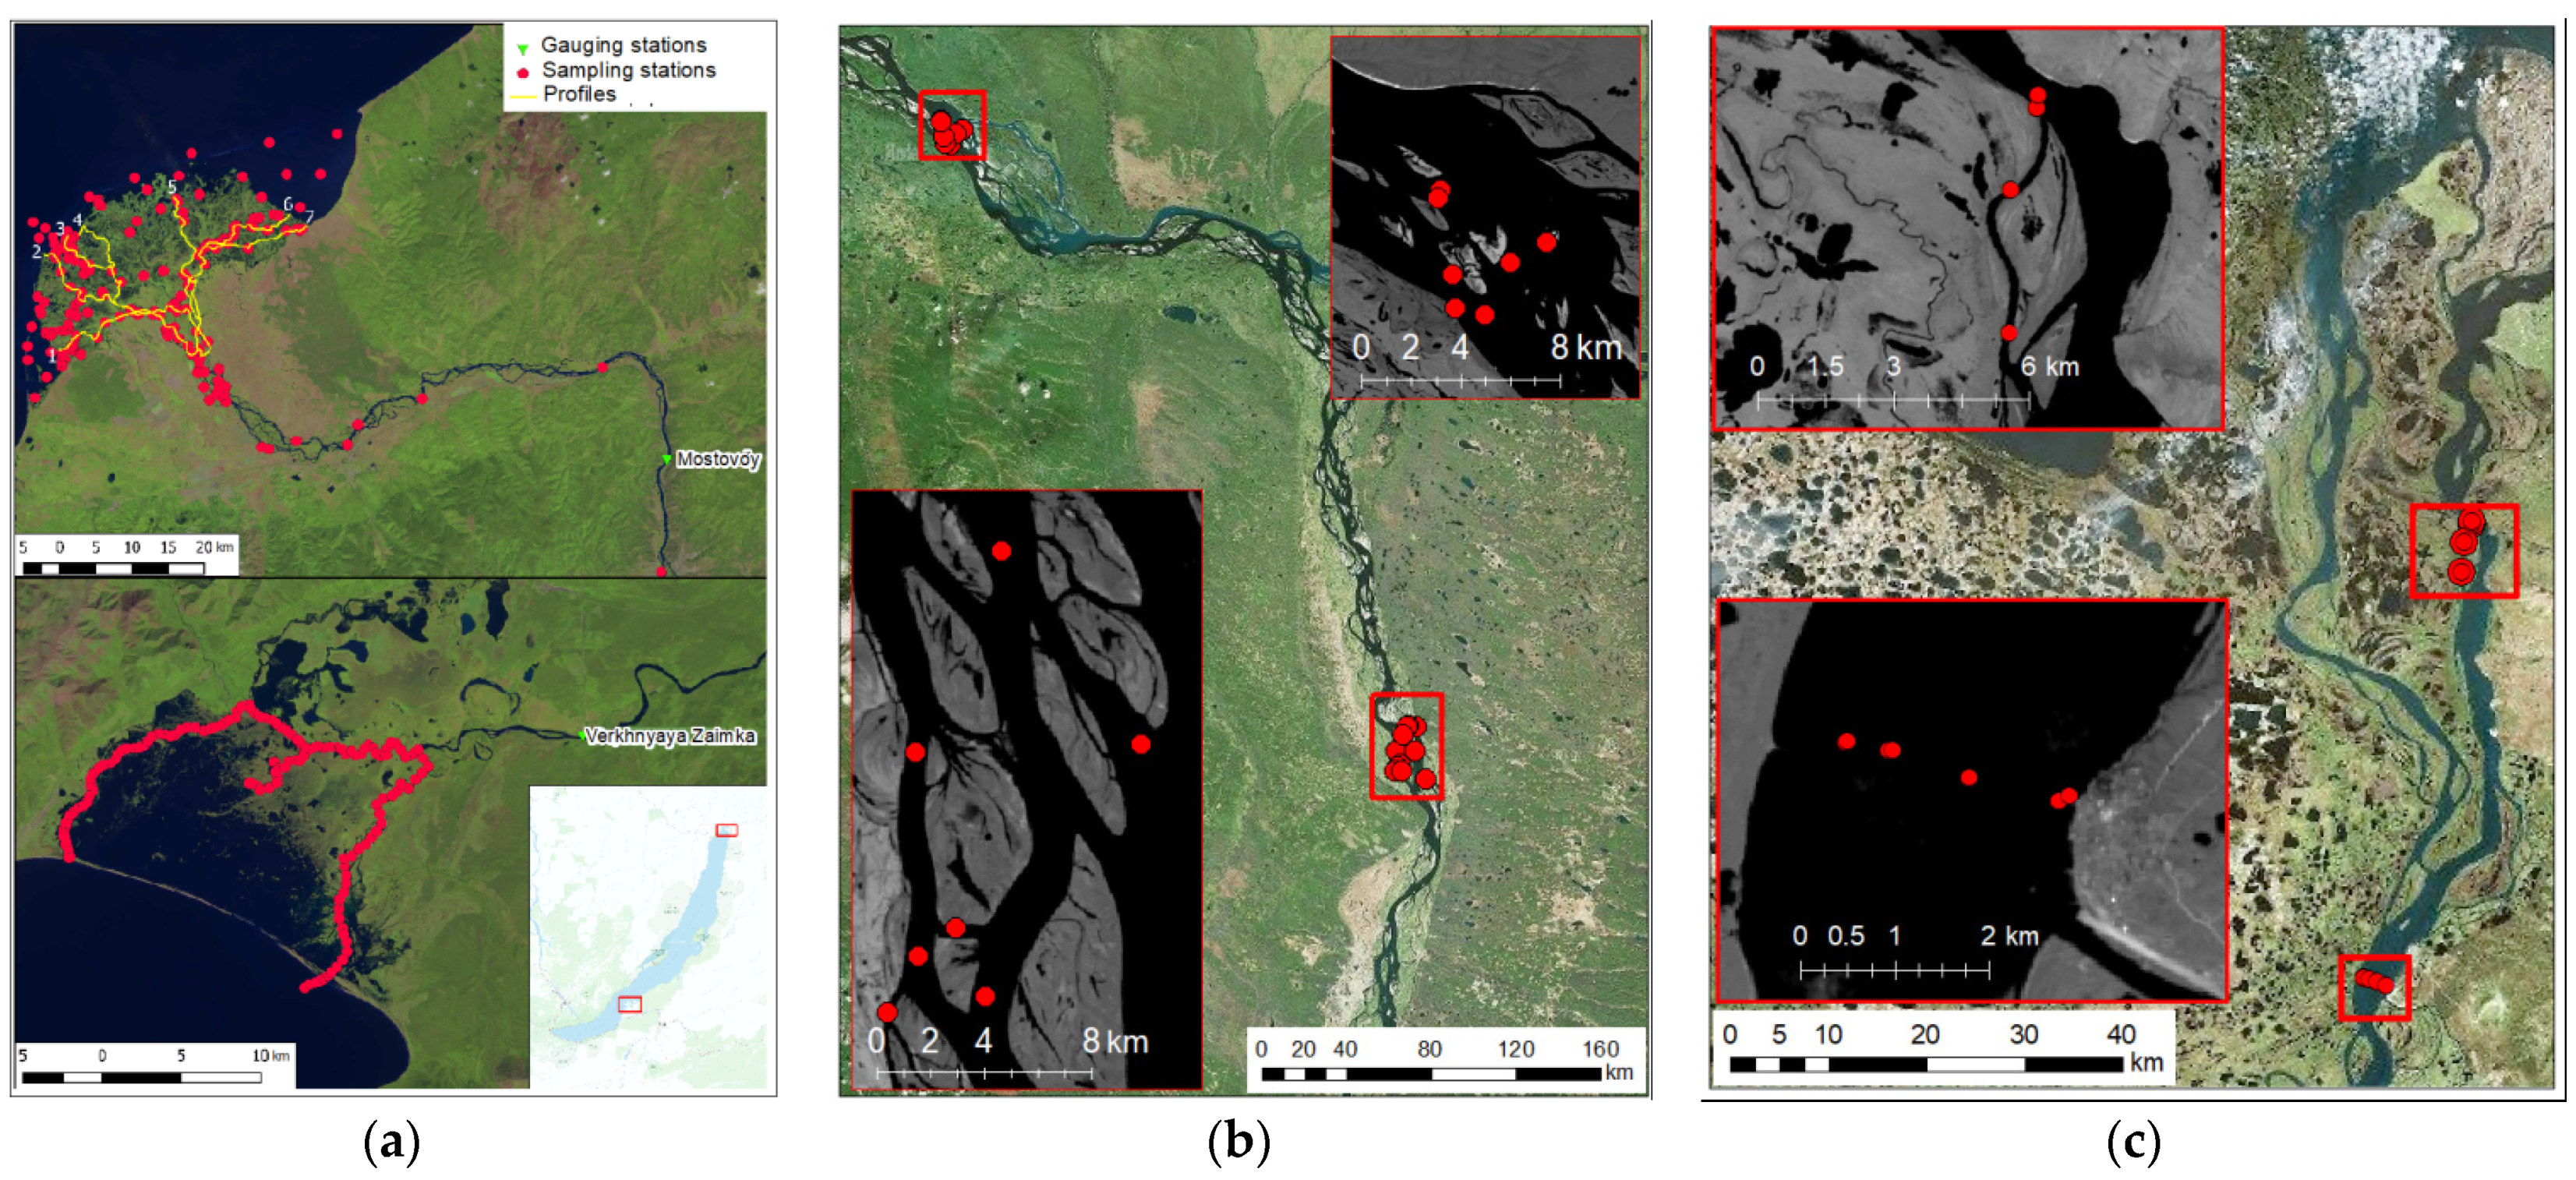
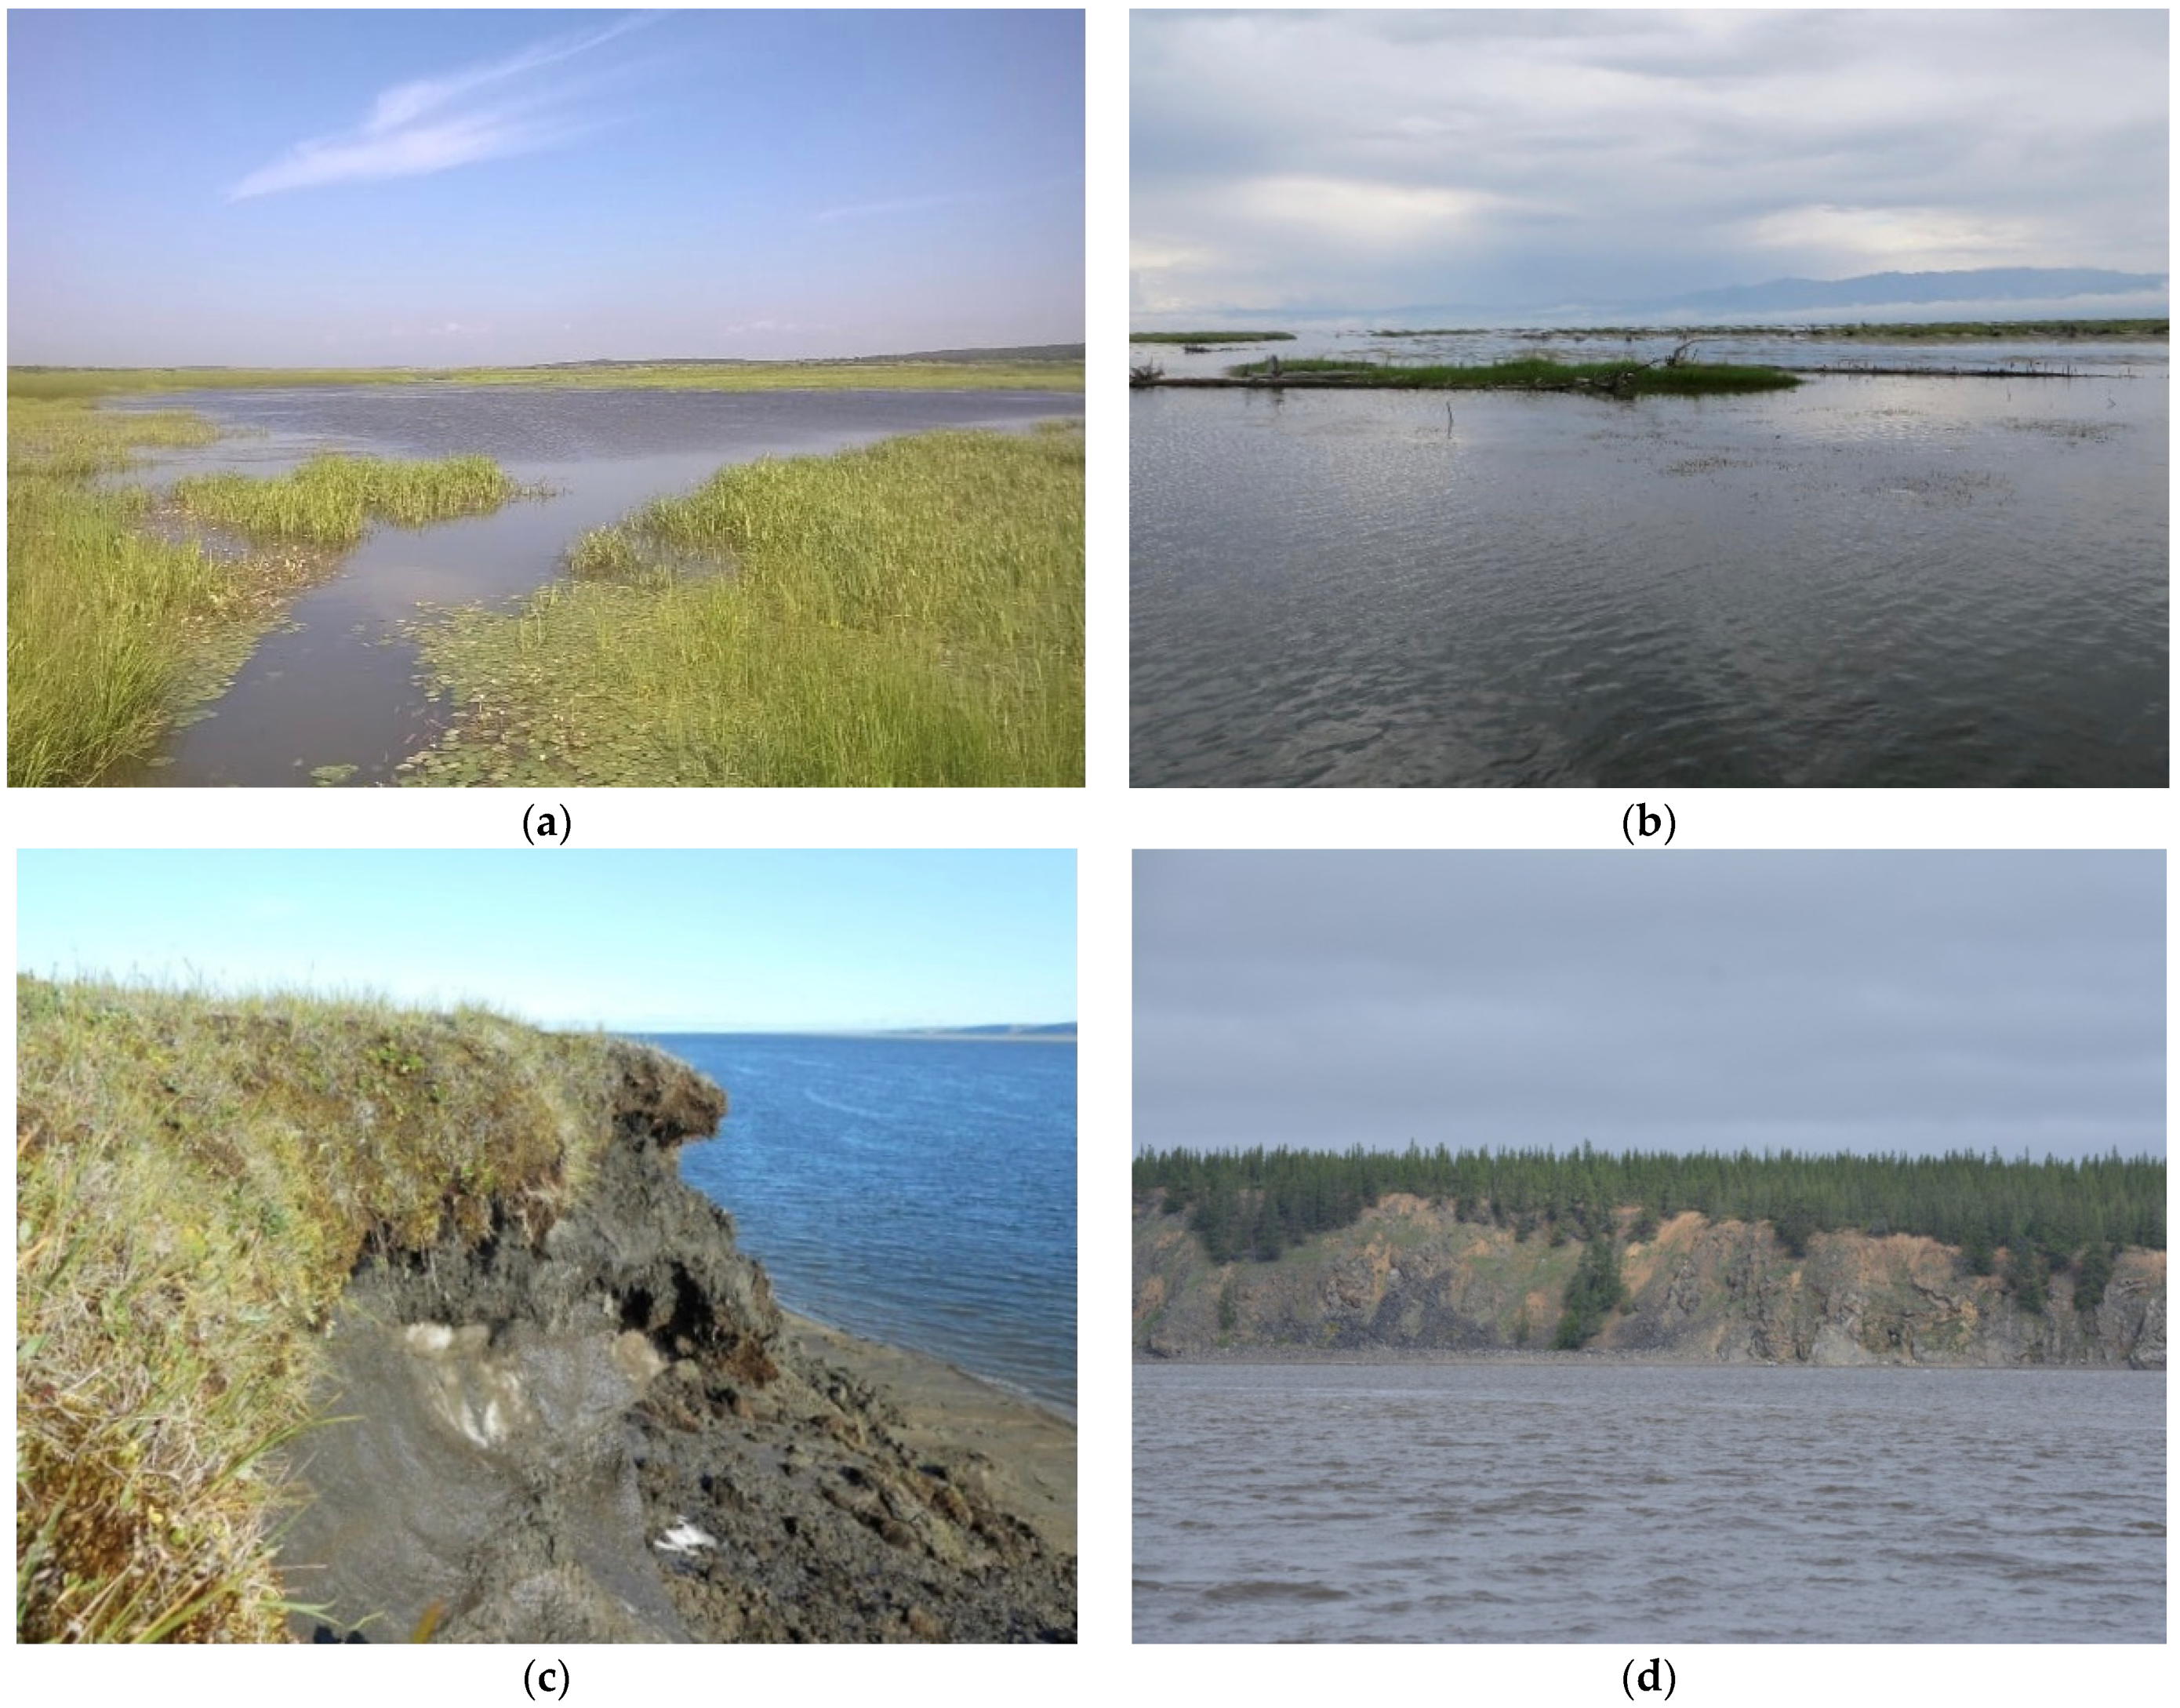
2.1. The Study Area
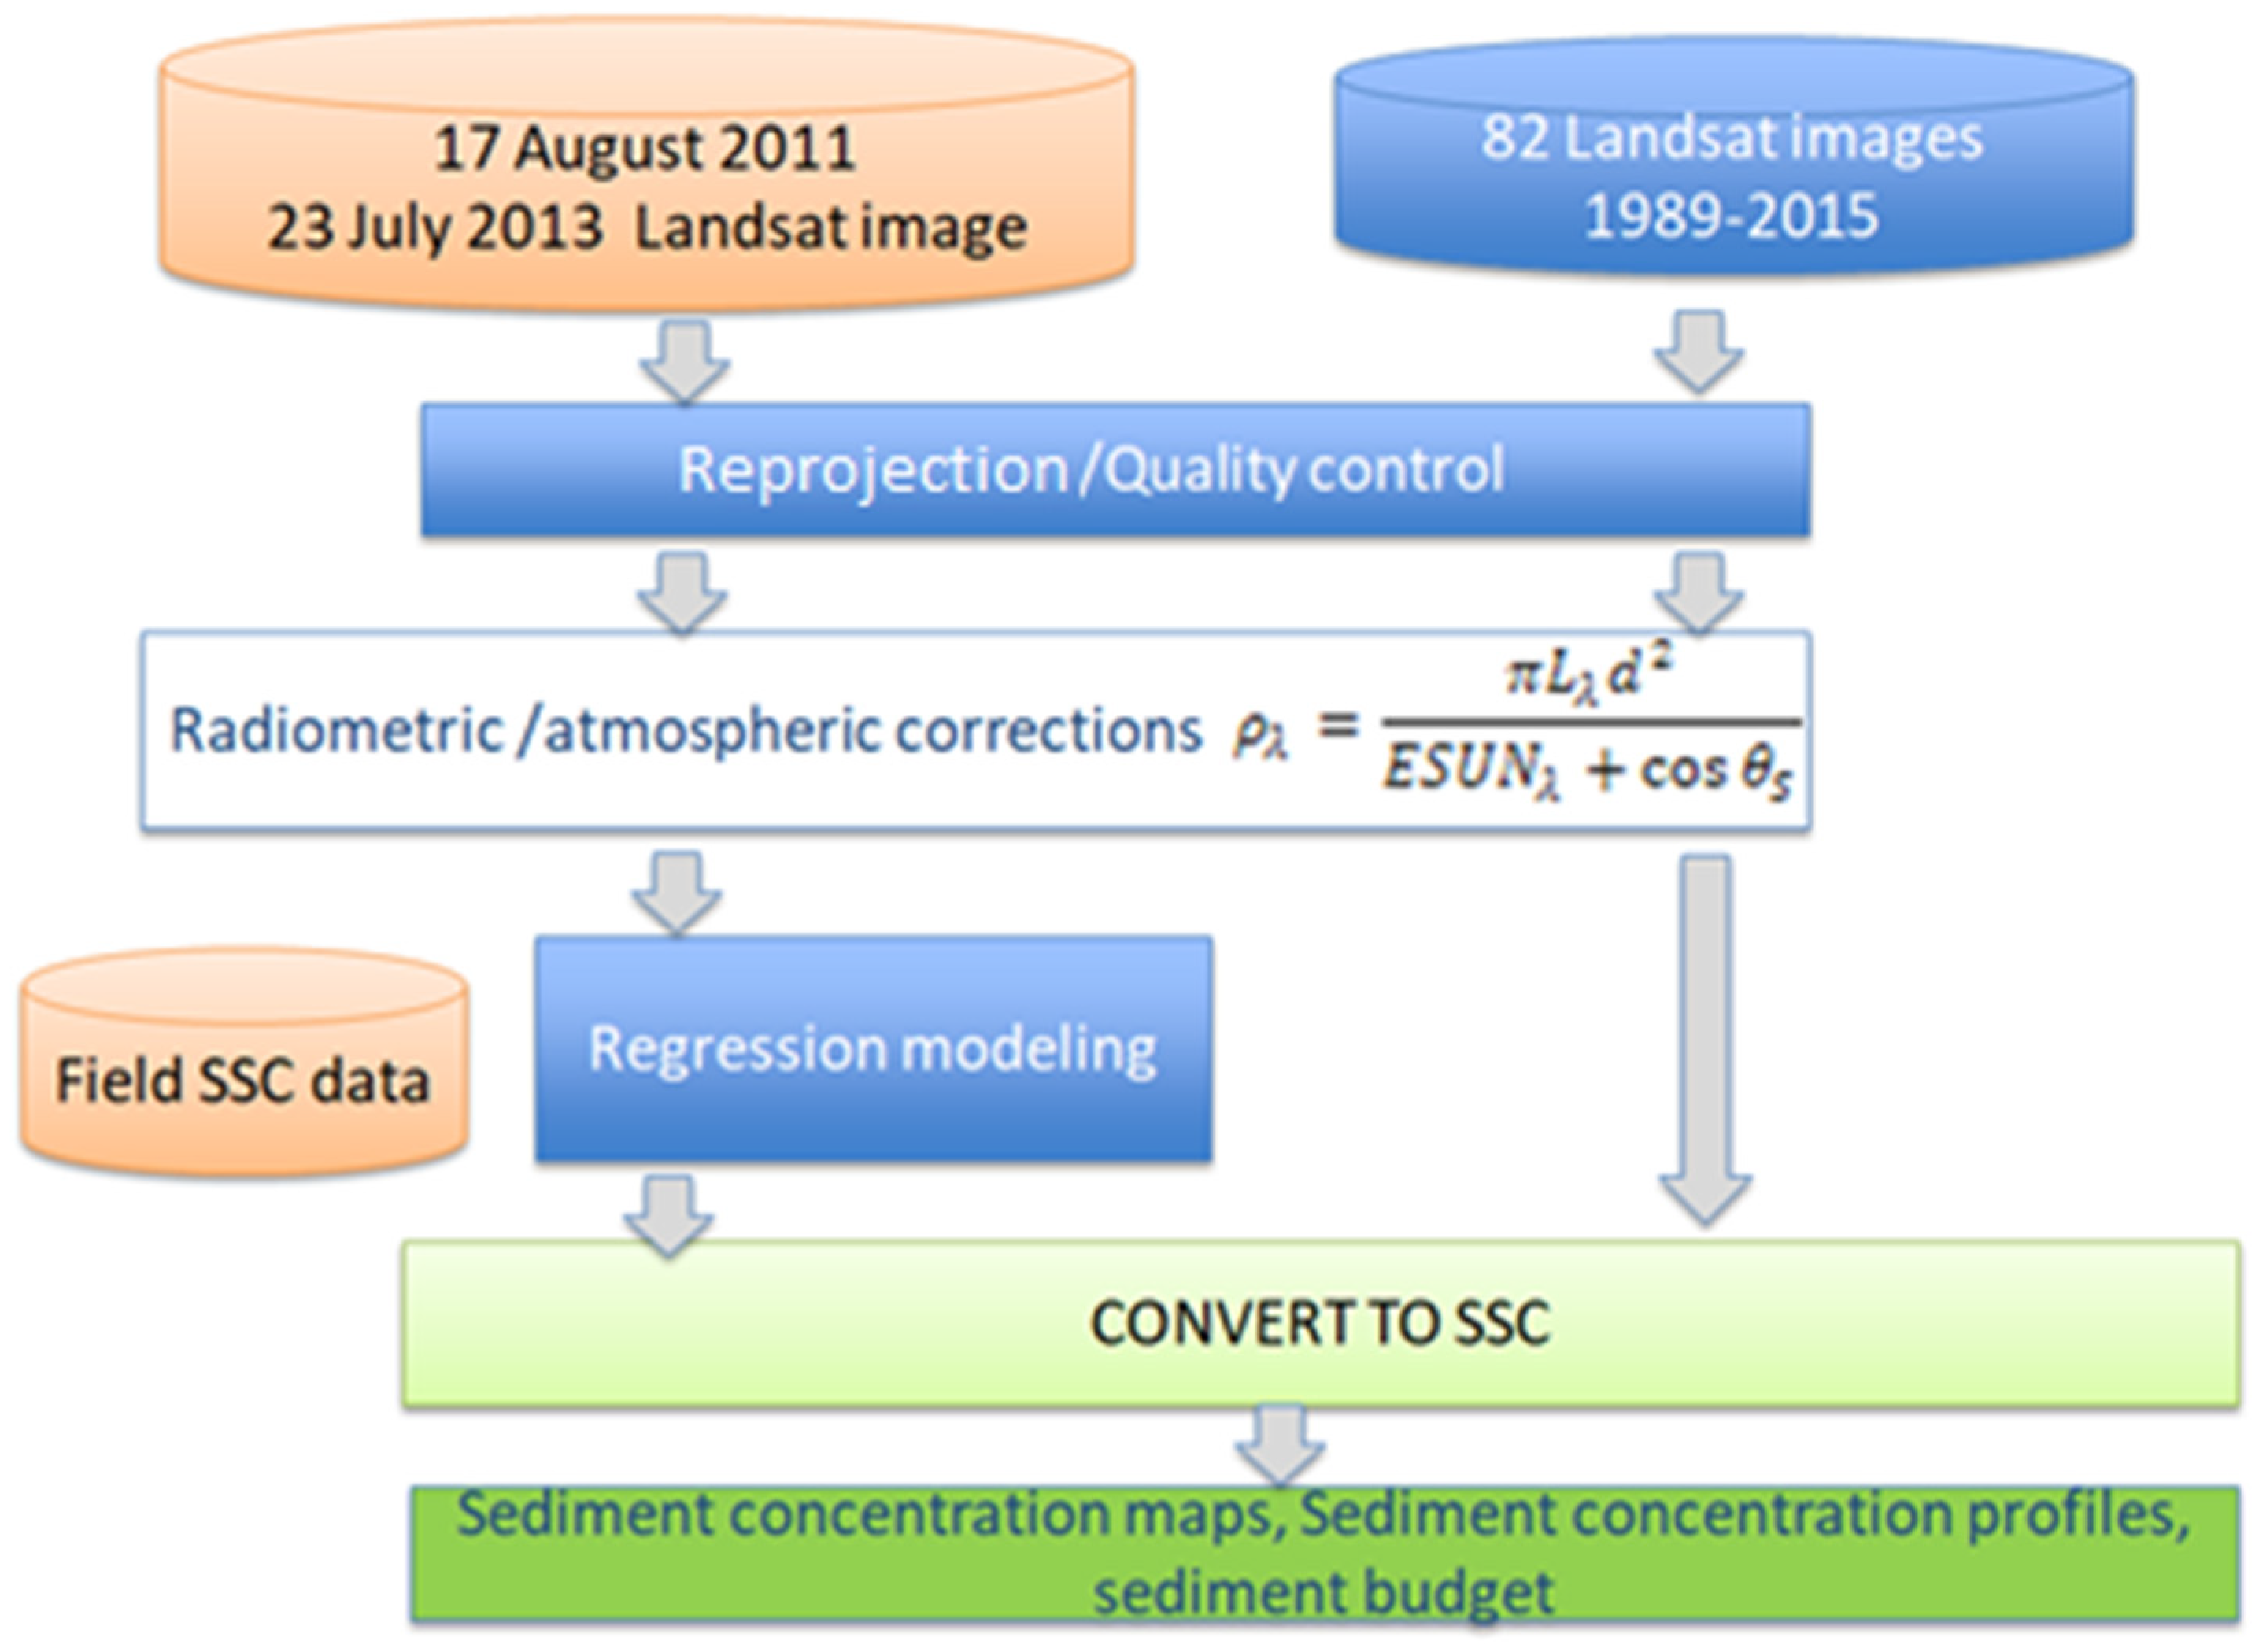
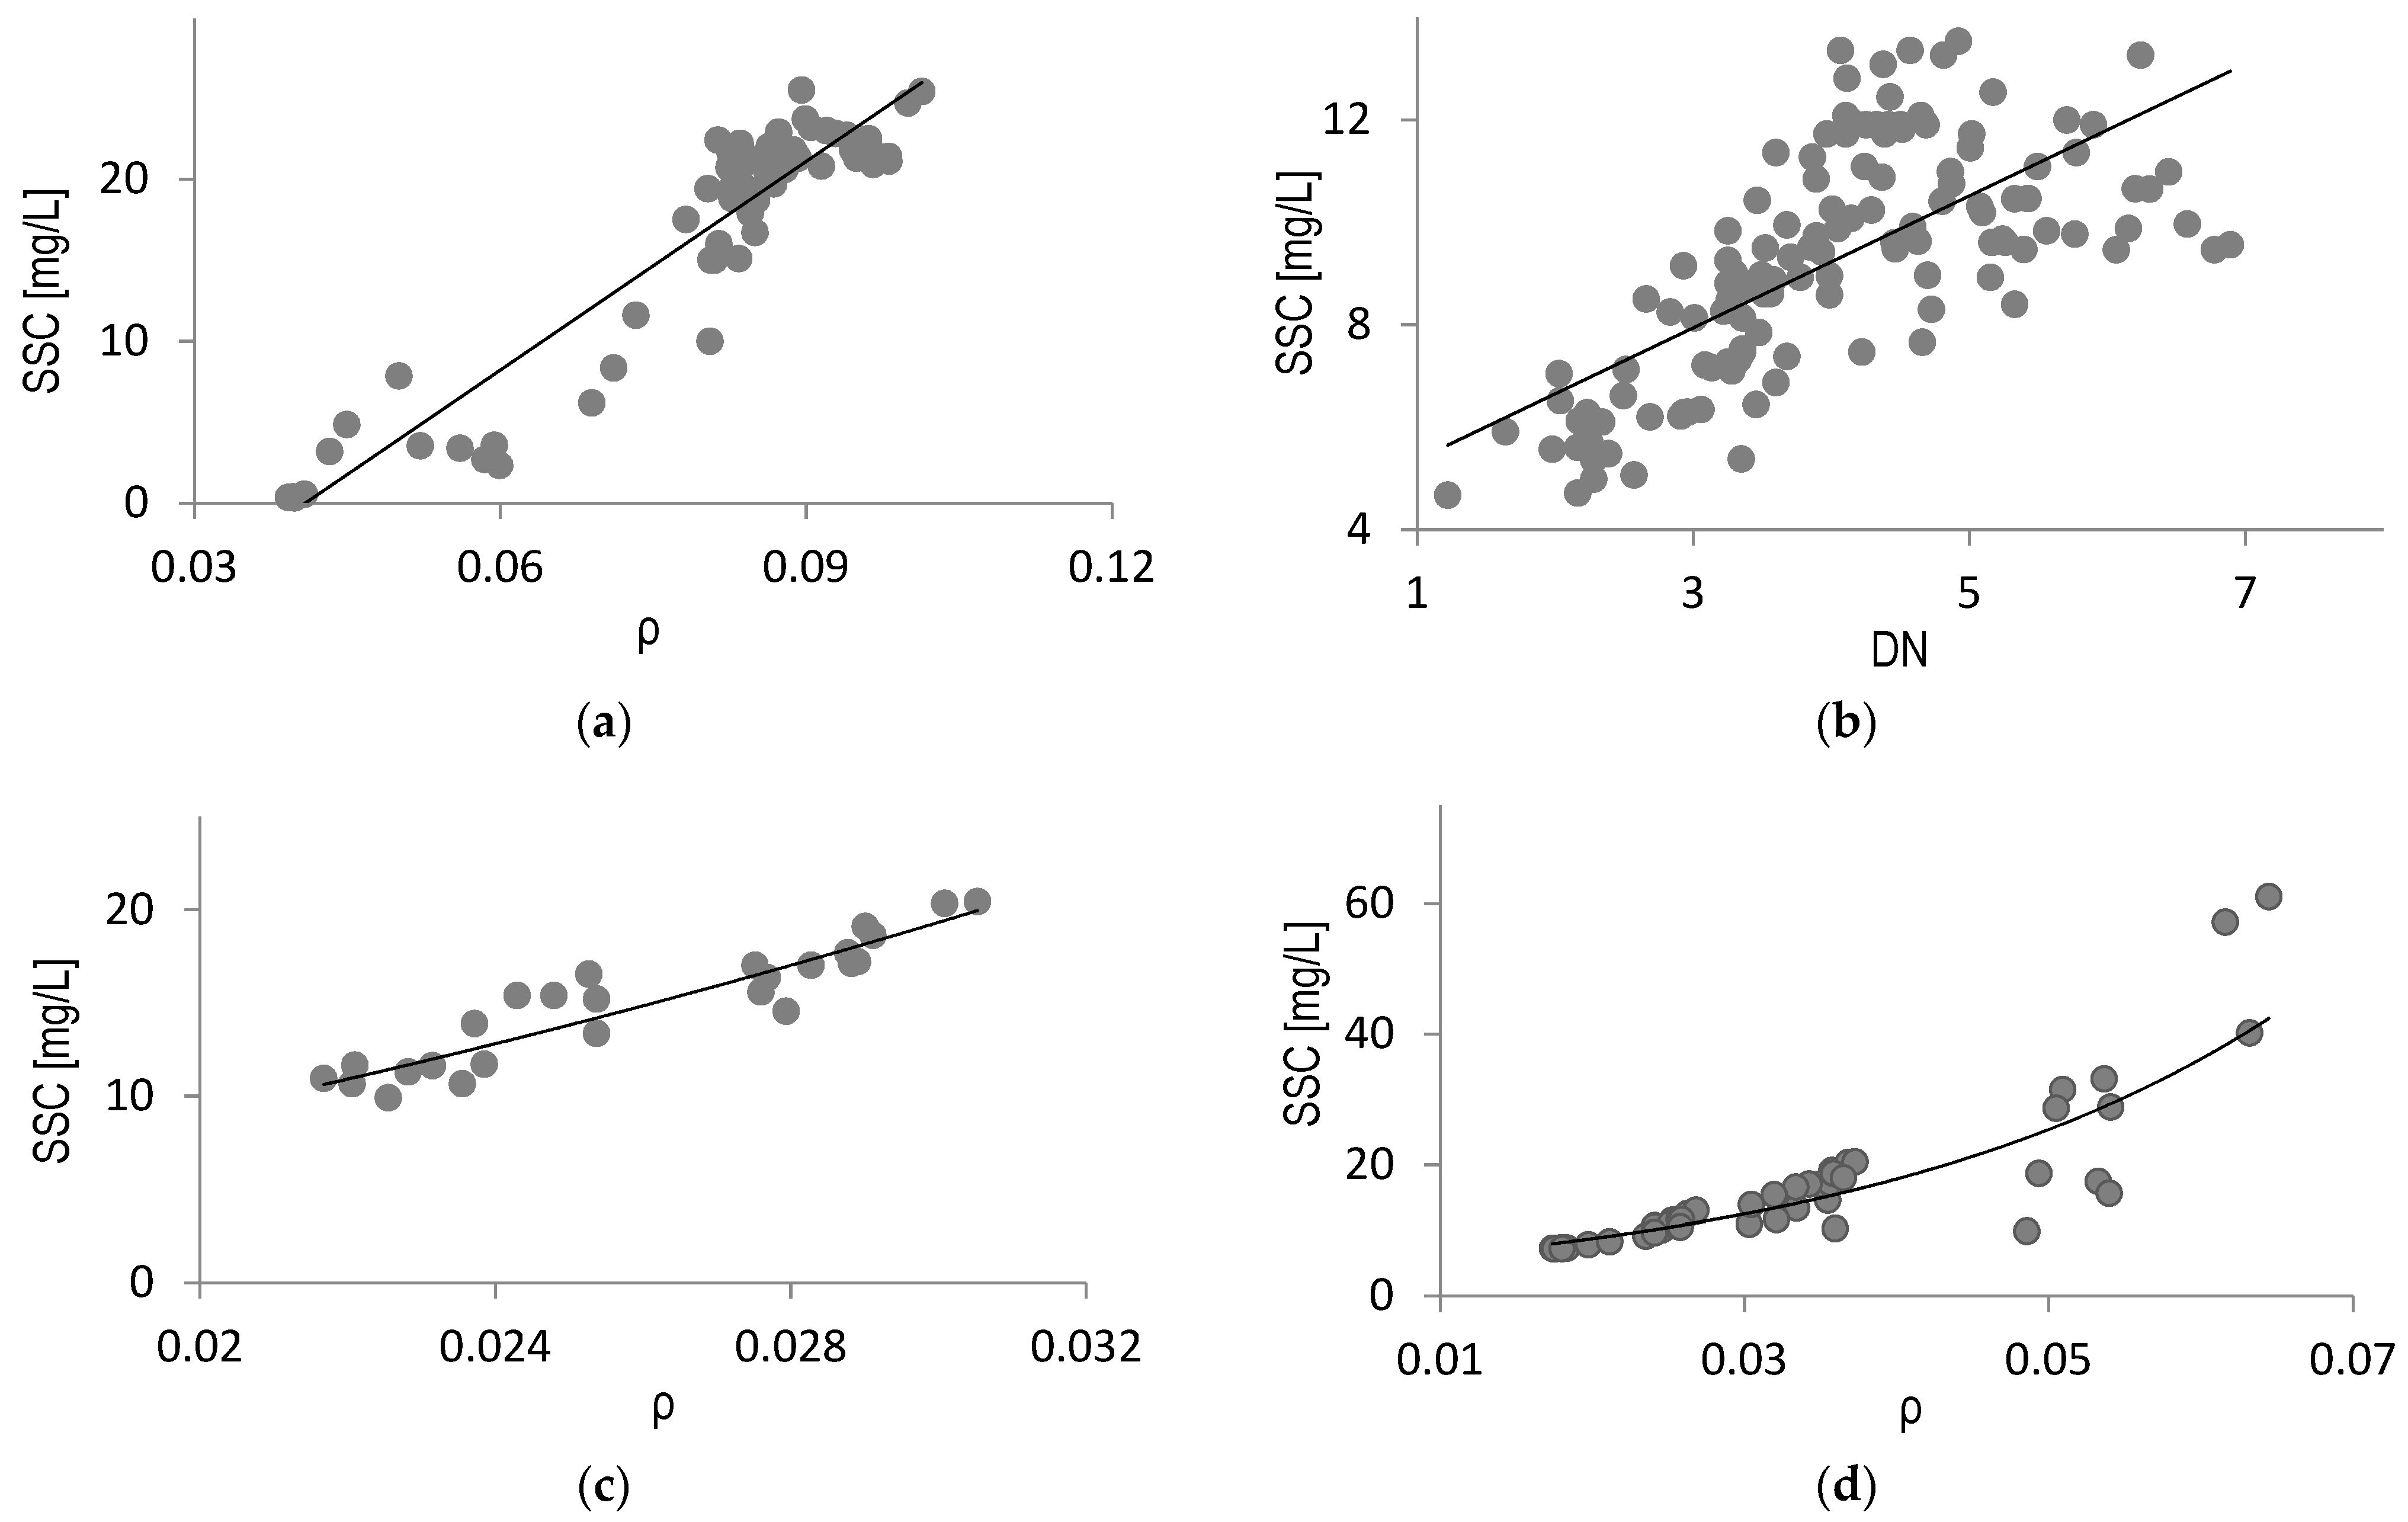
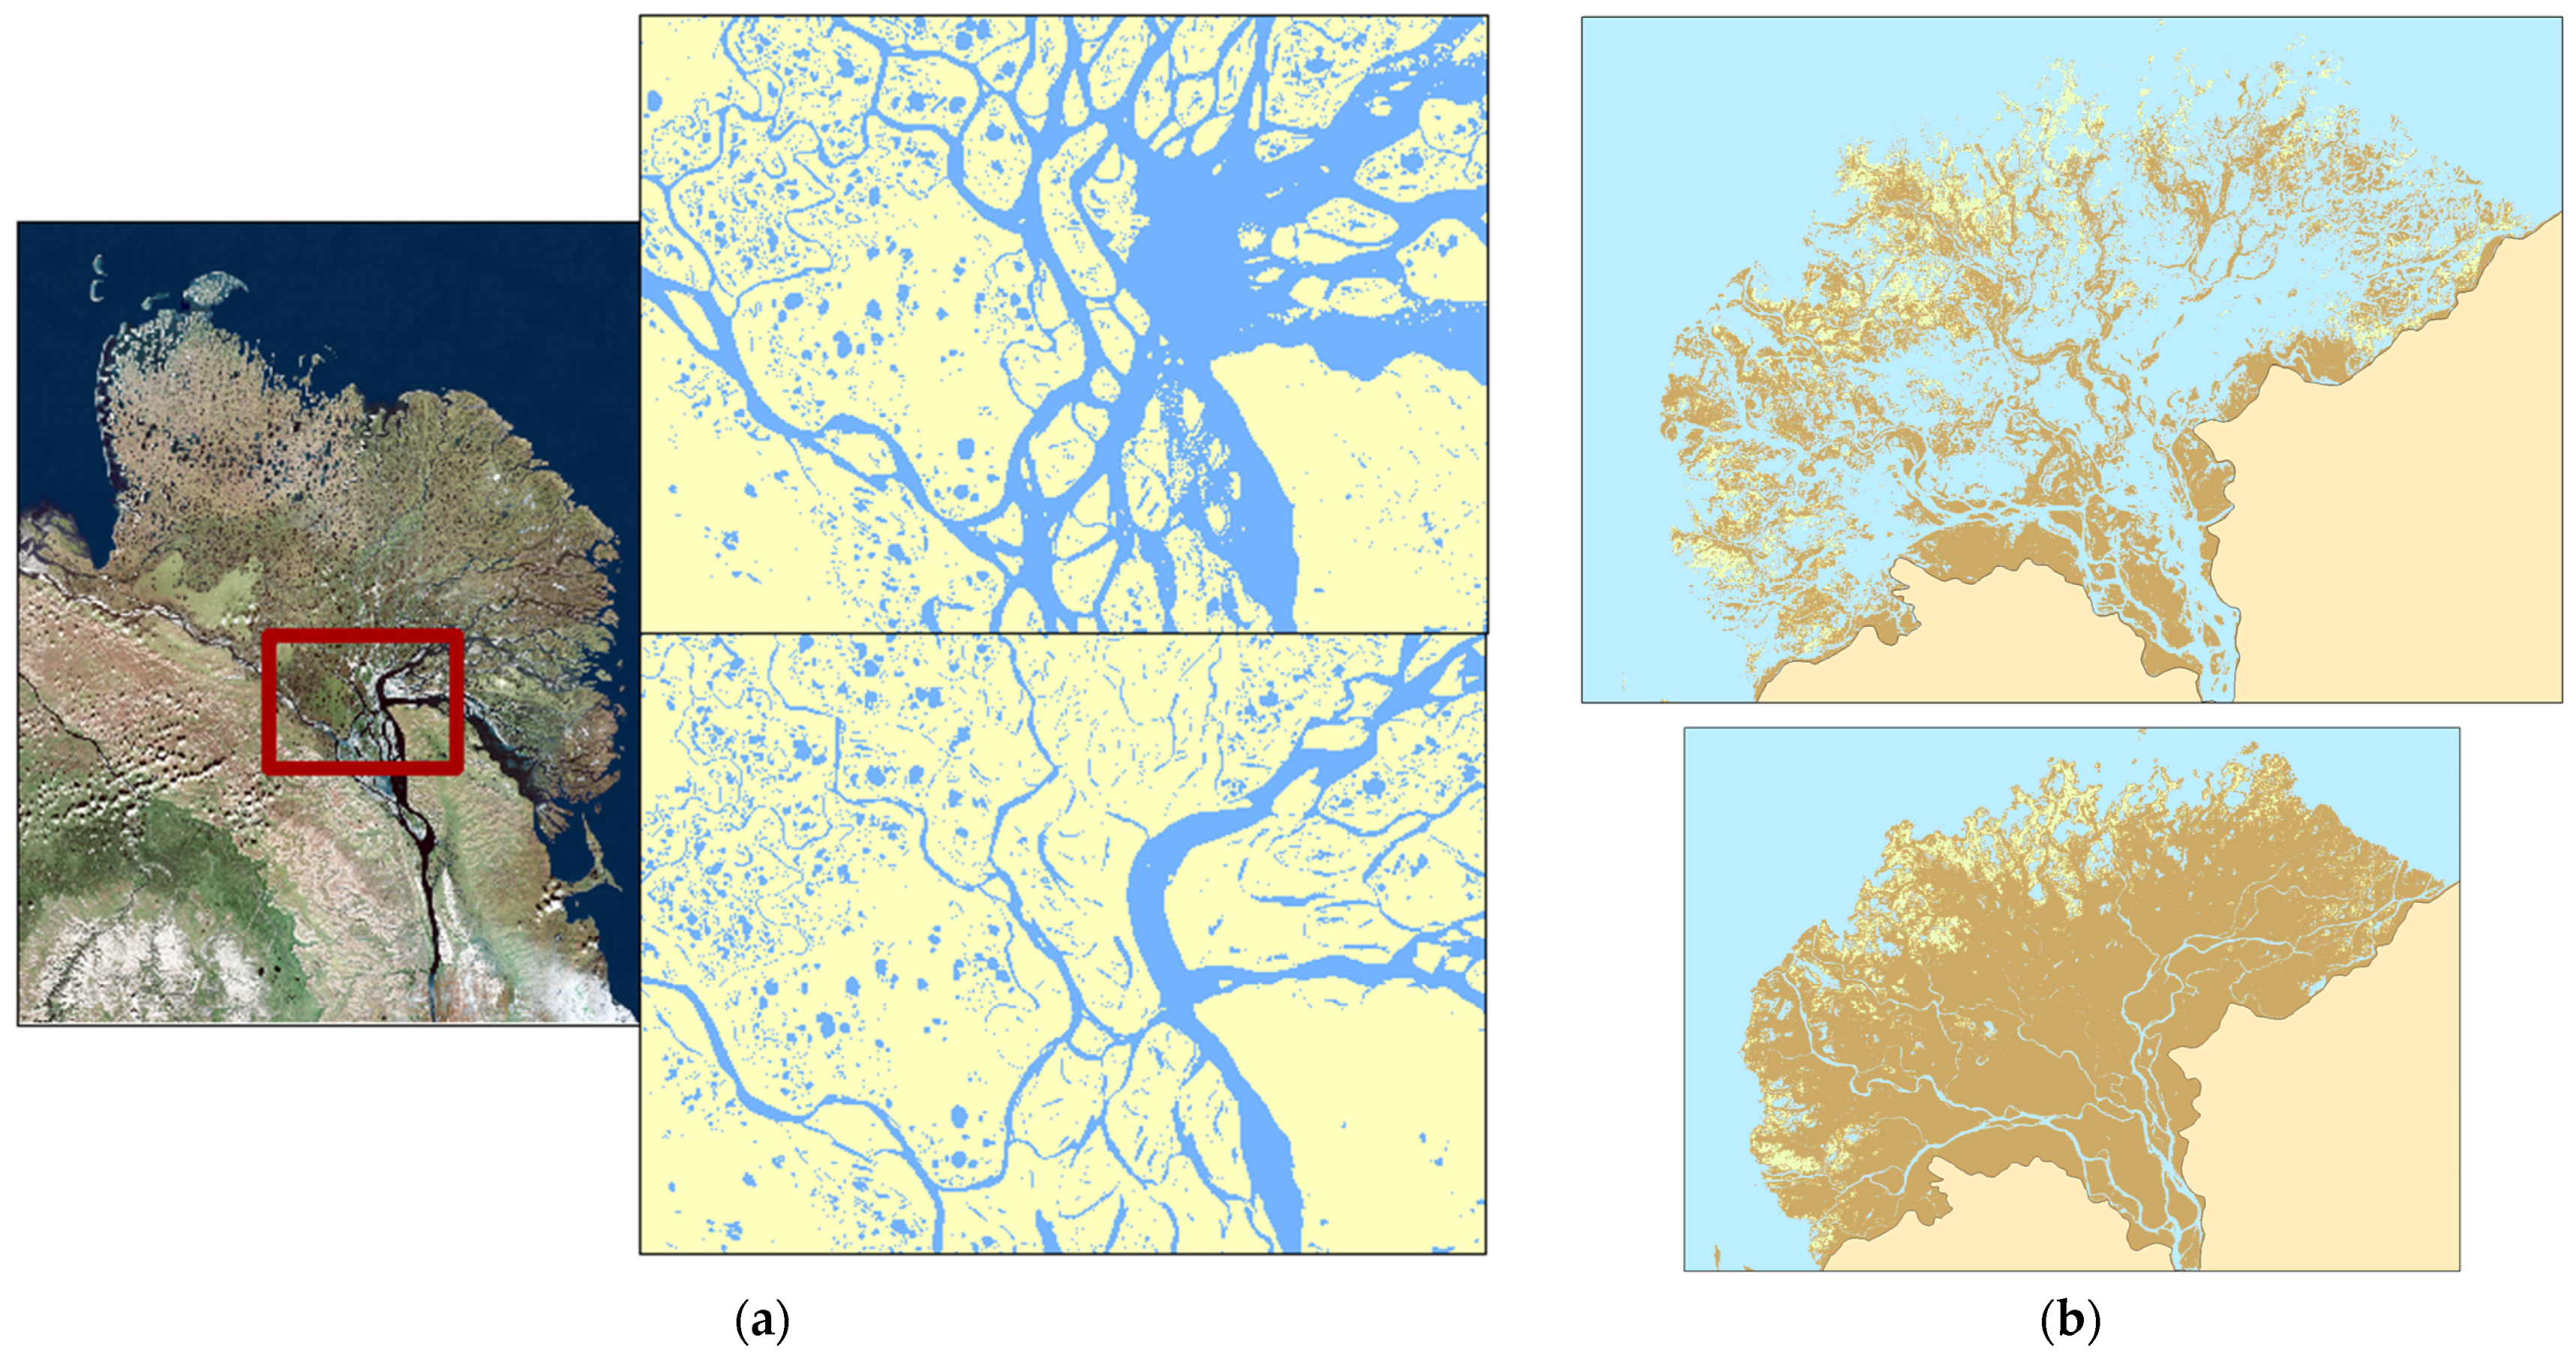
2.2. Methods
2.3. Materials
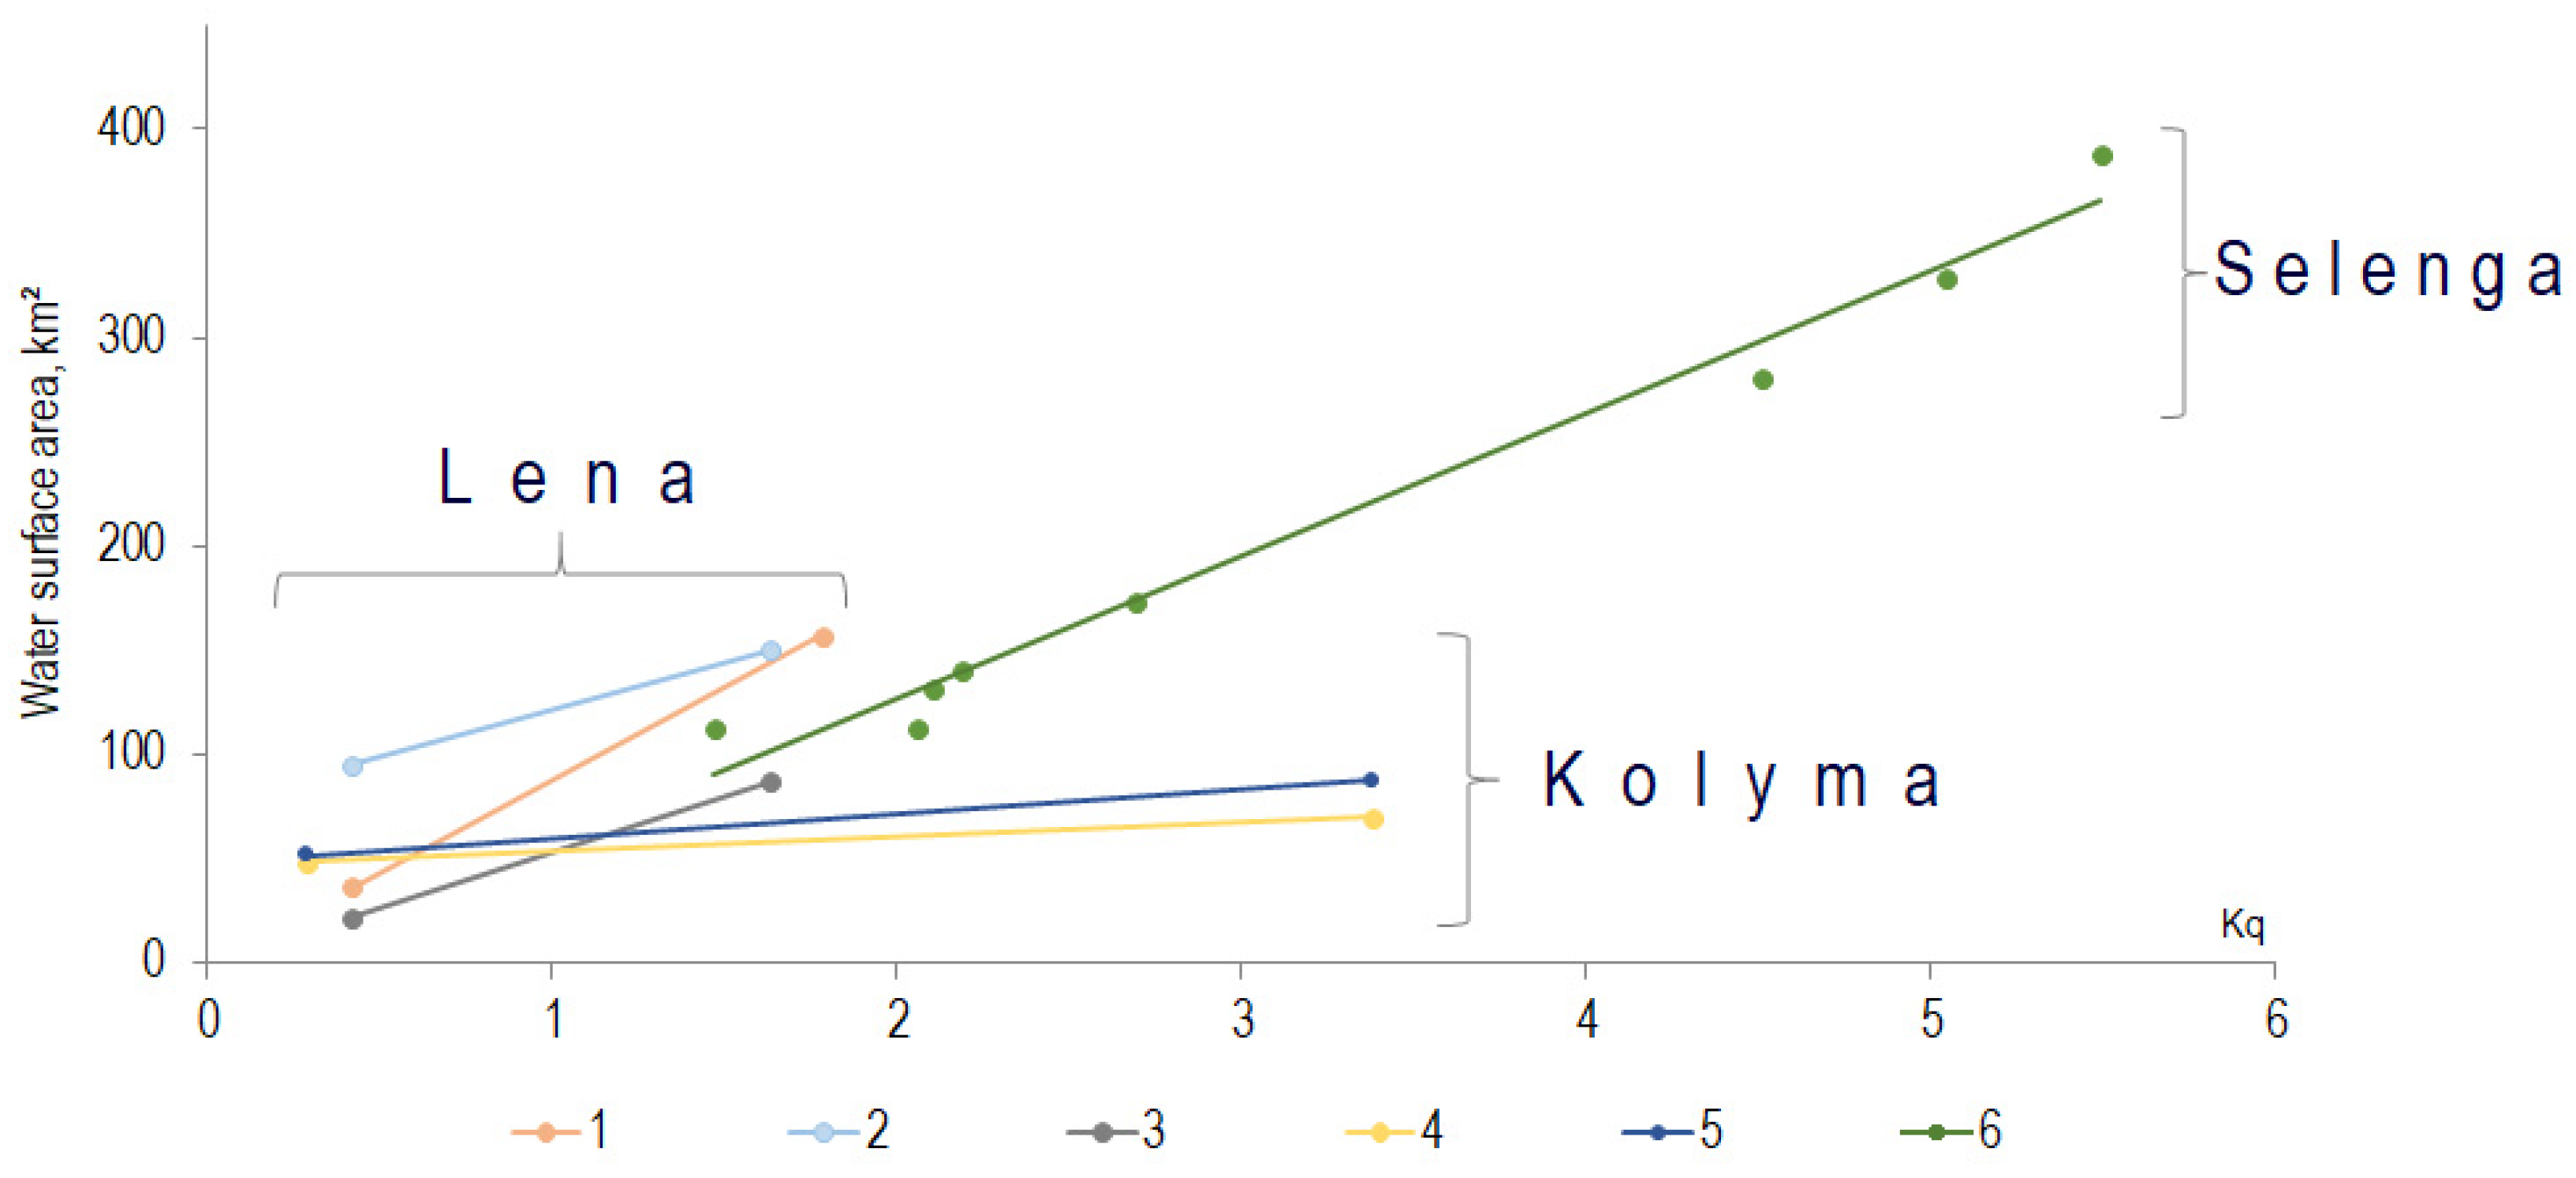
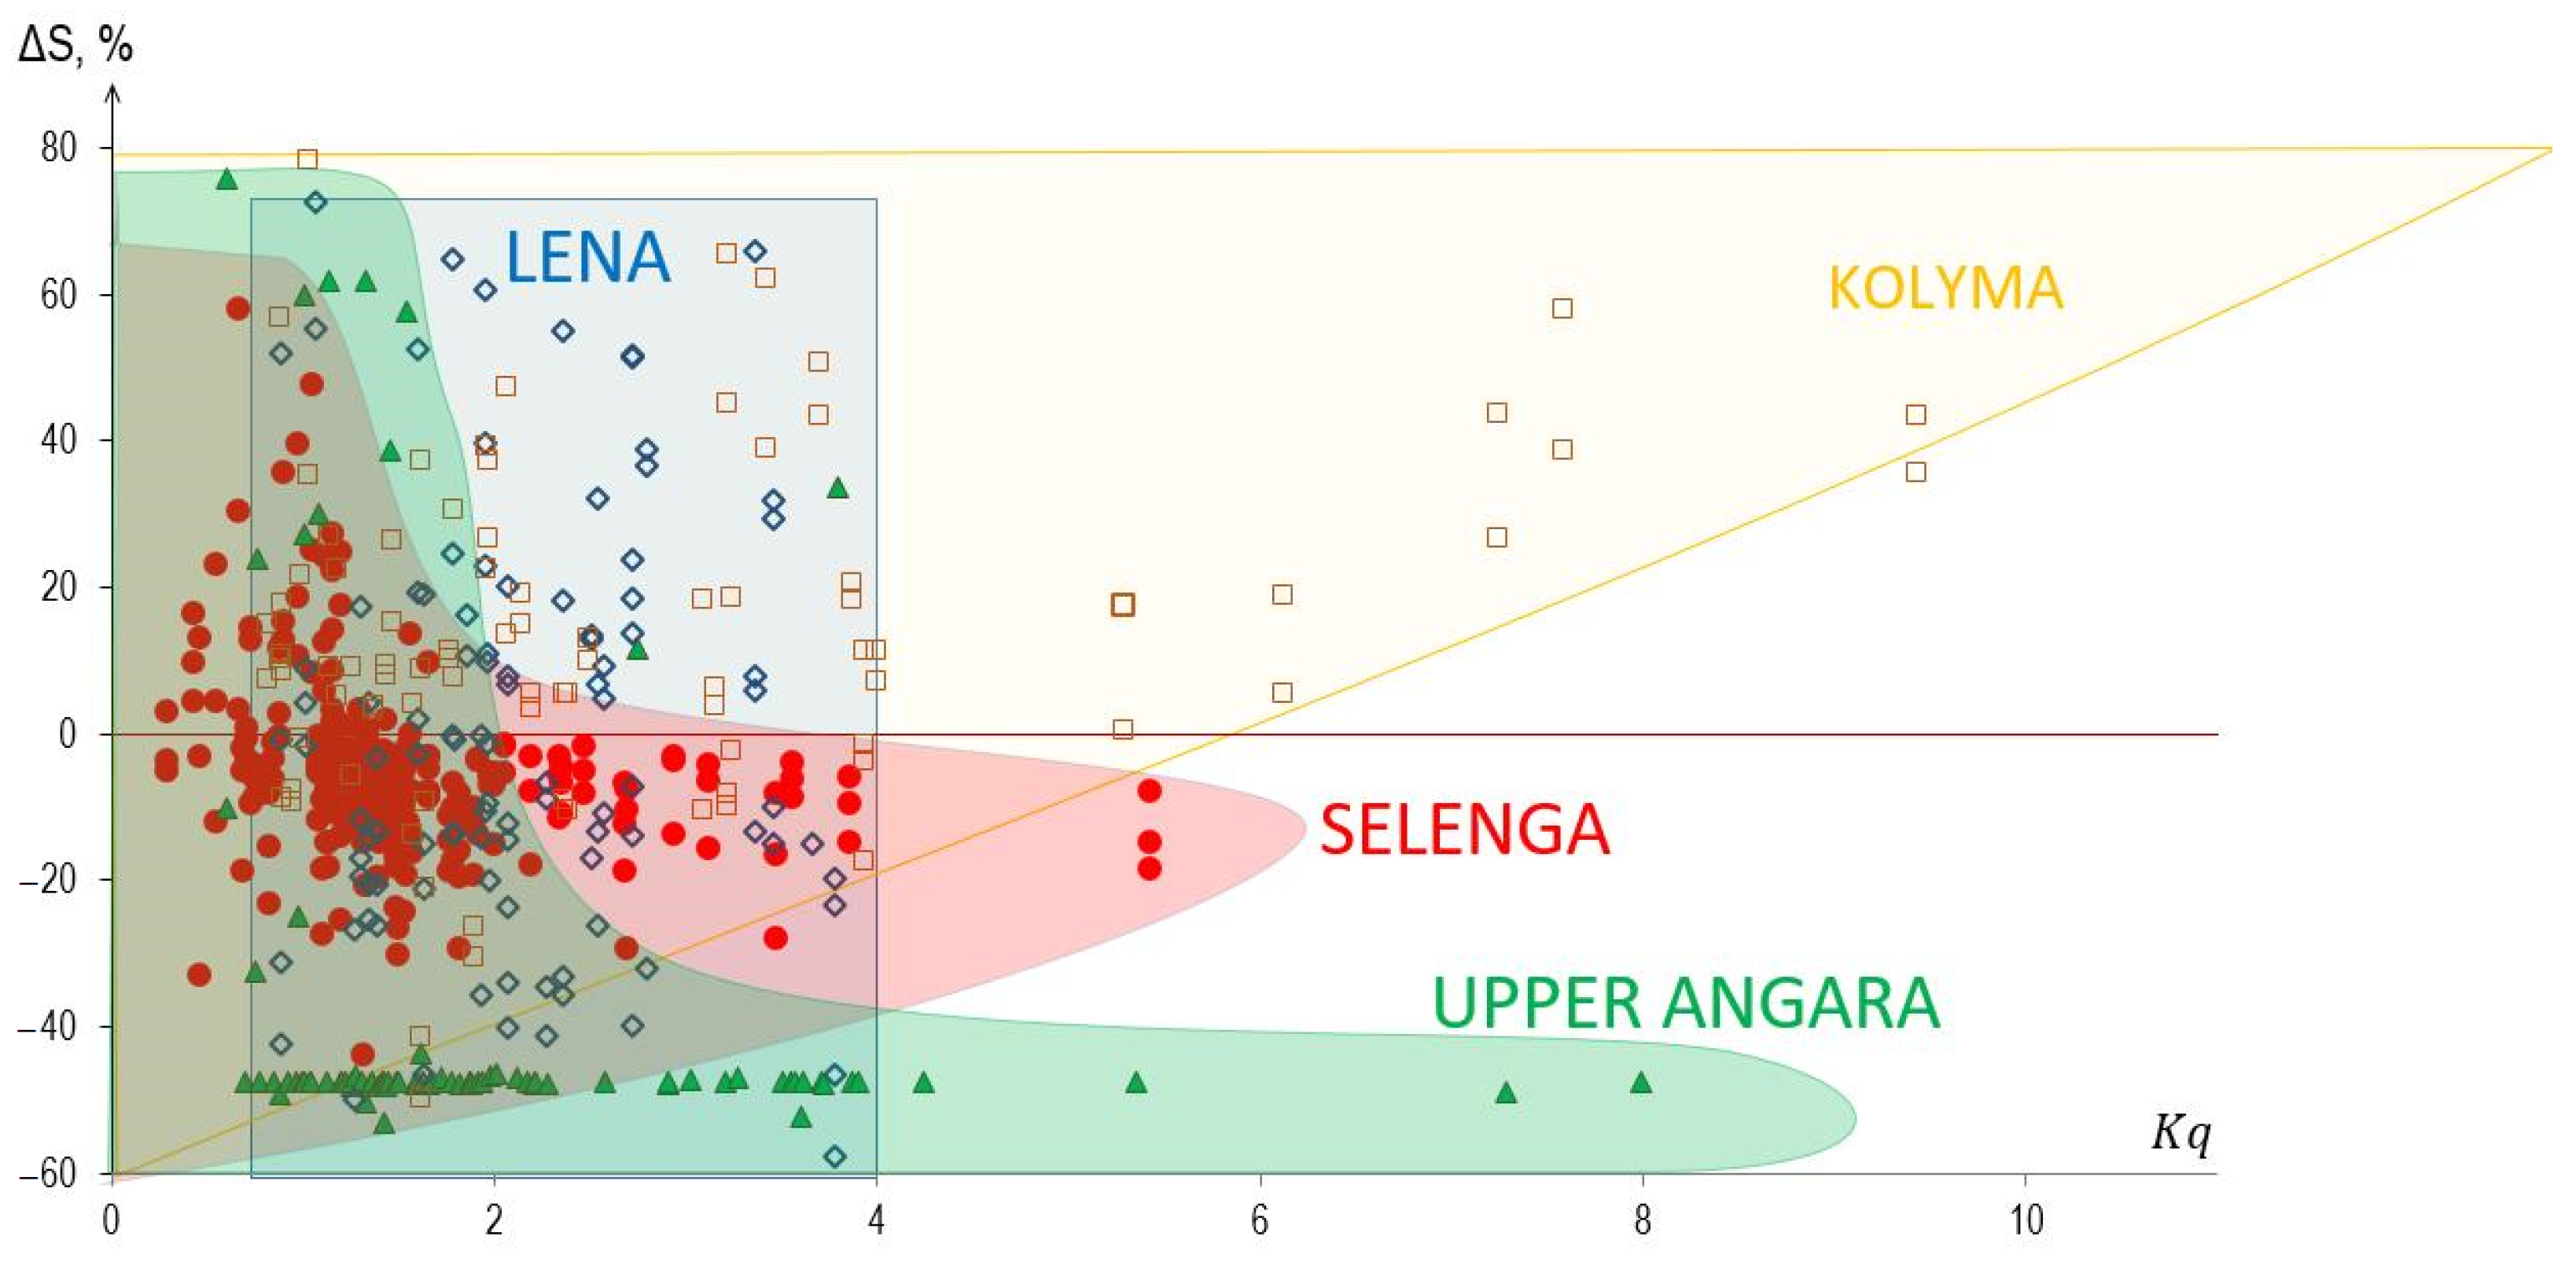
3. Results
4. Discussion
4.1. Drivers of Sediment Transport Changes along Deltas
4.2. Sedimentation and Biogeochemical Impacts
5. Conclusions
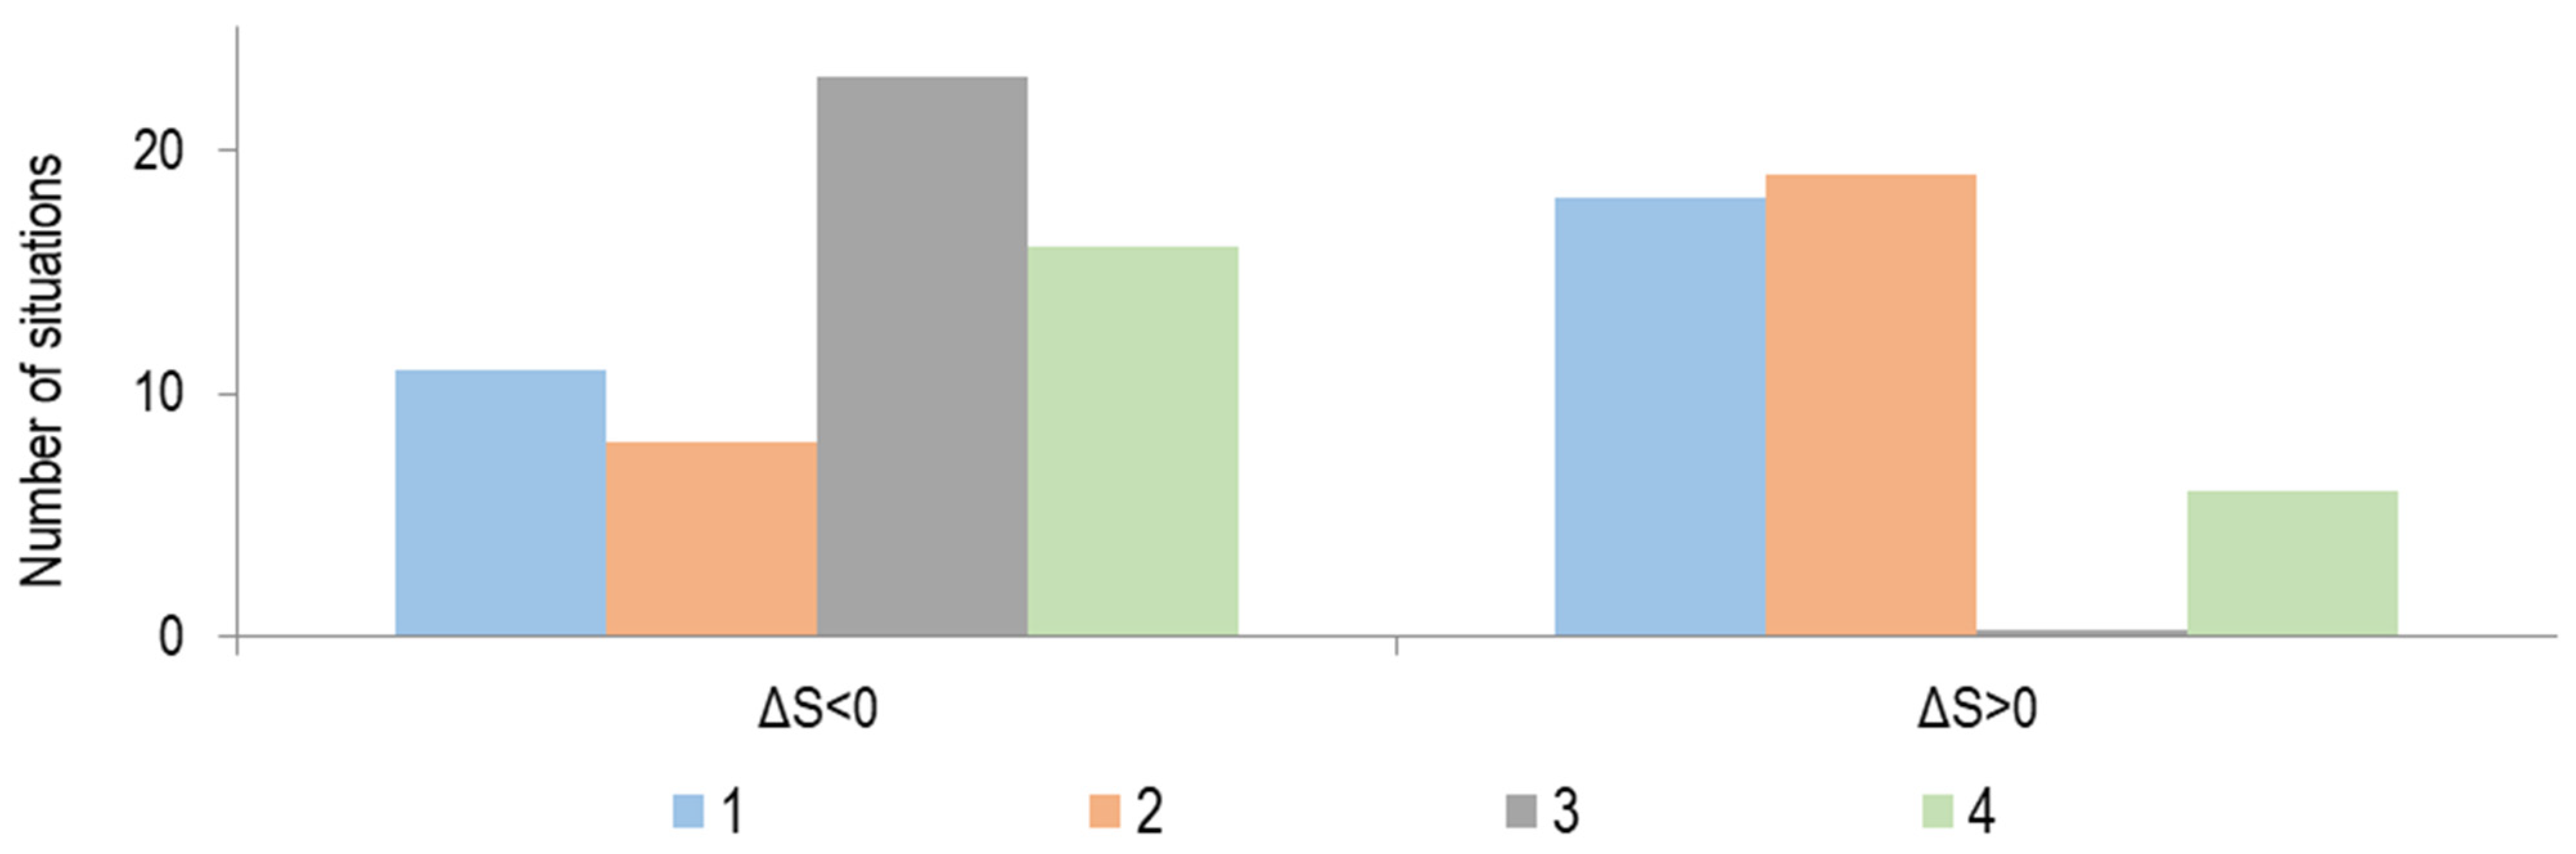
- Patterns of sediment sinks and sources in the deltas significantly varied between various deltas and in general change due to latitudinal gradients.
- Zoning and seasonality might be considered in future studies as fundamental parameters of river delta sedimentation. Permafrost in the North and aquatic vegetation in the South are dominant drivers that determine zonal North-to-South variation in suspended sediment budget.
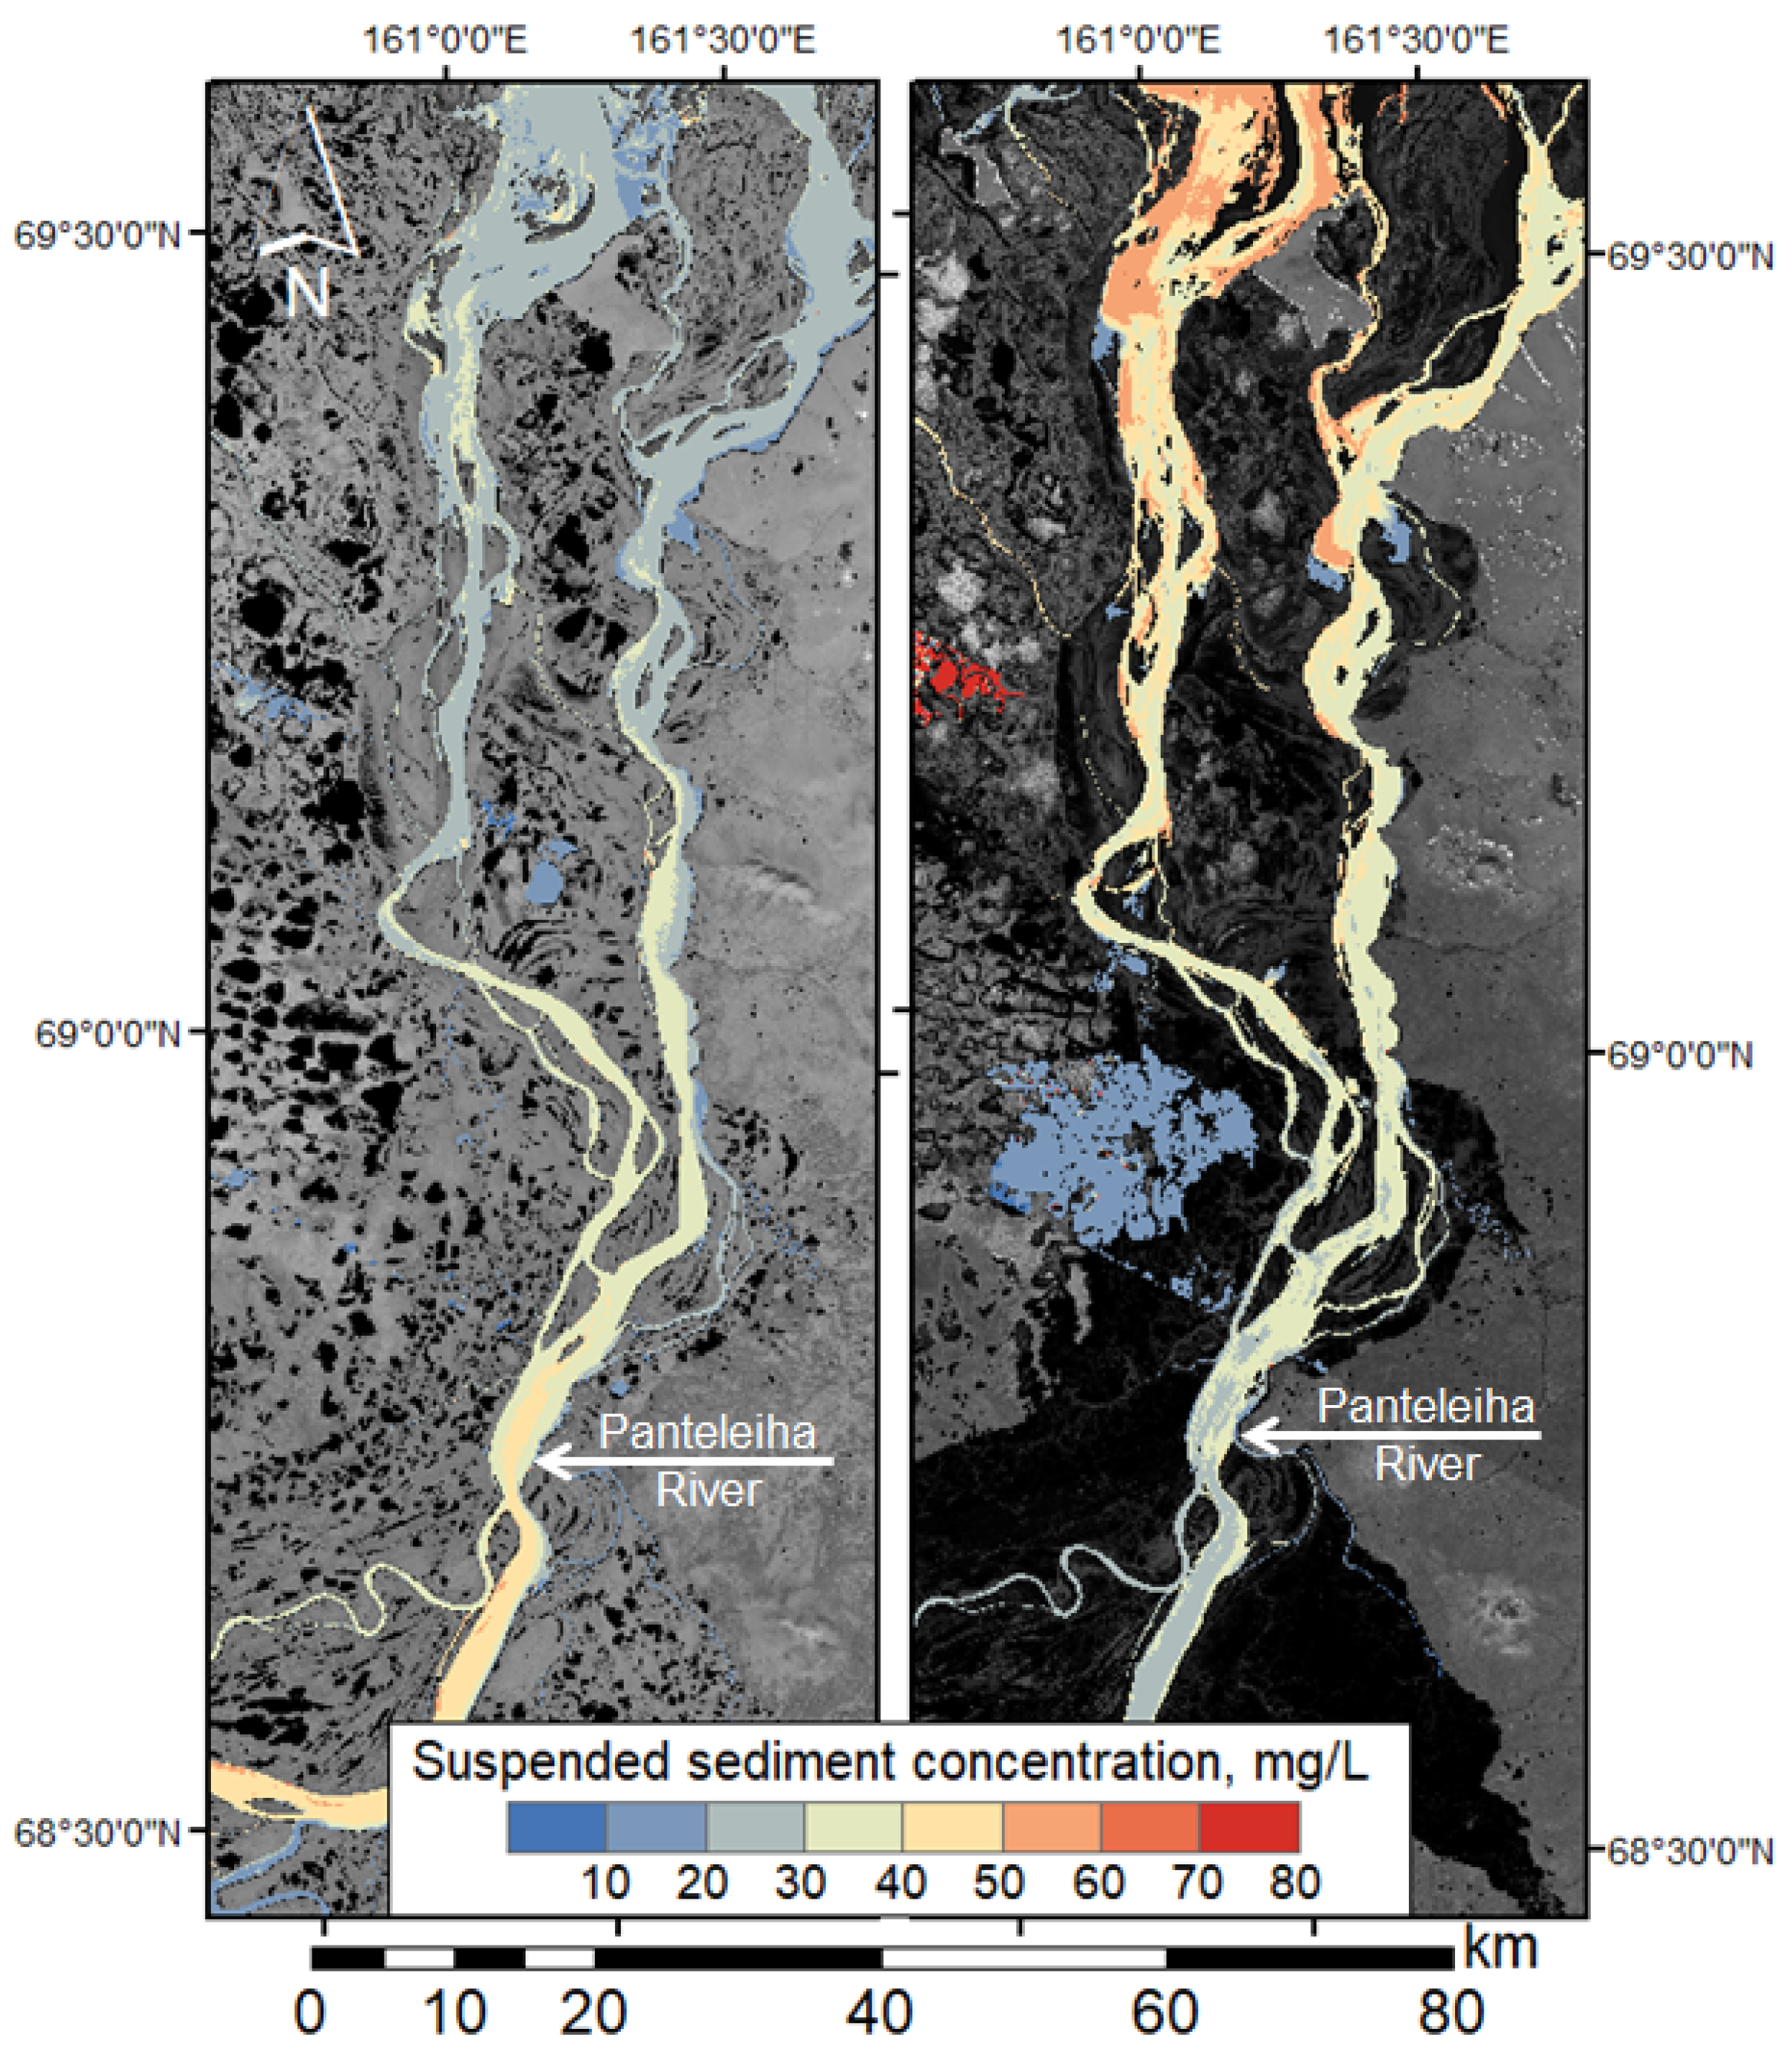
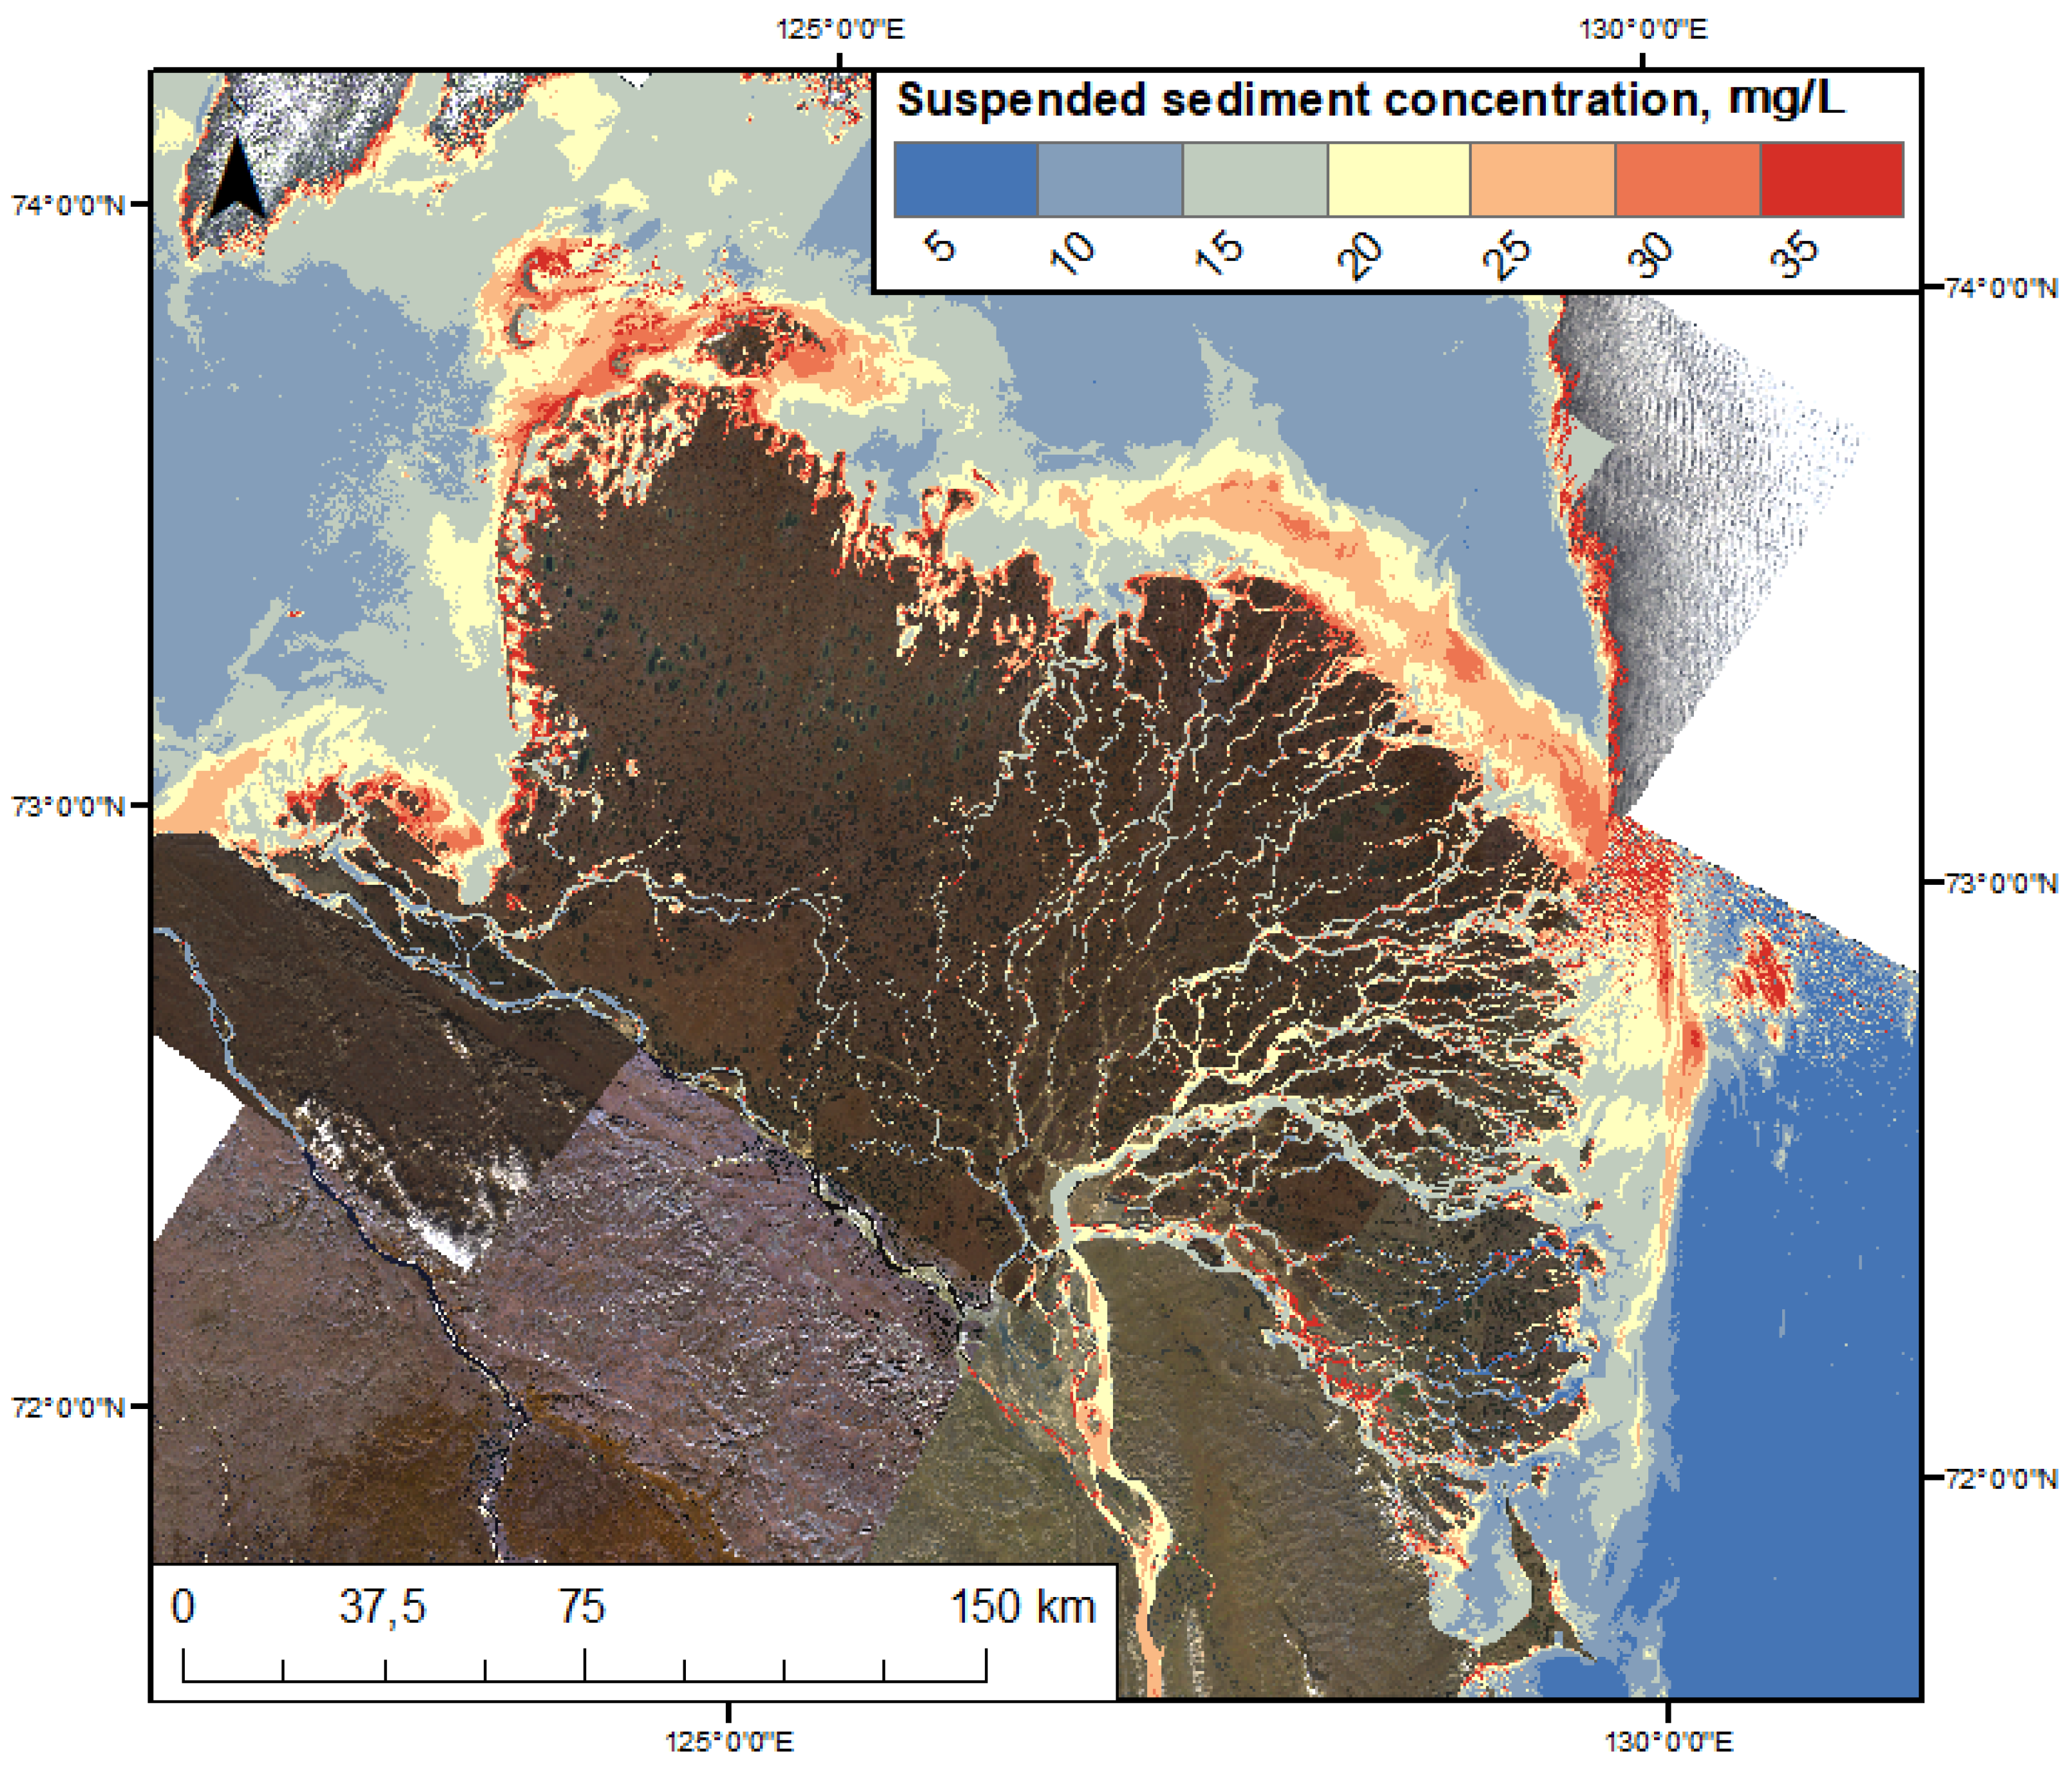
- Lena and Kolyma deltas represent mostly erosional patterns where suspended load increases along the main distributaries; here, an increase of sediment discharge in a permafrost-affected region may be predominantly driven by the rate of summer thawing and associated activation of erosion features. Upper Angara and Lena deltas mostly capture suspended sediments.
Author Contributions
Funding
Data Availability Statement
Acknowledgments
Conflicts of Interest
References
- Nienhuis, J.H.; Ashton, A.D.; Edmonds, D.A.; Hoitink, A.J.F.; Kettner, A.J.; Rowland, J.C.; Törnqvist, T.E. Global-scale human impact on delta morphology has led to net land area gain. Nature 2020, 577, 514–518. [Google Scholar] [CrossRef]
- Giosan, L.; Constantinescu, S.; Filip, F.; Deng, B. Maintenance of large deltas through channelization: Nature vs. humans in the Danube delta. Anthropocene 2013, 1, 35–45. [Google Scholar] [CrossRef]
- Syvitski, J.P.M.; Overeem, I.; Brakenridge, G.R.; Hannon, M. Floods, floodplains, delta plains—A satellite imaging approach. Sediment. Geol. 2012, 267, 1–14. [Google Scholar] [CrossRef]
- Syvitski, J.P.M.; Kettner, A.J.; Correggiari, A.; Nelson, B.W. Distributary channels and their impact on sediment dispersal. Mar. Geol. 2005, 222, 75–94. [Google Scholar] [CrossRef]
- Rowland, J.C.; Dietrich, W.E.; Day, G.; Parker, G. Formation and maintenance of single-thread tie channels entering floodplain lakes: Observations from three diverse river systems. J. Geophys. Res. Earth Surf. 2009, 114, F02013. [Google Scholar] [CrossRef]
- Passalacqua, P.; Giosan, L.; Goodbred, S.; Overeem, I. Stable ≠ Sustainable: Delta Dynamics Versus the Human Need for Stability. Earth’s Futur. 2021, 9, e2021EF002121. [Google Scholar] [CrossRef]
- Lisitzyn, A.P. Marginal filter of oceans. Oceanology 1995, 5, 735–747. (In Russian) [Google Scholar]
- Chalov, S.R.; Bazilova, V.O.; Tarasov, M.K. Modelling suspended sediment distribution in the Selenga River Delta using LandSat data. Proc. Int. Assoc. Hydrol. Sci. 2017, 375, 19–22. [Google Scholar] [CrossRef]
- Törnqvist, R.; Jarsjö, J.; Pietroń, J.; Bring, A.; Rogberg, P.; Asokan, S.M.; Destouni, G. Evolution of the hydro-climate system in the Lake Baikal basin. J. Hydrol. 2014, 519, 1953–1962. [Google Scholar] [CrossRef]
- Leeder, M.R.; Harris, T.; Kirkby, M.J. Sediment supply and climate change: Implications for basin stratigraphy. Basin Res. 1998, 10, 7–18. [Google Scholar] [CrossRef]
- Peterson, B.J.; Holmes, R.M.; McClelland, J.W.; Vörösmarty, C.J.; Lammers, R.B.; Shiklomanov, A.I.; Shiklomanov, I.A.; Rahmstorf, S. Increasing River Discharge to the Arctic Ocean. Science. 2002, 298, 2171–2173. [Google Scholar] [CrossRef] [PubMed]
- Shiklomanov, A.; Déry, S.; Tretiakov, M.; Yang, D.; Magritsky, D.; Georgiadi, A.; Tang, W. River Freshwater Flux to the Arctic Ocean. In Arctic Hydrology, Permafrost and Ecosystems; Springer International Publishing: Cham, Switzerland, 2021; pp. 703–738. [Google Scholar]
- Bring, A.; Fedorova, I.; Dibike, Y.; Hinzman, L.; Mård, J.; Mernild, S.H.; Prowse, T.; Semenova, O.; Stuefer, S.L.; Woo, M.-K. Arctic terrestrial hydrology: A synthesis of processes, regional effects, and research challenges. J. Geophys. Res. Biogeosciences 2016, 121, 621–649. [Google Scholar] [CrossRef]
- Ahmed, R.; Prowse, T.; Dibike, Y.; Bonsal, B. Effects of Climatic Drivers and Teleconnections on Late 20th Century Trends in Spring Freshet of Four Major Arctic-Draining Rivers. Water 2021, 13, 179. [Google Scholar] [CrossRef]
- Wrzesiński, D.; Sobkowiak, L. Transformation of the Flow Regime of a Large Allochthonous River in Central Europe—An Example of the Vistula River in Poland. Water 2020, 12, 507. [Google Scholar] [CrossRef]
- Alexeevsky, N.I.; Chalov, R.S.; Berkovich, K.M.; Chalov, S.R. Channel changes in largest Russian rivers: Natural and anthropogenic effects. Int. J. River Basin Manag. 2013, 11, 175–191. (In Russian) [Google Scholar] [CrossRef]
- Alekseevskii, N.I.; Berkovich, K.M.; Chalov, R.S.; Chalov, S.R. Spatiotemporal variability in channel deformations on rivers of Russia. Geogr. Nat. Resour. 2012, 33, 192–199. [Google Scholar] [CrossRef]
- Pavelsky, T.M.; Smith, L.C. Remote sensing of suspended sediment concentration, flow velocity, and lake recharge in the Peace-Athabasca Delta, Canada. Water Resour. Res. 2009, 45, W11417. [Google Scholar] [CrossRef]
- Tejedor, A.; Longjas, A.; Zaliapin, I.; Foufoula-Georgiou, E. Delta channel networks: 1. A graph-theoretic approach for studying connectivity and steady state transport on deltaic surfaces. Water Resour. Res. 2015, 51, 3998–4018. [Google Scholar] [CrossRef]
- Magritsky, D.V. Climate-induced and anthropogenic changes in sediment transport of the main Arctic Rivers of Siberia and the Far East of the Russian Federation. In Proceedings of the IV All-Russian Conference “Hydrometeorology and Ecology: Achievements and Prospects of Development”/MGO Named after L. N. Karlin; Himizdat: Saint Petersburg, Russia, 2020; pp. 248–253. (In Russian) [Google Scholar]
- Alabyan, A.M.; Chalov, R.S.; Korotaev, V.N.; Sidorchuk, A.Y.; Zaitsev, A.A. Natural and technogenic water and sediment supply to the Laptev sea. Ber. Zur Polar-Und Meeresforsch. 1995, 182, 264–271. [Google Scholar]
- Chalov, S.R.; Bazilova, V.O.; Tarasov, M.K. Suspended sediment balance in Selenga delta at the late XX–early XXI century: Simulation by LANDSAT satellite images. Water Resour. 2017, 44, 463–470. [Google Scholar] [CrossRef]
- Park, E.; Latrubesse, E.M. Modeling suspended sediment distribution patterns of the Amazon River using MODIS data. Remote Sens. Environ. 2014, 147, 232–242. [Google Scholar] [CrossRef]
- Martinez, J.M.; Guyot, J.L.; Filizola, N.; Sondag, F. Increase in suspended sediment discharge of the Amazon River assessed by monitoring network and satellite data. Catena 2009, 79, 257–264. [Google Scholar] [CrossRef]
- Wójcik, K.A.; Bialik, R.J.; Osińska, M.; Figielski, M. Investigation of Sediment-Rich glacial meltwater plumes using a high-resolution multispectral sensor mounted on an unmanned aerial vehicle. Water 2019, 11, 2405. [Google Scholar] [CrossRef]
- Schild, K.M.; Hawley, R.L.; Chipman, J.W.; Benn, D.I. Quantifying suspended sediment concentration in subglacial sediment plumes discharging from two svalbard tidewater glaciers using landsat-8 and in situ measurements. Int. J. Remote Sens. 2017, 38, 6865–6881. [Google Scholar] [CrossRef]
- Scholz, C.A.; Moore, T.C.; Hutchinson, D.R.; Golmshtok, A.J.; Klitgord, K.D.; Kurotchkin, A.G. Comparative sequence stratigraphy of low-latitude versus high-latitude lacustrine rift basins: Seismic data examples from the East African and Baikal rifts. Palaeogeogr. Palaeoclimatol. Palaeoecol. 1998, 140, 401–420. [Google Scholar] [CrossRef]
- Antokhina, O.Y.; Latysheva, I.V.; Mordvinov, V.I. A Cases Study Of Mongolian Cyclogenesis During The July 2018 Blocking Events. Geogr. Environ. Sustain. 2019, 12, 66–78. [Google Scholar] [CrossRef]
- Potemkina, T.G. Sediment runoff formation trends of major tributaries of Lake Baikal in the 20th century and at the beginning of the 21st century. Russ. Meteorol. Hydrol. 2011, 36, 819–825. (In Russian) [Google Scholar] [CrossRef]
- Garmaev, E.J.; Khristoforov, A.V. Water Resources of the Rivers of the Lake Baikal Basin: Basics of Their Use and Protection; GEO: Nobosibirsk, Russia, 2010; p. 220. (In Russian) [Google Scholar]
- Chalov, S.R.; Potemkina, T.G.; Pashkina, M.P.; Kasimov, N.S. Long-term changes of the budget of suspended sediment in the deltas of the tributaries of Lake Baikal. Meteorol. Hydrol. 2019, 10, 50–59. (In Russian) [Google Scholar]
- Alexeevsky, N.I. Geoecological State of Russian Arctic Coast and Their Safety of Nature Management; GEOS: Moscow, Russia, 2007; p. 284. (In Russian) [Google Scholar]
- Bolshiyanov, D.Y.; Makarov, A.S.; Schneider, V.; Stoof, G. Origin and Development of the Lena River Delta; AARI: St. Petersburg, Russia, 2013. (In Russian) [Google Scholar]
- Fedorova, I.; Chetverova, A.; Bolshiyanov, D.; Makarov, A.; Boike, J.; Heim, B.; Morgenstern, A.; Overduin, P.P.; Wegner, C.; Kashina, V.; et al. Lena Delta hydrology and geochemistry: Long-term hydrological data and recent field observations. Biogeosciences 2015, 12, 345–363. [Google Scholar] [CrossRef]
- Boike, J.; Kattenstroth, B.; Abramova, K.; Bornemann, N.; Chetverova, A.; Fedorova, I.; Fröb, K.; Grigoriev, M.; Grüber, M.; Kutzbach, L.; et al. Baseline characteristics of climate, permafrost and land cover from a new permafrost observatory in the Lena River Delta, Siberia (1998–2011). Biogeosciences 2013, 10, 2105–2128. [Google Scholar] [CrossRef]
- Smith, L.C.; Pavelsky, T.M. Remote sensing of volumetric storage changes in lakes. Earth Surf. Process. Landforms 2009, 34, 1353–1358. [Google Scholar] [CrossRef]
- Froidefond, J.M.; Lahet, F.; Hu, C.; Doxaran, D.; Guiral, D.; Prost, M.T.; Ternon, J.F. Mudflats and mud suspension observed from satellite data in French Guiana. Mar. Geol. 2004, 208, 153–168. [Google Scholar] [CrossRef]
- Güttler, F.N.; Niculescu, S.; Gohin, F. Turbidity retrieval and monitoring of Danube Delta waters using multi-sensor optical remote sensing data: An integrated view from the delta plain lakes to the western-northwestern Black Sea coastal zone. Remote Sens. Environ. 2013, 132, 86–101. [Google Scholar] [CrossRef]
- Trinh, L.H.; Zablotskii, V.R.; Le, T.G.; Hien Dinh, T.T.; Le, T.T.; Trinh, T.T.; Nga Nguyen, T.T. Estimation of Suspended Sediment Concentration Using Vnredsat–1a Multispectral Data, A Case Study in Red River, Hanoi, Vietnam. Geogr. Environ. Sustain. 2018, 11, 49–60. [Google Scholar] [CrossRef]
- Onderka, M. Correlations between several environmental factors affecting the bloom events of cyanobacteria in Liptovska Mara reservoir (Slovakia)-A simple regression model. Ecol. Modell. 2007, 209, 412–416. [Google Scholar] [CrossRef]
- Härmä, P.; Vepsäläinen, J.; Hannonen, T.; Pyhälahti, T.; Kämäri, J.; Kallio, K.; Eloheimo, K.; Koponen, S. Detection of water quality using simulated satellite data and semi-empirical algorithms in Finland. Sci. Total Environ. 2001, 268, 107–121. [Google Scholar] [CrossRef]
- Doxaran, D.; Froidefond, J.-M.; Castaing, P. A reflectance band ratio used to estimate suspended matter concentrations in sediment-dominated coastal waters. Int. J. Remote Sens. 2002, 23, 5079–5085. [Google Scholar] [CrossRef]
- Wang, J.; Lu, X.; Zhou, Y. Retrieval of suspended sediment concentrations in the turbid water of the Upper Yangtze River using Landsat ETM+. Chin. Sci. Bull. 2007, 52, 273–280. [Google Scholar] [CrossRef]
- Chander, G.; Markham, B.L.; Helder, D.L. Summary of current radiometric calibration coefficients for Landsat MSS, TM, ETM+, and EO-1 ALI sensors. Remote Sens. Environ. 2009, 113, 893–903. [Google Scholar] [CrossRef]
- Chavez, J. Image-Based Atmospheric Corrections-Revisited and Improved. Photogramm. Eng. Remote Sens. 1996, 62, 1025–1036. [Google Scholar]
- Fedorova, I.V.; Makushin, M. Report on the Hydrological Part of the Expedition “Lena-2016”; SPBU: Saint-Petersburg, Russia, 2016; p. 32. (In Russian) [Google Scholar]
- Fleilea, A.E. Suspended Sediment Load Monitoring Along the Mekong River from Satellite Images. J. Earth Sci. Clim. Chang. 2013, 4, 1–6. [Google Scholar] [CrossRef]
- Doxaran, D.; Froidefond, J.M.; Lavender, S.; Castaing, P. Spectral signature of highly turbid waters: Application with SPOT data to quantify suspended particulate matter concentrations. Remote Sens. Environ. 2002, 81, 149–161. [Google Scholar] [CrossRef]
- Petus, C.; Chust, G.; Gohin, F.; Doxaran, D.; Froidefond, J.M.; Sagarminaga, Y. Estimating turbidity and total suspended matter in the Adour River plume (South Bay of Biscay) using MODIS 250-m imagery. Cont. Shelf Res. 2010, 30, 379–392. [Google Scholar] [CrossRef]
- Chu, V.W.; Smith, L.C.; Rennermalm, A.K.; Forster, R.R.; Box, J.E.; Reeh, N. Sediment plume response to surface melting and supraglacial lake drainages on the Greenland ice sheet. J. Glaciol. 2009, 55, 1072–1082. [Google Scholar] [CrossRef]
- Nechad, B.; Ruddick, K.G.; Park, Y. Calibration and validation of a generic multisensor algorithm for mapping of totalsuspended matter in turbid waters. Remote Sens. Environ. 2010, 114, 854–866. [Google Scholar] [CrossRef]
- Wang, J.J.; Lu, X.X.; Liew, S.C.; Zhou, Y. Retrieval of suspended sediment concentrations in large turbid rivers using Landsat ETM+: An example from the Yangtze River, China. Earth Surf. Process. Landforms 2009, 34, 1082–1092. [Google Scholar] [CrossRef]
- Shiklomanov, A.I.; Holmes, R.M.; McClelland, J.W.; Tank, S.E.; Spencer, R.G.M. Arctic Great Rivers Observatory. Discharge Dataset, Version 2021.05.06. Available online: https://www.arcticrivers.org/data (accessed on 15 September 2021).
- Lee, S.; Wolberg, G.; Shin, S.Y. Scattered data interpolation with multilevel B-splines. IEEE Trans. Vis. Comput. Graph. 1997, 3, 228–244. [Google Scholar] [CrossRef]
- Lane, R.R.; Day, J.W.; Shaffer, G.P.; Hunter, R.G.; Day, J.N.; Wood, W.B.; Settoon, P. Hydrology and water budget analysis of the East Joyce wetlands: Past history and prospects for the future. Ecol. Eng. 2016, 87, 34–44. [Google Scholar] [CrossRef]
- Shinkareva, G.L.; Lychagin, M.Y.; Tarasov, M.K.; Pietroń, J.; Chichaeva, M.A.; Chalov, S.R. Biogeochemical specialization of macrophytes and their role as a biofilter in the Selenga delta. Geogr. Environ. Sustain. 2019, 12, 240–263. [Google Scholar] [CrossRef]
- Chalov, S.R.; Prokopeva, K.N. Assessment suspended sediment budget of the Lena River delta based on the remote sensing dataset. Issled. Zemli Iz Kosm. 2021, 3, 19–29. (In Russian) [Google Scholar]
- Debolsky, V.K.; Gritsuk, I.I.; Ionov, D.N.; Maslikova, O.J. Erosion of the frozen riversides of the northern rivers depending on the direction of the coastal slop. Bull. MGSU 2018, 13, 1112–1124. (In Russian) [Google Scholar]
- Dolgopolova, E.N. The role of permafrost in the formation of the hydrological and morphological regime of river mouths in the Arctic Ocean watershed area. Arct. Ecol. Econ. 2018, 48, 70–85. (In Russian) [Google Scholar] [CrossRef]
- Wright, S.A.; Schoellhamer, D.H. Estimating sediment budgets at the interface between rivers and estuaries with application to the Sacramento-San Joaquin River Delta. Water Resour. Res. 2005, 41, W09428. [Google Scholar] [CrossRef]
- Dubinenkov, I.; Flerus, R.; Schmitt-Kopplin, P.; Kattner, G.; Koch, B.P. Origin-specific molecular signatures of dissolved organic matter in the Lena Delta. Biogeochemistry 2015, 123, 1–14. [Google Scholar] [CrossRef][Green Version]
- Passalacqua, P.; Lanzoni, S.; Paola, C.; Rinaldo, A. Geomorphic signatures of deltaic processes and vegetation: The Ganges-Brahmaputra-Jamuna case study. J. Geophys. Res. Earth Surf. 2013, 118, 1838–1849. [Google Scholar] [CrossRef]
- Perignon, M.; Adams, J.; Overeem, I.; Passalacqua, P. Dominant process zones in a mixed fluvial–tidal delta are morphologically distinct. Earth Surf. Dyn. 2020, 8, 809–824. [Google Scholar] [CrossRef]
- Heiler, G.; Hein, T.; Schiemer, F.; Bornette, G. Hydrological connectivity and flood pulses as the central aspects for the integrity of a river-floodplain system. Regul. Rivers Res. Manag. 1995, 11, 351–361. [Google Scholar] [CrossRef]
- Pietroń, J.; Chalov, S.R.; Chalova, A.S.; Alekseenko, A.V.; Jarsjö, J. Extreme spatial variability in riverine sediment load inputs due to soil loss in surface mining areas of the Lake Baikal basin. Catena 2017, 152, 82–93. [Google Scholar] [CrossRef]
- Szczuciński, W.; Jagodziński, R.; Hanebuth, T.J.J.; Stattegger, K.; Wetzel, A.; Mitręga, M.; Unverricht, D.; Van Phach, P. Modern sedimentation and sediment dispersal pattern on the continental shelf off the Mekong River delta, South China Sea. Glob. Planet. Chang. 2013, 110, 195–213. [Google Scholar] [CrossRef]
- Chalov, S.; Thorslund, J.; Kasimov, N.; Aybullatov, D.; Ilyicheva, E.; Karthe, D.; Kositsky, A.; Lychagin, M.; Nittrouer, J.; Pavlov, M.; et al. The Selenga River delta: A geochemical barrier protecting Lake Baikal waters. Reg. Environ. Chang. 2017, 17, 2039–2053. [Google Scholar] [CrossRef]
- Allison, M.A.; Kuehl, S.A.; Martin, T.C.; Hassan, A. Importance of flood-plain sedimentation for river sediment budgets and terrigenous input to the oceans: Insights from the Brahmaputra-Jamuna River. Geology 1998, 26, 175. [Google Scholar] [CrossRef]
- Bomer, E.J.; Wilson, C.A.; Datta, D.K. An Integrated Approach for Constraining Depositional Zones in a Tide-Influenced River: Insights from the Gorai River, Southwest Bangladesh. Water 2019, 11, 2047. [Google Scholar] [CrossRef]
- Karthe, D.; Chalov, S.; Moreido, V.; Pashkina, M.; Romanchenko, A.; Batbayar, G.; Kalugin, A.; Westphal, K.; Malsy, M.; Flörke, M. Assessment of runoff, water and sediment quality in the Selenga River basin aided by a web-based geoservice. Water Resour. 2017, 44, 399–416. [Google Scholar] [CrossRef]
- Pietroń, J.; Nittrouer, J.A.; Chalov, S.R.; Dong, T.Y.; Kasimov, N.; Shinkareva, G.; Jarsjö, J. Sedimentation patterns in the Selenga River delta under changing hydroclimatic conditions. Hydrol. Process. 2018, 32, 278–292. [Google Scholar] [CrossRef]
- Korytny, L.M.; Il’icheva, E.A.; Pavlov, M.V.; Amosova, I.Y. Hydrologo-morphological approach to regionalization of the Selenga river basin. Geogr. Nat. Resour. 2012, 33, 212–217. [Google Scholar] [CrossRef]
- Dong, T.Y.; Nittrouer, J.A.; Il’icheva, E.; Pavlov, M.; McElroy, B.; Czapiga, M.J.; Ma, H.; Parker, G. Controls on gravel termination in seven distributary channels of the Selenga River Delta, Baikal Rift basin, Russia. Geol. Soc. Am. Bull. 2016, 128, 1297–1312. [Google Scholar] [CrossRef][Green Version]
- Bolshiyanov, D.; Makarov, A.; Savelieva, L. Lena River delta formation during the Holocene. Biogeosciences 2015, 12, 579–593. [Google Scholar] [CrossRef]
- Mariotti, G.; Fagherazzi, S. Wind waves on a mudflat: The influence of fetch and depth on bed shear stresses. Cont. Shelf Res. 2013, 60, S99–S110. [Google Scholar] [CrossRef]
- Battjes, J.A.; Labeur, R.J. FloodWaves in Rivers. In Unsteady Flow in Open Channels; Cambridge University Press: Cambridge, UK, 2017; pp. 143–156. [Google Scholar]
- Rutschmann, P.; Hager, W.H. Diffusion of floodwaves. J. Hydrol. 1996, 178, 19–32. [Google Scholar] [CrossRef]
- Osadchiev, A.; Silvestrova, K.; Myslenkov, S. Wind-Driven Coastal Upwelling near Large River Deltas in the Laptev and East-Siberian Seas. Remote Sens. 2020, 12, 844. [Google Scholar] [CrossRef]
- Shakhova, N.; Semiletov, I.; Bel’cheva, N. The great Siberian rivers as a source of methane on the Russian Arctic shelf. Dokl. Earth Sci. 2007, 415, 734–736. [Google Scholar] [CrossRef]
- Tessier, A.; Cardigan, R.; Dubreul, B.; Rapin, F. Partioning of zinc between the water column and the oxic sediments in lakes. Geochim. Cosmochim. Acta 1989, 11, 109–116. [Google Scholar]
- Riba, I.; DelValls, T.Á.; Forja, J.M.; Gómez-Parra, A. The influence of pH and salinity on the toxicity of heavy metals in sediment to the estuarine clam ruditapes philippinarum. Environ. Toxicol. Chem. 2004, 23, 1100. [Google Scholar] [CrossRef] [PubMed]
- Zhang, Q.; Manzoni, S.; Katul, G.; Porporato, A.; Yang, D. The hysteretic evapotranspiration-Vapor pressure deficit relation. J. Geophys. Res. Biogeosci. 2014, 119, 125–140. [Google Scholar] [CrossRef]
- Magritsky, D.V.; Frolova, N.L.; Agafonova, S.A.; Sazonov, A.A.; Efimov, V.A.; Vasilenko, A.N. Current Hydrological State of the Mouth of the Kolyma River Based on the Materials of the Summer Expedition in 2019. In Proceedings of the IV All-Russian Conference “Hydrometeorology and Ecology: Achievements and Prospects of Development”/MGO Named after L. N. Karlin; Himizdat: Saint Petersburg, Russia, 2020; pp. 243–247. (In Russian) [Google Scholar]
- Kulmala, M.; Lappalainen, H.; Petäjä, T.; Kerminen, V.-M.; Viisanen, Y.; Matvienko, G.; Melnikov, V.; Baklanov, A.; Bondur, V.; Kasimov, N.; et al. Pan-Eurasian experiment (PEEX) program: Grand challenges in the arctic-boreal context. Geogr. Environ. Sustain. 2016, 9, 5–18. [Google Scholar] [CrossRef]
- Georgiadi, A.G.; Koronkevich, N.I.; Milyukova, I.P.; Barabanova, E.A. Integrated projection for runoff changes in large Russian river basins in the XXI century. Geogr. Environ. Sustain. 2016, 9, 38–46. [Google Scholar] [CrossRef][Green Version]


| Delta | Deltas Area, km2 | Catchment Size, km2 | Average Discharge at the Delta Topset, m3 s−1 (for Period) | Peak Discharge at the Delta Topset, m3 s−1 (Date) | Number of Main Distributaries | Gauging Station (Distance to the Delta Topset, km) |
|---|---|---|---|---|---|---|
| Selenga | 680 [30] | 447,000 [30] | 865 (1934–2015) [22] | 6420 (1993) [22] | 7 | Mostovoy (150 km) |
| Upper Angara | 400 [31] | 21,400 [31] | 269 (1946–2016) [31] | 2 | Verkhnyaya Zaimka (10 km) | |
| Kolyma | 350 [32] | 526,000 [32] | 3210 (1977–2004) [32] | 42,900 (1999) [32] | 2 | Kolymskoe (150 km) |
| Lena | 32,000 [33] | 2,430,000 [33] | 16,800 (1935–2005) [32] | 220,000 (1989) [32] | 4 | Kyusyur (380 km) |
| Delta | Equation | Number and Period of Images |
|---|---|---|
| Selenga | R = 0.87 | 82 images for the period from 1989 to 2015 |
| Upper Angara | R = 0.84 | 87 images for the period from 1986 to 2018 |
| Kolyma | R = 0.79 | 92 images for the period from 1999 to 2020 |
| Lena | R = 0.84 | 43 images for the period from 2000 to 2020 |
| Delta | ΔS < −20% | −20% < ΔS < 0% | 0% < ΔS < 20% | 0% < ΔS < 20% | |
|---|---|---|---|---|---|
| Selenga | 13/5.4 | 184/76.0 | 34/14.0 | 11/4.6 | |
| Upper Angara | 91/52.3 | 60/34.5 | 10/5.7 | 13/7.5 | |
| Lena | all distributaries | 24/23.8 | 34/33.6 | 23/22.8 | 20/19.8 |
| distributaries 1,2 | 5/8.9 | 14/25.0 | 21/37.5 | 16/28.6 | |
| distributaries 3,4 | 19/42.3 | 20/44.5 | 2/4.4 | 4/8.8 | |
| Kolyma | 5/5.6 | 18/20.0 | 40/44.4 | 27/30.0 | |
Publisher’s Note: MDPI stays neutral with regard to jurisdictional claims in published maps and institutional affiliations. |
© 2021 by the authors. Licensee MDPI, Basel, Switzerland. This article is an open access article distributed under the terms and conditions of the Creative Commons Attribution (CC BY) license (https://creativecommons.org/licenses/by/4.0/).
Share and Cite
Chalov, S.; Prokopeva, K.; Habel, M. North to South Variations in the Suspended Sediment Transport Budget within Large Siberian River Deltas Revealed by Remote Sensing Data. Remote Sens. 2021, 13, 4549. https://doi.org/10.3390/rs13224549
Chalov S, Prokopeva K, Habel M. North to South Variations in the Suspended Sediment Transport Budget within Large Siberian River Deltas Revealed by Remote Sensing Data. Remote Sensing. 2021; 13(22):4549. https://doi.org/10.3390/rs13224549
Chicago/Turabian StyleChalov, Sergey, Kristina Prokopeva, and Michał Habel. 2021. "North to South Variations in the Suspended Sediment Transport Budget within Large Siberian River Deltas Revealed by Remote Sensing Data" Remote Sensing 13, no. 22: 4549. https://doi.org/10.3390/rs13224549
APA StyleChalov, S., Prokopeva, K., & Habel, M. (2021). North to South Variations in the Suspended Sediment Transport Budget within Large Siberian River Deltas Revealed by Remote Sensing Data. Remote Sensing, 13(22), 4549. https://doi.org/10.3390/rs13224549