Article

Earthquake Vulnerability Assessment for Urban Areas Using an ANN and Hybrid SWOT-QSPM Model

1
Faculty of Built Environment & Surveying, Universiti Teknologi Malaysia, Skudai 81310, Johor, Malaysia
2
Geoscience Platform Division, Korea Institute of Geoscience and Mineral Resources (KIGAM), 124, Gwahak-ro, Yuseong-gu, Daejeon 34132, Korea
3
Department of Geophysical Exploration, Korea University of Science and Technology, 217 Gajeong-ro, Yuseong-gu, Daejeon 34113, Korea
4
Department of Urban Planning and Land Management, Institute of Geodesy and Geoinformation (IGG), University of Bonn, Nußallee 1, 53115 Bonn, Germany
5
School of Geography and Sustainable Communities, University of Wollongong, Northfields Avenue, Wollongong, NSW 2522, Australia
6
Centre for Ecosystem Science, University of New South Wales, Sydney, NSW 2052, Australia
7
Department of Ecosystem Management, University of New England, Armidale, NSW 2351, Australia
8
Department of Geomatics Engineering, Faculty of Civil Engineering and Transportation, University of Isfahan, Isfahan 81746-73441, Iran
9
Institute of Oceanography and Environment (INOS), Universiti Malaysia Terengganu (UMT), Kuala Nerus 21030, Terengganu, Malaysia
10
Department of Civil Engineering, Sharif University of Technology, Azadi Ave, Tehran 11365-11155, Iran
11
The Centre for Advanced Modelling and Geospatial Information Systems (CAMGIS), Faculty of Engineering and Information Technology, University of Technology Sydney, Ultimo, NSW 2007, Australia
12
Center of Excellence for Climate Change Research, King Abdulaziz University, P.O. Box 80234, Jeddah 21589, Saudi Arabia
13
Earth Observation Centre, Institute of Climate Change, Universiti Kebangsaan Malaysia (UKM), Bangi 43600, Selangor, Malaysia
*
Author to whom correspondence should be addressed.
Remote Sens. 2021, 13(22), 4519; https://doi.org/10.3390/rs13224519
Submission received: 9 September 2021 / Revised: 4 November 2021 / Accepted: 5 November 2021 / Published: 10 November 2021

Abstract

:
Tabriz city in NW Iran is a seismic-prone province with recurring devastating earthquakes that have resulted in heavy casualties and damages. This research developed a new computational framework to investigate four main dimensions of vulnerability (environmental, social, economic and physical). An Artificial Neural Network (ANN) Model and a SWOT-Quantitative Strategic Planning Matrix (QSPM) were applied. Firstly, a literature review was performed to explore indicators with significant impact on aforementioned dimensions of vulnerability to earthquakes. Next, the twenty identified indicators were analyzed in ArcGIS, a geographic information system (GIS) software, to map earthquake vulnerability. After classification and reclassification of the layers, standardized maps were presented as input to a Multilayer Perceptron (MLP) and Self-Organizing Map (SOM) neural network. The resulting Earthquake Vulnerability Maps (EVMs) showed five categories of vulnerability ranging from very high, to high, moderate, low and very low. Accordingly, out of the nine municipality zones in Tabriz city, Zone one was rated as the most vulnerable to earthquakes while Zone seven was rated as the least vulnerable. Vulnerability to earthquakes of residential buildings was also identified. To validate the results data were compared between a Multilayer Perceptron (MLP) and a Self-Organizing Map (SOM). The scatter plots showed strong correlations between the vulnerability ratings of the different zones achieved by the SOM and MLP. Finally, the hybrid SWOT-QSPM paradigm was proposed to identify and evaluate strategies for hazard mitigation of the most vulnerable zone. For hazard mitigation in this zone we recommend to diligently account for environmental phenomena in designing and locating of sites. The findings are useful for decision makers and government authorities to reconsider current natural disaster management strategies.

1. Introduction

Natural disasters have resulted in significant human and economic losses worldwide [1,2,3,4,5,6]. Calamities such as earthquakes are no longer considered mere natural phenomena but the outcome of multifaceted interactions between human society and hazardous events [7]. At the turn of the last century, numerous scholars reported uneven global distributions of natural disasters and their impacts [8,9]. In this context the concept of vulnerability emerges as an inherent difference in hazard susceptibility which predicts potential loss of life, damage to infrastructure, and adverse economic effects [10]. Differences in vulnerability cause the noted uneven distributions in the impacts and aftermaths of natural disasters [11]. As a result, vulnerability has become fundamental to global studies on environmental change and sustainability science undertaken by several research groups [12,13,14]. Studies on vulnerability assessments are crucial to developing adaptation strategies and implementation policies [15].
In the last two decades, the term ‘vulnerability’ has become a critical and widely used concept for hazard research and developing appropriate mitigation strategies at the local, national, and international scale [16,17]. However, despite some scientific progress, the application of vulnerability science remains a challenge [18,19], in particular because the vulnerability of humanity to natural disasters such as earthquakes is influenced by human behavior. Lowering the vulnerability in urban spaces can eliminate the physical and economic costs of natural disasters as it increases the potential of physical and socioeconomic systems to resist [20,21,22]. High vulnerability of an urban environment to earthquakes is typically exacerbated by various factors, namely urbanization, population growth, uncontrolled settlement in extremely seismic areas, and elevated exposure to various risk indicators. Other detrimental factors include poor building standards and dilapidated social infrastructure, resulting in inadequate disaster management [23,24]. Studies to date typically focused on assessing vulnerability based on a risk assessment, which is influenced by environmental, social, economic, and physical conditions [25,26,27]. The aim of such studies is to predict the magnitude of earthquakes [28,29] or aspects of structural and geological engineering [30,31]. Largely overlooked, however, are the significant impacts on social structure, economic development, and cultural heritage of urban areas.
Therefore, a sound assessment method for urban vulnerability should include socio-economic, environmental, and physical factors of vulnerability that help decision-makers to prioritize interventions or steer future spatial developments. Although numerous methods exist to assess vulnerability and earthquake hazard mitigation, there is no consensus on the most effective approach. As for soft computing techniques, different computing tools have been adopted to detect hazards and assess damaged buildings such as the improved rapid assessment of earthquake hazard-safety of structures via artificial neural networks [32]. Numerous scholars have also paid attention to the use of machine learning (ML) methods to predict damage via a Support Vector Machine (SVM) model [33]; multicriteria decision making [34]; application of support vector machine modeling for the rapid evaluation of seismic hazard of existing buildings [35]; along with fuzzy systems (FSs) [36]. Further available are soft computing techniques for the rapid evaluation of visual safety and a damage classification of existing buildings [37]; a prototype for machine learning-based earthquake hazard safety assessment of structures by using a smartphone app [38]; assessing building damage from xBD satellite imagery datasets [39,40]; a Convolutional Neural Network (CNN) that features an automated assessment of building damage based on remote sensing and image analysis [41]. A vulnerability assessment of urban spaces to earthquake hazard using the catastrophe theory in the context of geographic information system has also been conducted [42]. The detailed geological, geodetical, geotechnical and geophysical parameters of the region of the North Tabriz Fault were combined using an Analytic Hierarchy Process (AHP) and a deterministic near-field earthquake of magnitude 7 was simulated [43]. This simulation provides differing intensities of ground shaking in the different districts of Tabriz. In another study, a GIS application of the Karmania Hazard Model (KHM) for earthquake scenario development and disaster management was conducted [44]. This model draws on datasets integrated and manipulated in a relational database management system to simulate an earthquake with specific characteristics relating to magnitude, depth, distance, time and date.
However, there are still limited studies using ANN and hybrid models to handle the EVM and hazard mitigation strategies in urban areas. Moreover, there is a significant challenge for remotely sensed imagery analysis due to the highly imbalanced class distribution [45,46]. In addition, none of the existing methods are holistic and simultaneously account for socioeconomic, physical, and environmental factors. The results depend on the amount of data available as well as the ability of the assessor to interpret the data [47,48]. There is also no comprehensive study to provide essential information on the strengths, weaknesses, opportunities, and threats (SWOT) for effective hazard mitigation and disaster management planning. The definition and formulation of urban earthquake vulnerability and catastrophe risk mitigation involves an integrated and interdisciplinary approach to consider a broad variety of vulnerability factors [49]. Therefore, we posit that an integrated approach is needed for the assessment of urban vulnerability to earthquakes. The methods that we employ in our study aim at improving the evaluation and prediction of earthquake vulnerability through scientific analysis of Earthquake Vulnerability Maps (EVMs) and by applying techniques such as Multicriteria Analysis and Fuzzy Set Theory using supporting tools like GIS and IDRISI.
In this study, we firstly used Artificial Neural Networks (ANN) as an adequate computational model to address the ambiguity innate to earthquake phenomena [6,50]. ANN systems successively process data from interconnected modules that respond to inputs by variables that can be altered, such as weights, thresholds and functions for mathematical transition [51]. In a bracket, each unit manages input from other units and then transfers signals to another. This makes ANN an adequate choice for grappling with problems that involve large data sets and dynamic nonlinear interactions with many different solutions. In data sets where the program formula is unable to solve the problem, ANN can also delineate complex patterns [52]. Furthermore, reliable predictions are possible even for uncharted data [53,54]. Therefore, ANN has the potential to create risk maps resulting from dynamic encounters with excellent precision. In order to build an ANN framework based on chosen metrics, it must be qualified. For the ANN preparation, an adequate set of training parameters is critical [55]. The most imminent limitation for ANN is that it expects the training algorithm and network architecture to be immoderate. Unfortunately, there are no rules to describe both network functions so far. However, the ideal and optimum network can only be sought by deploying a trial and error process [56,57]. ANN on its own is ineffective when applied to earthquake vulnerability problems and it has therefore been highly recommended by researchers to apply ANN with hybrid models. ANN can also determine complicated patterns in sets of data which computational formulas are unable to solve [38,39,40,41,42]. Furthermore, it provides reliable predictions even on noisy and uncertain data [40,41]. Therefore, ANN has the capacity to produce classified vulnerability maps arising from complex interactions with high accuracy. To develop an ANN structure based on selected research indicators, it needs to be trained. An appropriate choice of training parameters is necessary for training ANN [42,43,44]. The single most imperative limitation of an ANN lies in its efficiency, which relies heavily on the training algorithm and network architecture. Regrettably, to date, no guidelines exist to define both features of the network. It is feasible to find the ideal and optimal network just by utilizing a trial and error procedure [45,46,47,48,49,50].
Secondly, we used a Strengths, Weaknesses, Opportunities, and Threats (SWOT) analysis which helps with the development of hazard reduction strategies. A SWOT analysis constitutes a structured planning method that helps summarize the most important factors for evaluating the characteristic of earthquake vulnerability. However, in its calculation and estimation measures, the SWOT approach reveals certain limitations. The magnitude factor is not quantified in a traditional SWOT analysis to assess the influence of each factor on the planned strategy [58]. Alternatively, the Quantitative Strategic Planning Matrix (QSPM) can solve this problem and also prioritize strategies. Hence, we chose a QSPM in this study. The outlined integrated approaches can potentially help with prioritizing management of highly vulnerable municipality zones and select adequate mitigation strategies, and planning policies.
Accordingly, the core question of the current study that reflects the gap in the literature is how to measure vulnerabilities for the development of Earthquake Vulnerability Maps (EVM) using an ANN and Hybrid SWOT-QSPM Model. To our knowledge, no research has been conducted using an ANN and Hybrid SWOT-QSPM Model for EVM development of urban areas. The specific objectives of this study include: (1) to develop ANN models to provide EVM and to identify the least and most vulnerable municipality zones of Tabriz city; (2) to identify Residential Building Vulnerability (RBV) in different municipality zones of Tabriz city through a comparative analysis between RBV and Self-Organizing Maps (SOM); (3) to develop a hybrid SWOT analysis and QSPM model to evaluate inherent and exterior factors, and to rank possible hazard mitigation strategies based on priority. To date there are no published applications of ANN and SWOT–QSPM for the assessment of urban vulnerability to earthquakes.
The paper is organized as follows: Section 2 presents the methods and a description of the study area. The results are described in Section 3. Section 4 presents the results and discusses the methodology used in the hybrid models. Finally, conclusions are drawn in Section 5.

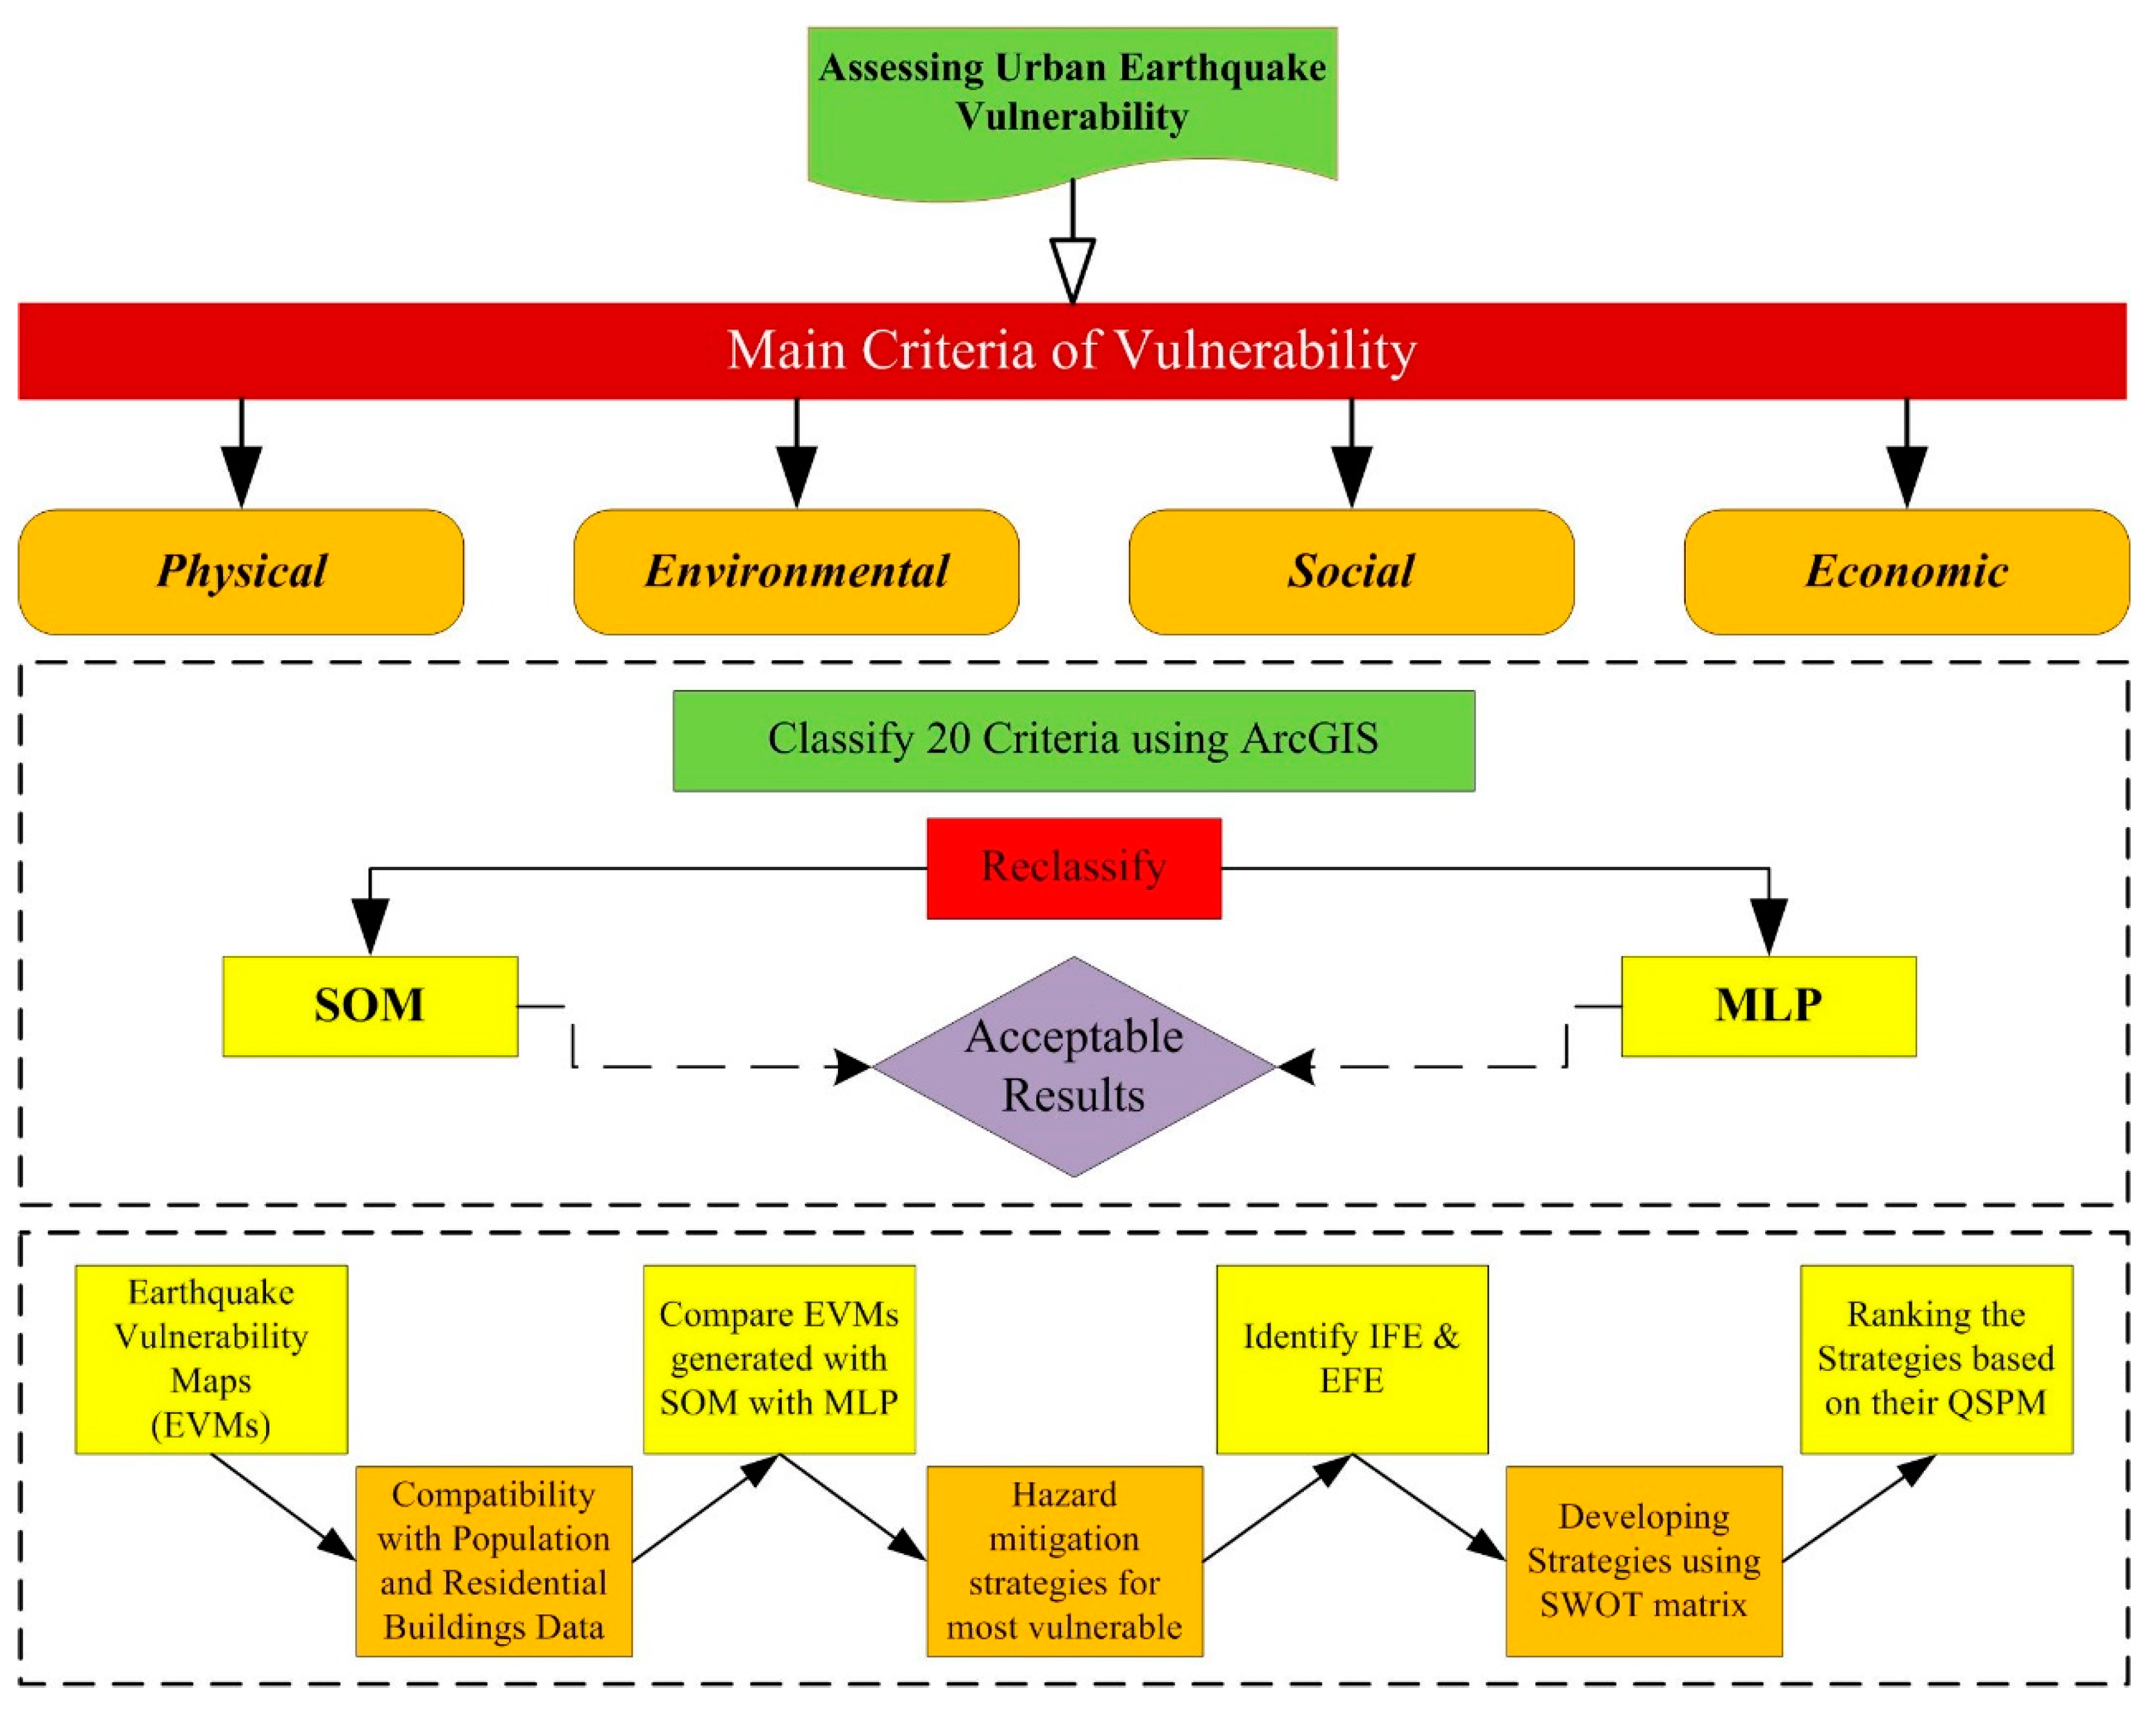
2. Materials and Methods
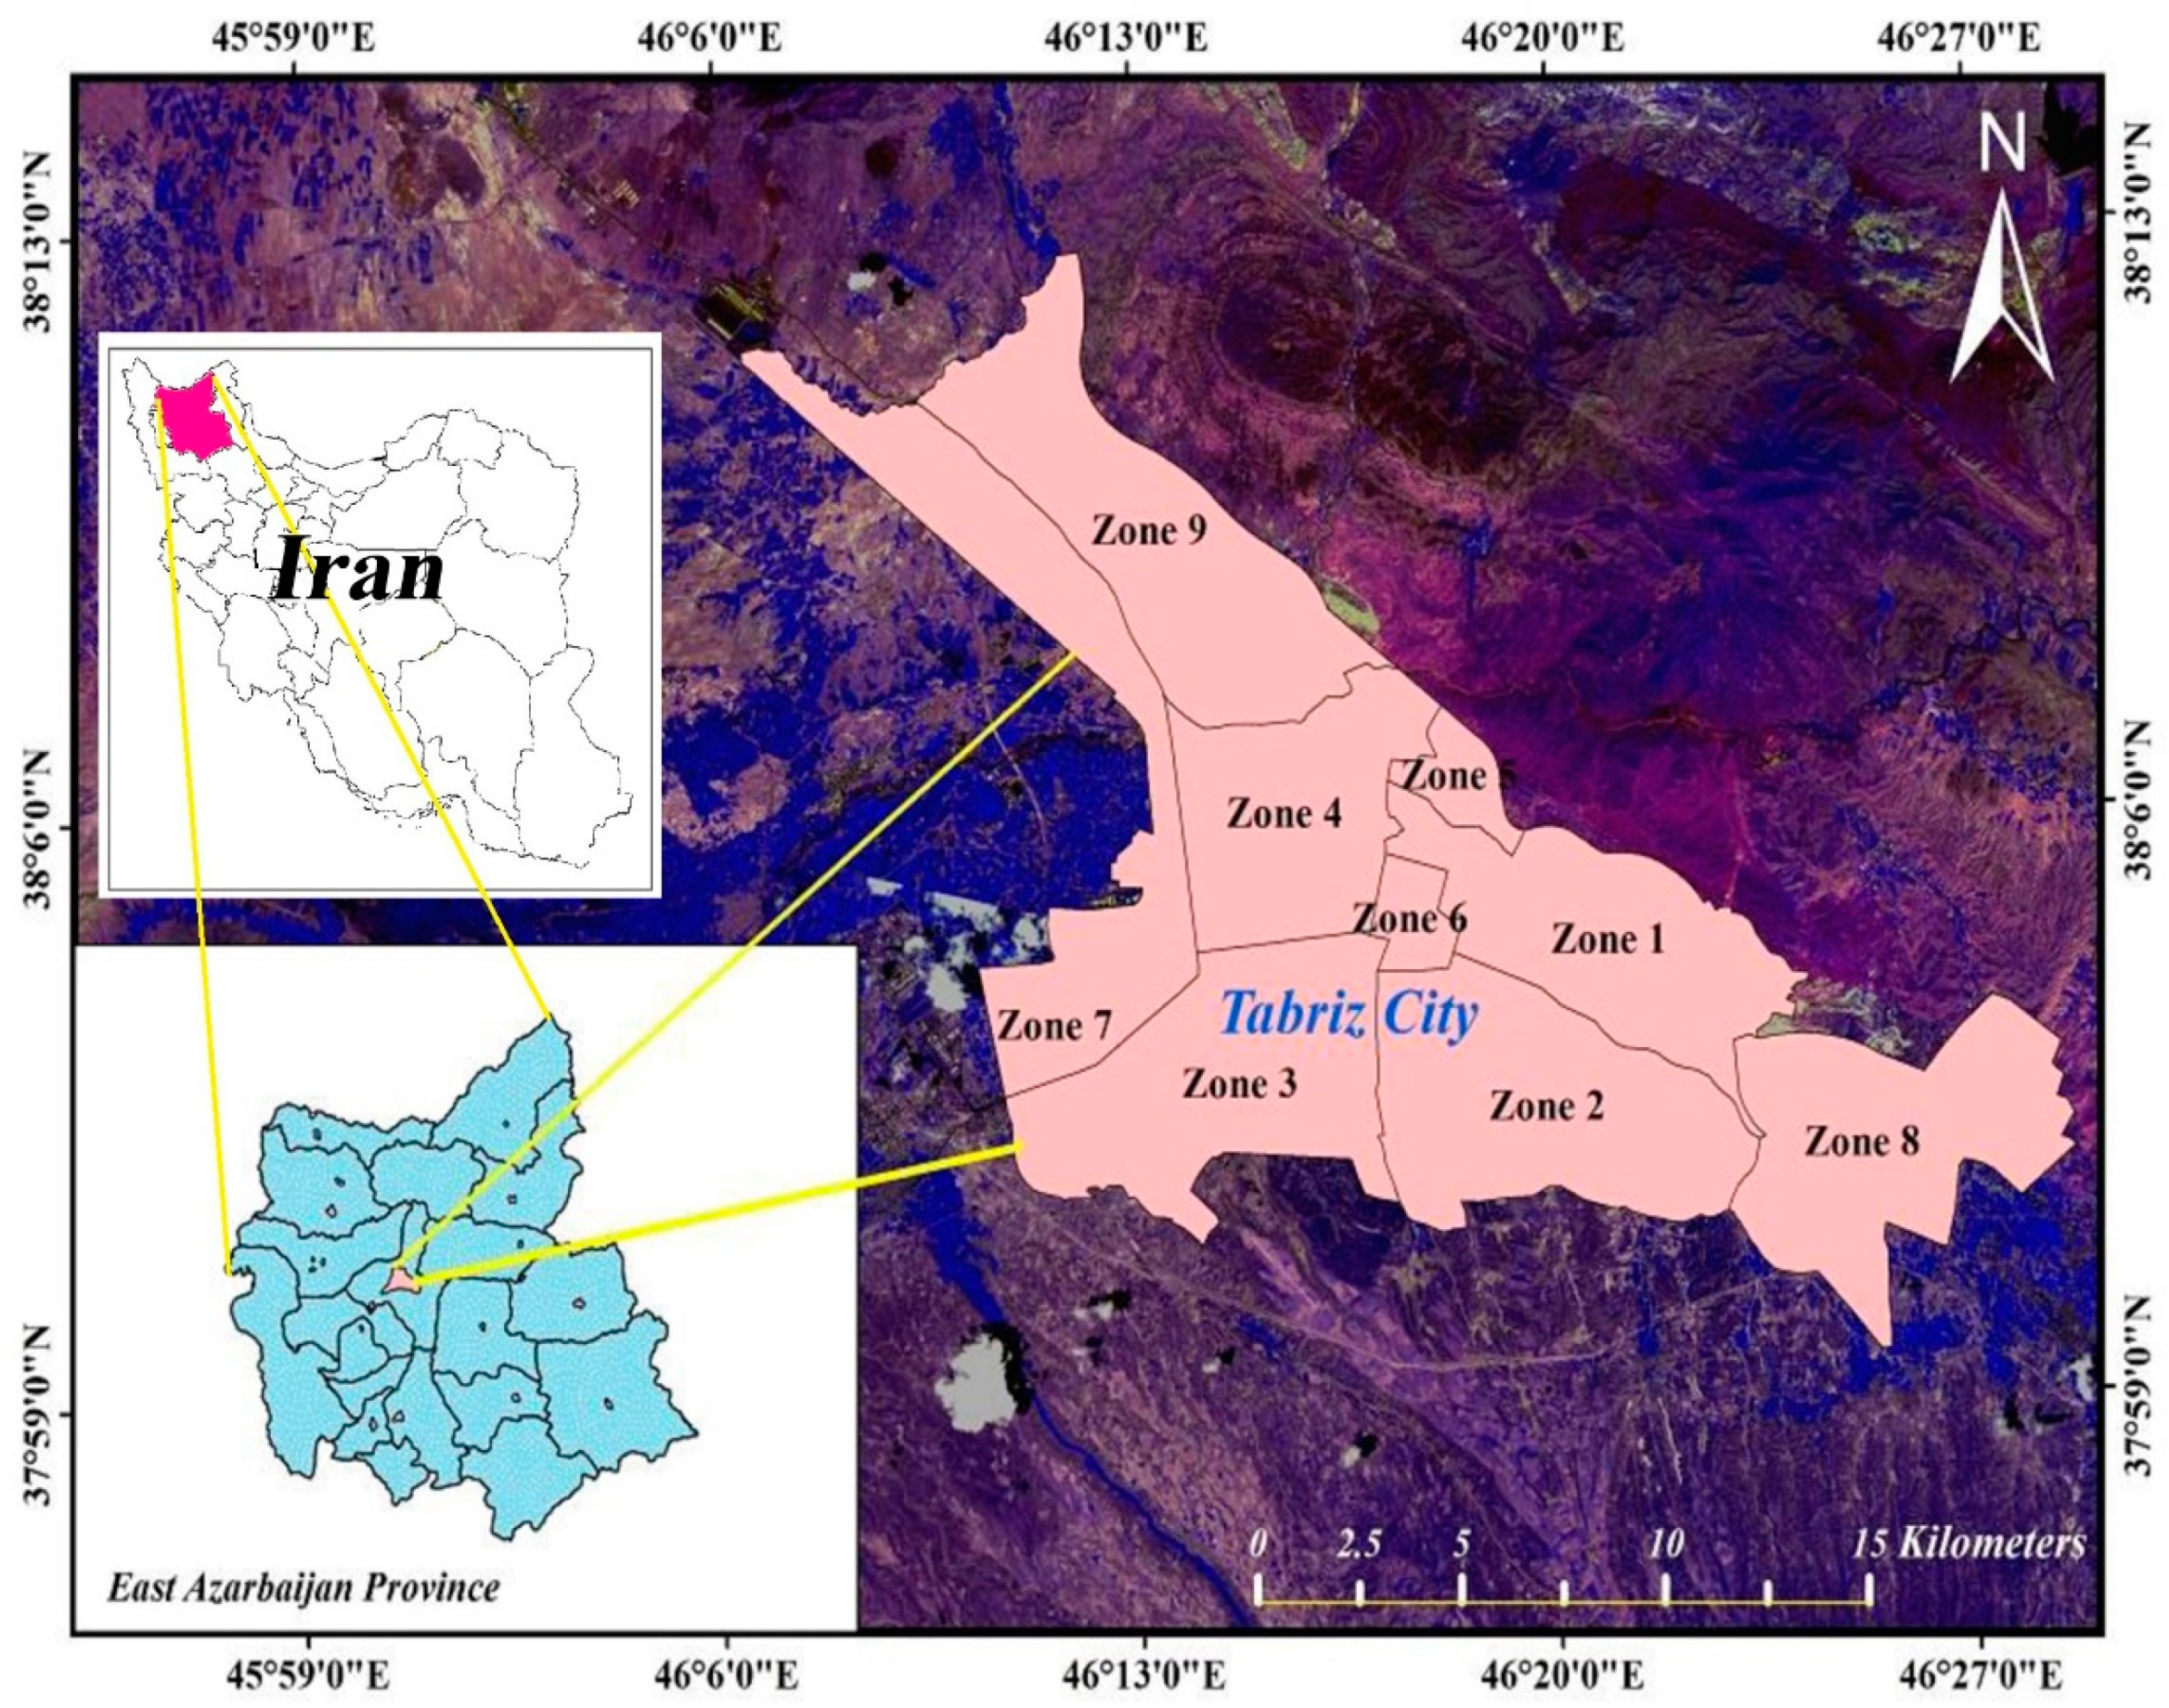
2.1. Study Area

The city of Tabriz in NW Iran was selected for the case study due to its location in a seismic-prone area with consistently catastrophic earthquakes. Metropolitan Tabriz with its over 1.5 million residents consists of nine municipal zones (Figure 1). It is Iran’s second largest city in terms of land area and the old precincts cover approximately 25 km2 [59]. The North Tabriz Fault (NTF), occupying an area of 150 km2, stretches from the Caucasus in the north to the Zagros Mountains in the south. The whole area is surrounded by seismic activity and deep-rooted deformation which is one of the prominent tectonic features in western Iran and eastern Turkey. The NTF is the dominant tectonic structure in the immediate neighborhood of Tabriz [60,61]. While the NTF has been seismically inactive over the last few years, historically, major earthquakes have been triggered by the fault. Three major earthquakes shattered the NTF arrangement and the nearby reverse faults ranging from the southeast to the northwest over the course of 65 years.
These earthquakes included the Shebli in 1721 (M ~ 7.3) which occurred southeast of the NTF rupturing a surface length of greater than 35 km; then the Tabriz in 1780 (M ~ 7.4) affecting the northwestern area of the NTF, causing a surface fissure length of approximately 42 km; and finally the Marand-Mishu in 1786 (M ~ 6.3) at the Mishu reverse fault and the Sufian segment. Seismologists expect that a major earthquake could take place in Tabriz in the foreseeable future according to probabilistic and deterministic evaluations. Therefore, hazard mitigation studies for reducing the catastrophic devastation from such an event are indispensable [62].

2.2. Data Acquisition, Classification and Standardization

The most critical part for generating vulnerability maps is to select indicators capturing the dissimilarity of the study area [63,64,65,66,67,68]. It is also the most time-consuming aspect because of the need to prepare a GIS spatial database for subsequent use in the hazard evaluation of earthquakes and for input into the simulation of earthquake scenarios. A literature review and a survey of experts were conducted that helped identify 44 indicators for investigating urban susceptibility to earthquakes in Tabriz (Appendix A). Experts surveyed in this study included scientists from different private and governmental organizations in Tabriz. The experts were asked to rank the identified earthquake vulnerability indicators in order of importance and similarity from most to least meaningful for Tabriz [69]. The significance index of the individual indicators was computed based on equation 1. The Relative Value Index (RII) varies from 0 to 1 and fewer than 0.50 RII indicators have been omitted from the study as highlighted with red color [70,71,72], this was the case for 24 indicators. The remaining indicators (RII ≥ 0.50) were ranked as almost equally important for determining the vulnerability to earthquakes of Tabriz [50,51] (Appendix B).
Relative   Importance   Index   ( R ) = i = 1 5 g i A × N
where,
  • g: weight given by the Relative Importance Index (R) of experts for each indicator, ranging from 1 to 5;
  • A: maximum weight, in this case A = 5;
  • N: number of experts.
To categorize municipal zones into five different vulnerability classes, various default options exist in the GIS software such as using equal intervals, manual or natural breaks, or via statistical considerations [73]. To obtain five distinct vulnerability classes, the manual classifier approach was applied. Initially, a classification was established using all the layers necessary for building scale, residential building presence, building floors, materials, building efficiency, building age, commercial building presence, educated people, working people, household, unemployed people, inhabitants, and building block size. Other indicators used for the classification included the distance to a particular locale described through the presence of a road network, further the presence of faults, service centers, relief centers and open spaces. All layers were classified into five classes except the slope that was presented as a percentage, and the geology. In order to measure density and distance, respectively, a kernel density function and a Euclidean function were used. The Euclidean function was applied with a pixel size of 10 × 10 m. However, to calculate the slope, we created a digital elevation model (DEM) from contours using 1:50,000 topographic sheet of Tabriz. The classification was done on the basis of percentages. Measurements from cross-sectional profiles of the topography of Tabriz were used to define zones from which elevation data were extracted for the DEM. The uniform input layers derived from this GIS technique are used in this study. Classified input layers resulting from the GIS processing of the earthquake vulnerability indicators included: (a) density of buildings by age; (b) distance to emergency facilities; (c) distance to the fault; (d) building floor density; (e) geology of Tabriz; (f) household density; (g) density of literate people; (h) density of buildings by size; (i) density of buildings by material; (j) population density; (k) distance to open space; (l) density of employed people; (m) distance to a relief center; (n) density of residential buildings; (o) distance to road networks; (p) density of building by quality; (q) overall building density; (r) commercial building density; (s) density of unemployed people; (t) percent of slope.
Experts analyzed the geological map according to the rock texture, rock constituents, type of surface, water permeability, and the occurrence of faults and fractures. Using the function to raster, vector to raster or polygon to raster methods in ArcGIS, the twenty qualitative or quantitative metrics were transformed. Each indicator was standardized as it has a definite value for the range scale. Finally, indicators were weighted based on how strongly they influence earthquake vulnerability. Twenty layers were standardized which offers membership significance based on each criterion’s utility.

2.3. Processing Layers in the IDRISI Software Using SOM for Supervised Classification

The standard layers created in the preceding stage were transferred to the IDRISI software environment. The comparable range of all layers is the most critical factor at this stage. The raster calculator was introduced for this purpose. In order to use a Self-Organizing Map (SOM), the maps that were now similar were then entered into the IDRISI program with ENVI format. The different stages of the model development are provided in Figure 2. The main criteria of vulnerability are divided into four sections. In the middle of Figure 2, the methods are noted to develop EVM.

2.4. Methods

2.4.1. Self-Organizing Map (SOM)

In 1982, self-organizing maps were introduced [74]. The concept was to use a small number of samples to represent a large volume of data. SOM is an unsupervised neural network that can put itself in order. This consists of a dimensional reference space and a dimensional output space. The plan is generally a 2-D structure showing a weight vector associated with each unit of the map.
N i j = { w i j ; 1 i L , 1 j M }
where Nij represents a 2-D grid of the map also commonly referred to as the neuron, and wij represents the weight vector, also known as a prototype vector, allotted to the (i,j)-th unit of the SOM structure. L and M form the rows and column numbers.
The formation of the SOM consists of three stages: (1) competition, (2) synaptic adaption, and (3) cooperation which we describe in the following.

Competition

The best matching unit (BMU) is calculated in this section based on the Euclidean spacing between the weight vector and that of the training input arrangements. The weight of the neurons is identified as gij = {g1, g2, …, gd} where d is defined as the weight vectors dimension. For example, in this case it is nine according to the number of features or elements. The elements, specified as discrete wavelet-transformed CA, CD, CV, and CH, the pixel cell value (PV), standard deviation (STD), gradient (GXY), energy (ERG) and variance (VAR), are utilized to form the feature vectors. The training configuration vector set in this study is specified as T = {Vp, 1 ≤ p ≤ n}, where Vp represents the p’th training feature vector whereas n stands for the total training pattern vectors, which in this case is 10,000. During training, the SOM uses the Euclidean distance to determine the grid in its map for which the weight is closest to the Vp. The best matching unit, hereafter defined as BMU of Vp and indicated as Wm, is the neuron in the architecture of SOM that is closest to the Vp. The Euclidean distance and the BMU are calculated as follows:
d i s t = V p W m
B M U = min i j { V p W m }

Synaptic Adaption

The BMU and surrounding neighbors have their weights gij updated with a step of t and will be presented by
g i j ( t + 1 ) = w i j ( o l d ) + α ( t ) θ ( t ) { V ( t ) W ( t ) }
The old g is the current g for a node, plus a portion of the old weight and the input of vector (t) depending on the remoteness from the BMU. α(t) is the rate of learning, an exponential decaying process which ensures the convergence of the SOM as follows.
α ( t ) = α 0 . exp ( t λ )

Cooperation

Ideally, the winning neuron weight must be changed after discovering the BMU. However, in practice the BMU and its neighbors would then be updated by Equation (2),
θ ( t ) = exp ( d 2 2 σ 2 ( t ) )
where θ(t) is defined as the topological neighborhood center on BMU and where d represents the position of BMU in the unit σ of SOM. The latter is a function of exponential decay that diminishes on each iteration until finally the neighborhood equals BMU. The topological neighbors’ amplitude reduces monotonically with the growing lateral distance as in Equation (8).
σ ( t ) = σ 0 . exp ( t λ )
SOM networks have the ability to analyze complicated multivariate data from natural systems [75]. SOM’s input layer can accommodate multiple inputs that pass through a competitive layer (also known as the output) consisting of a couple of dimensions during training. The “winning” node is a node in the competitive layer which in the Euclidean distance is the closest weight vector to the input vector and updates its weight during training. SOM differs from other networks due to its spatiality [76,77] which has the ability to maintain topological associations in the original [78,79].
Classification of remotely-sensed imagery, both supervised and unsupervised, can be used in SOM through Kohonen’s neural network. In this research, the self-organizing map (SOM) neural network with a supervised classification mode was performed for assessing urban earthquake vulnerability in Tabriz using the IDRISI selva (Version 17.1) software (Clark Labs).
It indicated that the network was training. Thereafter, the 20 input layers were specified and standardized (Table 1) and their names entered into the grid. For the interval in the column and the interval in the row, 3 and 7, respectively, were entered. The interval samples all pixel features in the input pictures and increases the time of measurement. Growing the interval would minimize the measurement time. For training, the data type (image) was specified and entered into the training file which was extracted from the ANP model. This file defines the classes used for the classification. A number of web parameters were then determined. We first determined the amount of produced layer neurons which adjusted the initial neighborhood radius if desired. To cover the entire output sheet, it needs a sufficiently high value. In this study, network parameters included 20 input layer neurons, 2025 output layer neurons, 64.64 initial neighborhood radiuses, a minimum level of learning of 0.5 and an overall rate of learning of 1 (Table 1). For the supervised classification, an option allowed to fine tune parameters, which included the minimum and the maximum value gain term in the range 0.0 to 1.0, a smoothing rule and the number of smoothed epochs. As shown in Table 1, schematically, SOM is generally represented as a dimensional grid with nodes adjusted to various input data patterns.
The next steps dealt with initiating the training of the network coarse-tuning and labeling the feature map before classifying. The preparation of the earthquake vulnerability map was the final phase of the ANN study. For this we selected the classify button to perform the SOM classification. The resulting layer map was moved to a GIS environment after generating the EVM from the SOM phase. The raster layer map was then transformed to a vector layer format and the dissolved feature was prepared to measure the city-wide vulnerability.

2.4.2. Multilayer Perceptron (MLP)

The most common ANN is the network known as Multilayer Perceptron (MLP), which is a structure of three layers, including the input, the output, and the hidden layers, including the space between them [80]. The input data layer originates from various sources such as thematic layers. As a result, the amount of input data sources influences the number of grids in the input layer. The data structure is actively processed in hidden and output architecture. The amount of hidden layers and their grids are determined through a trial and error approach [81]. The application determines the number of grids in the output structural layers, which is represented in this case by the class being mapped. Each of the hidden grids responds to the weighted input layers it obtains from the linked neurons from the previous input [82]. After determining the weighted summation of input layers for each hidden grid, a transfer function is prompted to specify the activation of that grid. From (8), it can be shown that the signal flow (0) is in series x1, x2, x3, …, xm assumed to be unidirectional, as indicated by arrows. The grid output signal flow (0) is described in the relationship as follows,
0 = f ( n e t ) = f ( j = 1 n g j x j )
where gj is the weight vector and f(net) is the function called a transfer activation function. The net variable is defined as a scalar of the net product of the weight and input layer vectors,
n e t = g T x = g 1 x 1 + g 2 x 2 + + g n x n
where T is the transpose of a matrix, and, in the simplest case, the output value 0 is computed as,
0 = f ( n e t ) = { 1   if   g T x θ 0 otherwise
where θ is called the threshold value level; a node commonly known as linear threshold element [83].
The back-propagation (BP) algorithm is used by the MLP to classify remotely-sensed imagery. The computation is built on information obtained from the training data. The MLP processes a nonparametric degeneration analysis between input variables and a dependent variable, which is symbolized by an output grid in the network [84]. The MLP was used in a threshold transfer function for output neurons (hard classification mode) to carry out the assessment of susceptibility to earthquake hazards in Tabriz, via the IDRISI SELVA product software (Version 17.1) (Clark Labs). For the outcome, we employed the classification option in accordance with the research objectives. Thereafter we specified, the 20 input layers and standardized them before entering their names in the grid. The masked image consists of Boolean values arranged in 1 s in all of the cells of interest and 0 s elsewhere. Due to the nonavailability of earthquake records from 1780 and lack of enough sampling and databases and sites, the proposed method in this research employed a new training strategy for the selected layers. We’ve designated 70% of the training data as training and 30% as testing. We adjusted the weights following the BP method to reduce the training process error that occurs between the ANN output and the actual data [85]. The amount of pixels in each class is divided randomly between the training process and the testing for each category in the training data file. The ratio between the amounts specified for the maximum training pixels and testing them also determines the actual amount of pixels used for the training process and testing. The pixels will be divided in a 1-to-1 ratio if the same values are used for each entry. Generally, it is safe to specify in terms of hundreds to thousands instead of a large number of pixels per classification. The training and testing in Tabriz were done with an average of 500 pixels per class. We used the training pixel values for the validation of the results. In this procedure, a hidden layer with seven nodes, input layer of 20 nodes, and output layer of five nodes formed the network topology (Table 2).
The amount of input layers is categorized through the amount of images while the quantity of outputs is prescribed by the training data classes in the training file. The subsequent procedures deal with training the parameter values whereby the critical step is the learning rate. This is a positive constant which controls the adjustment applied to the linking weights. In this case, we used an automatic training procedure and a dynamic learning rate; along with a self-adjusting process. This dynamic learning, requires the entry of starting and finishing learning rates. The entry learning rates and the momentum factor applied were 0.001, 0.0001, and 0.5, respectively (Table 2). Small values of learning rates have a tendency to increase the time in the training step. Large ones however may produce inferior results with variable adjustments. The momentum factor is applied in this study to step up the procedure of convergence. With some adjustments in criteria, the procedure can be terminated.
By means of a root mean square (RMS) approach for the learning of the network, a measure of an acceptable error is shown in Equation (12):
R M S = p k ( t p k o p k ) 2 P × N
The extracted RMS for this study was 0.1534 which is acceptable compared to the IDRISI default value of 0.5. Defining a small value of acceptable error means that convergence is hard to attain. Therefore, additional iterations have the potential of over-training. We set iterations to 10,000 meaning the training procedure was terminated when the value was reached. Finally, the accuracy rate is established on the sample specifications of the training process and testing pixel values per category. In this analysis, the MLP attained was 90.01% for the overall accuracy using the testing data (Figure 3). The last step of the MLP evaluation was the processing of the earthquake vulnerability map (EVM). To achieve this, the trained and tested MLP model was applied to the derived data sets to produce the EVM of the study area. The EVM product was then transferred to the GIS product environment and converted from raster layers to vector format before the Dissolve function was prepared to compute the vulnerability of the whole city.

2.5. Strategy Development for Hazard Mitigation

2.5.1. SWOT Analysis

To conduct a proper SWOT analysis, firstly, the internal and external factor evaluation matrices, IFE and EFE, need to be prepared. Then, a SWOT analysis needs to be conducted based on them to understand the strategies. In the following, we first explain IFE and EFE and then the SWOT analysis.

The Evaluation Factors

The external factors evaluation (EFE) matrix is a tool that allows strategists in urban planning to analyze external factors such as environmental, economic, social, political, cultural and technological factors relevant to a specific issue at a certain period of time. On the other hand, the internal factors evaluation (IFE) matrix is a tool for analyzing the internal factors of a city. The matrices are usually developed based on expert opinion and yield an assessment of the opportunities and threats (for EFE), and strengths and weaknesses (for IFE) of a city.
To develop the internal and external factors evaluation, five steps should be taken:
  • Step 1. The opportunities and risks and then the strengths and vulnerabilities of the city can be assessed by recognizing the external and internal variables.
  • Step 2. Solicit experts’ opinions through a questionnaire, with a weighted coefficient (between 0 to 1) being assigned to each factor in a way that the total of the assigned weighted coefficients equals one.
  • Step 3. Based on the analysis of opportunities, threats and strengths and weaknesses, a score of 1 to 4 is allocated for each of these factors for the city. The number 4 means that the reaction was perfect, and 1 shows that the reaction was very weak. The interpretation of each of these scores can be as follows: 4 (excellent reaction), 3 (good reaction), 2 (bad and negative reaction), 1 (very bad reaction).
  • Step 4. The factor weight is multiplied by its score of efficiency to get the final value for each factor. Once the cumulative score of each element is determined, they are summarized to determine the total weighted IFE and EFEE scores.
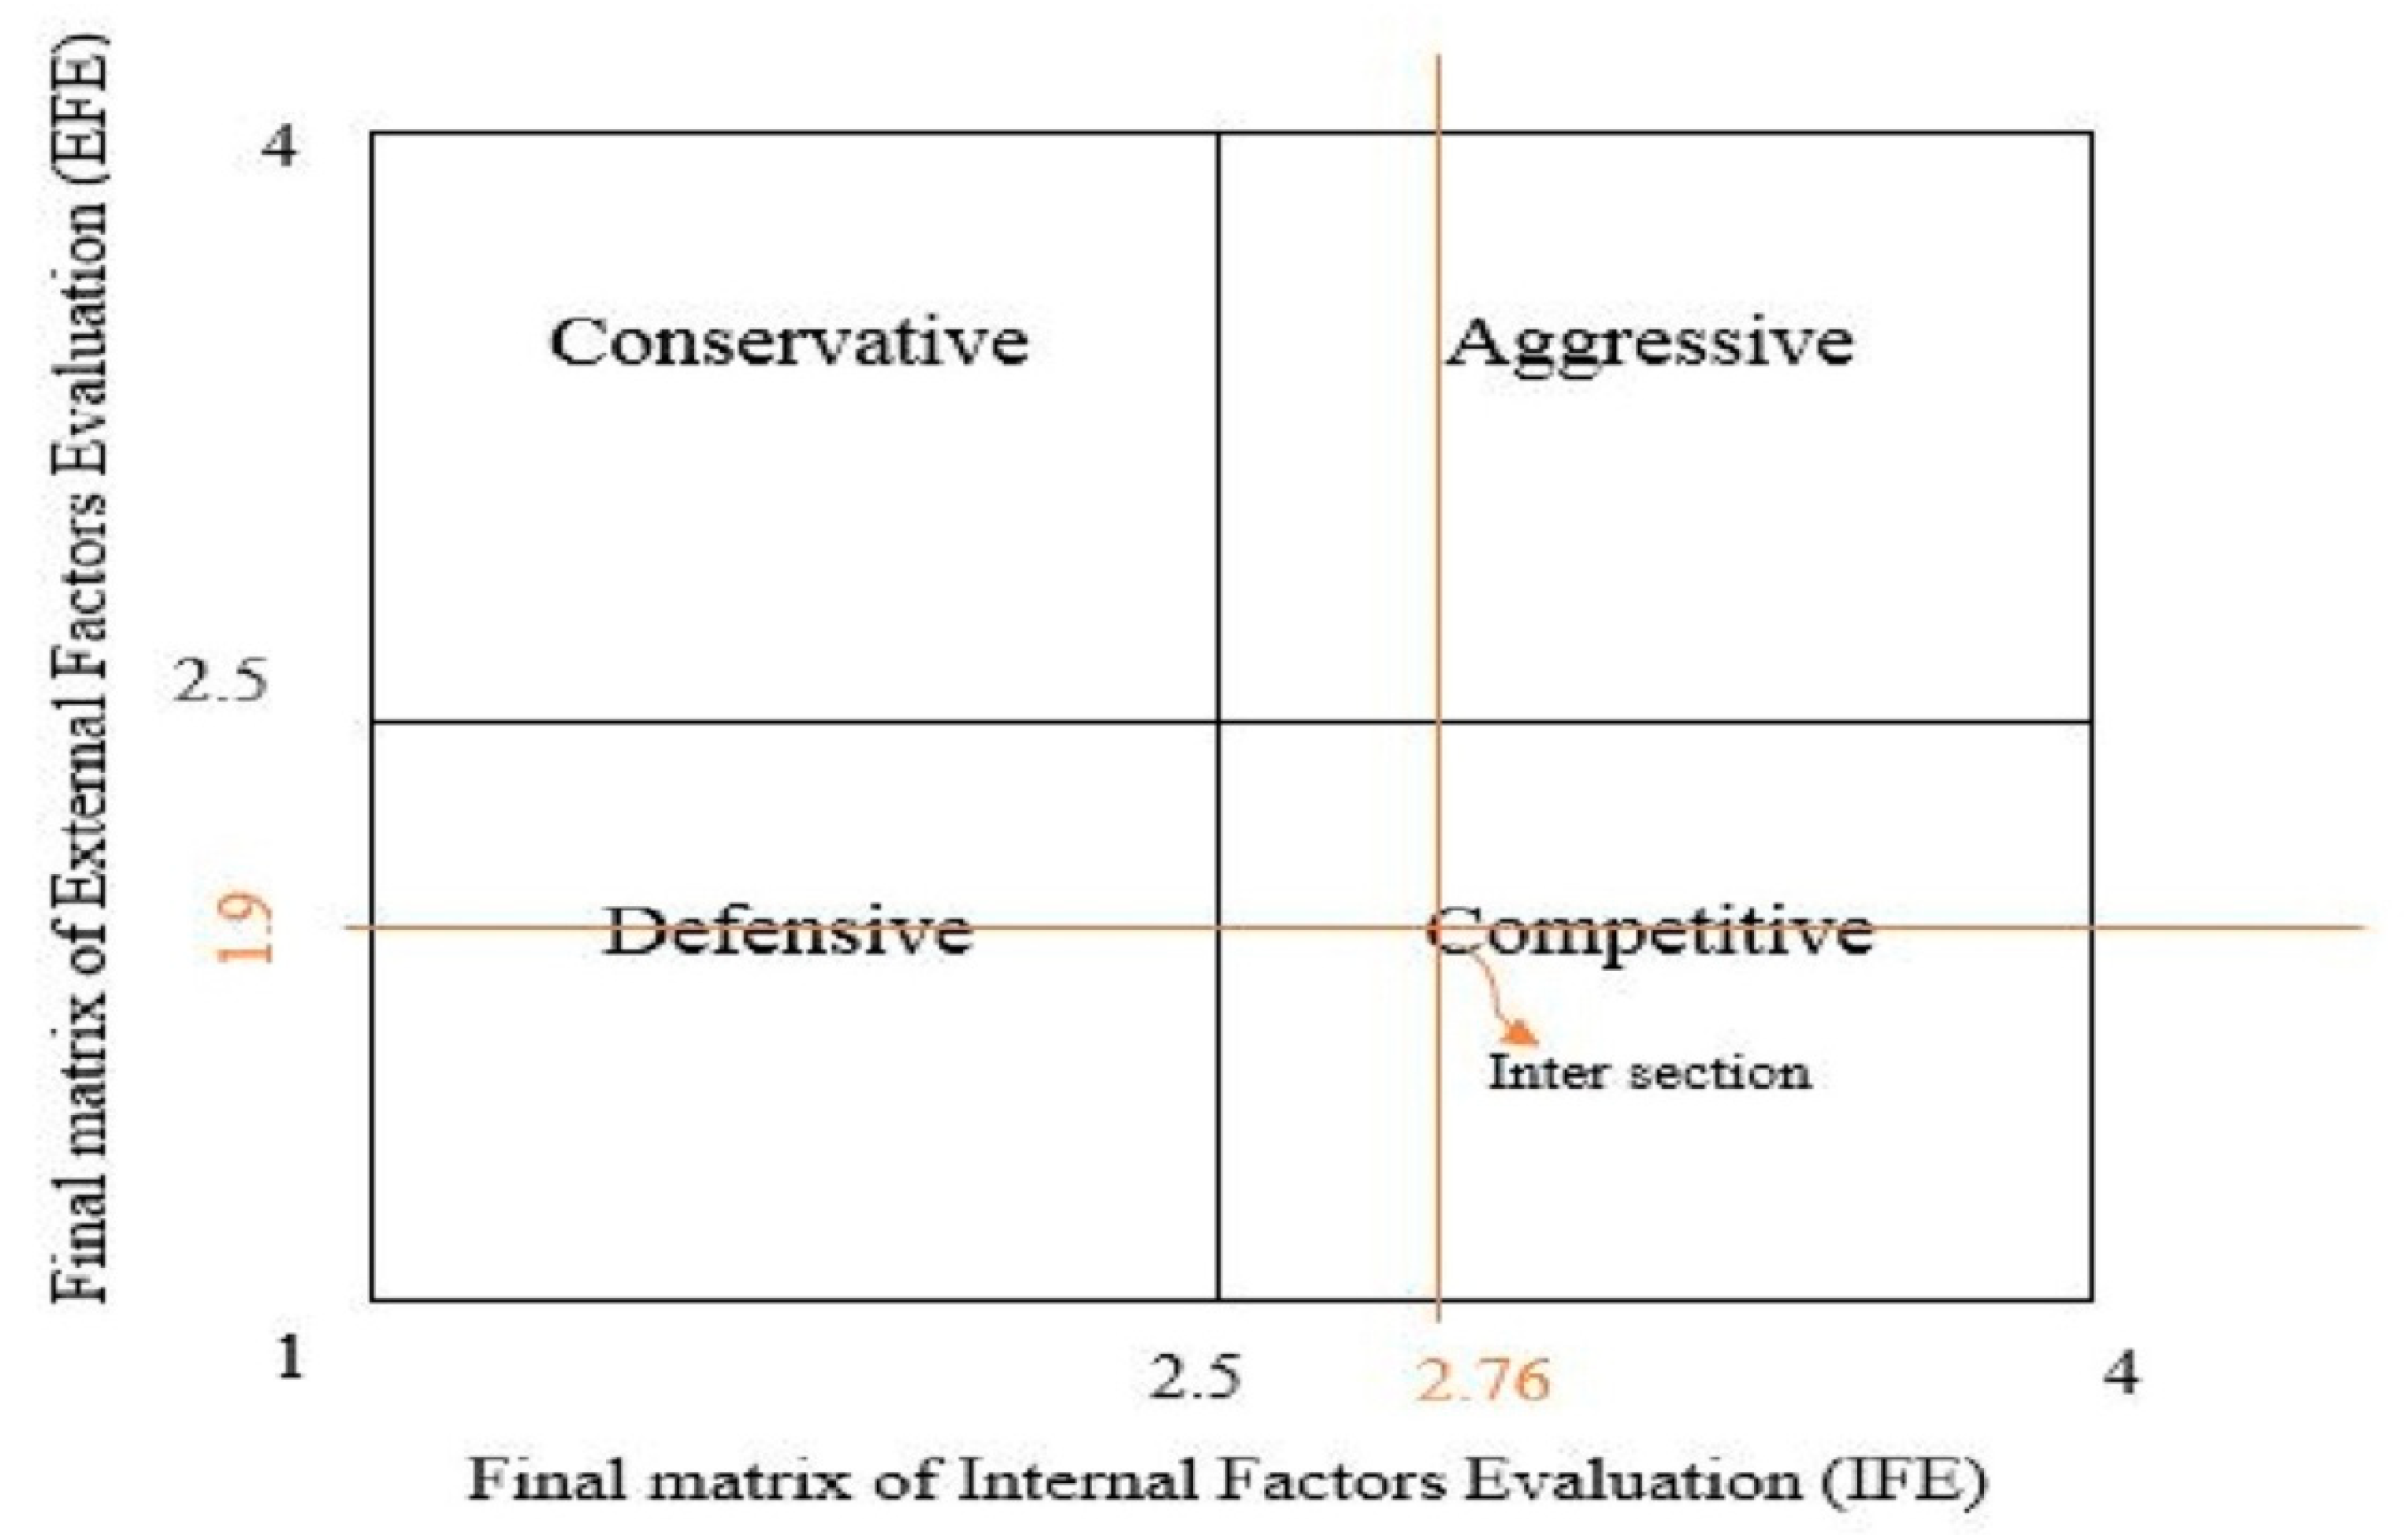
  • Step 5. The total weighted score is calculated which is at least 1 and at the most 4. The average score for the cities is 2.5. For IFE, if this score value is below 2.5, it indicates that the strengths were not greater than the weaknesses. If it was more than 2.5, the strengths overshadowed the weaknesses [86]. On the other hand, for EFE, if this value is below 2.5, it means that the opportunities were not greater than the threats; if it was above 2.5, then the opportunities overshadowed the threats [87].

Developing Strategies Using SWOT

SWOT analysis is an efficient structured method of planning that identifies each factor of strength, weakness, opportunity and threat, and reports the corresponding possible strategies to deal with an issue [88,89,90].
The aim of a SWOT analysis is to classify the main internal and external factors relevant for the issue [91,92,93,94].
In normal mode, the SWOT analysis consists of a 2 × 2 table and each of its four cells shows a group of strategies (Table 3) with each group targeting an objective as follows:
  • Aggressive strategies: capitalizing the most on using environmental opportunities by harnessing the strengths of the city.
  • Competitive strategies: using the strengths of the city for avoiding threats.
  • Conservative strategies: for using the potential advantages which are hidden in environmental opportunities in order to compensate for the weaknesses of the city.
  • Defensive strategies: for minimizing the losses from threats and weaknesses.

2.5.2. The Strategic Planning Matrix

The most effective solution can be formulated after defining and evaluating core strategic variables as inputs for a Quantitative Strategic Planning Matrix (QSPM). This matrix is used for choosing and prioritizing the strategies based on expert opinion, and prioritizes which strategy should be considered first, based on its attraction score. This QSPM matrix is created in five stages:
  • Step 1. In the left column in the matrix of the QSPM, the external factor opportunities and risks and inner strength factors and weaknesses of the city are identified. This information is collated directly from the IFE and EFE matrices.
  • Step 2. A score is allocated for each critical factor. These scores are related to the IFE and EFE matrices and are added to the second column, next to the critical success factors.
  • Step 3. By considering the second stage of the formulation (i.e., integration and combination), the possible and applicable strategies are considered and added to the row at the top of the QSPM matrix.
  • Step 4. Finally, the attraction score (AS) is determined. It is defined as the numerical value which captures the relative attraction of each strategy. By simultaneously considering critical success factors and the attraction scoring, the following central question needs to be answered: Does this factor have any effect on choosing any of the four strategy types mentioned above? If the answer to this question is positive, then this strategy is compared with this key factor. Strategies should then be evaluated considering their relative attraction scores as being either one of the following:
Score 1: not attractive,
Score 2: partially attractive,
Score 3: reasonably attractive,
Score 4: very attractive.
  • Step 5. The total score of attraction is calculated. To evaluate the relative intensity of that solution, the attraction score of each element in each row is multiplied. A high score indicates a high attraction for that strategy [95].

3. Results

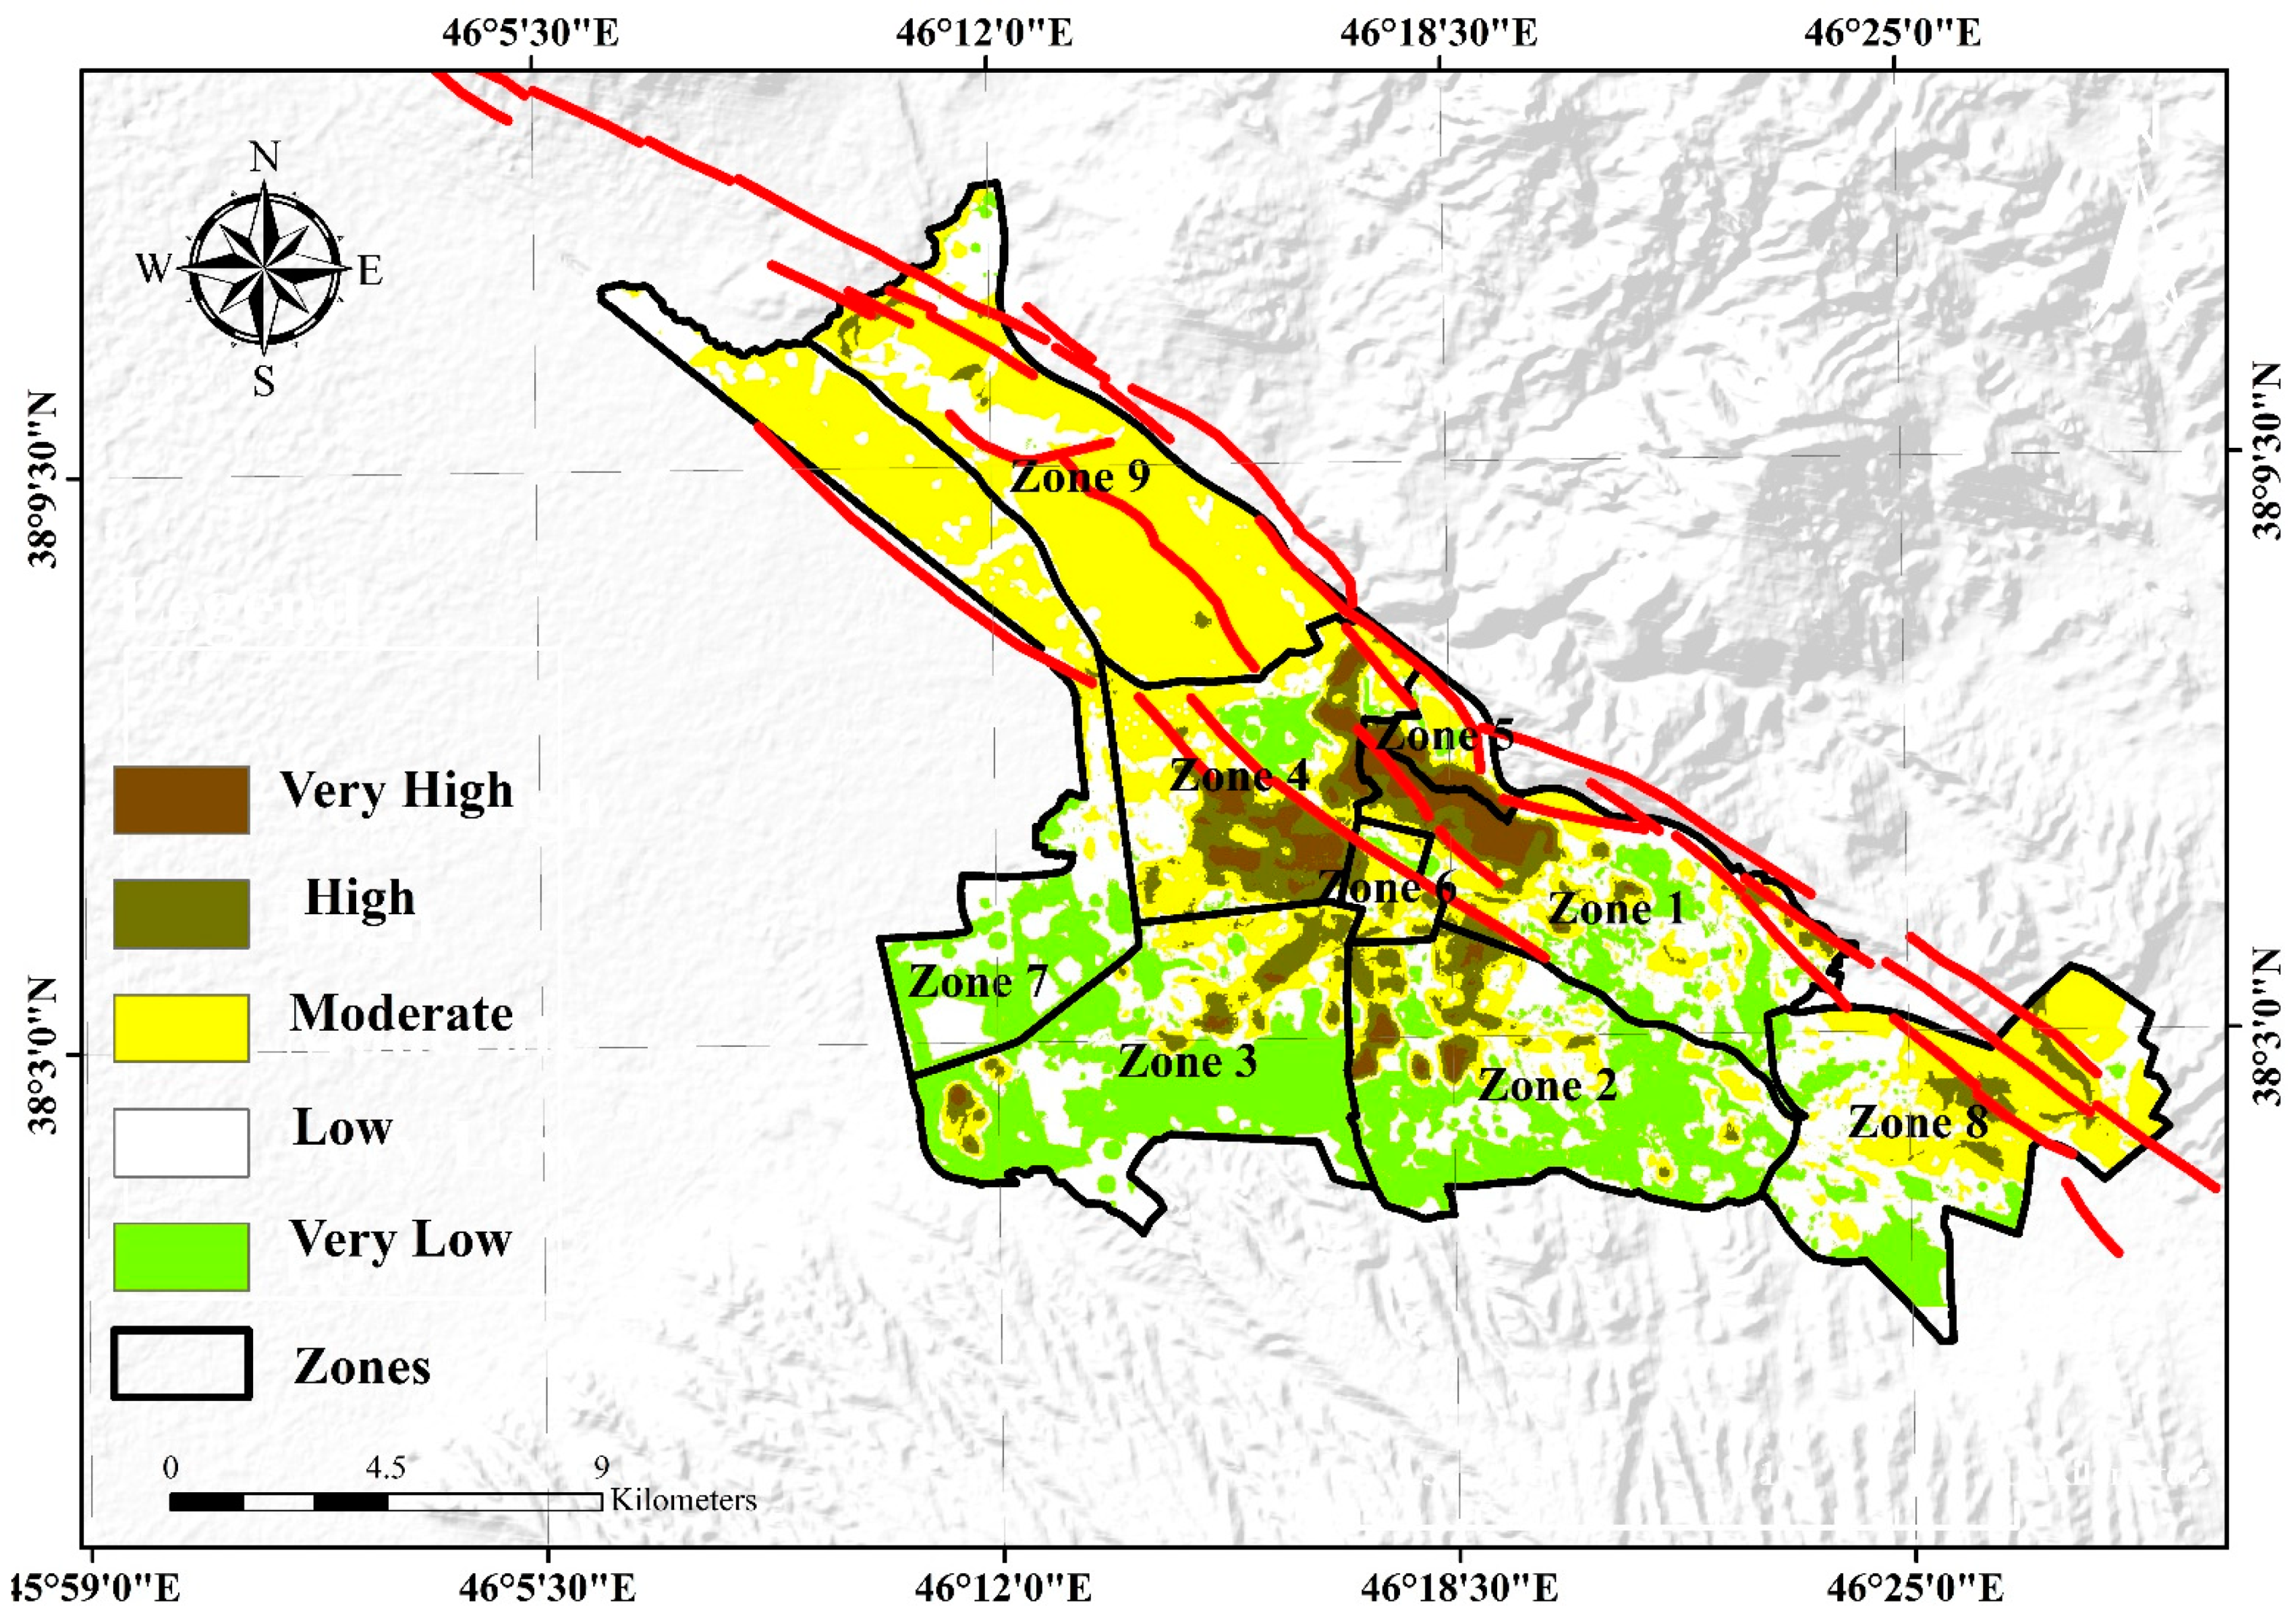
3.1. Earthquake Vulnerability Map (EVM) Benerated by Adopting the SOM Method

The findings obtained using SOM for our vulnerability assessment are presented in Table 3. Accordingly, vulnerability was grouped into five classes ranging from very high, to high, moderate, low and very low. The result shows that 1.58% (405.82 ha) of the total area are very highly vulnerable to earthquakes whereas 6.13% (1574.76 ha) are highly and 37.23% (9559.78 ha) moderately vulnerable. About half of the area (50.22%; 12,895.06 ha) shows low vulnerability and another 4.83% (1240.61 ha) very low vulnerability.
Zoning the EVM of Tabriz exposes the extent of susceptibility to earthquakes in the various municipalities (Table 4). The majority of municipalities shows either low or medium vulnerability, with just a few percent of their land being classified as very high/high or very low in terms of vulnerability. Conversely, Zone one is characterized by the highest vulnerability and Zone four encompasses large areas that are highly vulnerable.
Specifically, 17.56% and 16.74% of Zone five is categorized as very highly or highly vulnerable, respectively (Table 4). Zone four is the second most vulnerable zone, with 1.37% of land being either very highly vulnerable or 27.65% highly vulnerable. In Zone one, 6.96% of the land is very highly vulnerable and 12.40% highly vulnerable. Conversely Zone three shows mainly low (66.42%) to very low (11.60%) vulnerability, and so do Zone seven and Zone two.
As for the Population Vulnerability (PV), in Zone five the largest percentages of the population are exposed to very high and high vulnerability to earthquakes, followed by Zone one and Zone four (Table 5).
As for Residential Building Vulnerability, as inferred by overlaying the EVM of Tabriz with residential building data, we found that Zones five, four and one, respectively, show the highest percentage of vulnerability, and Zones seven, eight and two, respectively, the lowest vulnerability (Table 6). Overlaying population and residential building data on the EVM accounts for the significance of these two indicators in determining earthquake vulnerability. In other words, with the increase in density of the population and residential buildings in areas highly to very highly vulnerable to earthquakes increases the likelihood for casualties and serious damage to infrastructure.

3.2. Earthquake Vulnerability Map (EVM) Generated by the MLP Method

The Multilayer Perceptron results show that 1.19% of Tabriz is very highly vulnerable. Highly, moderate, and low vulnerability corresponds to 5.60%, 34.11%, and 52.74% of the area (Table 7). Zone one, Zone four, and Zone five are most vulnerable while the south and southeast regions of Tabriz fare relatively well (Figure 3 and Table 8).
Figure 3. Earthquake vulnerability in Tabriz, Iran, by municipality, provided by MLP.
Remotesensing 13 04519 g003
As can be seen in Table 8, the MLP data show that 16.14% and 14.26% and of Zone five is classified as being very highly and highly vulnerable, respectively. Zone four encompasses 1.08% and 25.57% of land that is very highly and high vulnerable, respectively. Zone one which is also of concern given it has 5.74% and 9.80% of land classed as very highly and highly vulnerable, respectively (Table 8). The other zones are of less concern.
However, identifying the size and area of the land that is vulnerable is not enough to determine the adverse effects of an earthquake. As shown above for the SOM, population density and residential building density also need to be accounted for when forecasting impacts. This enabled us to better understand Population Vulnerability and Residential Building Vulnerability in various zones of Tabriz to better evaluate how to reduce impacts of an earthquake by finding the intersect between seismically vulnerable land zones that are also characterized by high population and residential building density.
Table 9 and Table 10 show the relative vulnerability of the different municipality zones in Tabriz as obtained by overlaying the Earthquake Vulnerability Map (EVM) with population and residential building data. The potentially most vulnerable areas are clustered in Zones five, four and one, respectively, which are located along the NTF. Residents in these zones are known to earn lower than average income and reside in small housing properties causing an overall population and building density. Conversely, the least vulnerable zones were Zone seven, Zone three and Zone two.

3.3. Validation

The next step in our research involved the validation of our results. Calibration of the data had partitioned them into five classifications of very favorable, favorable, rather favorable, unfavorable and very unfavorable conditions with values ranging from 5, 4, 3, 2 to 1, respectively. A perfectly constructed model should be able to represent the region of interest in a fairly accurate manner. Nonetheless, there is a probability of not achieving such accuracy with our standardized or classified data. The EVM findings from the Multilayer Perceptron (MLP) were compared with the EVM findings from the Self-Organizing Map (SOM) to validate our proposed model outcomes. Scatter-plots were applied. These scatter-plots constructed from rusts provided by both methods show a strong positive relationship between the extremely vulnerable zones (one, four and five) and the least vulnerable zones (two, three and seven) for both EVMs. Additionally, Spearman correlation coefficients were computed comparing the most and least vulnerable zones according to the SOM and the MLP (Table 11 and Table 12). The correlation coefficients of 0.997 and 0.921 were statistically significant at the 0.01 and 0.05 levels. Thus both outputs agree on the level of vulnerability of the respective zones.
In addition to the above metrics, we used an efficient quality index, i.e., the Q-average, for the validation of the model. For two vectors x and y, it is calculated as follows [96],
Q ( x , y ) = 4 σ x y . x ¯ . y ¯ ( σ x 2 + σ y 2 ) . ( x ¯ 2 + y ¯ 2 )
where, σxy represents a covariance arising from comparing x and y, σx and σy denote variances, and x ¯ and y ¯ denote the mean of x and y, respectively. The Q-average value varies between −1 to 1. The optimum value for the Q-average is 1 which is obtained when x = y.
Table 13 indicates that the Q value is higher than 0.9 for the SOM and MLP results for the most and least vulnerable areas to earthquakes in Tabriz, Iran.

Hazard Mitigation Strategies for Zone One

Considering the EVM generated by the SOM, Zone one shows a high level of vulnerability. Zone one consists of three regions with a total population of 211,302, covering an area of 1547 ha (Table 14). The gross density is 137 persons/ha. Furthermore, the zone comprises 552.4 ha of residential land with a gross population density of 383 persons/ha.
Zone one was then selected as a case study for demonstrating how to formulate an earthquake hazard mitigation strategy.

3.4. SWOT Analysis

3.4.1. External Factor Evaluation (EFE)

Consulting with the city development strategies, the master plan of Tabriz and a field survey, seven factors were chosen pertaining to opportunities and threats (Table 15). The cumulative value of external variables (1.90) was not more than 2.5, which means that the risks outweigh the possibilities (Table 15).

3.4.2. Internal Factor Evaluation (IFE)

As for internal factors, we identified seven strengths and eight weaknesses (Table 16). The estimated cumulative value of internal variables was 2.76, which is above 2.5. This means that the strengths outweighed the disadvantages.

3.4.3. Internal and External Matrices (IE)

The intersection between the EFE and IFE scores marks the most suitable strategy type in the SWOT strategy matrix (Figure 4). The IE Matrix shows that Zone 1 is located in ‘competitive-strategy’ quadrant, i.e., for this zone we should appoint strategies that capitalize on the strengths of the city which ensure security against environmental threats.

3.5. Developing an Earthquake Hazard Mitigation Plan

3.5.1. SWOT Plans

To capitalize on the strengths of the Tabriz to equip the city against earthquakes a competitive strategy involving twelve key mitigation components is recommended (Table 17). These were identified through a pair-wise matching of the SO, WO, ST, and WT factors. The WT hazard mitigation strategies build a defense strategy to avoid the vulnerabilities of Zone 1 to external threats (Table 17).

3.5.2. QSPM Strategies

The QSPM study was carried out to provide more guidelines for earthquake hazard reduction as well as for classifying methods according to their goals. Since it was revealed in the EFE/IEF matrix that the desired strategy is competitive considering strengths and threats for Zone one, we also considered a competitive (ST) strategy in the quantitative strategic planning matrix (QSPM). For each strategy, detailed computations are given in Table 18.
Considering the results shown in Table 19, rankings of the results of the QSPM analysis were calculated as shown in Table 18. The overall level of scores of attractiveness for QSPM were 4.19, 3.69, 4.43 and 3.48 for strategies ST1, ST2, ST3 and ST4, respectively.

4. Discussion

Vulnerability to earthquake hazards is a multidimensional, and spatially and socially variable construct. Assessments of vulnerability require consideration of physical, environmental and socio-economic factors [97]. Physical factors pertaining to engineering and architectural aspects, and land use planning. They influence the sensibilities of the location and building environment. Environmental factors that impact on vulnerability include slope fraction of an area, geological formation features, drainage patterns and proximity to a fault. Social factors are more multifaceted and pertain to societal structures and communal aspects. Finally, economic factors that influence vulnerability include the exposure of an economic system to potential disaster damage and resulting in direct or indirect loss. It can be defined as inability of distressed individuals, societies, communities, enterprises, and governments to withstand or suppress the damage in question [98]. In the present study, we accounted for these multiple factors when assessing the potential vulnerability of Tabriz to earthquakes using ANN models and thus provide a comprehensive modelling approach. The novelty of the proposed assessment framework lies in its relative ease of applying multiple indices thus accounting for the varied concerns of different stakeholders as is typical in vulnerability studies. The information generated is useful for policy makers and land planners to frame action plans for mitigation strategies. The assessment framework proved efficient and can be flexibly applied to other urban areas worldwide at different spatial scales. Our detailed methodological approach therefore provides a blueprint for other hazard mitigation works requiring informed decision making.
A novel hybrid model of SWOT-QSPM was developed for earthquake risk assessments, in the context of a case study of Tabriz City, Iran. The modelling was coupled with a GIS-based spatial analysis useful for the regional scale. In addition, the ANN method helped determine earthquake probability measurements in Tabriz. This study aimed at developing a user-friendly geographic information system (GIS) tool, involving an ANN coupled with a novel SWOT-QSPM model that provides an effective and practical estimation for an earthquake risk assessment. This technique has great potential to become an important tool for city planning of future earthquake incidents. This is supported by related works [6,99,100,101,102,103,104]. The major drawback of the ANN technique is the time-consuming model development and implementation because the ANN training requires a large amount of training data [104]. The key limitations specific to our study situation included a lack of high-quality infrastructure data and long processing times.
Differences in vulnerability are largely due to the varying density in the population, unemployment, a compact urban living situation, poor access to open spaces, relief centers and there like. The pronounced variations in vulnerability to earthquake hazards in Tabriz, warrant special attention by both local authorities and the national government to reconsider current natural disaster management strategies. This calls for the development of policies, strategies and action plans that consider the weaknesses, strengths, opportunities and threats documented in this research. It is obvious from our research that this problem is complex, fuzzy and multidimensional and solutions will affect many aspects of Tabriz society, including education, legislation and technical administration. The SWOT analysis provided a systematic examination of factors that needs to be considered and identified twelve key strategies for hazard mitigation in Zone one. The Quantitative Strategic Planning Matrix (QSPM) was used to identify the relative attractiveness of the strategies which determined that the best strategy for hazard mitigation in Zone one was to optimally consider environmental phenomena when designing and positioning settlements.
Mitigation of earthquake hazards is the most effective tool for reducing harmful consequences. However, prevention of a catastrophe is nearly impossible. Nonetheless it is critical to minimize its potential impacts. Social hazard mitigation is considered one of its integral components to raise awareness of potential damage and develop education plans [99]. Thus, the elevated risk of earthquake incidence in the city of Tabriz and the potential risk scale of devastation require precautionary measures to mitigate future damage. The findings demonstrate that although there are some strengths and opportunities inherent to the urban management of Tabriz, threats and weaknesses also exist. The Internal Factors Evaluation Matrix (IFE) shows that the city’s internal situation is opportune. However, the External Factor Evaluation (EFE) raises concerns around the low levels of preparedness to capitalize on opportunities in response to external factors. A competitive strategy was identified as the most promising pathway to use the city’s strengths in order to reduce or eliminate the effects of earthquakes. Specifically, this should involve an optimal consideration of environmental phenomena when designing and deciding on locations of sites, reinforcement of the crisis confrontation subsystems in the city, revitalization and renewal of land uses in historic sections, as well as an adequate design of open spaces.
As for reinforcing factors, we recommend organizing specialized earthquake committees in the city of Tabriz and holding sessions every two months. The establishment of earthquake safety maneuvers at schools and allocating budgets for reconstruction and renovation of infrastructure such as a drinking water network (gas post, water reserves, petrol and gas station) in the danger zones of Tabriz seems also critical. Housing renovations particularly of old buildings prone to destruction are needed. Similarly, fine-grained lots, and narrow thoroughfares should be considered for replanning. Hence, it is necessary for urban managers to consider and prioritize the design of open spaces. Finally, locating settlements on lands with a gradient of less than 5% and away from fault lines will aid with the mitigating impacts from earthquakes in the future.

5. Conclusions

The application of the new ANN model to our real-world case study shows that the proposed model is robust for constructing a composite social, economic, environmental and physical vulnerability index. Its application to municipality zones in Tabriz and the development of Earthquake Vulnerability Maps (EVMs) reveal the existence of drastic regional differences in vulnerability to earthquakes. These maps provide a foundation for analyzing spatial variation and identifying the hotspots of earthquake vulnerability that are of greatest concern. They show that the most vulnerable zones in the city are clustered in the Zones one, four and five. Conversely, the less vulnerable zones are located in Zones two, three and seven. The remaining zones exhibit low to moderate levels of vulnerability. The proposed method for an earthquake risk assessment provides useful information that can assist in earthquake disaster mitigation.
The proposed integrated vulnerability assessment framework is flexible and can easily be applied to urban environments at various geographical scales with different mapping units. In this sense, the overall vulnerability maps for the urban area have potential for decision-makers in designing vulnerability reduction strategies and hence risk reduction strategies. We applied a hybrid (SWOT-QSPM) method and ANN approach to improve the earthquake risk assessment (ERA) and applied it to the other regions, to test the model. However, the potential of using these techniques in such complex and time-constrained problems still has to be explored in future research. As a recommendation, future research may conduct related studies on EVM by applying other MCDM techniques such as Analytic Network Processes (ANP) and Fuzzy Analytic Neural Processes (FANP) to compare the results between modelling outcomes and planning recommendations attained by different techniques. The developed hybrid framework of the SWOT-QSPM model coupled with ANN is easily replicable elsewhere for urban management. This point has been ignored in previous social vulnerability studies. Hence, future scenarios may include the application of artificial intelligence techniques or a 3D city model. Future research should also concentrate on the use of more intelligent analysis means such as back-propagation neural networks, probabilistic neural networks (e.g., a hybrid analytic hierarchy process; ANP-TOPSIS), supervised associating networks, multilayer perceptron neural network architectures, genetic algorithms, support vector machine and multilayer neural networks to compare the results between modelling outcomes and planning recommendations attained by different techniques. Finally, in the future, more attention should be afforded to conducting research for earthquake risk assessments and multicriteria analysis using the predication and accuracy algorithms for incremental updates. Accordingly, in our future work we will focus on evaluating our technique for large multi-criteria datasets to show how it can overcome the scalability drawback of traditional and multi-criteria analysis.

Author Contributions

Conceptualization, M.A. and H.Z.; methodology, M.A.; software, F.R.; validation, A.A., I.D.W. and P.K.L.; formal analysis, I.K.; investigation, M.A. and A.B.P.; writing—original draft preparation, M.A.; writing—review and editing, A.B.P. and B.P.; visualization, M.M.N.; supervision, B.P. All authors have read and agreed to the published version of the manuscript.

Funding

This research received no external funding.

Acknowledgments

The authors would like to acknowledge the support of Universti Teknologi Malaysia (UTM) for providing financial assistance. Appreciation also goes to the editors and anonymous reviewers for their valuable comments and suggestions, which were helpful in improving the paper.

Conflicts of Interest

The authors declare no conflict of interest.

Abbreviations

ANNArtificial Analytic Network
SWOTStrength Weaknesses Opportunities Threats
QSPMQuantitative Strategic Planning Matrix
GISGeography Information System
EVMsEarthquake Vulnerability Maps
SOMSelf-Organizing Map
MLPMultilayer Perceptron
RBVResidential Building Vulnerability
PVPopulation Vulnerability
NTFNorth Tabriz Fault
DENDensity
DISDistance
PERPercent
IFEInternal Factor Evaluation
EFEExternal Factor Evaluation
SOStrength–Opportunities
STStrength–Threats
WTWeaknesses–Threats
WOWeaknesses–Opportunities
TASTotal Attraction Score
ASAttraction Score
ERAEarthquake Risk Assessment

Appendix A. Relative Importance Index of Urban Earthquake Vulnerability Indicators

Indicators
1. Percent of population under 6 years old
2. Residential building density
3. Buildings floor density
4. Percent of population with telephone access
5. Distance to police station
6. Average acceleration value for medium magnitude earthquake
7. Percent female participating in labour force
8. Percent of population over 65 years old
9. Distance to open space
10. Aspect
11. Distance to relief centers
12. Commercial buildings density
13. Percent of population with disability
14. Household density
15. Room area per person
16. Employee people density
17. Percent of homeownership
18. Percent of population with the health insurance coverage
19. Percent of population who are migrants
20. Features of geology
21. Population density
22. Percent of housing unit with kitchen
23. Buildings density
24. Size of buildings density
25. Percent of slope
26. Ratio of widows in female population
27. Per capita household income
28. Unemployed people density
29. Drainage
30. Distance to fault
31. Quality of buildings density
32. Age of buildings density
33. Percent of housing unit with bathroom
34. Distance to road network
35. Degree of occupancy per room
36. Distance to danger centers
37. Private residence with more than five rooms
38. Dentists per 100,000 population
39. Specialist physicians per 100,000 population
40. Literate people density
41. Hospital beds per 100,000 population
42. Dwelling population density on census unit
43. Buildings materials density
44. Women with many children

Appendix B. Selected Indicators and Omitted Indicators Highlighted in Red

1.
Urban earthquake vulnerability indicators
2.
Relative importance index
3.
Rank
4.
1. Distance to Fault
5.
0.98
6.
1
7.
2. Population density
8.
0.96
9.
2
10.
3. Features of geology
11.
0.94
12.
3
13.
4. Buildings density
14.
0.92
15.
4
16.
5. Residential building density
17.
0.88
18.
5
19.
6. Household density
20.
0.86
21.
6
22.
7. Buildings materials density
23.
0.84
24.
7
25.
8. Age of buildings density
26.
0.82
27.
8
28.
9. Quality of buildings density
29.
0.78
30.
9
31.
10. Distance to open space
32.
0.78
33.
10
34.
11. Size of buildings density
35.
0.76
36.
11
37.
12. Percent of slope
38.
0.74
39.
12
40.
13. Distance to danger centers
41.
0.74
42.
13
43.
14. Buildings floor density
44.
0.72
45.
14
46.
15. Distance to relief centers
47.
0.68
48.
15
49.
16. Distance to road network
50.
0.66
51.
16
52.
17. Employee people density
53.
0.64
54.
17
55.
18. Literate people density
56.
0.62
57.
18
58.
19. Commercial buildings density
59.
0.58
60.
19
61.
20. Unemployed people density
62.
0.56
63.
20
64.
21. Dwelling population density on census unit
65.
0.48
66.
21
67.
22.Average acceleration value for medium magnitude earthquake
68.
0.46
69.
22
70.
23. Percent of population with disability
71.
0.44
72.
23
73.
24. Private residence more than five rooms
74.
0.42
75.
24
76.
25. Per capita household income
77.
0.42
78.
25
79.
26. Room area per person
80.
0.38
81.
26
82.
27. Degree of occupancy per room
83.
0.38
84.
27
85.
28. Percent female participating in labour force
86.
0.36
87.
28
88.
29. Percent of population with the health insurance coverage
89.
0.36
90.
29
91.
30. Women with many children
92.
0.34
93.
30
94.
31. Hospital beds per 100,000 population
95.
0.34
96.
31
97.
32. Percent of population with telephone access
98.
0.34
99.
32
100.
33. Specialist physicians per 100,000 population
101.
0.32
102.
33
103.
34. Dentists per 100,000 population
104.
0.32
105.
34
106.
35. Ratio of widows in female population
107.
0.02
108.
35
109.
36. Percent of population who are migrants
110.
0.28
111.
36
112.
37. Percent of homeownership
113.
0.28
114.
37
115.
38. Percent of housing units with kitchen
116.
0.26
117.
38
118.
39. Percent of population over 65 years old
119.
0.26
120.
39
121.
40. Percent of population under 6 years old
122.
0.24
123.
40
124.
41. Distance to police station
125.
0.24
126.
41
127.
42. Percent of housing units with bathroom
128.
0.24
129.
42
130.
43. Drainage
131.
0.22
132.
43
133.
44. Aspect
134.
0.22
135.
44

References

  1. Noy, I.; Vu, T.B. The economics of natural disasters in a developing country: The case of Vietnam. J. Asian Econ. 2010, 21, 345–354. [Google Scholar] [CrossRef] [Green Version]
  2. Jenkins, K. Indirect economic losses of drought under future projections of climate change: A case study for Spain. Nat. Hazards 2013, 69, 1967–1986. [Google Scholar] [CrossRef]
  3. Estrada, F.; Botzen, W.W.; Tol, R.S. Economic losses from US hurricanes consistent with an influence from climate change. Nat. Geosci. 2015, 8, 880–884. [Google Scholar] [CrossRef]
  4. Galbusera, L.; Giannopoulos, G. On input-output economic models in disaster impact assessment. Int. J. Disaster Risk Reduct. 2018, 30, 186–198. [Google Scholar] [CrossRef]
  5. Schilling, J.; Hertig, E.; Tramblay, Y.; Scheffran, J. Climate change vulnerability, water resources and social implications in North Africa. Reg. Environ. Chang. 2020, 20, 1–12. [Google Scholar] [CrossRef] [Green Version]
  6. Yariyan, P.; Zabihi, H.; Wolf, I.D.; Karami, M.; Amiriyan, S. Earthquake risk assessment using an integrated Fuzzy Analytic Hierarchy Process with Artificial Neural Networks based on GIS: A case study of Sanandaj in Iran. Int. J. Disaster Risk Reduct. 2020, 50, 101705. [Google Scholar] [CrossRef]
  7. Smith, K. Environmental Hazards: Assessing Risk and Reducing Disaster, 4th ed.; Routledge: New York, NY, USA, 2004. [Google Scholar]
  8. Rus, K.; Kilar, V.; Koren, D. Resilience assessment of complex urban systems to natural disasters: A new literature review. Int. J. Disaster Risk Reduct. 2018, 31, 311–330. [Google Scholar] [CrossRef]
  9. Dragović, N.; Vasiljević, Ð.; Stankov, U.; Vujičić, M. Go social for your own safety! Review of social networks use on natural disasters–case studies from worldwide. Open Geosci. 2019, 11, 352–366. [Google Scholar] [CrossRef]
  10. Beroya-Eitner, M.A. Ecological vulnerability indicators. Ecol. Indic. 2016, 60, 329–334. [Google Scholar] [CrossRef]
  11. Shen, S.; Cheng, C.; Song, C.; Yang, J.; Yang, S.; Su, K.; Yuan, L.; Chen, X. Spatial distribution patterns of global natural disasters based on biclustering. Nat. Hazards 2018, 92, 1809–1820. [Google Scholar] [CrossRef]
  12. Hakala, E.; Lähde, V.; Majava, A.; Toivanen, T.; Vadén, T.; Järvensivu, P.; Eronen, J.T. Northern Warning Lights: Ambiguities of Environmental Security in Finland and Sweden. Sustainability 2019, 11, 2228. [Google Scholar] [CrossRef] [Green Version]
  13. Gupta, A.K.; Negi, M.; Nandy, S.; Alatalo, J.M.; Singh, V.; Pandey, R. Assessing the vulnerability of socio-environmental systems to climate change along an altitude gradient in the Indian Himalayas. Ecol. Indic. 2019, 106, 105512. [Google Scholar] [CrossRef]
  14. Hoffmann, S.; Beierkuhnlein, C. Climate change exposure and vulnerability of the global protected area estate from an international perspective. Divers. Distrib. 2020, 26, 1496–1509. [Google Scholar] [CrossRef]
  15. Maikhuri, R.; Nautiyal, A.; Jha, N.; Rawat, L.; Maletha, A.; Phondani, P.; Bahuguna, Y.; Bhatt, G. Socio-ecological vulnerability: Assessment and coping strategy to environmental disaster in Kedarnath valley, Uttarakhand, Indian Himalayan Region. Int. J. Disaster Risk Reduct. 2017, 25, 111–124. [Google Scholar] [CrossRef]
  16. Frigerio, I.; De Amicis, M. Mapping social vulnerability to natural hazards in Italy: A suitable tool for risk mitigation strategies. Environ. Sci. Policy 2016, 63, 187–196. [Google Scholar] [CrossRef]
  17. Oulahen, G.; Mortsch, L.; O’Connell, E.; Harford, D.; Rutledge, A. Local practitioners’ use of vulnerability and resilience concepts in adaptation to flood hazards. Clim. Chang. 2019, 153, 41–58. [Google Scholar] [CrossRef]
  18. Varis, O.; Kummu, M.; Salmivaara, A. Ten major rivers in monsoon Asia-Pacific: An assessment of vulnerability. Appl. Geogr. 2012, 32, 441–454. [Google Scholar] [CrossRef]
  19. Singh, R.; Kumar, R. Vulnerability of water availability in India due to climate change: A bottom-up probabilistic Budyko analysis. Geophys. Res. Lett. 2015, 42, 9799–9807. [Google Scholar] [CrossRef] [Green Version]
  20. Singh, S.J.; Fischer-Kowalski, M.; Haas, W. The sustainability of humanitarian aid: The Nicobar islands as a case of ‘complex disaster’. In The Asian Tsunami and Post-Disaster Aid; Springer: Singapore, 2018; pp. 143–165. [Google Scholar]
  21. Duy, P.N.; Chapman, L.; Tight, M. Resilient transport systems to reduce urban vulnerability to floods in emerging-coastal cities: A case study of Ho Chi Minh City, Vietnam. Travel Behav. Soc. 2019, 15, 28–43. [Google Scholar] [CrossRef]
  22. Cariolet, J.-M.; Vuillet, M.; Diab, Y. Mapping urban resilience to disasters–A review. Sustain. Cities Soc. 2019, 51, 101746. [Google Scholar] [CrossRef]
  23. Shah, A.A.; Ye, J.; Abid, M.; Khan, J.; Amir, S.M. Flood hazards: Household vulnerability and resilience in disaster-prone districts of Khyber Pakhtunkhwa province, Pakistan. Nat. Hazards 2018, 93, 147–165. [Google Scholar] [CrossRef]
  24. Fakhruddin, B.S.; Reinen-Hamill, R.; Robertson, R. Extent and evaluation of vulnerability for disaster risk reduction of urban Nuku’alofa, Tonga. Prog. Disaster Sci. 2019, 2, 100017. [Google Scholar] [CrossRef]
  25. Pagano, A.; Pluchinotta, I.; Giordano, R.; Vurro, M. Drinking water supply in resilient cities: Notes from L’Aquila earthquake case study. Sustain. Cities Soc. 2017, 28, 435–449. [Google Scholar] [CrossRef]
  26. Mishra, A.; Ghate, R.; Maharjan, A.; Gurung, J.; Pathak, G.; Upraity, A.N. Building ex ante resilience of disaster-exposed mountain communities: Drawing insights from the Nepal earthquake recovery. Int. J. Disaster Risk Reduct. 2017, 22, 167–178. [Google Scholar] [CrossRef]
  27. Wu, J.; He, X.; Li, Y.; Shi, P.; Ye, T.; Li, N. How earthquake-induced direct economic losses change with earthquake magnitude, asset value, residential building structural type and physical environment: An elasticity perspective. J. Environ. Manag. 2019, 231, 321–328. [Google Scholar] [CrossRef]
  28. Pandit, A.; Biswal, K.C. Prediction of earthquake magnitude using adaptive neuro fuzzy inference system. Earth Sci. Inform. 2019, 12, 513–524. [Google Scholar] [CrossRef]
  29. Majhi, S.K.; Hossain, S.S.; Padhi, T. MFOFLANN: Moth flame optimized functional link artificial neural network for prediction of earthquake magnitude. Evol. Syst. 2020, 11, 45–63. [Google Scholar] [CrossRef]
  30. Tziavou, O.; Pytharouli, S.; Souter, J. Unmanned Aerial Vehicle (UAV) based mapping in engineering geological surveys: Considerations for optimum results. Eng. Geol. 2018, 232, 12–21. [Google Scholar] [CrossRef] [Green Version]
  31. Naik, S.P.; Kim, Y.-S.; Kim, T.; Su-Ho, J. Geological and structural control on localized ground effects within the Heunghae Basin during the Pohang Earthquake (MW 5.4, 15th November 2017), South Korea. Geosciences 2019, 9, 173. [Google Scholar] [CrossRef] [Green Version]
  32. Harirchian, E.; Lahmer, T. Improved Rapid Assessment of Earthquake Hazard Safety of Structures via Artificial Neural Networks. IOP Conf. Ser. Mater. Sci. Eng. 2020, 897, 012014. [Google Scholar] [CrossRef]
  33. Harirchian, E.; Kumari, V.; Jadhav, K.; Raj Das, R.; Rasulzade, S.; Lahmer, T. A Machine Learning Framework for Assessing Seismic Hazard Safety of Reinforced Concrete Buildings. Appl. Sci. 2020, 10, 7153. [Google Scholar] [CrossRef]
  34. Harirchian, E.; Lahmer, T. Developing a hierarchical type-2 fuzzy logic model to improve rapid evaluation of earthquake hazard safety of existing buildings. Structures 2020, 28, 1384–1399. [Google Scholar] [CrossRef]
  35. Harirchian, E.; Lahmer, T.; Kumari, V.; Jadhav, K. Application of Support Vector Machine Modeling for the Rapid Seismic Hazard Safety Evaluation of Existing Buildings. Energies 2020, 13, 3340. [Google Scholar] [CrossRef]
  36. Harirchian, E.; Jadhav, K.; Kumari, V.; Lahmer, T. ML-EHSAPP: A prototype for machine learning-based earthquake hazard safety assessment of structures by using a smartphone app. Eur. J. Environ. Civ. Eng. 2021, 3, 1–21. [Google Scholar] [CrossRef]
  37. Harirchian, E.; Hosseini, S.E.A.; Jadhav, K.; Kumari, V.; Rasulzade, S.; Işık, E.; Wasif, M.; Lahmer, T. A review on application of soft computing techniques for the rapid visual safety evaluation and damage classification of existing buildings. J. Build. Eng. 2021, 43, 102536. [Google Scholar] [CrossRef]
  38. Harirchian, E.; Harirchian, A. Earthquake Hazard Safety Assessment of Buildings via Smartphone App: An Introduction to the Prototype Features-30. In Forum Bauinformatik: Von jungen Forschenden für junge Forschende: September 2018, Informatik im Bauwesen; Professur Informatik im Bauwesen; Bauhaus-Universität Weimar: Weimar, Germany, 2018; pp. 289–297. [Google Scholar]
  39. Bai, Y.; Hu, J.; Su, J.; Liu, X.; Liu, H.; He, X.; Meng, S.; Mas, E.; Koshimura, S. Pyramid Pooling Module-Based Semi-Siamese Network: A Benchmark Model for Assessing Building Damage from xBD Satellite Imagery Datasets. Remote Sens. 2020, 12, 4055. [Google Scholar] [CrossRef]
  40. Su, J.; Bai, Y.; Wang, X.; Lu, D.; Zhao, B.; Yang, H.; Mas, E.; Koshimura, S. Technical Solution Discussion for Key Challenges of Operational Convolutional Neural Network-Based Building-Damage Assessment from Satellite Imagery: Perspective from Benchmark xBD Dataset. Remote Sens. 2020, 12, 3808. [Google Scholar] [CrossRef]
  41. Valentijn, T.; Margutti, J.; van den Homberg, M.; Laaksonen, J. Multi-Hazard and Spatial Transferability of a CNN for Automated Building Damage Assessment. Remote Sens. 2020, 12, 2839. [Google Scholar] [CrossRef]
  42. Kheirizadeh Aroq, M.; Esmaeilpour, M.; Sarvar, H. Vulnerability assessment of cities to earthquake based on the catastrophe theory: A case study of Tabriz city, Iran. Environ. Earth Sci. 2020, 79, 1–21. [Google Scholar]
  43. Karimzadeh, S.; Miyajima, M.; Hassanzadeh, R.; Amiraslanzadeh, R. A GIS-based seismic hazard, building vulnerability and human loss assessment for the earthquake scenario in Tabriz. Soil Dyn. Earthq. Eng. 2014, 66, 263–280. [Google Scholar] [CrossRef]
  44. Hassanzadeh, R.; Nedovic-Budic, Z.; Alavi Razavi, A.; Norouzzadeh, M. Interactive approach for GIS based earthquake scenario development and resource estimation (Karmania hazard model). Comput. Geosci. 2013, 51, 324–338. [Google Scholar] [CrossRef]
  45. Zhang, X.; Song, Q.; Zheng, Y.; Hou, B.; Gou, S. Classification of imbalanced hyperspectral imagery data using support vector sampling. In Proceedings of the 2014 IEEE Geoscience and Remote Sensing Symposium, Quebec City, QC, Canada, 13–18 July 2014; pp. 2870–2873. [Google Scholar]
  46. Puertas, O.L.; Brenning, A.; Meza, F.J. Balancing misclassification errors of land cover classification maps using support vector machines and Landsat imagery in the Maipo river basin (Central Chile, 1975–2010). Remote Sens. Environ. 2013, 137, 112–123. [Google Scholar] [CrossRef]
  47. Armaş, I.; Toma-Danila, D.; Ionescu, R.; Gavriş, A. Vulnerability to earthquake hazard: Bucharest case study, Romania. Int. J. Disaster Risk Sci. 2017, 8, 182–195. [Google Scholar] [CrossRef]
  48. Nazmfar, H.; Saredeh, A.; Eshgi, A.; Feizizadeh, B. Vulnerability evaluation of urban buildings to various earthquake intensities: A case study of the municipal zone 9 of Tehran. Hum. Ecol. Risk Assess. Int. J. 2019, 25, 455–474. [Google Scholar] [CrossRef]
  49. Armaş, I. Diagnosis of landslide risk for individual buildings: Insights from Prahova Subcarpathians, Romania. Environ. Earth Sci. 2014, 71, 4637–4646. [Google Scholar] [CrossRef]
  50. Alizadeh, M.; Alizadeh, E.; Asadollahpour Kotenaee, S.; Shahabi, H.; Beiranvand Pour, A.; Panahi, M.; Bin Ahmad, B.; Saro, L. Social vulnerability assessment using artificial neural network (ANN) model for earthquake hazard in Tabriz city, Iran. Sustainability 2018, 10, 3376. [Google Scholar] [CrossRef] [Green Version]
  51. Alizadeh, M.; Hashim, M.; Alizadeh, E.; Shahabi, H.; Karami, M.R.; Beiranvand Pour, A.; Pradhan, B.; Zabihi, H. Multi-criteria decision making (MCDM) model for seismic vulnerability assessment (SVA) of urban residential buildings. ISPRS Int. J. Geo-Inf. 2018, 7, 444. [Google Scholar] [CrossRef] [Green Version]
  52. Aradag, S.; Genc, Y.; Turk, C. Comparative gasketed plate heat exchanger performance prediction with computations, experiments, correlations and artificial neural network estimations. Eng. Appl. Comput. Fluid Mech. 2017, 11, 467–482. [Google Scholar] [CrossRef]
  53. Taormina, R.; Chau, K.-W.; Sivakumar, B. Neural network river forecasting through baseflow separation and binary-coded swarm optimization. J. Hydrol. 2015, 529, 1788–1797. [Google Scholar] [CrossRef]
  54. Hajihassani, M.; Armaghani, D.J.; Marto, A.; Mohamad, E.T. Ground vibration prediction in quarry blasting through an artificial neural network optimized by imperialist competitive algorithm. Bull. Eng. Geol. Environ. 2015, 74, 873–886. [Google Scholar] [CrossRef]
  55. Gordan, B.; Armaghani, D.J.; Hajihassani, M.; Monjezi, M. Prediction of seismic slope stability through combination of particle swarm optimization and neural network. Eng. Comput. 2016, 32, 85–97. [Google Scholar] [CrossRef]
  56. Islam, M.S.; Mohandes, M.; Rehman, S. Vertical extrapolation of wind speed using artificial neural network hybrid system. Neural Comput. Appl. 2017, 28, 2351–2361. [Google Scholar] [CrossRef]
  57. Sharma, M.; Purohit, G.; Mukherjee, S. Information retrieves from brain MRI images for tumor detection using hybrid technique K-means and artificial neural network (KMANN). In Networking Communication and Data Knowledge Engineering; Springer: Berlin/Heidelberg, Germany, 2018; pp. 145–157. [Google Scholar]
  58. Masozera, M.; Bailey, M.; Kerchner, C. Distribution of impacts of natural disasters across income groups: A case study of New Orleans. Ecol. Econ. 2007, 63, 299–306. [Google Scholar] [CrossRef]
  59. Suhrabi, Z.; Delpisheh, A.; Taghinejad, H. Tragedy of women’s self-immolation in Iran and developing communities: A review. Int. J Burns. Trauma 2012, 2, 93–104. [Google Scholar]
  60. Berberian, M.; Arshadi, S. On the evidence of the youngest activity of the North Tabriz Fault and the seismicity of Tabriz city. Geol. Surv. Iran Rep. 1976, 39, 397–418. [Google Scholar]
  61. Jackson, J. Partitioning of strike-slip and convergent motion between Eurasia and Arabia in eastern Turkey and the Caucasus. J. Geophys. Res. Solid Earth 1992, 97, 12471–12479. [Google Scholar] [CrossRef]
  62. Ghayamghamian, M.; Rajool, A. Long-period Ground Motion Simulation for NTF Fault Near-source energy released. In Proceedings of the Fifteenth World Conference on Earthquake Engineering, Lisbon, Portugal, 18 June 2012; pp. 23–25. [Google Scholar]
  63. Wu, J.; He, T.; Cheng, P.G. Study on land degradation mapping by using hyperion data in HengShan Region of China. Prog. Geogr. 2006, 25, 131–139. [Google Scholar]
  64. Birkmann, J. Risk and vulnerability indicators at different scales: Applicability, usefulness and policy implications. Environ. Hazards 2007, 7, 20–31. [Google Scholar] [CrossRef]
  65. Aceves-Quesada, J.F.; Díaz-Salgado, J.; López-Blanco, J. Vulnerability assessment in a volcanic risk evaluation in Central Mexico through a multi-criteria-GIS approach. Nat. Hazards 2007, 40, 339–356. [Google Scholar] [CrossRef]
  66. Kumar, P.; Thakur, P.K.; Bansod, B.K.; Debnath, S.K. Multi-criteria evaluation of hydro-geological and anthropogenic parameters for the groundwater vulnerability assessment. Environ. Monit. Assess. 2017, 189, 1–24. [Google Scholar] [CrossRef]
  67. Ghajari, Y.E.; Alesheikh, A.A.; Modiri, M.; Hosnavi, R.; Abbasi, M.; Sharifi, A. Urban vulnerability under various blast loading scenarios: Analysis using GIS-based multi-criteria decision analysis techniques. Cities 2018, 72, 102–114. [Google Scholar] [CrossRef]
  68. Zabihi, H.; Alizadeh, M.; Wolf, I.D.; Karami, M.; Ahmad, A.; Salamian, H. A GIS-based fuzzy-analytic hierarchy process (F-AHP) for ecotourism suitability decision making: A case study of Babol in Iran. Tour. Manag. Perspect. 2020, 36, 100726. [Google Scholar] [CrossRef]
  69. Krosnick, J.A. Survey research. Annu. Rev. Psychol. 1999, 50, 537–567. [Google Scholar] [CrossRef]
  70. Shash, A.A. Factors considered in tendering decisions by top UK contractors. Constr. Manag. Econ. 1993, 11, 111–118. [Google Scholar] [CrossRef]
  71. Gergel, S.E. Spatial and non-spatial factors: When do they affect landscape indicators of watershed loading? Landsc. Ecol. 2005, 20, 177–189. [Google Scholar] [CrossRef]
  72. Pingoud, K.; Ekholm, T.; Savolainen, I. Global warming potential factors and warming payback time as climate indicators of forest biomass use. Mitig. Adapt. Strateg. Glob. Chang. 2012, 17, 369–386. [Google Scholar] [CrossRef]
  73. ESRI. Arc GIS (GIS and Mapping software); Environmental Systems Research Institute (ESRI): West Redlands, CA, USA, 2005. [Google Scholar]
  74. Kohonen, T. Self-organized formation of topologically correct feature maps. Biol. Cybern. 1982, 43, 59–69. [Google Scholar] [CrossRef]
  75. Weller, A.F.; Harris, A.J.; Ware, J.A. Artificial neural networks as potential classification tools for dinoflagellate cyst images: A case using the self-organizing map clustering algorithm. Rev. Paleobot. Palynol. 2006, 141, 287–302. [Google Scholar] [CrossRef]
  76. Nourani, V.; Baghanam, A.H.; Adamowski, J.; Gebremichael, M. Using self-organizing maps and wavelet transforms for space–time pre-processing of satellite precipitation and runoff data in neural network based rainfall–runoff modeling. J. Hydrol. 2013, 476, 228–243. [Google Scholar] [CrossRef]
  77. Geravand, S.; Ahmadi, M. Bloom filter applications in network security: A state-of-the-art survey. Comput. Netw. 2013, 57, 4047–4064. [Google Scholar] [CrossRef]
  78. Castillo, O.; Melin, P.; Ramírez, E.; Soria, J. Hybrid intelligent system for cardiac arrhythmia classification with Fuzzy K-Nearest Neighbors and neural networks combined with a fuzzy system. Expert Syst. Appl. 2012, 39, 2947–2955. [Google Scholar] [CrossRef]
  79. Caballero-Águila, R.; Hermoso-Carazo, A.; Linares-Pérez, J. Distributed fusion filters from uncertain measured outputs in sensor networks with random packet losses. Inf. Fusion 2017, 34, 70–79. [Google Scholar] [CrossRef]
  80. Paola, J.D.; Schowengerdt, R.A. A review and analysis of back propagation neural networks for classification of remotely sensed multi-spectral imagery. Int. J. Remote Sens. 1995, 16, 3033–3058. [Google Scholar] [CrossRef]
  81. Gong, P. Integrated analysis of spatial data for multiple sources: Using evidential reasoning and artificial neural network techniques for geological mapping. Photogramm. Eng. Rem Sens. 1996, 62, 513–523. [Google Scholar]
  82. Lee, S.; Ryu, J.; Won, J.; Park, H. Determination and application of the weights for landslide susceptibility mapping using an artificial neural network. Eng. Geol. 2004, 71, 289–302. [Google Scholar] [CrossRef]
  83. Abraham, A. Artificial Neural Networks. In Handbook of Measuring System Design; Peter, S.-H., Richard, T., Eds.; John Wiley and Sons: London, UK, 2004; pp. 901–908. [Google Scholar]
  84. Atkinson, P.M.; Tatnall, A.R.L. Introduction neural networks in remote sensing. Int. J. Remote Sens. 1997, 18, 699–709. [Google Scholar] [CrossRef]
  85. Pradhan, B.; Lee, S.; Buchroithner, M.F. Use of geospatial data for the development of fuzzy algebraic operators to landslide hazard mapping: A case study in Malaysia. Appl. Geomat. 2009, 1, 3–15. [Google Scholar] [CrossRef] [Green Version]
  86. Bohari, A.M.; Hin, C.W.; Fuad, N. The competitiveness of halal food industry in Malaysia: A SWOT-ICT analysis. Geogr.-Malays. J. Soc. Space 2017, 9, 145–167. [Google Scholar]
  87. Monavari, M.; Mogooee, A.R. Environmental Strategic Management; Kavoush Qalam: Iran, Tehran, 2007. [Google Scholar]
  88. Moosavi, S.J.; Safania, A.M.; Gholami, S. Feasibility athletic abilities nature (ecotourism, sports) West Mazandaran using SWOT analysis. Int. Res. J. Basic Appl. Sci. 2013, 5, 1238–1244. [Google Scholar]
  89. Bull, J.W.; Jobstvogt, N.; Böhnke-Henrichs, A.; Mascarenhas, A.; Sitas, N.; Baulcomb, C.; Lambini, C.K.; Rawlins, M.; Baral, H.; Zähringer, J. Strengths, Weaknesses, Opportunities and Threats: A SWOT analysis of the ecosystem services framework. Ecosyst. Serv. 2016, 17, 99–111. [Google Scholar] [CrossRef]
  90. Phadermrod, B.; Crowder, R.M.; Wills, G.B. Importance-performance analysis based SWOT analysis. Int. J. Inf. Manag. 2019, 44, 194–203. [Google Scholar] [CrossRef] [Green Version]
  91. Harfst, J.; Wirth, P.; Lintz, G.; Bieberstein, C. Strengths, Weaknesses, Opportunities and Threats of European Mining Regions (SWOT Report I); Leibniz Institute of Ecological and Regional Development (IOER): Dresden, Germany, 2010; p. 103. [Google Scholar]
  92. Reihanian, A.; Binti Mahmood, N.Z.; Kahrom, E.; Hin, T.W. Sustainable tourism development strategy by SWOT analysis: Boujagh National Park, Iran. Tour. Manag. Perspect. 2012, 4, 223–228. [Google Scholar] [CrossRef]
  93. Scolozzi, R.; Schirpke, U.; Morri, E.; D’Amato, D.; Santolini, R. Ecosystem services-based SWOT analysis of protected areas for conservation strategies. J. Environ. Manag. 2014, 146, 543–551. [Google Scholar] [CrossRef]
  94. Zharan, K.; Bongaerts, J.C. Decision-making on the integration of renewable energy in the mining industry: A case studies analysis, a cost analysis and a SWOT analysis. J. Sustain. Min. 2017, 16, 162–170. [Google Scholar] [CrossRef]
  95. Ghorbani, A.; Raufirad, V.; Rafiaani, P.; Azadi, H. Ecotourism sustainable development strategies using SWOT and QSPM model: A case study of Kaji Namakzar Wetland, South Khorasan Province, Iran. Tour. Manag. Perspect. 2015, 16, 290–297. [Google Scholar] [CrossRef]
  96. Wang, Q.; Guo, Y.; Yu, L.; Li, P. Earthquake prediction based on spatio-temporal data mining: An LSTM network approach. IEEE Trans. Emerg. Top. Comput. 2017, 8, 148–158. [Google Scholar] [CrossRef]
  97. Cardona, O.D.; Ordaz, M.; Reinoso, E.; Yamín, L.E.; Barbat, A.H. CAPRA—Comprehensive approach to probabilistic risk assessment: International initiative for risk management effectiveness. In Proceedings of the 15th World Conference on Earthquake Engineering, Lisbon, Portugal, 24–28 September 2012. [Google Scholar]
  98. Pelling, M.; High, C. Understanding adaptation: What can social capital offer assessments of adaptive capacity? Glob. Environ. Chang. 2005, 15, 308–319. [Google Scholar] [CrossRef]
  99. Der Sarkissian, R.; Zaninetti, J.M.; Abdallah, C. The use of geospatial information as support for Disaster Risk Reduction; Contextualization to Baalbek-Hermel Governorate/Lebanon. Appl. Geogr. 2019, 111, 102075. [Google Scholar] [CrossRef]
  100. Jena, R.; Pradhan, B.; Beydoun, G.; Sofyan, H.; Affan, M. Integrated model for earthquake risk assessment using neural network and analytic hierarchy process: Aceh province, Indonesia. Geosci. Front. 2020, 11, 613–634. [Google Scholar] [CrossRef]
  101. Moradi, M.; Delavar, M.R.; Moshiri, B. A GIS-based multi-criteria analysis model for earthquake vulnerability assessment using Choquet integral and game theory. Nat. Hazards 2017, 87, 1377–1398. [Google Scholar] [CrossRef]
  102. Lee, S.; Panahi, M.; Pourghasemi, H.R.; Shahabi, H.; Alizadeh, M.; Shirzadi, A.; Khosravi, K.; Melesse, A.M.; Yekrangnia, M.; Rezaie, F. Sevucas: A novel gis-based machine learning software for seismic vulnerability assessment. Appl. Sci. 2019, 9, 3495. [Google Scholar] [CrossRef] [Green Version]
  103. Sadrykia, M.; Delavar, M.R.; Zare, M. A GIS-Based Fuzzy Decision Making Model for Seismic Vulnerability Assessment in Areas with Incomplete Data. ISPRS Int. J. Geo-Inf. 2017, 6, 119. [Google Scholar] [CrossRef] [Green Version]
  104. Dahmani, K.; Dizene, R.; Notton, G.; Paoli, C.; Voyant, C.; Nivet, M.L. Estimation of 5-min time-step data of tilted solar global irradiation using ANN (artificial neural network) model. Energy 2014, 70, 374–381. [Google Scholar] [CrossRef]
Figure 1. Geographical location of Tabriz in Iran and its municipal zones.
Remotesensing 13 04519 g001
Figure 2. Methodological framework of the study to develop Earthquake Vulnerability Maps.
Remotesensing 13 04519 g002
Figure 4. SWOT matrix with final marks obtained from evaluating an internal and external IE Matrix shows that Zone 1 is located in the ‘competitive-strategy’ quadrant, i.e., for this zone we should appoint strategies that capitalize on the strengths of the city which ensure security against environmental threats.
Remotesensing 13 04519 g004
Table 1. Default characteristics and parameters of the ANN-SOM in IDRISI Selva.
GroupParameterDefault Value
Sampling in band imagesColumn interval3
Row interval7
Network parametersOutput layer neuron45 × 45 = 2025
Initial neighborhood radius64 × 64
Min. learning rate0.5
Max. learning rate1
Fine-tuned parametersMin. gain term0.1
Max. gain term0.8
Fine-tuned ruleLVQ2
Fine-tunined epochs80
Classification specificationOutput hard
classification map
Yes
Display feature mapYes
Algorithm for unknown pixelsMin mean distance
Table 2. Default characteristics and parameters of the ANN-MLP in the IDRISI Selva.
GroupParameterDefault Value
Input specificationsAvg. training pixels
per class
500
Avg. test pixels
per class
500
Network
topology
Hidden layers1
Training parametersAutomatic trainingYes
Dynamic learning rateYes
Learning rate0.0006
End learning rate0.000625
Momentum factor0.5
Sigmoid constant “a”1.0
Stopping criteriaRMS0.001
Iterations10,000
Accuracy rate90.00
Table 3. The SWOT structure.
PerspectiveOpportunities (O)Threats (T)
Strengths (S)(Area 1)
Aggressive strategies: Harnessing opportunities by using strengths (SO).
(Area 3)
Conservative strategies: Using the potential advantages which are hidden in environmental opportunities to compensate for the weaknesses of the city (WO).
Weaknesses (W)(Area 2)
Competitive strategies: Capitalising on the strengths for preventing the threats (ST).
(Area 4)
Defensive strategies: Minimizing the losses from threats and weaknesses (WT).
Table 4. Percentage of land cover by earthquake vulnerability of municipalities (zones) in Tabriz, Iran.
VulnerabilityVery HighHighModerateLowVery Low%
Zone one6.9612.4030.1648.751.72100.00
Zone two1.6410.2518.6752.9516.49100.00
Zone three0.175.7716.0466.4211.60100.00
Zone four1.3727.6539.7127.650.00100.00
Zone five17.5616.7423.2642.410.02100.00
Zone six0.000.0075.1424.860.00100.00
Zone seven0.000.0024.775.400.00100.00
Zone eight1.050.0039.6856.083.19100.00
Zone nine0.000.0076.1023.750.15100.00
Table 5. Assessment of Population Vulnerability (PV) in Tabriz according SOM Method.
VulnerabilityVery HighHighModerateLowVery LowPercent
Zone one23.7727.0824.1724.240.74100.00
Zone two9.2832.4226.5816.9114.82100.00
Zone three1.0422.2434.6734.417.64100.00
Zone four13.6241.5730.4214.380.00100.00
Zone five37.7331.4014.3116.550.00100.00
Zone six0.000.0089.1010.900.00100.00
Zone seven0.000.000.7299.620.00100.00
Zone eight0.000.0078.1421.860.00100.00
Zone nine0.000.00100.000.000.00100.00
Table 6. Assessment of Residential Building Vulnerability (RBV) in Tabriz according SOM Method.
VulnerabilityVery HighHighModerateLowVery LowPercentNumber of Buildings
Zone one13.6121.8034.0529.401.12100.0043,790
Zone two5.4630.9634.7714.4414.37100.0020,563
Zone three0.051.604.003.500.84100.0021,900
Zone four3.2438.0447.7011.020.00100.0033,766
Zone five35.9126.5619.0618.460.00100.005543
Zone six0.000.0086.9713.040.00100.003765
Zone seven0.000.008.4091.600.00100.001363
Zone eight0.0014.4034.1249.012.46100.00505
Zone nine0.000.0078.9621.040.01100.001793
Table 7. Earthquake vulnerability in Tabriz, Iran, according to the MLP algorithm.
VulnerabilityArea (m2)Hectares%
Very High3,053,5433062
High14,330,48714326
Medium87,294,910873034
Low134,963,68213,49753
Very Low16,251,35316265
SUM255,893,97525,591100
Table 8. Level of vulnerability of the Tabriz, Iran, municipality zones according to MLP.
VulnerabilityVery HighHighModerateLowVery LowPercent
Zone one5.749.8023.2357.943.29100.00
Zone two0.445.8015.3268.3010.14100.00
Zone three0.143.2916.2858.2022.10100.00
Zone four1.0825.5735.7335.941.69100.00
Zone five16.1414.2627.0042.540.06100.00
Zone six0.002.5641.4154.901.13100.00
Zone seven0.000.0028.8067.553.65100.00
Zone eight0.000.000.0053.043.28100.00
Zone nine0.000.0072.8627.080.05100.00
Table 9. Assessment of Population Vulnerability (PV) in Tabriz according to the MLP method.
VulnerabilityVery HighHighModerateLowVery LowPercent
Zone one19.9723.6125.2830.510.64100.00
Zone two2.8316.7313.3752.9914.08100.00
Zone three0.7212.5017.7653.6315.39100.00
Zone four3.3058.0621.7516.290.59100.00
Zone five35.9926.0522.7415.220.00100.00
Zone six0.0003.8269.8426.350.00100.00
Zone seven0.000.008.5875.5815.84100.00
Zone eight0.000.0066.6719.8112.16100.00
Zone nine0.000.00100.000.000.00100.00
Table 10. Assessment of Residential Building Vulnerability (RBV) in Tabriz according to the MLP method.
VulnerabilityVery HighHighModerateLowVery LowPercentNumber of Buildings
Zone one11.3317.8031.0138.960.90100.0043,200
Zone two01.4919.1634.8839.215.26100.0020,491
Zone three0.4321.4751.8514.5411.71100.0022,200
Zone four2.6744.1840.0312.540.59100.0034,567
Zone five33.3224.7126.7415.220.01100.005564
Zone six0.004.8555.4239.580.16100.003476
Zone seven0.000.004.9790.564.47100.001364
Zone eight0.000.0048.951.100.00100.00408
Zone nine0.000.0065.434.600.00100.001790
Table 11. Correlation between the MLP and SOM for the most vulnerable zones.
SOMMLP
SOMPearson Correlation10.997
Sig. (2-tailed) 0.00
N66
MLPPearson Correlation0.9971
Sig. (2-tailed)0.00
N66
Table 12. Correlation between the MLP and SOM for the least vulnerable zones.
SOMMLP
SOMPearson correlation10.921
Sig. (two-tailed) 0.026
N55
MLPPearson correlation0.9211
Sig. (two-tailed)0.026
N56
Table 13. Q-average of least and most vulnerable zones to earthquakes in Tabriz, Iran.
Least VulnerableMost Vulnerable
Q-average0.890.95
Table 14. Population density and land use characteristics of municipal Zone one in Tabriz, Iran.
Zone & RegionsPopulation in (2012) (Person)Residential Area (Hectare)Urban Constructed Area (Hectare)Total Area (Hectare)Net Population Density (Person/Hectare)Gross Population Density (Person/Hectare)
Constructed SpaceTotal Area
12,011,302.1552.41546.91546.9383.2137.3
1-178,698.3171.9333.2333.2458.3236.2
1-259,392.2148.8573.8573.8399.1104.4
1-373,212.4231.6639.8639.8316.2114.1
Table 15. External Factor Evaluation (EFE).
OpportunityWeightEffectiveness ScoreFinal Score
1Large number of young demographics in the population, particularly men, and using their potentials0.05230.156
2Presence of urban management0.05230.156
3Forming strengthening committees in East Azerbaijan Province and conducting studies on a number of public buildings and schools0.07840.312
4Granting of title deeds and official tenure right0.05230.156
5Granting of renewal incentive rules0.05230.156
6Feasibility of transforming abandoned buildings and empty spaces into needed land use types in the area such as green spaces0.05230.156
7Role of religious places in social interactions, training and communication0.02630.078
ThreatsWeightEffectiveness ScoreFinal Score
1Fine-grained lots0.10510.105
2Located on lands with a gradient of more than 5%0.10510.105
3This zone is located on fault lines0.13110.131
4Population density around gas stations of this zone0.07810.078
5Narrowness of thoroughfares0.05220.104
6Low distance to service centers of Tabriz (gas post, water reserves, petrol and gas station)0.10510.105
7Neglect of old buildings and probability of their destruction and leaving of large debris and blocking of thoroughfares0.05220.104
Total1 1.902
Table 16. Internal Factor Evaluation (IFE).
StrengthsWeightEffectiveness ScoreFinal Score
1High percentage of employees and low unemployment0.045430.1362
2Proper access to relief facilities such as fire station and hospital0.0940.36
3High access to urban open space0.06840.272
4Organizing specialized earthquake committee in the city of Tabriz and holding sessions every two months0.06830.204
5Holding earthquake and safety maneuver at schools0.06830.204
6People tendency toward housing renovation0.022730.681
7Allocating constructional budget to renovate infrastructure and development and renovation of drinking water network for various zones0.045430.1362
WeaknessesWeightEffectiveness ScoreFinal Score
1High population and building density0.0910.09
2High density of household0.06810.068
3Structural degradation of buildings due to their old ages0.0910.09
4Low quality of buildings in terms of materials0.0910.09
5High density of residential building and number of floors0.06810.068
6Poor access to the city center0.045420.0908
7Low renewal rates in residential building0.06820.136
8Delay in organizing and enabling as well as failure in planning in decision makings relevant to urban problems0.06820.136
Total1 2.7622
Table 17. Earthquake hazard mitigation strategies in Tabriz, Iran, based on a SWOT analysis.
Strengths (S)Weaknesses (W)
(1)
High percentage of employees and low unemployment
(2)
Proper access to relief facilities such as fire station and hospital
(3)
High access to urban open space
(4)
Organizing specialized earthquake committees in the city of Tabriz and holding sessions every two months
(5)
Holding earthquake and safety man oeuvres at schools
(6)
People’s attitudes toward housing renovation
(7)
Allocating constructional budget to renovate infrastructure, and the development and renovation of drinking water networks for various zones
(1)
High population and building density
(2)
High density of households
(3)
Structural degradation of buildings due to their old age
(4)
Low quality of buildings in terms of materials
(5)
High density of residential buildings and number of floors
(6)
Poor access to the city center
(7)
Low renewal rate in residential buildings, segregation from city
(8)
Delay in organizing and enabling as well as failure in planning in decision makings relevant to urban problems
Opportunities (O)(SO)(WO)
(1)
Large number of young demographics, particularly men, and using their potentials
(2)
Presence of urban management
(3)
Forming strengthening committees in East Azerbaijan Province and conducting studies on a number of public buildings and schools
(4)
Granting title deed and official tenure right
(5)
Granting renewal incentive rules
(6)
Feasibility of transforming abandoned buildings and empty spaces into required land uses in the area such as green spaces
(7)
Role of religious places in social interactions, training and communication
(3)
Broadening and promoting people’s cultural and public awareness concerning earthquakes and the hazards resulting from them
(4)
Enabling of residents and creating equipped urban spaces
(5)
New construction with more stability
(1)
Combining some lots due to improper sizes, topographic position and location
(2)
Reduction in population and building density
Threat (T)(ST)(WT)
(8)
Fine-grained lots
(9)
Locating on the lands with gradient more than 5%
(10)
This zone is located on fault lines
(11)
Population density around gas stations of this zone
(12)
Narrowness of thoroughfares
(13)
Low distance to danger centers of Tabriz (gas post, water reserves, petrol and gas station)
(14)
Inattention to old buildings and probability of their destruction and leaving large debris and blocking thoroughfares
(4)
Reinforcement of crisis confrontation subsystems in the city
(5)
Revitalization and renewal of land uses in historic areas
(6)
Proper design of open spaces inside urban areas of the zone by making hierarchy in their design
(7)
Optimal consideration of environmental phenomena in designing and locating of sites
(1)
Redistributing of land uses and considering their compatibility in decreasing population density around high risk areas
(2)
Preventing urban development and expansion in high risk areas
(3)
Reforming urban transportation networks
Table 18. Quantitative Strategies Planning Matrix (QSPM). AS represents attraction scores and TAS the total attraction scores.
Strategies
ST1ST2ST3ST4
FactorsWeightASTASASTASASTASASTAS
Strength
10.045420.090820.090810.045420.0908
20.090040.3610.090010.090040.36
30.068020.13610.068040.272030.204
40.068030.20430.204030.204030.204
50.068030.20410.068010.068010.0680
60.022720.045430.068130.068120.0454
70.045430.136220.090810.045410.0454
Weakness
10.090010.090010.090020.1810.0900
20.068010.068010.068020.13610.0680
30.090020.180020.180020.1810.0900
40.090020.180020.180020.1810.0900
50.068010.068010.068020.13610.0680
60.045420.090810.045430.136210.0454
70.068010.068020.136020.13620.1360
80.068020.136020.136030.20430.2040
Opportunity
10.05220.10420.10420.10410.052
20.05230.15630.15630.15630.156
30.07820.15640.31230.23420.156
40.05220.10410.05220.10420.104
50.05220.10420.10410.05210.052
60.05220.10420.10430.15610.052
70.02620.05210.02610.02610.026
Threat
10.10510.10510.10540.42010.105
20.10510.10520.21010.10540.420
30.13140.52430.39320.26240.524
40.07820.15610.07820.15610.078
50.05220.10410.05230.15620.104
60.10520.21020.21030.31510.105
70.05230.15640.20820.10420.104
Total4.190 3.690 4.430 3.480
Table 19. Results of the QSPM analysis for the recommended SWOT approach to address earthquake vulnerability.
StrategiesTotal Attractiveness
Score
ST3—Optimal consideration of environmental phenomena in designing and locating of sites4.43
ST1—Reinforcement of the crisis confrontation subsystems in the city4.19
ST2—Revitalization and renewal of land uses in historic areas3.69
ST4—Proper design of open spaces inside urban areas of the zone by creating hierarchy in their design3.48
Publisher’s Note: MDPI stays neutral with regard to jurisdictional claims in published maps and institutional affiliations.

