Abstract
Attenuation from fish can reduce the intensity of acoustic signals and significantly decrease detection range for long-range passive sensing of manmade vehicles, geophysical phenomena, and vocalizing marine life. The effect of attenuation from herring shoals on the Passive Ocean Acoustic Waveguide Remote Sensing (POAWRS) of surface vessels is investigated here, where concurrent wide-area active Ocean Acoustic Waveguide Remote Sensing (OAWRS) is used to confirm that herring shoals occluding the propagation path are responsible for measured reductions in ship radiated sound and corresponding detection losses. Reductions in the intensity of ship-radiated sound are predicted using a formulation for acoustic attenuation through inhomogeneities in an ocean waveguide that has been previously shown to be consistent with experimental measurements of attenuation from fish in active OAWRS transmissions. The predictions of the waveguide attenuation formulation are in agreement with measured reductions from attenuation, where the position, size, and population density of the fish groups are characterized using OAWRS imagery as well as in situ echosounder measurements of the specific shoals occluding the propagation path. Experimental measurements of attenuation presented here confirm previous theoretical predictions that common heuristic formulations employing free space scattering assumptions can be in significant error. Waveguide scattering and propagation theory is found to be necessary for accurate predictions.
1. Introduction
Acoustics is the primary means of sensing self-radiating sources in the ocean such as manmade vehicles, geophysical phenomena, and vocalizing marine mammals [1,2,3]. Attenuation from fish, however, can significantly decrease detection range for passive sensing in the ocean [4,5]. This makes it important to accurately predict attenuation from fish in long-range passive sensing. Attenuation from fish has been previously measured from fluctuations in the intensity of long-range acoustic signals caused by diel or seasonal shoaling patterns of the fish, including sardines in the Bristol Channel and groups of anchovies and sardines in the Gulf of Lion [4,5,6,7]. In these experiments fish population densities were inferred from the reductions in signal intensity, since it is difficult to measure instantaneous population distributions across long ranges with conventional survey methods. More recently, wide area Ocean Acoustic Waveguide Remote Sensing (OAWRS) was used to observe fish shoals over thousands of square kilometers and simultaneously measure attenuation from these shoals within the active OAWRS transmissions [8]. Here the effect of attenuation from fish on passive ocean acoustic waveguide remote sensing (POAWRS) of ship-radiated tonals is investigated, where wide-area OAWRS imagery of herring groups in Norwegian spawning grounds is used in conjunction with in situ echosounder data to measure the size and population density of the fish groups occluding the propagation path.
POAWRS has been previously applied to detect, localize, and classify vocalizations from fin whales in the Norwegian Sea [9], baleen whale species and toothed whale species in the Gulf of Maine [10,11,12], and sperm whales along the US east coast [13] over continental shelf-scale regions. Temporal–spatial distributions of marine mammal vocalizations measured by POAWRS in the Gulf of Maine have been compared with herring population density distributions in order to provide insights into the predator–prey dynamics in that ecosystem, and it was shown that marine mammals will spatially converge on fish spawning grounds and divide into separate foraging areas specific to each marine mammal species [3].
POAWRS has also been used to detect and characterize ship-radiated sound from surface vessels [14,15,16]. During previous OAWRS surveys of spawning herring in the Gulf of Maine and spawning capelin in Finnmark, Norway, ship-radiated tonals from research vessels were continuously measured with POAWRS over more than 10 h and at ranges of up to 30 km [14]. During the OAWRS survey of Norwegian herring spawning grounds, POAWRS detections of ship-radiated tonals from a fishing vessel less than 20 km away were lost to ambient background noise for periods of more than 1.5 h [14]. Here it is experimentally and theoretically shown that these detection losses are caused by attenuation from the herring shoals. The conditions determining whether attenuation from fish will significantly affect passive sensing are investigated here, and they are found to be similar to previously-demonstrated conditions determining whether attenuation will affect active sensing [8]. Attenuation from herring shoals did not significantly affect ship-radiated tonals in the Gulf of Maine since the frequencies of the tonals were well below the resonance peak of the shoaling herring in the region. Attenuation from capelin shoals did not significantly affect tonals in the Finnmark region because the size and population density of the capelin shoals were not sufficiently high. No attenuation was observed in one-way acoustic transmissions during an OAWRS survey of herring in the Gulf of Maine [17], likely because the direct propagation path between the source and receiver did not cross the fish shoals and the transmission frequencies were below the swimbladder resonance peak of the shoaling fish [8].
Here, POAWRS is used to measure reductions in ship-radiated sound due to attenuation from fish. A previous investigation of attenuation from fish measured reductions in active OAWRS transmissions [8]. Reductions in the intensity of ship-radiated tonals due to attenuation from fish are predicted using an analytical formualtion for acoustic propagation and scattering through an ocean waveguide with inhomogeneities [18]. This formulation has been previously shown to be consistent with experimental measurements of attenuation from fish to active OAWRS transmissions [8], as well as measurements of attenuation and temporal coherence loss in the presence of surface gravity waves, near-sea-surface air bubbles and internal waves [19,20,21,22]. Reductions in ship-radiated sound measured here are consistent with the predictions of the waveguide attenuation model, where the position, size, and population density of the fish groups occluding the propagation path are fully characterized using OAWRS imagery as well as in situ echosounder measurements. Common heuristic approaches that employ free space scattering assumptions for attenuation from fish are also investigated. While it has been theoretically shown that these heuristic approaches can be in disagreement with formulations that incorporate waveguide scattering and propagation effects [8], here it is experimentally confirmed that the heuristic approaches can be in significant error for predicting attenuation in a waveguide environment.
It is experimentally shown that reductions in the intensity of ship-radiated tonals increase with the size and population density of fish groups occluding the propagation path, with reductions of more than 4 dB commonly observed for the Norwegian herring shoals studied here. These intensity reductions are shown to lead to prolonged detection losses as dense herring shoals continuously occlude the propagation path. Such intensity reductions and corresponding detection losses may be significant in other regions where dense fish groups congregate, and may present significant impediments to passive sensing of other acoustic sources such as vocalizing marine mammals and underwater vehicles.
2. Materials and Methods
2.1. Measuring Reductions in Ship Tonal Intensity Due to Fish-Attenuation
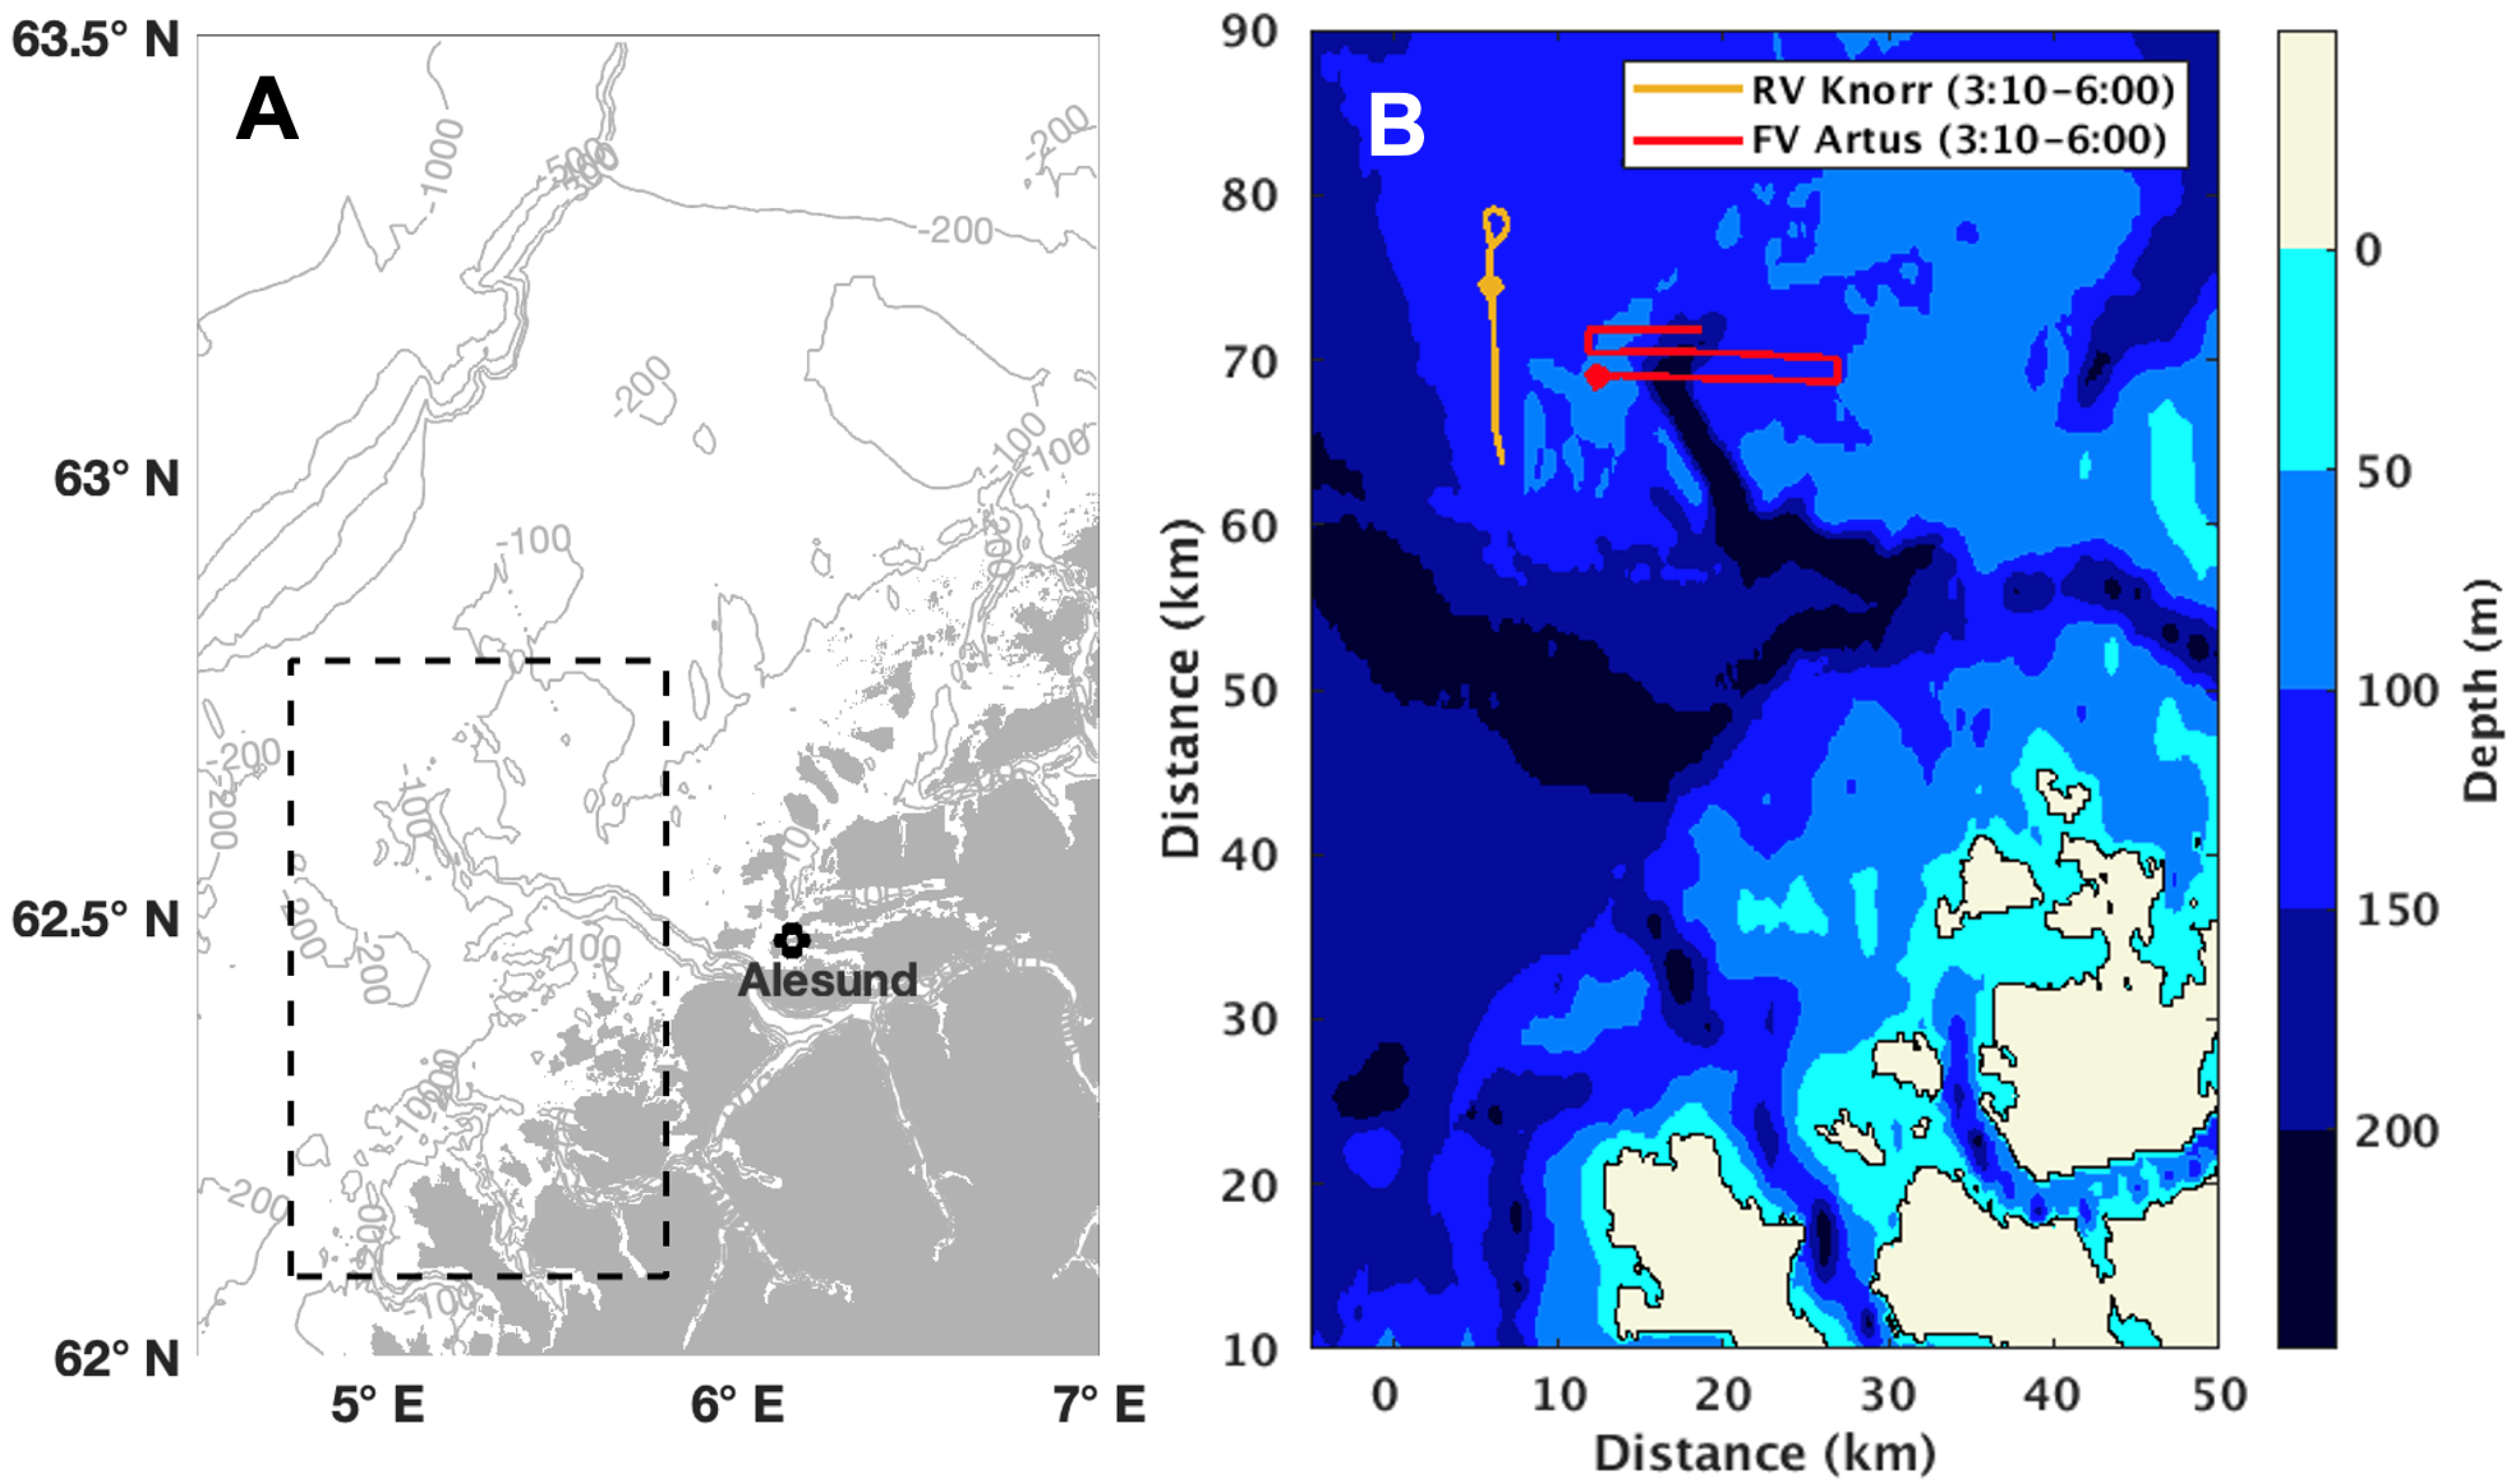
Ship-radiated tonals from the FV Artus are detected by the POAWRS system over a three-hour period during a survey of herring spawning grounds near Ålesund, Norway (Figure 1). Passive acoustic data is beamformed in the direction of the Artus using a large-aperture densely-sampled horizontal coherent receiver array towed behind the RV Knorr [14,15,16], where the relative bearing of the Artus is determined using GPS data from both ships. Concurrent wide-area scattering strength maps generated by the monostatic OAWRS system are used to monitor herring groups within a 30 km radius of the Knorr (Appendix B of [8]). Active OAWRS transmissions do not interfere with the passive measurements shown here since the frequency of the Artus tonal studied here (1584 Hz) is well above the OAWRS sensing frequency (955 Hz).
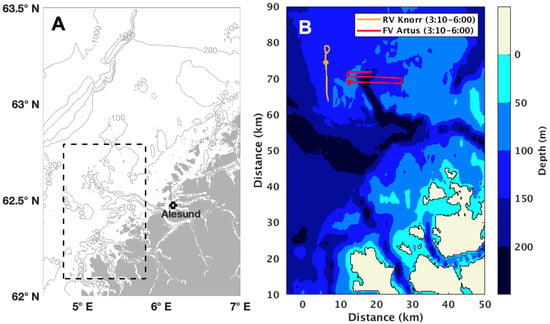
Figure 1.
Ship-radiated tonals from the FV Artus (red line in B) are intermittently detected by a horizontal coherent receiver array towed by the RV Knorr (orange line in B) in herring spawning grounds near Ålesund, Norway between 3:10 and 6:00 UTC on 21 February 2014. The location of the Norwegian Sea 2014 experiment off the coast of Ålesund where the FV Artus was present is shown in (A). The black dashed box in (A) denotes the region shown in (B). Red and orange dots in (B) denote the starting position of the tracks at 3:10 UTC.
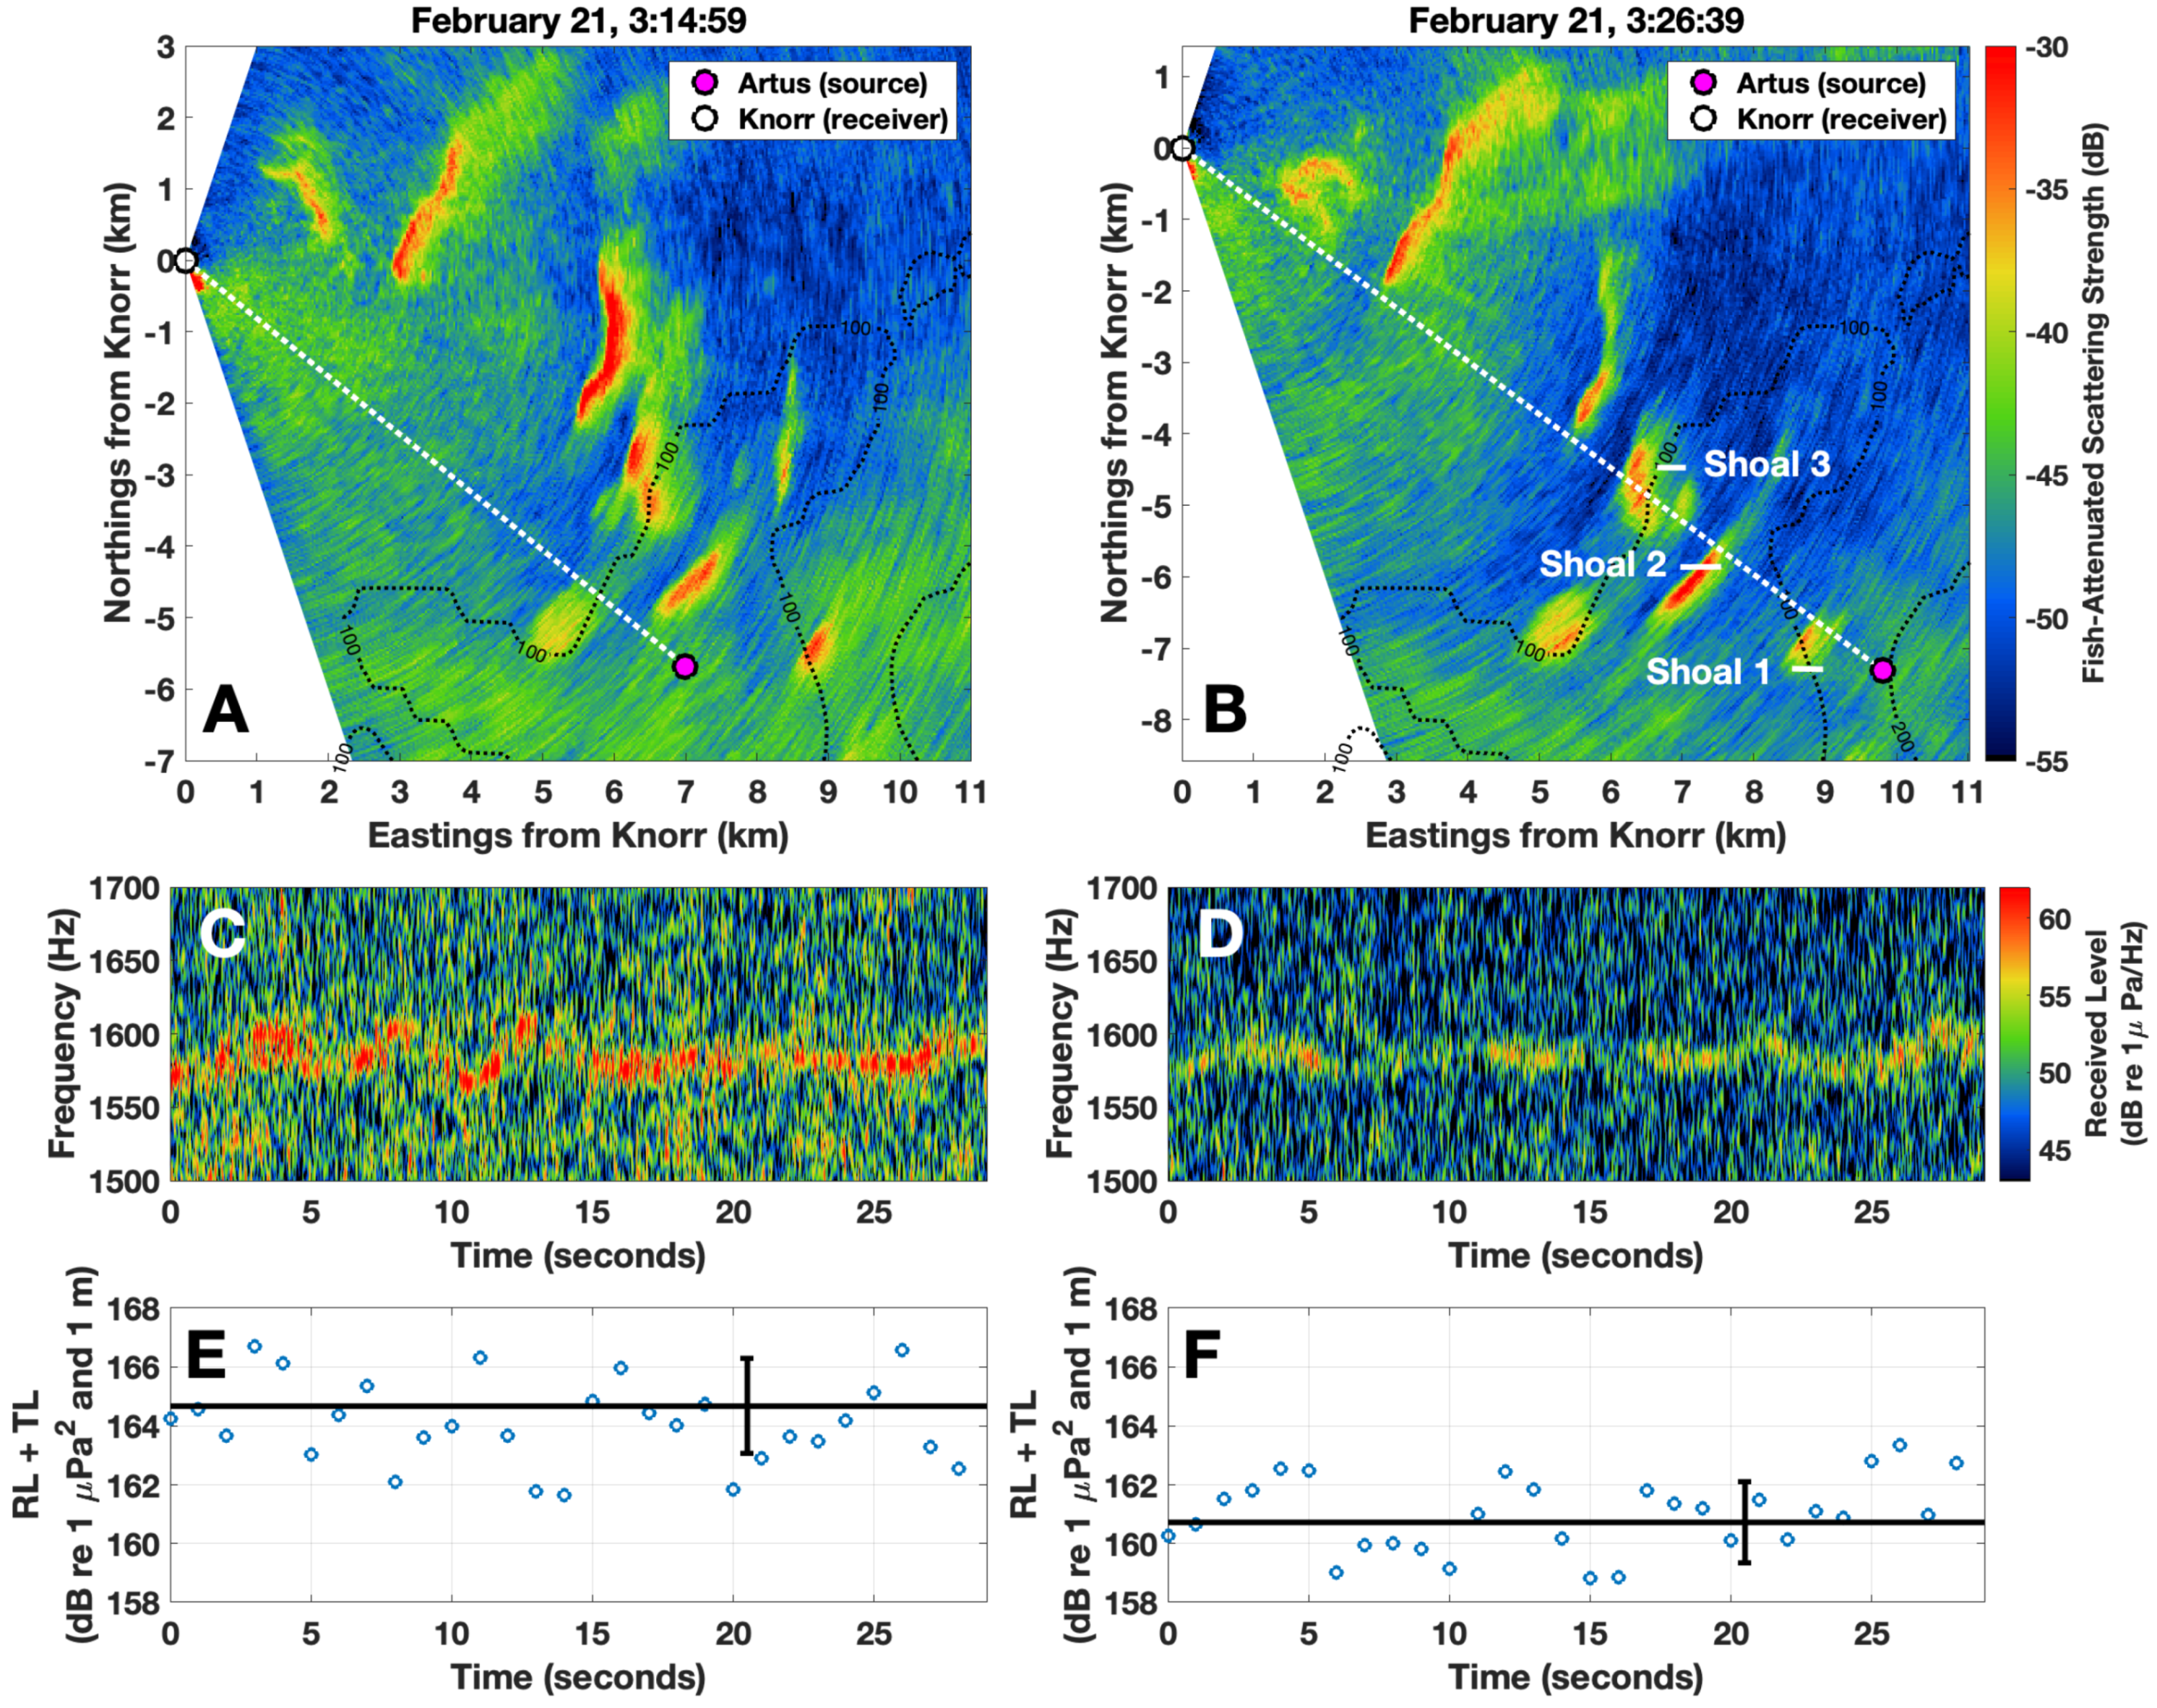
Significant reductions in the received level of ship-radiated tonals from the Artus are observed when three herring shoals occlude the propagation path between 3:15–3:26 on 21 February (Figure 2). The decrease in sound pressure level of the Artus tonal due to attenuation from fish is measured as the decrease in the received level beamformed in the direction of the Artus () corrected for transmission loss from spreading losses and seafloor scattering () after the fish groups occlude the propagation path, according to
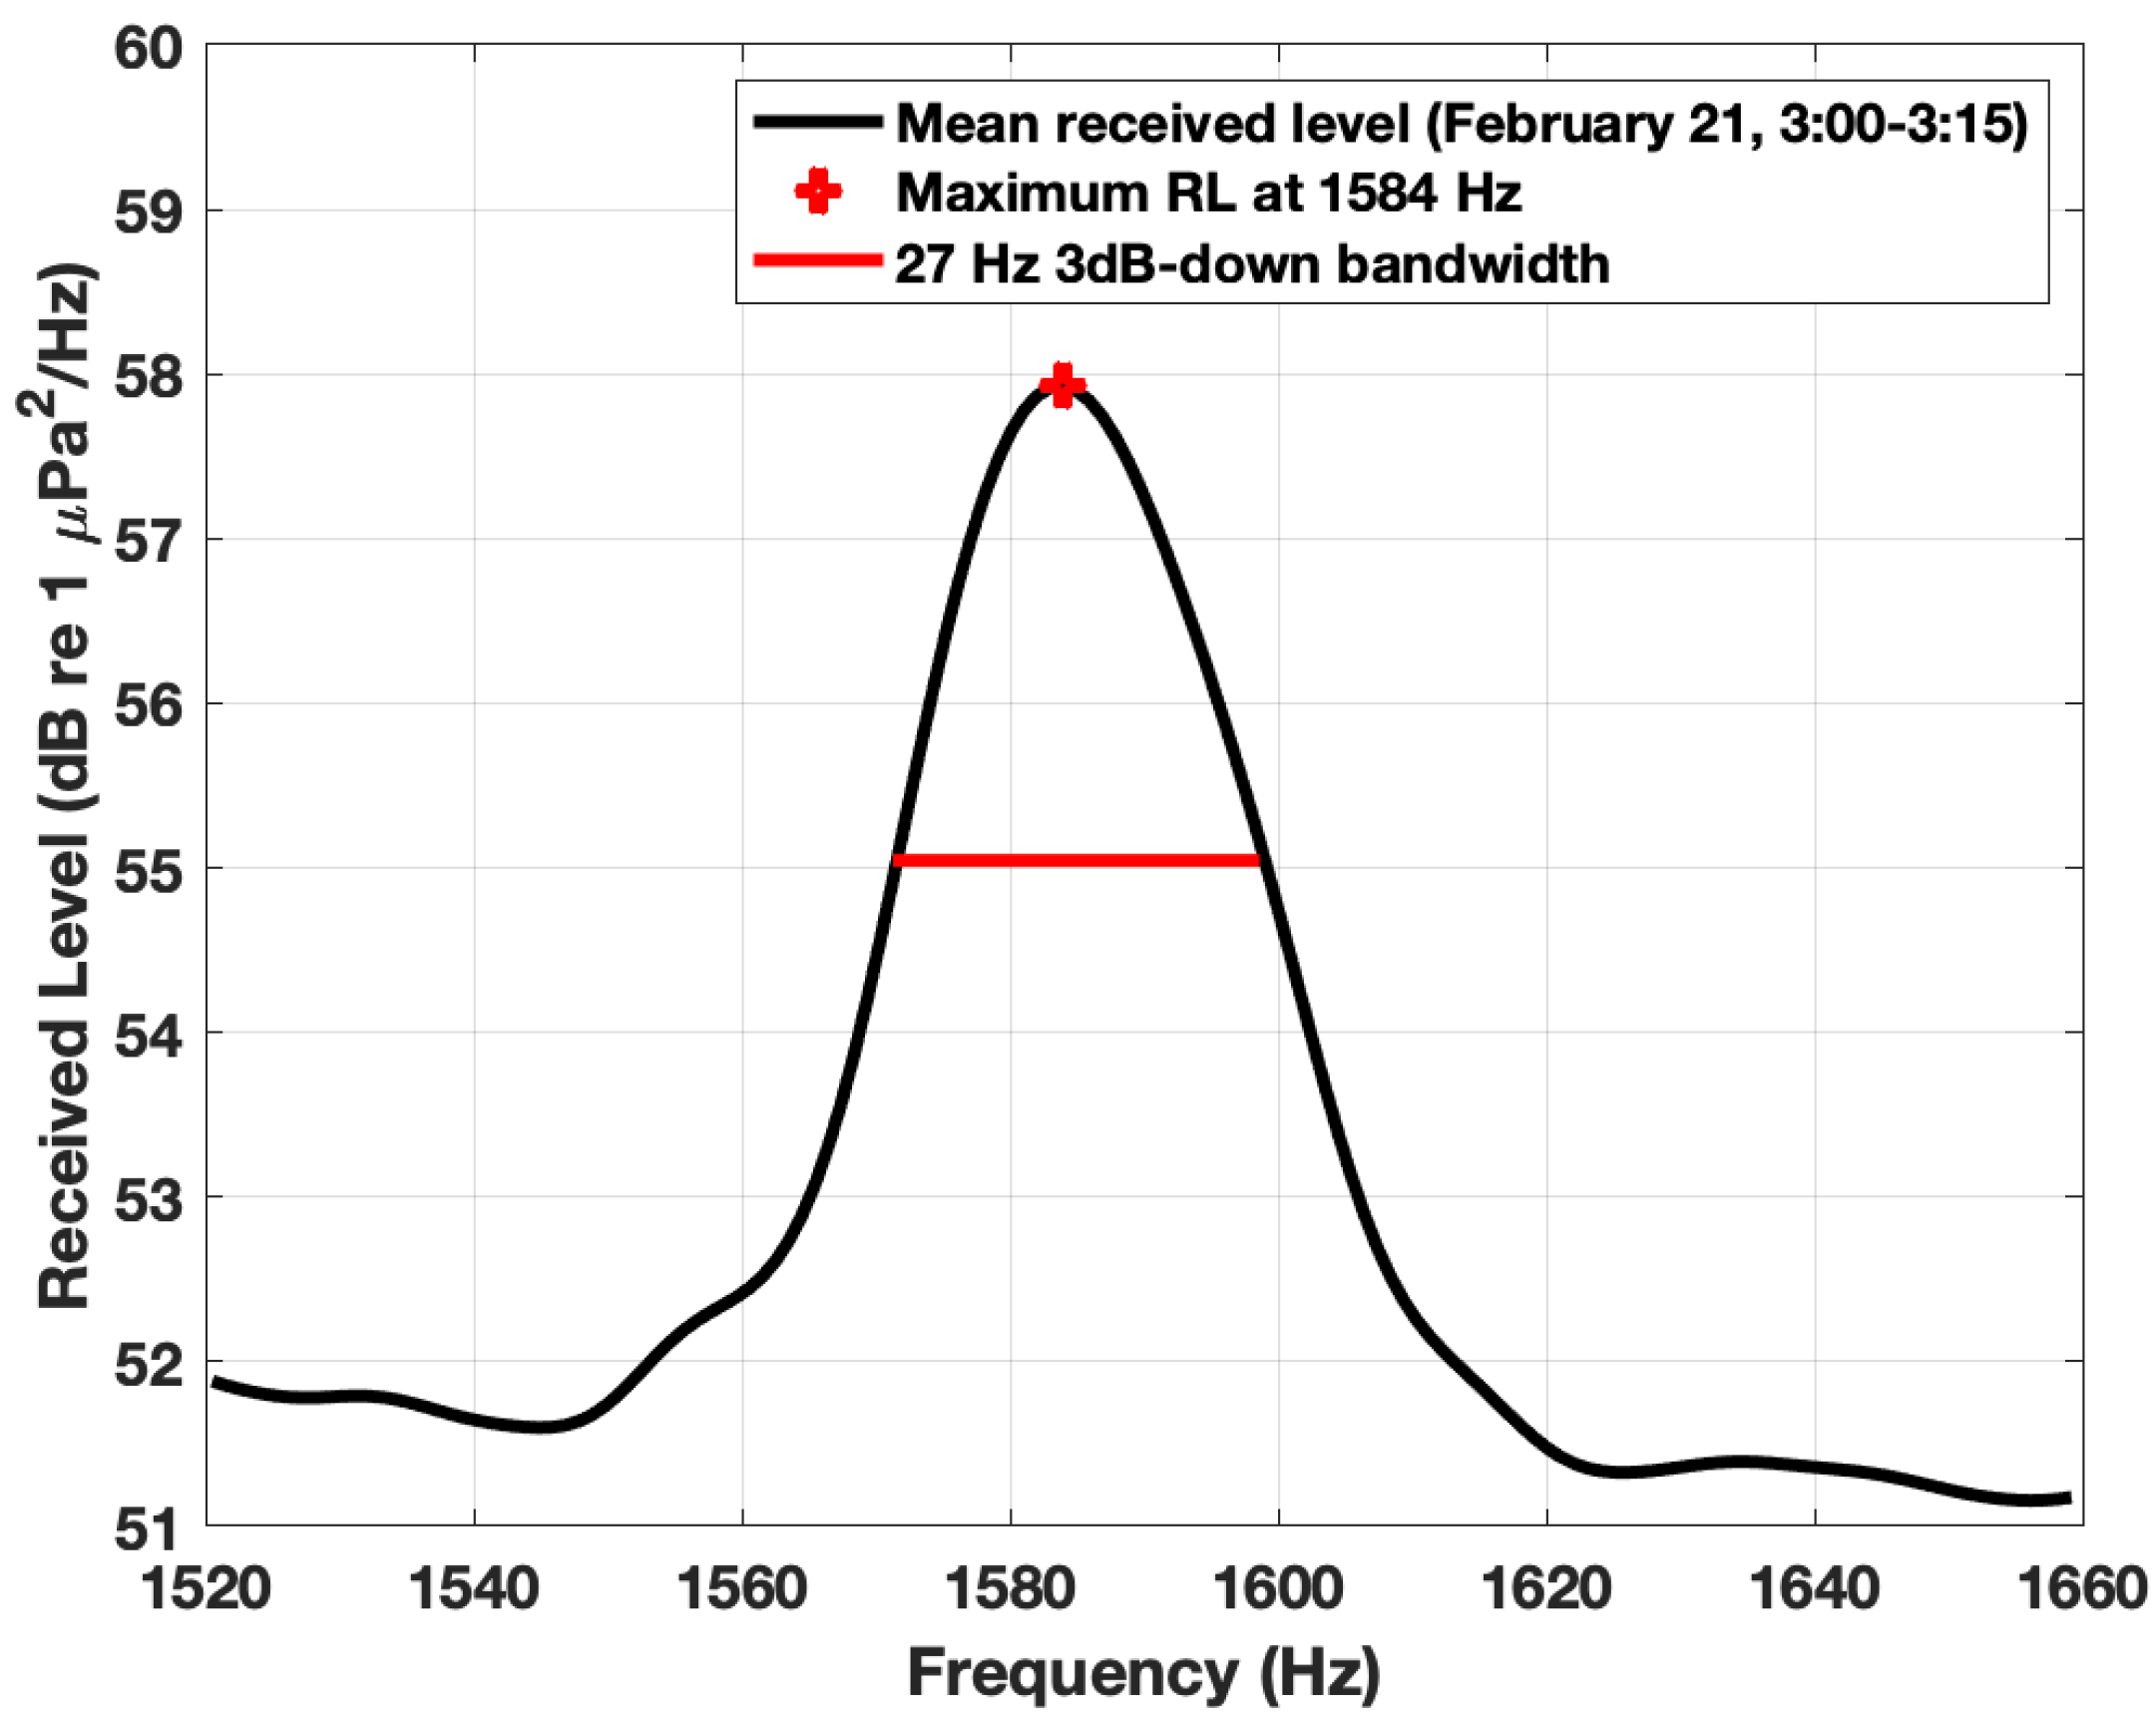
where corresponds to measurements where OAWRS imagery confirms that no significant fish groups occlude the propagation path from the Artus to the receiver (Figure 2A), and corresponds to measurements where significant fish groups are observed in OAWRS imagery along the propagation path (Figure 2B). The received level is calculated from the average received intensity at frequencies between , where = 1584 Hz is the center frequency of the Artus tonal and B = 27 Hz is the 3 dB-down bandwidth of the Artus tonal (Figure A3). Transmission loss from spreading losses and seafloor scattering () is defined as
where is the Green function between the source location and the receiver location . A parabolic equation model [23] is used to calculate the Green functions in the range-dependent environment, where the conditional expectation over the sound speed is determined by averaging five Monte-Carlo realizations. Each Monte-Carlo realization employs randomly-selected sound-speed profiles measured in the relevant environment (Figure A5) every 500 m along the propagation path. It has been previously shown that five Monte-Carlo realizations are sufficient to converge on the mean transmission loss in continental shelf waveguide environments using this method [24]. In the example shown in Figure 2 (3:15–3:26 on 21 February), is equal to 164.6 dB with a standard deviation of 1.6 dB, and is equal to 160.7 dB with a standard deviation of 1.4 dB. The decrease in the Artus tonal due to attenuation from fish is then 3.9 dB with a standard deviation of 2.1 dB. The distance from the Artus to the receiver increases from 9.1 km to 12.5 km during this time period, leading to an increase in the magnitude of transmission loss of approximately 1.2 dB. Variations in the speed of the Artus were less than 0.1 m/s between 3:15 and 3:26 (Figure A4C). The bearing of the receiver with respect to the Artus changed by less than 1° between 3:15 and 3:26 (Figure A4B), demonstrating that the directivity of the Artus signal did not contribute to measured intensity reductions.
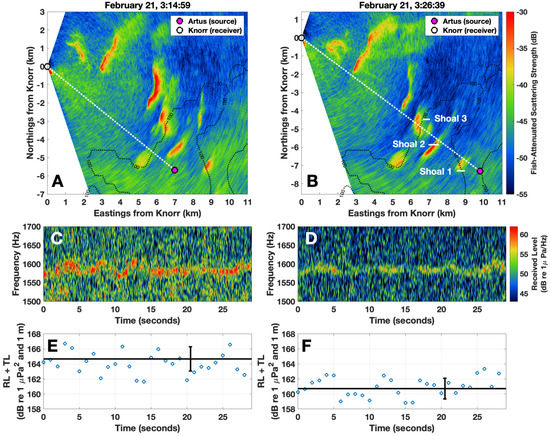
Figure 2.
Significant reductions in the intensity of a ship-radiated tonal from the FV Artus are observed when a group of three herring shoals occlude the propagation path. At 3:14:59, no fish groups are observed in wide-area OAWRS imagery along the propagation path from the Artus to the receiver array (A). At 3:26:39, OAWRS imagery reveals three fish shoals occluding the propagation path (B). Spectrograms of the 1584 Hz tonal from the Artus beamformed in the direction of the Artus are shown in (C,D), where significant reductions in the received level are observed after the fish groups occlude the propagation path. The received level within the bandwidth of the Artus tonal () corrected for transmission loss from spreading and seafloor attenuation () is shown in (E,F). Blue dots denote measurements averaged over 1 s intervals within the frequency band of the Artus tonal (1570.5–1597.5 Hz), and black lines denote the mean and standard deviation of these 1 s measurements. The three white lines in (B) correspond to echosounder transects of the three herring shoals shown in Figure 3. Fluctuations in the measured scattering strength of herring shoals between (A,B) are caused by attenuation from fish to OAWRS signals, which has been previously investigated in [8]. Reductions in the received level between 1500–1700 Hz (C,D) are likely caused by attenuation from herring of broadband noise from the Artus. Black dotted lines in (A,B) designate bathymetric contours.
2.2. Predicting Reductions in Ship Tonal Intensity Due to Fish-Attenuation
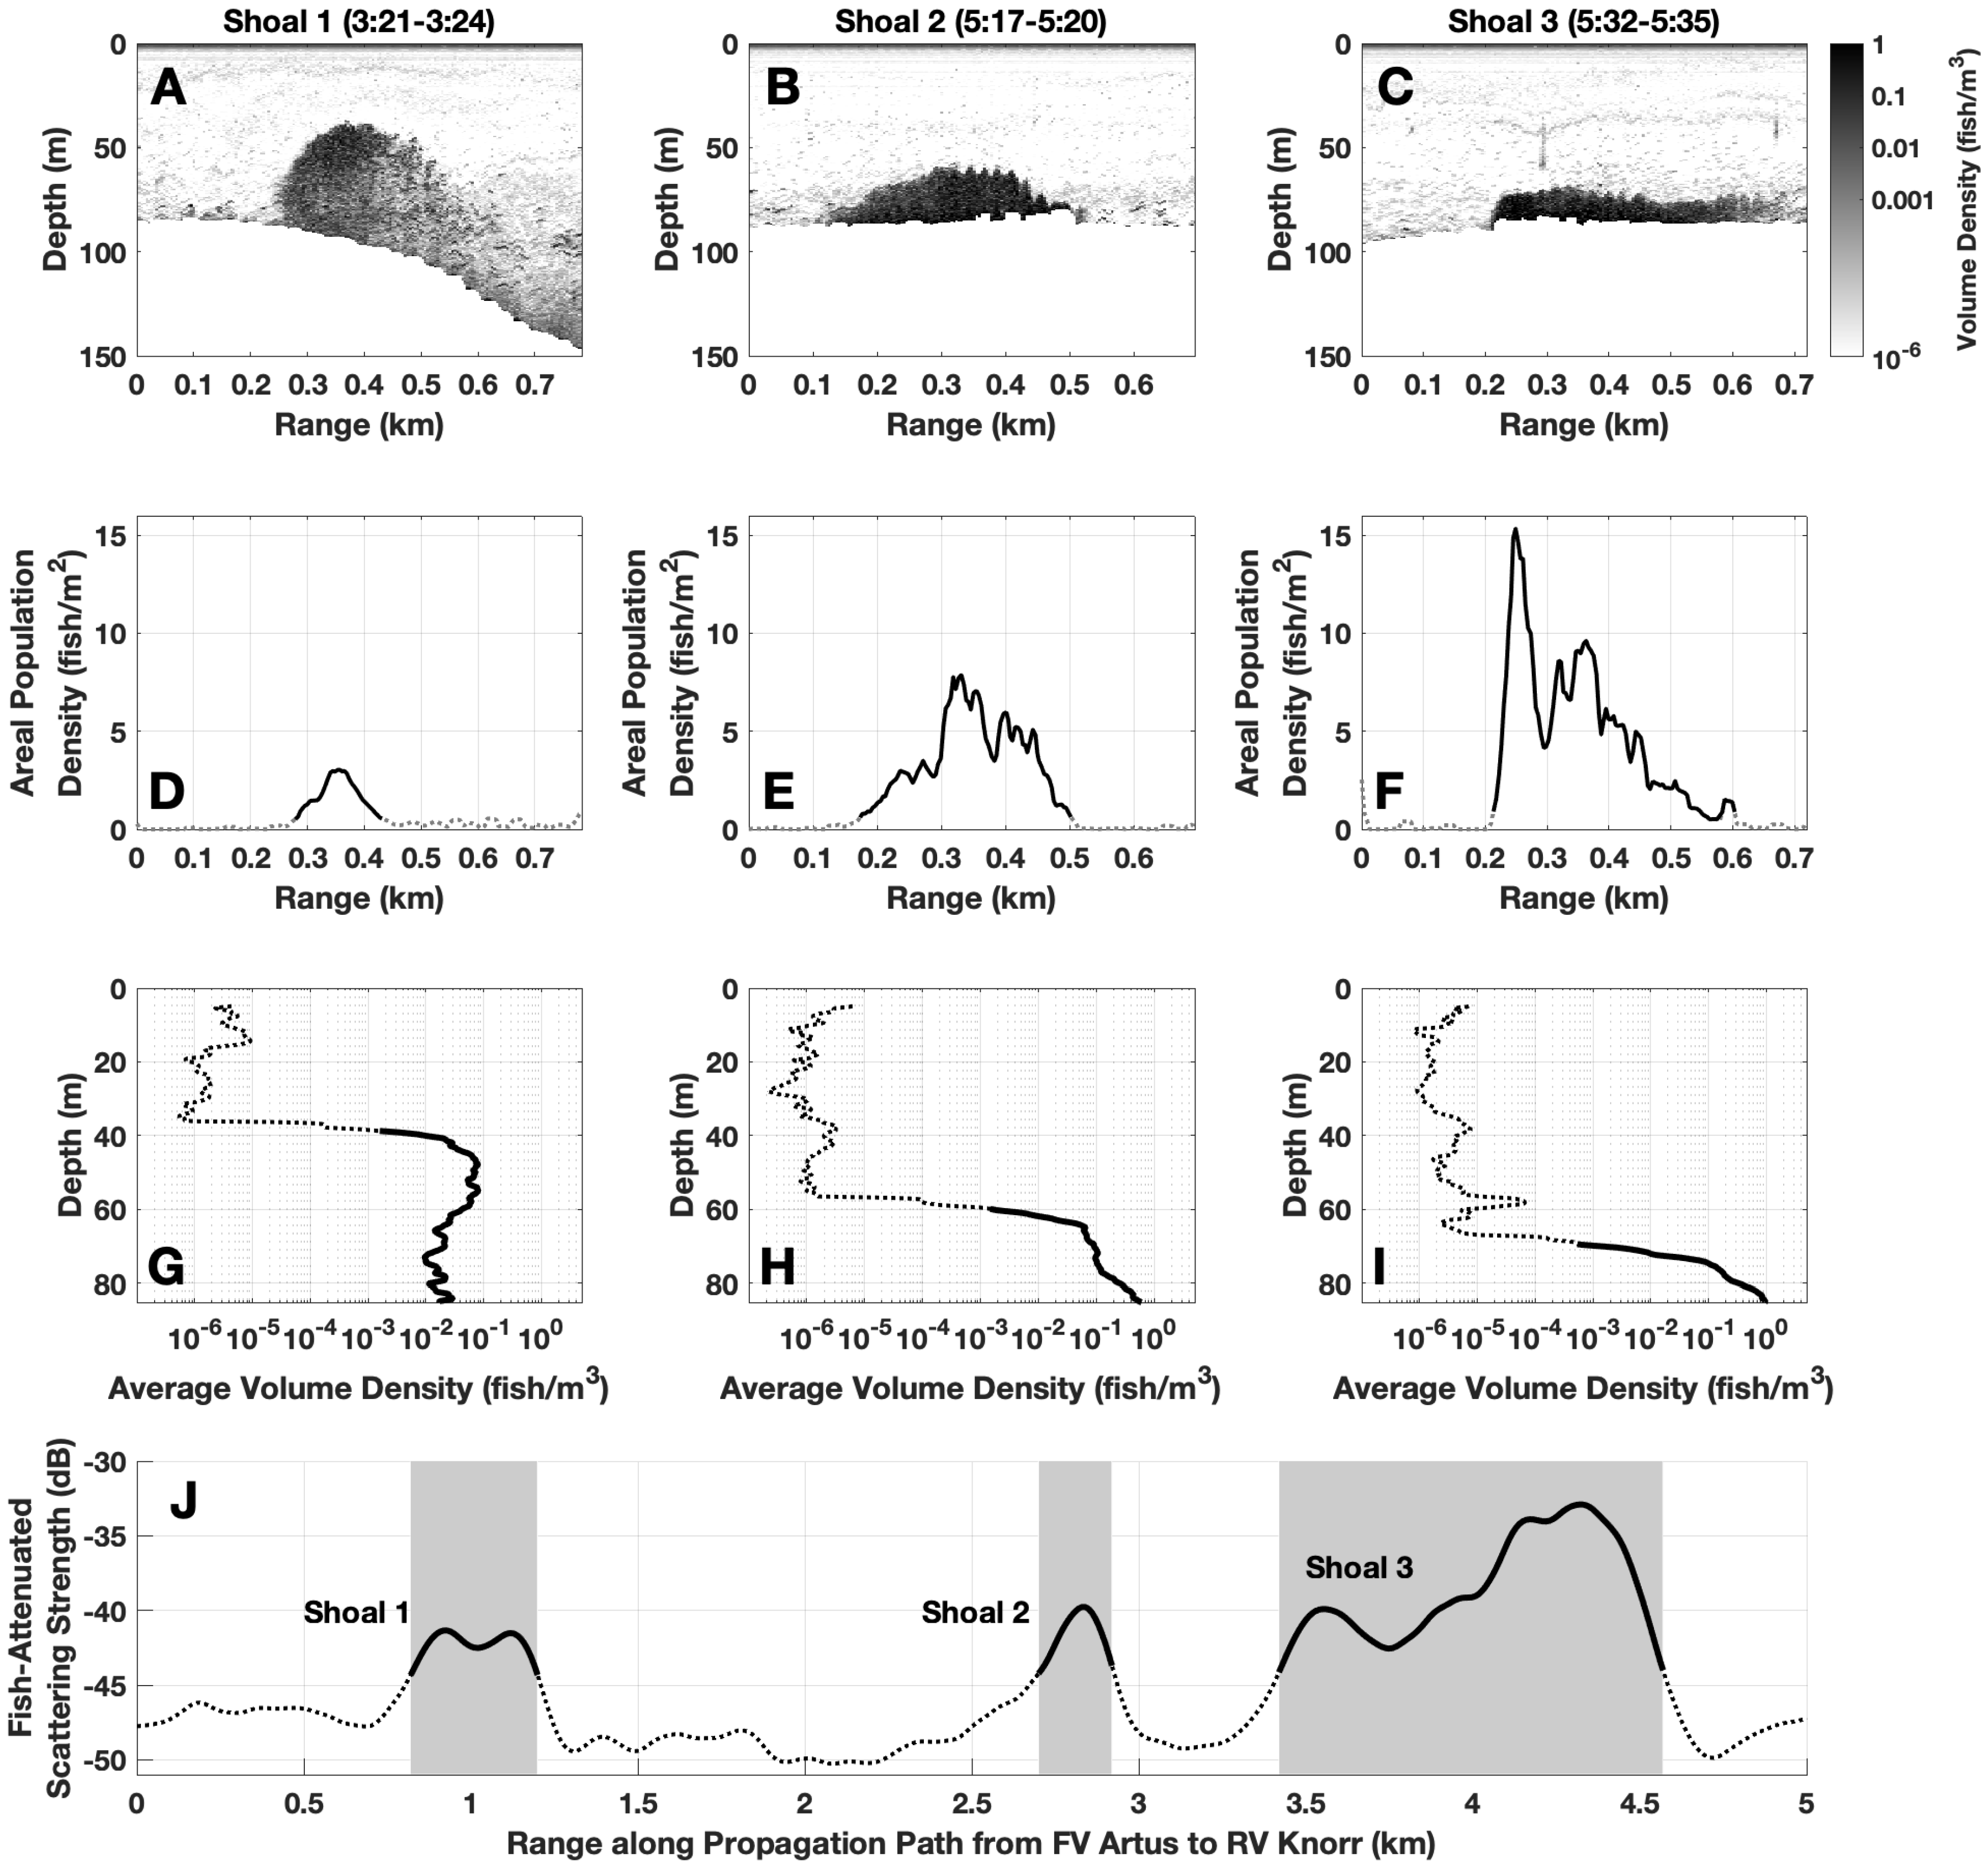
Reductions in the intensity of ship-radiated tonals due to attenuation from fish are predicted using a normal-mode-based analytical theory for acoustic propagation and scattering through inhomogeneities in an ocean waveguide [8,18]. Predicted reductions depend on the population density distribution with respect to depth and range along the propagation path. Since it is difficult to precisely characterize variations in population density for an individual shoal with respect to depth and range along the propagation path, each shoal is characterized here assuming a constant areal population density , as well as mean shoal depth , shoal vertical thickness H, mean range along the propagation path and horizontal width along the propagation path W. These variables are determined using a combination of OAWRS scattering strength maps and in situ echosounder measurements of the three shoals (Figure 3).
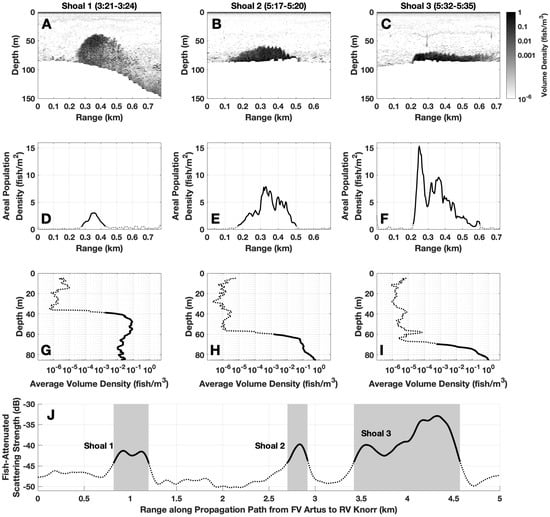
Figure 3.
In order to predict reductions in ship-radiated tonals from the FV Artus due to attenuation from herring, the areal population density, vertical position, and horizontal position of the three herring shoals labeled in Figure 2B are characterized using a combination of in situ echosounder measurements and OAWRS imagery. The areal population density and vertical distribution are estimated from echosounder measurements of the shoals recorded less than two hours from the OAWRS transmission (A–C). The areal density along each echosounder transect is shown in (D–F). The three shoals are segmented by choosing regions where the measured areal population density is above the critical population density at which herring groups were found to form (0.2 fish/m2, black solid lines in D–F) [25,26]. The vertical position of these shoals is determined by selecting depths where the average volumetric population density along each segment is greater than fish/m2 (black solid lines in G–I). The horizontal position of the shoals along the propagation path from the FV Artus to the receiver is estimated from OAWRS measurements of fish-attenuated scattering strength along the propagation path (J). The horizontal position of the shoals (gray boxes in J) is determined by selecting regions where the fish-attenuated scattering strength is 5.6 dB greater than the mean seafloor scattering level measured in this region (−50 dB).
The population density () and vertical distribution (, H) of the herring shoals occluding the propagation path are determined from in situ echosounder measurements of the shoals. Echosounder measurements of volumetric population density and areal population density are calculated according to Appendix G of [8]. The shoals are segmented by selecting regions where the areal population density is greater than the critical population density at which herring groups were found to form (0.2 fish/m2) [25,26], and the mean population density for each shoal is determined by averaging across these segments (Figure 3D–F). The mean depth and vertical thickness H for each shoal are chosen so that the average volumetric population density with respect to depth is greater than 10 fish/m3 at depths between and (Figure 3G–I).
The horizontal distribution of shoals along the propagation path (, W) is determined using OAWRS scattering strength measurements along the propagation path from the source (FV Artus) to the receiver (RV Knorr). OAWRS scattering strength is typically measured by correcting transmissions for source level, areal resolution footprint, spreading loss and seafloor attenuation [25,26,27,28], however the OAWRS transmissions in this environment have been previously shown to be affected by attenuation from herring shoals [8], so these measurements are referred to as “fish-attenuated scattering strength” (Appendix A). The mean range of each shoal along the propagation path and horizontal width of each shoal along the propagation path W are chosen so that the fish-attenuated scattering strength is 5.6 dB greater than background seafloor scattering at ranges between and (Figure 3J), where 5.6 dB is the standard deviation of an acoustic measurement after saturated multipath propagation when the time-bandwidth product is one [29,30]. Measured values of , , H, , and W for the three herring shoals studied here are shown in Table 1.

Table 1.
Parameters Characterizing the three Herring Shoals in Figure 3.
3. Results
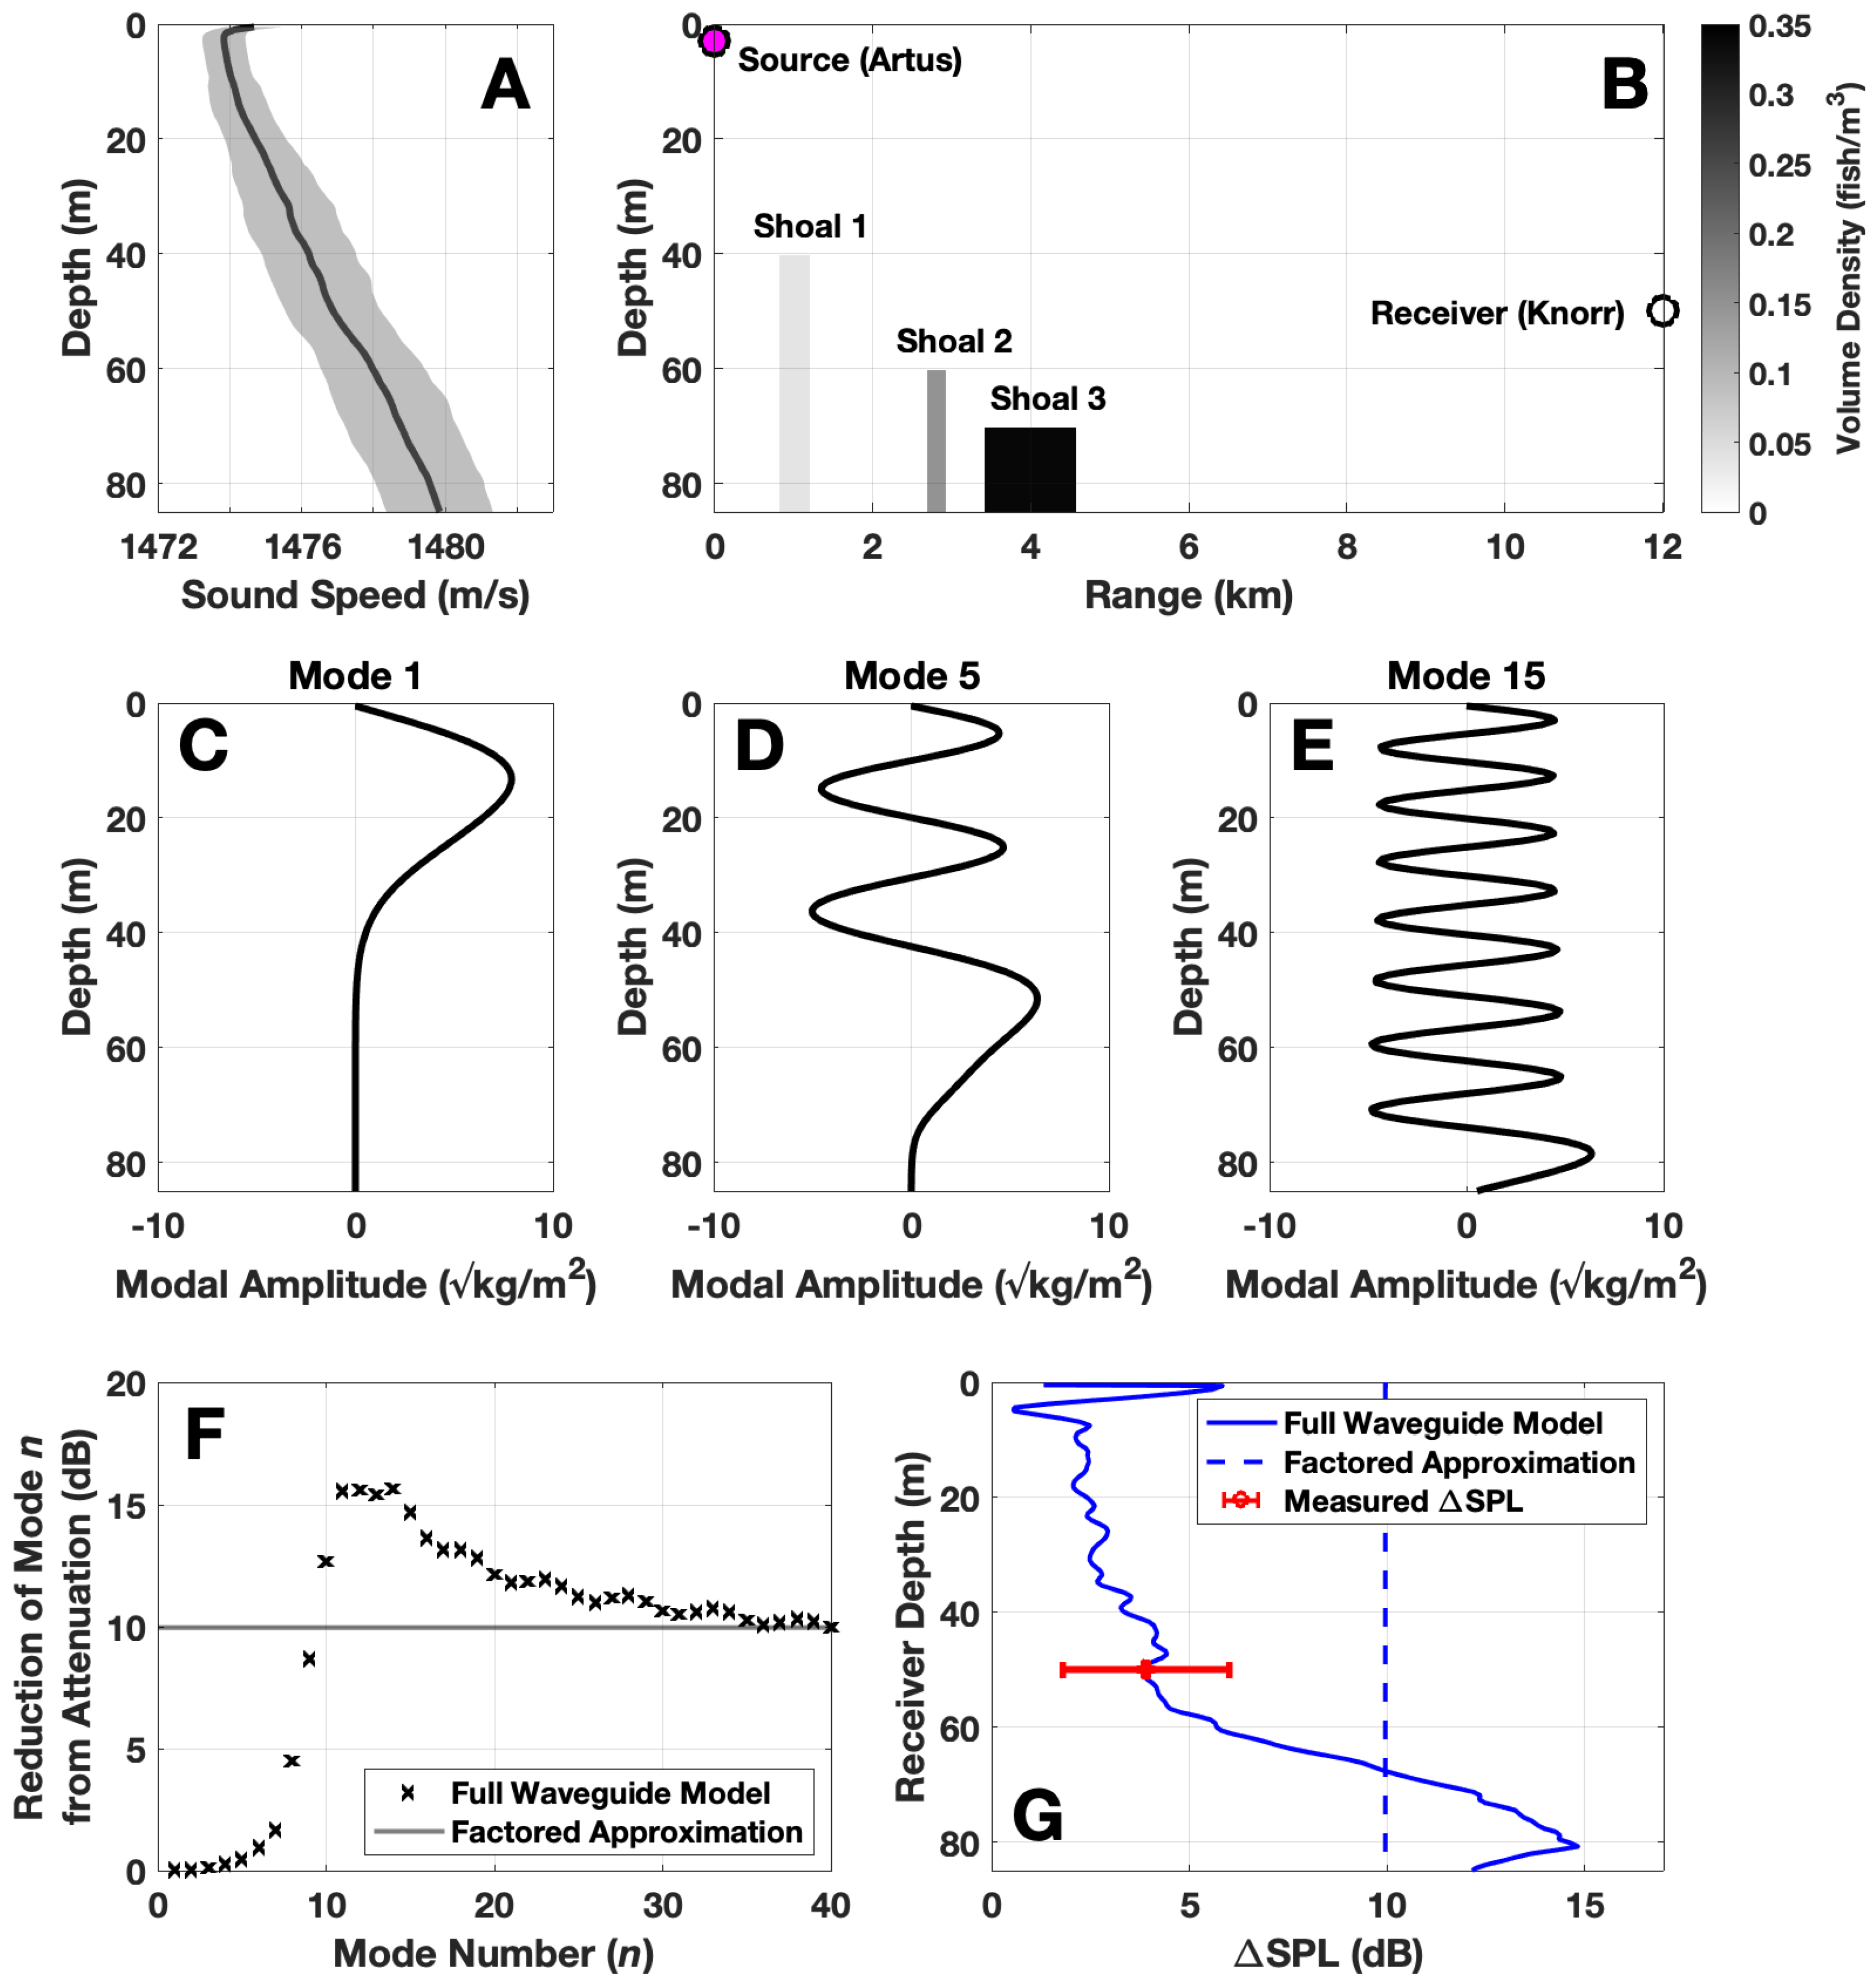
The predictions of the waveguide attenuation model are found to be in agreement with measured reductions in the Artus tonal due to attenuation from herring, where the size, position, and population density of the three shoals occluding the propagation path are fully characterized by OAWRS imagery as well as in situ echosounder measurements (Figure 4). The reduction in sound pressure level is modeled according to Equation (10) of [8], where the volumetric population density is expressed with respect to range and depth z assuming discrete shoals with constant population densities, according to:
where is the areal population density of shoal k, is the mean depth of shoal k, is the vertical thickness of shoal k, is the mean range of shoal k along the propagation path and is the horizontal width of shoal k along the propagation path (Table 1). In the upward-refracting underwater environment studied here, dominant lower order acoustic modes are concentrated in the upper water column. Since the observed fish groups are concentrated in the lower water column, these lower order modes will experience almost no attenuation from the fish groups (Figure 4F). Modeled is found to be in agreement with measurements at the receiver depth used in this experiment. Free-space-like factored formulations that ignore these depth-dependent modal attenuation effects (Equation (14) of [8]) overestimate the loss due to attenuation from fish by more than 5 dB (Figure 4G).
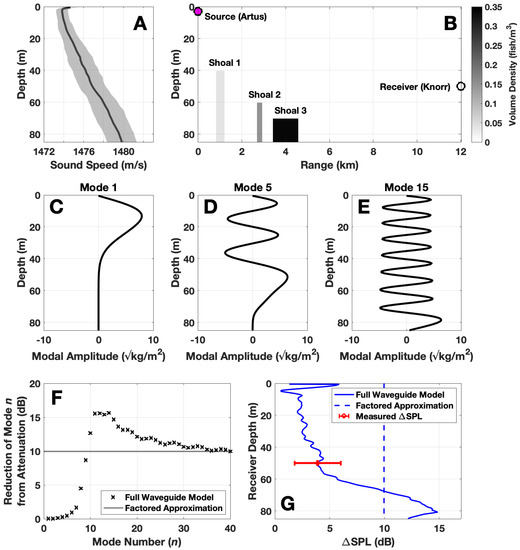
Figure 4.
The predictions of the waveguide attenuation model are consistent with measured reductions in the Artus tonal due to attenuation from herring. The water column sound speed profile in Ålesund waters is shown in (A), where the black solid line denotes the mean sound speed and the gray shaded region denotes the standard deviation. The population density distributions of the three shoals measured in Figure 3 as well as the position of the source and receiver are shown in (B). A source depth of 3 m (magenta dot in B) is chosen to correspond with the depth halfway between the sea surface and the draft depth of the FV Artus [14], and the depth of the receiver array towed by the RV Knorr is 50 m (white dot in B). Selected normal modes are shown in (C–E). Since the Ålesund underwater environment is upward-refracting (Figure A5), the lowest order modes concentrated in the upper water column will experience almost no attenuation from the fish groups which are concentrated in the bottom half of the water column (F). As a result, the predicted reduction in sound pressure level due to attenuation from fish () is approximately 10 dB lower when the receiver is in the upper water column compared to the lower water column (G). The modeled decrease in the received level (blue solid line in G) is within a standard deviation of measurements at the relevant receiver depth (red data in G). The loss due to attenuation estimated by the free-space-like factored approximation is not sensitive to changes in receiver depth, and predictions are more than 5 dB greater than measurements (blue dotted line in G). Water density is modeled as 1025 kg/m3, seafloor density as 1900 kg/m3 and seafloor sound speed as 1700 m/s.
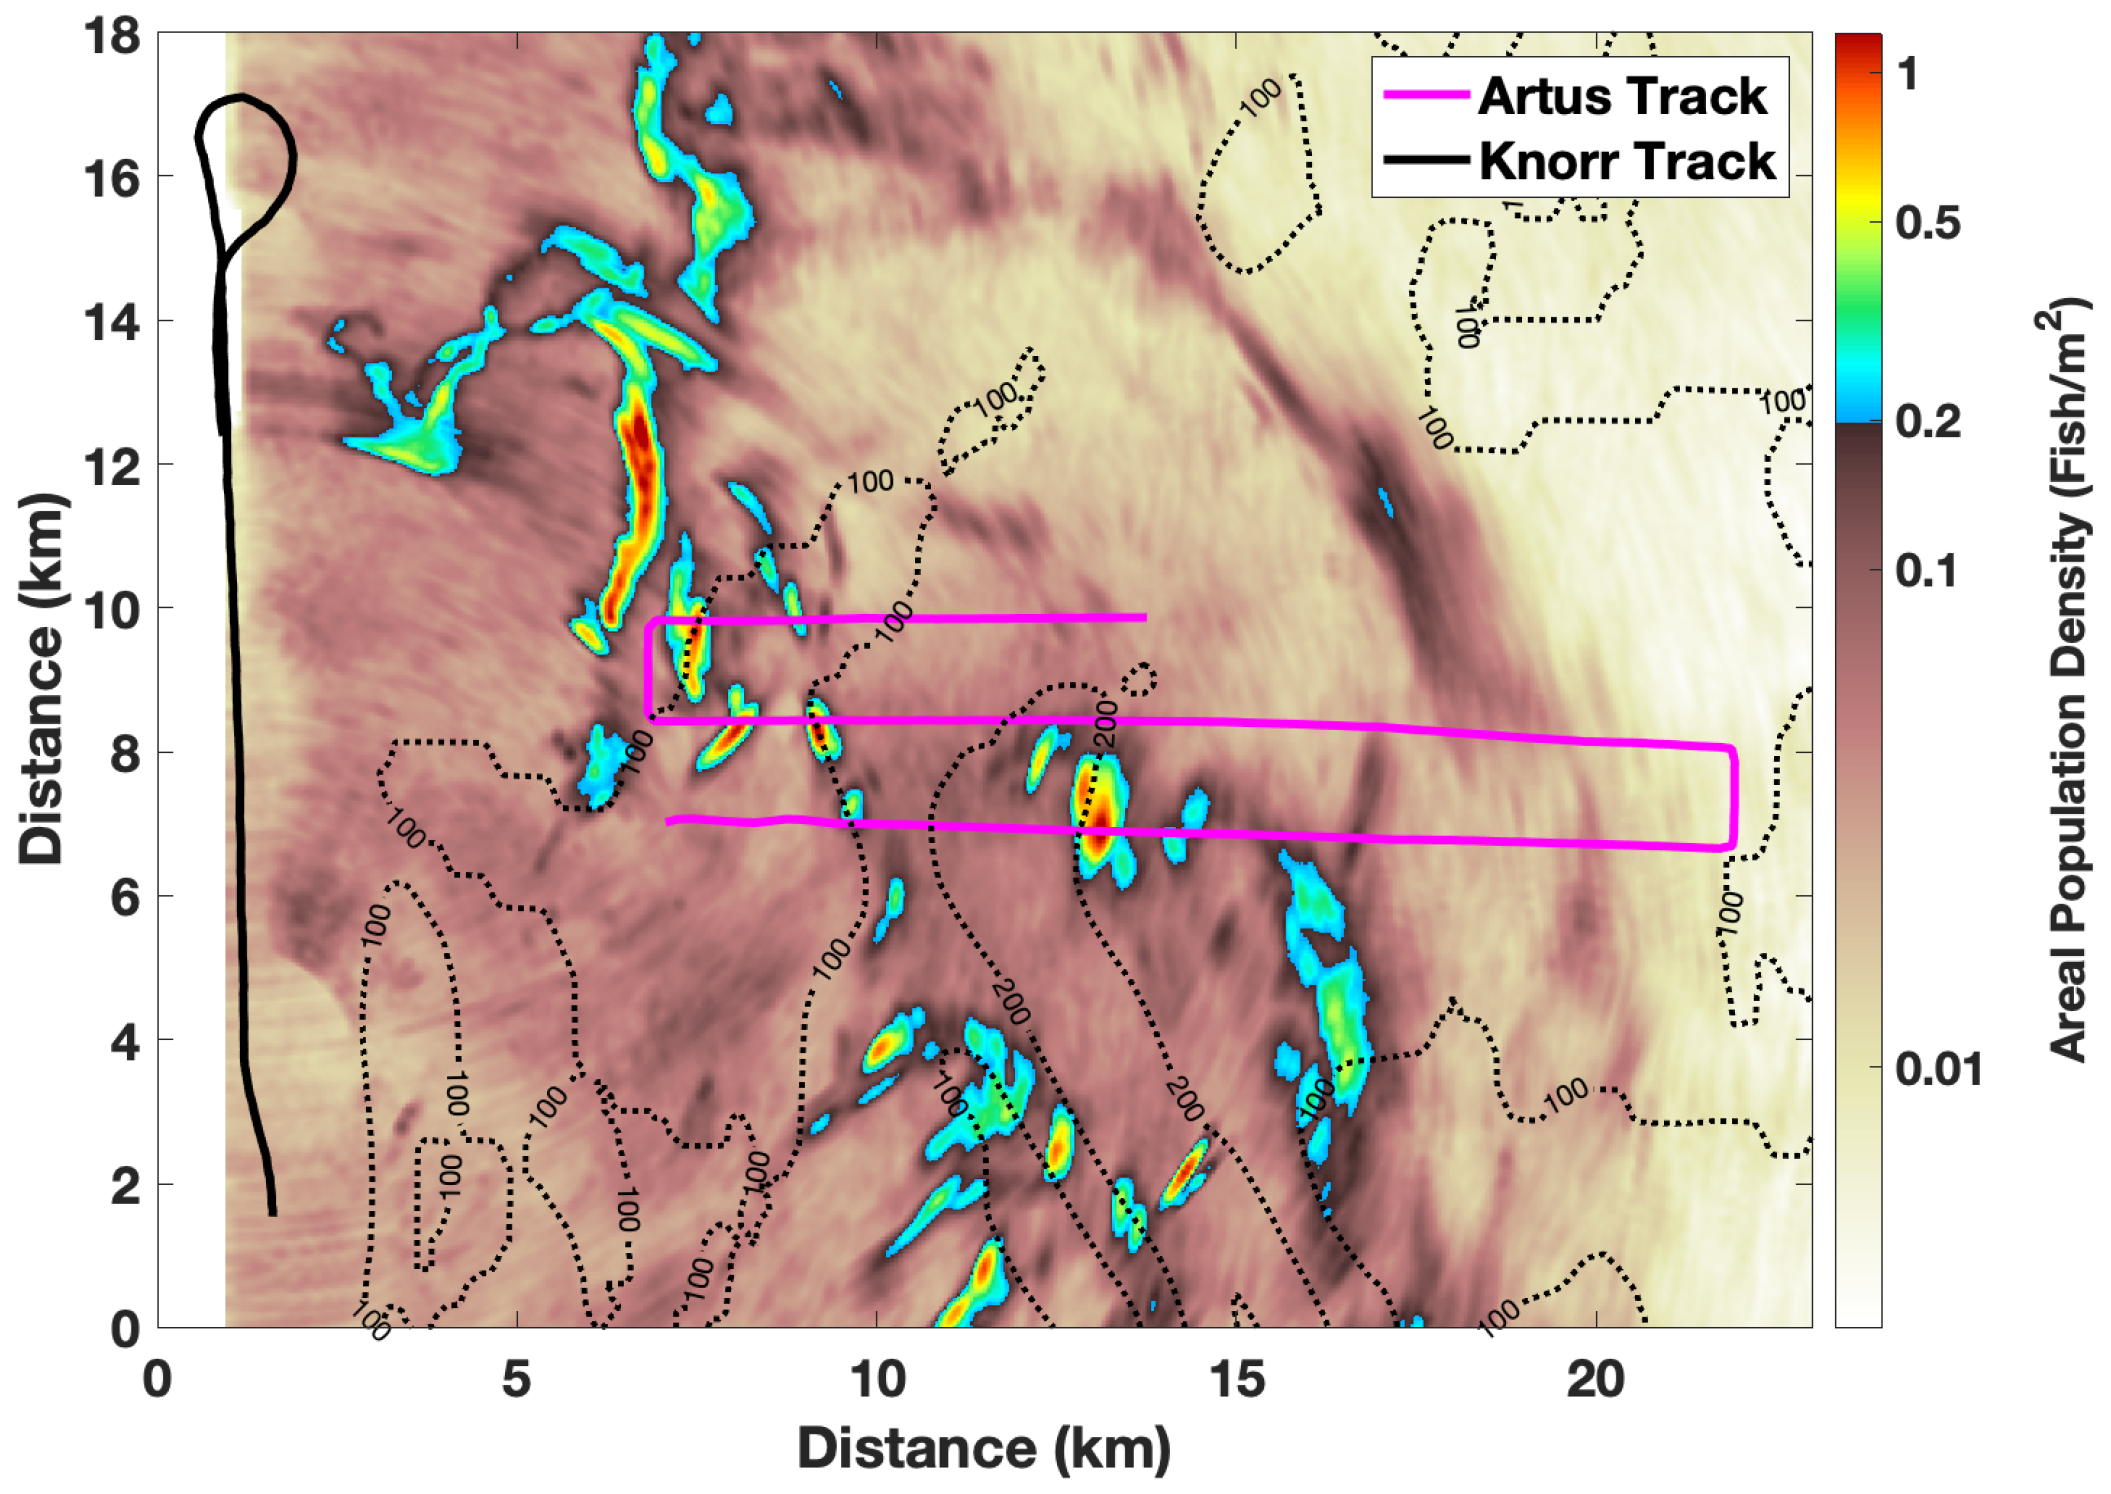
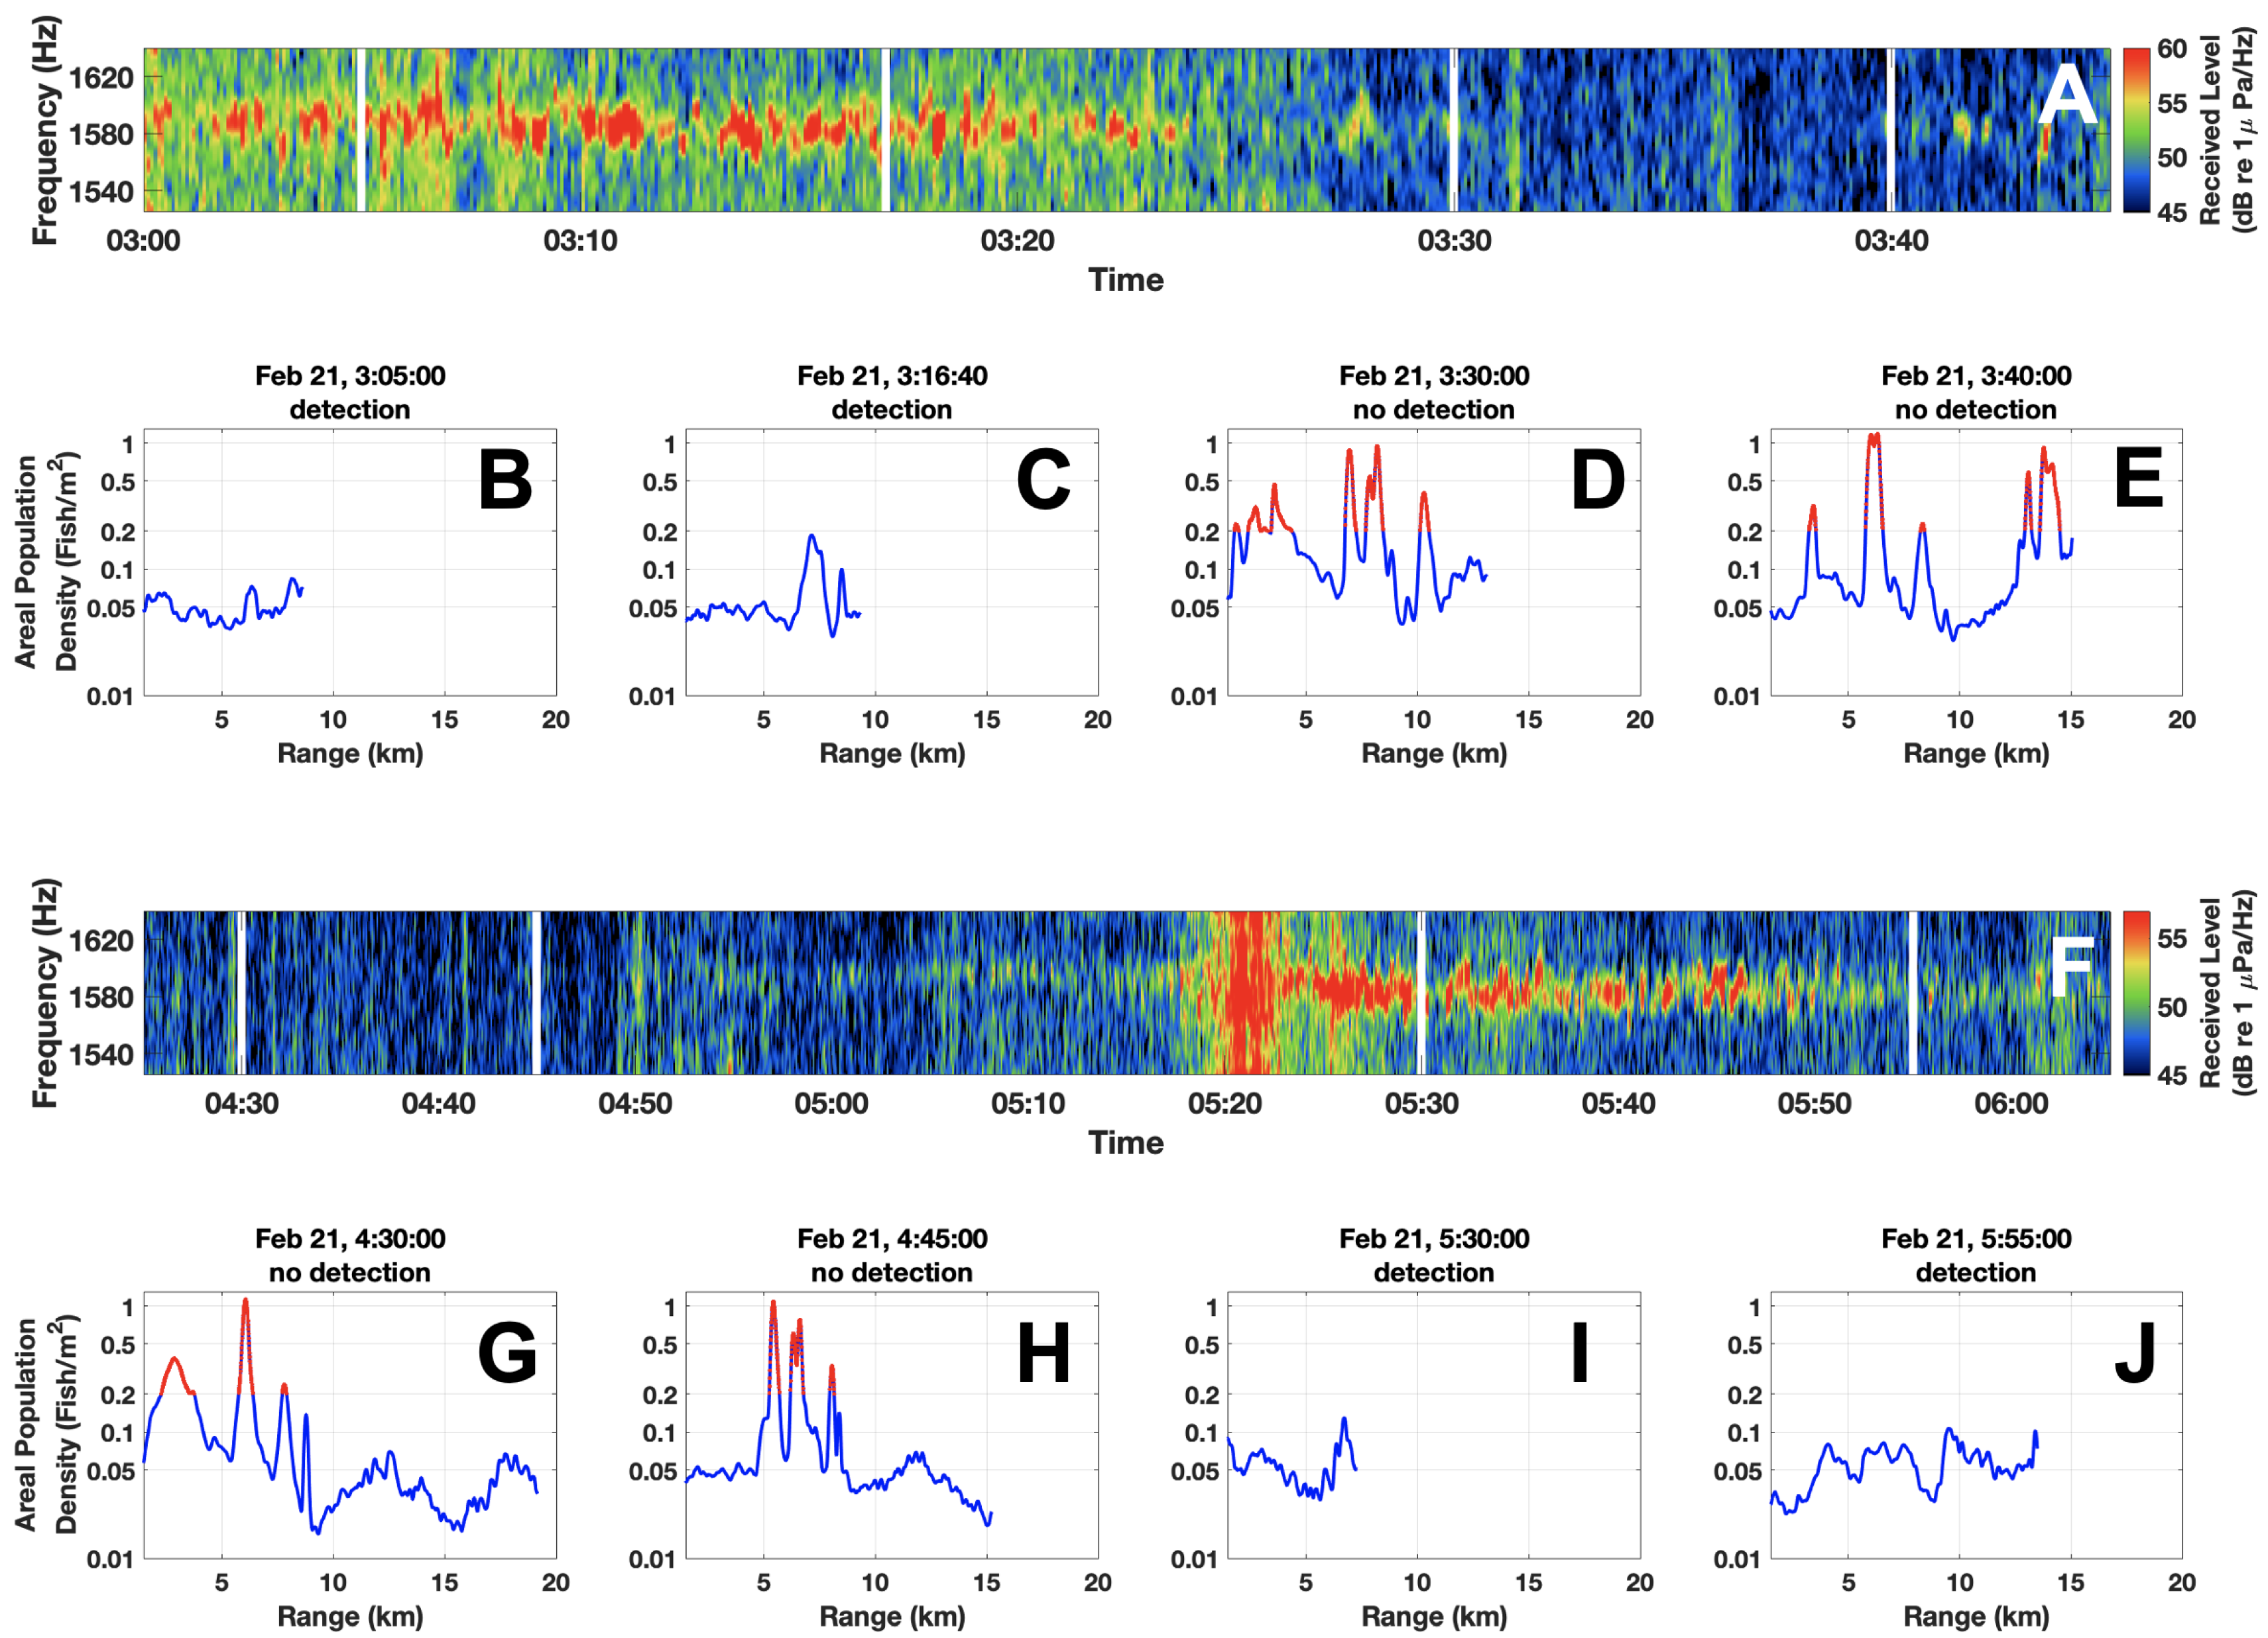
Reductions in the intensity of the Artus tonal and corresponding detection losses are shown to be strongly correlated with dense herring groups occluding the propagation path, where the criteria for valid detections are defined in Appendix C. The population density of herring groups between the source and receiver is calculated at each time interval by interpolating an OAWRS population density map (Figure 5) between the known locations of the Artus and the Knorr. During a period between 3:28 and 5:07, the tonal from the Artus is not detected by the POAWRS system. This loss of detection is shown to be correlated with herring groups occluding the propagation path with horizontal widths greater than 1 km and population densities above 0.2 fish/m2, which is the critical population density at which large herring shoals were found to form [25,26] (Figure 6).
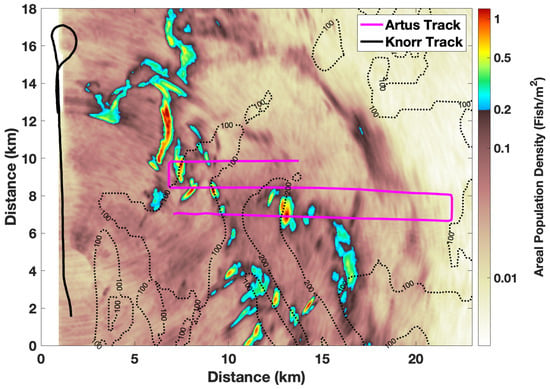
Figure 5.
OAWRS map of herring areal population density between 3:00 and 6:00. Reductions in the received level of the Artus tonal between 3:10 and 6:00 shown in Figure 7 are calculated using the population density between the Artus (pink line) and the Knorr (black line). The color scale is chosen so that the transition from brown to blue occurs at 0.2 fish/m2, which is the critical population density at which large herring shoals were found to form [25,26]. Black dotted lines denote bathymetric contours. This areal population density map is generated from five instantaneous OAWRS transmissions between 3:00 and 6:00 on 21 February 2014 (3:04:09, 3:24:09, 4:19:09, 5:04:09, and 5:39:59) according to Appendix A.
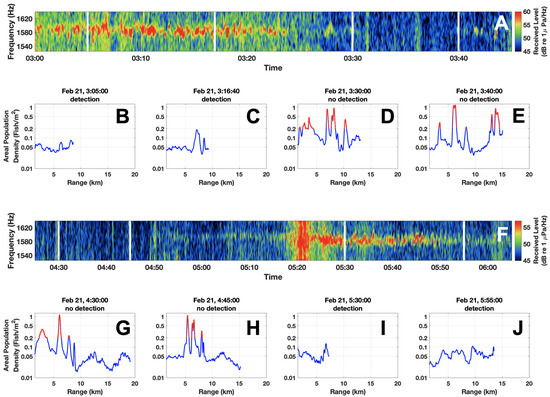
Figure 6.
Detections of ship-radiated tonals from the FV Artus are lost to ambient noise when dense herring shoals occlude the propagation path. Spectrograms of the received level beamformed in the direction of the Artus are shown in (A,F). At approximately 3:28 on 21 February, the signal from the Artus falls below ambient background noise (A). Before this loss of detection, OAWRS measurements of herring population density between the source and receiver are mostly below 0.2 fish/m2, which is the critical population density at which large herring shoals were found to form (B,C) [25,26]. After the loss of detection, multiple fish groups are observed along the propagation path with population densities above 0.2 fish/m2 (red data in D,E). The signal from the Artus is detected again at approximately 5:10 (F). Before detection at 5:10 there are still dense fish groups occluding the propagation path with population densities above 0.2 fish/m2 (red data in G,H). After the Artus is detected, the population densities are below 0.2 fish/m2 (I,J). Measurements of herring areal population density shown here are from the OAWRS population density map shown in Figure 5. Vertical white lines in (A,F) correspond to times when measurements in (B–E) and (G–J) are respectively made. Broadband noise from the Artus is also observed between 3:00 and 3:28 in (A), and the strong broadband signal between 5:17 and 5:35 in (F) is likely caused by propeller cavitation from the Artus [15,16]. The criteria for valid detections are defined in Appendix C.
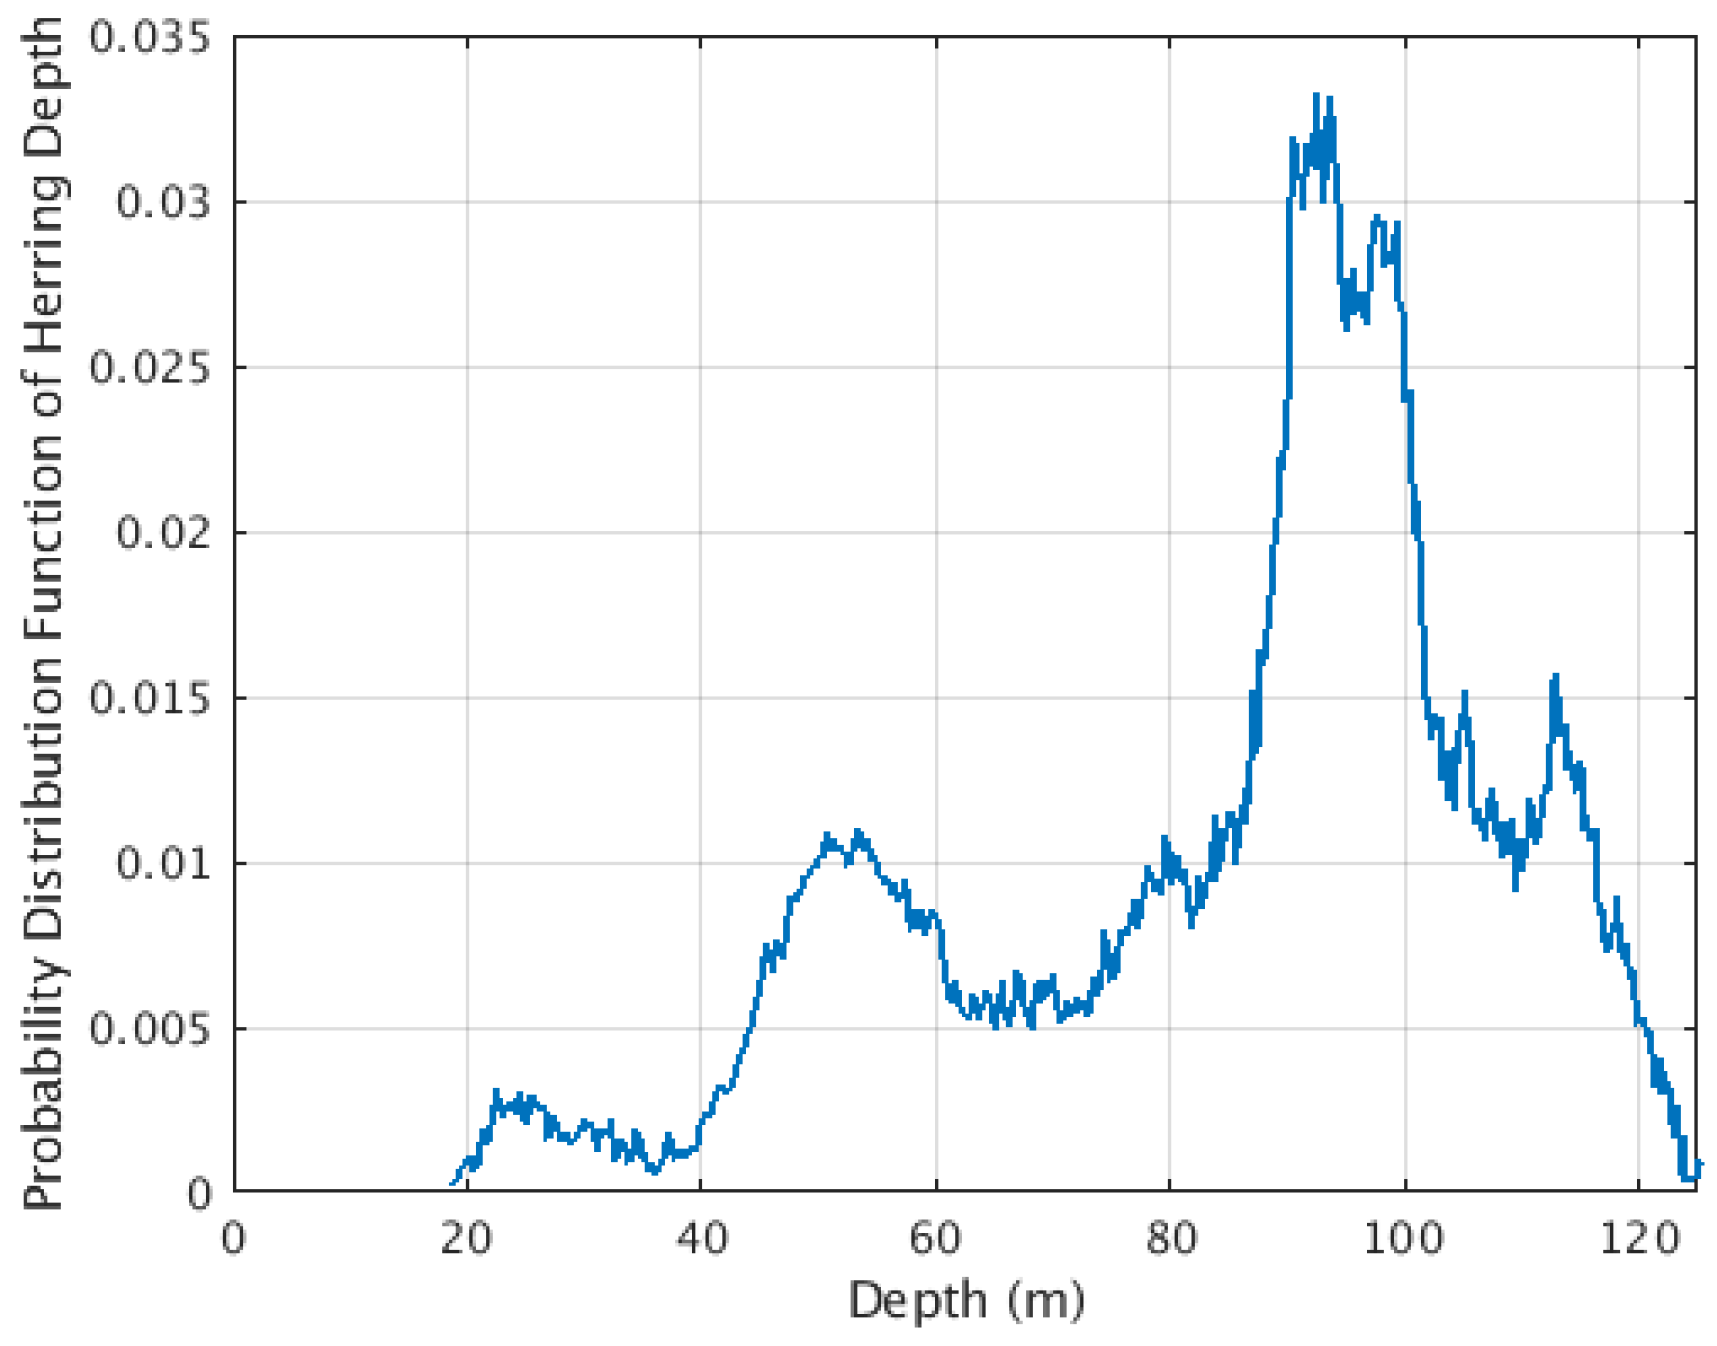
Reductions in the Artus tonal due to attenuation from fish are predicted between 3:10 and 6:00 from population density measurements using Equation (10) of [8]. In the absence of individual echosounder measurements of herring depth for each shoal, attenuation is modeled assuming the same depth distribution for all shoals. The volumetric population density with respect to range and depth z is then expressed as:
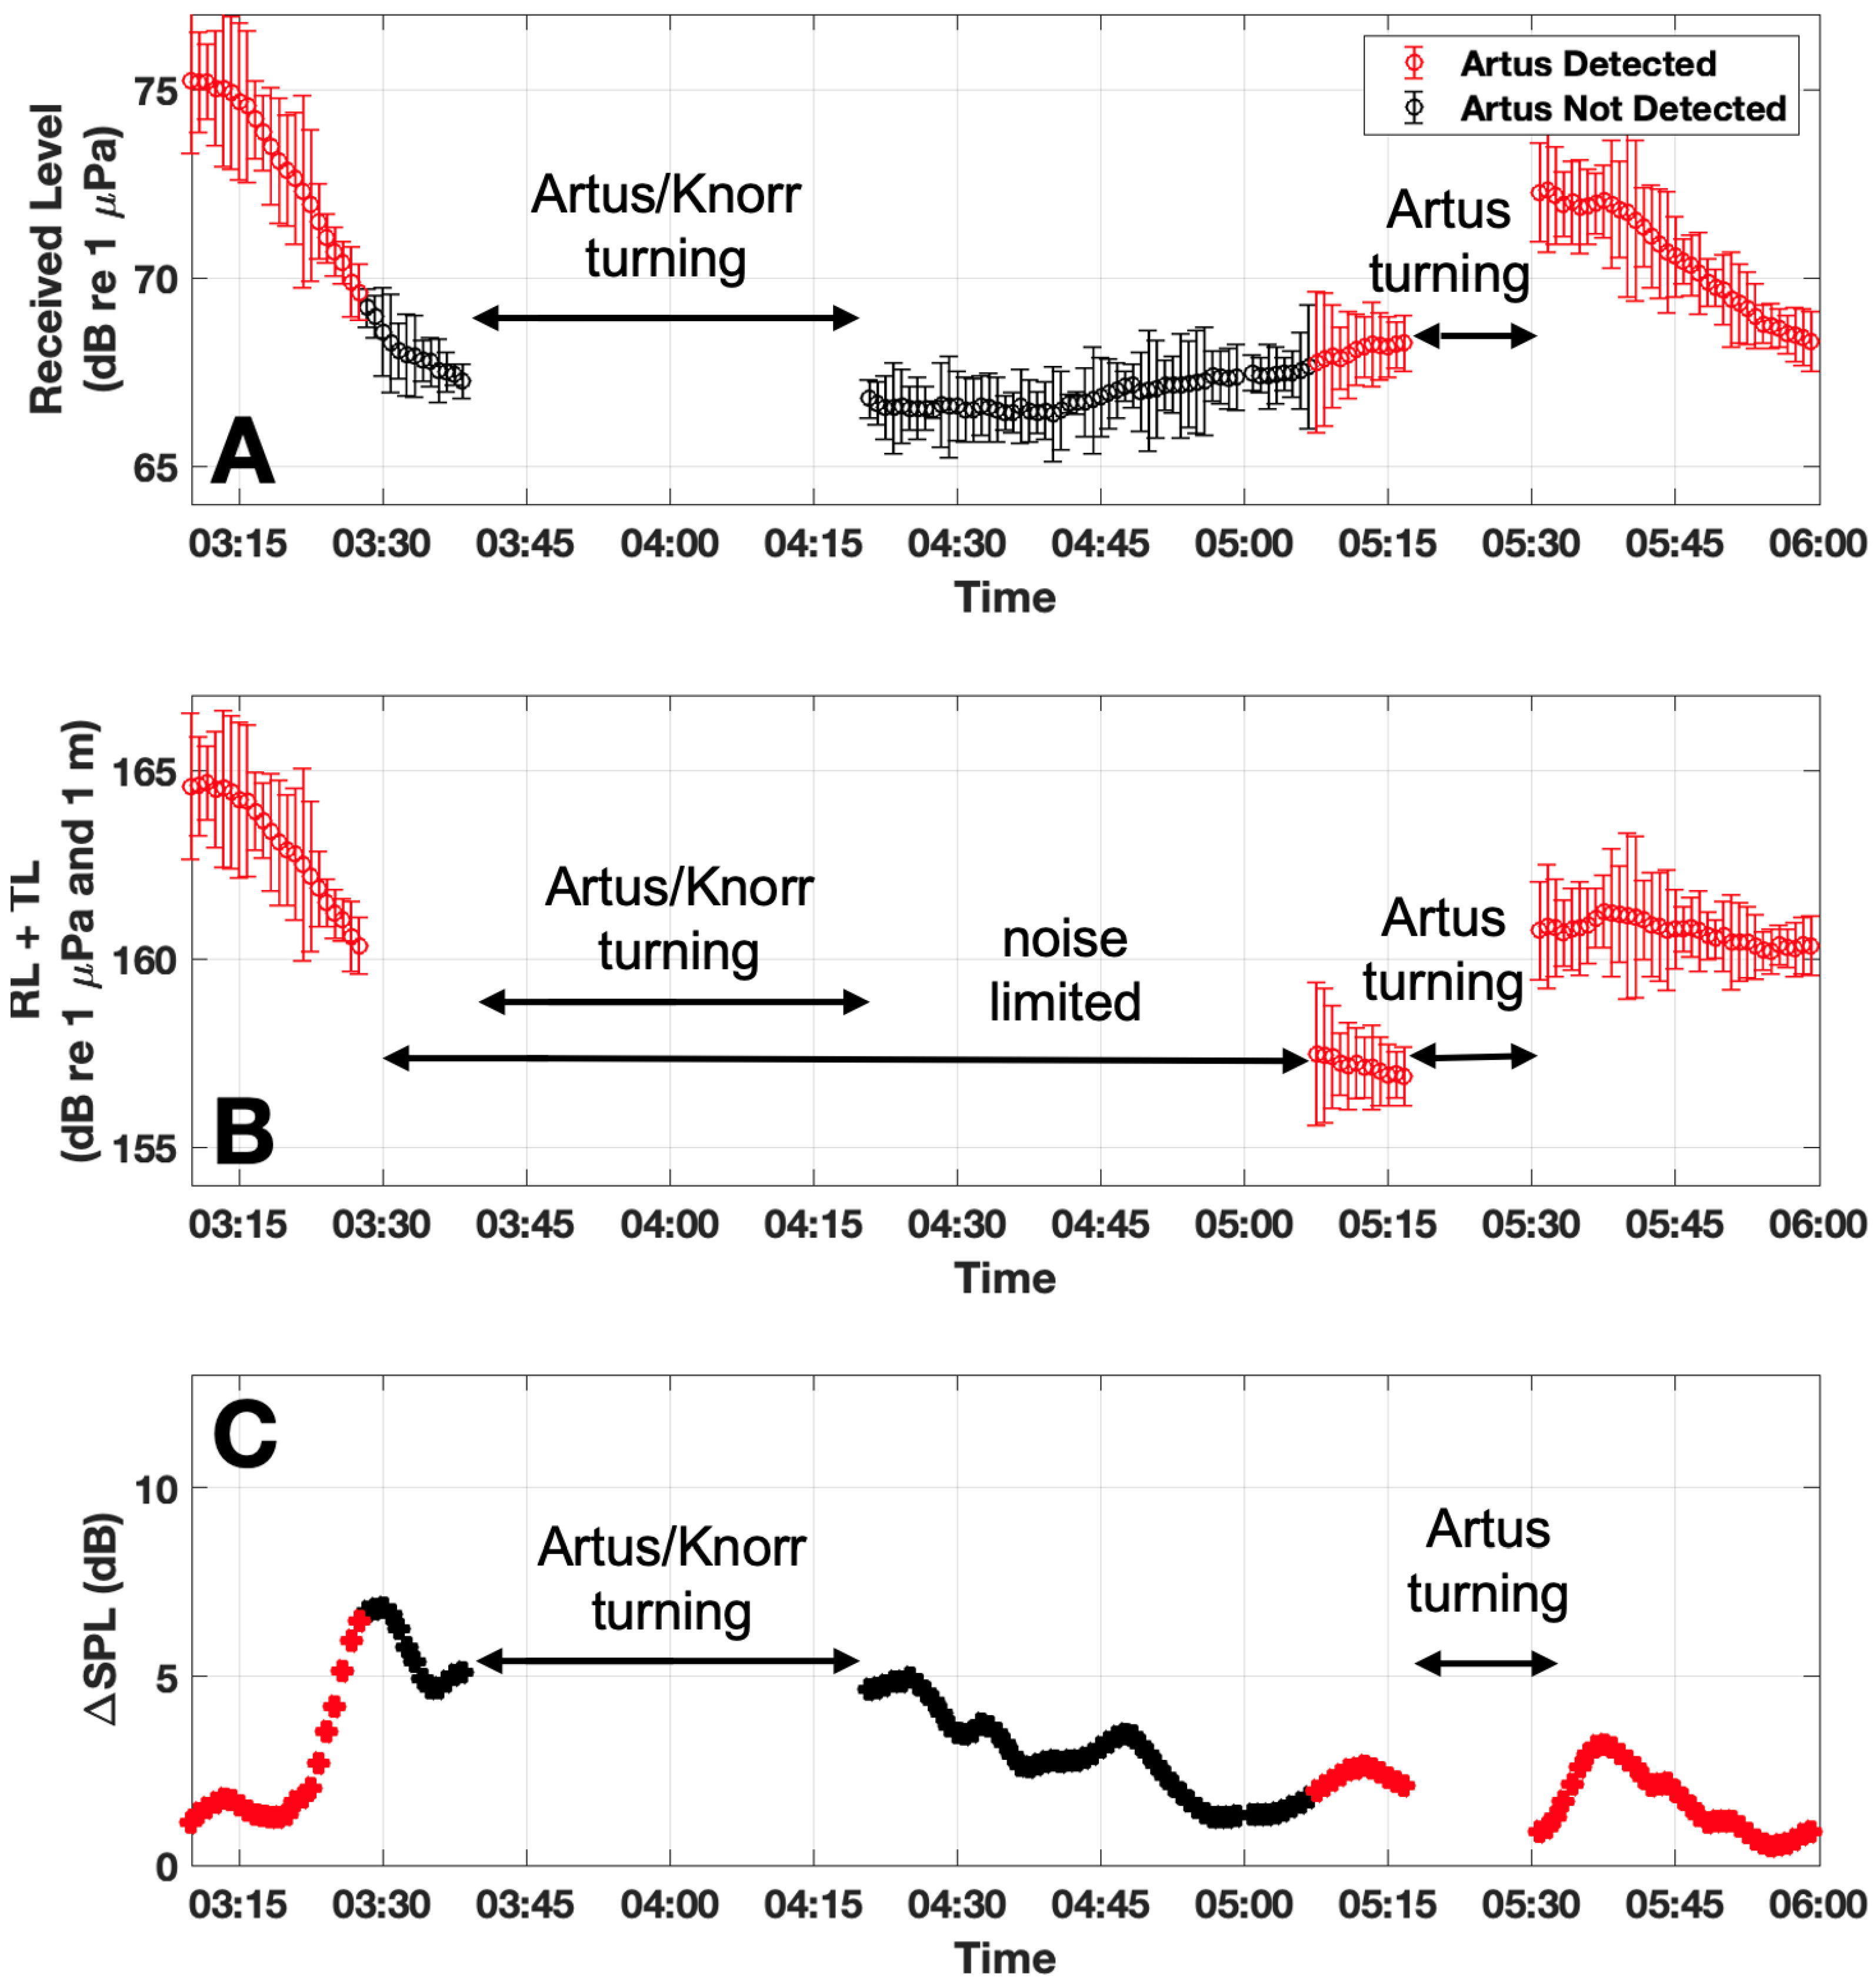
where is the areal population density measured by OAWRS (Figure 5) and is the probability distribution function of herring depth, which is determined from echosounder measurements during the experiment and explicitly defined in Appendix B. Predicted reductions in the intensity of the Artus tonal are shown to be consistent with measured reductions and corresponding detection losses (Figure 7). Variations in ship speed are less than 0.5 m/s during this time period, indicating that changes in the source level of the Artus tonal over time are not significant enough to lead to the detection losses observed here (Figure A4).
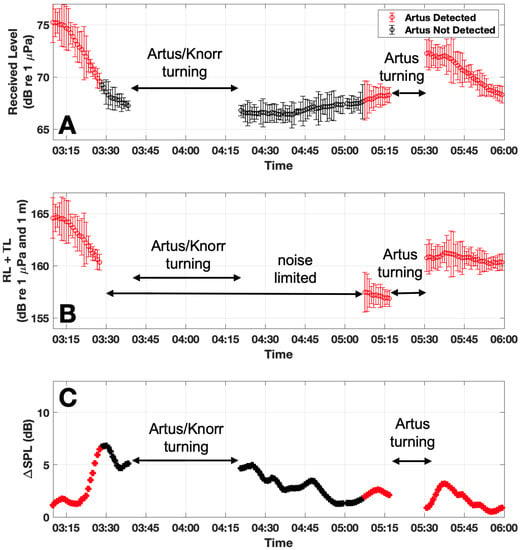
Figure 7.
Reductions in the received level of the Artus tonal between 3:10 and 6:00 on 21 February and corresponding detection losses are consistent with predicted reductions due to attenuation from fish. The received level beamformed in the direction of the Artus within the frequency band of the Artus tonal (1570.5–1597.5 Hz) is shown in (A). Red data indicates times when the Artus tonal was detected above background noise, while black data indicates times then the Artus tonal was not detected (Appendix C). The received level corrected for transmission loss from spreading losses and seafloor attenuation () is shown in (B) for data where the Artus tonal is detected above ambient noise. The reduction in received level due attenuation from fish () is predicted in (C) using the OAWRS map of herring population density shown in Figure 5. The measured 4 dB reduction in between 3:15 and 3:26 (B) is consistent with the predicted loss due attenuation from fish during this time (C). After the detection loss at 3:28, the signal remains undetected until the predicted loss due to attenuation () falls below 2 dB after 5:00. The approximately 4 dB increase in after the gap in the data between 5:15 and 5:20 (B) is likely caused by a change in the orientation of the Artus, since the Artus turns away from the Knorr and creates a more direct path from the Artus engine to the receiver (Figure A4B). Variations in ship speed are less than 0.5 m/s during this time period, indicating that changes in the source level of the Artus tonal over time are not significant enough to lead to the detection losses observed here (Figure A4). Error bars in (A,B) denote the standard deviation over 30 s intervals.
While attenuation from herring in Ålesund waters led to prolonged detection losses for tonals from the FV Artus, attenuation from fish did not affect POAWRS detections of ship-radiated tonals during previous surveys of herring in the Gulf of Maine and Norwegian capelin off the coast of Finnmark [14]. Reductions in the intensity of ship-radiated tonals due to attenuation from fish is predicted in all three environments, and the presence or absence of significant attenuation is found to be consistent with theoretical predictions. Attenuation is negligible for tonals from the RV Delaware II in the Gulf of Maine since the frequencies of the tonals were well below the resonance peak of the spawning herring in that environment (Figure 8A). Predicted losses due to attenuation from Finnmark capelin are less than 1 dB because the horizontal width of observed capelin shoals is not large enough to lead to significant attenuation (<0.25 km, Figure 8B). Significant attenuation from Ålesund herring is predicted at the frequency of the tonal from the FV Artus, which is consistent with observed intensity reductions during the survey (Figure 8C). This analysis demonstrates that the waveguide attenuation formulation can be used to determine the conditions for significant attenuation from fish for long-range passive sensing in ocean waveguide environments. Predicted losses due to attenuation from fish are used to estimate the source level of the Artus signal in Appendix D.

Figure 8.
The decrease in the intensity of ship-radiated tonals due to attenuation from fish () is predicted here for previous POAWRS surveys in three continental shelf environments: herring in the Gulf of Maine, capelin in Finnmark waters, and herring in Ålesund waters. The magnitude of depends on the width of the shoals along the propagation path between the source and the receiver. Tonals from the RV Delaware II (black dotted lines in A) are well below the resonance peak of the herring in the Gulf of Maine and predicted losses due to attenuation are less than 0.3 dB. The width of the observed capelin shoals in Finnmark are less than 0.2 km, and corresponding losses due to attenuation are predicted to be less than 1 dB at the frequencies of tonals from the RV Johan Hjort (black dotted lines in B). Predicted attenuation from herring in Ålesund is significant at the frequency of the tonal from the FV Artus (black dotted line in C). Physical parameters used for modeling attenuation in each environment are shown in Table 2, and measured sound speed profiles in each environment are shown in Figure A5.
4. Discussion
The effect of attenuation from fish on passive sensing of ship-radiated tonals is investigated, and it is shown that measured reductions in ship-radiated tonals are in agreement with a normal-mode based formulation for acoustic propagation through inhomogeneities in a waveguide. Common heuristic approaches that employ free space scattering assumptions disagree with measurements by more than 5 dB. While the potential for such heuristic approaches to incorrectly predict attenuation from fish in a waveguide environment has been previously discussed in theory [8], to our knowledge the results shown here are the first experimental evidence that attenuation formulations ignoring waveguide physics can be in significant error. It is shown that the waveguide attenuation formulation can be used to determine the conditions for significant attenuation for long-range passive sensing of self-radiating sources in the ocean such as manmade vehicles, geophysical phenomena, and vocalizing marine mammals. Attenuation from fish may also limit the ability of vocalizing marine mammals to echolocate in regions with dense fish shoals [31,32].
5. Conclusions
Following the theoretical work in Ratilal and Makris [18] and Duane et al. [8], it is experimentally shown that attenuation from dense herring groups in Norwegian spawning grounds can reduce the intensity of ship-radiated tonals and lead to prolonged detection losses for passive sensing of surface vessels in an ocean waveguide. Such detection losses can create significant impediments to passive acoustic sensing of underwater vehicles, marine life, and geophysical phenomena. Here, wide-area OAWRS imagery is used in conjunction with echosounder data to measure the size, position, and population density of every major fish shoal occluding the propagation path from source to receiver. Reductions in signal intensity due to attenuation from fish are predicted using an analytical theory for acoustic propagation through inhomogeneities in an ocean waveguide, and measured intensity reductions are found to be in agreement with theoretical predictions. Common heuristic approaches that employ free space scattering assumptions for attenuation from fish groups are found to be in disagreement with measurements.
Author Contributions
Conceptualization, N.C.M. and O.R.G.; formal analysis, D.D., C.Z., F.P. and N.C.M.; funding acquisition, N.C.M. and O.R.G.; conducting experiment at sea, N.C.M. and O.R.G.; methodology, D.D. and N.C.M.; project administration, N.C.M. and O.R.G.; resources, N.C.M. and O.R.G.; software, D.D., C.Z., F.P. and N.C.M.; supervision, N.C.M.; validation, D.D., C.Z. and N.C.M.; visualization, D.D. and N.C.M.; writing—original draft, D.D. and N.C.M.; writing—review & editing, N.C.M. and D.D. All authors have read and agreed to the published version of the manuscript.
Funding
This research was funded by Office of Naval Research grant number N00014-17-1-2197.
Conflicts of Interest
The authors declare no conflict of interest.
Appendix A. OAWRS Measurements of Herring Population Density
OAWRS data presented here is from an experiment conducted in 2014 to survey fish populations in the Nordic Seas via continuous monitoring with instantaneous wide-area sensing [8,33]. OAWRS data was produced from linear frequency modulated active transmissions of 1 s duration and 50 Hz bandwidth centered at 955 Hz from a vertical source array attached to the research vessel. Scattered returns from environmental features are received by a horizontal line array towed by the same research vessel with multiple nested sub-apertures (Figure A1). The same receiver array is used to passively measure ship noise from the FV Artus using POAWRS. Three linear apertures of the receiver array, i.e., the low-frequency (LF) aperture, the mid-frequency (MF), and the high frequency (HF) aperture, consist of 64 equally spaced hydrophones with respective inter-element spacing of 1.5 m, 0.75 m, and 0.375 m. Images are generated by beamforming, matched filtering, and charting scattered returns using nonuniformly-spaced combinations of the LF, MF, and HF apertures, as described in [34]. OAWRS measurements of scattering strength uncorrected for attenuation from fish () are calculated according to Equation (A2) of [8]. Since attenuation from fish prevented the entire region from being instantaneously surveyed by OAWRS, the areal population density map in Figure 5 is generated from five instantaneous OAWRS transmissions between 3:00 and 6:00 on 21 February 2014 (3:04:09, 3:24:09, 4:19:09, 5:04:09, and 5:39:59). Discrepancies between the overlapping OAWRS scattering strength images are assumed to be caused by attenuation from fish, and the maximum scattering strength between overlapping pixels was chosen in order to minimize the effects of attenuation, according to:
where is the estimated scattering strength at horizontal position and is the fish-attenuated scattering strength measured by OAWRS transmission j. The areal population density of herring is then calculated according [25,26,27,28] to
where = −29.5 is the calibrated target strength of herring measured during this experiment at sensing frequency f = 955 Hz [8]. A running circular averaging window of 1 km radius is applied to the composite population density map in order to eliminate boundary discontinuities due to lack of temporal simultaneity of the five instantaneous OAWRS images.
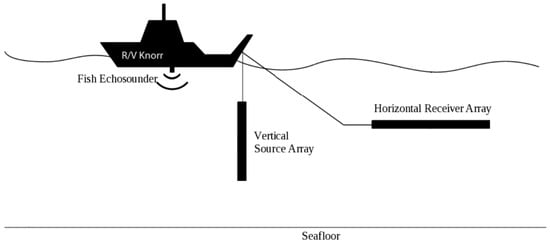
Figure A1.
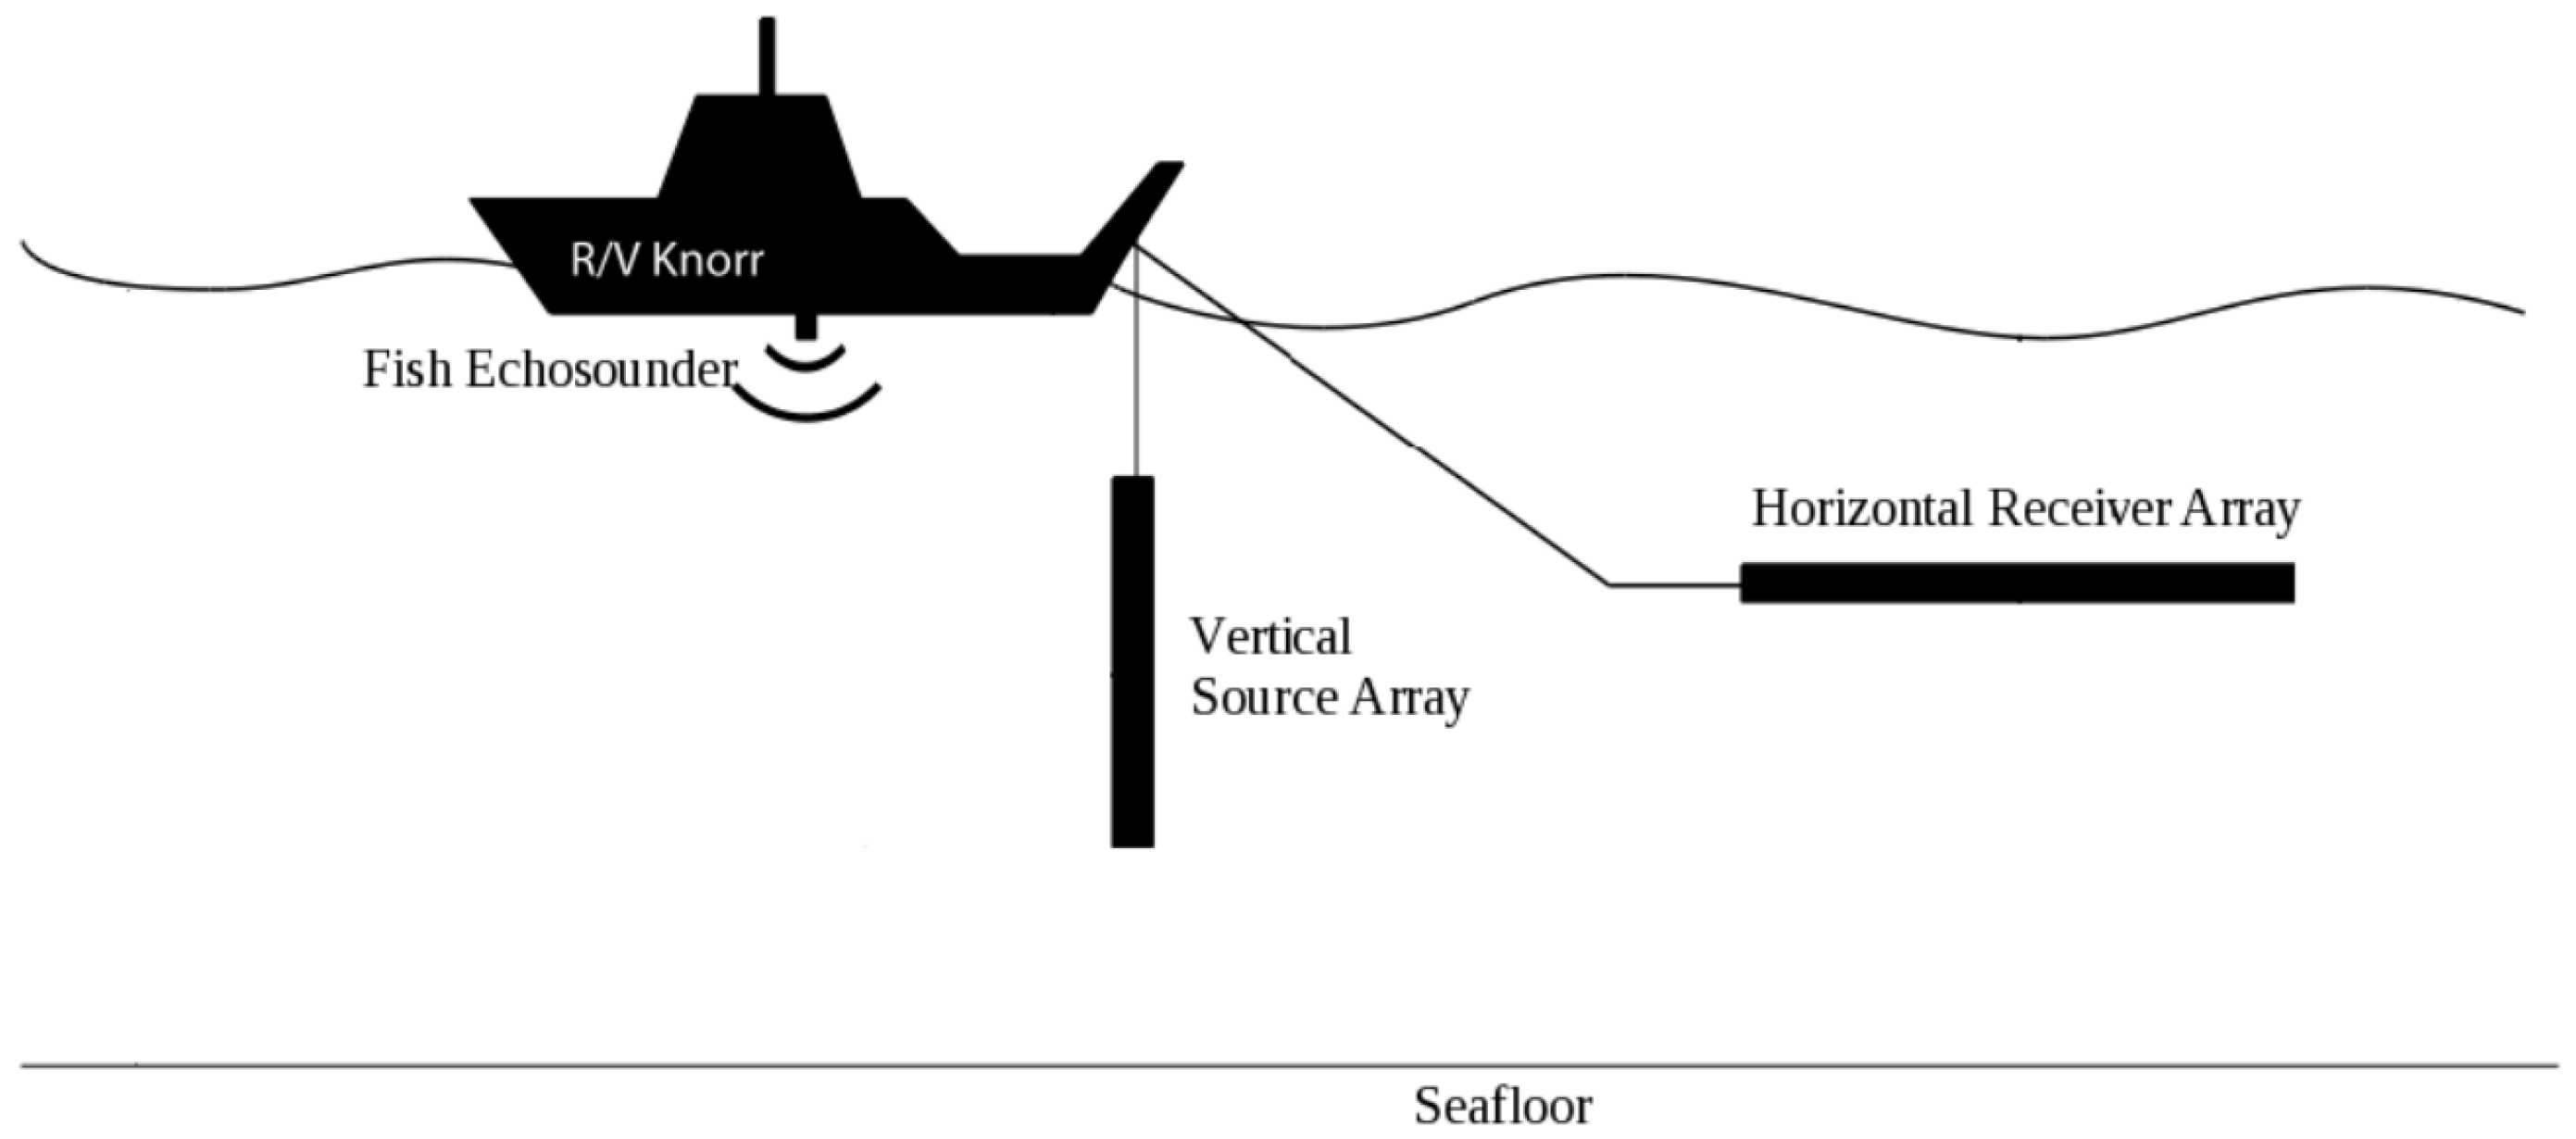
OAWRS system used for herring measurements during the Nordic Seas 2014 Experiment [33]. The system is effectively monostatic with source and receiver arrays towed from the same research vessel (RV Knorr). The OAWRS source was developed under the National Science Foundation and Sloan Foundation MRI program for wide-area sensing of marine life, and the ONR Five Octave Research Array (FORA) was used as the OAWRS receiver. The same receiver array is used to passively measure ship noise from the FV Artus using POAWRS.
Appendix B. Estimating the Probability Density Function of Herring Depth
Shoal volumetric population density (fish/m3) is measured from echogram data according to Equation (A22) of [8]. The probability density function of herring depth is measured by aggregating echosounder measurements of herring in Ålesund waters according to:
where is the volumetric population density of herring at horizontal position and depth z measured between 3:10 and 6:00 on February 20, where is shown in Figure A2.
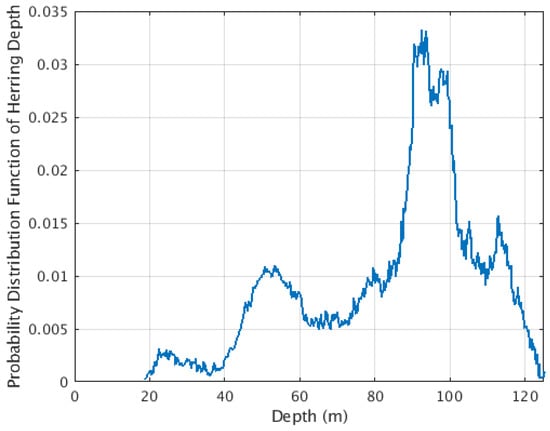
Figure A2.
Probability density function of herring depth inverted from echosounder measurements on 21 February 2014 between 3:10 and 6:00 in Ålesund spawning grounds (Equation (A3)).
Figure A2.
Probability density function of herring depth inverted from echosounder measurements on 21 February 2014 between 3:10 and 6:00 in Ålesund spawning grounds (Equation (A3)).
Appendix C. Identifying Detections of Ship-Radiated Tonals
Measurements of received level beamformed in the direction of the Artus are classified as “Artus detected” or “Artus not detected” depending on whether the beamformed received level is greater or less than the noise level corrected for the array gain plus the detection threshold , according to:
The noise level corrected for the array gain () is measured as the average received level beamformed in the direction of the Artus at frequencies between 1620 Hz and 1650 Hz, where no significant tonals contaminate measurements during the time studied. These measurements of may include broadband noise from the Artus and other ships (not including tonals) or other sources of ambient noise. The detection threshold = 1.5 dB is calculated as the standard deviation of the Artus tonal at frequencies between (Figure 2), where = 1584 Hz is the center frequency of the Artus tonal and B = 27 Hz is the 3 dB-down bandwidth of the Artus tonal (Figure A3). Since the signal from the Artus is cylostationary rather than a pure tonal [14], standard deviation measurements are not in agreement with the theoretically-derived standard deviation of a pure tonal after saturated multipath propagation derived in [30,35].
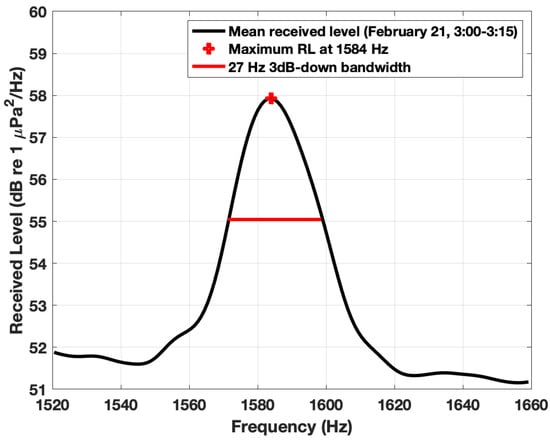
Figure A3.
Since the signal from the Artus is cylostationary rather than a pure tonal [14], the 3 dB-down bandwidth of the Artus tonal is calculated from the average measured intensity over a 15 min period where the tonal is detected (21 February, 3:00–3:15). The black line denotes the received level at frequencies between 1520 Hz and 1660 Hz, the red dot denotes the maximum received level within this frequency range at 1584 Hz, and the red line denotes the measured 27 Hz 3 dB-down bandwidth of the Artus tonal.
Appendix D. Estimating Artus Source Level
The source level of the Artus can be estimated according to:
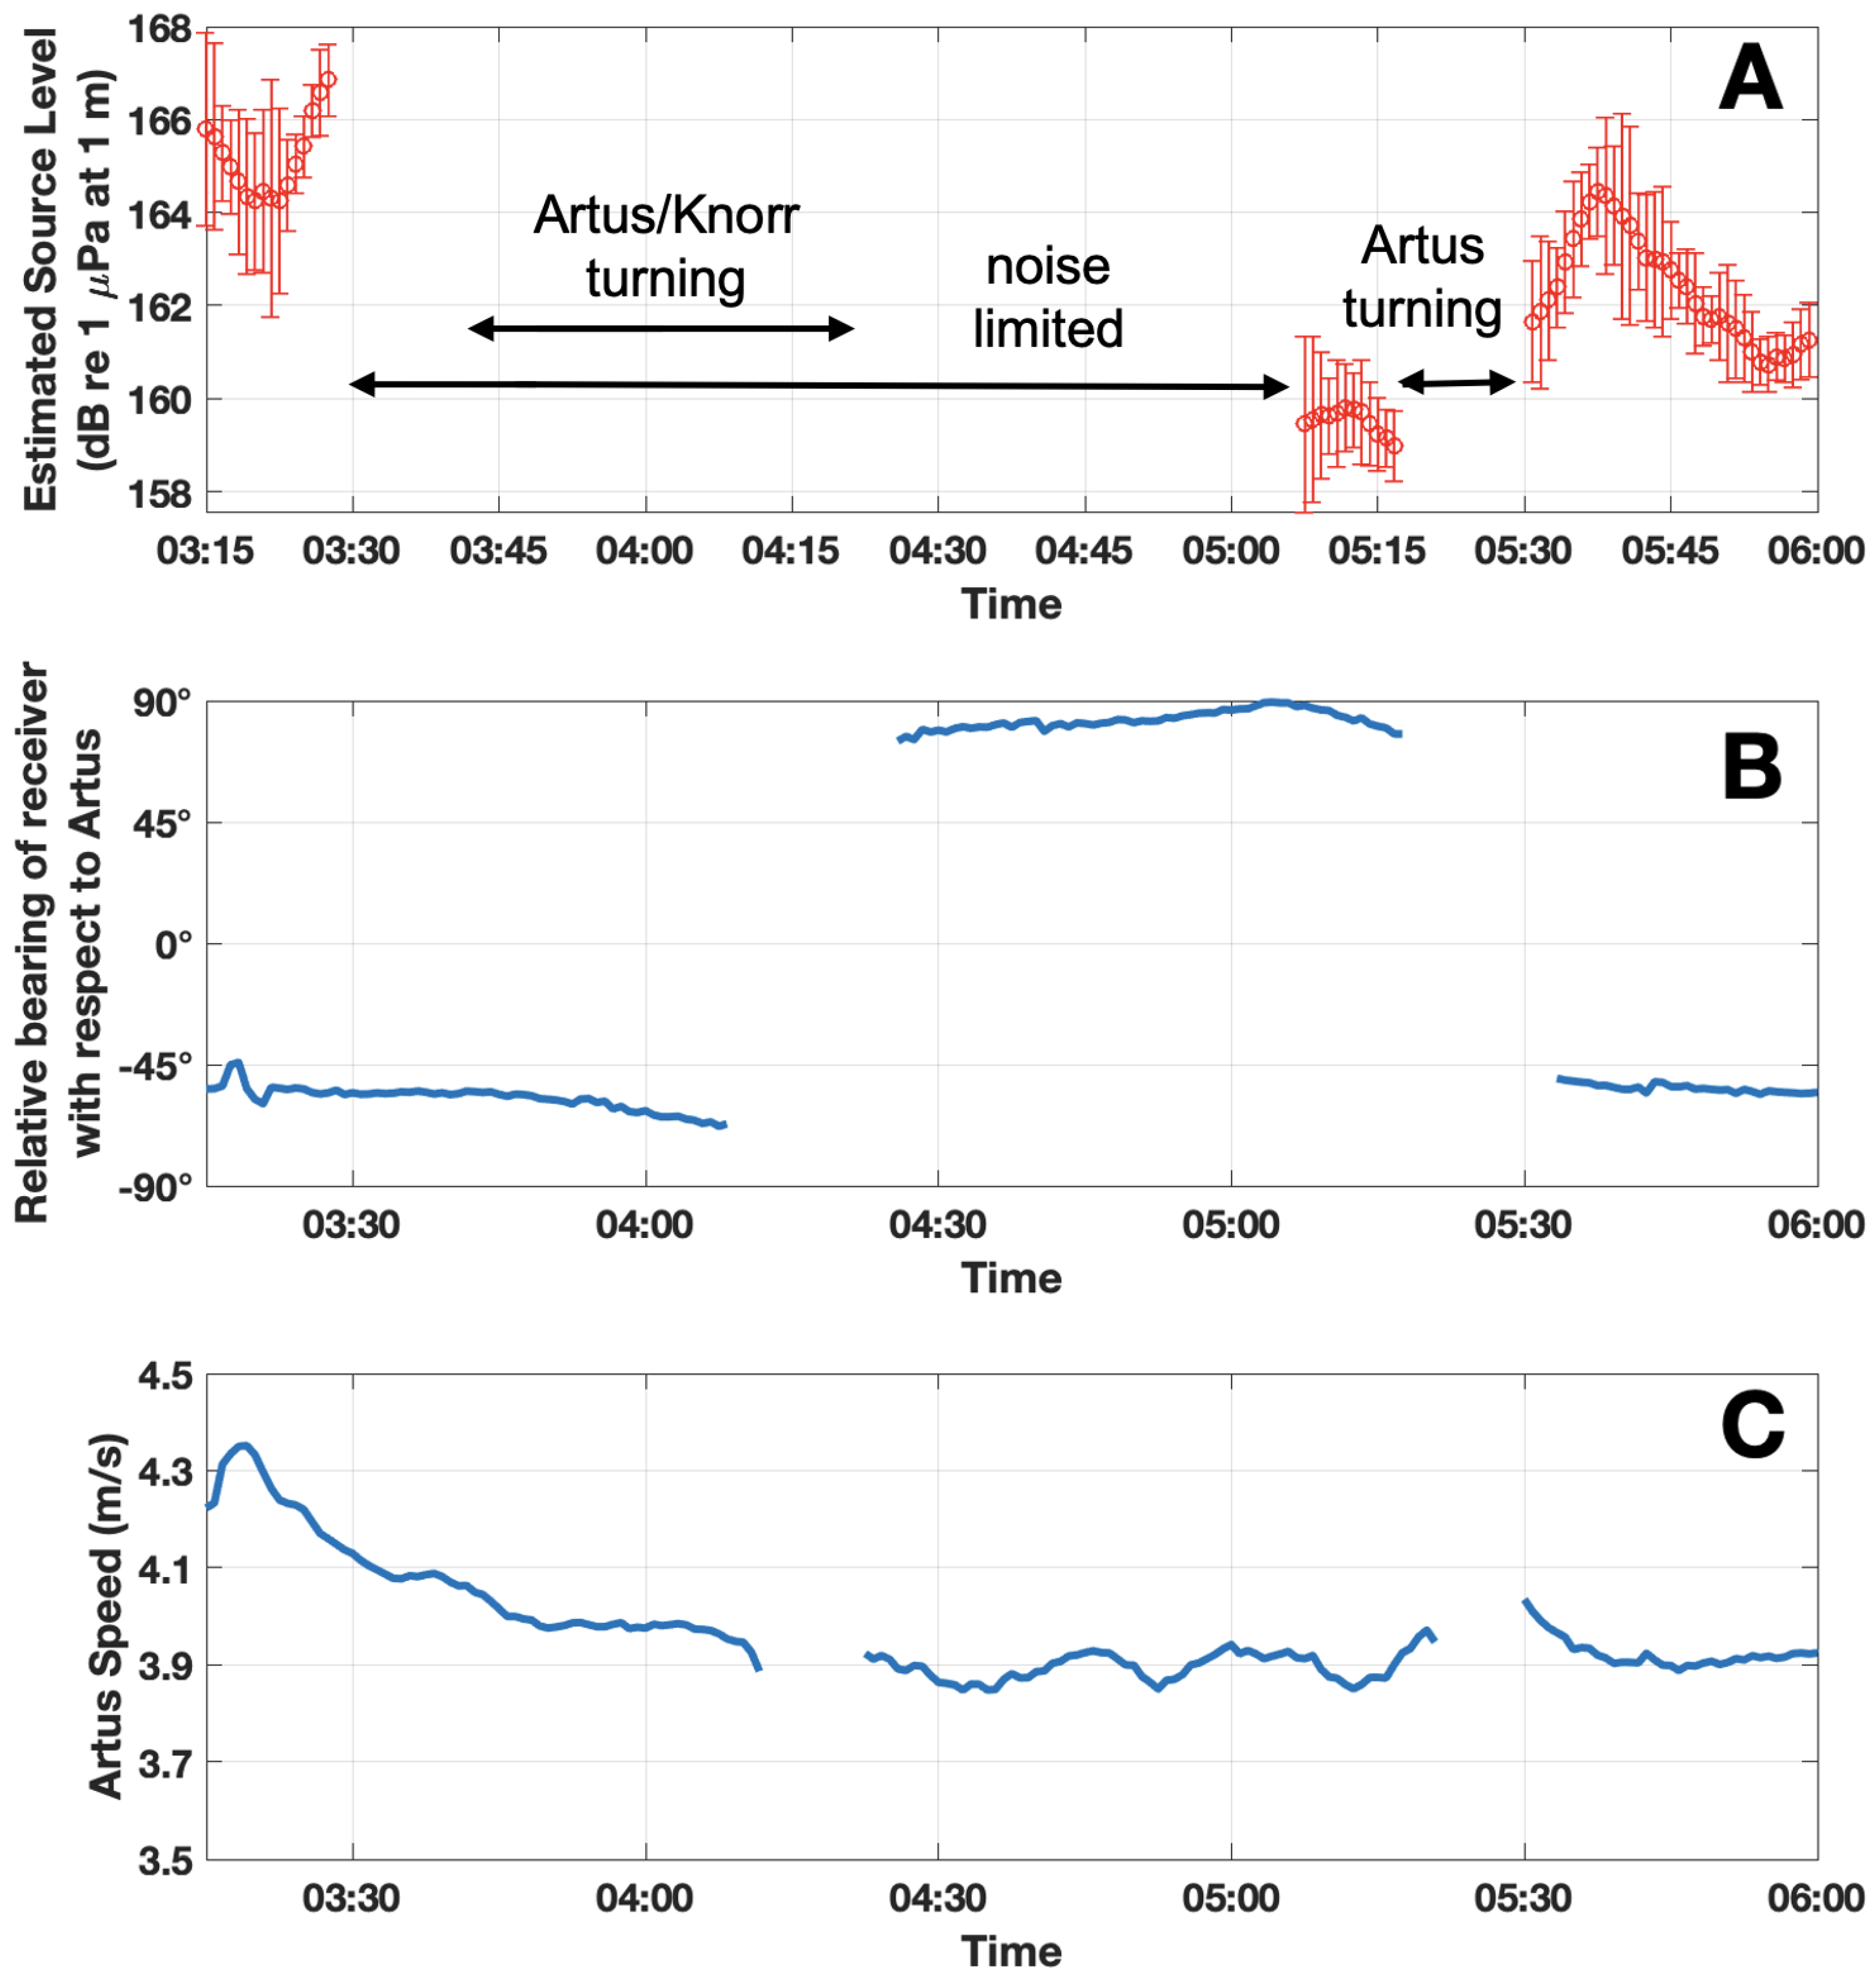
where is the received level of the Artus tonal corrected for transmission loss from spreading losses and seafloor attenuation (Figure 7B) and is the modeled decrease in sound pressure level of the Artus tonal due to attenuation from fish (Figure 7C). Source level estimates between 3:15 and 6:00 on 21 February are shown in Figure A4A. Variations in source level estimates are likely caused by changes in the bearing of the receiver with respect to the Artus (Figure A4B). Variations in the speed of the Artus cannot fully explain observed reductions in the intensity of the received signal of the Artus (Figure A4C), demonstrating that attenuation from fish is a significant factor leading to intensity reductions and detection losses. With the exception of the ship turns at 3:10, 4:15, and 5:20, variations in the speed of the Artus are smaller than 0.5 m/s.
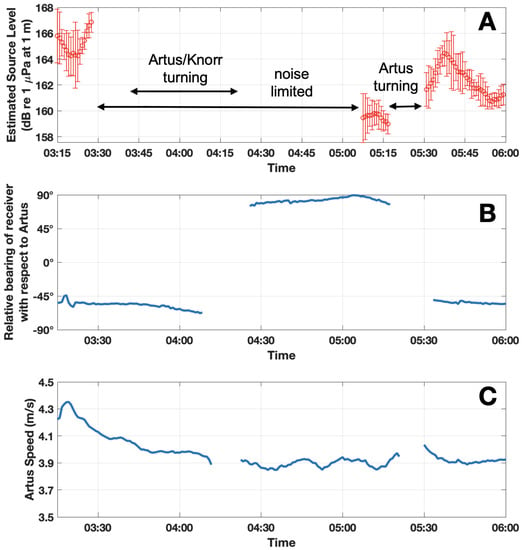
Figure A4.
The source level of the Artus signal within the frequency band of the Artus tonal (1570.5–1597.5 Hz) is estimated in A, according to Equation (A5). Error bars in (A) denote the standard deviation over 30 s intervals. Variations in source level estimates over time are likely caused by changes in the direction of the Artus, since ship-radiated sound is typically directional [36]. The relative bearing (B) of the receiver with respect to the Artus is defined to be 90° when the Artus is facing toward the receiver and −90° when the Artus is facing away from the receiver. The estimated source level is greatest when the Artus faces away from the receiver since there is a more direct path from the Artus engine to the receiver. Between 3:15–4:09 and 5:33–6:00, the receiver is within 45° of the Artus’s back endfire direction and the estimated source level is between 161 and 167 dB re 1 Pa at 1 m. Between 4:25–5:18, the receiver is within 15° of the Artus’s forward endfire direction and the estimated source level is between 158 and 160 dB re 1 Pa at 1 m. Source level estimations are consistent with previously-reported source levels for surface vessels of similar size as the Artus [37]. With the exception of the ship turns at 3:10, 4:15, and 5:20, variations in the speed of the Artus are smaller than 0.5 m/s (C).
Appendix E. Sound Speed Profiles
Water-column sound speed profiles in the Gulf of Maine, Finnmark waters, and Ålesund waters are shown in Figure A5.

Figure A5.
Profiles of water-column sound speed from XBT measurements in the Gulf of Maine, Finnmark waters, and Ålesund waters. Black solid lines denote the mean sound speed, and gray shaded regions denote standard deviation.
Figure A5.
Profiles of water-column sound speed from XBT measurements in the Gulf of Maine, Finnmark waters, and Ålesund waters. Black solid lines denote the mean sound speed, and gray shaded regions denote standard deviation.

References
- Medwin, H.; Clay, C. Acoustical Oceanography; John Wiley Sons Inc.: New York, NY, USA, 1977. [Google Scholar]
- Urick, R. Principles of Underwater Sound; McGraw Hill: New York, NY, USA, 1983. [Google Scholar]
- Wang, D.; Garcia, H.; Tran, D.D.; Jain, A.D.; Yi, D.H.; Gong, Z.; Jech, J.M.; Godø, O.R.; Makris, N.C.; Ratilal, P. Vast assembly of vocal marine mammals from diverse species on fish spawning ground. Nature 2016, 531, 366–369. [Google Scholar] [CrossRef]
- Weston, D.; Stevens, K.; Revie, J.; Pengelly, M. Multiple frequency studies of sound transmission fluctuations in shallow water. J. Sound. Vib. 1971, 18, 487–497. [Google Scholar] [CrossRef]
- Ching, P.; Weston, D. Wideband studies of shallow-water acoustic attenuation due to fish. J. Sound. Vib. 1971, 18, 499–510. [Google Scholar] [CrossRef]
- Diachok, O. Effects of absorptivity due to fish on transmission loss in shallow water. J. Acoust. Soc. Am. 1999, 105, 2107–2128. [Google Scholar] [CrossRef]
- Diachok, O.; Liorzou, B.; Scalabrin, C. Estimation of the number density of fish from resonance absorptivity and echo sounder data. ICES J. Mar. Sci. 2001, 58, 137–153. [Google Scholar] [CrossRef][Green Version]
- Duane, D.; Cho, B.; Jain, A.D.; Godø, O.R.; Makris, N.C. The Effect of Attenuation from Fish Shoals on Long-Range, Wide-Area Acoustic Sensing. Remote Sens. 2019, 11, 2464. [Google Scholar] [CrossRef]
- Garcia, H.A.; Zhu, C.; Schinault, M.E.; Kaplan, A.I.; Handegard, N.O.; Godø, O.R.; Ahonen, H.; Makris, N.C.; Wang, D.; Huang, W.; et al. Temporal–Spatial, Spectral, and Source Level Distributions of Fin Whale Vocalizations in the Norwegian Sea observed with a Coherent Hydrophone Array. ICES J. Mar. Sci. 2019, 76, 268–283. [Google Scholar] [CrossRef]
- Huang, W.; Wang, D.; Ratilal, P. Diel and Spatial Dependence of Humpback Song and Non-Song Vocalizations in Fish Spawning Ground. Remote Sens. 2016, 8, 712. [Google Scholar] [CrossRef]
- Wang, D.; Huang, W.; Garcia, H.; Ratilal, P. Vocalization Source Level Distributions and Pulse Compression Gains of Diverse Baleen Whale Species in the Gulf of Maine. Remote Sens. 2016, 8, 881. [Google Scholar] [CrossRef]
- Gong, Z.; Jain, A.D.; Yi, D.H.; Wu, F.; Zorn, A.; Ratilal, P.; Makris, N.C. Ecosystem Scale Acoustic Sensing Reveals Humpback Whale Behavior Synchronous with Herring Spawning Processes and Re-Evaluation Finds No Effect of Sonar on Humpback Song Occurence in the Gulf of Maine in Fall 2006. PLoS ONE 2014, 9, e104733. [Google Scholar] [CrossRef]
- Tran, D.D.; Huang, W.; Bohn, A.C.; Wang, D. Using a Coherent Hydrophone Array for Observing sperm Whale Range, Classification, and Shallow-Water Dive Profiles. J. Acoust. Soc. Am. 2014, 135, 3352–3363. [Google Scholar] [CrossRef] [PubMed]
- Huang, W.; Wang, D.; Garcia, H.; Godø, O.R.; Ratilal, P. Continental Shelf-Scale Passive Acoustic Detection and Characterization of Diesel-Electric Ships Using a Coherent Hydrophone Array. Remote Sens. 2017, 9, 772. [Google Scholar] [CrossRef]
- Zhu, C.; Garcia, H.; Kaplan, A.; Schinault, M.; Handegard, N.O.; Godø, O.R.; Huang, W.; Ratilal, P. Detection, Localization and Classification of Multiple Mechanized Ocean Vessels over Continental-Shelf Scale Regions with Passive Ocean Acoustic Waveguide Remote Sensing. Remote Sens. 2018, 10, 1699. [Google Scholar] [CrossRef]
- Zhu, C.; Seri, S.G.; Mohebbi-Kalkhoran, H.; Ratilal, P. Long-Range Automatic Detection, Acoustic Signature Characterization and Bearing-Time Estimation of Multiple Ships with Coherent Hydrophone Array. Remote Sens. 2020, 12, 3731. [Google Scholar] [CrossRef]
- Tran, D.D.; Andrews, M.; Ratilal, P. Probability Distribution for Energy of Saturated Broadband Ocean Acoustic Transmission: Results from Gulf of Maine 2006 Experiment. J. Acoust. Soc. Am. 2012, 132, 3659–3672. [Google Scholar] [CrossRef]
- Ratilal, P.; Makris, N.C. Mean and covariance of the forward field propagated through a stratified ocean waveguide with three-dimensional random inhomogeneities. J. Acoust. Soc. Am. 2004, 118, 3532–3558. [Google Scholar] [CrossRef]
- Chen, T.; Ratilal, P.; Makris, N.C. Mean and variance of the forward field propagated through three-dimensional random internal waves in a continental-shelf waveguide. J. Acoust. Soc. Am. 2005, 118, 3560–3574. [Google Scholar] [CrossRef]
- Chen, T.; Ratilal, P.; Makris, N.C. Temporal coherence after multiple forward scattering through random three-dimensional inhomogeneities in an ocean waveguide. J. Acoust. Soc. Am. 2008, 124, 2812–2822. [Google Scholar] [CrossRef]
- Gong, Z.; Chen, T.; Ratilal, P.; Makris, N.C. Temporal coherence of the acoustic field forward propagated through a continental shelf with random internal waves. J. Acoust. Soc. Am. 2013, 134, 3476–3485. [Google Scholar] [CrossRef] [PubMed]
- Cho, B.; Makris, N.C. Predicting the effects of random ocean dynamic processes on underwater acoustic sensing and communication. Sci. Rep. 2020, 10, 4525. [Google Scholar] [CrossRef]
- Collins, M. A split-step Padé solution for the parabolic equation method. J. Acoust. Soc. Am. 1993, 93, 1736–1742. [Google Scholar] [CrossRef]
- Andrews, M.; Chen, T.; Ratilal, P. Empirical dependence of acoustic transmission scintillation statistics on bandwidth, frequency, and range in New Jersey continental shelf. J. Acoust. Soc. Am. 2009, 125, 111–124. [Google Scholar] [CrossRef]
- Makris, N.C.; Ratilal, P.; Jagannathan, S.; Gong, Z.; Andrews, M.; Bertsatos, I.; Godø, O.; Nero, R.; Jech, J.M. Critical population density triggers rapid formation of vast oceanic fish shoals. Science 2009, 323, 1734–1737. [Google Scholar] [CrossRef]
- Makris, N.C.; Ratilal, P.; Symonds, D.; Jagannathan, S.; Lee, S.; Nero, R. Fish population and behavior revealed by instantaneous continental shelf-scale imaging. Science 2006, 311, 660–663. [Google Scholar] [CrossRef]
- Jagannathan, S.; Bertsatos, I.; Symonds, D.; Chen, T.; Nia, H.; Jain, A.; Andrews, M.; Gong, Z.; Nero, R.; Ngor, L.; et al. Ocean Acoustics Waveguide Remote Sensing (OAWRS) of marine ecosystems. Mar. Ecol. Prog. Ser. 2009, 395, 137–160. [Google Scholar] [CrossRef]
- Gong, Z.; Andrews, M.; Jagannathan, S.; Patel, R.; Jech, J.M.; Makris, N.C.; Ratilal, P. Low-frequency target strength and abundance of shoaling Atlantic herring (Clupea Harengus) Gulf Maine Ocean Acoust. Waveguide Remote Sens. 2006 Exp. J. Acoust. Soc. Am. 2010, 127, 104–123. [Google Scholar] [CrossRef]
- Dyer, I. Statistics of Sound Propagation in the Ocean. J. Acoust. Soc. Am. 1970, 48, 337–345. [Google Scholar] [CrossRef]
- Makris, N.C. The effect of saturated transmission scintillation on ocean acoustic intensity measurements. J. Acoust. Soc. Am. 1996, 100, 769–783. [Google Scholar] [CrossRef]
- Yi, D.H.; Makris, N.C. Feasibility of Acoustic Remote Sensing of Large Herring Shoals and Seafloor by Baleen Whales. Remote Sens. 2016, 8, 693. [Google Scholar] [CrossRef]
- Johnson, M.; Madsen, P.T.; Zimmer, W.M.X.; de Soto, N.A.; Tyack, P.L. Beaked whales echolocate on prey. Proc. Biol. Sci. 2004, 271, 2239–2247. [Google Scholar] [CrossRef] [PubMed]
- Makris, N.C.; Godø, O.R.; Yi, D.H.; Macauley, G.J.; Jain, A.D.; Cho, B.; Gong, Z.; Jech, J.M.; Ratilal, P. Instantaneous areal population density estimation of entire Atlantic cod and herring spawning groups and group size distribution relative to total spawning population. Fish Fish. 2018, 20, 1–13. [Google Scholar]
- Wang, D.; Ratilal, P. Angular resolution enhancement provided by nonuniformly-spaced linear hydrophone arrays in ocean acoustic waveguide remote sensing. Remote Sens. 2017, 9, 1036. [Google Scholar] [CrossRef]
- Makris, N.C. A foundation for logarithmic measures of fluctuating intensity in pattern recognition. Opt. Lett. 1995, 20, 2012–2014. [Google Scholar] [CrossRef]
- Trevorrow, M.V.; Vasiliev, B. Directionality and maneuvering effects on a surface ship underwater acoustic signature. J. Acoust. Soc. Am. 2008, 124, 767. [Google Scholar] [CrossRef]
- Wang, L.S.; Robinson, S.P.; Theobald, P. Measurement of radiated ship noise. Proc. Mtgs. Acoust. 2012, 17, 070091. [Google Scholar]
Publisher’s Note: MDPI stays neutral with regard to jurisdictional claims in published maps and institutional affiliations. |
© 2021 by the authors. Licensee MDPI, Basel, Switzerland. This article is an open access article distributed under the terms and conditions of the Creative Commons Attribution (CC BY) license (https://creativecommons.org/licenses/by/4.0/).

