Abstract
This article presents the burned area (BA) product of the Copernicus Climate Change Service (C3S) of the European Commission. This product, named C3SBA10, is based on the adaptation to Sentinel-3 OLCI images of a BA algorithm developed within the Fire Climate Change Initiative (FireCCI) project, which used MODIS data. We first reviewed the adaptation process and then analysed the results of both products for common years (2017–2019). Comparisons were performed using four different grid sizes (0.05°, 0.10°, 0.25°, and 0.50°). Annual correlations between the two products ranged from 0.94 to 0.99. Global BA estimates were found to be more similar when the two Sentinel-3 satellites were active (2019), as the temporal resolution was closer to that of the MODIS sensor. Global validation was performed using reference data derived from Landsat-8 images, following a stratified random sampling design. The C3SBA10 showed commission errors between 16 and 21% and omission errors from 48 to 50%, similar to those found in the FireCCI product. The temporal reporting accuracy was also validated using 19 million active fires. In total, 87% of the detections were made within 10 days after the fire by both products. The high consistency between both products ensures global BA data provision from 2001 to the present. The datasets are freely available through the Copernicus Climate Data Store (CDS) repository.
1. Introduction
Interactions between climate and fire are bidirectional. On the one hand, climate impacts fire regimes [1,2,3,4], mostly by modifying temperature and precipitation patterns, which in turn impacts fire ignition and behaviour through changes in soil and fuel moisture, vegetation productivity, and fuel availability [5,6,7,8]. On the other hand, biomass burning is a critical source of aerosols and greenhouse gases that directly affect atmospheric chemistry [9,10], carbon budgets [11,12], and carbon stocks [13]. Emissions from fires increase aerosol optical depth, modifying the radiation budget and, thus, warming the lower atmosphere, which affects regional temperature, clouds, and precipitation patterns [14,15].
Fires have important ecological implications as well. They are closely related to biodiversity, either favouring or degrading it depending on fire severity and persistency [16,17,18]. Furthermore, wildfires have significant societal impacts, particularly when extreme events occur as a result of climate anomalies. Large damage to people’s lives, health and infrastructure have been observed in recent catastrophic fire seasons of Southern Europe, Australia and Western USA [2,8,19].
For those reasons, Fire Disturbance was included by the Global Climate Observing System (GCOS) as one of the Essential Climate Variables (ECV) [20], acknowledging its relevance to characterising the Earth’s climate system. The European Space Agency (ESA) responded to the GCOS demands by promoting the Climate Change Initiative (CCI) programme in 2009. Its main objective was to develop long-term datasets of ECVs based on satellite observations. This programme was initially focused on 13 ECVs (extended to 26 ECVs in 2018), each of them addressed within a dedicated project that encompassed algorithm development, validation, uncertainty characterisation, and large-scale earth observations data processing, among other tasks [21].
Fire disturbance was one of the initial ECVs tackled within the CCI programme (FireCCI project, https://climate.esa.int/en/projects/fire/, accessed on 21 October 2021), aiming to produce long-term time series of global burned area (BA) data. Although BA information is required for a wide range of applications [22,23], the FireCCI project was mainly oriented towards climate modellers and, hence, BA data have been mainly used for the characterisation of fire emissions [9,24] and the parameterisation of Dynamic Global Vegetation Models (DGVMs) [25,26,27,28]. These applications strongly benefit from an extended temporal coverage of BA datasets, while assuring their temporal and spatial consistency [29]. The most recent BA products developed within the FireCCI project include the FireCCI51, based on MODIS data, which extends from 2001 to 2019 [30], and the FireCCILT11 (1982–2018), based on AVHRR-LTDR data [31].
A few years after the ESA CCI programme started, the European Commission launched the Copernicus Climate Change Service (C3S, https://climate.copernicus.eu/, accessed on 21 October 2021), which now includes more than 20 ECVs [32]. This service builds upon the research and development carried out by the scientific community, especially the one associated to the CCI programme, and it is the service in charge of the operational production of those ECV datasets. Regarding BA, the FireCCI51 product was transferred to the C3S for the historical record, while demanding the generation of a new BA dataset based on European Copernicus satellites. The new product should guarantee consistency with the FireCCI51 data, as this dataset was developed only for research purposes, and it would no longer be processed. Adapting both the BA algorithm and the product to the new Copernicus missions would assure an operational continuity of the BA products. Since FireCCI51 was generated from the 250 m resolution near-infrared (NIR) band of the MODIS sensor [30], it was decided to base the continuity of this BA dataset on the Ocean and Land Colour Instrument (OLCI) on board Sentinel-3 (S3), which has a similar spatial and temporal resolution.
The adaptation of algorithms and products to different sensors is often performed when long-term time series are required, since the lifetime of single missions is generally limited. Coupling datasets from different input sensors extends the length of the series or helps fill existing gaps. The change from one input data source to another is not automatic, as each sensor has its particular characteristics in terms of spatial, temporal and radiometric resolution, which determine the performance of the algorithm. For this reason, a thorough review of the algorithm is required, in order to adapt it to the characteristics of the new sensor. For instance, the SeaWIFS Ocean Aerosol Retrieval (SOAR) algorithm, originally designed for the retrieval of aerosol optical depth (AOD) over water from the SeaWIFS sensor [33], and the Deep Blue algorithm to retrieve AOD over land [34], have been adapted to the Suomi-NPP Visible Infrared Imaging Radiometer Suite (VIIRS) sensor [35,36] and to the AVHRR sensor [37], requiring several algorithm adaptations and optimisations. Another example is the sea surface temperature (SST) dataset of C3S (https://cds.climate.copernicus.eu/cdsapp#!/dataset/satellite-sea-surface-temperature, accessed on 21 October 2021), which derives independent SST Level 3 products from AVHRR, ATSR1, ATSR2, AATSR and SLSTR sensors [38]. To assure the consistency of the different products, the harmonisation of the sensor input data [39] and the adaptation of some parts of the SST retrieval algorithm [40] were performed. Although a Level 4 multi-sensor product exists, which provides spatially complete information, the authors indicate that the process of interpolation for gap-filling entails that feature resolution is degraded relative to the lower-level data [41], and for this reason, different products from the individual sensors are still provided, and are useful.
This paper presents the adaptation of the FireCCI51 BA algorithm to the OLCI sensor and the generation of the new BA dataset, named C3SBA10, which is now part of the C3S service. This product is the first global BA product derived from OLCI data. This manuscript briefly describes the original algorithm (FireCCI51) in Section 2.1, while the pre-processing, adaptation, uncertainty characterisation, generation, and distribution of the OLCI-based BA dataset are explained in Section 2.2, Section 2.3, Section 2.4 and Section 2.5. The C3SBA10 data were produced from 2017 to the present. This dataset was designed to be as consistent as possible with its predecessor FireCCI51 (2001–2019) to ensure that multi-decadal analyses can benefit from both datasets uninterruptedly. For this reason, this paper emphasises the inter-comparison analysis between FireCCI51 and C3SBA10 datasets for the common period (2017–2019), pointing out similarities and discrepancies (Section 2.6). The products were spatially validated using reference data obtained from multitemporal Landsat-8 images, and temporally validated using active fire information (Section 2.7). The results of the BA detections for the common time series (2017–2019) as well as the quality assessment of the product are presented in Section 3, followed by the discussion and conclusion (Section 4 and Section 5, respectively).
2. Materials and Methods
2.1. FireCCI51 Algorithm
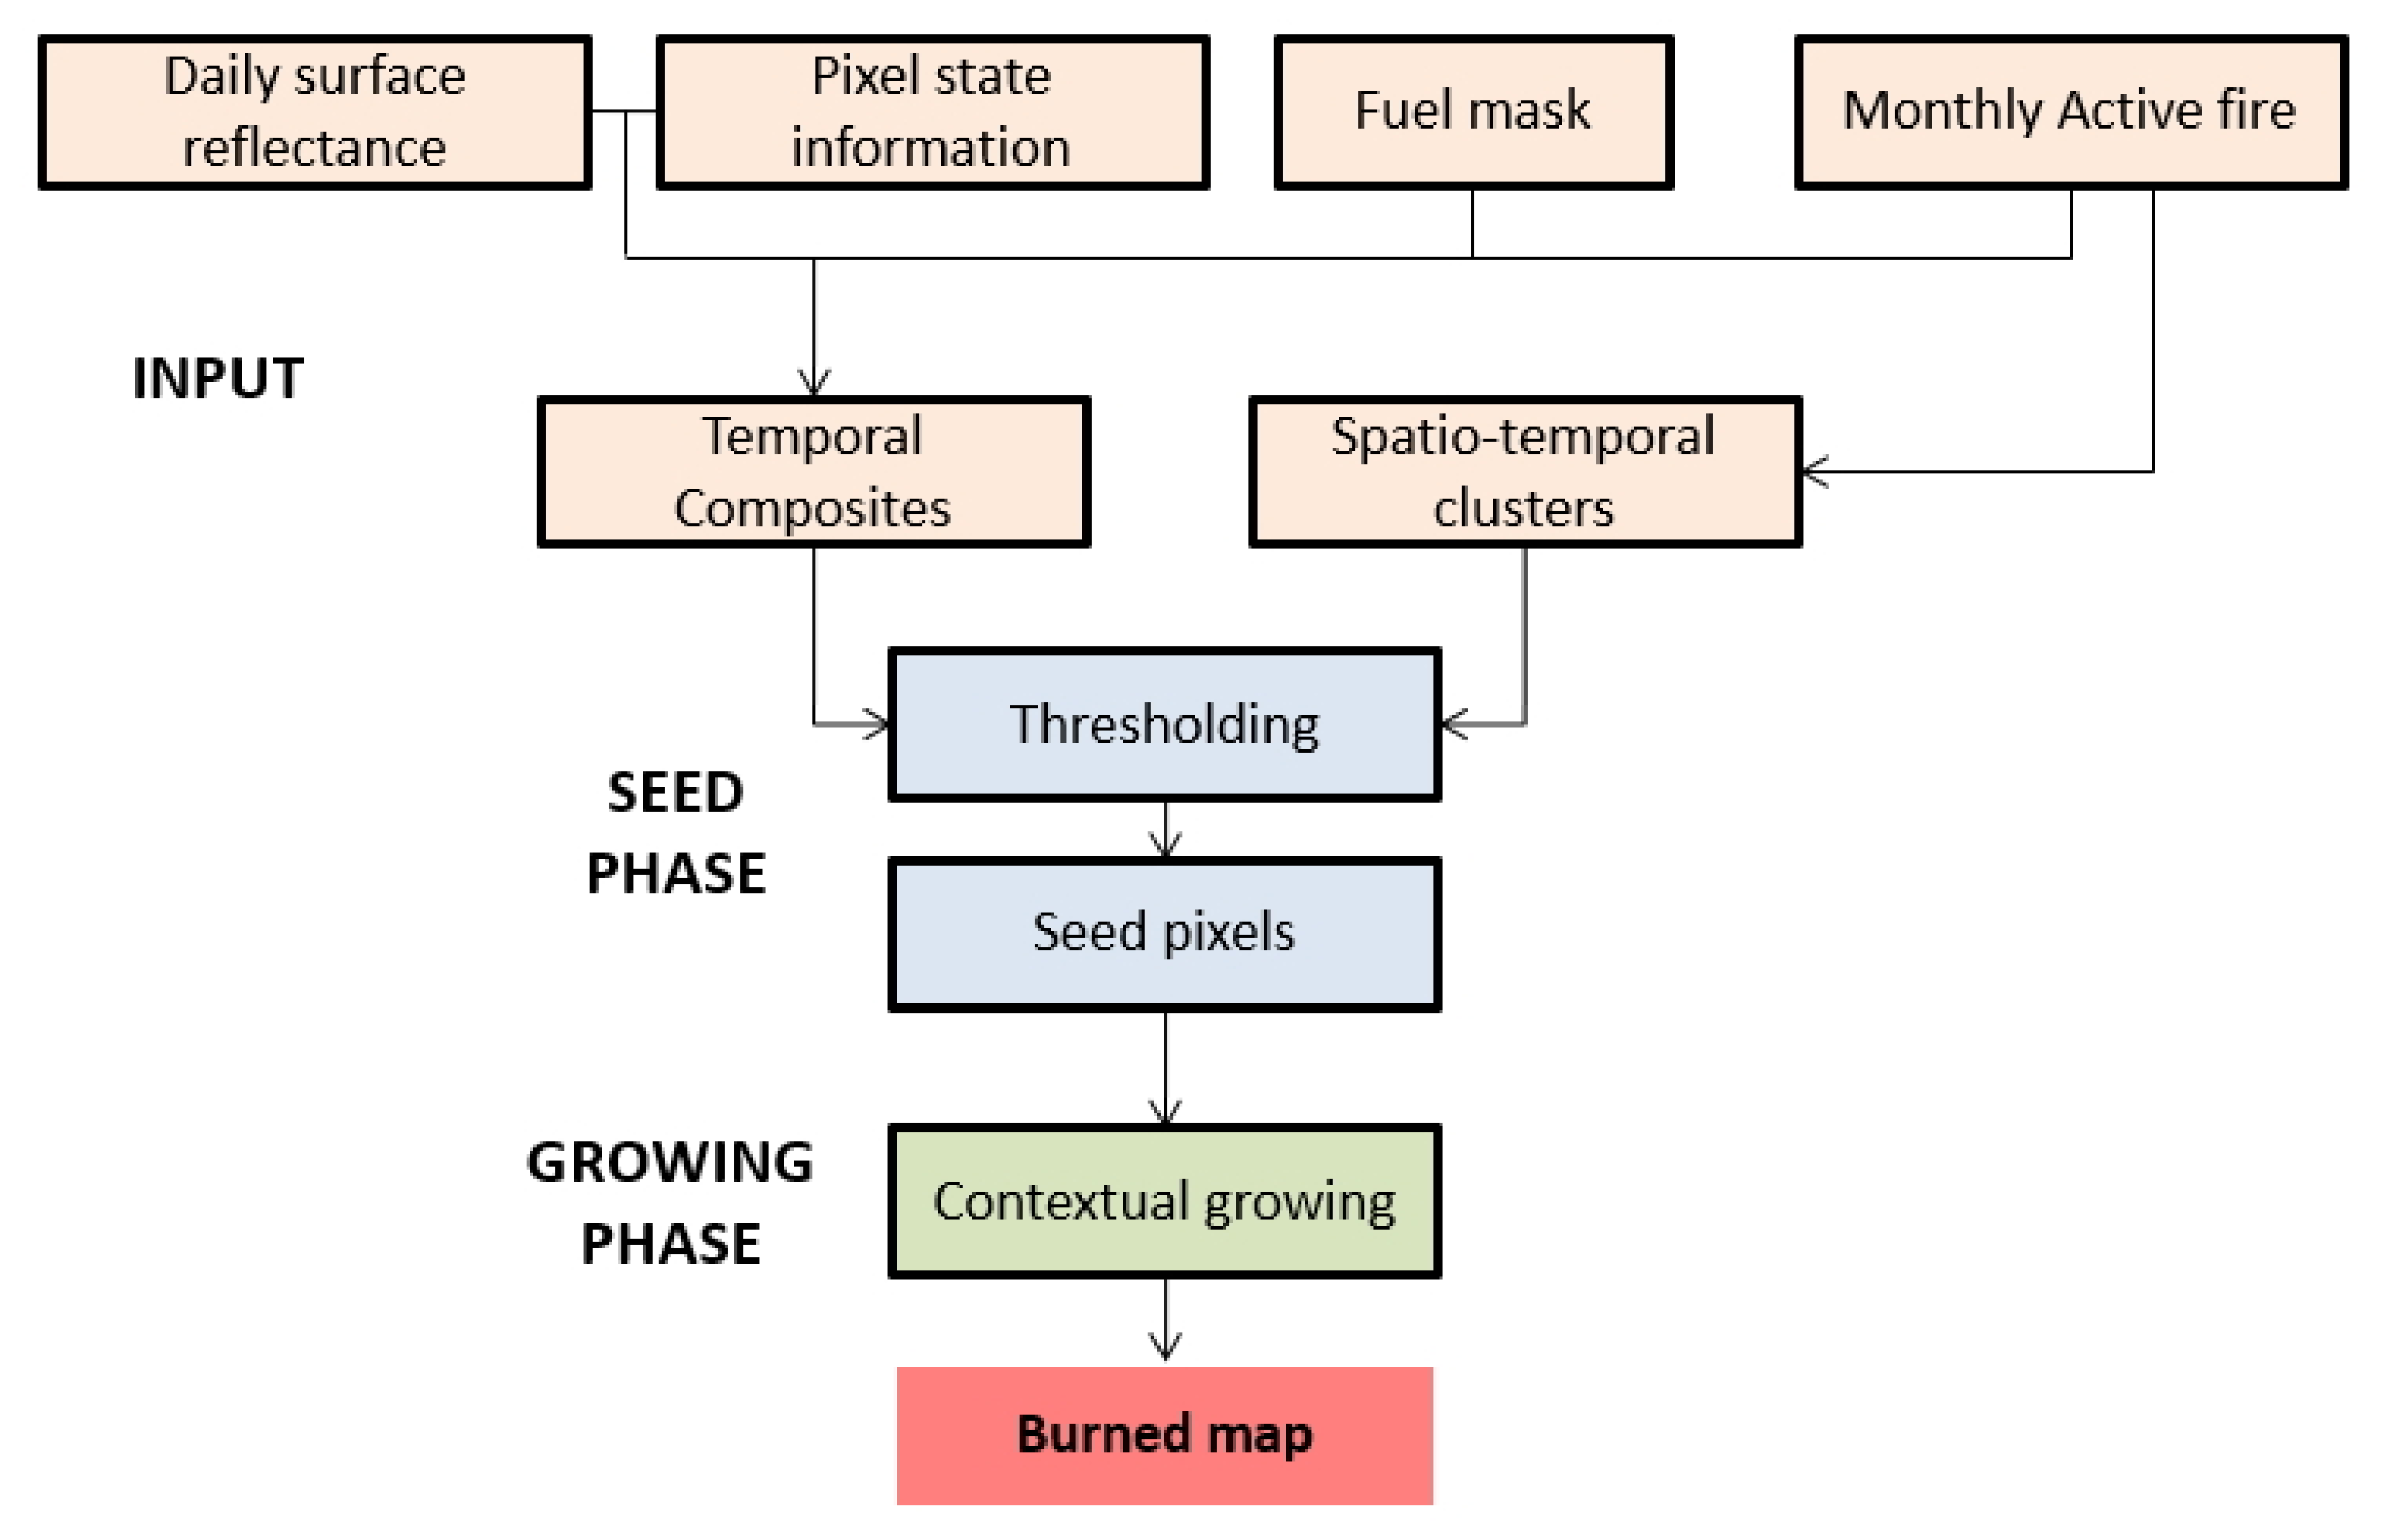
The FireCCI51 algorithm was developed to take advantage of the higher spatial resolution of the Red/NIR bands of MODIS (250 m). It follows a hybrid approach that combines active fires and reflectance changes caused by burnings (see Figure 1, with further details in [30]). The algorithm first created monthly composites of NIR reflectance by searching for the minimum NIR daily surface reflectance within the monthly period while maximising the proximity to the date determined by the nearest active fire. Since NIR typically decreases after a fire event, a second monthly variable that retains the relative NIR drop from the previous composite was computed as well. To avoid problems related to cloud and cloud shadows, pixel state information, which indicates the quality of the observation, was used to filter out those pixels. The third variable was generated from neighbour active fires that are sufficiently close in space (<1875 m) and time (<4 days) to be aggregated into spatio-temporal clusters (STC). To improve computational efficiency, a fuel mask (burnable categories) was derived from land cover data. It was used to remove urban areas, bare areas, water bodies, and permanent snow and ice classes from further processing [30].
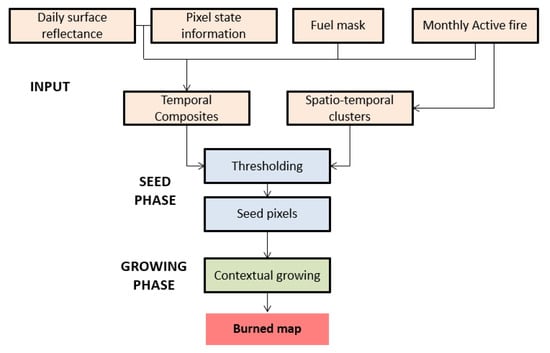
Figure 1.
Simplified version of the main scheme of the global BA algorithm. Adapted from [30].
The detection of burned pixels was performed following a two-phase approach. The first step aimed to minimise commission errors by selecting seed-pixels with a high probability of being burned (seed-phase). NIR and relative NIR drop thresholds were obtained for each STC based on specific burned and unburned samples. The burned sample was defined by the active fires that belong to the STC. The unburned one was composed of pixels from the vicinity of the STC, i.e., those located within a strip between 10 and 20 km from the STC. Using in each case the thresholds of the corresponding STC, active fires were filtered out to obtain seed-pixels. The second phase of the algorithm proceeded with iterative contextual growth around each seed-pixel, the stop criteria being the thresholds of the STC to which the seed-pixel belonged (growing-phase). The purpose of this step was to minimise omission errors by better shaping the burned patch.
The final result was a monthly classification, wherein each burned pixel was labelled by its day of detection, i.e., the day of the year from which the NIR value of the monthly composite was extracted.
2.2. Input Data for the C3SBA10 Product
2.2.1. OLCI Surface Directional Reflectances
The S3 satellites were designed to provide operational ocean and land observation services (https://sentinel.esa.int/web/sentinel/missions/sentinel-3, accessed on 21 October 2021). They represent the continuity of the European Remote Sensing satellites (ERS-1 and ERS-2), the Envisat, and the Satellite Pour l’Observation de la Terre (SPOT). S3s have a low-altitude (814.5 km), high-inclination (98.65°) sun-synchronous Earth orbit and need 27 days to complete a full cycle (385 orbits). The first satellite, called S3A, was launched in February 2016 and the second one, called S3B, was launched two years later. The orbit of S3B is identical to S3A but it flies ±140° out of phase to improve revisit time. The design life of S3 is 7.5 years (consumables for 12 years), but the mission is expected to last longer, with two additional satellites already funded.
The OLCI sensor, one of S3’s main payloads, is a push-broom imaging spectrometer composed of five cameras that are tiled 12.6° in the western direction to mitigate potential sun-glint effects (https://sentinel.esa.int/web/sentinel/technical-guides/sentinel-3-olci, accessed on 21 October 2021). It has a swath width of 1270 km (Field-of-View = 68.6°) and it offers global coverage at 300 m every ~2 or ~1 day depending on the number of satellites available (S3A or S3A + S3B, respectively), the latitude, and the application (ocean or land). The OLCI instrument includes 21 spectral bands (400–1020 nm), 15 taken from the precursor sensor MERIS on board the ENVISAT satellite, and 6 extra channels that were included to improve the atmospheric and aerosol corrections (Table 1). OLCI was initially designed for ocean monitoring, but it has been successfully used in several land applications [42,43]. MERIS data were the basis of the first global BA dataset within the FireCCI [44], and therefore, it was expected that OLCI would show similar BA detection capabilities, although with better temporal resolution (3-day revisit time for MERIS and 1 day for OLCI, when the two S3s are available).

Table 1.
OLCI bands characteristics. The band indicated in grey was the one used as input for the C3SBA10 algorithm.
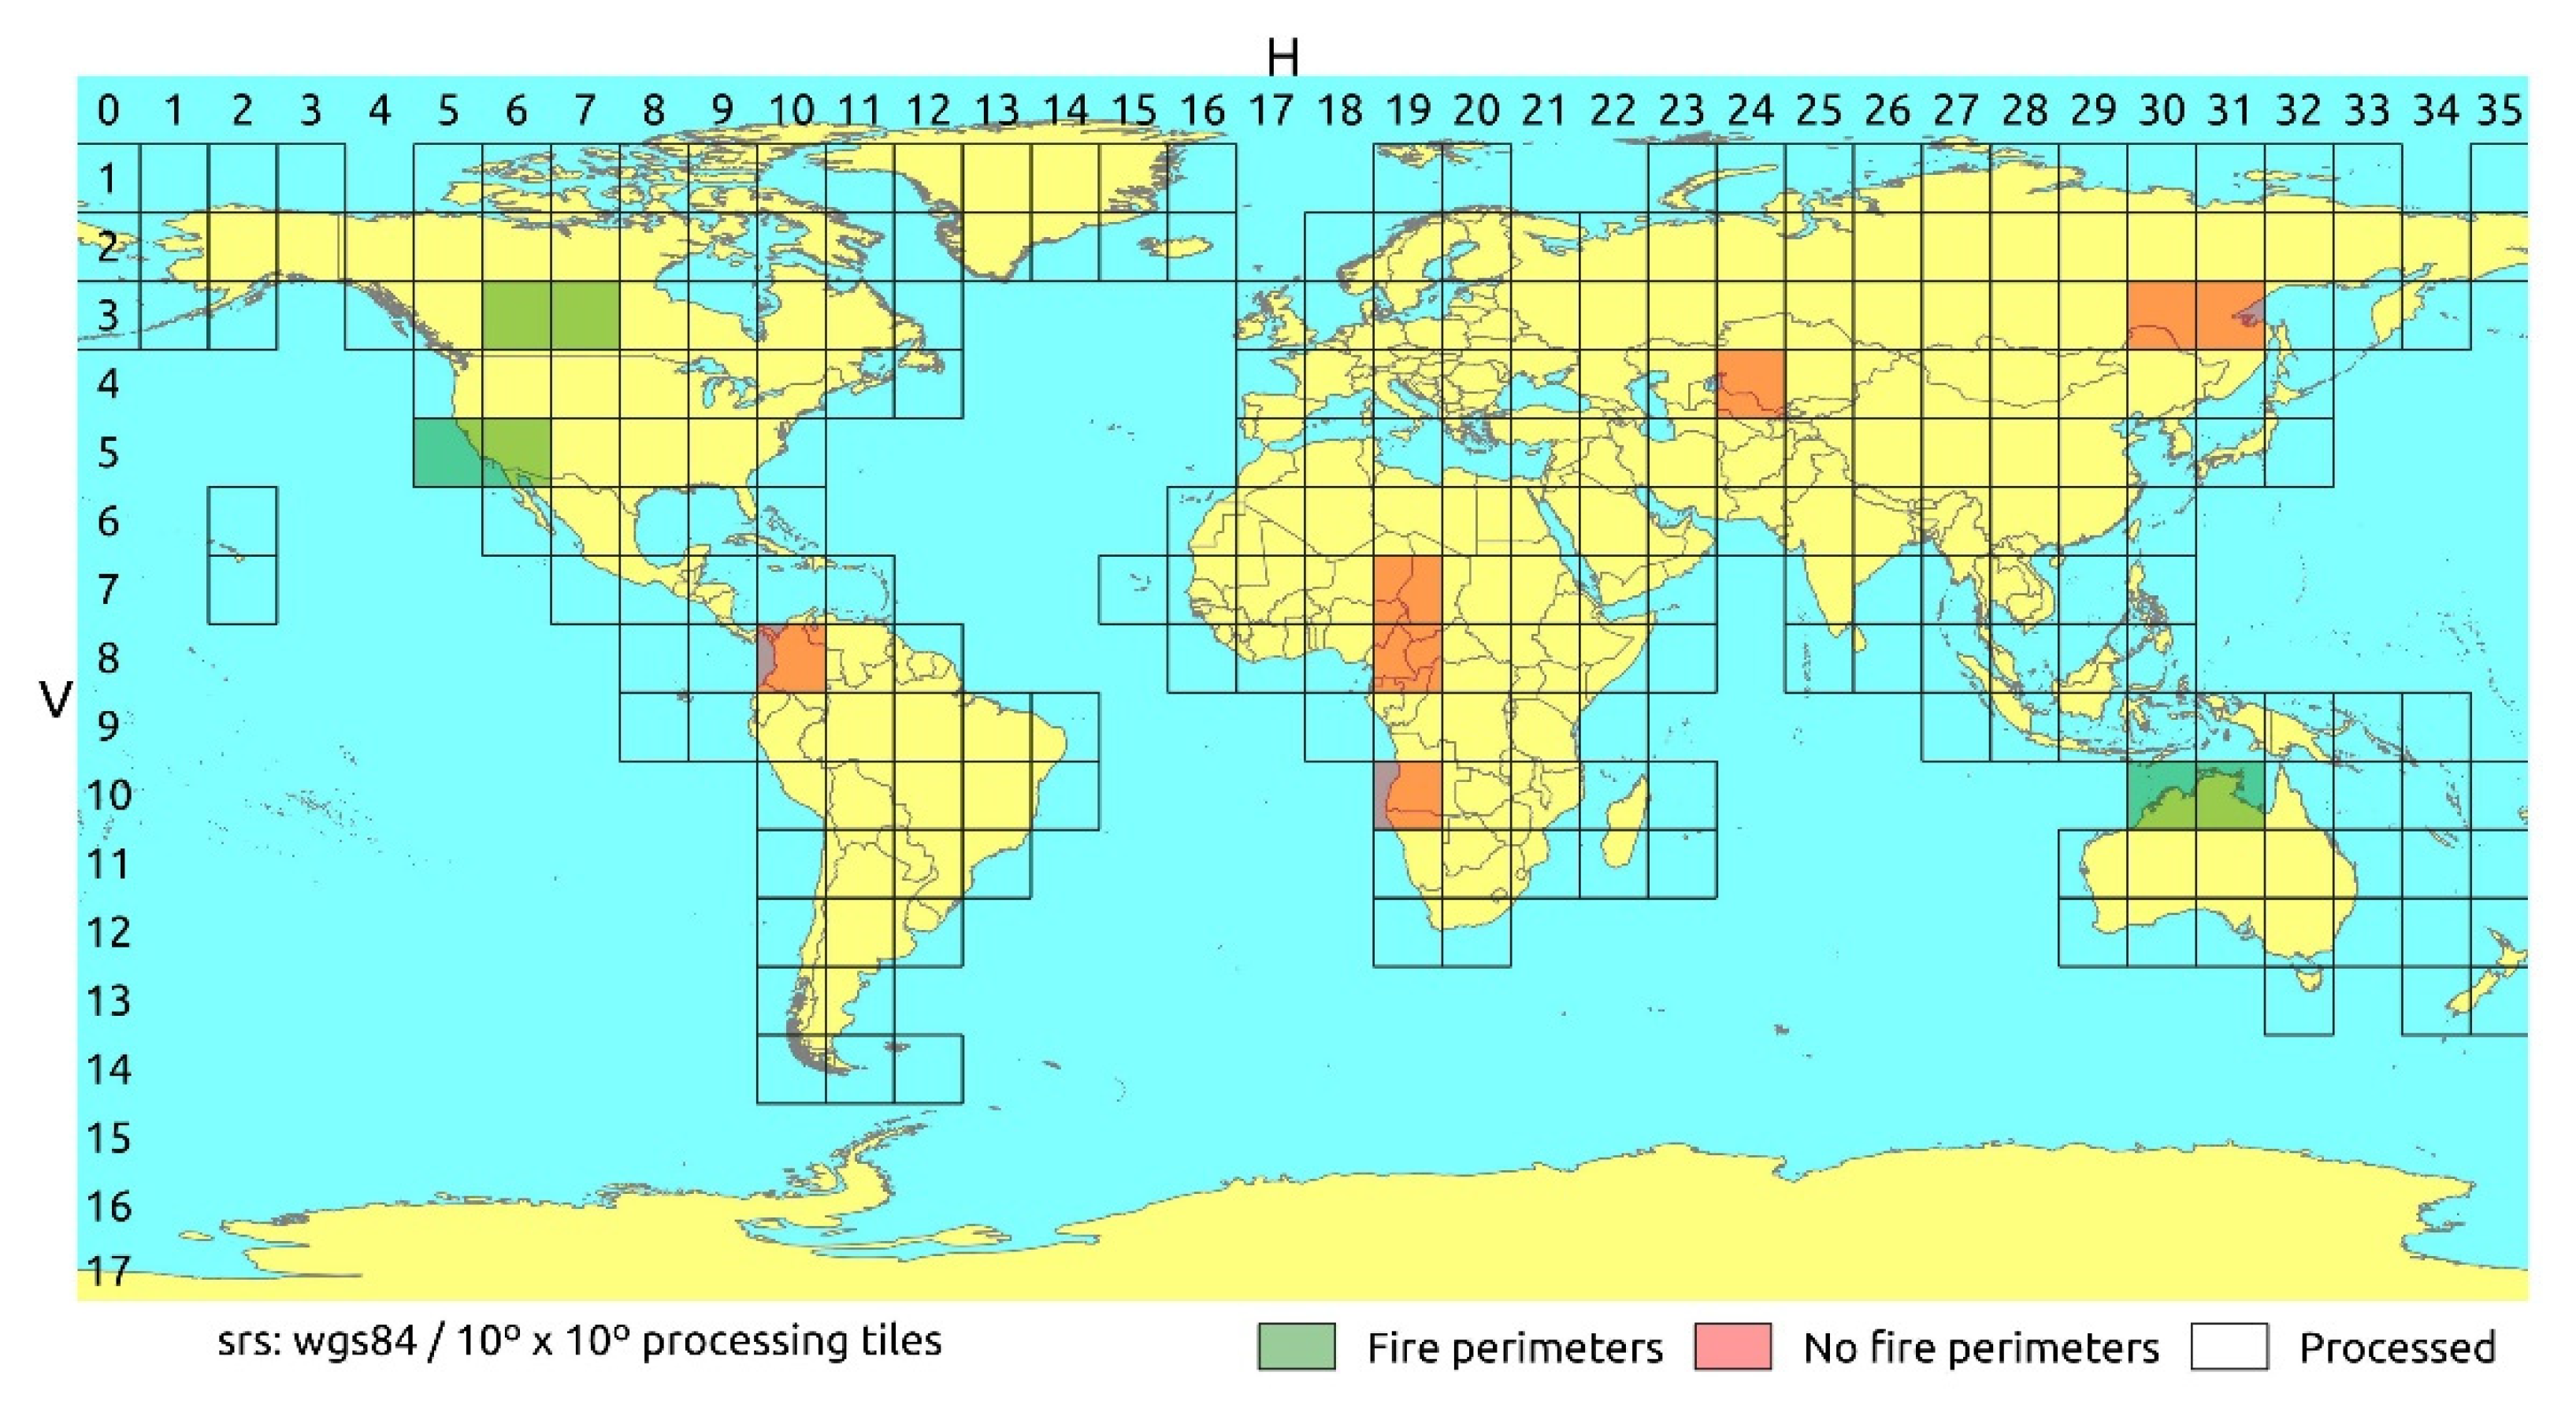
The OLCI Level 1 product (https://sentinel.esa.int/web/sentinel/user-guides/sentinel-3-olci/product-types/level-1b, accessed on 21 October 2021) was converted to surface directional reflectance (SDR) using an automated pre-processing chain that generated OLCI Level 3 SDR. The first module of the chain converted the top-of-atmosphere spectral radiance to the apparent SDR. Then, a pixel identification module calculated a set of pixel classification attributes, such as clear, cloud, snow/ice, cloud shadows, etc. The third module included an atmospheric correction algorithm, considering the absorbing and scattering effects of atmospheric gases, in particular ozone, oxygen and water vapour, of the scattering of air molecules (Rayleigh scattering) and the correction of absorption and scattering due to aerosol particles. The atmospheric correction was first developed in the GlobAlbedo project [45]. The last processing module of the pre-processing chain (compositing and mosaicking) was applied to retrieve the final Level 3 products. These 1-day SDR composites were derived from an input set of single satellite observations (i.e., SDR and pixel classification data described previously). Thus, those single observations were (i) reprojected onto a Plate Carrée grid, (ii) temporally aggregated for given binning cells (tiles), and (iii) mosaicked based on the binning cells onto a Level 3 product of 10 × 10 degrees tiles (Figure 2).
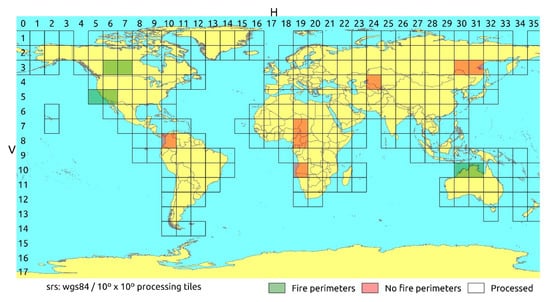
Figure 2.
The 10 × 10-degree tiles used for the processing of the OLCI global BA product. A total of 273 tiles were processed, of which 13 were used to adapt the algorithm (red and green tiles).
2.2.2. Auxiliary Data
Information on active fires was used to guide both the seed and the growing phase of the BA algorithm. The input product was the MODIS MCD14ML Collection 6, which provides global monthly information on the location of thermal anomalies using both Terra and Aqua MODIS thermal bands [46] at 1 km spatial resolution. The MCD14ML product is provided in the ASCII format, and one of its attributes specifies the presumed origin of the thermal anomaly: 0 for presumed vegetation fire, 1 for active volcano, 2 for other static land sources, and 3 for offshore thermal anomalies. Among these categories, only those anomalies labelled as 0 were considered.
Global, annual land cover (LC) maps, which were provided by the Land Cover C3S (https://cds.climate.copernicus.eu/cdsapp#!/dataset/satellite-land-cover?tab=overview, accessed on 21 October 2021), were used as well. This LC product was brokered to C3S from the CCI programme and extended for the years 2016–2019 using data at 333 m spatial resolution from PROBA-V. This satellite, which was launched in 2013, was designed to bridge the gap in vegetation remote sensing between SPOT-VGT (1998–2014) and the S3 [47]. Land cover was used by the algorithm to mask out unburnable areas, i.e., bare areas, urban areas, water bodies, and permanent snow and ice classes, to decrease the amount of data to be processed, and to report which land cover classes were burned.
2.3. C3SBA10 Product Algorithm
The adaptation of the FireCCI51 algorithm to the OLCI sensor was based on the study sites shown in Figure 2, as they encompassed a wide variety of vegetation types and fire regimes. These study sites were the thirteen equivalent 10° × 10° OLCI tiles of the MODIS standard, sinusoidal tiles used in the development of the original FireCCI51 algorithm [30]. Six of those tiles were distributed in regions where fire perimeters from different official services were available. The western coast of the United States, in California, was chosen as representative of temperate forests. Fire perimeters for this area were obtained through the Fire and Resource Assessment Program (FRAP, http://frap.fire.ca.gov/, accessed on 21 October 2021). Northern Australia was selected as representative of tropical savanna. Fire perimeters were downloaded from the Northern Australian Fire Information (NAFI, http://www.firenorth.org.au/nafi3/, accessed on 21 October 2021). Finally, as an example of the boreal forests, fire perimeters were downloaded from the Canadian National Fire Database (CNFDB, http://cwfis.cfs.nrcan.gc.ca/ha/nfdb, accessed on 21 October 2021). The remaining seven tiles were used to visually check that no major problems arose when applying the adapted algorithm to the new sensor, e.g., border effects in Central Africa, problems on the thresholds due to contrasted fire regimes within the same tile in Angola, or region-growing problems due to high BA/active fire ratios found near Kazakhstan. The adaptation of the algorithm to OLCI and its integration into the C3S system were carried out during 2018 and, hence, the training dataset’s temporal coverage was limited to 2017, when only S3A was available.
Most of the parameters that control the FireCCI51 BA algorithm were independent of the base sensor used to detect BA, such as the time-gap used to temporally aggregate active fires or the absolute thresholds that were fixed for global detection [30]. However, parameters linked to a distance might be affected by the spatial resolution of both the surface reflectance product and the active fire product. The fixed distance used to spatially aggregate active fires into the same cluster (Section 2.1), for example, might depend on the spatial resolution of the input active fire product. Higher-spatial resolution thermal bands can lead to higher densities of active fire pixels within the same burned patch [48,49], and therefore, the distance that is needed to spatially aggregate them could be smaller. In this case, there was no difference between the input active fire product used in the development of the original algorithm and the adapted one (Section 2.2.2). Similarly, the distances used to define the unburned region around active fire clusters (Section 2.1) depend on both the spatial resolution of the input surface reflectance and the density of active fires per burned patch. The spatial resolution of the base sensor directly affects the number of surface reflectance pixels that fall into the unburned strip, and hence could be used to estimate the thresholds. The same distance could imply the selection of much more pixels when the spatial resolution of the input sensor was high, while coarser resolutions could lead to a number of pixels that may be insufficient. The spatial resolutions of the input sensors used in the original algorithm (250 m) and the adapted one (300 m) were considered sufficiently similar to retain the parameters that defined the unburned strip.
Since the FireCCI51 BA algorithm worked with a single NIR band of the MODIS sensor (841–876 nm), the first step for adapting the algorithm was to find the most suitable OLCI band (Table 1). Based on a sensitivity analysis of the MERIS bands carried out by [50] during the development of the first global BA dataset of the FireCCI project (FireCCI41 [44]), two NIR bands were considered candidates to be the input of the adapted BA algorithm: Oa12 centred at 753.75 nm and Oa17 centred at 865 nm (Table 1). These spectral bands were the most sensitive for BA detection, although no significant differences were found between them [50]. Therefore, the adapted BA algorithm was run twice (one per band) using the training dataset to verify the performance of both bands. The assessment against the services’ fire perimeters showed slightly higher accuracy measures of the 865 nm band over the 753.75 nm one (same commission error and ~1% lower omission error). None of the bands showed unexpected anomalies in the rest of the tiles. Taking into account these results, we finally selected the 865 ± 10 nm OLCI band, which also had maximum spectral similarity with the MODIS band used for the FireCCI51 algorithm.
2.4. Uncertainty Characterisation
Uncertainty characterisation is increasingly being demanded by the end-users of BA products, since it helps in the parameterisation of climate models [29]. Although important advances have been made in the last years regarding the uncertainty characterisation of ECVs [51,52,53], methods to standardise the generation of this variable are still needed [22]. Therefore, the CS3BA10 algorithm follows the same approach used in the FireCCI51 product. Four input variables related to different phases of the original algorithm were used to compute the estimation of BA detection uncertainty (pb): monthly NIR composite (NIR), monthly relative NIR drop (RelΔNIR), number of valid observations in the first 10 post-fire days (obs) and the distance to the nearest seed-pixel (dist). The uncertainty was computed using a logistic regression. Based on those four variables and the results from 2008 of the study sites that were used to develop the original algorithm, the final coefficients of the regression were obtained.
In the case of the adapted C3SBA10 algorithm, the coefficients of the logistic regression were updated (Equation (1)) using the four input variables and results of the training dataset described in Section 2.3:
2.5. Product Generation
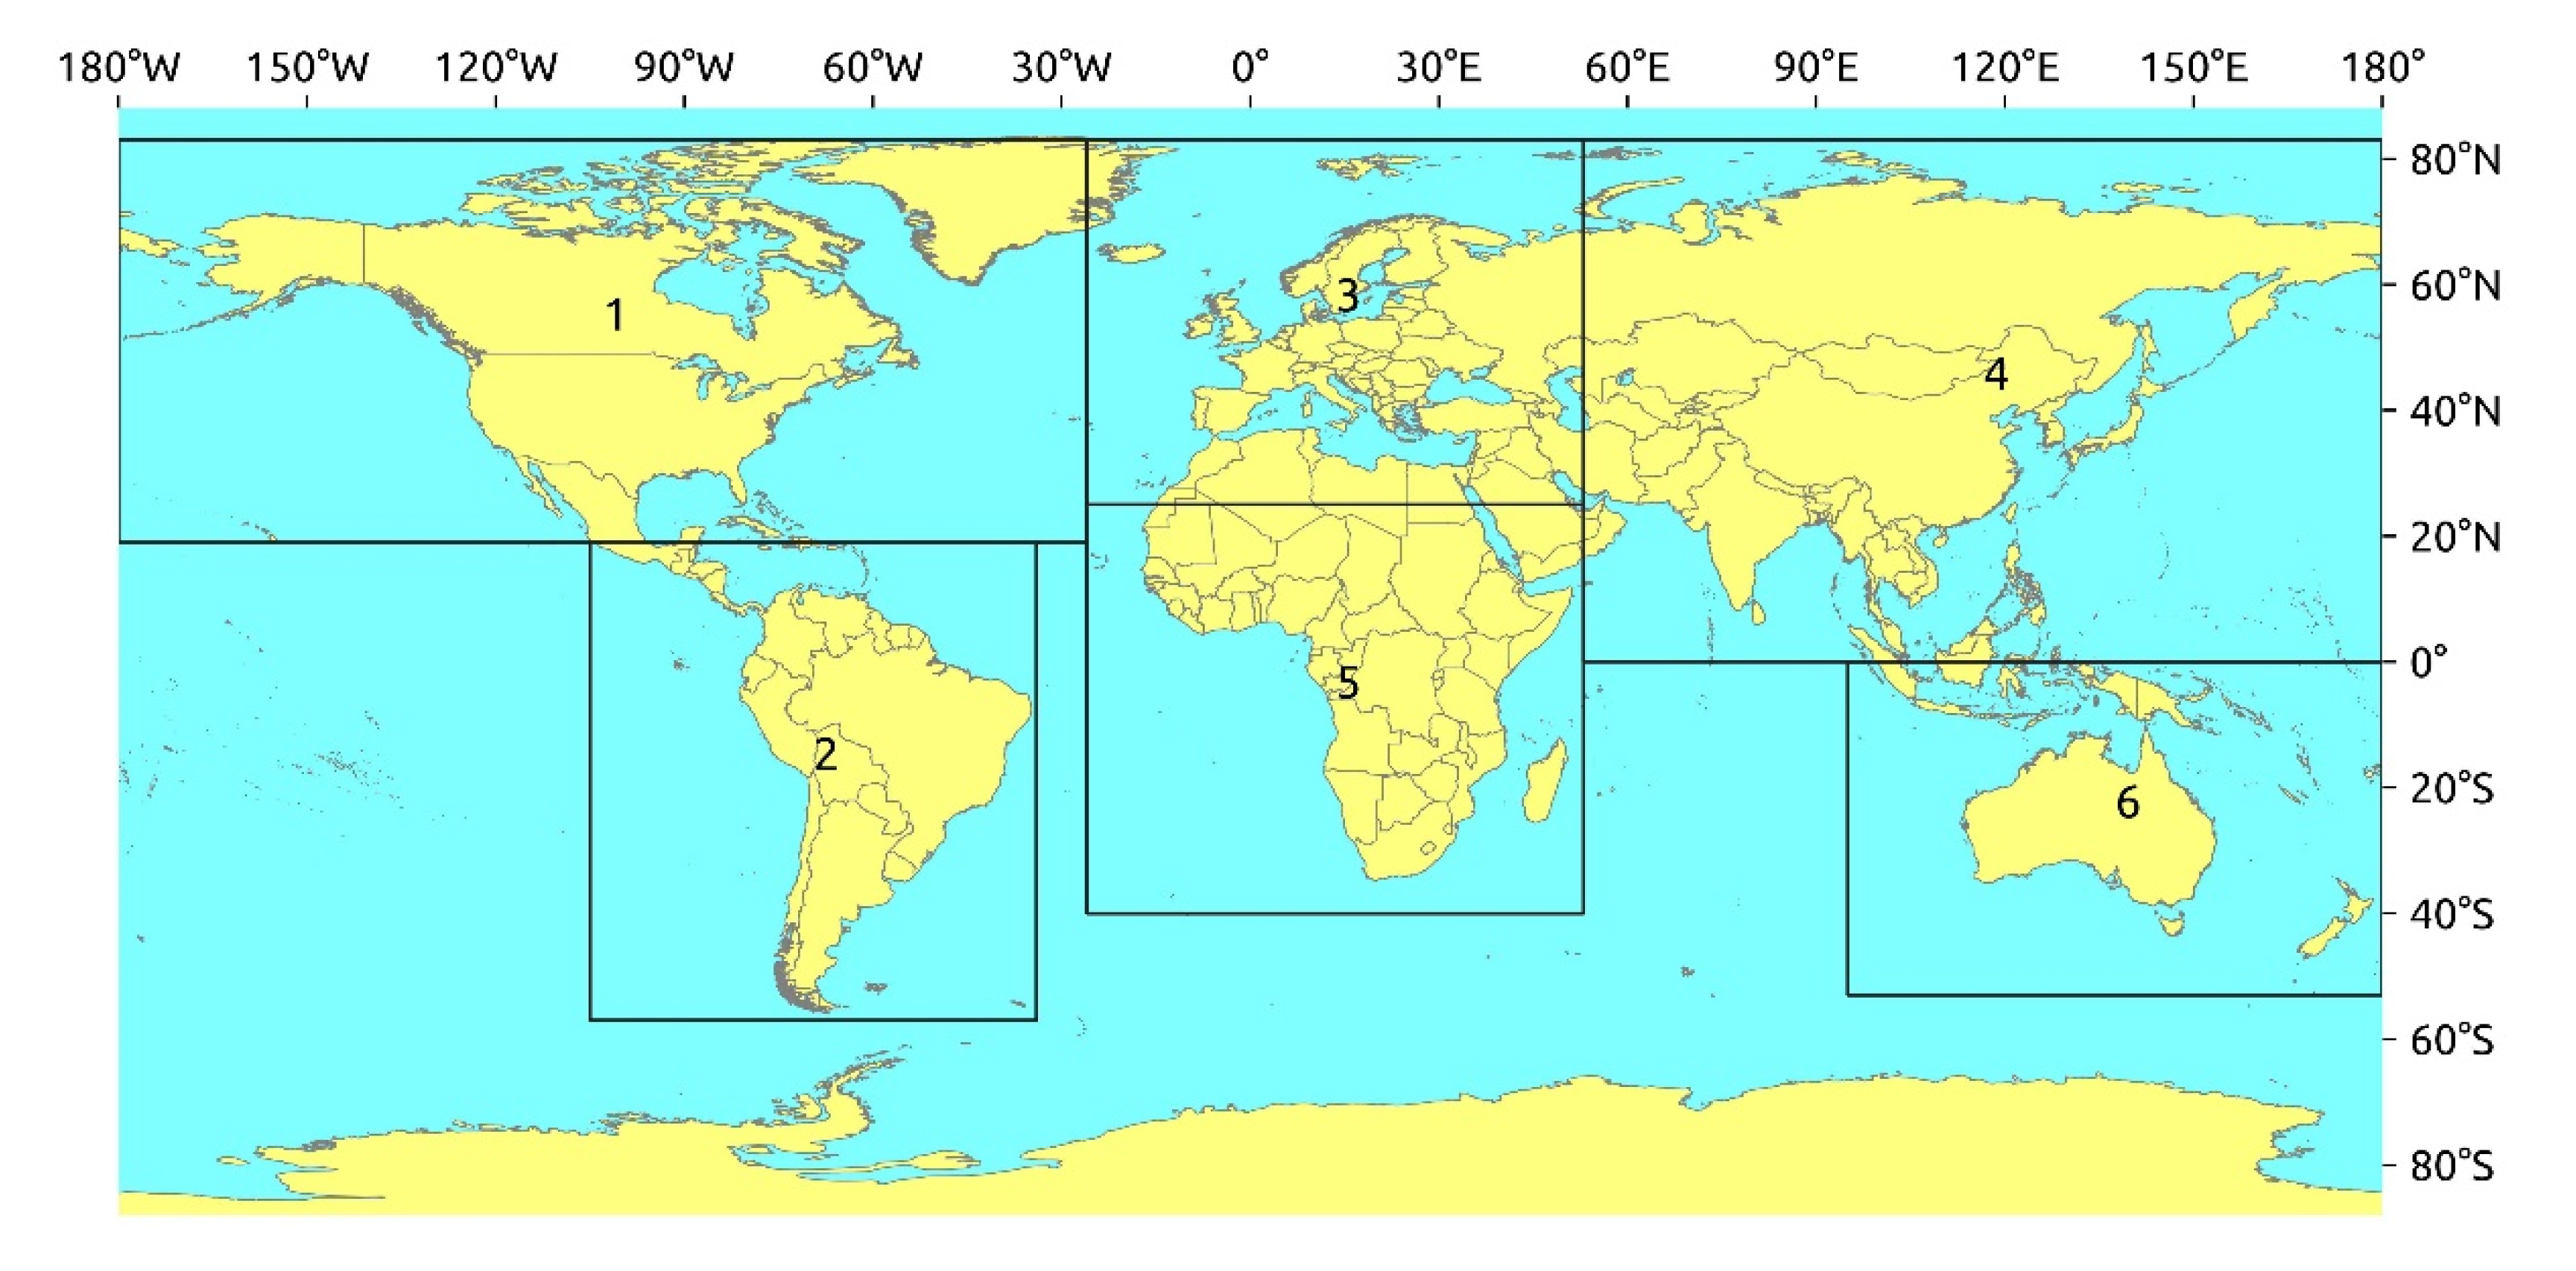
The adapted algorithm was processed on a monthly basis for each 10° × 10° tile, and hence the raw outputs were provided per month and tile. The pre-processing and BA processing steps took advantage of the independence of tiles, and were produced in parallel for multiple tiles. The raw outputs were formatted, mainly following the specifications of the FireCCI project [54], to obtain the pixel and grid products that were delivered to the final users in the NetCDF4 format. The pixel products include the date of the detected burned pixel at the original spatial resolution (300 m) distributed in six continental tiles (Figure 3), plus the uncertainty and land cover of those pixels. The grid products include aggregated BA at 0.25° spatial resolution, burned land cover, uncertainty, fraction of burnable area, and fraction of observed area (Table 2).
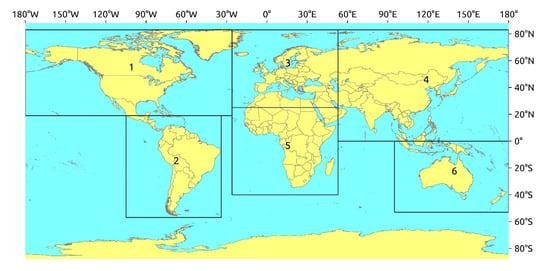
Figure 3.
Continental tiles of the global BA pixel product.

Table 2.
Pixel and grid products’ specifications.
The processing was run on 273 tiles that encompass the main burnable areas of the Earth, as determined by the input land cover data. The C3SBA10 extended the spatial coverage provided by the FireCCI51 dataset, including northern latitudes between 70° and 80° of North America and Greenland, since rare fire events were observed in recent years in these regions [55,56]. This change affected the original bounding box of Area 1 of the pixel product defined by [54] within the FireCCI, whose eastern border was extended from 50° W to 26° W in C3SBA10 (Figure 3).
The C3SBA10 dataset has been regularly processed since January 2017, ensuring up to three years of overlap (2017–2019) with FireCCI51.
2.6. Intercomparison between FireCCI51 and C3SBA10
Consistency between products is of prime interest for long-term analyses, which is a critical component of climate modelling [22,29]. From this perspective, since C3SBA10 was conceived as a continuation of FireCCI51, several analyses were performed to assess the similarities and differences between both datasets. This agreement may be influenced either by the differences between the main input reflectance datasets used by each of them (865 ± 10 nm for C3SBA10 and 858.5 ± 17.5 nm for FireCCI51), by the changes in the spatial resolution (300 m for C3SBA10 and 250 m for FireCCI51), or by the atmospheric and geometric correction processes applied to both sensors (OLCI for C3SBA10 and MODIS for FireCCI51).
A fundamental step when comparing spatial and temporal trends of global BA datasets is the definition of the grid size to aggregate the BA information. Although different spatial and temporal comparison units have been previously used [57,58,59,60], we were guided by previous intercomparison efforts performed by the climate community. Within this scope, one notable example is the “fire model intercomparison project” (FireMIP), which systematically compared different fire-enabled DGVMs using global monthly BA data aggregated at the 0.5° resolution [27]. Statistical analyses that target the identification of factors that control fire patterns at global and regional scales commonly require monthly BA data aggregated at 0.25° or coarser spatial resolutions [5,26,61,62]. However, several global fire emission databases are available at 0.1° (e.g., [63] updated) and even at 0.05° (e.g., [64]) following the increasing spatial resolution of some global atmospheric chemistry models [65,66]. Thus, it was decided to aggregate BA information into four different geographic grid cell sizes, i.e., 0.05°, 0.1°, 0.25°, and 0.5°, on a monthly and annual basis. Since both FireCCI51 and C3SBA10 are distributed on geographic projection, the effect of the latitude on pixel size was corrected using a cosine weighting factor (earth radius = 6,378,137.0 m) when aggregating the BA.
The results were also aggregated spatially into eight biomes, following the same classification of the validation exercise. Four comparison cases were identified: biome-specific monthly BA, biome-specific annual BA, global monthly BA and global annual BA. In total, 1404 scatterplots (3 years × (12 monthly + 1 annual) × (eight biomes + 1 global) × 4 spatial resolutions) were generated based on these comparison cases and the four comparison grids defined above for the analysed years (2017–2019). Three metrics were used to determine the agreement of the products for a given case. A total least squares (TLS) regression was calculated for each scatter plot to obtain the slope and bias between products. TLS was selected, since it does not assume the dependency of the variables [59]. In addition, Pearson’s correlation and the root mean square error (RMSE) were used to estimate the agreement between the products [60].
2.7. Validation
2.7.1. Spatial Assessment
A spatial accuracy assessment was conducted for the period 2017–2019 for both the FireCCI51 and C3SBA10 products. An independent reference BA dataset derived from Landsat-8 OLI imagery was produced in compliance with the CEOS LPVS stage 3 validation requirements [67], which implies a rigorous statistical selection of reference sites representing diverse global conditions. Hence, for each calendar year, 100 sample units were randomly selected using a stratified random sampling design. The sampling units were spatially defined by the Thiessen scene areas (TSAs) constructed by [68] and [69] from the Landsat-frames World Reference System 2 (WRS-2). TSAs enable the partition of the Earth’s surface into non-overlapping spatial units, allowing the computation of unbiased estimators [70].
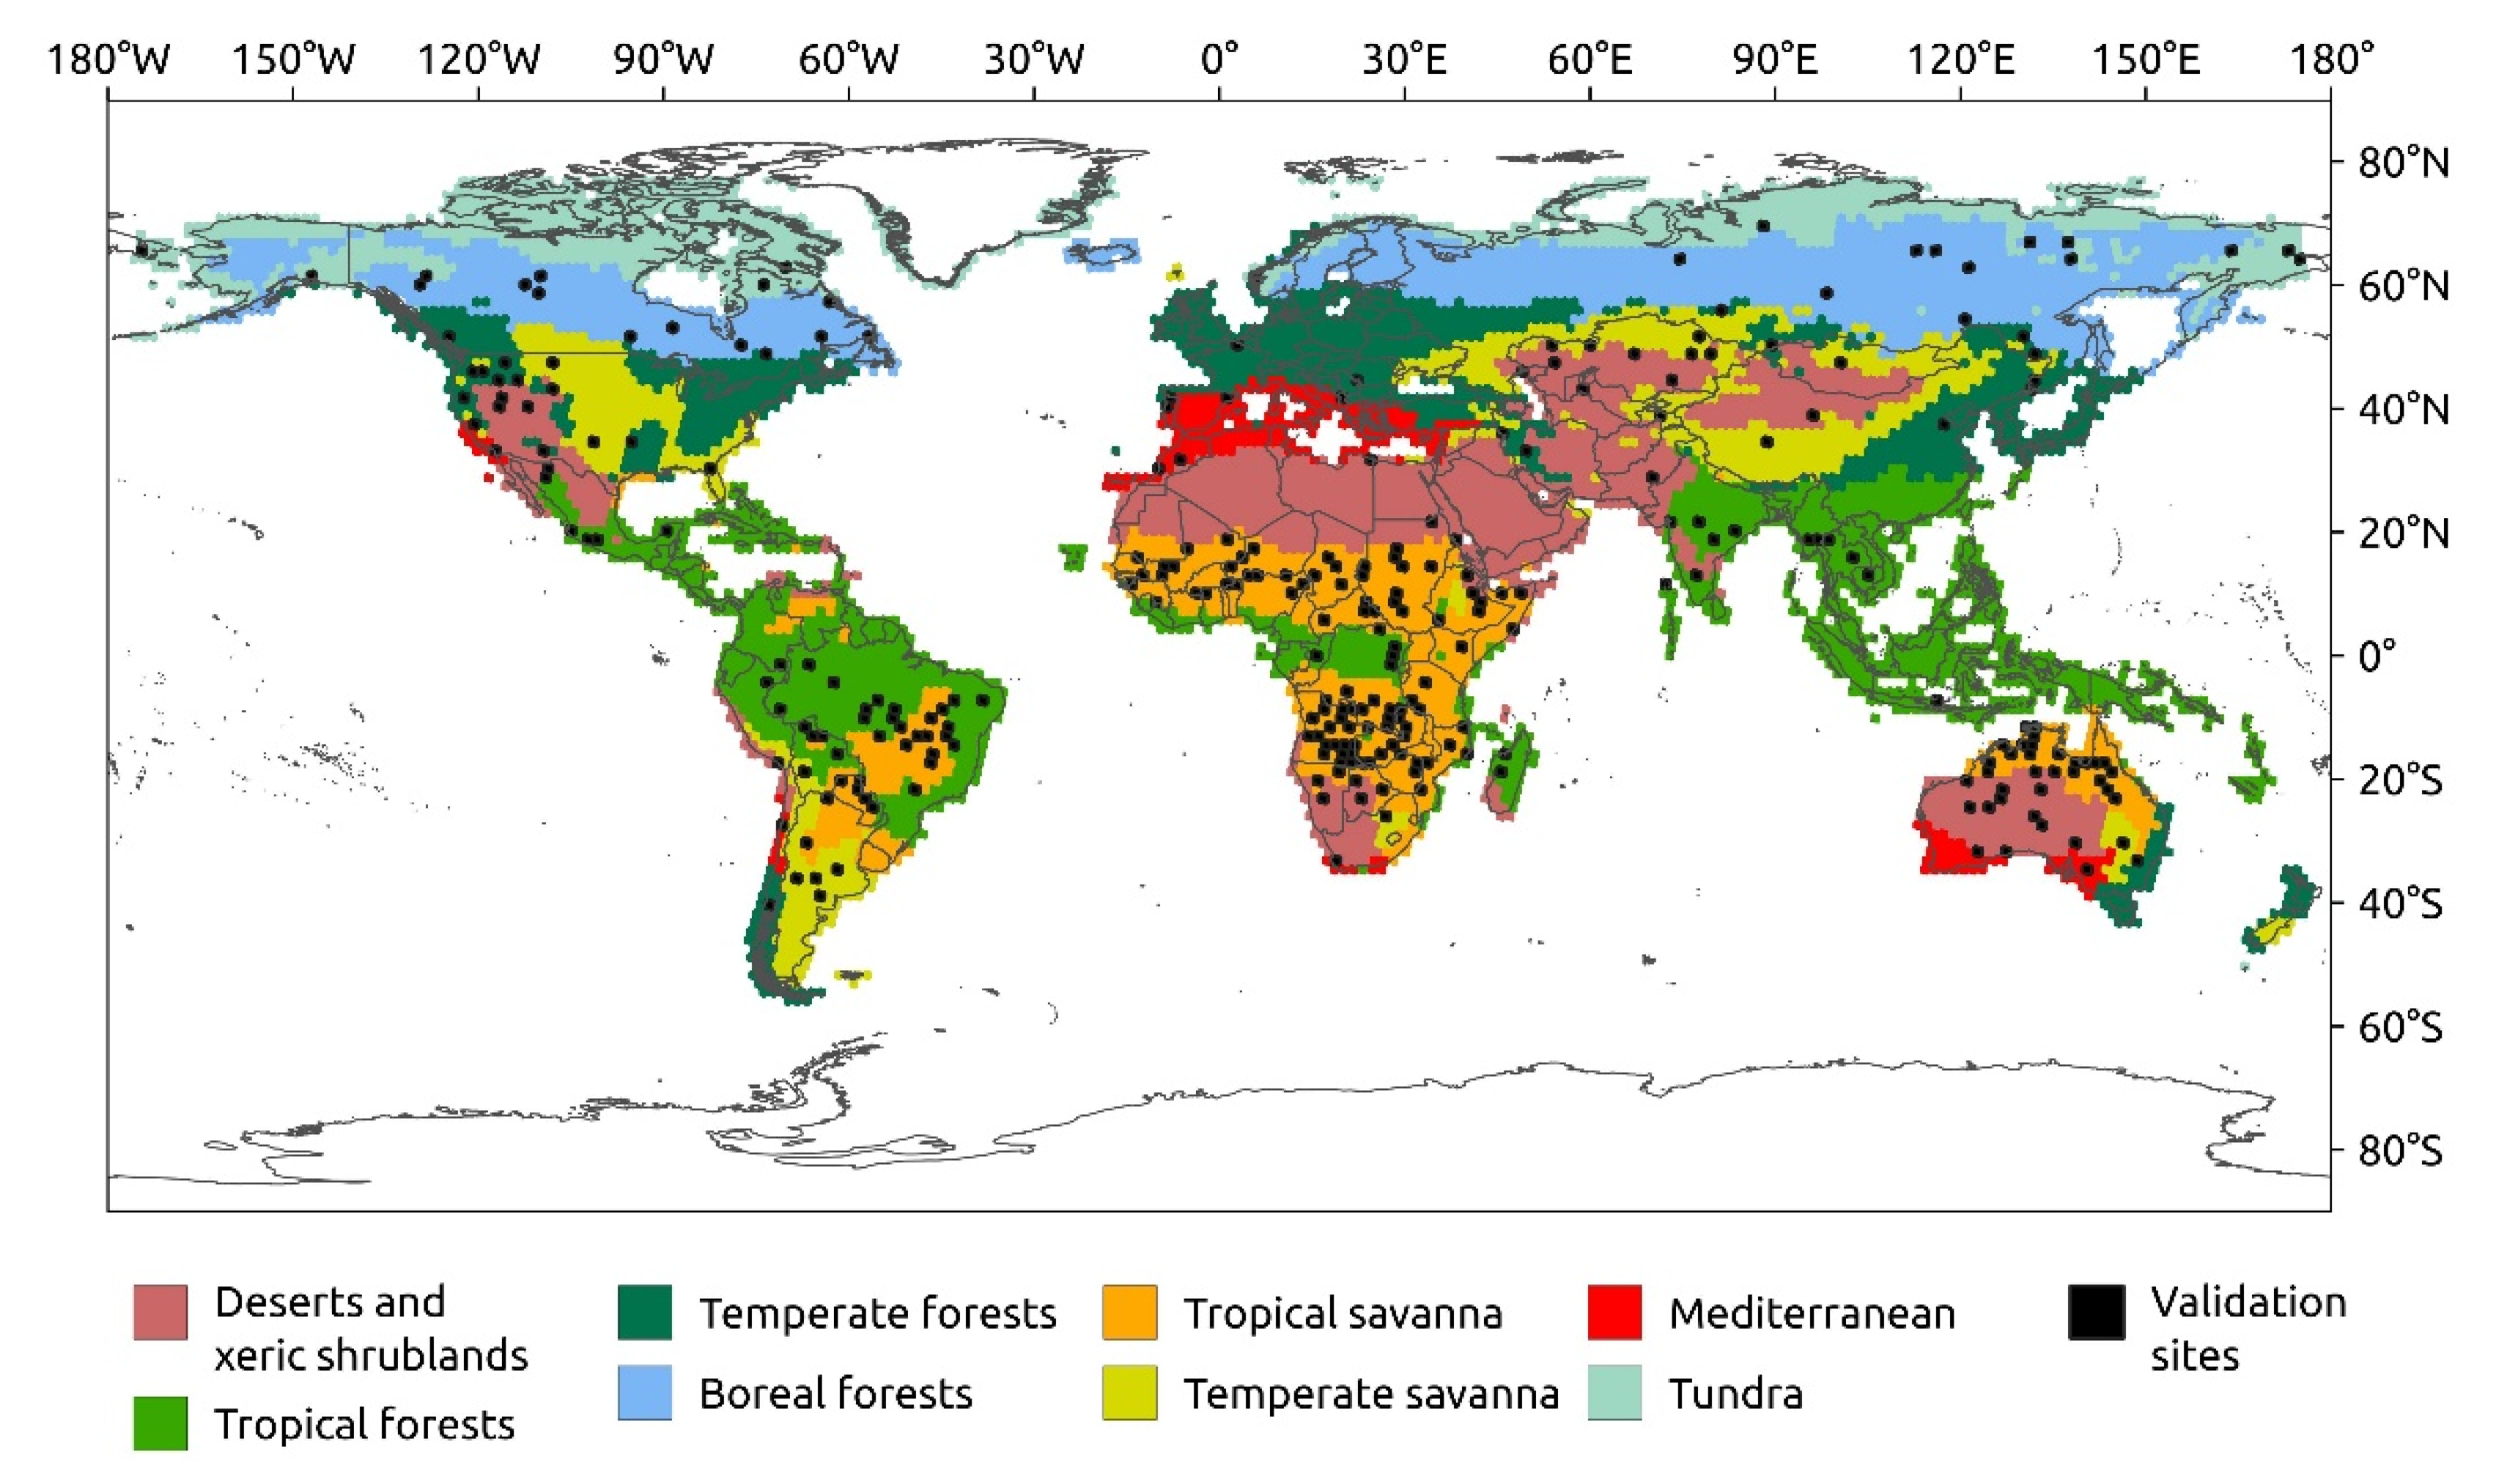
To ensure that sampled units were distributed across the main biogeographic regions, a first level of stratification was applied based on the biomes defined by the ecoregions 2017 map [71]. The original 14 biomes were aggregated into 8 major biomes: boreal forests, deserts and xeric shrublands, Mediterranean, temperate forests, temperate savanna, tropical forests, tropical savanna, and tundra (Figure 4). A second level of stratification was applied based on the FireCCI51 BA extent for each calendar year. Thus, each TSA within each biome and year was assigned to a high or low BA stratum following the approach of [72]. Then, the sample’s allocation within the 16 resulting strata (8 biomes × 2 high-low strata) was established proportionally to , where is the number of units in stratum h and is the mean mapped BA for stratum h [73].
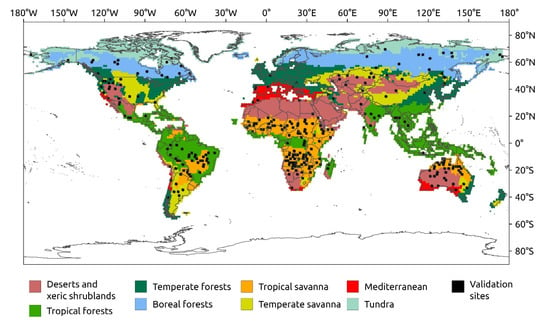
Figure 4.
Biomes representing the first stratum of validation sampling. The black locations show the 300 validation sites that were selected for 2017, 2018, and 2019 (100 for each year).
The reference data for the selected sites were obtained from pairs of Landsat-8 images using a semi-automatic classification algorithm [74], followed by a visual inspection to confirm the correct identification of burned patches. Consecutive pairs of images were used to obtain long temporal reference data, covering several months, the entire fire season or the whole year, depending on image availability. These long temporal reference data allow for an extended temporal overlap between reference and BA datasets, which makes it possible to improve the spatial accuracy assessment of the BA products, minimising the impact of the product’s temporal reporting accuracy in the spatial accuracy estimates. Further details on the validation methods can be found in [75].
Accuracy metrics were computed based on the error matrix, which is widely used by the scientific community for thematic accuracy assessment [76,77]. This matrix was derived from the cross tabulation of reference data and the BA products. The metrics used to assess the product accuracy were the Dice coefficient (DC) [78], the relative bias (relB) and the commission (Ce) and omission (Oe) errors. DC measures the similarity between the two sets of data: the higher its value, the more accurate the burned category. relB informs about the bias of the BA product relative to the reference BA: a negative relB means that the BA product underestimates the BA compared to the reference data, while a positive relB shows an overestimation. Ce refers to the burned area mapped by the BA product but not classified as burned in the reference data, while Oe indicates the burned area in the reference data not mapped in the BA product. All the accuracy metrics and their associated standard errors were estimated for the whole population, applying the formulas described in [72,79].
2.7.2. Temporal Reporting Accuracy Assessment
A validation of the temporal reporting accuracy of the products was also performed, aiming to measure how accurately the day-of-burn (JD in Table 2) was determined by the BA product. A common approach is to use as reference the day-of-detection reported by the active fires and compare with the day-of-detection reported by the corresponding pixel of the target BA product [80,81]. However, this approach assumes independence between the active fires and the burned area product. Therefore, since both the C3SBA10 and FireCCI51 products use MODIS active fires, the temporal reporting accuracy assessment was carried out based on the active fires detected at the 375 m spatial resolution by the VIIRS sensor on board Suomi-NPP satellite (VNP14IMGML C1 thermal anomalies product [82]). Similar to the MODIS thermal anomalies (MCD14ML) dataset, the product includes the location of the anomalies and a field to select the presumed vegetation fires. The temporal reporting accuracy assessment was computed both globally and by biome.
2.8. Analysis of the Impact of the Temporal Resolution in Burned Area
Since the C3SBA10 product was derived from two different satellite combinations (S3A for 2017 and 2018, and S3A and B for 2019, it was convenient to test the impact of different image availability conditions on the product’s accuracy and consistency. To do this, the results for 2019 of the BA algorithms were compared using as inputs only S3A or both S3A and B. The 13 calibration tiles described in Section 2.3 were used for this comparison. For this analysis, an additional sample of 43 Landsat TSAs was processed to obtain reference fire perimeters to check the accuracy of the resulting products. Those perimeters were obtained following the same methods as those used for the global validation, but in this case only covering the calibration sites.
3. Results
3.1. Intercomparison between FireCCI51 and C3SBA10
3.1.1. Summary of the Annual Burned Area
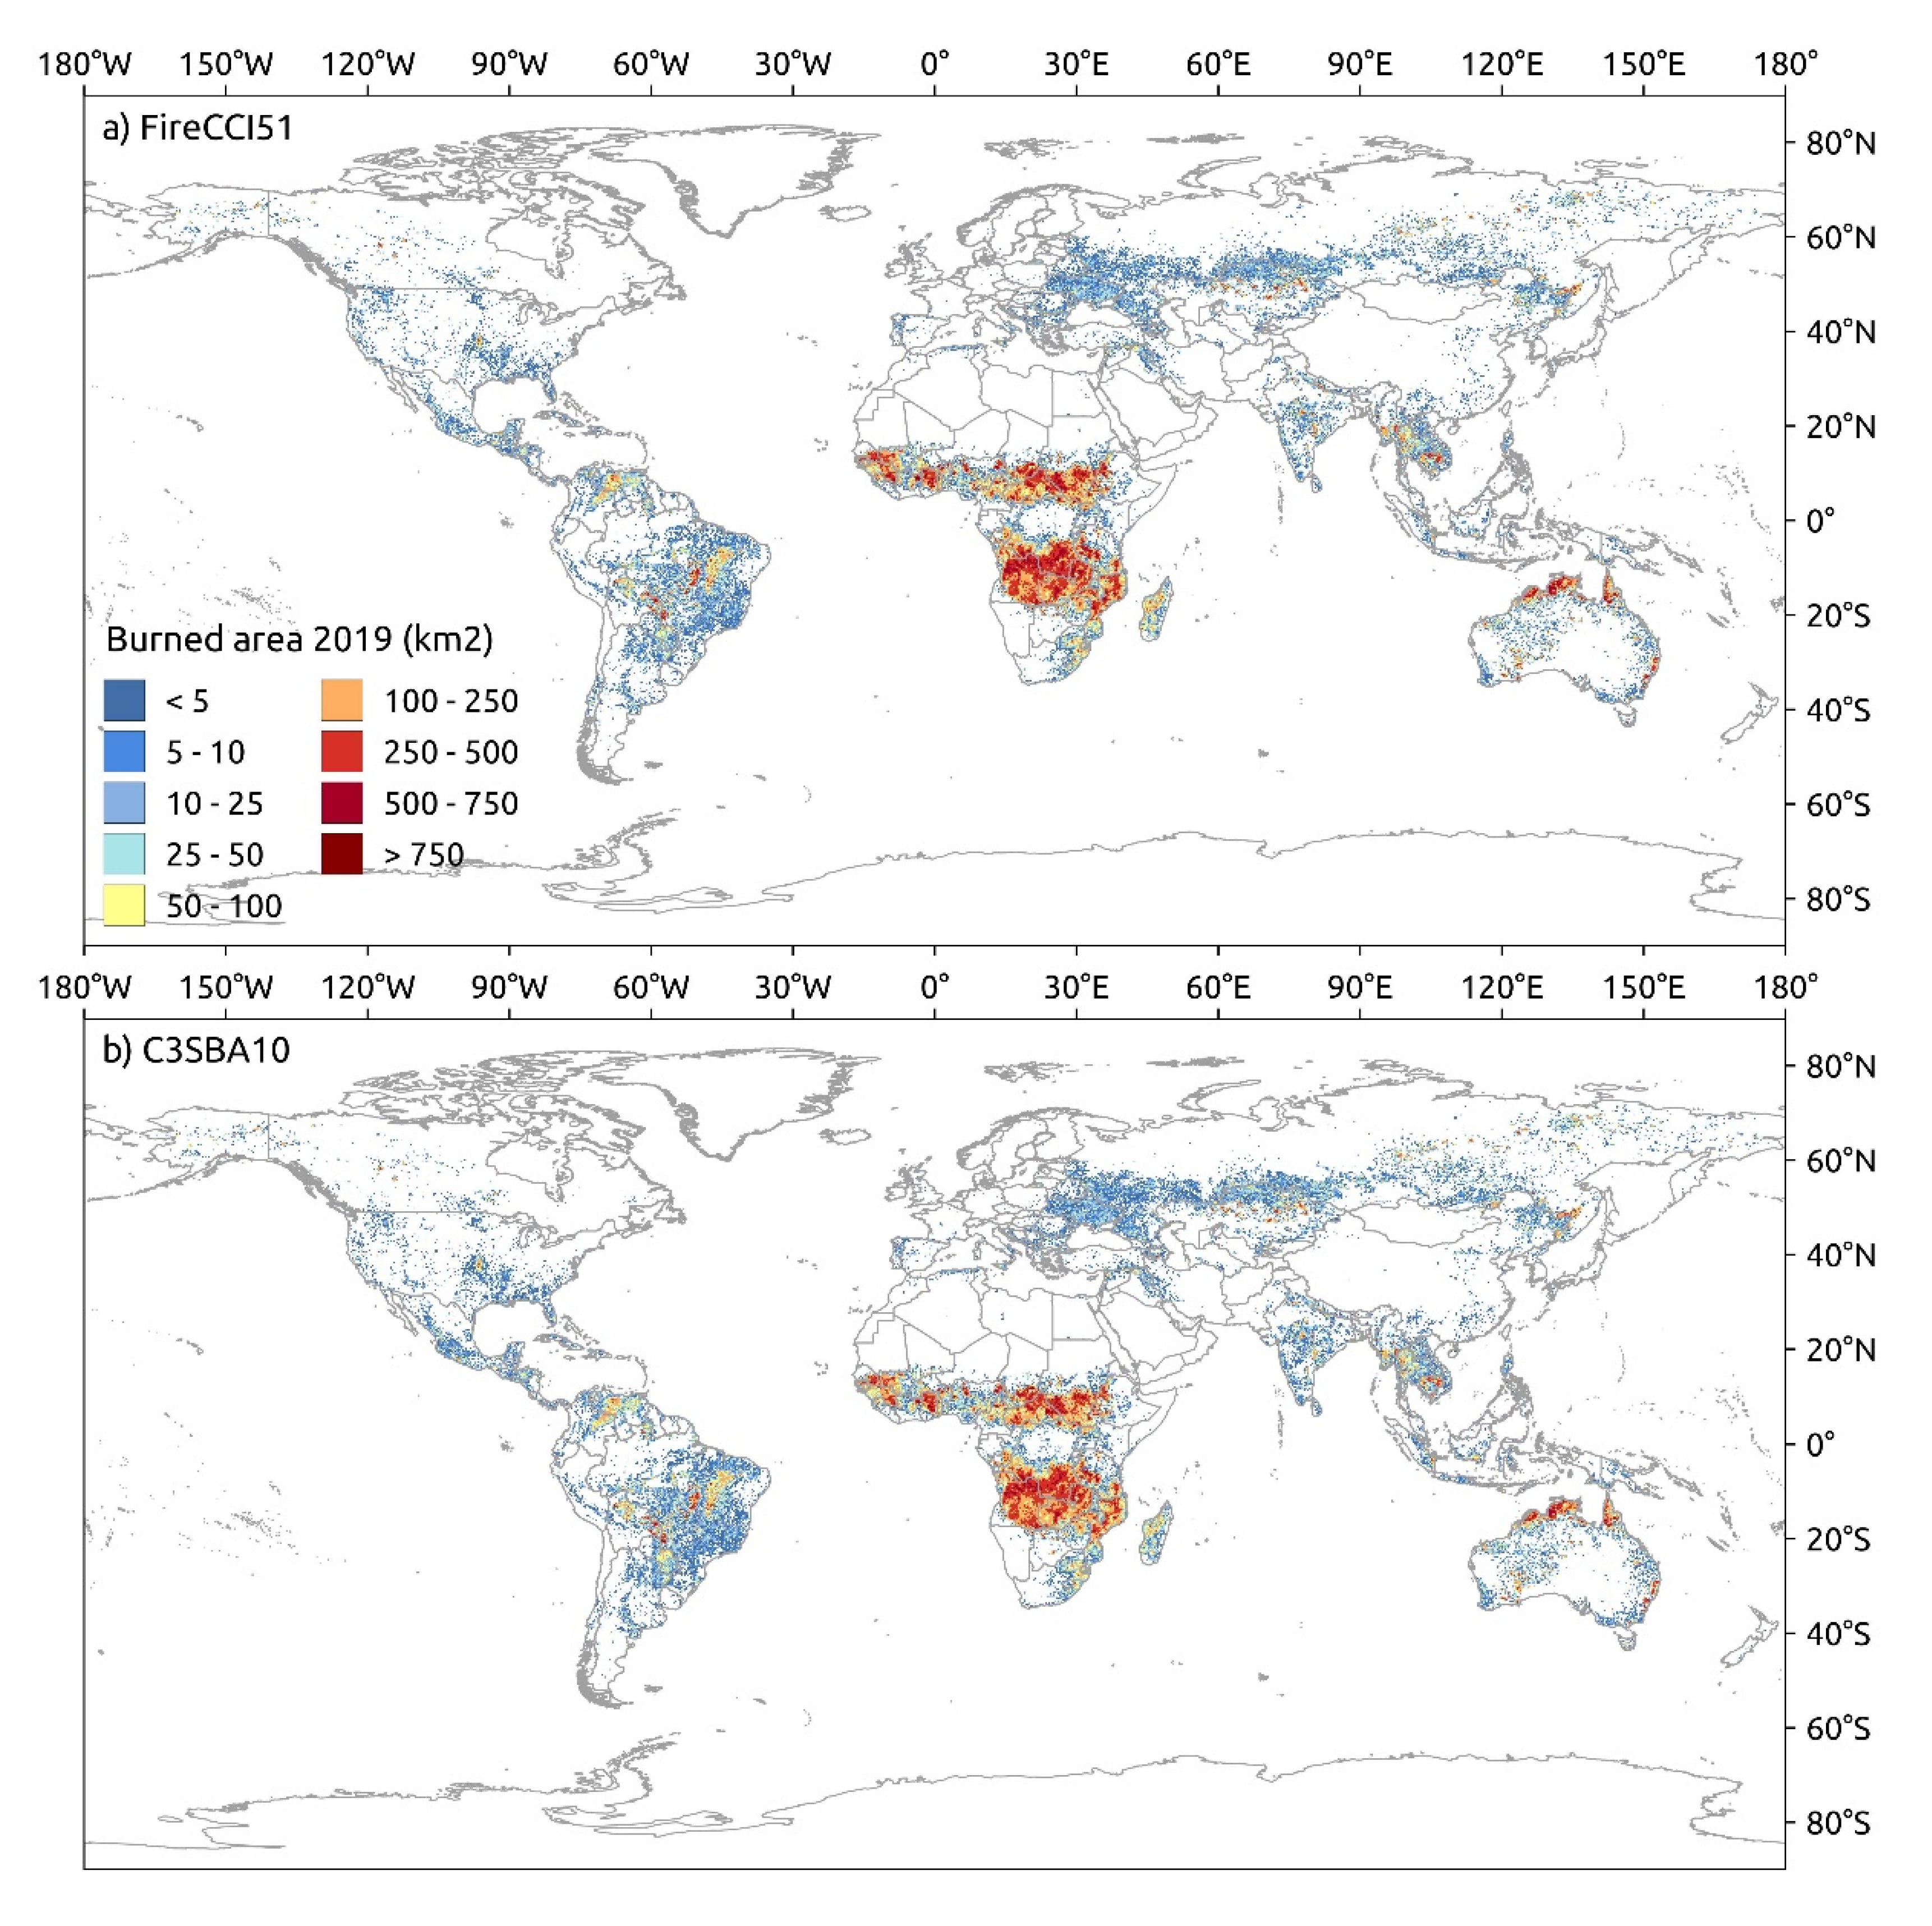
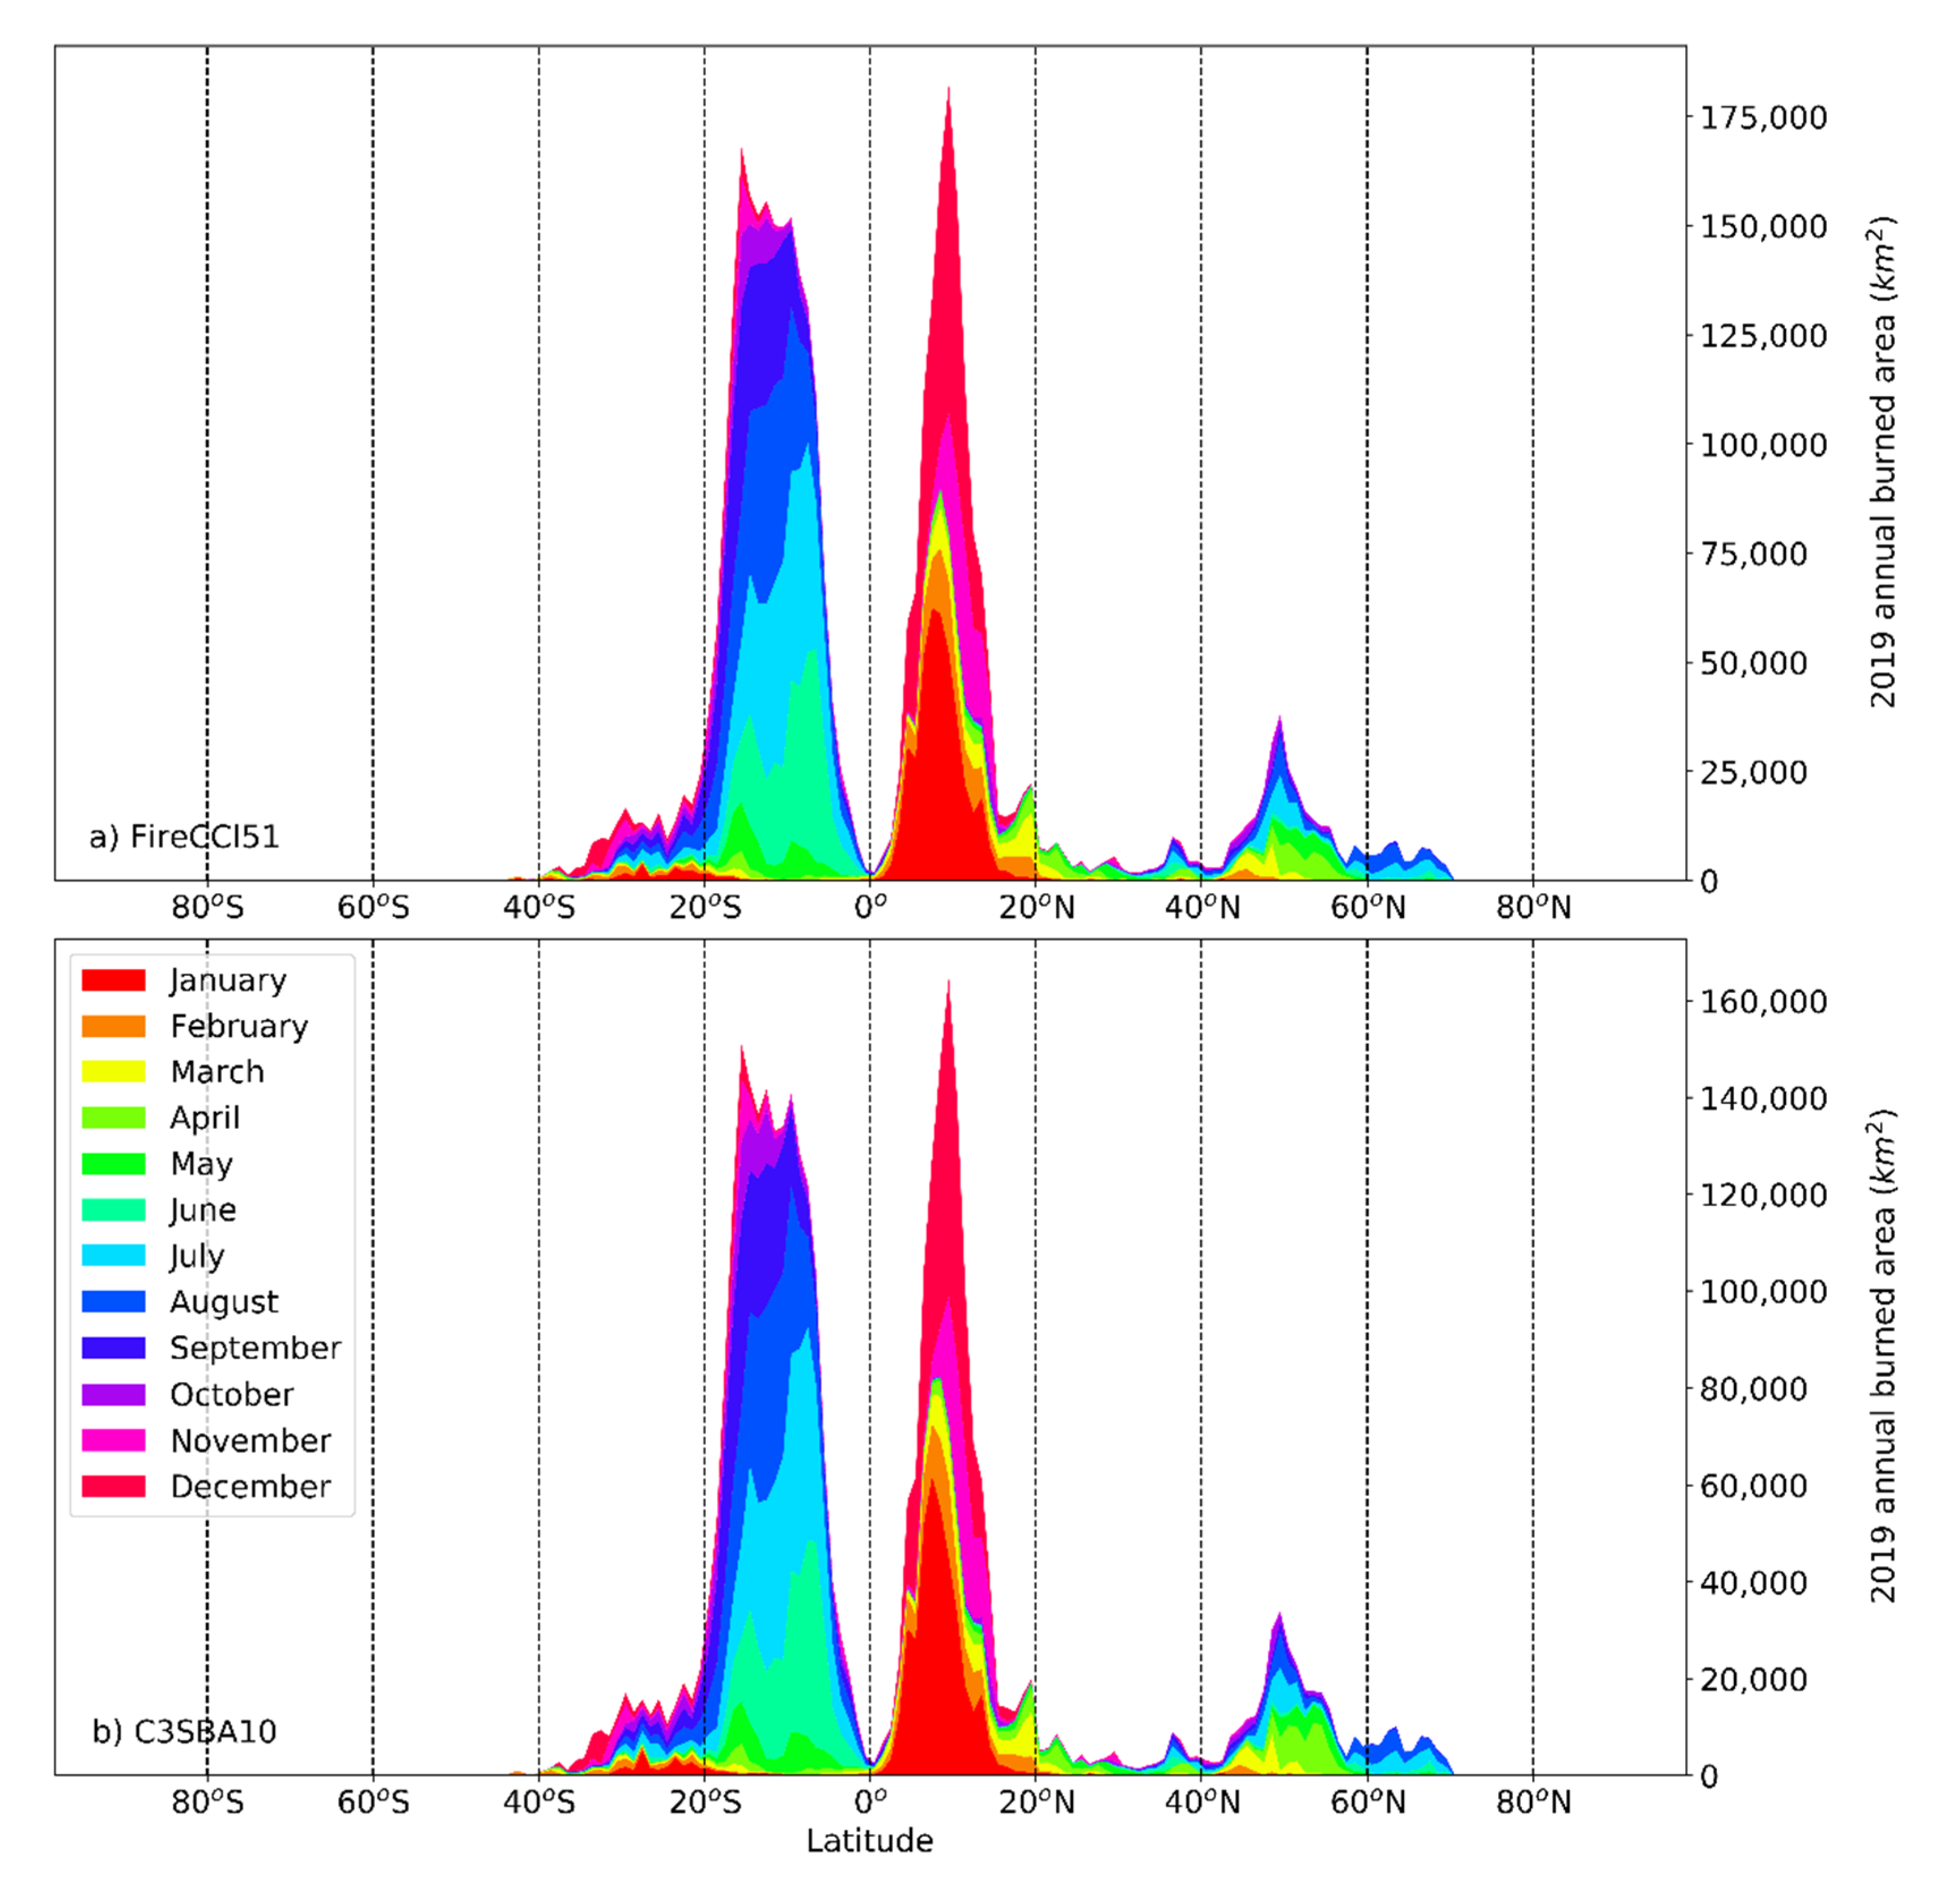
Figure 5 shows the annual accumulated BA at 0.25° for both FireCCI51 (a) and C3SBA10 (b) in the year 2019, and Figure 6 shows the latitudinal and seasonal contribution of BA for the year 2019. The amount of BA detected per biome for the three complete natural years can be found in Table 3.
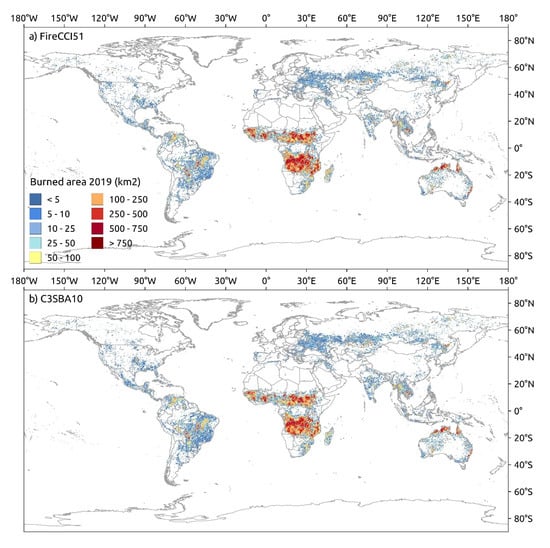
Figure 5.
FireCCI51 (a) and C3SBA10 (b) annual accumulated BA for the year 2019 at 0.25° spatial resolution.
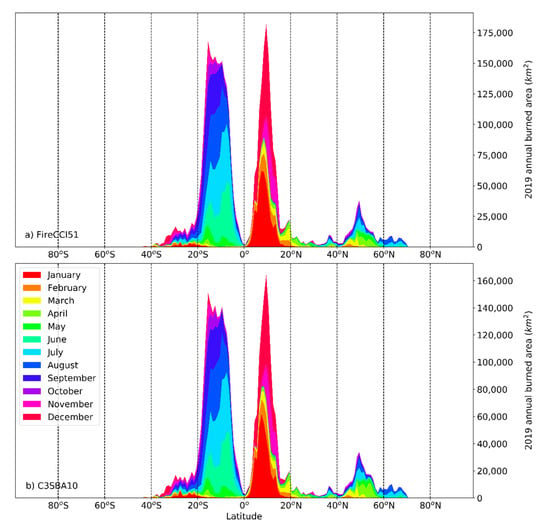
Figure 6.
Monthly burned area for 2019 distributed along latitudes determined by FireCCI51 (a) and C3SBA10 (b).

Table 3.
Burned area per biome derived from the C3SBA10 product, and relative differences against the predecessor global BA product FireCCI51.
The C3SBA10 product detected 3.77 × 10⁶, 3.68 × 10⁶, and 3.59 × 10⁶ km2 of BA for the years 2017, 2018 and 2019, respectively (Table 3). The FireCCI51 estimated more BA in all years, with proportions ranging from 7.8% in 2019 to 17.3% in 2017. The main contributor to global BA in both products was the tropical savanna, representing between 74 and 78% of global burns. Therefore, most global BA was located on a relatively small latitudinal band between 20° N and 20° S (Figure 5 and Figure 6) that covers part of South America, Central America, Africa, South East Asia, Indonesia and the northern part of Australia. Among these tropical regions, several studies have shown that the African savannas are responsible for around 70% of global BA, followed by the Australian ones, and the Brazilian Cerrado and the Orinoquia region in Colombia and Venezuela [9,83,84,85,86]. Almost all the disparities between the products in terms of total BA could be explained via the differences found in this biome, where C3SBA10 detected 0.49 × 10⁶, 0.46 × 10⁶, and 0.26 × 10⁶ km2 less BA, respectively, in the 3 years of the overlapping time series.
Tropical forests account for between 9 and 11% of total BA (average 0.35 × 10⁶ km2 for C3SBA10 and 0.40 × 10⁶ km2 for the FireCCI51, respectively). The influence of the dry season in tropical biomes is quite evident in the products, with a marked fire period from November to March in the Northern Hemisphere, and from June to October in the Southern hemisphere (Figure 6). This trend slightly differs in South East Asia where the fire season continues until May. A lesser contribution, but still important, comes from the peatland areas of Kalimantan and Sumatra in Indonesia.
Another significant belt of fire activity can be found in the temperate forest and grasslands of the Northern Hemisphere (Figure 5), with relative maximum of around 50° N (Figure 6). Both C3SBA10 and FireCCI51 estimated that, on average, the accumulated contribution of these biomes to the global fire activity was around 7% (0.27 × 10⁶ km2 and 0.29 × 10⁶ km2, respectively). Most of this BA comes from the grasslands on the Asian steppe, which is dominated by large fires, although there is also important agricultural activity [87,88]. The central plains of United States also exhibit fire activity linked to croplands, as do the forest areas of the north-western territories. In the Southern Hemisphere, the BA derived from the extreme wildfires of 2019–2020 in the temperate forests of south-eastern Australia [8] is noticeable in Figure 5. The monthly variability in BA in temperate areas of the Northern Hemisphere is marked by both agricultural practices and dry summer conditions, leading to two separated fire activity periods: one in March–April and the other in July–August.
The deserts and xeric shrublands’ amount of BA detected by C3SBA10 and FireCCI51 products showed a similar contribution to that of temperate areas, although with much more inter-annual variability. The BA for 2017 was 0.26 × 10⁶ and 0.31 × 10⁶ km2, respectively, while for 2019 this number decreased by more than a half (0.11 × 10⁶ km2 according to both products) (Table 3). Two areas on the Earth are responsible for most of this BA: central and southern Kazakhstan are affected by large fires in summer (July–August), while the xeric shrublands and grasslands of central and western Australia show fire activity from October to January.
In the highest latitudes (>60°N), the boreal forests showed an increase in BA for the three-year period, oscillating from 61,173 and 58,533 km2 in 2017 to 90,503 and 86,711 km2 in 2019, according to C3SBA10 and FireCCI51, respectively, which means a 50% increase. In the Tundra region, BA showed an even higher increase, as in 2019 the products estimated 7 times more BA than in the previous year (Table 3). In fact, in 2019, the contributions of these two biomes were almost as much as that of temperate forests. Figure 6 shows how the fire season in the northern latitudes has a clear seasonal pattern in both products, with the highest activity in the summer months (July–August).
Finally, the BA in Mediterranean areas showed the least agreement between products, with the relative differences ranging from −17% (2019) to −33% (2018). The larger differences in 2018 are in line with the significant contrast between the BA of that year and of the other two years, which was noticeable in both products. This inter-annual variation seemed to be related to the extreme fire seasons in Portugal in 2017 and in 2019.
3.1.2. Spatial and Temporal Agreement
Even though the annual BAs detected by the global BA products differed through the study period (2017–2019), the correlation showed a significant agreement between them at all comparison grid sizes (Table 4). For instance, the correlation at the finest comparison resolution (0.05°) was found to be 0.937 in the year with lowest agreement (2017), and 0.952 in the year with the highest agreement (2019). This agreement increased when the spatial resolution of the comparison was decreased, reaching a 0.99 correlation for all years at the 0.5° grid size. However, the slope showed a clear bias towards FireCCI51, pointing to an underestimation of the C3SBA10 product at the global and annual scales, confirming the differences in the accuracy metrics.

Table 4.
Global correlation coefficient between FireCCI51 and C3SBA10, slope and RMSE for the years 2017, 2018 and 2019 at 0.05°, 0.10°, 0.25° and 0.50° grid sizes.
There is a clear improvement in the agreement between products in 2019 as well. The correlation metric was the highest in that year (from 0.95 at 0.05° to 0.99 at 0.50° grid resolutions), as was the slope (around 0.92 for all grid resolutions), which meant an increase in the amount of BA detected by the C3SBA10. The RMSE for that year was also the lowest, indicating that the availability of more images from both S3s made the differences between the BA products smaller.
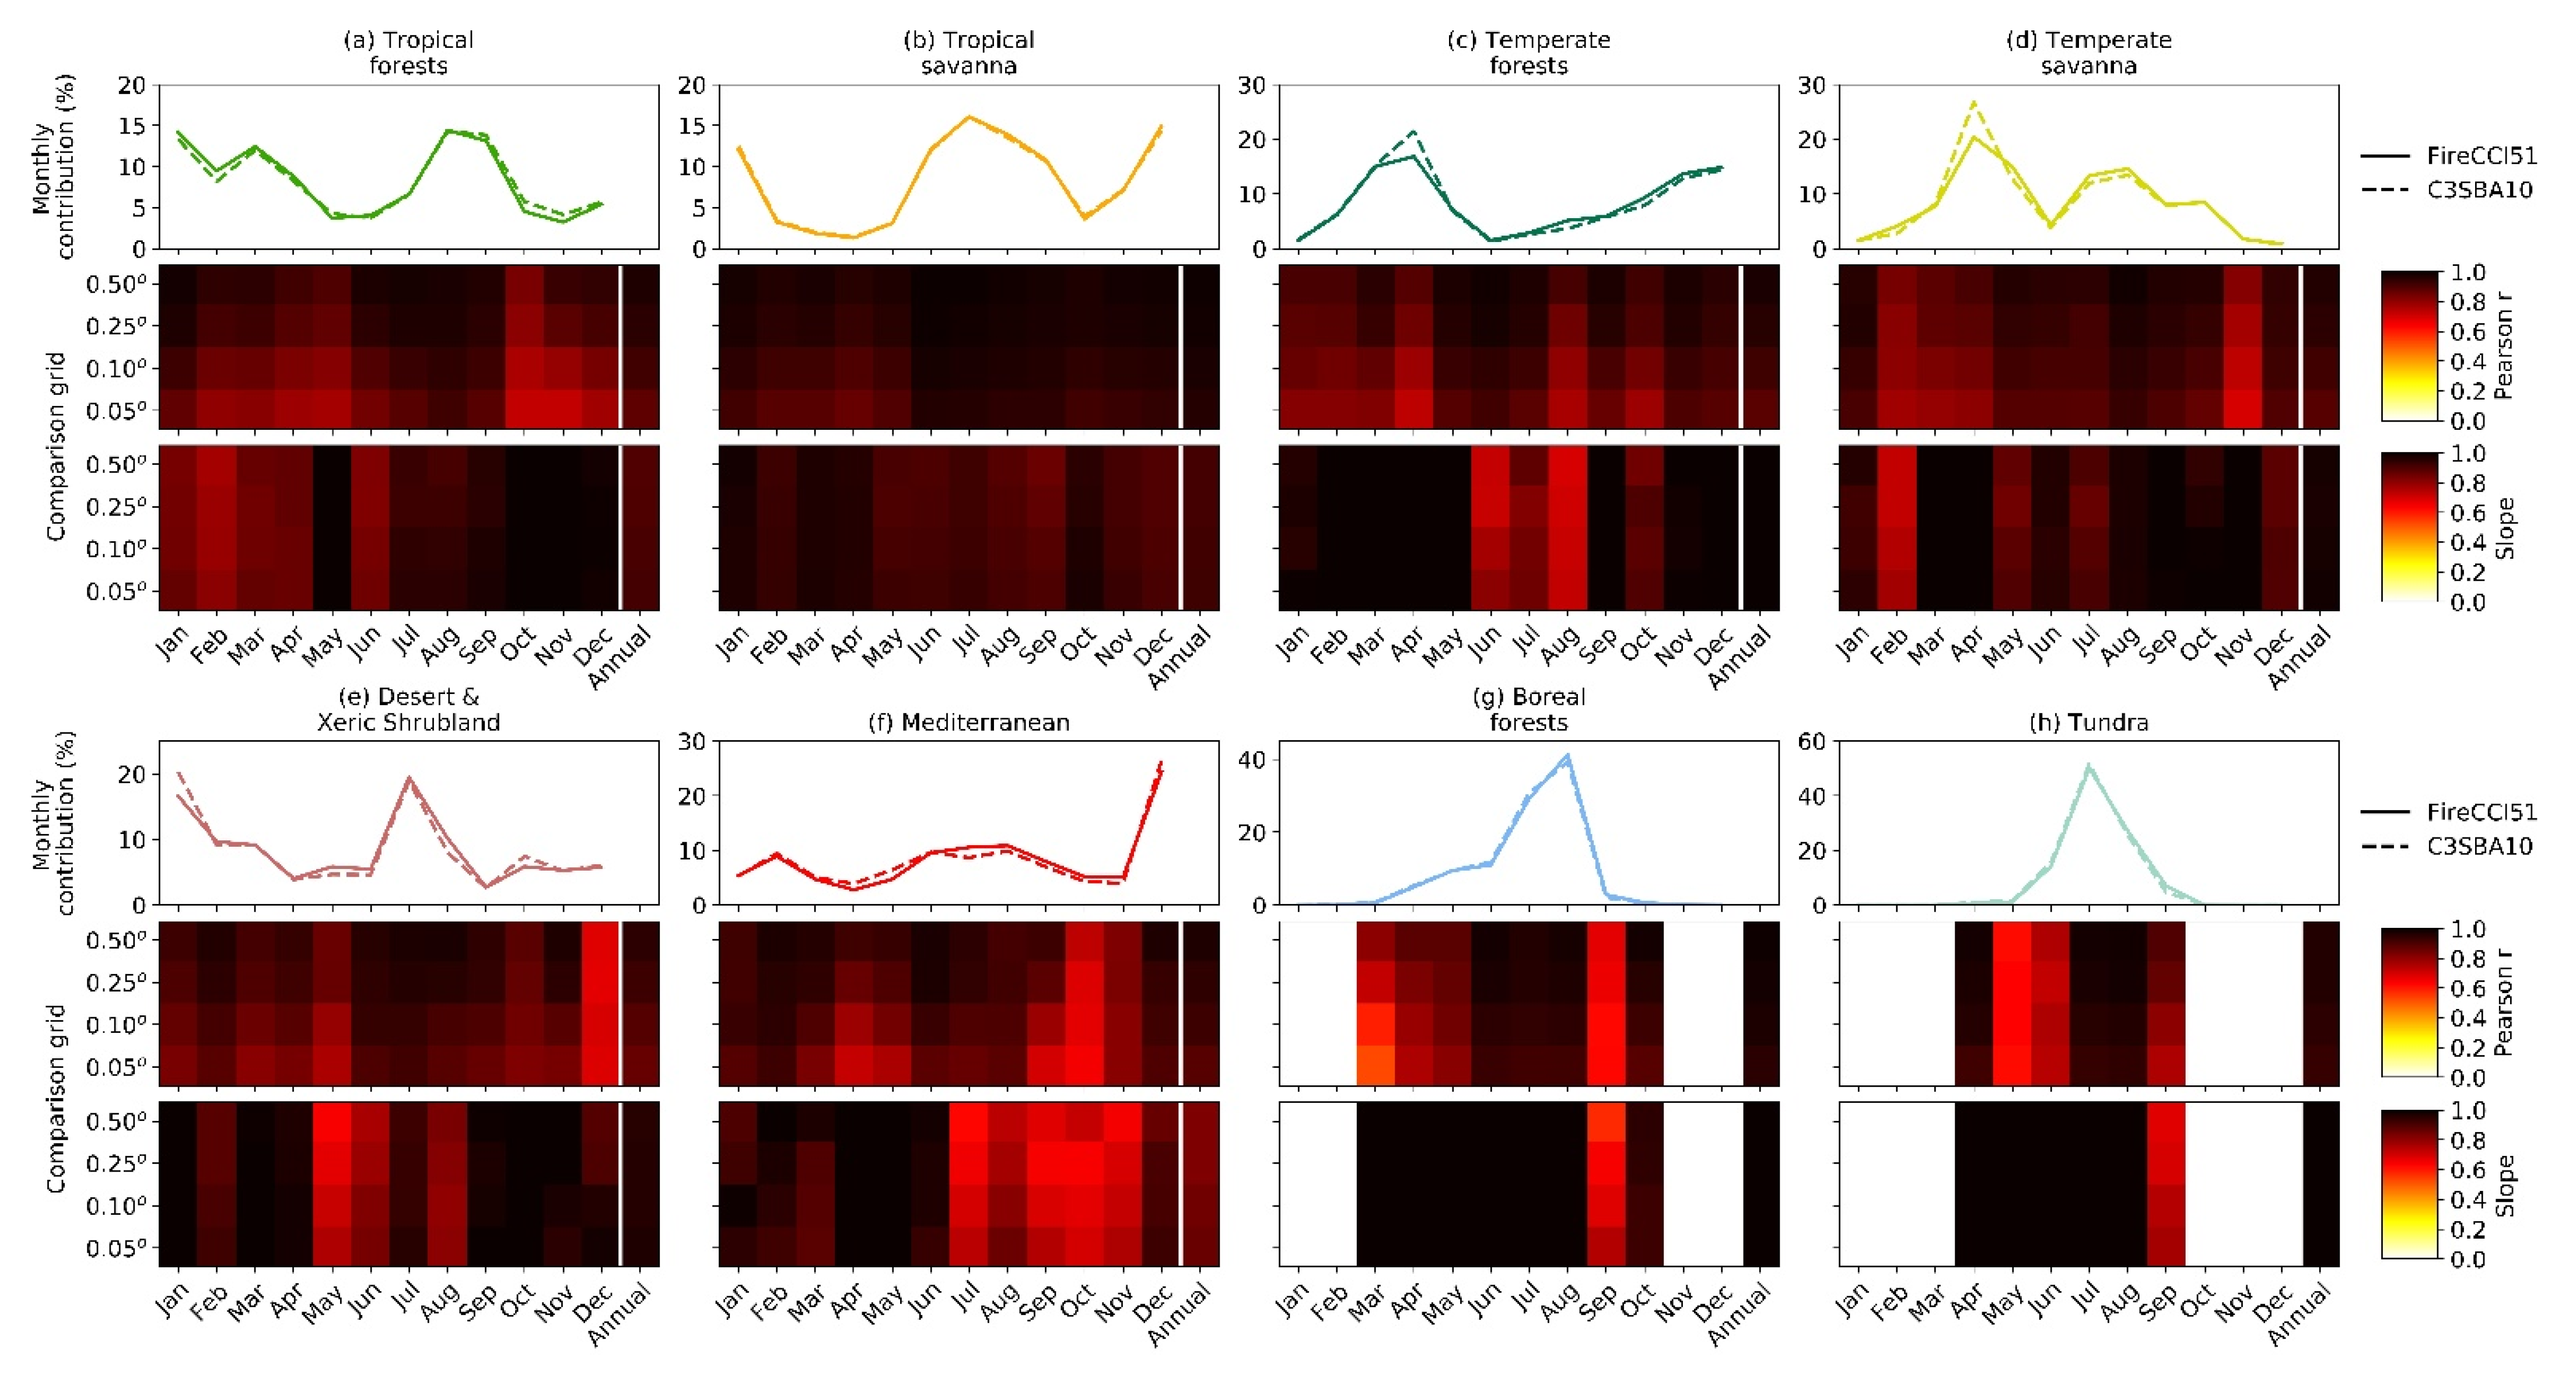
Through the eight biomes, the lowest correlations at the annual scale were those of deserts and xeric shrublands, with a 0.86 correlation at 0.05° grid resolution (Figure 7e). Tropical savanna showed the highest annual agreement, with correlations from 0.96 (at 0.05°) to 0.99 (at 0.50°). However, it had the highest RMSE of the different biomes (2.28 km2 at 0.05°) due to the large amount of BA per grid cell. Boreal forest and tundra showed very high agreement as well, with correlation coefficients between 0.94 and 0.98 for all grid sizes and the lowest RMSE, i.e., 0.27 km2 for boreal forest and 0.14 km2 for tundra at 0.05°. The rest of the biomes presented correlations between 0.87 and 0.89 at the 0.05° spatial resolution and above 0.90 from 0.10° upwards.
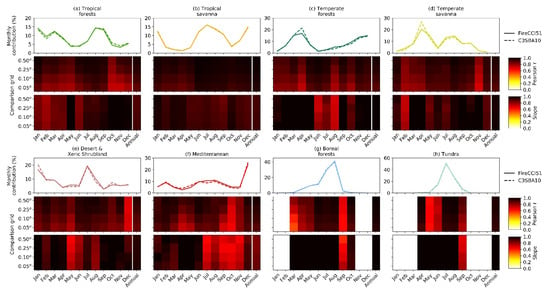
Figure 7.
Monthly percent BA contribution, Pearson’s correlation and bias (slope) between the FireCCI51 and C3SBA10 products per biome (sub-figures (a–h)) and grid size for the year 2019.
The four biomes that were unbiased or showed a little bias towards C3SBA10 were those located at the highest latitudes (boreal and tundra) and in temperate areas, with slope values near to 1. The rest of the biomes showed an underestimation of the C3SBA10, although in different proportions. The most noticeable underestimation was linked to the Mediterranean biome (Figure 7f), with a maximum slope of 0.86 at the 0.05° grid resolution. The rest of biomes presented slopes ranging from 0.89 to 0.97.
At the monthly scale, the agreement between products showed noticeable changes. The most stable biome throughout the year was tropical savanna (Figure 7b), since it was the most frequently burned biome and it was where most of the global BA was located. Actually, the lowest correlation was found in the months that contributed less to annual BA, i.e., February, March, April and May, with correlations from 0.86 to 0.89 at the finest comparison resolution, respectively. The rest of the months showed correlations above 0.92 at the 0.05° grid size, and were higher at the rest of the compared resolutions. In fact, at 0.50°, the lowest correlation, which was found in April, showed a value higher than 0.95. A systematic underestimation of the C3SBA10 was noticeable through all the grid cells that belong to tropical savanna, with slopes between 0.90 (September and December) and 0.98 (October) at the 0.05° spatial resolution. The influence of tropical savanna was clear in the global metrics, which can in some cases obscure subjacent trends in other biomes.
In most cases, the correlation increased with the proportional contribution to the annual BA. This was the case of boreal forests (Figure 7g) and tundra (Figure 7h), whose peak months clearly matched the summer months, i.e., July and August, which were responsible for 70% and 77% of the annual BA in those biomes, respectively, and, at the same time, showed the highest agreement (Pearson’s r > 0.91). However, not all biomes had a marked unimodal fire season, since they encompassed different continents and hemispheres, therefore indicating that fire activity is affected by diverse climatic and human conditions. In the case of deserts and the xeric shrubland biome (Figure 7e), two separate peaks were found, one in January (20% of annual BA, Pearson’s r = 0.83, slope = 1.12 at 0.05° grid size) and another in July (19% of annual BA, Pearson’s r = 0.92, slope = 0.95 at 0.05°). Something similar occurred in tropical forests (Figure 7a) where January (13% of annual BA, Pearson’s r = 0.87, slope = 0.87 at 0.05°) and August (14% of annual BA, Pearson’s r = 0.92, slope = 0.95 at 0.05°) had the maximum monthly BA values. The tropical savanna showed two clear fire seasons as well (Figure 7b), following the dry seasons of each hemisphere.
The agreement shown between C3SBA10 and FireCCI51 was not as stable in the case of temperate and Mediterranean biomes. In the former case, there was a clear discrepancy in the monthly contribution of April to the annual BA. In the case of temperate forests (Figure 7c), the monthly contribution corresponded to 21.3% for C3SBA10, while FireCCI51 estimated it at 16.8%. The same occurred in the temperate savanna (Figure 7d), where the contribution increased from 20.4% (FireCCI51) to 26.8% (C3SBA10). However, this discrepancy affected mainly the RMSE, which was much higher for this month than for the rest of the months in both biomes (RMSE = 0.44 km2 in savanna and RMSE = 0.27 km2 in forest at 0.05° grid size). In the Mediterranean biome (Figure 7f), from July to November, there was a significant increase in the bias towards FireCCI51, losing the stability shown in the first half of the year, and with slope values as low as 0.70, e.g., in the case of October.
3.2. Validation
3.2.1. Spatial Assessment
Table 5 shows the estimated accuracy metrics and their standard errors (SE) for the validation dataset. The Dice coefficient varied from 61.7 in 2019 (SE = 2.9) to 64.8 (SE = 2.9) in 2018 for the C3SBA10 product. These values were similar to those obtained for the FireCCI51 product, although this showed accuracy values that were higher for the years 2017 and 2018, but not substantially so for 2019 (Table 5), when the two S3 satellites were available. In general terms, C3SBA10 showed lower commission errors (Ce) and higher omission errors (Oe) than FireCCI51 throughout the three-year period. Both products showed negative relative bias for all the years, indicating a systematic underestimation of BA, which is common to other global BA datasets [89].

Table 5.
Accuracy metrics for the years 2017, 2018 and 2019. Standard errors are shown between parentheses.
Although three years are not enough to extract significant conclusions about the temporal trends of accuracy, a similar behaviour can be observed in both products. Thus, the year that presented the highest accuracy metrics in one product also did so in the other product.
3.2.2. Temporal Reporting Accuracy Assessment
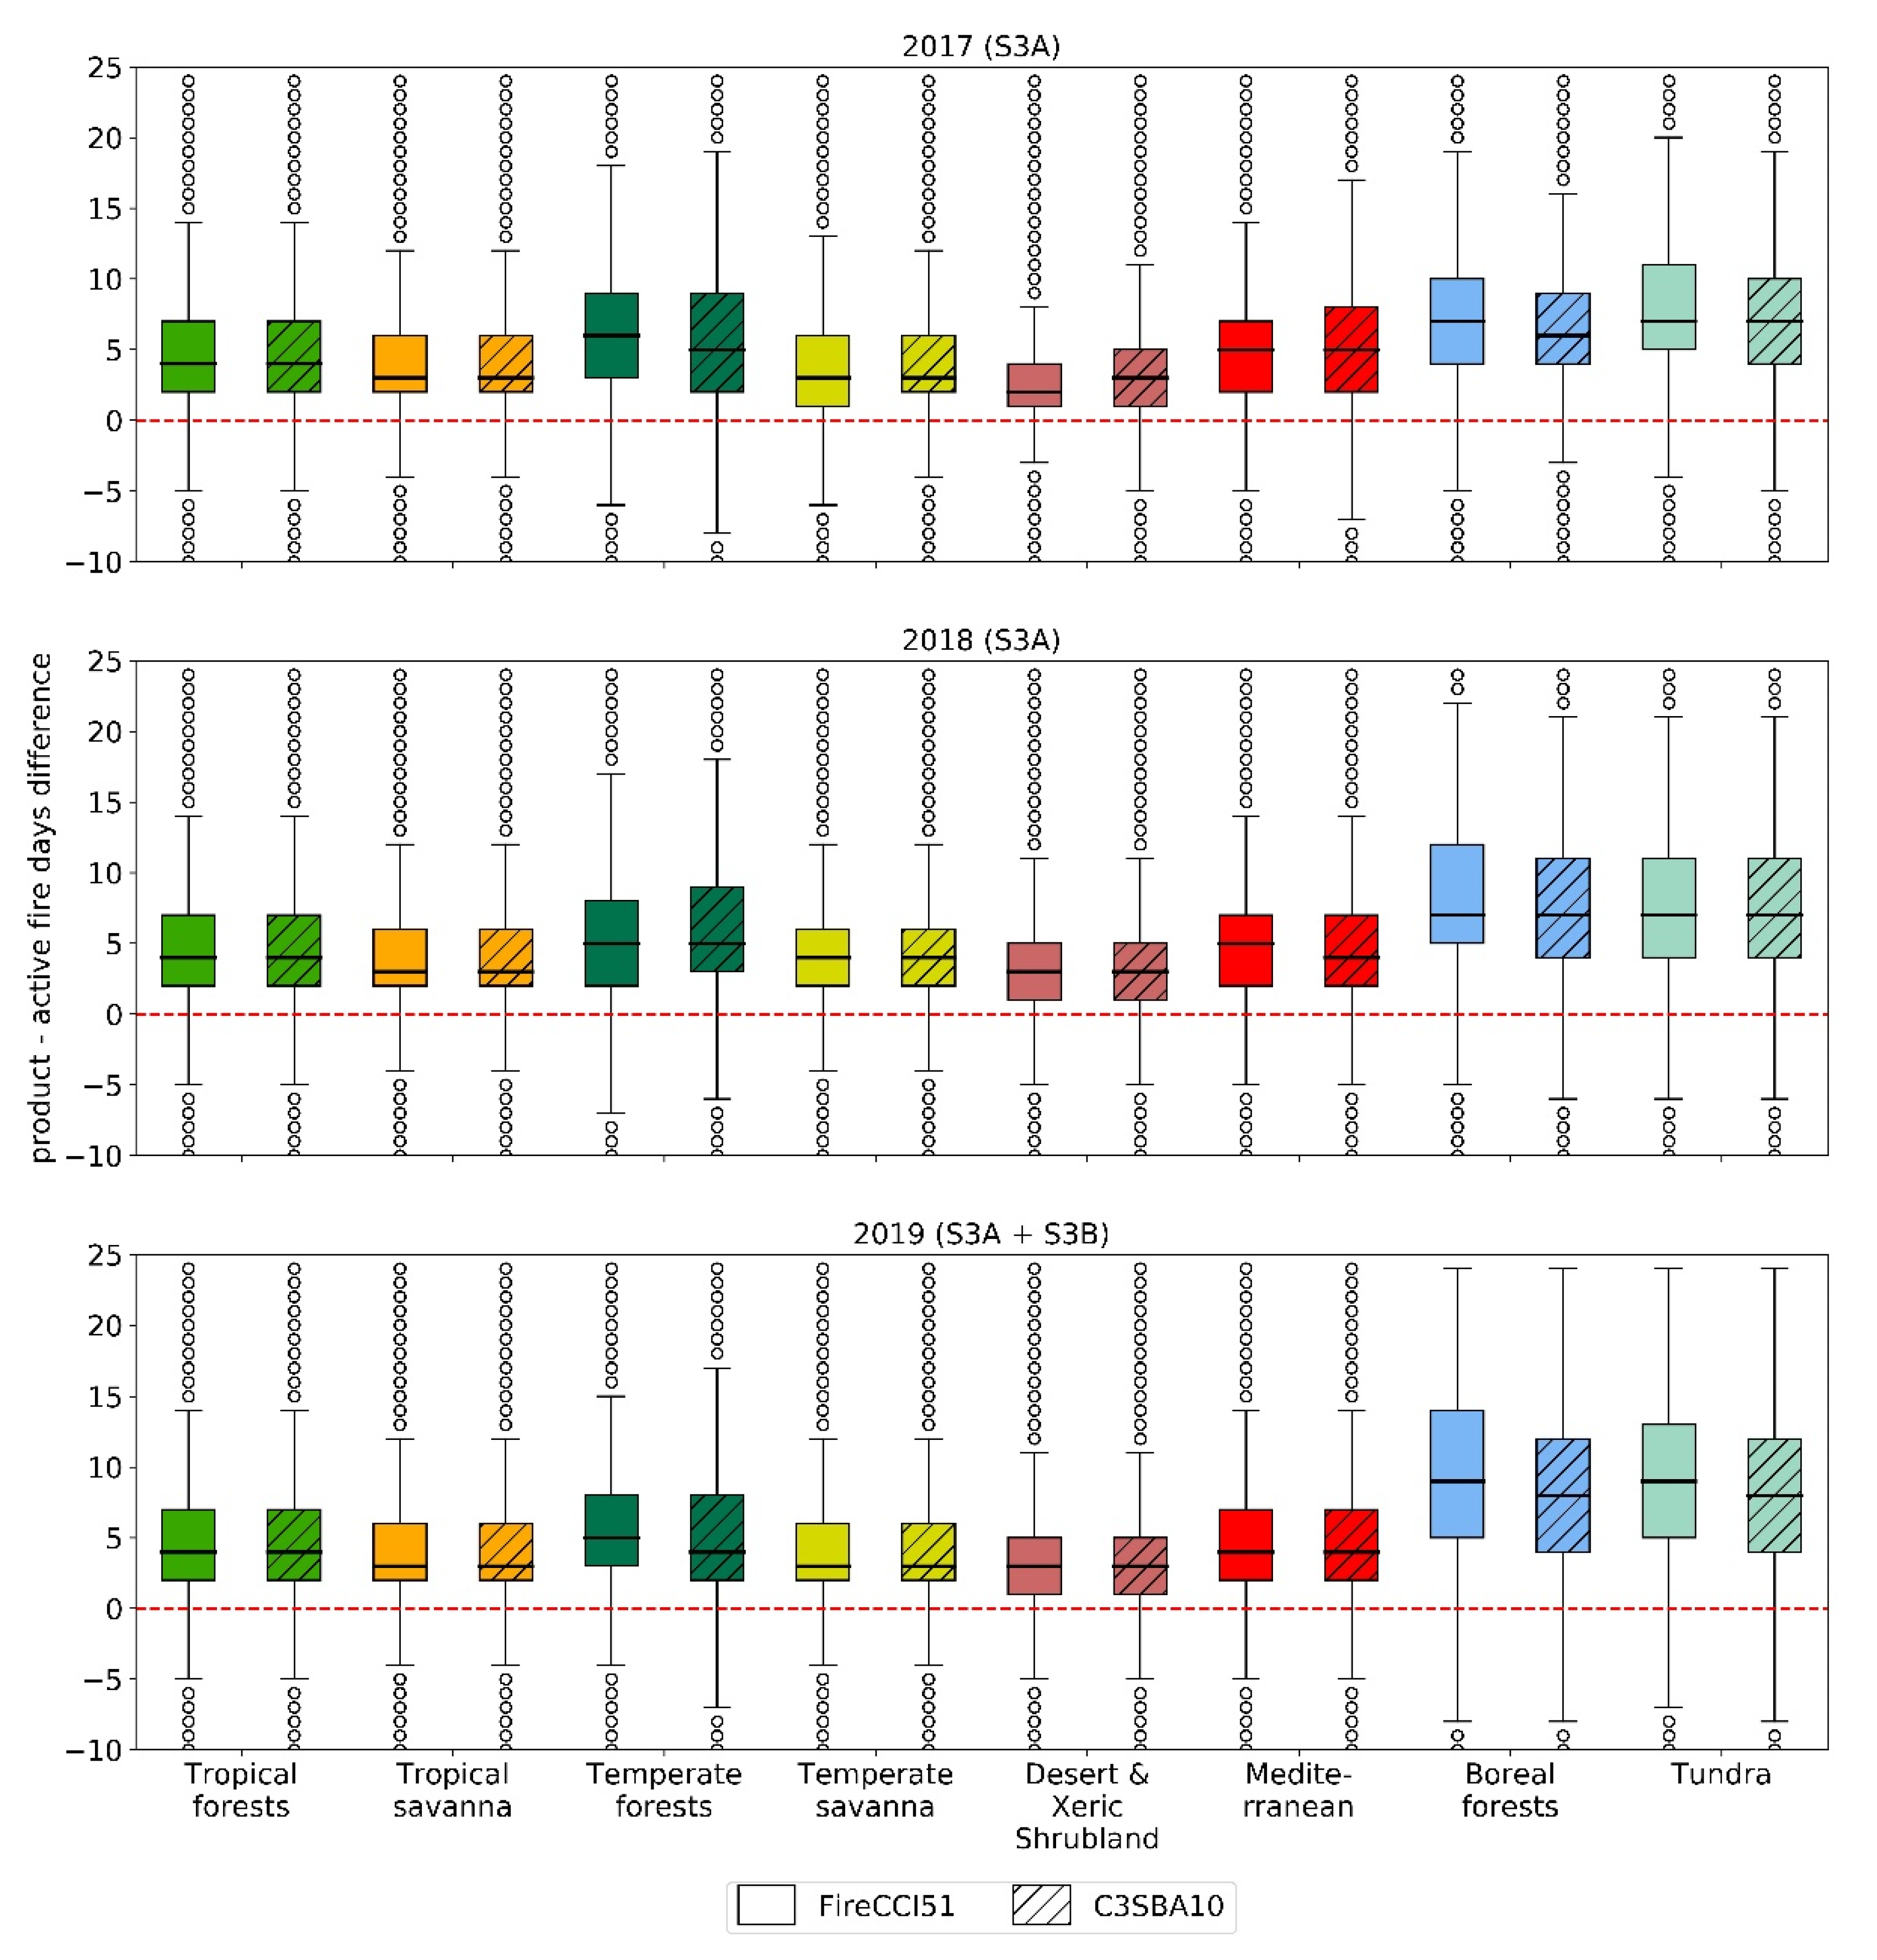
About 19 million active fires were used to estimate the temporal reporting accuracy of the three-year period of both products (Figure 8). On average (2017–2019), the results of C3SBA10 and FireCCI51 showed that for deserts and xeric shrubland, tropical and temperate savanna and Mediterranean biomes, around 90% of burned pixels were detected within the first 10 days after the fire (Table A1 and Table A2). This proportion was slightly lower in temperate and tropical forests, where about 80% and 83% of the pixels were labelled within 10 days of detection, respectively. The less accurate biomes were the boreal ones, where only 69% (forest) and 68% (tundra) of the burned pixels were detected by C3SBA10 within the first 10-day period, and slightly less by FireCCI51.
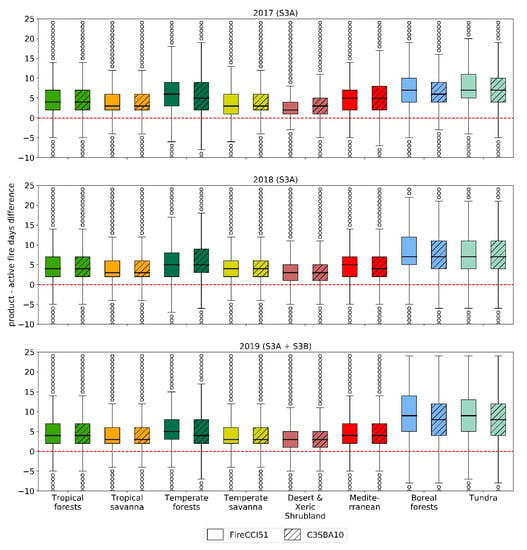
Figure 8.
Temporal reporting accuracy assessment of both FireCCI51 and C3SBA10 products. The box represents the interquartile range (IQR), the lower and upper bounds being the 25th and 75th percentiles, respectively. The black line within the box corresponds to the median value. The whiskers represent an additional area of 1.5 × IQR.
The analysis showed that, on average, the products were only able to detect more than 20% of the cases within 0 or 1-day difference in temperate savanna and desert and xeric shrubland biomes. This accuracy substantially increased if the difference was set to a maximum of 3 days’ difference, whereat all biomes doubled the number of cases that were detected within this time threshold.
3.3. Impact of the Number of Input Images
As indicated, the assessment on the performance of the C3SBA10 related to the number of S3 satellites available was carried out only on the 13 calibration tiles, using a dedicated validation dataset. As expected, the availability of S3B images from 2019 had an important influence on the results, both in terms of accuracy and BA estimations (Table A3). The omission error for those 13 tiles decreased from 45.4% (vS3A) to 40.5% (C3SBA10), while the Dice coefficient increased almost 3% (DC = 68.1 for C3SBA10). The relative bias was also reduced from −32.9 (vS3A) to −25.1 (C3SBA10), guided by the mentioned reduction in omission errors and a slight increase (below two percentage points) in the commission errors. All this led to an increment in the estimation of BA in the 13 tiles from 509,166 to 551,782 km2 (+8.4%).
In line with these findings, the comparison performed in the previous sections showed that the availability of both S3A and B, and hence a higher temporal resolution, had a significant impact on the amount of BA detected by the C3SBA10, mainly in those biomes where fire activity is frequent. This explains that the estimations between FireCCI51 and C3SBA10 were much more similar in 2019 than in the other years. Actually, the differences between the two products for 2019 were reduced by more than half in 2017 and 2018 for tropical forests, temperate savanna, desert and xeric shrubland and temperate forests, and by almost a half in tropical savanna (Table 3). In fact, if tropical savanna was not considered, only 30,000 km2 of BA was underestimated by the C3SBA10 versus FireCCI51. This underestimation was partially compensated for by the detection of more BA in boreal forest and tundra (5305 km2). The availability of more images can also explain why the difference in the omission error between the C3SBA10 and FireCCI51 was reduced from more than 7% in 2017 and 2018 to below 4% in 2019. As a consequence, the difference between the Dice coefficients in 2019 is 2.2%, half of that observed in the pre-S3B years. All this led to the highest agreement in 2019, which showed the highest Pearson’s correlations, the lowest bias towards FireCCI51, and the lowest RMSE.
4. Discussion
The transference of the FireCCI BA products to an operational service was challenging as, when the implementation process began in 2018, they were still in development, and had to be adapted to the new Copernicus missions. However, it is important to provide a consistent BA product for the climate service because BA information is demanded by atmospheric and carbon modellers. For this reason, it was decided to make a conservative choice by transferring the experience from the latest version of FireCCI’s BA algorithms (FireCCI51) to the C3S service, while adapting it to the new OLCI sensor on board the S3 satellites. Since the FireCCI51 product was conceived as a research product, not an operational one, it was processed only until 2019. Therefore, this option would guarantee the continuity of the CCI BA time series from 2019 onwards. Thus, the main objective of the C3SBA10 BA algorithm was to create a consistent product with FireCCI51.
The results of the intercomparison analysis prove this consistency between C3SBA10 and FireCCI51, with similar spatial and temporal trends. The annual BA data show a correlation value of 0.95, with a minor underestimation (slope = 0.92 and RMSE = 1.07 km2) at 0.05° spatial resolution, the finest spatial resolution used in the comparison (Table 4). The agreement between the products improved as the grid resolution for intercomparison decreased (Table 4, and Figure 7). The main differences between the two products were observed in the first two years of the time series (2017 and 2018) when only S3A was operating, and therefore the temporal resolution of OLCI (2–3 days) was much lower than the MODIS sensor (1 day). When the two S3 satellites were operating, in 2019, the BA estimations between the two products were more similar, although C3SBA10 detected 0.28 × 10⁶ km2 less BA than FireCCI51. Most of this difference (92%) was located in tropical savanna, where a systematic underestimation of C3SBA10 was found. This tendency towards underestimation was also observed in other global BA products (generally based on coarse spatial resolution sensors) when comparing them with regional products based on medium-resolution sensors. For instance, a continental BA product at 20 m derived from Sentinel-2 (S2) for the year 2016 in Sub-Saharan Africa found that global BA products significantly underestimate total BA, as they included 80% less burned area than the S2 BA product [90]. This was mainly caused by the poor detection of small fires (<100 ha) in global products. Therefore, C3SBA10 is likely missing more small fires than FireCCI51 due to its coarser spatial resolution (300 m vs. 250 m).
A deeper analysis of the year 2019 showed different trends in the consistency between products among the biomes. It was found that the changes in the correlation between products were linked to the BA detected for each month and biome. Although this relationship did not seem to be linear, i.e., a specific increase in BA did not mean a parallel increase in the correlation, it was clear that the larger the BA detected, the higher the correlation between products. The tropical savanna is an obvious example, and is where most of global BA was found. The boreal regions are another example where the correlation was the highest in the months with the largest BA, while it significantly decreased for the rest of the months. The extreme wildfire event of Eastern Australia [8] clearly illustrated this phenomenon, since it significantly increased BA and the agreement between products in December in the Mediterranean biome, and in November and December in temperate forests. There were some unusual cases as well, where higher BA did not necessarily mean higher correlation. This was the case for the temperate areas, where the correlation decreased in April.
Temperate savanna and forest biomes cover almost all the Northern Hemisphere’s mid-latitude croplands, located in the Russian Federation and Kazakhstan [87]. Cropland fires are characterised as small and transient [91,92], which made moderate-resolution BA products (250–500 m) unable to properly characterise the extent of cropland BA patches [87,88]. Besides this, the human activity in those regions may create two separate peak months (bimodal fire season), one of them taking place in sub-optimal weather conditions, and thus at times when less valid images are available [93]. It is reasonable to assume that the same issue was affecting both the FireCCI51 and C3SBA10 products, which clearly increased the uncertainty in those regions and, hence, decreased the agreement. In fact, it was very likely that the rest of the biomes were affected by a similar issue [94], manifesting a decrease in the agreement of products from March to May (Figure 7) when agricultural activity is high globally [92].
The validation exercise carried out through the overlapping three-year period (2017–2019) showed that both global BA products presented higher omission than commission errors [75]. This trend agrees with the validation exercises of other global BA products [79,83,89], as well as with the abovementioned inability of moderate-resolution BA products to detect small fire patches. The omission errors presented in this paper were lower than those found by previous authors for other global BA products, e.g., 72.6% for NASA’s standard product in [89], and 81% and 71% for two consecutive versions of FireCCI products (FireCCI41 and FireCCI50) in [83]. However, it must be highlighted that these estimations are not fully comparable to those presented in this paper, since all those studies used so-called short units (reference data generated from a maximum period of 16 days) instead of long units (reference data covering several months, as done in this study) to estimate the spatial accuracy of the products [75]. Similarly to the amounts of BA detections, the availability of the second S3 in 2019 had a direct impact on the accuracy of C3SBA10 (DC = 61.7 ± 2.9), and hence the accuracy of this year was more similar to that estimated for FireCCI51 (DC = 63.9 ± 2.8).
As was mentioned at the beginning of the discussion, the main aim of the C3SBA10 was to produce, based on European satellites, a BA product that is consistent with its precursor FireCCI51. However, the successful achievement of this requirement meant, at the same time, that some limitations detected in the FireCCI products were maintained in the new dataset. Among these limitations were the low temporal reporting accuracy shown by FireCCI51 [30] and potential tiling effects. The former was indeed observed, as only around 20% of the burned pixels were detected within ±1 day after the fire, 44% within ±3 days and 87% within ±10 days. The reporting accuracy problems of C3SBA10 and FireCCI51 are related to the criteria used to create the monthly composites, which are the starting point of both algorithms. To avoid the cloud and observation problems of the daily images, monthly NIR composites were created by selecting the most suitable NIR observation on a 20-day moving window centred around the date of the nearest active fire. This moving window was only expanded when less than four cloud-free images were found after the fire. Thus, in most cases, the search was limited to the first 10 post-fire days. However, inside the searching window, the algorithm prioritises the separability of the burned signal over the proximity of the observation to the date of the nearest active fire. The most separable observation, although it theoretically should be, is not always found in the day immediately after the fire due to angular effects. Although a temporal reporting accuracy of ±10 days could be reasonable for some applications (e.g., dynamic vegetation modelling), there are others, such as atmospheric emissions estimations, wherein the precise date of burn is very critical. However, these applications commonly use grid BA files, where BA is provided as the total per month in each grid cell. An additional post-processing step could be applied, for instance, reallocating the BA estimations following the active fires’ temporal distribution [9].
Regarding tiling effects, since both algorithms are processed following a standard tiling system, border effects may appear between adjacent tiles. A recent study that analysed this effect on the FireCCI51 and NASA’s standard BA products (MCD64A1 c6 [85]), which follow the standard MODIS tiling system, showed that horizontal border effects were noticeable in both products [95]. In the case of FireCCI51, border effects were mainly found in three different areas, although the most substantial one was located in Northwest India, near Pakistan. Although FireCCI51 presented a new methodology to estimate different thresholds for each fire, the first step in the algorithm still uses a tile-based threshold to perform the initial filtering of active fires. To do this, an unburned sample is selected from those pixels located further than 10 km from the nearest active fire. In the Indian case, the fire’s activity is concentrated in the southern part of the tile, and therefore, the unburned sample is mainly composed of pixels falling in the Himalayan mountainous area. This area is full of shadows, with very low NIR values, and hence the estimated threshold (10th percentile of the sample) is too low, filtering almost all the active fires in that initial step. Although C3SBA10 followed a different tiling system than the MODIS products, tiles are equally distributed every 10° in latitude, and therefore the same horizontal border effects appear in the C3SBA10 product as well.
The use of MODIS active fires may be seen as a drawback of C3SBA10, since the MODIS sensors are expected to be decommissioned ca. 2023. MODIS active fires were selected again for consistency reasons, as they were used by the FireCCI51 product for the benefit of having a long time series [30]. The replacement of MODIS active fires with those detected by other sensors will not become effective until the end (or severe degradation) of the MODIS mission. The best options for replacement would be the VIIRS sensor, on board Suomi-NPP and NOAA-20, or the Sea and Land Surface Temperature Radiometer (SLSTR) on board S3. The VIIRS active fires application can considerably increase the detection of small fires due to its improved spatial resolution of 375 m (versus 1 km of MODIS active fires) [48,49], although the impact on the identification of burned patches should be studied, due to the limitations of the moderate-resolution reflectance data in detecting small burned patches. Currently, the lack of a morning overpass of the VIIRS sensor could also be a limitation, particularly considering the diurnal cycle of tropical fires [96,97]. Using S3 SLSTR to obtain active fires would be greatly beneficial for the C3SBA10 product, as BA processing would not require external sensors. Besides this, the current version of the active fires algorithm seems well adapted to small fires [98]. However, this version of the algorithm is night-time-only, and consequently, provides limited sampling of the actual fire activity.
5. Conclusions
This paper describes the process that was followed to adapt the FireCCI51 global BA product, which is based on MODIS surface reflectance, to the C3S service using S3 OLCI data. The resulting product, called C3SBA10, ensures the continuation of the CCI BA component. A critical issue when generating long-term time series of ECVs is to ensure the consistency between the products that may be derived from different sensors. From that perspective, the inter-comparison with FireCCI51 showed the high agreement in both the spatial and temporal trends of BA, as well as a similar accuracy, especially during 2019, when both S3A and B were available. At the time of writing this paper, more than three years (January 2017–2020) of global BA data were publicly available at the Climate Data Store in pixel (300 m) and grid (0.25°) format.
Author Contributions
Conceptualisation, J.L.-L. and E.C.; methodology, J.L.-L., M.F. and E.C.; software, J.L.-L., G.K. and M.B.; validation, M.F. and J.L.-L., formal analysis, J.L.-L., investigation, J.L.-L., data curation, J.L.-L., G.K., M.B. and M.F.; writing—original draft preparation, J.L.-L., M.L.P. and E.C.; writing—review and editing, J.L.-L., M.L.P., M.F. and E.C.; supervision, E.C.; project administration, M.L.P. and E.C.; funding acquisition, E.C. All authors have read and agreed to the published version of the manuscript.
Funding
This study has been funded by the Service Contract for the provision of land CDRs and ICDRs of the Copernicus Climate Change Service (contract no. ECMWF/COPERNICUS/2018/C3S_312b_Lot5_VITO/SC1), the ESA Climate Change Initiative–Fire ECV (contract no. 4000126706/19/I-NB), and the Spanish Ministry of Science, Innovation, and Universities through a FPU doctoral fellowship (FPU17/02438).
Institutional Review Board Statement
Not applicable.
Informed Consent Statement
Not applicable.
Data Availability Statement
The C3SBA10 product presented in this paper includes two types of BA files: monthly full-resolution continental tiles and monthly global grid files at an aggregated resolution of 0.25 degrees, as described in Section 2.5 and Table 2. Both datasets, pixel and grid data types, are freely available through the Copernicus Climate Data Store (CDS) repository (DOI: https://doi.org/10.24381/cds.f333cf85, accessed on 21 October 2021 [99]), referenced as OLCI C3S Burned Area v1.0. Users should note that FireCCI51 is also available through the same repository, referenced as MODIS FireCCI v5.1.1cds.
Conflicts of Interest
The authors declare no conflict of interest. The funders had no role in the design of the study; in the collection, analyses, or interpretation of data; in the writing of the manuscript, or in the decision to publish the results.
Additionally
The reference files generated for the spatial global validation of the C3SBA10 product are publicly available at https://doi.org/10.21950/BBQQU7 (accessed on 21 October 2021) [100].
Appendix A

Table A1.
Average (2017–2019) temporal reporting accuracies of the C3SBA10.
Table A1.
Average (2017–2019) temporal reporting accuracies of the C3SBA10.
| Reporting Accuracy | Tropical Forest | Tropical Savanna | Temperate Forest | Temperate Savanna | Desert and Xeric Shrubland | Mediterranean | Boreal Forest | Tundra | Global |
|---|---|---|---|---|---|---|---|---|---|
| 0–1 days | 16.9% | 18.5% | 14.0% | 21.4% | 24.9% | 14.2% | 6.3% | 7.3% | 17.4% |
| 0–3 days | 40.9% | 48.2% | 33.5% | 49.7% | 56.2% | 37.6% | 17.5% | 19.3% | 44.5% |
| 0–5 days | 59.5% | 68.0% | 51.0% | 69.0% | 75.0% | 59.3% | 32.0% | 33.3% | 63.6% |
| 0–10 days | 83.4% | 89.1% | 80.7% | 93.2% | 94.1% | 91.1% | 69.2% | 68.0% | 86.8% |

Table A2.
Average (2017–2019) temporal reporting accuracies of the FireCCI51.
Table A2.
Average (2017–2019) temporal reporting accuracies of the FireCCI51.
| Reporting Accuracy | Tropical Forest | Tropical Savanna | Temperate Forest | Temperate Savanna | Desert and Xeric Shrubland | Mediterranean | Boreal Forest | Tundra | Global |
|---|---|---|---|---|---|---|---|---|---|
| 0–1 days | 16.2% | 18.6% | 9.7% | 23.1% | 31.0% | 13.8% | 5.2% | 5.5% | 17.8% |
| 0–3 days | 40.2% | 48.7% | 27.3% | 51.6% | 61.8% | 35.7% | 15.4% | 14.7% | 45.2% |
| 0–5 days | 59.3% | 68.4% | 46.2% | 70.6% | 78.6% | 57.4% | 29.4% | 27.3% | 64.4% |
| 0–10 days | 84.3% | 89.4% | 78.3% | 93.0% | 94.4% | 92.3% | 63.7% | 62.1% | 87.1% |

Table A3.
Accuracy metrics for 2019 of the 13 calibration tiles. C3SBA10 is the official C3S BA product, which used both S3A and B images. Conversely, vS3A represents the version that uses only S3A.
Table A3.
Accuracy metrics for 2019 of the 13 calibration tiles. C3SBA10 is the official C3S BA product, which used both S3A and B images. Conversely, vS3A represents the version that uses only S3A.
| Accuracy Metric | vS3A | C3SBA10 |
|---|---|---|
| Dice coefficient | 65.3 | 68.1 |
| Commission error | 18.7 | 20.5 |
| Omission error | 45.4 | 40.5 |
| Relative bias | −32.9 | −25.1 |
References
- Marlon, J.R.; Bartlein, P.J.; Daniau, A.-L.; Harrison, S.P.; Maezumi, S.Y.; Power, M.J.; Tinner, W.; Vanniére, B. Global biomass burning: A synthesis and review of Holocene paleofire records and their controls. Quat. Sci. Rev. 2013, 65, 5–25. [Google Scholar] [CrossRef]
- Turco, M.; Jerez, S.; Augusto, S.; Tarín-Carrasco, P.; Ratola, N.; Jiménez-Guerrero, P.; Trigo, R.M. Climate drivers of the 2017 devastating fires in Portugal. Sci. Rep. 2019, 9, 13886. [Google Scholar] [CrossRef]
- Chuvieco, E.; Pettinari, M.L.; Koutsias, N.; Forkel, M.; Hantson, S.; Turco, M. Human and climate drivers of global biomass burning variability. Sci. Total Environ. 2021, 779, 146361. [Google Scholar] [CrossRef] [PubMed]
- Abatzoglou, J.T.; Williams, A.P.; Boschetti, L.; Zubkova, M.; Kolden, C.A. Global patterns of interannual climate–fire relationships. Glob. Chang. Biol. 2018, 24, 5164–5175. [Google Scholar] [CrossRef]
- Andela, N.; van der Werf, G.R. Recent trends in African fires driven by cropland expansion and El Niño to La Niña transition. Nat. Clim. Chang. 2014, 4, 791–795. [Google Scholar] [CrossRef]
- Daniau, A.-L.; Sánchez Goñi, M.F.; Martinez, P.; Urrego, D.H.; Bout-Roumazeilles, V.; Desprat, S.; Marlon, J.R. Orbital-scale climate forcing of grassland burning in southern Africa. Proc. Natl. Acad. Sci. USA 2013, 110, 5069. [Google Scholar] [CrossRef] [PubMed] [Green Version]
- Moritz, M.A.; Parisien, M.-A.; Batllori, E.; Krawchuk, M.A.; Van Dorn, J.; Ganz, D.J.; Hayhoe, K. Climate change and disruptions to global fire activity. Ecosphere 2012, 3, 49. [Google Scholar] [CrossRef]
- Bowman, D.; Williamson, G.; Yebra, M.; Lizundia-Loiola, J.; Pettinari, M.L.; Shah, S.; Bradstock, R.; Chuvieco, E. Wildfires: Australia needs national monitoring agency. Nature 2020, 584, 188–191. [Google Scholar] [CrossRef] [PubMed]
- van der Werf, G.R.; Randerson, J.T.; Giglio, L.; Van Leeuwen, T.T.; Chen, Y.; Rogers, B.M.; Mu, M.; Van Marle, M.J.E.; Morton, D.C.; Collatz, G.J. Global fire emissions estimates during 1997–2016. Earth Syst. Sci. Data 2017, 9, 697–720. [Google Scholar] [CrossRef] [Green Version]
- Ward, D.; Kloster, S.; Mahowald, N.; Rogers, B.; Randerson, J.; Hess, P. The changing radiative forcing of fires: Global model estimates for past, present and future. Atmos. Chem. Phys. 2012, 12, 10857–10886. [Google Scholar] [CrossRef] [Green Version]
- Yue, C.; Ciais, P.; Houghton, R.A.; Nassikas, A.A. Contribution of land use to the interannual variability of the land carbon cycle. Nat. Commun. 2020, 11, 3170. [Google Scholar] [CrossRef]
- Poulter, B.; Cadule, P.; Cheiney, A.; Ciais, P.; Hodson, E.; Peylin, P.; Plummer, S.; Spessa, A.; Saatchi, S.; Yue, C. Sensitivity of global terrestrial carbon cycle dynamics to variability in satellite-observed burned area. Glob. Biogeochem. Cycles 2015, 29, 207–222. [Google Scholar] [CrossRef] [Green Version]
- Friedlingstein, P.; O’Sullivan, M.; Jones, M.W.; Andrew, R.M.; Hauck, J.; Olsen, A.; Peters, G.P.; Peters, W.; Pongratz, J.; Sitch, S.; et al. Global Carbon Budget 2020. Earth Syst. Sci. Data 2020, 12, 3269–3340. [Google Scholar] [CrossRef]
- Tosca, M.G.; Randerson, J.T.; Zender, C.S.; Flanner, M.G.; Rasch, P.J. Do biomass burning aerosols intensify drought in equatorial Asia during El Niño? Atmos. Chem. Phys. 2010, 10, 3515–3528. [Google Scholar] [CrossRef] [Green Version]
- Tosca, M.G.; Diner, D.J.; Garay, M.J.; Kalashnikova, O.V. Observational evidence of fire-driven reduction of cloud fraction in tropical Africa. J. Geophys. Res. Atmos. 2014, 119, 8418–8432. [Google Scholar] [CrossRef]
- Kelly, L.T.; Brotons, L. Using fire to promote biodiversity. Science 2017, 355, 1264. [Google Scholar] [CrossRef]
- Enright, N.J.; Fontaine, J.B.; Bowman, D.M.J.S.; Bradstock, R.A.; Williams, R.J. Interval squeeze: Altered fire regimes and demographic responses interact to threaten woody species persistence as climate changes. Front. Ecol. Environ. 2015, 13, 265–272. [Google Scholar] [CrossRef] [Green Version]
- Bowman, D.M.J.S.; Balch, J.K.; Artaxo, P.; Bond, W.J.; Carlson, J.M.; Cochrane, M.A.; D’Antonio, C.M.; DeFries, R.S.; Doyle, J.C.; Harrison, S.P.; et al. Fire in the Earth system. Science 2009, 324, 481–484. [Google Scholar] [CrossRef] [PubMed]
- Higuera, P.E.; Abatzoglou, J.T. Record-setting climate enabled the extraordinary 2020 fire season in the western United States. Glob. Chang. Biol. 2021, 27, 1–2. [Google Scholar] [CrossRef]
- Bojinski, S.; Verstraete, M.; Peterson, T.C.; Richter, C.; Simmons, A.; Zemp, M. The concept of essential climate variables in support of climate research, applications, and policy. Bull. Am. Meteorol. Soc. 2014, 95, 1431–1443. [Google Scholar] [CrossRef]
- Plummer, S.; Lecomte, P.; Doherty, M. The ESA Climate Change Initiative (CCI): A European contribution to the generation of the Global Climate Observing System. Remote Sens. Environ. 2017, 203, 2–8. [Google Scholar] [CrossRef]
- Chuvieco, E.; Mouillot, F.; van der Werf, G.R.; San Miguel, J.; Tanasse, M.; Koutsias, N.; García, M.; Yebra, M.; Padilla, M.; Gitas, I.; et al. Historical background and current developments for mapping burned area from satellite Earth observation. Remote Sens. Environ. 2019, 225, 45–64. [Google Scholar] [CrossRef]
- Mouillot, F.; Schultz, M.G.; Yue, C.; Cadule, P.; Tansey, K.; Ciais, P.; Chuvieco, E. Ten years of global burned area products from spaceborne remote sensing—A review: Analysis of user needs and recommendations for future developments. Int. J. Appl. Earth Obs. Geoinf. 2014, 26, 64–79. [Google Scholar] [CrossRef] [Green Version]
- Seiler, W.; Crutzen, P.J. Estimates of gross and net fluxes of carbon between the biosphere and the atmosphere from biomass burning. Clim. Chang. 1980, 2, 207–247. [Google Scholar] [CrossRef]
- Forkel, M.; Dorigo, W.; Lasslop, G.; Teubner, I.; Chuvieco, E.; Thonicke, K. A data-driven approach to identify controls on global fire activity from satellite and climate observations (SOFIA V1). Geosci. Model Dev. 2017, 10, 4443. [Google Scholar] [CrossRef] [Green Version]
- Forkel, M.; Andela, N.; Harrison, S.P.; Lasslop, G.; van Marle, M.; Chuvieco, E.; Dorigo, W.; Forrest, M.; Hantson, S.; Heil, A.; et al. Emergent relationships with respect to burned area in global satellite observations and fire-enabled vegetation models. Biogeosciences 2019, 16, 57–76. [Google Scholar] [CrossRef] [Green Version]
- Hantson, S.; Arneth, A.; Harrison, S.P.; Kelley, D.I.; Prentice, I.C.; Rabin, S.S.; Archibald, S.; Mouillot, F.; Arnold, S.R.; Artaxo, P. The status and challenge of global fire modelling. Biogeosciences 2016, 13, 3359–3375. [Google Scholar] [CrossRef] [Green Version]
- Hantson, S.; Kelley, D.I.; Arneth, A.; Harrison, S.P.; Archibald, S.; Bachelet, D.; Forrest, M.; Hickler, T.; Lasslop, G.; Li, F.; et al. Quantitative assessment of fire and vegetation properties in simulations with fire-enabled vegetation models from the Fire Model Intercomparison Project. Geosci. Model Dev. 2020, 13, 3299–3318. [Google Scholar] [CrossRef]
- Heil, A.; Pettinari, M.L. ESA Climate Change Initiative-Fire_cci D1.1 User Requirements Document (URD), Version 7.2. 2021. Available online: https://climate.esa.int/media/documents/Fire_cci_D1.1_URD_v7.2.pdf (accessed on 21 October 2021).
- Lizundia-Loiola, J.; Otón, G.; Ramo, R.; Chuvieco, E. A spatio-temporal active-fire clustering approach for global burned area mapping at 250 m from MODIS data. Remote Sens. Environ. 2020, 236, 111493. [Google Scholar] [CrossRef]
- Otón, G.; Lizundia-Loiola, J.; Pettinari, M.L.; Chuvieco, E. Development of a consistent global long-term burned area product (1982–2018) based on AVHRR-LTDR data. Int. J. Appl. Earth Obs. Geoinf. 2021, 103, 102473. [Google Scholar] [CrossRef]
- Thépaut, J.; Dee, D.; Engelen, R.; Pinty, B. The Copernicus Programme and its Climate Change Service. In Proceedings of the IGARSS 2018-2018 IEEE International Geoscience and Remote Sensing Symposium, Valencia, Spain, 22–27 July 2018; pp. 1591–1593. [Google Scholar]
- Sayer, A.M.; Hsu, N.C.; Bettenhausen, C.; Ahmad, Z.; Holben, B.N.; Smirnov, A.; Thomas, G.E.; Zhang, J. SeaWiFS Ocean Aerosol Retrieval (SOAR): Algorithm, validation, and comparison with other data sets. J. Geophys. Res. Atmos. 2012, 117. [Google Scholar] [CrossRef]
- Hsu, N.C.; Jeong, M.J.; Bettenhausen, C.; Sayer, A.M.; Hansell, R.; Seftor, C.S.; Huang, J.; Tsay, S.C. Enhanced Deep Blue aerosol retrieval algorithm: The second generation. J. Geophys. Res. Atmos. 2013, 118, 9296–9315. [Google Scholar] [CrossRef]
- Sayer, A.M.; Hsu, N.C.; Lee, J.; Bettenhausen, C.; Kim, W.V.; Smirnov, A. Satellite Ocean Aerosol Retrieval (SOAR) Algorithm Extension to S-NPP VIIRS as Part of the “Deep Blue” Aerosol Project. J. Geophys. Res. Atmos. 2018, 123, 380–400. [Google Scholar] [CrossRef] [PubMed]
- Hsu, N.C.; Lee, J.; Sayer, A.M.; Kim, W.; Bettenhausen, C.; Tsay, S.C. VIIRS Deep Blue Aerosol Products Over Land: Extending the EOS Long-Term Aerosol Data Records. J. Geophys. Res. Atmos. 2019, 124, 4026–4053. [Google Scholar] [CrossRef]
- Sayer, A.M.; Hsu, N.C.; Lee, J.; Carletta, N.; Chen, S.H.; Smirnov, A. Evaluation of NASA Deep Blue/SOAR aerosol retrieval algorithms applied to AVHRR measurements. J. Geophys. Res. Atmos. 2017, 122, 9945–9967. [Google Scholar] [CrossRef] [PubMed]
- Embury, O.; Good, S. Product User Guide and Specification–Sea Surface Temperature, D3.SST.1-v2.2_PUGS_of_v2SST_products_v6.0. 2020. Available online: https://datastore.copernicus-climate.eu/documents/satellite-sea-surface-temperature/v2.0/D3.SST.1-v2.2_PUGS_of_v2SST_products_v6.0_APPROVED_Ver1.pdf (accessed on 21 October 2021).
- Merchant, C.J.; Block, T.; Corlett, G.K.; Embury, O.; Mittaz, J.P.D.; Mollard, J.D.P. Harmonization of Space-Borne Infra-Red Sensors Measuring Sea Surface Temperature. Remote. Sens. 2020, 12, 1048. [Google Scholar] [CrossRef] [Green Version]
- Merchant, C.I. Sea Surface Temperature CCI Phase-II Algorithm Theoretical Basis Document (v2 Reprocessing), SST_CCI-ATBD-UOR-203 (ATBD), Issue 3. 2019. Available online: https://climate.esa.int/media/documents/SST_cci_PUG_v2.pdf (accessed on 21 October 2021).
- Merchant, C.J.; Embury, O.; Bulgin, C.E.; Block, T.; Corlett, G.K.; Fiedler, E.; Good, S.A.; Mittaz, J.; Rayner, N.A.; Berry, D.; et al. Satellite-based time-series of sea-surface temperature since 1981 for climate applications. Sci. Data 2019, 6, 223. [Google Scholar] [CrossRef] [PubMed] [Green Version]
- Zhang, Z.; Zhao, L.; Lin, A. Evaluating the performance of Sentinel-3A OLCI land products for gross primary productivity estimation using ameriflux data. Remote Sens. 2020, 12, 1927. [Google Scholar] [CrossRef]
- Pastor-Guzman, J.; Brown, L.; Morris, H.; Bourg, L.; Goryl, P.; Dransfeld, S.; Dash, J. The Sentinel-3 OLCI Terrestrial Chlorophyll Index (OTCI): Algorithm Improvements, Spatiotemporal Consistency and Continuity with the MERIS Archive. Remote Sens. 2020, 12, 2652. [Google Scholar] [CrossRef]
- Alonso-Canas, I.; Chuvieco, E. Global Burned Area Mapping from ENVISAT-MERIS data. Remote Sens. Environ. 2015, 163, 140–152. [Google Scholar] [CrossRef]
- López, G.; Muller, J.-P.; Potts, D.; Shane, N.; Kharbouche, S.; Fisher, D.; Lewis, P.; Brockmann, C.; Danne, O.; Krueger, O.; et al. GlobAlbedo Algorithm Theoretical Basis Document Version 4.12 2013. Available online: http://globalbedo.org/docs/GlobAlbedo_Albedo_ATBD_V4.12.pdf (accessed on 21 October 2021).
- Giglio, L.; Schroeder, W.; Hall, J.V.; Justice, C.O. Modis Collection 6 Active Fire Product User’s Guide Revision B. 2018. Available online: https://modis-fire.umd.edu/files/MODIS_C6_Fire_User_Guide_B.pdf (accessed on 21 October 2021).
- Wolters, E.; Dierckx, W.; Lordache, M.D.; Swinnen, E. PROBA-V Products User Manual v. 3.01. 2018. Available online: https://proba-v.vgt.vito.be/sites/proba-v.vgt.vito.be/files/products_user_manual.pdf (accessed on 21 October 2021).
- Oliva, P.; Schroeder, W. Assessment of VIIRS 375m active fire detection product for direct burned area mapping. Remote Sens. Environ. 2015, 160, 144–155. [Google Scholar] [CrossRef]
- Schroeder, W.; Oliva, P.; Giglio, L.; Csiszar, I.A. The New VIIRS 375 m active fire detection data product: Algorithm description and initial assessment. Remote Sens. Environ. 2014, 143, 85–96. [Google Scholar] [CrossRef]
- Oliva, P.; Martin, P.; Chuvieco, E. Burned area mapping with MERIS post-fire image. Int. J. Remote Sens. 2011, 32, 4175–4201. [Google Scholar] [CrossRef]
- Merchant, C.J.; Paul, F.; Popp, T.; Ablain, M.; Bontemps, S.; Defourny, P.; Hollmann, R.; Lavergne, T.; Laeng, A.; de Leeuw, G. Uncertainty information in climate data records from Earth observation. Earth Syst. Sci. Data 2017, 9, 511–527. [Google Scholar] [CrossRef] [Green Version]
- Mittaz, J.; Merchant, C.J.; Woolliams, E.R. Applying principles of metrology to historical Earth observations from satellites. Metrologia 2019, 56, 032002. [Google Scholar] [CrossRef]
- Sayer, A.M.; Govaerts, Y.; Kolmonen, P.; Lipponen, A.; Luffarelli, M.; Mielonen, T.; Patadia, F.; Popp, T.; Povey, A.C.; Stebel, K. A review and framework for the evaluation of pixel-level uncertainty estimates in satellite aerosol remote sensing. Atmos. Meas. Tech. Discuss 2019, 13, 373–404. [Google Scholar] [CrossRef] [Green Version]
- Chuvieco, E.; Pettinari, M.L.; Heil, A.; Storm, T. ESA CCI EVC Fire Disturbance: D1.2 Product Specification Document, Version 6.3. 2017. Available online: https://climate.esa.int/media/documents/Fire_cci_D1.2_PSD_v6.3.pdf (accessed on 21 October 2021).
- Amos, J. Arctic Wildfires: How Bad Are They and What Caused Them? Available online: https://www.bbc.com/news/world-europe-49125391 (accessed on 21 October 2021).
- Evangeliou, N.; Kylling, A.; Eckhardt, S.; Myroniuk, V.; Stebel, K.; Paugam, R.; Zibtsev, S.; Stohl, A. Open fires in Greenland in summer 2017: Transport, deposition and radiative effects of BC, OC and BrC emissions. Atmos. Chem. Phys. 2019, 2, 1393–1411. [Google Scholar] [CrossRef] [Green Version]
- Boschetti, L.; Eva, H.D.; Brivio, P.A.; Gregoire, J.M. Lessons to be learned from the comparison of three satellite-derived biomass burning products. Geophys. Res. Lett. 2004, 31, L21501. [Google Scholar] [CrossRef] [Green Version]
- Giglio, L.; Randerson, J.T.; van der Werf, G.R.; Kasibhatla, P.S.; Collatz, G.J.; Morton, D.C.; DeFries, R.S. Assessing variability and long-term trends in burned area by merging multiple satellite fire products. Biogeo Sci. Discuss 2010, 7, 1171–1186. [Google Scholar] [CrossRef] [Green Version]
- Humber, M.L.; Boschetti, L.; Giglio, L.; Justice, C.O. Spatial and temporal intercomparison of four global burned area products. Int. J. Digit. Earth 2018, 12, 460–484. [Google Scholar] [CrossRef]
- Turco, M.; Herrera, S.; Tourigny, E.; Chuvieco, E.; Provenzale, A. A comparison of remotely-sensed and inventory datasets for burned area in Mediterranean Europe. Int. J. Appl. Earth Obs. Geoinf. 2019, 82, 101887. [Google Scholar] [CrossRef] [Green Version]
- Bistinas, I.; Oom, D.; Sá, A.C.L.; Harrison, S.P.; Prentice, I.C.; Pereira, J.M.C. Relationships between human population density and burned area at continental and global scales. PLoS ONE 2013, 8, e81188. [Google Scholar] [CrossRef] [PubMed]
- Knorr, W.; Kaminski, T.; Arneth, A.; Weber, U. Impact of human population density on fire frequency at the global scale. Biogeosciences 2014, 11, 1085–1102. [Google Scholar] [CrossRef] [Green Version]
- Kaiser, J.; Heil, A.; Andreae, M.; Benedetti, A.; Chubarova, N.; Jones, L.; Morcrette, J.-J.; Razinger, M.; Schultz, M.; Suttie, M. Biomass burning emissions estimated with a global fire assimilation system based on observed fire radiative power. Biogeosciences 2012, 9, 527–554. [Google Scholar] [CrossRef] [Green Version]
- Kuenen, J.J.P.; Visschedijk, A.J.H.; Jozwicka, M.; Denier van der Gon, H.A.C. TNO-MACC_II emission inventory; a multi-year (2003–2009) consistent high-resolution European emission inventory for air quality modelling. Atmos. Chem. Phys. 2014, 14, 10963–10976. [Google Scholar] [CrossRef] [Green Version]
- Aleksankina, K.; Heal, M.R.; Dore, A.J.; Van Oijen, M.; Reis, S. Global sensitivity and uncertainty analysis of an atmospheric chemistry transport model: The FRAME model (version 9.15.0) as a case study. Geosci. Model Dev. 2018, 11, 1653–1664. [Google Scholar] [CrossRef] [Green Version]
- Hu, L.; Keller, C.A.; Long, M.S.; Sherwen, T.; Auer, B.; Da Silva, A.; Nielsen, J.E.; Pawson, S.; Thompson, M.A.; Trayanov, A.L. Global simulation of tropospheric chemistry at 12.5 km resolution: Performance and evaluation of the GEOS-Chem chemical module (v10-1) within the NASA GEOS Earth system model (GEOS-5 ESM). Geosci. Model Dev. 2018, 11, 4603–4620. [Google Scholar] [CrossRef] [Green Version]
- Morisette, J.T.; Baret, F.; Liang, S. Special issue on global land product validation. IEEE Trans. Geosci. Remote Sens. 2006, 44, 1695–1697. [Google Scholar] [CrossRef] [Green Version]
- Cohen, W.B.; Yang, Z.; Kennedy, R. Detecting trends in forest disturbance and recovery using yearly Landsat time series: 2. TimeSync—Tools for calibration and validation. Remote Sens. Environ. 2010, 114, 2911–2924. [Google Scholar] [CrossRef]
- Kennedy, R.E.; Yang, Z.; Cohen, W.B. Detecting trends in forest disturbance and recovery using yearly Landsat time series: 1. LandTrendr—Temporal segmentation algorithms. Remote Sens. Environ. 2010, 114, 2897–2910. [Google Scholar] [CrossRef]
- Gallego, F.J. Stratified sampling of satellite images with a systematic grid of points. ISPRS J. Photogramm. Remote Sens. 2005, 59, 369–376. [Google Scholar] [CrossRef]
- Dinerstein, E.; Olson, D.; Joshi, A.; Vynne, C.; Burgess, N.D.; Wikramanayake, E.; Hahn, N.; Palminteri, S.; Hedao, P.; Noss, R.; et al. An Ecoregion-Based Approach to Protecting Half the Terrestrial Realm. BioScience 2017, 67, 534–545. [Google Scholar] [CrossRef] [PubMed]
- Padilla, M.; Stehman, S.V.; Chuvieco, E. Validation of the 2008 MODIS-MCD45 global burned area product using stratified random sampling. Remote Sens. Environ. 2014, 144, 187–196. [Google Scholar] [CrossRef]
- Padilla, M.; Olofsson, P.; Stehman, S.V.; Tansey, K.; Chuvieco, E. Stratification and sample allocation for reference burned area data. Remote Sens. Environ. 2017, 203, 240–255. [Google Scholar] [CrossRef]
- Bastarrika, A.; Alvarado, M.; Artano, K.; Martinez, M.; Mesanza, A.; Torre, L.; Ramo, R.; Chuvieco, E. BAMS: A Tool for Supervised Burned Area Mapping Using Landsat Data. Remote Sens. 2014, 6, 12360–12380. [Google Scholar] [CrossRef] [Green Version]
- Franquesa, M.; Lizundia-Loiola, J.; Stehman, S.V.; Chuvieco, E. Using long temporal reference units to assess the spatial accuracy of global satellite-derived burned area products. Remote Sens. Environ. 2021. in review. [Google Scholar]
- Congalton, R.G. A review of assessing the accuracy of classifications of remotely sensed data. Remote Sens. Environ. 1991, 37, 35–46. [Google Scholar] [CrossRef]
- Stehman, S.V.; Foody, G.M. Key issues in rigorous accuracy assessment of land cover products. Remote Sens. Environ. 2019, 231, 111199. [Google Scholar] [CrossRef]
- Dice, L.R. Measures of the Amount of Ecologic Association Between Species. Ecology 1945, 26, 297–302. [Google Scholar] [CrossRef]
- Padilla, M.; Stehman, S.V.; Hantson, S.; Oliva, P.; Alonso-Canas, I.; Bradley, A.; Tansey, K.; Mota, B.; Pereira, J.M.; Chuvieco, E. Comparing the Accuracies of Remote Sensing Global Burned Area Products using Stratified Random Sampling and Estimation. Remote Sens. Environ. 2015, 160, 114–121. [Google Scholar] [CrossRef] [Green Version]
- Boschetti, L.; Roy, D.P.; Justice, C.O.; Giglio, L. Global assessment of the temporal reporting accuracy and precision of the MODIS burned area product. Int. J. Wildland Fire 2010, 19, 705–709. [Google Scholar] [CrossRef]
- Campagnolo, M.L.; Libonati, R.; Rodrigues, J.A.; Pereira, J.M.C. A comprehensive characterization of MODIS daily burned area mapping accuracy across fire sizes in tropical savannas. Remote Sens. Environ. 2021, 252, 112115. [Google Scholar] [CrossRef]
- Schroeder, W.; Giglio, L. Visible Infrared Imaging Radiometer Suite (VIIRS) 375 m & 750 m Active Fire Products, Product User’s Guide Version 1.4. 2018. Available online: https://viirsland.gsfc.nasa.gov/PDF/VIIRS_activefire_User_Guide.pdf (accessed on 21 October 2021).
- Chuvieco, E.; Lizundia-Loiola, J.; Pettinari, M.L.; Ramo, R.; Padilla, M.; Tansey, K.; Mouillot, F.; Laurent, P.; Storm, T.; Heil, A. Generation and analysis of a new global burned area product based on MODIS 250 m reflectance bands and thermal anomalies. Earth Syst. Sci. Data 2018, 10, 2015–2031. [Google Scholar] [CrossRef] [Green Version]
- Chuvieco, E.; Yue, C.; Heil, A.; Mouillot, F.; Alonso-Canas, I.; Padilla, M.; Pereira, J.M.; Oom, D.; Tansey, K. A new global burned area product for climate assessment of fire impacts. Glob. Ecol. Biogeogr. 2016, 25, 619–629. [Google Scholar] [CrossRef] [Green Version]
- Giglio, L.; Boschetti, L.; Roy, D.P.; Humber, M.L.; Justice, C.O. The Collection 6 MODIS burned area mapping algorithm and product. Remote Sens. Environ. 2018, 217, 72–85. [Google Scholar] [CrossRef] [PubMed]
- Roy, D.P.; Boschetti, L.; Justice, C.O. The collection 5 MODIS burned area product—Global evaluation by comparison with the MODIS active fire product. Remote Sens. Environ. 2008, 112, 3690–3707. [Google Scholar] [CrossRef]
- Hall, J.V.; Loboda, T.V.; Giglio, L.; McCarty, G.W. A MODIS-based burned area assessment for Russian croplands: Mapping requirements and challenges. Remote Sens. Environ. 2016, 184, 506–521. [Google Scholar] [CrossRef] [Green Version]
- Zhu, C.; Kobayashi, H.; Kanaya, Y.; Saito, M. Size-dependent validation of MODIS MCD64A1 burned area over six vegetation types in boreal Eurasia: Large underestimation in croplands. Sci. Rep. 2017, 7, 4181. [Google Scholar] [CrossRef] [PubMed]
- Boschetti, L.; Roy, D.P.; Giglio, L.; Huang, H.; Zubkova, M.; Humber, M.L. Global validation of the collection 6 MODIS burned area product. Remote Sens. Environ. 2019, 235, 111490. [Google Scholar] [CrossRef] [PubMed]
- Ramo, R.; Roteta, E.; Bistinas, I.; van Wees, D.; Bastarrika, A.; Chuvieco, E.; van der Werf, G.R. African burned area and fire carbon emissions are strongly impacted by small fires undetected by coarse resolution satellite data. Proc. Natl. Acad. Sci. USA 2021, 118, e2011160118. [Google Scholar] [CrossRef] [PubMed]
- McCarty, J.L.; Korontzi, S.; Justice, C.O.; Loboda, T. The spatial and temporal distribution of crop residue burning in the contiguous United States. Sci. Total Environ. 2009, 407, 5701–5712. [Google Scholar] [CrossRef]
- Randerson, J.; Chen, Y.; Werf, G.; Rogers, B.; Morton, D. Global burned area and biomass burning emissions from small fires. J. Geophys. Res. Biogeosci. (2005–2012) 2012, 117, G040012. [Google Scholar] [CrossRef]
- Benali, A.; Mota, B.; Carvalhais, N.; Oom, D.; Miller, L.M.; Campagnolo, M.L.; Pereira, J.M.C. Bimodal fire regimes unveil a global-scale anthropogenic fingerprint. Glob. Ecol. Biogeogr. 2017, 26, 799–811. [Google Scholar] [CrossRef]
- Vadrevu, K.P.; Lasko, K.; Giglio, L.; Schroeder, W.; Biswas, S.; Justice, C. Trends in Vegetation fires in South and Southeast Asian Countries. Sci. Rep. 2019, 9, 7422. [Google Scholar] [CrossRef] [PubMed]
- Liu, T.; Crowley, M.A. Detection and impacts of tiling artifacts in MODIS burned area classification. IOP SciNotes 2021, 2, 014003. [Google Scholar] [CrossRef]
- Giglio, L.; Kendall, J.D.; Mack, R. A multi-year active fire dataset for the tropics derived from the TRMM VIRS. Int. J. Remote Sens. 2003, 24, 4505–4525. [Google Scholar] [CrossRef]
- Campagnolo, M.L.; Oom, D.; Padilla, M.; Pereira, J.M.C. A patch-based algorithm for global and daily burned area mapping. Remote Sens. Environ. 2019, 232, 111288. [Google Scholar] [CrossRef]
- Xu, W.; Wooster, M.J.; He, J.; Zhang, T. First study of Sentinel-3 SLSTR active fire detection and FRP retrieval: Night-time algorithm enhancements and global intercomparison to MODIS and VIIRS AF products. Remote Sens. Environ. 2020, 248, 111947. [Google Scholar] [CrossRef]
- Lizundia-Loiola, J.; Franquesa, M.; Boettcher, M.; Kirches, G.; Pettinari, M.L.; Chuvieco, E. C3SBA10: OLCI C3S Burned Area v1.0. Clim. Data Store 2020. [Google Scholar] [CrossRef]
- Franquesa, M.; Vanderhoof, M.K.; Stavrakoudis, D.; Gitas, I.; Roteta, E.; Padilla, M.; Chuvieco, E. BARD: A global and regional validation burned area database, V5. e-cienciaDatos 2020. [Google Scholar] [CrossRef]
Publisher’s Note: MDPI stays neutral with regard to jurisdictional claims in published maps and institutional affiliations. |
© 2021 by the authors. Licensee MDPI, Basel, Switzerland. This article is an open access article distributed under the terms and conditions of the Creative Commons Attribution (CC BY) license (https://creativecommons.org/licenses/by/4.0/).

