Abstract
The purpose of this study was to evaluate the applicability of medium and long-term satellite rainfall estimation (SRE) precipitation products for drought monitoring over mainland China. Four medium and long-term (19 a) SREs, i.e., the Tropical Rainfall Measuring Mission (TRMM) Multi-Satellite Precipitation Analysis (TMPA) 3B42V7, the Integrated Multi-satellitE Retrievals for Global Precipitation Measurement V06 post-real time Final Run precipitation products (IMF6), Global Rainfall Map in Near-real-time Gauge-calibrated Rainfall Product (GSMaP_Gauge_NRT) for product version 6 (GNRT6) and gauge-adjusted Global Satellite Mapping of Precipitation V6 (GGA6) were considered. The accuracy of the four SREs was first evaluated against ground observation precipitation data. The Standardized Precipitation Evapotranspiration Index (SPEI) based on four SREs was then compared at multiple temporal and spatial scales. Finally, four typical drought-influenced regions, i.e., the Northeast China Plain (NEC), Huang-Huai-Hai Plain (3HP), Yunnan–Guizhou Plateau (YGP) and South China (SC) were chosen as examples to analyze the ability of four SREs to capture the temporal and spatial changes of typical drought events. The results show that compared with GNRT6, the precipitation estimated by GGA6, IMF6 and 3B42V7 are in better agreement with the ground observation results. In the evaluation using SPEI, the four SREs performed well in eastern China but have large uncertainty in western China. GGA6 and IMF6 perform superior to GNRT6 and 3B42V7 in estimating SPEI and identifying typical drought events and behave almost the same. In general, GPM precipitation products have great potential to substitute TRMM precipitation products for drought monitoring. Both GGA6 and IMF6 are suitable for historical drought analysis. Due to the shorter time latency of data release and good performance in the eastern part of mainland China, GNRT6 and GGA6 might play a role for near real-time drought monitoring in the area. The results of this research will provide reference for the application of the SREs for drought monitoring in the GPM era.
1. Introduction
Drought is one of the natural disasters with the highest frequency and the most extensive impact, which has a huge impact on society, agriculture and economy [1,2,3,4]. Affected by climate change and global warming, precipitation patterns and hydrological cycles have undergone drastic changes [5,6,7,8] and the frequency of droughts on a global scale has also shown an increasing trend in recent decades [9,10,11]. Therefore, there is an urgent need to develop more accurate and effective drought monitoring and forecasting methods.
Previous studies usually divided droughts into four types: meteorological drought (insufficient precipitation), hydrological drought (insufficient surface or groundwater flow), agricultural drought (insufficient soil moisture) and socioeconomic drought (depleted water resources) [12,13,14]. Drought monitoring generally relies on data from surface meteorological observation sites. However, due to the sparse and uneven spatial distribution of regional meteorological sites, it is difficult to meet the monitoring requirements [15]. With the rapid development of remote sensing technology, the emergence of satellite precipitation products has changed the temporal–spatial distribution and efficiency of precipitation mapping and drought monitoring [16,17,18,19]. Among the many satellite rainfall estimate (SRE) precipitation products, the TMPA (Tropical Rainfall Measuring Mission (TRMM) Multi-Satellite Precipitation Analysis), released by National Aeronautics and Space [20], is one of the most widely used satellite precipitation products with the best comprehensive performance. Numerous research results show that the latest 3B42V7 product has a precision equivalent to that of ground station observation data on a monthly scale [21,22,23,24]. Although the observation history of this precipitation product is less than 30 years (the data record length generally required to study drought), some studies have proved that it still has great potential in drought monitoring [25,26,27,28,29]. As the successor of TRMM, the Global Precipitation Measurement (GPM) Core Observatory was launched in February 2014 by a joint effort of NASA and the Japan Aerospace Exploration Agency (JAXA). Compared with the TMPA product, the Level-3 product provided by the Integrated Multi-satellitE Retrievals for GPM (IMERG) and the Global Satellite Mapping of Precipitation (GSMaP) product have higher spatial and temporal resolution (half hour and 0.1° × 0.1°) [30,31]. A large number of evaluation results show that GPM precipitation products have higher accuracy and applicability than previous satellite precipitation products and can better reflect the temporal and spatial characteristics of precipitation [32,33,34,35]. Owing to the late start of GPM, its application in drought monitoring is limited. However, the latest Version 6 release of IMERG fused the early precipitation estimates collected in 2000–2014 during the operation of the TRMM satellite with more recent precipitation estimates collected during operation of the GPM satellite, which broke the previous restrictions. At the same time, the Japan Aerospace Exploration Agency (JAXA) also released the Global Rainfall Map in Near-real-time Gauge-calibrated Rainfall Product (GSMaP_Gauge_NRT) for product version 6 (GNRT6), with a period from 1 April 2000 to present, and the Gauge-calibrated Reanalysis Product (GSMaP_Gauge_RNL) for the past period from March 2000 to February 2014, which also provided the possibility to study drought. In addition, these GPM products above are still less used in drought monitoring research.
Drought index is the basis and core of drought monitoring and research, which contains a clear physical mechanism [36]. The common indices used to identify and quantify drought are the Standardized Precipitation Index (SPI), the Palmer Drought Severity Index (PDSI) and the Standardized Precipitation Evapotranspiration Index (SPEI). The SPI [37] is widely used in many drought studies because it has the advantages of simple calculation and time flexibility and can better reflect the beginning, end, duration and intensity of drought. However, because it only considers precipitation as a single factor index and ignores the influence of other meteorological factors and the duration of early drought on the degree of late drought, the SPI has some limitations in practical application. On the contrary, the PDSI [38] considers not only precipitation but also evapotranspiration, runoff and soil moisture, which are comparable in time and space. However, there are also some problems in PDSI, such as a too complicated calculation, too high data requirements and lack of multi-scale. In response, Wells and Goddard [39] established the self-calibrating PDSI (scPDSI), which significantly improves the spatial comparability of PDSI and makes it more reasonable to monitor extreme drought and flood events. Subsequently, Vicente-Serrano et al. [40] proposed the SPEI, which not only combines the sensitivity of the PDSI to evaporation changes but also has the characteristics of simple calculation and multi-time scales of the SPI. The SPEI should be given priority when monitoring global-warming-enhanced macroscale droughts [32,33,34,35].
Some recent studies have evaluated the adaptability of TRMM and GPM precipitation products in drought monitoring [25,27,41,42]. For instance, Sahoo et al. [25] found that TMPA 3B42V7 with short-term records can temporally and spatially identify drought events. Wei et al. [42] found the IMERGE Final Run precipitation product has perfect capabilities in drought monitoring over mainland China. Tashima et al. [43] found that the SPI derived from GNRT6 can better detect short-term (1 to 3 months) drought. However, the application of consolidated products of GSMaP (standard product combined with reanalysis product) for drought monitoring has not been confirmed comprehensively, which hinders its development in different fields.
The geographical and climatic conditions of mainland China are complex, and the distribution of precipitation is uneven at temporal and spatial scales, which has led to frequent drought events in recent decades [44]. For instance, drought events in North China have been increasing in the past 30 years [45]. In addition, extreme droughts have even appeared in some southern humid regions. For example, the drought of southwest China during 2009–2010 and the drought in the middle and lower reaches of the Yangtze River in 2011 caused huge losses to the local economy and society [46]. SREs with wider coverage are highly qualified to make up for the shortage of using precipitation data from uneven and sparse meteorological stations for drought monitoring in mainland China, which often suffers from drought disasters. Although the effectiveness of some SREs for drought monitoring in mainland China has been evaluated, for example, Guo et al. [47], Xu et al. [26] and Wei et al. [42] found that while PERSIANN-CDR, MSWEP V2.1 and IMERG V06 can be used for drought monitoring in eastern China, most studies use SPI only, which is the drought index that does not consider evapotranspiration. Despite that, evapotranspiration has recently begun to be considered in some studies, such as Jiang et al. [41] who used SPEI considering evapotranspiration to evaluate the effectiveness of IMERG V06 Three Runs precipitation products for drought monitoring in mainland China. Nevertheless, there is no comparison of the ability of typical TRMM and GPM precipitation products to identify drought events. Thus, it is of urgent significance to comprehensively evaluate and compare the performance of typical TRMM and GPM precipitation products, including merged products of GSMaP, when calculating the drought index considering global warming involving evapotranspiration over mainland China.
Based on the above considerations, the primary objective of this study is to evaluate the applicability and performance of four medium and long-term SREs (i.e., GNRT6, GGA6, IMF6 and 3B42V7, which all have been calibrated) in calculating SPEI across mainland China. More precisely, there are two questions we need to answer: (1) is the drought-monitoring performance of the GGA6 and IMF6 products better than the other two products and which is best; and (2) does the GNRT6 product in operation have sufficient potential for real-time monitoring of drought. The first question is reasonable since GGA6 and IMF6 products are considered to be the ultimate products of GPM compared with GNRT6 and perform better than 3B42V7 in precipitation estimation generally. It is also meaningful to address the second question for the reason that there is a delay of several days or months before GGA6 and IMF6 are processed and produced after collecting satellite observation data. Therefore, there are limitations in real-time drought monitoring for them and only real-time or near-real-time products (i.e., GNRT6) can solve the above problems. The flow chart of this research is shown in Figure 1. It is expected that this research can provide a new reference for the application of the SREs for drought monitoring under global warming and climate change.
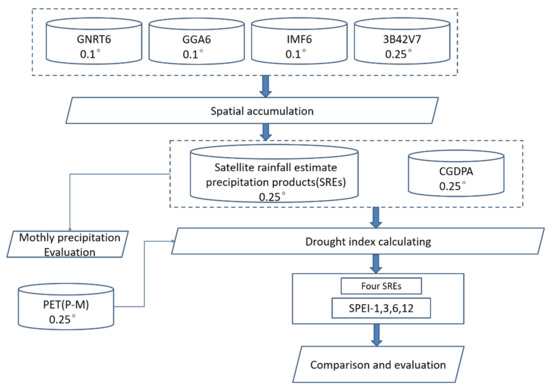
Figure 1.
Flowchart of the study.
2. Study Area and Data
2.1. Study Area
Mainland China (Figure 2) has a complex climate and diverse landforms. According to climates, agriculture and elevation, mainland China could be divided into 9 regions, namely, Northeast China Plain (NEC), northern arid and semiarid region (NAS), Huang-Huai-Hai Plain (3HP), Loess Plateau (LP), Tibetan Plateau (TP), middle-lower Yangtze Plateau (MLY), Sichuan Basin and surrounding regions (SBS), South China (SC) and Yunnan–Guizhou Plateau (YGP). On the whole, the northeast part of mainland China is dominated by a temperate monsoon climate, the northwest part by an arid temperate continental climate, the southeast part by a humid tropical monsoon climate and the Qinghai–Tibetan Plateau by an alpine and plateau climate [48]. The data comes from Geographic Data Sharing Infrastructure, College of Urban and Environmental Science, Peking University (http://geodata.pku.edu.cn (accessed on 5 May 2020)).
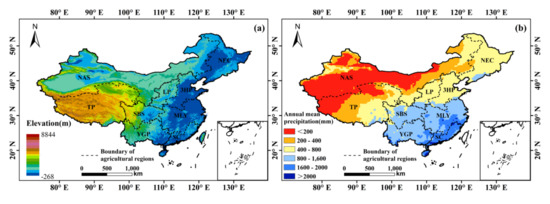
Figure 2.
Spatial pattern of (a) elevation and (b) annual mean precipitation and division of 9 agricultural regions across mainland China. NEC: Northeast China Plain; NAS: northern arid and semiarid region; 3HP: Huang-Huai-Hai Plain; LP: Loess Plateau; TP: Tibetan Plateau; MLY: middle-lower Yangtze Plateau; SBS: Sichuan Basin and surrounding regions; SC: South China; YGP: Yunnan–Guizhou Plateau.
2.2. Gauge Precipitation Observation
The daily data set of China’s surface climate data is generated by strict quality control method based on the data of China’s national ground stations. In this study, the data of 808 weather stations from June 2000 to May 2019 provided by the China National Meteorological Information Center (https://data.cma.cn (accessed on 7 May 2020)) were used to calculate the potential evapotranspiration (PET) data for the calculation of SPEI. The missing data of the data set were reconstructed by using the mean value of the adjacent three sites.
The China Gauge-based Precipitation Daily Analysis (CGDPA) product [49] was another reference data to evaluate the drought monitoring utility of the SREs and calculate SPEI. The CGDPA data from more than 2400 independent weather stations across mainland China are produced through optimized interpolation methods, combined with terrain correction and strict quality control, and therefore has high reliability and accuracy.
2.3. Satellite Rainfall Estimate (SRE) Data
The TMPA products supplied by the National Aeronautics and Space Administration (NASA) [20] are satellite-based precipitation products which are able to estimate quasi-global rainfall (50°N–50°S) with high spatial and temporal resolution (0.25° × 0.25°, 3 h). As the latest version of TRMM data, TRMM 3B42V7 uses the Global Precipitation Climatology Centre (GPCC) gauge precipitation to correct the merged microwave-infrared precipitation adjusted by TRMM to achieve higher accuracy [50]. In this study, TRMM 3B42V7 precipitation data with 3 h was derived for the period 2000–2019 from the website https://trmm.gsfc.nasa.gov/ (accessed on 9 May 2020).
The Global Precipitation Measurement (GPM) mission is the successor to TRMM. As a core part of the GPM, the GPM Core Observatory, which carries a dual-frequency precipitation radar (DPR) and a conical-scanning multichannel GPM Microwave Imager (GMI), was successfully launched on 28 February 2014. This study will focus on the Level-3 product provided by the Integrated Multi-satellitE Retrievals for GPM (IMERG) algorithm. The gauge-adjusted Final Run (with a latency of 2.5 months) daily precipitation product from 2000 to 2019 provided by IMERG, which can be obtained from the Precipitation Measurement Missions website at https://pmm.nasa.gov/data-access/downloads/gpm (accessed on 12 May 2020), was used for drought monitoring.
The “standard product”, “near-real-time product”, “real-time product” and “reanalysis product” make up the GSMaP products in the GPM era. The GNRT6 daily precipitation product from 2000 to 2019, a member of the near-real-time product which is processed 4 h after observations, was used in this study. On the other hand, gauge-adjusted hourly precipitation rate (GA) belongs to the standard product which is processed 3 days after observations. Furthermore, Japanese 55-year reanalysis (JRA55) [51,52] is used as input data to produce reanalysis product (GRG). Kubota et al. [31] found that the differences between the reanalysis and the standard products are small. Hence, the precipitation products with daily (GA and GRG) temporal resolution were merged to GGA6 for long-term (2000–2019) analyses in this study. All products are accessible through the JAXA Global Rainfall Watch website (http://sharaku.eorc.jaxa.jp/GSMaP/ (accessed on 12 May 2020)).
3. Methodology
3.1. Standardized Precipitation Evapotranspiration Index (SPEI)
SPEI is based on the theory of the simple water cycle and considers the drought index of falling water and evapotranspiration in the changing environment [53]. The SPEI calculation process consists of three parts. First, use the improved Penman–Monteith method to calculate the potential evapotranspiration, then compare the difference between the monthly precipitation and the monthly potential evapotranspiration as the SPEI input data and finally calculate the SPEI value by using the frequency value of the 3-parameter log-logistic distribution. In this study, the SPEI is used with the four most commonly used time scales (i.e., 1-, 3-, 6- and 12-month). The drought category of SPEI determined by Vicente-Serrano et al. [40] is shown in Table 1.

Table 1.
Classification used for Standardized Precipitation Evapotranspiration Index (SPEI).
3.2. Statistical Metrics for Evaluation
Six statistical indicators and classification metrics (see Table 2) are used to evaluate the ability of SREs to monitor precipitation and drought in China. Correlation coefficient (CC) is used to characterize the consistency between satellite data and measured data. Relative bias (BIAS), root mean-squared error (RMSE) and mean error (ME) describes the error between them. Probability of detection (POD) and false alarm ratio (FAR) show the ability of satellite data to capture drought events.

Table 2.
Statistical metrics for evaluation used in this study a.
4. Results
4.1. Evaluation and Intercomparison between Four SREs
Figure 3 shows the spatial distribution of the correlation coefficient, relative bias, root mean square error and mean error between SREs and CGDPA from 2000 to 2019. Table 3 lists the correlation coefficient index quantiles between SREs and CGDPA for nine agricultural districts in China (5%, 50%, 95%). It can be clearly seen that the accuracy of IMF6, GGA6 and 3B42V7 is better than that of GNRT6. For IMF6, GGA6 and 3B42V7, except some areas of TP and NAS, the correlation coefficients of other regions are relatively high (CC >0.85), and the relative bias is relatively small (BIAS: −30% to 30%), indicating their high accuracy in these regions. The SREs are easy to overestimate or underestimate the benchmark data in the west of NAS with less precipitation and TP with high altitude. There may be two reasons for this phenomenon. On the one hand, the lack of observation sites in western China has led to high uncertainty in the assessment of SREs in these regions and, on the other hand, the complex terrain, dry climate and fewer weather stations for error correction of SREs might also affect the accuracy of the SREs [27]. The root mean square error in China’s coastal areas is relatively high and gradually decreases towards inland on account of the spatial distribution of precipitation in China (Figure 2b). On the whole, the best consistency is IMF6, followed by GGA6 and then 3B42V7, which is consistent with the results shown in Table 3, except in TP. Although both GNRT6 and GGA6 have undergone correction processing, they use different algorithms where GNRT6 adjusts GSMaP Near-real-time product version 6 (NRT6) using a system model with parameters calculated from data obtained during the past 30 days while GGA6 is adjusted by the NOAA Climate Prediction Center (CPC) global rain gauge data [31], which may be a crucial reason for the relatively low accuracy of GNRT6 especially in the mountainous areas of western China. In addition, it can be seen that compared to the other three seasons, the performance of GNRT6 in winter has significantly decreased (the value of CC decreased from 0.862 in summer to 0.735 in winter) from the seasonal assessment of SREs (Table 4). This may be related to more snow and ice coverage in winter, which will influence the accuracy of PMW-based precipitation [54]. In general, the four SREs showed high accuracy in east China but their accuracy is still uncertain in most areas of west China.
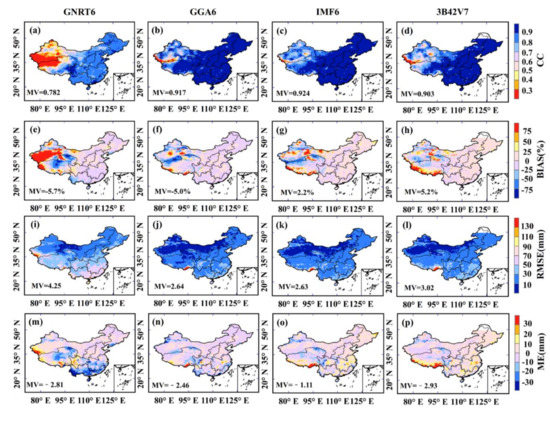
Figure 3.
(a–d) CC, (e–h) BIAS, (i–l) RMSE and (m–p) ME of the four SREs w.r.t in situ observations in June 2000–May 2019.

Table 3.
50% and 95% quantiles of monthly CC and BIAS of the four SREs w.r.t. in situ observations for the nine agricultural regions for 2000–2019.

Table 4.
Seasonal statistics of the four SREs w.r.t in situ observations over Mainland China.
4.2. Comparison of SPEI Estimates from SREs and In Situ Observations
Figure 4, Figure 5, Figure 6, Figure 7 and Figure 8 display the comparison results of SPEI calculated with SREs, CGDPA and station-interpolated PET data (the probability of detection, false alarm ratio and MISS are based on SPEI ≤−0.5 as the condition for determining the occurrence of drought). Distribution metrics (5%, 50% and 95% quantile) of CCs of the SREs for the nine agricultural regions are also listed in Table 5 and Table 6. It can be seen that discrepancies in precipitation spatial patterns are reflected in the SPEI estimates as well by comparing Figure 3 and Figure 4. In addition, as expected, compared to precipitation estimates, the correlations of the SPEI calculated by the four SREs have all decreased (3B42V7 has the largest decline while GGA6 has the smallest) which indicates that the errors and uncertainties of SREs will be amplified when they are propagated to SPEI. The comparison results of GGA6 and IMF6 are of particular interest since the precipitation correlation of IMF6 is higher than that of GGA6, but the SPEI correlation is the opposite result. It indicates that compared to IMF6, the time variability of GGA6 in the SPEI estimate is more consistent with those from CGDPA [25]. On the one hand, there is no doubt that GGA6 and IMF6 have outstanding performance in regional drought monitoring and present similar SPEI spatial pattern, with high CC above 0.8 (low RMSE below 0.7) in eastern China and low CC below 0.3 in the western part. According to the POD (Figure 6), >80% of the drought months observed from the rain gauge observations were also adequately detected by GGA6 and IMF6, except for in NEC, NAS and TP. FAR and MISS of them show a similar spatial pattern with POD, with low values below 0.2 in most areas of China. On the other hand, the results for GNRT6 and 3B42V7 are relatively poor but still show good correlation in eastern China (CC >0.7 and RMSE <0.9 in most parts of eastern China). Compared to GGA6 and IMF6, GNRT6 and 3B42V7 are more likely to miss the drought event and mistake normal conditions for drought events. It should be noted that the drought monitoring results of the four SREs in western China have large uncertainties. In addition, from Figure 4, it can be seen that for all the four SREs, SPEI correlation shows a downward trend as time scale increases in mainland China, which may be caused by the accumulation of systematic errors and random errors of SREs. Overall, GGA6 and IMF6 have shown good utility in drought monitoring in eastern China while they perform poorly in western NAS and TP. GNRT6 and 3B42V7 also hold certain potential to monitor drought conditions in eastern China, but their monitoring results might have more uncertainty.
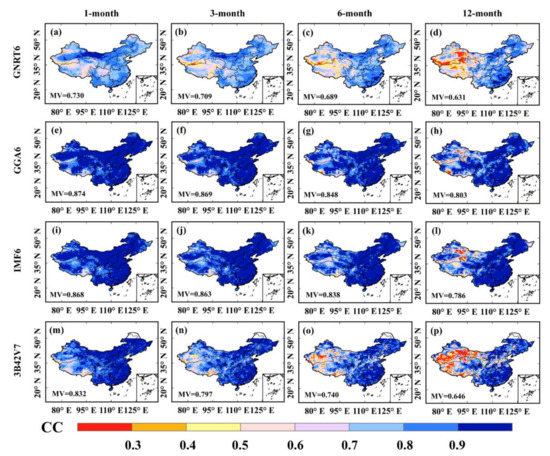
Figure 4.
CC of the (a,e,i,m) 1-, (b,f,j,n) 3-, (c,g,k,o) 6- and (d,h,l,p) 12-month SPEI based on the four SREs w.r.t in situ observations in June 2000–May 2019. Columns for different time scales, rows for different SREs.
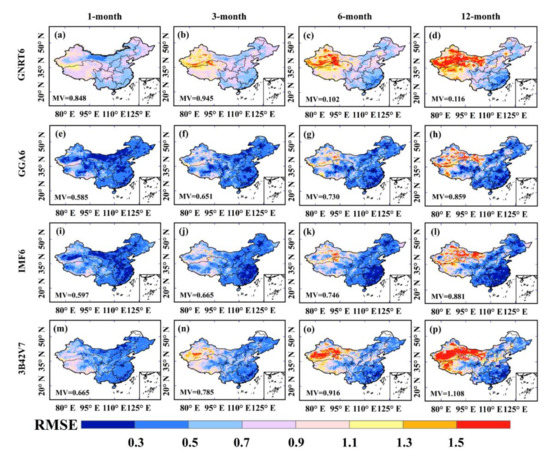
Figure 5.
RMSE of the (a,e,i,m) 1-, (b,f,j,n) 3-, (c,g,k,o) 6- and (d,h,l,p) 12-month SPEI based on the four SREs w.r.t in situ observa-tions in June 2000–May 2019. Columns for different time scales, rows for different SREs.
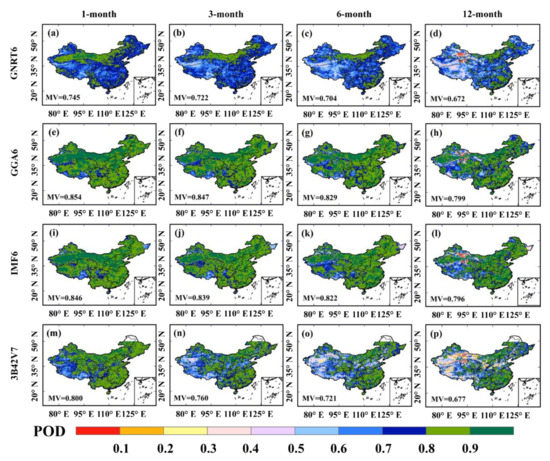
Figure 6.
POD of the (a,e,i,m) 1-, (b,f,j,n) 3-, (c,g,k,o) 6- and (d,h,l,p) 12-month SPEI based on the four SREs w.r.t in situ observa-tions in June 2000–May 2019. Columns for different time scales, rows for different SREs.
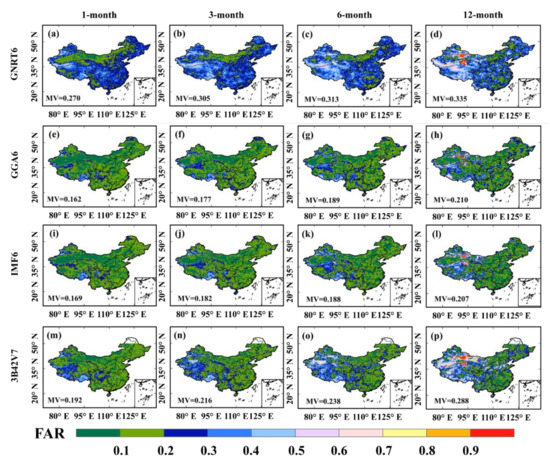
Figure 7.
FAR of the (a,e,i,m) 1-, (b,f,j,n) 3-, (c,g,k,o) 6- and (d,h,l,p) 12-month SPEI based on the four SREs w.r.t in situ observa-tions in June 2000–May 2019. Columns for different time scales, rows for different SREs.
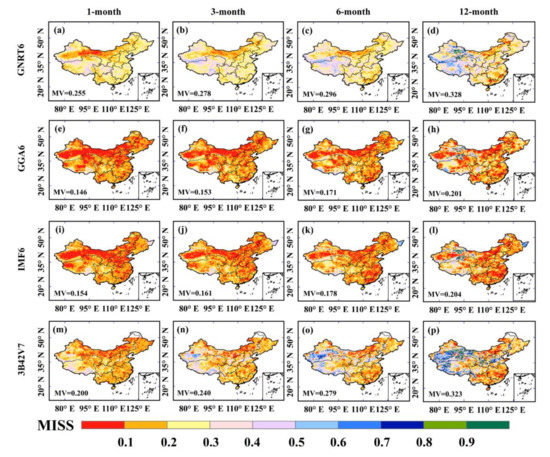
Figure 8.
MISS of the (a,e,i,m) 1-, (b,f,j,n) 3-, (c,g,k,o) 6- and (d,h,l,p) 12-month SPEI based on the four SREs w.r.t in situ observa-tions in June 2000–May 2019. Columns for different time scales, rows for different SREs.

Table 5.
CC of the 1-, 3-, 6- and 12-month SPEI calculated by GNRT6 and GGA6 for the nine agricultural regions. The gray-filled data represents the maximum average CC of the four SREs in the region and time scale.

Table 6.
Same as Table 5 but for IMF6 and 3B42V7.
4.3. Drought Events: Some Case Studies
In order to evaluate the drought spatiotemporal variability of the four SREs, four drought events that occurred in different geographic regions and climate systems were selected, including the drought events from January 2001 to January 2002 in NEC [27], from 2010 to 2011 in 3HP [26], from 2009 to 2010 in YGP [55] and from 2003 to 2004 in SC [56]. First, the choice of NEC and YGP was to analyze the typical severe drought events in the region. Secondly, 3HP, as an important grain producing area in China, was naturally selected as a case study. Finally, SC was chosen since its agricultural production will be severely affected if a drought occurs due to developed economy and large population. In order to better reveal the seasonal drought, three months were selected as the duration of SPEI in the next regional assessment [46].
Figure 9 and Figure 10, respectively, show the time series of the regional average SPEI3 and the ratio of drought area based on the four SREs in the four regions. CCs, RMSEs, PODs and FARs of the regional-averaged SPEI3 are shown in Figure 10. Although some deviations were found in the estimation of the SPEI3 value and the percentage of drought area, the four SREs can accurately identify the start and end times and severity of typical drought events in the four regions. The drought simulation results of GGA6, IMF6 and 3B42V7 in the four regions are very satisfactory. In contrast, GNRT6 has poor consistency with the in situ observation results but it can still identify drought events. The difference between GGA6 and IMF6 is small, and their temporal correlation is better among the four SREs. Figure 11 exhibits temporal CC, RMSE, POD, FAR and MISS of the regional averaged drought indices for the four drought-affected regions. For NEC, GGA6 performs best on the five evaluation indicators. This situation is also applicable to IMF6 in YGP. However, for 3HP and SC, the performance of the two SREs on different evaluation indicators has both advantages and disadvantages. For example, although GGA6 has a higher CC in 3HP, it has higher RMSE, FAR and MISS and lower POD.
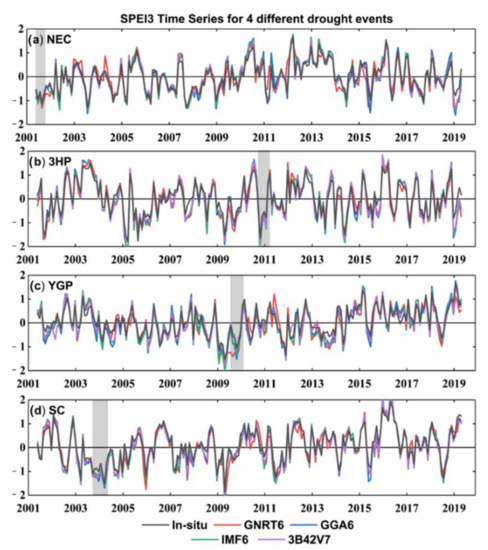
Figure 9.
Time series of regional-averaged SPEI3 of the four typical drought-affected areas((a) NEC, (b) 3HP, (c) YGP and (d) SC) during 2001–2019. Gray backgrounds indicate the period of the typical drought events.
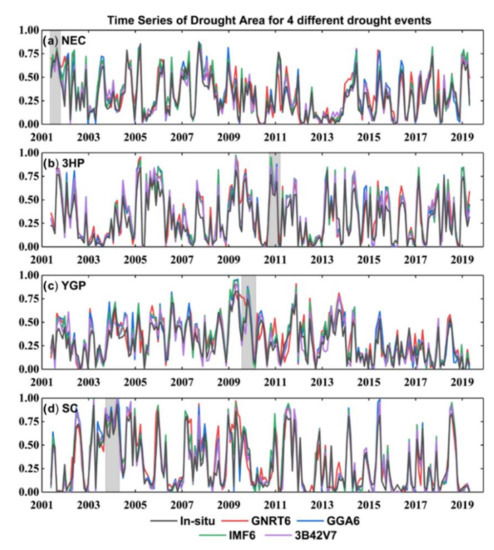
Figure 10.
Time series of ratio of drought area of the four typical drought-affected areas ((a) NEC, (b) 3HP, (c) YGP and (d) SC) during 2001–2019. Gray backgrounds indicate the period of the typical drought events.
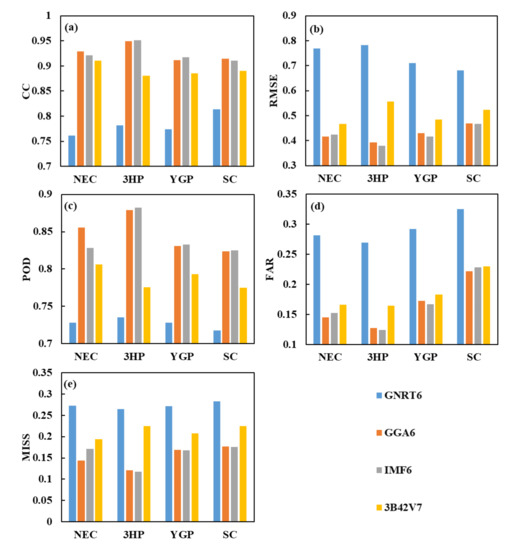
Figure 11.
Temporal (a) CC, (b) RMSE, (c) POD, (d) FAR and (e) MISS of the regional averaged drought indices for the four drought-affected regions.
Spatial maps of SPEI3 for a specific month of four typical drought events are shown in Figure 12. In general, the four SREs can detect four typical drought events. The SPEI3 spatial distribution characteristics of GGA6 and IMF6 in each region are highly consistent with the original observation results. In contrast, 3B42V7 cannot accurately extract the spatial centers and extent of typical drought events in each region, although it performs better on the temporal evaluation of above drought events. It is worth noting that GNRT6 can relatively accurately match the spatial pattern of drought events in four regions.
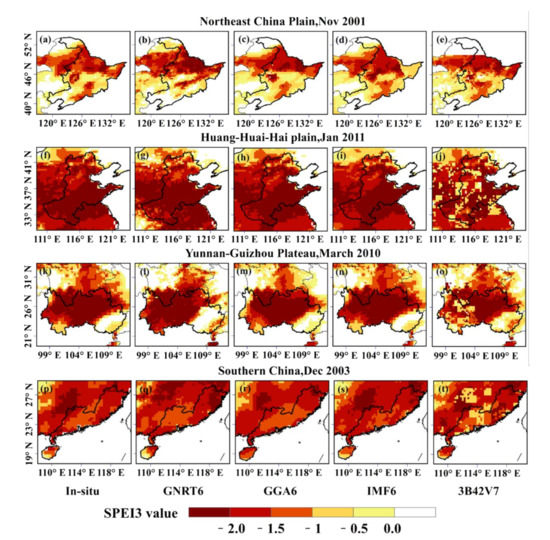
Figure 12.
Spatial pattern of the typical drought events for the four typical drought-affected agricultural regions based on in situ observations (a,f,k,p), GNRT6 (b,g,l,q), GGA6 (c,h,m,r), IMF6(d,i,n,s) and 3B42V7 (e,j,o,t).
5. Discussion
5.1. Influence of the Length of Base Period on SPEI Calculation
Since the SPEI is statistical index based on multi-year series, its reliability is greatly affected by the length of the data [57], although predecessors have analyzed the sensitivity of some drought indices to data length. For example, Sahoo et al. [25] compared the SPI calculated by long-term (31 a) and short-term (10 a) data records and found that the length of the data record has little effect on the calculation of SPI. Ref [27] analyzes the calculation of PDSI based on the data length of long-term (33 a) and short-term (18 a). The results show that it is reasonable to use the precipitation data with 18 a to evaluate the PDSI. Although the sequence length (19 a) of the precipitation product used in this study is longer than previous studies, it may still not meet the requirements, and the influence of the base period length on the SPEI calculation is unclear. Therefore, it is necessary to verify the sensitivity of the results of this study to the length of the base period which is used for calculating the SPEI. We compared the SPEI calculated based on 1981–2019 (38 a) and 2000–2019 (19 a), spatially and temporally, and selected NEC and YGP as drought cases. The results are shown in Figure 13. It can be found that, on the one hand, the SPEIs calculated based on 38 a and 19 a in situ data have a high spatial correlation and, on the other hand, the SPEI time series of 18 a in situ data can accurately match those of 33 a data. These results verify the low sensitivity of the results of the study to the length of base period which encourage us to extend this conclusion to other data sets (such as the GPM products) and regions. At the same time, many droughts and floods occurred in China during the time interval selected in this study, which satisfies the assumption of Sahoo et al. [25] that both normal and extreme events are included in the data recording period. In short, it is reasonable to apply the precipitation data of 19 a to this study.
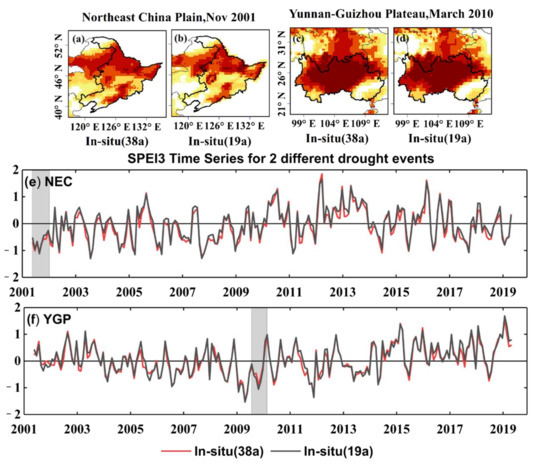
Figure 13.
(e,f) Temporal and (a–d) spatial comparison of the SPEI3 based on the long-term (1981–2019, 38 a) and short-term (2000–2019, 19 a) in situ observations.
5.2. Comparison of the Applicability of Four SREs for Drought Monitoring
Consistent with the findings of Sahoo et al. [25], Zhong et al. [27], Wei et al. [42] and Jiang et al. [41], SREs performed better in areas with high rain gauge density, as their deviations in these areas can be more accurately corrected. As the successor to TRMM, GPM precipitation products (except GNRT6) can better identify drought events in time and space, which was consistent with the findings of Wei et al. (2020). Although the SPEI correlation of GGA6 is higher than that of IMF6 as a whole, the performance of the two needs to be analyzed in detail when the space is gathered on a regional scale. For example, when only the correlation coefficient is considered, the SPEI temporal consistency of GGA6 is higher than that of IMF6 in NAS and TP. The opposite results appear in LP and MLY. Both have advantages and disadvantages in other areas. Taking NEC as an example, the SPEI of GGA shows the higher correlation at 3-, 6- and 12-month, while IMF6 is at 1-month. When the number of evaluation indicators considered increases, the comparison between the two in different regions will show different results. From a spatial perspective, the performance of GPM products is better than TRMM products. Both GGA6 and IMF6 can reveal the spatial pattern of drought events well and behave almost the same.
In this study, we evaluated the applicability of the four SREs for retrospective droughts. However, we often need to monitor droughts in real time or near real time in practical applications. Flash droughts, a type of drought with rapid onset as accompanied by heat waves, have occurred frequently in recent years, including those over the central USA in 2012 [58] and southern China in 2013 [59], bringing a huge threat to the safety of people’s lives and property. GNRT6 and GGA6, with shorter lag time (4 h and 3 days), show better applicability under the background of higher requirements on the lag time of precipitation products and other data put forward by flash drought monitoring.
Above all, GPM precipitation products, with better drought monitoring performance, higher spatial resolution and larger coverage, are able to replace TRMM precipitation products to identify drought events. Both GGA6 and IMF6 are suitable for retrospective historical drought assessment. The data release delays of GNRT6 and GGA6 are acceptable for near-real-time drought monitoring and they can identify drought events in eastern China, which indicates that they might have potential for real-time drought monitoring in this area. However, the near-real-time drought monitoring capabilities of them need to be evaluated at a shorter time scale (weekly to sub-monthly). With the upgrading of products, the application of next-generation products (such as GNRT7 and GGA7) in drought monitoring is expected to be further improved. In addition, Xu et al. [26] found that the integrated precipitation products have great potential for drought monitoring in China. If the standard, real-time and reanalysis precipitation products involved in this study are fused into new products, more reliable drought monitoring results can be obtained, which is also the development direction of future research.
6. Conclusions
This study mainly assessed and compared the drought monitoring applicability of four medium and long-term SREs over mainland China. The four SREs were evaluated based on the in situ observed precipitation from China Meteorological Administration. The SPEI, a widely used drought index which takes into account global warming, was chosen to test the performance of drought monitoring of the four SREs. The main conclusions are summed up as follows:
(1) At a monthly scale, except for some areas of TP and NAS, the precipitation estimates by GGA6, IMF6 and 3B42V7 are highly consistent with observations from ground stations (average CCs are 0.917, 0.924 and 0.903, respectively) and the deviations between them are small (average biases are −5.0%, 2.2% and 5.2%, respectively). The accuracy of GNRT6 is lower than the other three SREs but it still has relatively high consistency (with average CC of 0.782). As the spatial distribution of precipitation in China (Figure 2b) is characterized by a stepwise decrease from the southeast to the west, the RMSE decreases gradually from coastal regions to inland areas. Due to the sparse weather stations and complex terrain, the error of the four SREs in western China is relatively large.
(2) The regional SPEI values of multiple time scales were calculated based on the regional monthly average precipitation and potential evapotranspiration data. In most parts of mainland China, the SPEI values based on the four SREs are in good agreement with those obtained from in situ observations. In general, GGA6 and IMF6 are better than GNRT6 and 3B42V7 in terms of the performance of estimating SPEI. In addition, they present a similar spatial pattern of SPEI that they perform well in eastern China (high CC and POD) but have low correlation in western China. The performance of SPEI values based on the four SREs is better in a short time scale than in a long time scale, which indicates that they are easier to identify droughts caused by short-term precipitation shortage.
(3) Four drought events were selected to evaluate the spatiotemporal variability of four SREs. Generally, all four SREs can identify typical drought events. GGA6 and IMF6 have the best performance with a small difference while 3B42V7 cannot match the spatial pattern of drought events well.
In summary, GGA6 and IMF6 products are superior to GNRT6 and 3B42V7 in detecting drought events and behave almost the same. GGA6 is slightly better with its shorter lag time. GNRT6 has also achieved satisfactory results in detecting drought events in the eastern part of mainland China, indicating that it might have potential for real-time drought monitoring in this area.
Author Contributions
S.C. and W.W. formulated the problem and designed the research; S.C. performed the experiments and wrote the original draft; S.C., W.W. and Z.Y. contributed to the manuscript review and editing; W.W. and Z.Y. provided project administration, resources and funding acquisition. All authors have read and agreed to the published version of the manuscript.
Funding
This work was jointly supported by the National Natural Science Foundation of China (51979071, 51779073), the Distinguished Young Fund Project of Natural Science Foundation of Jiangsu Province (BK20180021), the National “Ten Thousand Program” Youth Talent and the Six Talent Peaks Project in Jiangsu Province.
Institutional Review Board Statement
Not applicable.
Informed Consent Statement
Not applicable.
Data Availability Statement
Not applicable.
Acknowledgments
The data from the China National Meteorological Information Center (https://data.cma.cn (accessed on 7 May 2020)), Tropical Rainfall Measuring Mission (TRMM), Global Precipitation Measurement (GPM) mission and Geographic Data Sharing Infrastructure, College of Urban and Environmental Science, Peking University (http://geodata.pku.edu.cn (accessed on 6 May 2020)), are gratefully acknowledged.
Conflicts of Interest
The authors declare no conflict of interest.
References
- Piao, S.; Ciais, P.; Huang, Y.; Shen, Z.; Peng, S.; Li, J.; Zhou, L.; Liu, H.; Ma, Y.; Ding, Y.; et al. The impacts of climate change on water resources and agriculture in China. Nature 2010, 467, 43–51. [Google Scholar] [CrossRef] [PubMed]
- Sheffield, J.; Wood, E.F.; Roderick, M.L. Little change in global drought over the past 60 years. Nature 2012, 491, 435. [Google Scholar] [CrossRef] [PubMed]
- Damberg, L.; Aghakouchak, A. Global trends and patterns of drought from space. Theor. Appl. Climatol. 2014, 117, 441–448. [Google Scholar] [CrossRef]
- Yao, N.; Li, Y.; Lei, T. Drought evolution, severity and trends in mainland China over 1961–2013. Sci. Total Environ. 2017, 616, 73–89. [Google Scholar] [CrossRef] [PubMed]
- Trenberth, K.E. Changes in precipitation with climate change. Clim. Res. 2011, 47, 123–138. [Google Scholar] [CrossRef] [Green Version]
- Ali, G. Climate change and associated spatial heterogeneity of Pakistan: Empirical evidence using multidisciplinary approach. Sci. Total Environ. 2018, 634, 95–108. [Google Scholar] [CrossRef] [PubMed]
- Yeh, P.J.F.; Wu, C. Recent acceleration of the terrestrial hydrologic cycle in the US Midwest. J. Geophys. Res.-Atmos. 2018, 123, 2993–3008. [Google Scholar] [CrossRef]
- Zhong, R.; He, Y.; Chen, X. Responses of the hydrological regime to variations in meteorological factors under climate change of the Tibetan plateau. Atmos. Res. 2018, 214, 296–310. [Google Scholar] [CrossRef]
- Dai, A. Increasing drought under global warming in observations and models. Nat. Clim. Chang. 2013, 3, 52–58. [Google Scholar] [CrossRef]
- Yu, M.; Li, Q.; Hayes, M.J.; Svoboda, M.D.; Heim, R.R. Are droughts becoming more frequent or severe in China based on the Standardized Precipitation Evapotranspiration Index: 1951–2010? Int. J. Climatol. 2013, 34, 545–558. [Google Scholar] [CrossRef]
- Venkataraman, K.; Tummuri, S.; Medina, A.; Perry, J. 21st century drought outlook for major climate divisions of Texas based on CMIP5 multimodel ensemble: Implications for water resource management. J. Hydrol. 2016, 534, 300–316. [Google Scholar] [CrossRef] [Green Version]
- Mishra, A.K.; Singh, V.P. A review of drought concepts. J. Hydrol. 2010, 391, 202–216. [Google Scholar] [CrossRef]
- Trambauer, P.; Maskey, S.; Werner, M.; Pappenberger, F.; Van, B.; Uhlenbrook, S. Identification and simulation of space-time variability of past hydrological drought events in the Limpopo River basin, southern Africa. Hydrol. Earth Syst. Sci. 2014, 18, 2925–2942. [Google Scholar] [CrossRef] [Green Version]
- Ayantobo, O.O.; Yi, L.; Song, S.; Ning, Y. Spatial comparability of drought characteristics and related return periods in mainland china over 1961–2013. J. Hydrol. 2017, 550, 549–567. [Google Scholar] [CrossRef]
- Cai, Y.; Jin, C.; Wang, A. Comprehensive precipitation evaluation of TRMM 3B42 with dense rain gauge networks in a mid-latitude basin, northeast, China. Theor. Appl. Climatol. 2015, 1, 1–13. [Google Scholar] [CrossRef]
- Islam, M.N.; Uyeda, H. Use of TRMM in determining the climatic characteristics of rainfall over Bangladesh. Remote Sens. Environ. 2007, 108, 264–276. [Google Scholar] [CrossRef]
- Almazroui, M. Calibration of TRMM rainfall climatology over Saudi Arabia during 1998–2009. Atmos. Res. 2011, 99, 400–414. [Google Scholar] [CrossRef]
- Du, L.; Tian, Q.; Yu, T.; Meng, Q.; Jancso, T.; Udvardy, P.; Huang, Y. A comprehensive drought monitoring method integrating MODIS and TRMM data. Int. J. Appl. Earth Obs. Geoinf. 2013, 23, 245–253. [Google Scholar] [CrossRef]
- Zhang, L.; Jiao, W.; Zhang, H.; Huang, C.; Tong, Q. Studying drought phenomena in the Continental United States in 2011 and 2012 using various drought indices. Remote Sens. Environ. 2017, 190, 96–106. [Google Scholar] [CrossRef]
- Huffman, G.J.; Adler, R.F.; Bolvin, D.T.; Gu, G.; Nelkin, E.J.; Bowman, K.P.; Hong, Y.; Stocker, E.F.; Wolff, D.B. The TRMM multisatellite precipitation analysis (TMPA): Quasi-global, multiyear, combined-sensor precipitation estimates at fine scales. J. Hydrometeorol. 2007, 8, 38–55. [Google Scholar] [CrossRef]
- Yong, B.; Ren, L.; Hong, Y.; Wang, J.; Gourley, J.J.; Jiang, S.; Chen, X.; Wang, W. Hydrologic evaluation of Multisatellite Precipitation Analysis standard precipitation products in basins beyond its inclined latitude band: A case study in Laohahe basin, China. Water Resour. Res. 2010, 46, 759–768. [Google Scholar] [CrossRef] [Green Version]
- Hu, Q.; Yang, D.; Wang, Y. Accuracy and spatio-temporal variation of high resolution satellite rainfall estimate over the Ganjiang River Basin. Sci. China 2013, 56, 853–865. [Google Scholar] [CrossRef]
- Tong, K.; Su, F.; Yang, D.; Hao, Z. Evaluation of satellite precipitation retrievals and their potential utilities in hydrologic modeling over the Tibetan Plateau. J. Hydrol. 2014, 519, 423–437. [Google Scholar] [CrossRef]
- Sun, R.; Yuan, H.; Liu, X.; Jiang, X. Evaluation of the latest satellite–gauge precipitation products and their hydrologic applications over the Huaihe River basin. J. Hydrol. 2016, 536, 302–319. [Google Scholar] [CrossRef]
- Sahoo, A.K.; Sheffield, J.; Pan, M.; Wood, E.F. Evaluation of the tropical rainfall measuring mission multi-satellite precipitation analysis (TMPA) for assessment of large-scale meteorological drought. Remote Sens. Environ. 2015, 159, 181–193. [Google Scholar] [CrossRef]
- Xu, Z.; Wu, Z.; He, H.; Wu, X.; Zhou, J.; Zhang, Y.; Guo, X. Evaluating the accuracy of MSWEP V2. 1 and its performance for drought monitoring over mainland China. Atmos. Res. 2019, 226, 17–31. [Google Scholar] [CrossRef]
- Zhong, R.; Chen, X.; Lai, C.; Wang, Z.; Lian, Y.; Yu, H.; Wu, X. Drought monitoring utility of satellite-based precipitation products across mainland China. J. Hydrol. 2019, 568, 343–359. [Google Scholar] [CrossRef]
- Zhu, Q.; Luo, Y.; Zhou, D.; Xu, Y.; Wang, G.; Gao, H. Drought Monitoring Utility using Satellite-Based Precipitation Products over the Xiang River Basin in China. Remote Sens. 2019, 11, 1483. [Google Scholar] [CrossRef] [Green Version]
- Suliman, A.; Awchi, T.A.; Al-Mola, M.; Shahid, S. Evaluation of remotely sensed precipitation sources for drought assessment in Semi-Arid Iraq. Atmos. Res. 2020, 242, 105007. [Google Scholar] [CrossRef]
- Huffman, G.J.; Bolvin, D.T.; Braithwaite, D.; Hsu, K.; Joyce, R.; Xie, P. NASA Global Precipitation Measurement (GPM) Integrated Multi-satellitE Retrievals for GPM (IMERG). In Algorithm Theoretical Basis Document (ATBD) Version 06; NASA/GSFC: Greenbelt, MD, USA, 2019. [Google Scholar]
- Kubota, T.; Aonashi, K.; Ushio, T. Global Satellite Mapping of Precipitation (GSMaP) Products in the GPM Era. Satell. Precip. Meas. 2020, 67, 355–373. [Google Scholar]
- Tang, G.; Zeng, Z.; Long, D.; Guo, X.; Yong, B.; Zhang, W.; Hong, Y. Statistical and Hydrological Comparisons between TRMM and GPM Level-3 Products over a Midlatitude Basin: Is Day-1 IMERG a Good Successor for TMPA 3B42V7? J. Hydrometeorol. 2015, 17, 121–137. [Google Scholar] [CrossRef]
- Tang, G.; Ma, Y.; Long, D.; Zhong, L.; Hong, Y. Evaluation of GPM Day-1 IMERG and TMPA Version-7 legacy products over Mainland China at multiple spatio-temporal scales. J. Hydrol. 2016, 533, 152–167. [Google Scholar] [CrossRef]
- Sahlu, D.; Nikolopoulos, E.; Moges, S.; Anagnostou, E.; Hailu, D. First evaluation of the integrated multi-satellite retrieval for gpm day-1 imerg over the upper blue nile basin. J. Hydrometeorol. 2016, 17, 2875–2882. [Google Scholar] [CrossRef]
- Manz, B.; Páez-Bimos, S.; Horna, N.; Buytaert, W.; Ochoa-Tocachi, B.; Lavado-Casimiro, W. Comparative ground validation of imerg and tmpa at variable spatio-temporal scales in the tropical andes. J. Hydrometeorol. 2017, 18, 2469–2489. [Google Scholar] [CrossRef]
- Keyantash, J.; Dracup, J. The quantification of drought: An evaluation of drought indices. Bull. Am. Meteor. Soc. 2002, 83, 1167–1180. [Google Scholar] [CrossRef]
- McKee, T.B.; Doesken, N.J.; Kleist, J. The relationship of drought frequency and duration to time scales. In Proceedings of the 8th Conference on Applied Climatology, Qingdao, China, 28–31 August 2010; American Meteorological Society: Boston, MA, USA, 1993. [Google Scholar]
- Palmer, W.C. Meteorological Drought; US Department of Commerce, Weather Bureau: Washington, DC, USA, 1965. [Google Scholar]
- Wells, N.; Goddard, S.; Hayes, M.J. A self-calibrating palmer drought severity index. J. Clim. 2004, 17, 2335–2351. [Google Scholar] [CrossRef]
- Vicente-Serrano, S.M.; Begueria, S.; Lopezmoreno, J.I. A multiscalar drought index sensitive to global warming: The standardized precipitation evapotranspiration index. J. Clim. 2010, 23, 1696–1718. [Google Scholar] [CrossRef] [Green Version]
- Jiang, S.; Wei, L.; Ren, L.; Xu, C.Y.; Liu, Y. Utility of integrated IMERG precipitation and GLEAM potential evapotranspiration products for drought monitoring over mainland China. Atmos. Res. 2020, 247, 105141. [Google Scholar] [CrossRef]
- Wei, L.; Jiang, S.; Ren, L.; Zhang, L.; Wang, M.; Duan, Z. Preliminary Utility of the Retrospective IMERG Precipitation Product for Large Scale Drought Monitoring over Mainland China. Remote Sens. 2020, 12, 2993. [Google Scholar] [CrossRef]
- Tashima, T.; Kubota, T.; Mega, T. Precipitation extremes monitoring using the near-real-time GSMaP product. IEEE J. Sel Top. Appl. Earth Obs. Remote Sens. 2020, 13, 5640–5651. [Google Scholar] [CrossRef]
- Lai, C.; Li, J.; Wang, Z.; Wu, X.; Zeng, Z.; Chen, X.; Lian, Y.; Yu, H.; Wang, P.; Bai, X. Drought-induced reduction in net primary productivity across mainland China from 1982 to 2015. Remote Sens. 2018, 10, 1433. [Google Scholar] [CrossRef] [Green Version]
- Wang, H.; Chen, Y.; Pan, Y.; Li, W. Spatial and temporal variability of drought in the arid region of China and its relationships to teleconnection indices. J. Hydrol. 2015, 523, 283–296. [Google Scholar] [CrossRef]
- Xu, K.; Yang, D.; Yang, H.; Li, Z.; Qin, Y.; Shen, Y. Spatio-temporal variation of drought in China during 1961–2012: A climatic perspective. J. Hydrol. 2015, 526, 253–264. [Google Scholar] [CrossRef]
- Guo, H.; Bao, A.; Liu, T.; Chen, S.; Ndayisaba, F. Evaluation of PERSIANN-CDR for Meteorological Drought Monitoring over China. Remote Sens. 2016, 8, 379. [Google Scholar] [CrossRef] [Green Version]
- Li, J.; Wang, Z.; Lai, C.; Wu, X.; Zeng, Z.; Chen, X.; Lian, Y. Response of net primary production to land use and land cover change in mainland China since the late 1980s. Sci. Total Environ. 2018, 639, 237–247. [Google Scholar] [CrossRef] [PubMed]
- Shen, Y.; Xiong, A. Validation and comparison of a new gauge-based precipitation analysis over mainland China. Int. J. Climatol. 2016, 36, 252–265. [Google Scholar] [CrossRef]
- De Jesiis, A.; Brena-Naranjo, J.A.; Pedrozo-Acuna, A.; Alcocer Yamanaka, V.H. The use of TRMM 3B42 product for Drought monitoring in Mexico. Water 2016, 8, 325. [Google Scholar] [CrossRef]
- Kobayashi, S.; Ota, Y.; Harada, Y.; Ebita, A.; Moriya, M.; Onoda, H.; Onogi, K.; Kamahori, H.; Kobayashi, C.; Endo, H.; et al. The JRA-55 reanalysis: General specifications and basic characteristics. J. Meteorol. Soc. Jpn. 2015, 93, 5–48. [Google Scholar] [CrossRef] [Green Version]
- Harada, Y.; Kamahori, H.; Kobayashi, C.; Endo, H.; Kobayashi, S.; Ota, Y.; Onoda, H.; Onogi, K.; Miyaoka, K.; Takahashi, K. The JRA-55 reanalysis: Representation of atmospheric circulation and climate variability. J. Meteorol. Soc. Jpn. 2016, 94, 269–302. [Google Scholar] [CrossRef] [Green Version]
- Beguerıa, S.; Vicente-Serrano, S.; Reig, F.; Latorre, B. Standardized precipitation evapotranspiration index (SPEI) revisited: Parameter fitting, evapotranspiration models, tools, datasets and drought monitoring. Int. J. Climatol. 2014, 34, 3001–3023. [Google Scholar] [CrossRef] [Green Version]
- Tian, Y.; Peters-Lidard, C.D.; Choudhury, B.J.; Garcia, M. Multitemporal analysis of TRMM-based satellite precipitation products for land data assimilation applications. J. Hydrometeorol. 2007, 8, 1165–1183. [Google Scholar] [CrossRef]
- Zhang, W.; Jin, F.; Zhao, J.; Qi, L.; Ren, H. The possible influence of a nonconventional El Niño on the severe autumn drought of 2009 in Southwest China. J. Clim. 2013, 26, 8392–8405. [Google Scholar] [CrossRef]
- Ren, L.; Wei, L.; Jiang, S.; Shi, J.; Yuan, F.; Zhang, L.; Liu, R. Drought monitoring utility assessment of CHIRPS and GLEAM satellite products in China. Trans. CSAE 2019, 35, 146–154. [Google Scholar]
- Wu, H.; Hayes, M.; Wilhite, D. The effect of data length on the standardized precipitation index calculation. Int. J. Climatol. 2005, 25, 505–520. [Google Scholar] [CrossRef] [Green Version]
- Hoerling, M. Causes and predictability of the 2012 Great Plains drought. Bull. Am. Meteor. Soc. 2014, 95, 269–282. [Google Scholar] [CrossRef] [Green Version]
- Mo, K.C.; Lettenmaier, D.P. Heat wave flash droughts in decline. Geophys. Res. Lett. 2015, 42, 2823–2829. [Google Scholar] [CrossRef]
Publisher’s Note: MDPI stays neutral with regard to jurisdictional claims in published maps and institutional affiliations. |
© 2021 by the authors. Licensee MDPI, Basel, Switzerland. This article is an open access article distributed under the terms and conditions of the Creative Commons Attribution (CC BY) license (https://creativecommons.org/licenses/by/4.0/).