Article

BDS Satellite Clock Prediction Considering Periodic Variations

1
College of Intelligent Systems Science and Engineering, Harbin Engineering University, Harbin 150001, China
2
HEU Qingdao Ship Science and Technology Co., Ltd., Qingdao 266400, China
*
Author to whom correspondence should be addressed.
Remote Sens. 2021, 13(20), 4058; https://doi.org/10.3390/rs13204058
Submission received: 10 September 2021 / Revised: 2 October 2021 / Accepted: 6 October 2021 / Published: 11 October 2021
(This article belongs to the Special Issue Applications of Satellite Geodesy for Earth Observation)

Abstract

:
The periodic noise exists in BeiDou navigation satellite system (BDS) clock offsets. As a commonly used satellite clock prediction model, the spectral analysis model (SAM) typically detects and identifies the periodic terms by the Fast Fourier transform (FFT) according to long-term clock offset series. The FFT makes an aggregate assessment in frequency domain but cannot characterize the periodic noise in a time domain. Due to space environment changes, temperature variations, and various disturbances, the periodic noise is time-varying, and the spectral peaks vary over time, which will affect the prediction accuracy of the SAM. In this paper, we investigate the periodic noise and its variations present in BDS clock offsets, and improve the clock prediction model by considering the periodic variations. The periodic noise and its variations over time are analyzed and quantified by short time Fourier transform (STFT). The results show that both the amplitude and frequency of the main periodic term in BDS clock offsets vary with time. To minimize the impact of periodic variations on clock prediction, a time frequency analysis model (TFAM) based on STFT is constructed, in which the periodic term can be quantified and compensated accurately. The experiment results show that both the fitting and prediction accuracy of TFAM are better than SAM. Compared with SAM, the average improvement of the prediction accuracy using TFAM of the 6 h, 12 h, 18 h and 24 h is in the range of 6.4% to 10% for the GNSS Research Center of Wuhan University (WHU) clock offsets, and 11.1% to 14.4% for the Geo Forschungs Zentrum (GFZ) clock offsets. For the satellites C06, C14, and C32 with marked periodic variations, the prediction accuracy is improved by 26.7%, 16.2%, and 16.3% for WHU clock offsets, and 29.8%, 16.0%, 21.0%, and 9.0% of C06, C14, C28, and C32 for GFZ clock offsets.

Graphical Abstract

1. Introduction

The real-time satellite orbit and clock products are indispensable for real-time precise point positioning (RT-PPP) [1]. The ultra-rapid orbit products with sufficient accuracy from MGEX Analysis Centers (ACs) can be used as real-time orbit correction directly [2]. However, the clock offsets are closely related to the satellite atomic clocks in space which can be influenced by many factors, such as external environmental effects that are not corrected by conventional models [3]. It is difficult to grasp the behavior of the satellite clocks accurately. Therefore, analyzing the characteristics of the clock offsets and improving the accuracy of real-time clock offsets is of great importance to RT-PPP [4,5].
For BDS satellites, the domestic atomic clocks are equipped to provide the on-board time reference. BDS-2 satellites are equipped with the rubidium (Rb) atomic clocks, while BeiDou-3 satellites are equipped with the new generation Rb atomic clocks and high-quality hydrogen (H) atomic clocks [6,7]. The BDS real-time clock products can be obtained through the ultra-rapid clock products or the real-time clock corrections. The ultra-rapid clock products are comprised of observation and prediction parts, and the prediction part is available for real-time applications. Limited by the accuracy of clock prediction model, the accuracy of the predicted clock offsets is lower than that of real-time clock corrections calculated based on observation data from global or regional network stations [8]. The real-time clock corrections enable the RT-PPP via internet. Due to a network outage, a disruption in data streaming is inevitable [9], which will interrupt the availability and stability of RT-PPP [10]. In this case, the predicted clock offsets are usually used to maintain the continuity of real-time applications [11]. Therefore, an accurate clock prediction model is of great importance. Currently, some available models, such as a quadratic polynomial model (QPM), spectral analysis model (SAM), grey mode (GM), and autoregressive integrated moving average model (ARIMA) [12,13,14,15], are given for clock prediction. Among them, the QPM is the most basic clock prediction model, modeled with the parameters of the clock offset, clock velocity, and clock drift, and intuitively reflects the physical characteristics of satellite clocks [16,17]. However, the QPM ignores the periodic noise, which presents in clock offsets [18,19]. Some studies attribute the periodic noise to the factors such as orbit determination errors, temperature variations, and perturbation errors [20,21]. The SAM, composed of quadratic polynomial and periodic terms, improves the prediction accuracy of the QPM by compensating the periodic noise, and is widely used to obtain ultra-rapid clock products [22,23,24]. To further improve the prediction accuracy of SAM, different numbers of periodic term and different length of fitting period used in SAM are evaluated. The evaluated results show that the optimal number and length vary with the clock type and its in-orbit performance [25]. The remaining nonlinear system errors in SAM residuals are modeled and compensated by the Back Propagation (BP) neural network, and the accuracy of 24 h predicted clock offsets is around 4 ns [26]. For the SAM, the compensation effect of periodic noise directly affects the fitting and prediction accuracy. Therefore, the accurate periodic terms are the prerequisite for the SAM. The FFT is usually used to extract periodic terms from the clock offsets. For good frequency resolution, long-term clock offset series are applied for FFT, such as 60-day, 100-day, and even one year [25,26,27]. However, due to space environment changes, temperature variations, and various disturbances, the periodic noise is time-varying [28]. The time-varying performance of GPS satellites based on the clock products of the International GNSS Service (IGS) is characterized, and the results show that the amplitudes of periodic terms vary with the eclipse seasons, and there is a relationship between the periodic noise and orbit dynamics [29]. The Galileo satellite clock offsets have a similar performance. A detailed time-varying analysis of the first two significant periodic terms is carried out for Galileo satellites based on the European Space Agency (ESA) clock products, and confirms that amplitude variations of the first periodic term affected by eclipse seasons, and the amplitude sinusoidal variations of second periodic term related to the J2 relativistic effect [30]. Studies show that the BDS periodic terms have some distinction between the GPS and Galileo, but similar variations of the periodic variations have been found in the BDS satellite clock offsets [31]. Considering that the FFT cannot characterize the periodic variations of the clock offsets in time domain [32], the periodic terms obtained by FFT may have certain deviations. In this case, the accuracy of the SAM will be affected, and it is necessary to quantify the periodic terms more accurately.
In this paper, we investigate the periodic variations of BDS satellites clock offsets based on the clock products from WHU and GFZ. To obtain more periodic variation details, the STFT is used, and the results are compared with FFT. The time-varying amplitude and frequency of the periodic terms in BDS satellite clock offsets are detected through STFT. Awareness of periodic variations can be used to improve the clock prediction model, we proposed a time frequency analysis model (TFAM), and the fitting performance as well as prediction performance are evaluated.
The following section is arranged as follows. First, the periodic variations of the BDS satellite clock offsets are characterized and analyzed, and the TFAM considering periodic variations is proposed in Section 2. Then, the fitting and prediction performance of the proposed TFAM are evaluated and compared with that of the SAM in Section 3. The discussions are given in Section 4. Finally, the conclusions are summarized in Section 5.

2. Materials and Methods

In this section, the periodic variations of BDS satellite clock offsets are characterized and analyzed, and the TFAM considering periodic variations is proposed. In order to obtain the clean clock offsets, a preprocessing step is implemented. This paper introduces a double median absolute deviation (MAD) detection method, which can distinguish the gross errors and phase jumps effectively. After preprocessing, the amplitude spectrums based on different FFT lengths are compared, and the limitation of FFT in analyzing the time-varying periodic noise is discussed. To fully analyze the periodic variations, the QPM fitting residuals in the time domain, the spectrum analysis results in frequency domain, and the time-frequency analysis results in time and frequency domain of three constellation satellites are given. By time-frequency analysis of STFT, the periodic variations of BDS satellite clock offsets are characterized, and the relationships between the periodic variations and sun elevation angle above the orbit plane (β angle) are investigated. After that, the frequency variations of the main periodic term are analyzed in detail. Finally, the clock prediction model is modified by taking into account the periodic variations of clock offsets, and the TFAM is proposed.

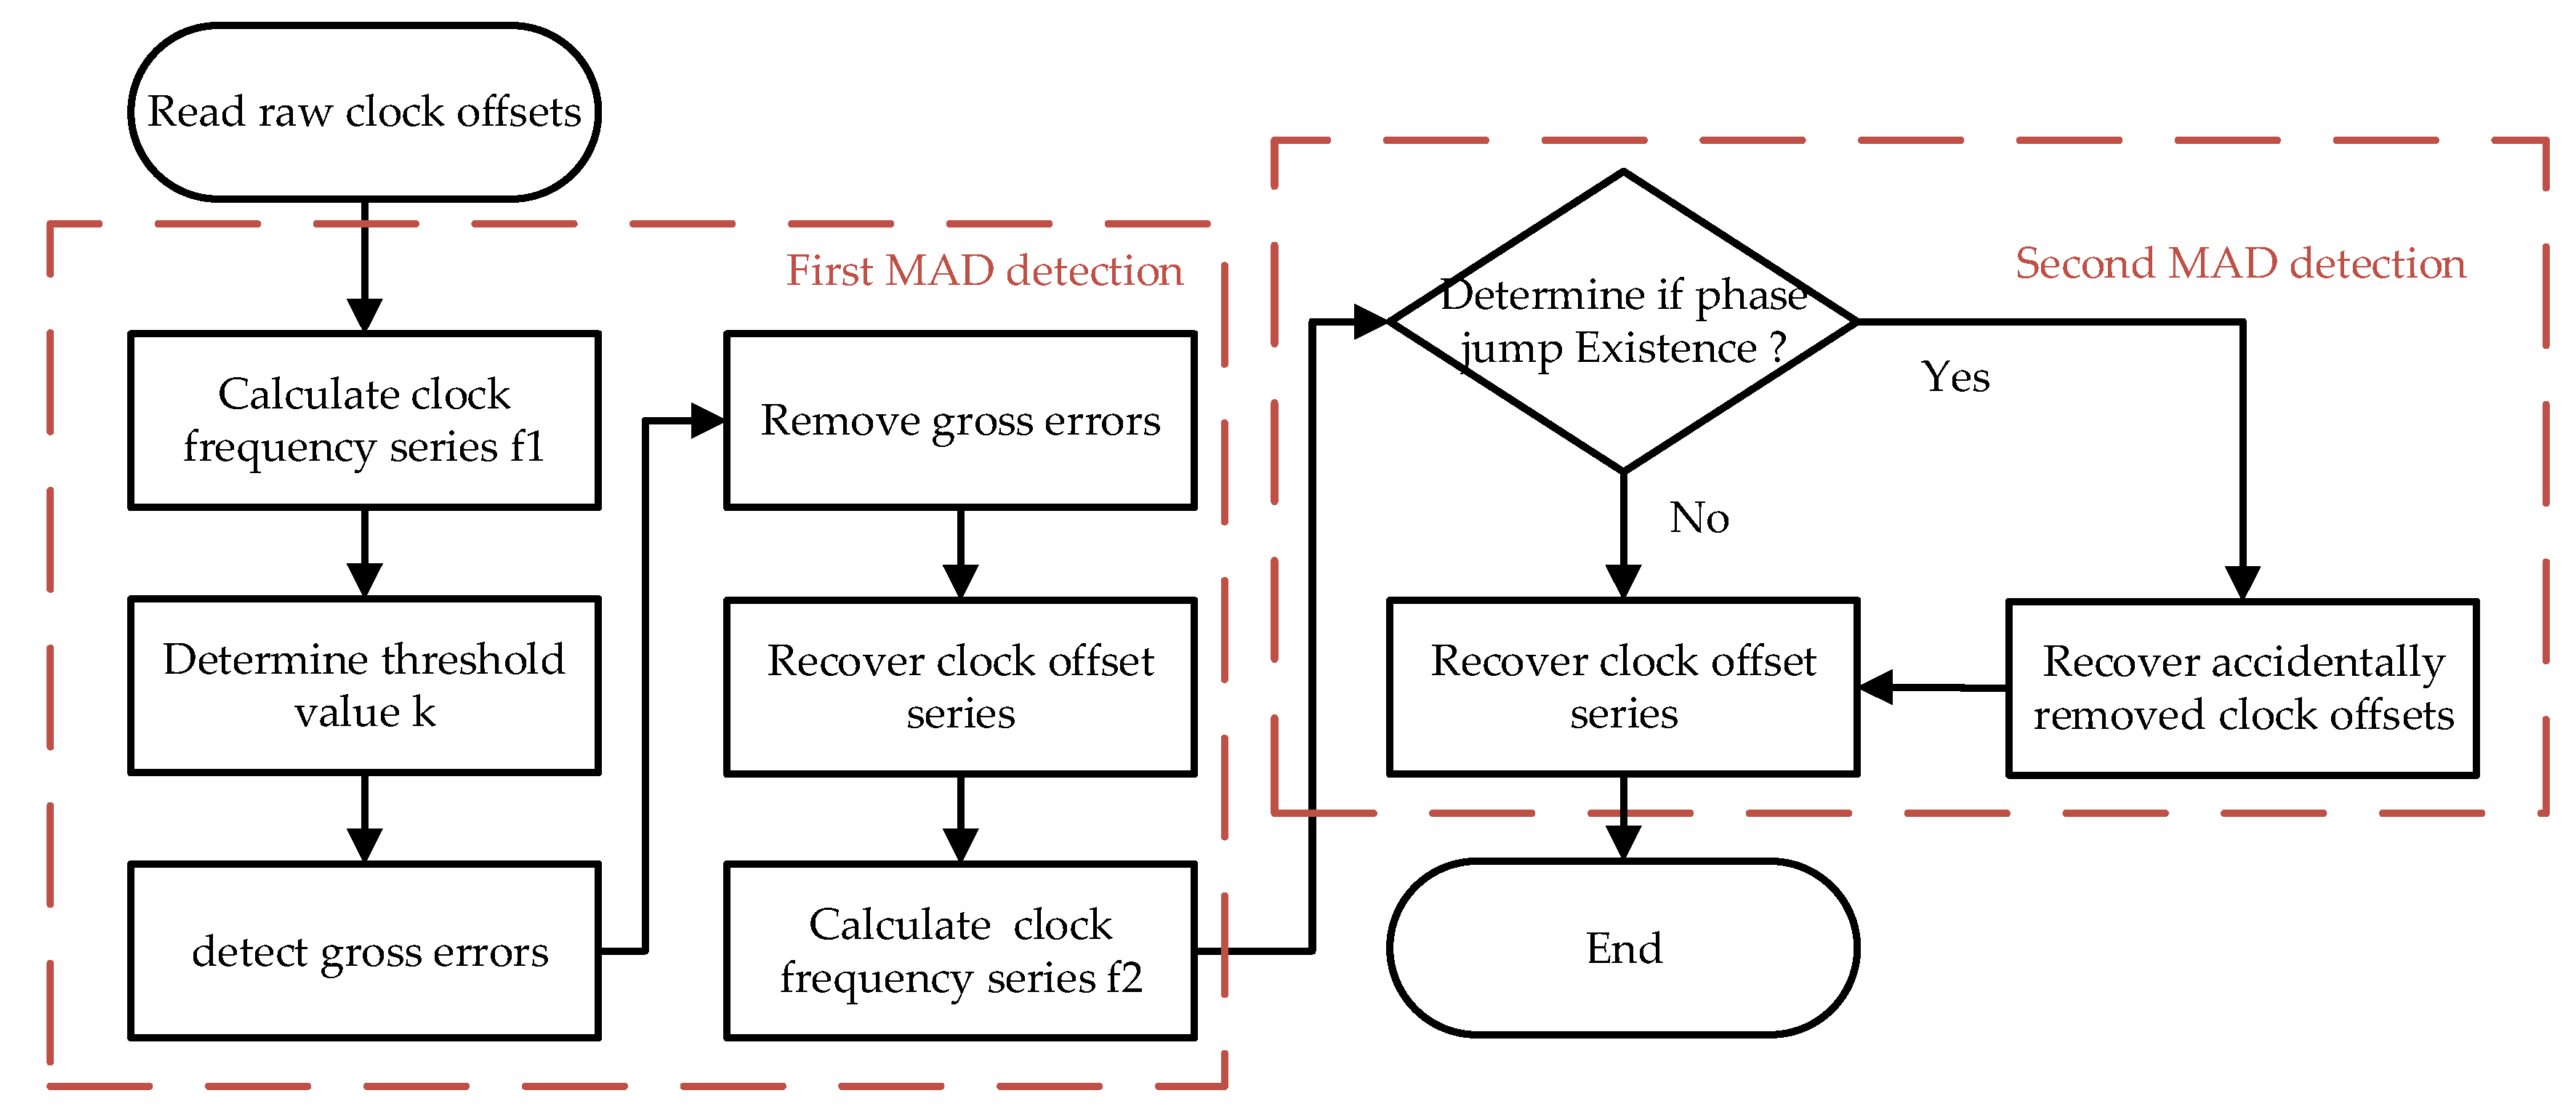
2.1. Preprocessing of Clock Offsets

The preprocessing of raw clock offsets is of great importance for periodic variation analysis and clock prediction. The gross errors and phase jumps are the main anomalies of the clock offsets, which cannot objectively reflect the characteristics of the satellite clocks and degrade the performance of clock prediction [33]. Such clock anomalies should be processed before periodic variation analysis and clock offset modeling. With high calculation efficiency and anti-error performance, the MAD method is usually used to detect gross errors [34]. When the clock frequency series satisfies Equation (1), the related clock offsets are considered abnormal:
| y i | > k
where y i represents the clock frequency series, i is the epoch, and k is the threshold value, which can be calculated by k = m + n M A D . m denotes the median of the clock frequency series, M A D = M e d i a n { | y i m | / 0.6745 } , and the factor n can be set to 3–5.
The traditional MAD method is a preprocessing method corresponding to clock frequency series. Both gross errors and phase jumps of clock offsets in time domain will bring outliers in clock frequency series, which means the outliers detected by traditional MAD are caused by gross errors or phase jumps. If all the outliers are processed without distinguishing them, some effective clock offsets may be destroyed simultaneously. Therefore, it is necessary to identify the outliers caused by gross errors or phase jumps. In this paper, we use double MAD detection to distinguish the outliers. The detailed flowchart of the double MAD detection is shown in Figure 1.
As shown in Figure 1, the double MAD detection performs two MAD detection. In the first MAD detection, the raw clock offsets are converted to clock frequency series, and the threshold value k is calculated. The outliers of clock frequency series can be easily detected by MAD detection. Then, store the clock offset outliers identified by the first MAD detection temporarily and eliminate the frequency outliers. After that, the clock offset series without gross errors are recovered by integral algorithm. In the second MAD detection, the new clock frequency series are recalculated, while the threshold k still uses the value obtained by the first MAD detection. In this case, the outliers of clock frequency series absolutely correspond to the phase jumps, and the clock offsets, which are accidentally removed during the first MAD detection, can be recovered. After double MAD detection, the outliers caused by gross errors and phase jumps are marked respectively.
It should be noted that the gross errors and phase jumps identified by double MAD detection should be processed reasonably. In this paper, the gross errors are set to zero in the BDS satellite clock periodic variation analysis, while removed directly during modeling. The constant offset brought by phase jump is corrected to guarantee sufficient clock offset series for modeling. We use the mean of f 2 without outliers to substitute the outliers of the clock frequency series. After that, the clock offsets before and after the phase jump are aligned.

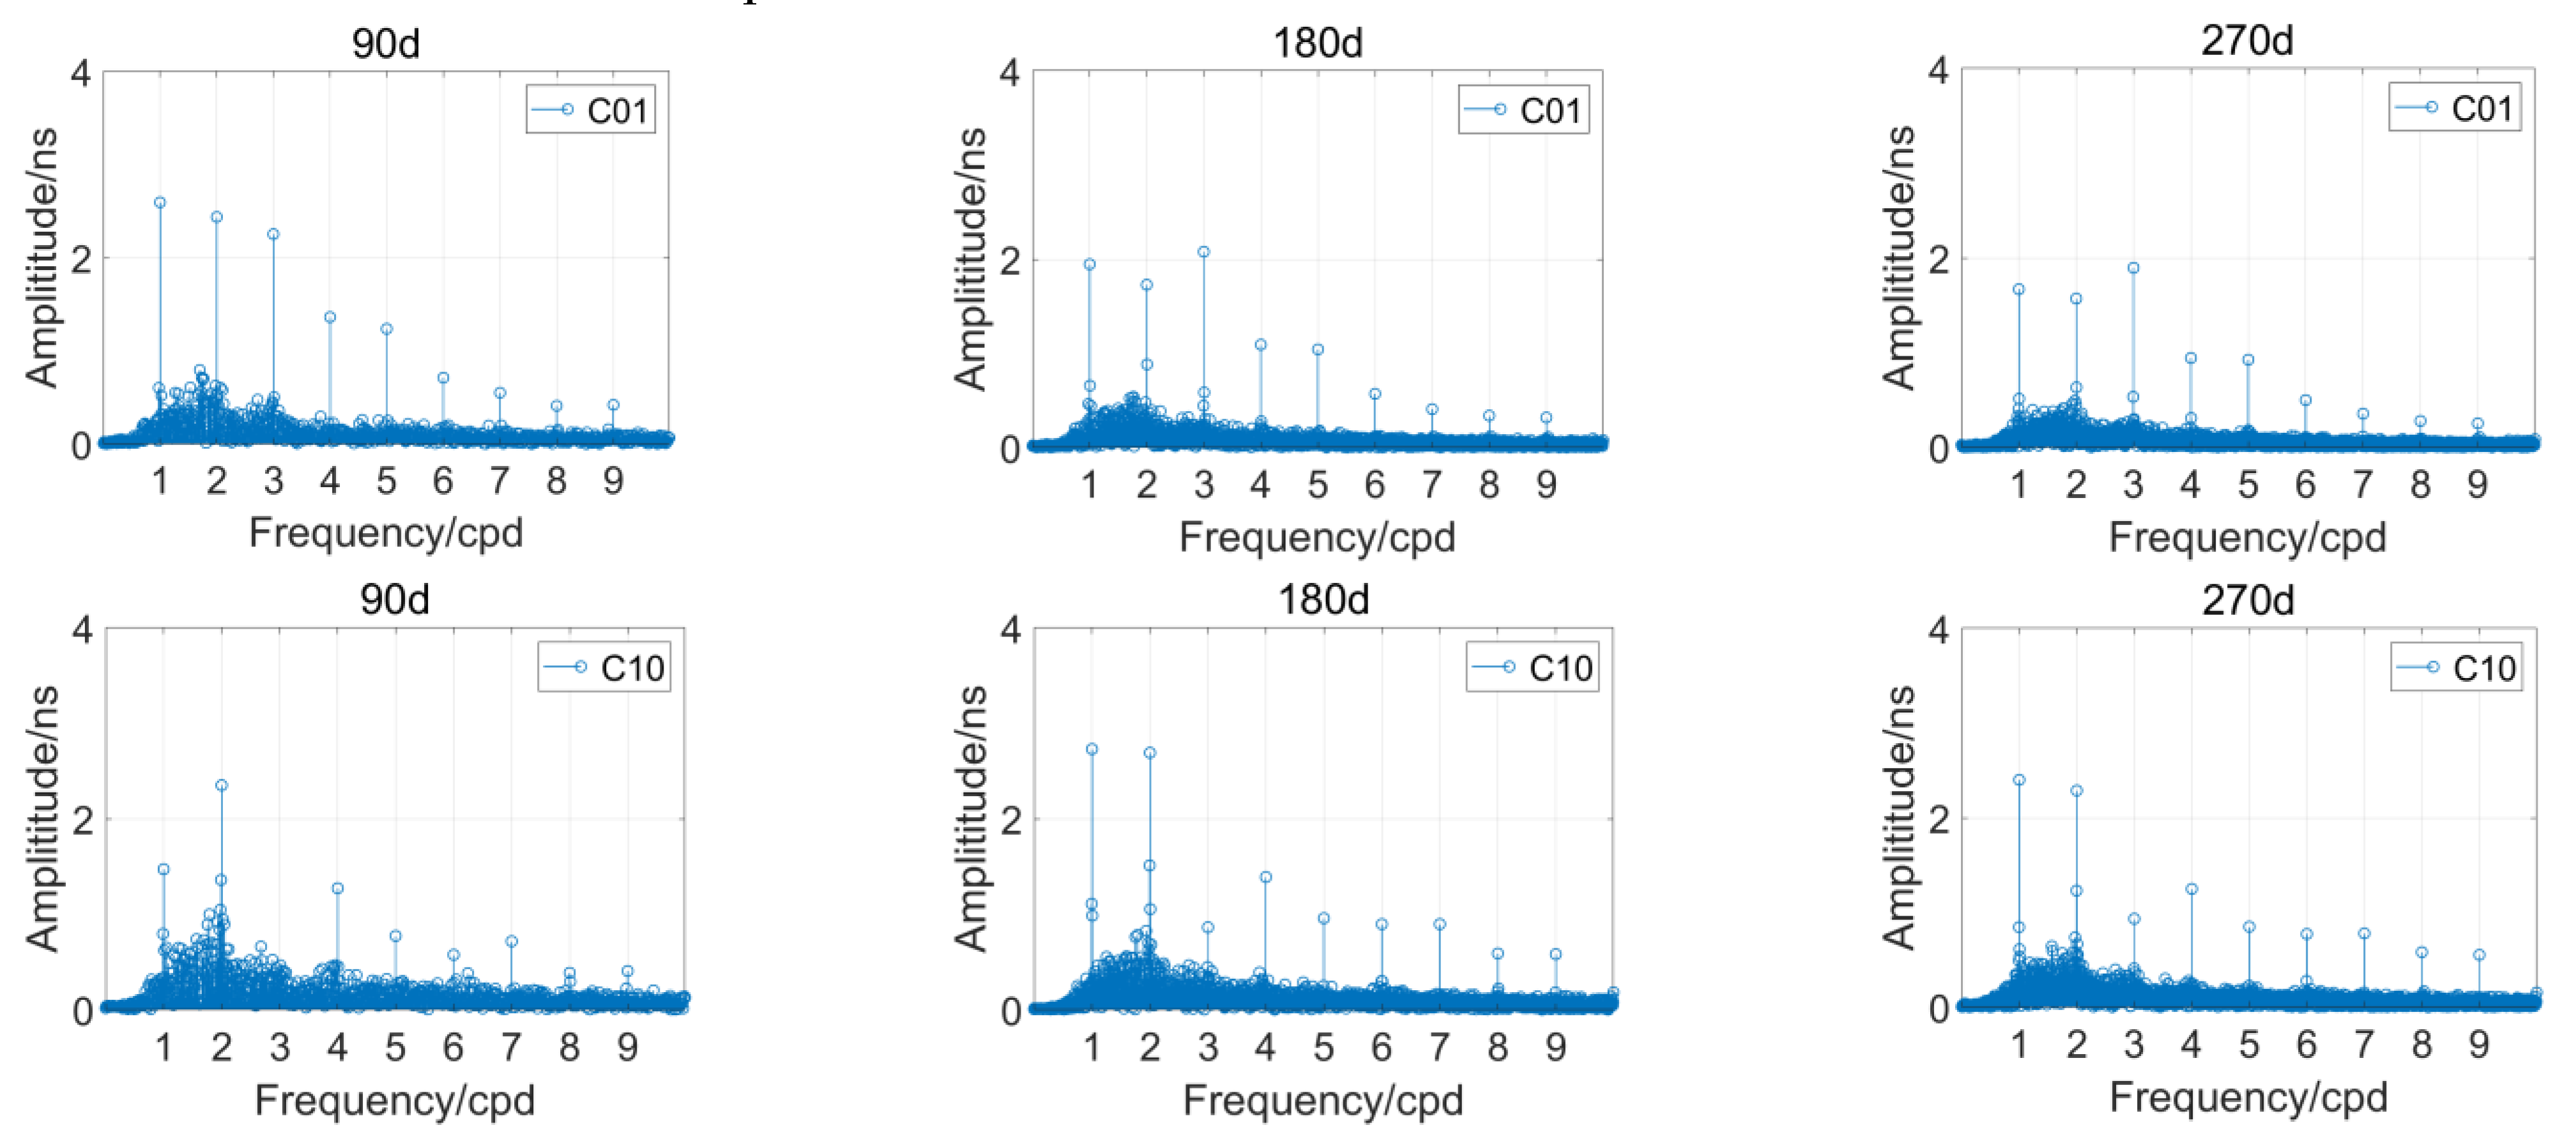
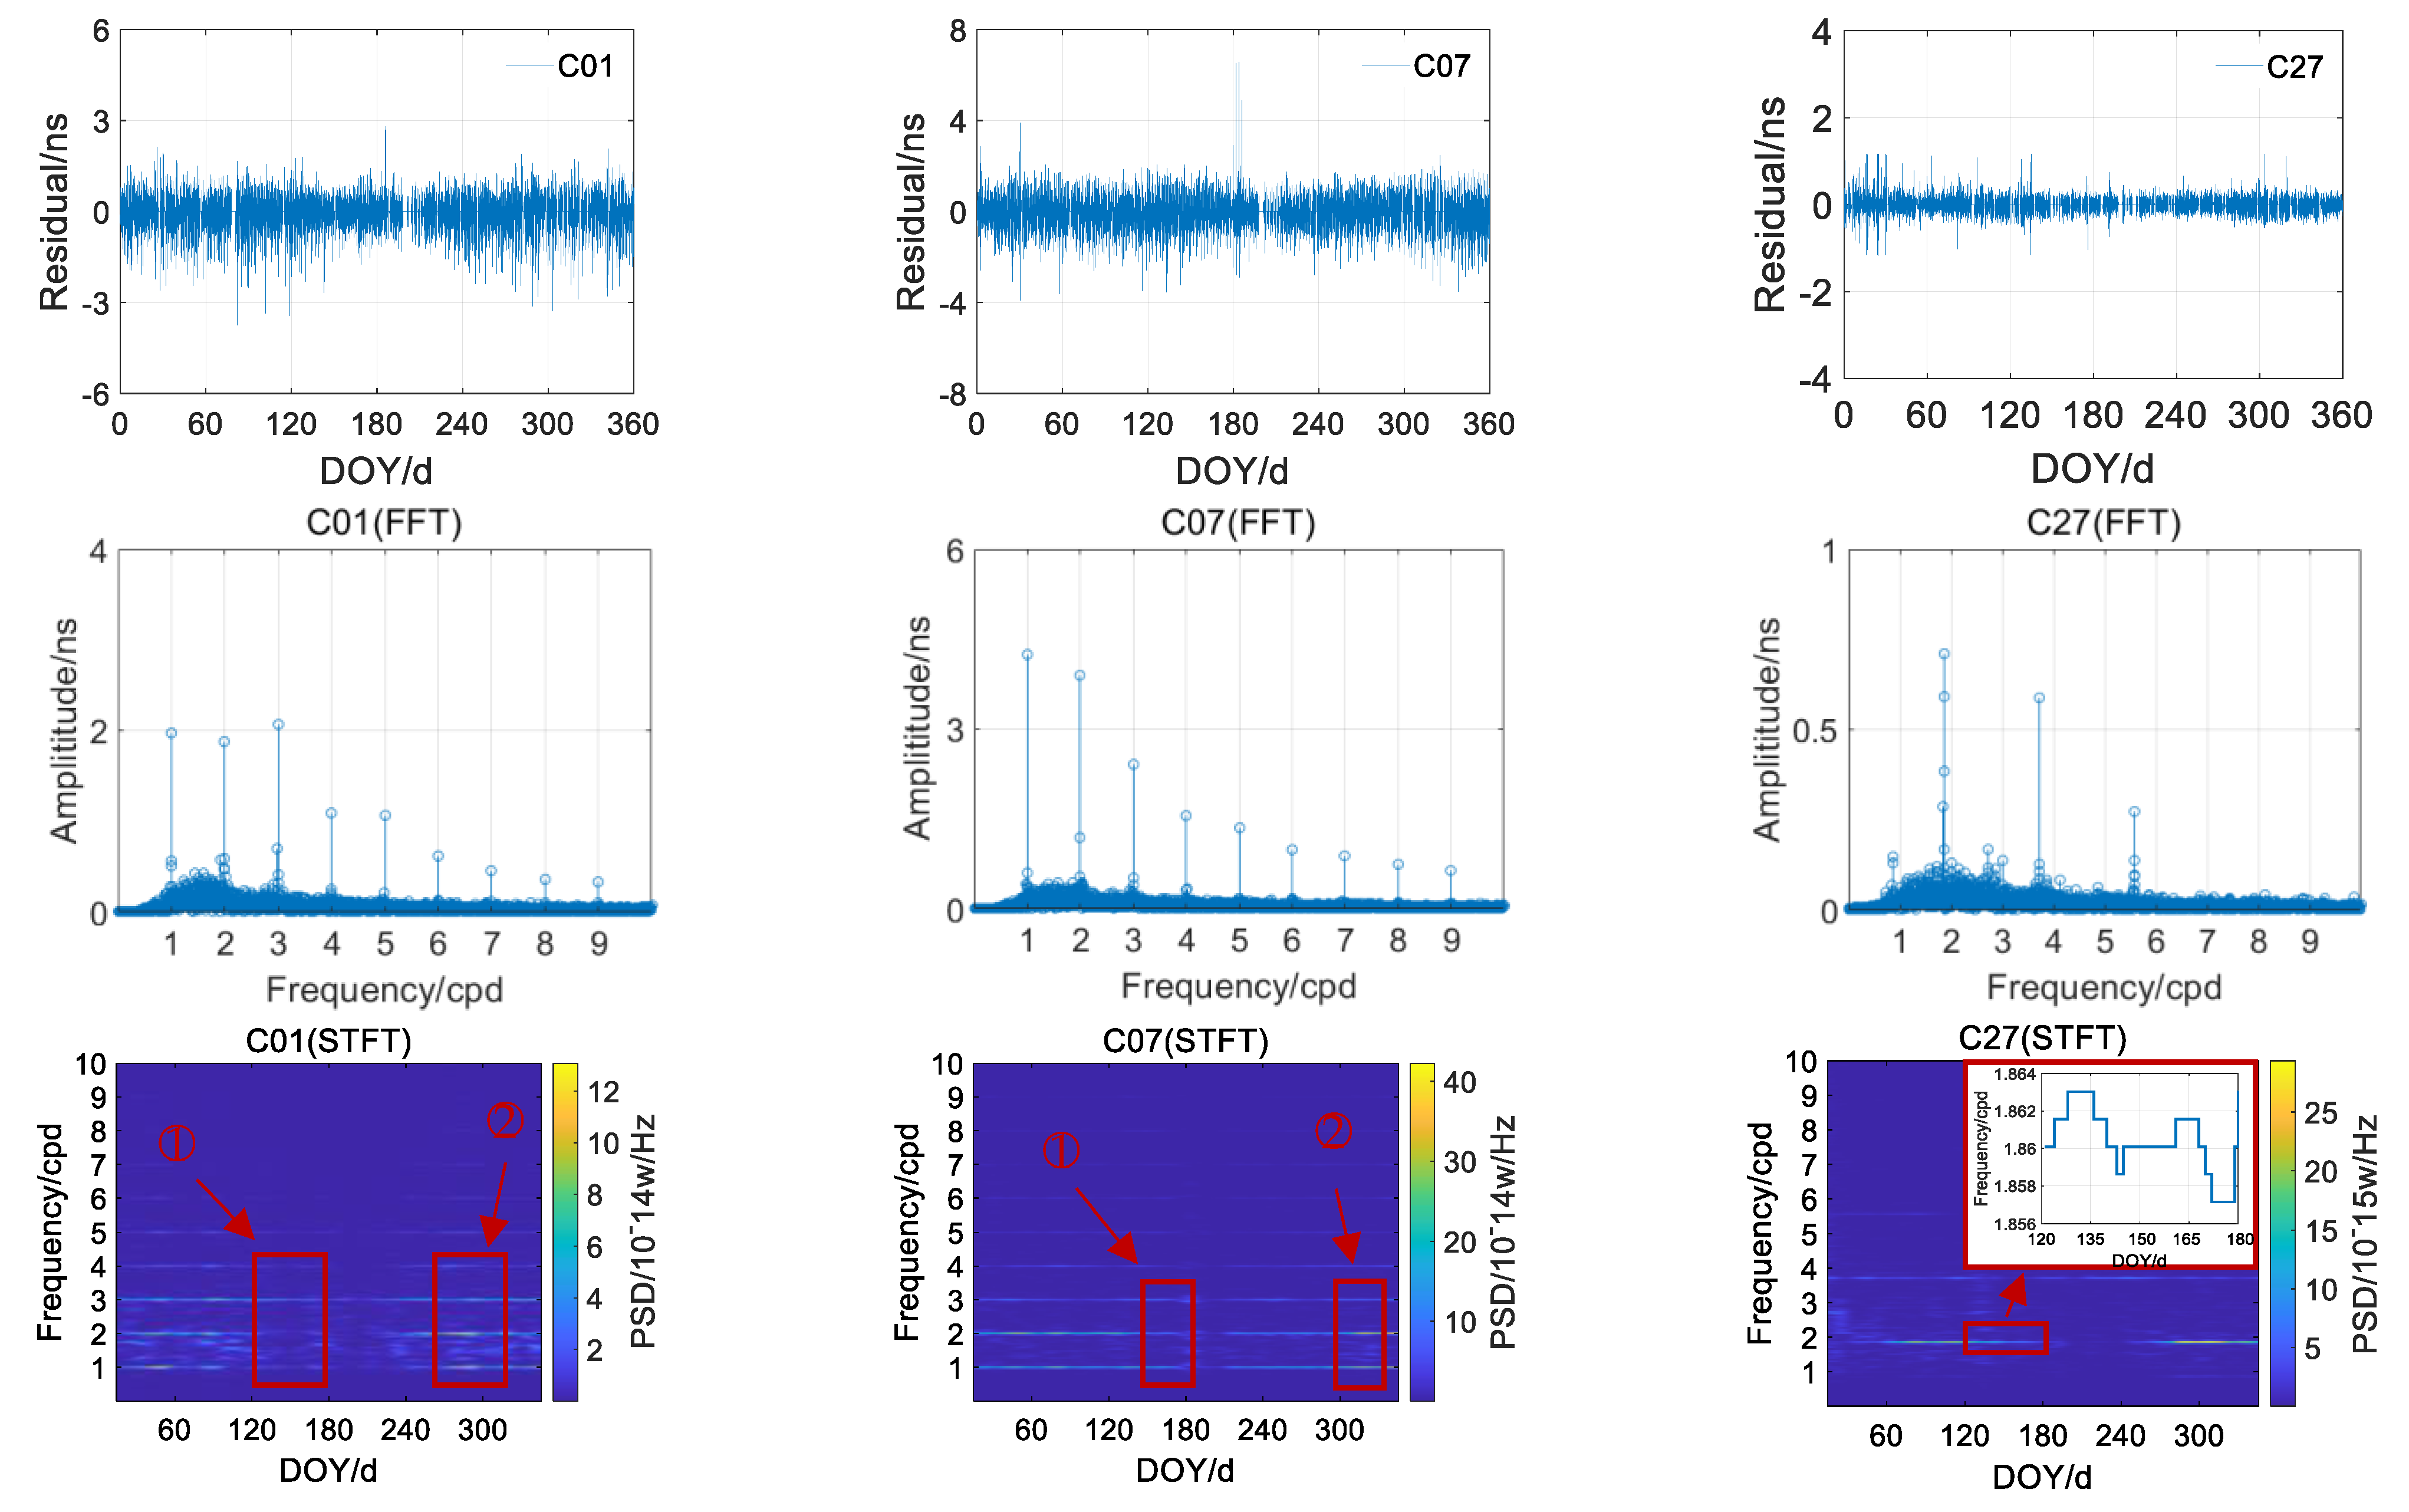
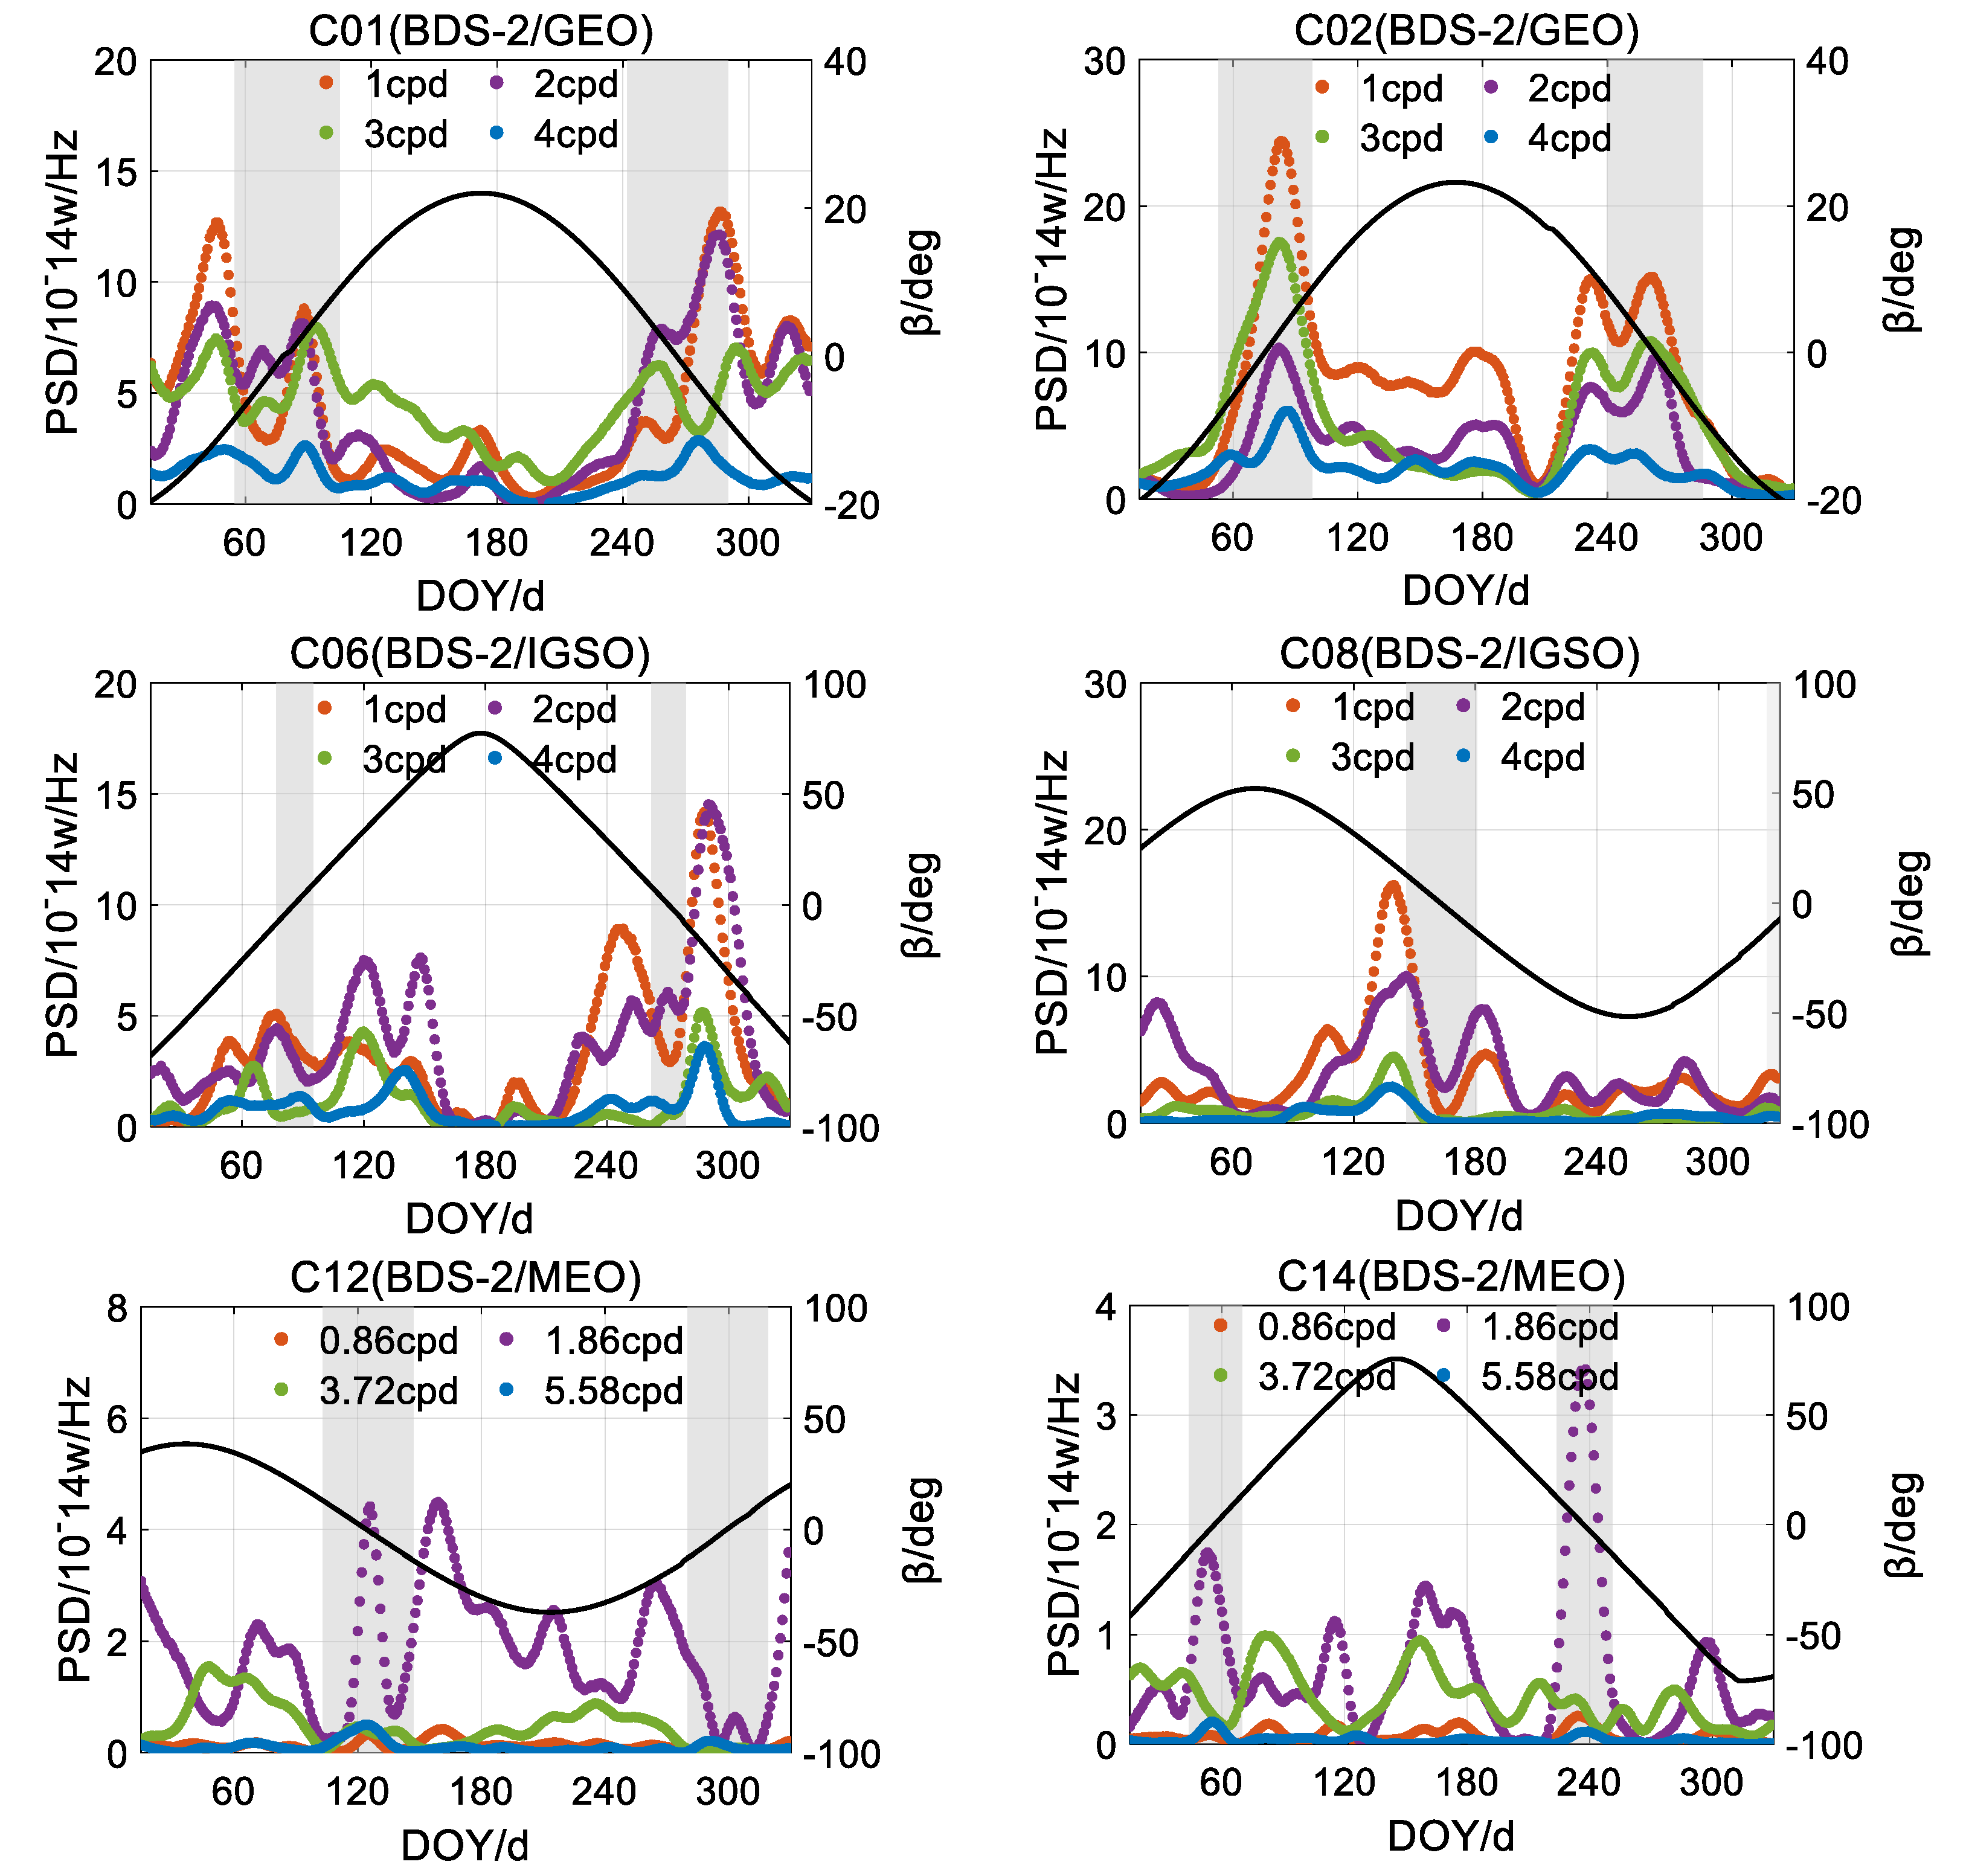
2.2. Analysis of Periodic Variations in BDS Satellite Clock Offsets

The atomic clocks are crucial payloads of BDS satellites and can be easily influenced by environment and temperature [16,17]. Many researchers have confirmed that the periodic noise is significant in BDS satellite clock offsets, which are probably caused by some factors such as the orbit determination errors, temperature variations, and perturbation errors [20,21]. The FFT is a traditional method used to identify and extract periodic terms from the clock offsets. To improve the frequency resolution of amplitude spectrum, the length of clock offset series used for FFT is usually long, such as 60-day, 100-day, and even one year [25,26,27]. There are no uniform criteria for selecting the length of clock offset series in published literature. The FFT based on different lengths of clock offset series may give different periodic terms, especially the main periodic term. Here, the amplitude spectrums of different lengths of clock offset series are given first.
The raw BDS satellite clock offset series used here are WHU precise clock products, from day-of-year (DOY) 001 to 270 of the year 2019 (https://cddis.nasa.gov/archive/gnss/products/mgex, accessed on 14 August 2021). Considering that the BDS precise clock products are obtained by Orbit Determination and Time Synchronization (ODTS), some orbit determination errors (particularly for the radial component) are absorbed by the clock offsets [31]. Therefore, the orbit determination strategies are essential for the analysis of precise clock offsets [35]. Table 1 gives crucial information of the precise orbit determination strategies with which the used WHU precise clock products are estimated. Solar radiation pressure (SRP) is the dominant non-gravitational perturbation for satellites [36], which can affect the accuracy of the satellite orbit directly. For WHU orbit strategies, the 5-parameter ECOM1 model with an empirical a priori model is used as BDS SRP model [35,37].
To analyze the influence of different FFT lengths on spectral analysis, Geosynchronous Orbit (GEO) satellite C01, Inclined Geosynchronous Satellite Orbit (IGSO) satellite C10, and Medium Earth Orbit (MEO) satellite C25 are chosen randomly as an example. First, daily clock offsets are fitted by QPM after preprocessing. Second, the different length residuals of the QPM aligned day by day are utilized for FFT analysis. The amplitude spectrums of the 90-day, 180-day, and 270-day are shown in Figure 2. The horizontal axis represents frequency with the unit cycles per day (cpd), and the vertical axis represents the amplitude with the unit ns.
From Figure 2, the periodic terms in clock offsets are detected at multiple frequencies. For C01 and C10, the 1 cpd periodic term approximately equal to their orbit period of 23.9 h. Apart from four significant periodic terms, the amplitude of other periodic terms decreases with n (n is an integer) increases. The periodic terms with low amplitude are ignored in modeling and prediction. For C25, there are only four significant periodic terms in the amplitude spectrums. Among them, the 1.86 cpd periodic term is approximately equal to MEO orbit period of 12.9 h. It can be found that the BDS satellite clock offset periodic terms closely related to the orbit period. Similar periodic terms have been found in other satellites from the same constellation.
As shown in Figure 2, it can be seen that the main periodic term obtained by FFT based on different lengths of clock offset series are distinct. For C01, the periodic term of 1 cpd is the most significant in the amplitude spectrum of 90-day, while 3 cpd in the amplitude spectrum of 180-day and 270-day. For C10, the main periodic term in 90-day amplitude spectrum is 2 cpd, while 1 cpd for the 180-day and 270-day amplitude spectrums. The spectral peak in the 90-day and 270-day amplitude spectrums for C25 is approximately 3.72 cpd, while 1.87 cpd in the 180-day amplitude spectrum. Distinct amplitude spectrum results of different FFT lengths are probably led by periodic variations. Performing FFT on clock offset series gives the global spectrum analysis result for the entire time series. However, it cannot give the variations of frequency components in the time domain. The satellite atomic clocks in space are affected by space environment changes, temperature variations, and various disturbances, which make the periodic noise time-varying. Therefore, the main periodic term obtained by FFT may be inaccurate. The STFT has a unique advantage in processing non-stationary signals. To perform STFT, long-term clock offset series are broken up into chunks, and to reduce artifacts at chunk boundary, the chunks overlap each other. Each chunk is Fourier transformed, and the magnitude for each point in time and frequency domain is recorded. Therefore, the STFT can effectively detect the variations of amplitude spectrum. In this section, the STFT is used to analyze the periodic variations of BDS satellite clock offsets.
Although the constellation deployment of BDS-3 has been completed, some satellites of BDS-3 are in orbit only for a short time, and there are no sufficient precise clock products. Therefore, the discussion in this paper is limited to 15 satellites of BDS-2 and 15 satellites of BDS-3. The BDS-3 satellites are manufactured by China Academy of Space Technology (CAST) and Shanghai Engineering Center for Microsatellites (SECM). The satellites from the two manufacturers have different body sizes and attitude modes, and employ two different satellite platforms. Distinct attitude control models employed by CAST satellites and the SECM satellites affect the accuracy of orbit determination and clock offsets [19]. Therefore, it is necessary to classify the satellite clock offsets that from the CAST or the SECM. The detailed information of the BDS satellites is listed in Table 2.
To fully analyze the periodic variations, we investigate the periodic noise of the BDS satellite clock offsets in frequency and the time-frequency domain. First, we collected the raw clock products (DOY 001 to 360, 2019), and calculated the fitting residuals of the QPM after preprocessing. Then, we perform a spectrum analysis based on FFT and a time-frequency analysis based on STFT for the residuals. Limited by paper length, one satellite from each constellation is randomly selected to show the results. Figure 3 gives the residuals, amplitude spectrum, and spectrogram of the GEO satellite C01, the IGSO satellite C07, and the MEO satellite C27.
The figure of residuals shows small gaps, meaning that the raw clock offsets of C01, C07 and C27 have good continuity. The spectrograms in Figure 3 give the information of the time domain and the frequency domain simultaneously. The horizontal axis represents the time domain, and the vertical axis represents the frequency domain. The third dimension, which is represented by the intensity of the color, indicates the Power Spectral Density (PSD) of the frequency at that time.
From the results of residuals in Figure 3, it can be seen that the amplitude of the residuals varies over time irregularly, and there is no intuitive information about periodic variations. The amplitude spectrums show the holistic periodic terms of 360-day clock offset series. The spectrograms give the variations of the periodic terms through color variations. Two types of variations can be found through the spectrograms. First, the amplitude of the periodic terms varies with time, and the variations are diverse for different periodic terms and different satellites. Second, the frequencies of periodic terms vary over time. Therefore, the main periodic term is time-varying, and the detected results by FFT and STFT are different. For C01, the highest spectral peak in frame ① is 3 cpd, while 2 cpd in frame ②. For C07, the main periodic term in frame ① and frame ② of the spectrogram is 1 cpd, and 2 cpd, respectively. For C27, there are several significant peaks around 1.86 cpd in the amplitude spectrum, and the amplitude of them has little difference. The picture-in-picture of spectrogram shows that these significant periodic terms around 1.86 cpd play the main role at different times. Such frequency fluctuations of the main periodic term are easily ignored by FFT in a short time.
Considering that the accuracy of orbits and clocks during eclipse seasons are much lower than that in non-eclipse seasons, we characterize and quantify the periodic variations in WHU precise clock products during the eclipse seasons. A correlation analysis between the PSD and β angle is performed. The PSD of four significant periodic terms from Figure 3 are extracted and analyzed. The results of BDS-2 GEO satellites C01 and C02, BDS-2 IGSO satellites C06 and C08, BDS-2 MEO satellites C12 and C14, BDS-3 MEO satellites C19 and C21 made by CAST and BDS-3 MEO satellites C25 and C27 made by SECM are shown in Figure 4. The vertical axis on the left represents the PSD of periodic terms, and the vertical axis on the right represents the β angle. When the absolute value of β angle is less than a critical value, the satellite enters the eclipse seasons [44]. For GEO and IGSO satellites, the value is 8.5 deg, while for MEO satellites the value is 14.5 deg [45,46]. The shaded regions in Figure 4 represent the eclipse seasons.
Figure 4 shows the variations of four significant periodic terms. The temporal variations of PSD can be found for each satellite in eclipse seasons and non-eclipse seasons. For GEO and IGSO satellites, the PSD of four periodic terms vary seasonally. When the eclipse seasons come, the values of PSD are gradually increasing. The 1.86 cpd periodic term in the PSD of MEO satellites varies significantly, and it tracks the eclipse seasons. Other periodic terms show limited correlation with eclipse seasons. The 1 cpd periodic term of GEO and IGSO satellites and 1.86 cpd periodic term of MEO satellites, which are closely related to their orbit period, are significantly affected by the eclipse seasons. During the eclipse seasons, the actual attitude of the satellite is inconsistent with the nominal attitude. The yaw attitude will deteriorate the accuracy of non-conservative perturbation model and the correction of phase winding and PCO, thus affecting the accuracy of the satellite orbits [44]. Apart from the yaw attitude, the thermal radiation which is complicated to be accurately modeled also affects the orbit accuracy in eclipse seasons [46]. Considering that up to 97% of the radial orbit errors can be absorbed by the clock offsets [47], the PSD variations of the periodic term related to the orbit period can be affected by low orbit accuracy caused by yaw bias, thermal radiation, and other factors. The PSD variations of other periodic terms may be affected by perturbation errors and environment variations. Compared with BDS-2 MEO satellites, the PSD variations of BDS-3 MEO satellites in eclipse seasons are more outstanding. For BDS-3 MEO satellites, the PSD variations of C19 and C21 are higher than those of C25 and C27. It may be affected by the distinct orbit accuracy of CAST satellites and SECM satellites.
From Figure 4, it can be concluded that the PSD of periodic terms vary with time, and the variations of each periodic term are inconsistent. The inconsistent variations lead to the main periodic term varying over time. For GEO and IGSO satellites, the main periodic term varies irregularly, while the variations of the main periodic term generally occur around the β angle peak value for MEO satellites. Considering that the International GNSS Monitoring and Assessment System (IGMAS) and the GFZ only add one periodic term to the SAM for the BDS ultra-rapid clock products [26], we focus on the variations of the main periodic term. The frequency variations of the main periodic term for all satellites considered are shown in Figure 5.
Figure 5 gives the frequency variations of the main periodic term. The horizontal axis and the vertical axis represent the time and the PRN, respectively. The third dimension indicates the frequency of the main periodic term. The left subfigure contains the frequency variations of the main periodic term for 30 satellites. As can be seen from the figure, the result of C11 is obviously anomalous from the others. The right subfigure gives the results of all satellites except C11. From the right subfigure, it can be seen that the main periodic terms of 29 satellites vary over time, and the frequency range is between 0 and 6 cpd. Therefore, the main periodic term obtained by FFT according to long-term clock offset series cannot be used as the main periodic term simply.
As different MGEX ACs have different orbit and clock solutions, apart from the WHU, we also analyze periodic variations based on BDS clock products from GFZ. Since GFZ start to release BDS-3 satellite precise clock products on the website of Crustal Dynamics Data Information System (CDDIS) from DOY 166 in 2020, the 360-day clock products (DOY 166, 2020 to 159, 2021) provided by WHU and GFZ are used to analyze the periodic variations. The frequency variations of the main periodic term for WHU and GFZ clock offsets are shown in Figure 6.
From Figure 6, it can be seen that the frequency variations exist both in WHU and GFZ clock products, and the inconsistent variations may be caused by the different orbit and clock solutions. In addition to C11, special frequencies are also detected in C14 clock offsets. In order to analyze the special results of C11 and C14, the 360-day (DOY 166, 2020 to 159, 2021) spectrograms are given in Figure 7.
As shown in Figure 7, C11 has an obvious periodic term around 20 cpd, and the frequency of this periodic term increases with time. For C14, special periodic terms with decreasing frequency can be found in the spectrogram. A special periodic term can be identified both from WHU and GFZ clock offsets. It may be caused by anomalies of the satellite atomic clock itself.
Based on the analysis of this section, it can be found that the main periodic term of BDS satellite clock offsets is time-varying, and the variations occur frequently in all satellites. Therefore, the frequencies of the periodic terms obtained by STFT are more accurate for compensating the periodic noise than FFT. These time-varying periodic terms should be considered to improve the clock prediction model, especially for satellites with marked periodic variations.

2.3. BDS Satellite Clock Prediction Model Considering Periodic Variations

As a widely used and representative satellite clock prediction model, the SAM is expressed as:
x i = a 0 + a 1 ( t i - t 0 ) + a 2 ( t i - t 0 ) 2 + r = 1 l A r s i n ( 2 π f r ( t i - t 0 ) ) +   B r s i n ( 2 π f r ( t i t 0 ) ) + Δ i   ( 0 i n ) ,   P ¯
where x i is clock offset of epoch t i , t 0 represents the reference epoch, and a 0 , a 1 and a 2 are clock offset (phase), clock velocity (frequency), and clock drift (frequency drift), respectively. l is the number of periodic terms, and A r , B r , f r denote the amplitude and frequency of the periodic terms, respectively. Δ i is the residual of the model at epoch t i . P ¯   =   d i a g ( i ( t i t 0 ) ) ,   i = ( 1 , 2 , , n ) is the weight matrix [26].
Generally, parameters l and f r in Equation (2) are determined first by spectrum analysis, and then other parameters such as a 0 , a 1 , a 2 , A r and B r are estimated using LS. From Section 2, there are multiple frequency components in BDS satellite clock offset periodic noise. Inappropriate l may easily cause overfitting, which adversely affects the prediction accuracy [3]. The current research generally adds one or two periodic terms in clock prediction model to compensate for the periodic noise [26,27,28]. Considering the SAM with one periodic term is commonly used in BDS ultra-rapid clock products [26], we set l to 1 in this paper. The accurate frequency parameter f r is critical for the fitting and prediction accuracy of the SAM. From the previous analysis, the amplitude spectrum calculated by FFT is a global spectrum analysis result and cannot give the periodic variations in time dimension. Awareness of time-varying periodic term can be used to improve the clock prediction model, in this paper, the STFT is utilized to detect and quantify the frequency parameter f r of the main periodic term. Based on constantly updated clock offsets, the time-varying amplitude spectrum can be obtained by STFT, and the time-varying parameter f r can be determined accurately. Since the periodic term coefficient is obtained by STFT, the improved clock prediction model is referred to as the time-frequency analysis model (TFAM).

3. Results

In this section, based on the clock products of the WHU and the GFZ, the performance of the TFAM is analyzed. First, the fitting performance of the TFAM is evaluated and compared with that of the SAM. Then, the prediction results of the TFAM and the SAM are discussed. Finally, the prediction results of the satellites with marked periodic variations are investigated to show the performance of TFAM fully.

3.1. Accuracy Analysis of Clock Offset Fitting

In order to evaluate the fitting accuracy of the improved model, 30-day (DOY 200 to 229, 2020) WHU and GFZ clock offset fitting are analyzed statistically. The root mean square (RMS) error is used as the evaluation criterion of the fitting accuracy. Figure 8 gives the RMS of the QPM, the SAM, and the TFAM fitting residuals after removing the anomalies, respectively.
Figure 8 shows the mean fitting RMS of the WHU and GFZ clock offsets, respectively. It can be seen that both the SAM and the TFAM have better fitting accuracy than the QPM. For some satellites, the TFAM performs better than the SAM, and, for others, the fitting accuracy is basically the same. Adding a time-varying main periodic term to the clock prediction model indeed improves the fitting accuracy, and for the satellites with marked periodic variations, the TFAM can further improve the fitting accuracy. The BDS-3 MEO satellites have better fitting accuracy than BDS-2 MEO satellites, which implies that the BDS-3 MEO satellite clocks have better performance in modeling. This is mainly because the BDS-3 satellites are equipped with higher quality on-board atomic clocks than BDS-2. MEO satellites present better fitting performance than the GEO and IGSO satellites, which may be caused by different orbit model performance of MEO satellites and other satellites.
In order to further evaluate the fitting accuracy, the improvement rate of the TFAM relative to the SAM is analyzed. The improvement is given in Figure 9.
As shown in Figure 9, the improvement of fitting accuracy is presented by considering the time-varying periodic term. The improvement is not only in WHU clock offsets, but also in GFZ clock offsets. Nearly half of the satellites have clear improvements. Affected by inconsistent periodic variations of satellites, the improvement is different for different satellites. The maximum improvement of a single satellite for WHU clock offsets is 36.4%, while it is 50.0% for GFZ clock offsets. For WHU clock offsets, the fitting accuracy improves 10.5% and 12.2% for GFZ clock offsets. It is clear that the fitting residuals are further mitigated by considering the time-varying periodic term in the clock prediction model.

3.2. BDS Satellite Clock Prediction Analysis

In order to evaluate the prediction performance of the TFAM, we give and compare the prediction results of the TFAM and the SAM. The fitting and prediction are processed on a daily basis. To evaluate the prediction accuracy with different prediction time, 6 h, 12 h, 18 h, and 24 h prediction results are given in this section. As the data length of precise clock products publicly released by GFZ is limited, 300-day (DOY 166, 2020 to 099, 2021) clock offsets are used as the FFT length in this section. As shown in Table 2, the BDS-3 satellites are manufactured by CAST and SECM, and they have been partitioned to analyze the prediction performance, respectively. RMS after quadratic difference processes is used as the evaluation standard of the prediction accuracy. Clock prediction results of 30-day (DOY 140 to 169, 2021) are analyzed statistically. The mean RMS of 30 days for 30 satellites are listed in Table 3.
Table 3 shows the mean prediction RMS of the WHU and GFZ clock offsets using the SAM and TFAM. It can be seen that the TFAM improves the mean prediction accuracy of the SAM, which indicates that the effect of the periodic noise can be further weakened by considering the time-varying periodic term. For different satellite types, IGSO satellites have maximum improvement, and the 24 h accuracy improvement of GFZ and WHU clock offsets achieve 19.5% and 8.8%, respectively. For the GEO satellites, there is little accuracy improvement both for WHU and GFZ clock offsets. Figure 10 gives the frequency variations of the main periodic term for GFZ and WHU clock offsets of 30 days (DOY 140 to 169, 2021). As shown in Figure 10, there is little periodic variations for GEO satellites. Therefore, little accuracy improvement is achieved for GEO satellites. The periodic variations of IGSO satellites are more frequent than MEO satellites. The improvement of MEO satellites is lower than that of IGSO, which is mainly because the MEO periodic variations generally only occur around the β angle peak value. Compared with WHU, the GFZ improvement is more obvious. It is caused by the different periodic variations between WHU and GFZ clock offsets. As shown in Figure 10, the variations of the main periodic term are mostly consistent for GFZ and WHU clock offsets. The prediction accuracy improvement of the 6 h, 12 h, 18 h, and 24 h are in the range of 6.4% to 10.0% for WHU clock offsets, while 11.1% to 14.4% for GFZ clock offsets.
In addition, the prediction accuracy of different satellites is discussed. Compared with the BDS-2 MEO satellites, the prediction accuracy of BDS-3 MEO satellites is better. Because the BDS-3 satellites are equipped with the new generation high-quality atomic clocks, they have better frequency stability than the atomic clocks on BDS-2. For different constellation satellites, the MEO satellites have the best prediction accuracy, followed by the GEO satellites and the IGSO satellites. Comparing the prediction accuracy of satellites from different manufacturers, it can be found that the prediction accuracy of SECM satellites is higher than CAST satellites. For different prediction lengths, the prediction accuracy is generally reduced with increasing of the prediction length. The 6 h prediction accuracy of the TFAM for all satellites is approximately 0.9 ns.
Considering that the time-varying periodic terms of different satellites occur at different times, the overall improvement of TFAM is limited. For the TFAM, it performs better for the satellites with marked periodic variations. In order to evaluate the performance of the improved model for the satellites with marked periodic variations, the BDS-2 IGSO satellite C06, the BDS-2 MEO satellite C14, the BDS-3 SECM satellite C28, and the BDS-3 CAST satellite C32 are chosen to show improved accuracy. Considering that there are little periodic variations of BDS-2 GEO satellites from DOY 140 to 169, in 2021, four satellites from IGSO and MEO constellations are chosen as an example. Figure 11 and Figure 12 give the amplitude spectrums and spectrograms of WHU and GFZ clock offsets, respectively.
It can be seen from the amplitude spectrums and spectrograms in Figure 11 and Figure 12, the main periodic terms detected by FFT and STFT are distinct for C06, C14, and C32. For C28, the main periodic term in the amplitude spectrum and spectrogram of Figure 11 is the same, while different in Figure 12, which may be caused by different clock offset continuity of WHU and GFZ. For C06, C14, and C32, the amplitude spectrums and spectrograms of WHU and GFZ clock offsets have slight discrepancy, while the variation trend is basically the same. The spectral peak at the amplitude spectrum of the C06 is 1 cpd, while 1 cpd during DOY 140 to 145 and 2 cpd during DOY 145 to 170 in the corresponding spectrograms. For the C14, the main periodic term at the amplitude spectrum is 1.86 cpd. A periodic variation can be found in the spectrogram of the C14 satellite. From DOY 140 to 145, the main periodic term is 5.94 cpd, while the main periodic term is changed to 3.72 cpd after DOY 145. The main periodic term at the amplitude spectrum and the spectrogram of C32 are 1.86 cpd and 3.72 cpd, respectively. Therefore, for C06, C14, and C32 in Figure 11 and all of the satellites in Figure 12, the main periodic term has marked variations, and the frequency parameter of the TFAM and the SAM is different. Such significant periodic variation could affect prediction accuracy of the clock prediction model. The 30-day prediction errors (24 h prediction) of C06, C14, C28, and C32 based on the SAM and TFAM are given in Figure 13 and Figure 14.
As shown in Figure 13 and Figure 14, the prediction errors of the TFAM and the SAM increase with prediction time, and the increase trend is similar for C06, C14, and C32 using WHU and GFZ clock offsets. For the satellites with marked periodic variations, the divergence trend of prediction errors is significantly improved using the TFAM than SAM, which indicates that the prediction errors accumulated with time can be improved by considering the time-varying periodic terms. Apparently, the TFAM can enhance the clock prediction accuracy. In order to intuitively demonstrate the prediction accuracy of the SAM and the TFAM, the mean value of the 30-day prediction errors is calculated, and the mean RMS values of the 30-day are remarked in Figure 15.
As shown in Figure 15, the prediction accuracy is significantly improved using the TFAM compared to the SAM. For WHU clock offsets, the RMS of the C06, C14, and C32 are improved by 26.7%, 16.2%, and 16.3%, respectively. The GFZ clock offset prediction accuracy improvements for C06, C14, C28, and C32 are 29.8%, 16.0%, 21.0%, and 9.0%. The TFAM performs better for the satellites with marked periodic variations.

4. Discussion

This research focused on the characteristics of the BDS satellite clock offset periodic variations, and proposed TFAM to analyze the impact of the periodic variations on the performance of clock prediction model. According to previous researchers, the amplitude of the periodic terms is time-varying. From the FFT results of different clock offset lengths, it can be seen that the FFT is not suitable to detect and quantify the periodic variations. Considering that the STFT has a unique advantage in processing non-stationary signals, it is used to analyze the periodic variations of BDS satellite clocks in this paper. Comparing the amplitude spectrums obtained by FFT and spectrograms obtained by STFT, it can be seen that both the amplitude and frequency of periodic terms vary with time, and the variations are diverse for different satellites. By analyzing the PSD variations of four significant periodic terms with respect to the β angle of BDS satellite, it is found that the amplitude variations of periodic terms due to the orbit determination errors vary significantly, and it tracks the eclipse season. For other periodic terms, the PSD variations may be caused by perturbation errors and environment variations. As the PSD variations of each periodic term are inconsistent, the frequency of main periodic term varies over time, which is found both in the WHU and GFZ clock offsets. Awareness of periodic variations may be used to improve the clock prediction model, and the TFAM considering the time-varying periodic term is established. Using STFT instead of FFT in obtaining the main periodic term, the periodic variations of the clock offsets are properly considered in the clock prediction model.
Compared with the fitting and prediction performance of the TFAM and SAM, it can be concluded that adding a time-varying periodic term to the TFAM indeed improves the fitting and prediction accuracy. Since the periodic variations of different satellites occur at different times, the overall improvement of TFAM is limited. For the satellites with marked periodic variations, the TFAM can significantly improve the fitting and prediction accuracy. Although there are some differences between the periodic variations of the WHU and GFZ clock offsets, the TFAM can improve the fitting and prediction accuracy for both WHU and GFZ clock offsets.
Due to the inconsistency performance of different satellites, the fitting and prediction results are discussed, and some conclusions have been drawn. The fitting and prediction accuracy of BDS-3 MEO satellites is better than that of BDS-2 MEO satellites. This may be because the BDS-3 satellites are equipped with high-quality atomic clocks, which have more stable frequency than atomic clocks on BDS-2 satellites. MEO satellites present better fitting and prediction performance than the GEO and IGSO satellites, and this is mainly because the orbit model performs better for MEO satellites than other satellites. Comparing the prediction accuracy of satellites from different manufacturers, the prediction accuracy of SECM satellites is higher than that of CAST satellites. It may be affected by the distinct orbit accuracy of CAST satellites and SECM satellites, which is caused by different attitude control models.
It is noted that the TFAM performs well for satellites with marked periodic variations. Except for the periodic noise, the characteristics of residual noise will be further studied in future work.

5. Conclusions

Due to space environment changes, temperature variations, and various disturbances, the periodic noise of the BDS satellite clocks is time-varying. In this paper, the periodic variations of BDS satellite clock offsets are analyzed by STFT. Then, the time-varying periodic terms are used to improve the performance of the clock prediction. Some conclusions can be summarized from this paper:
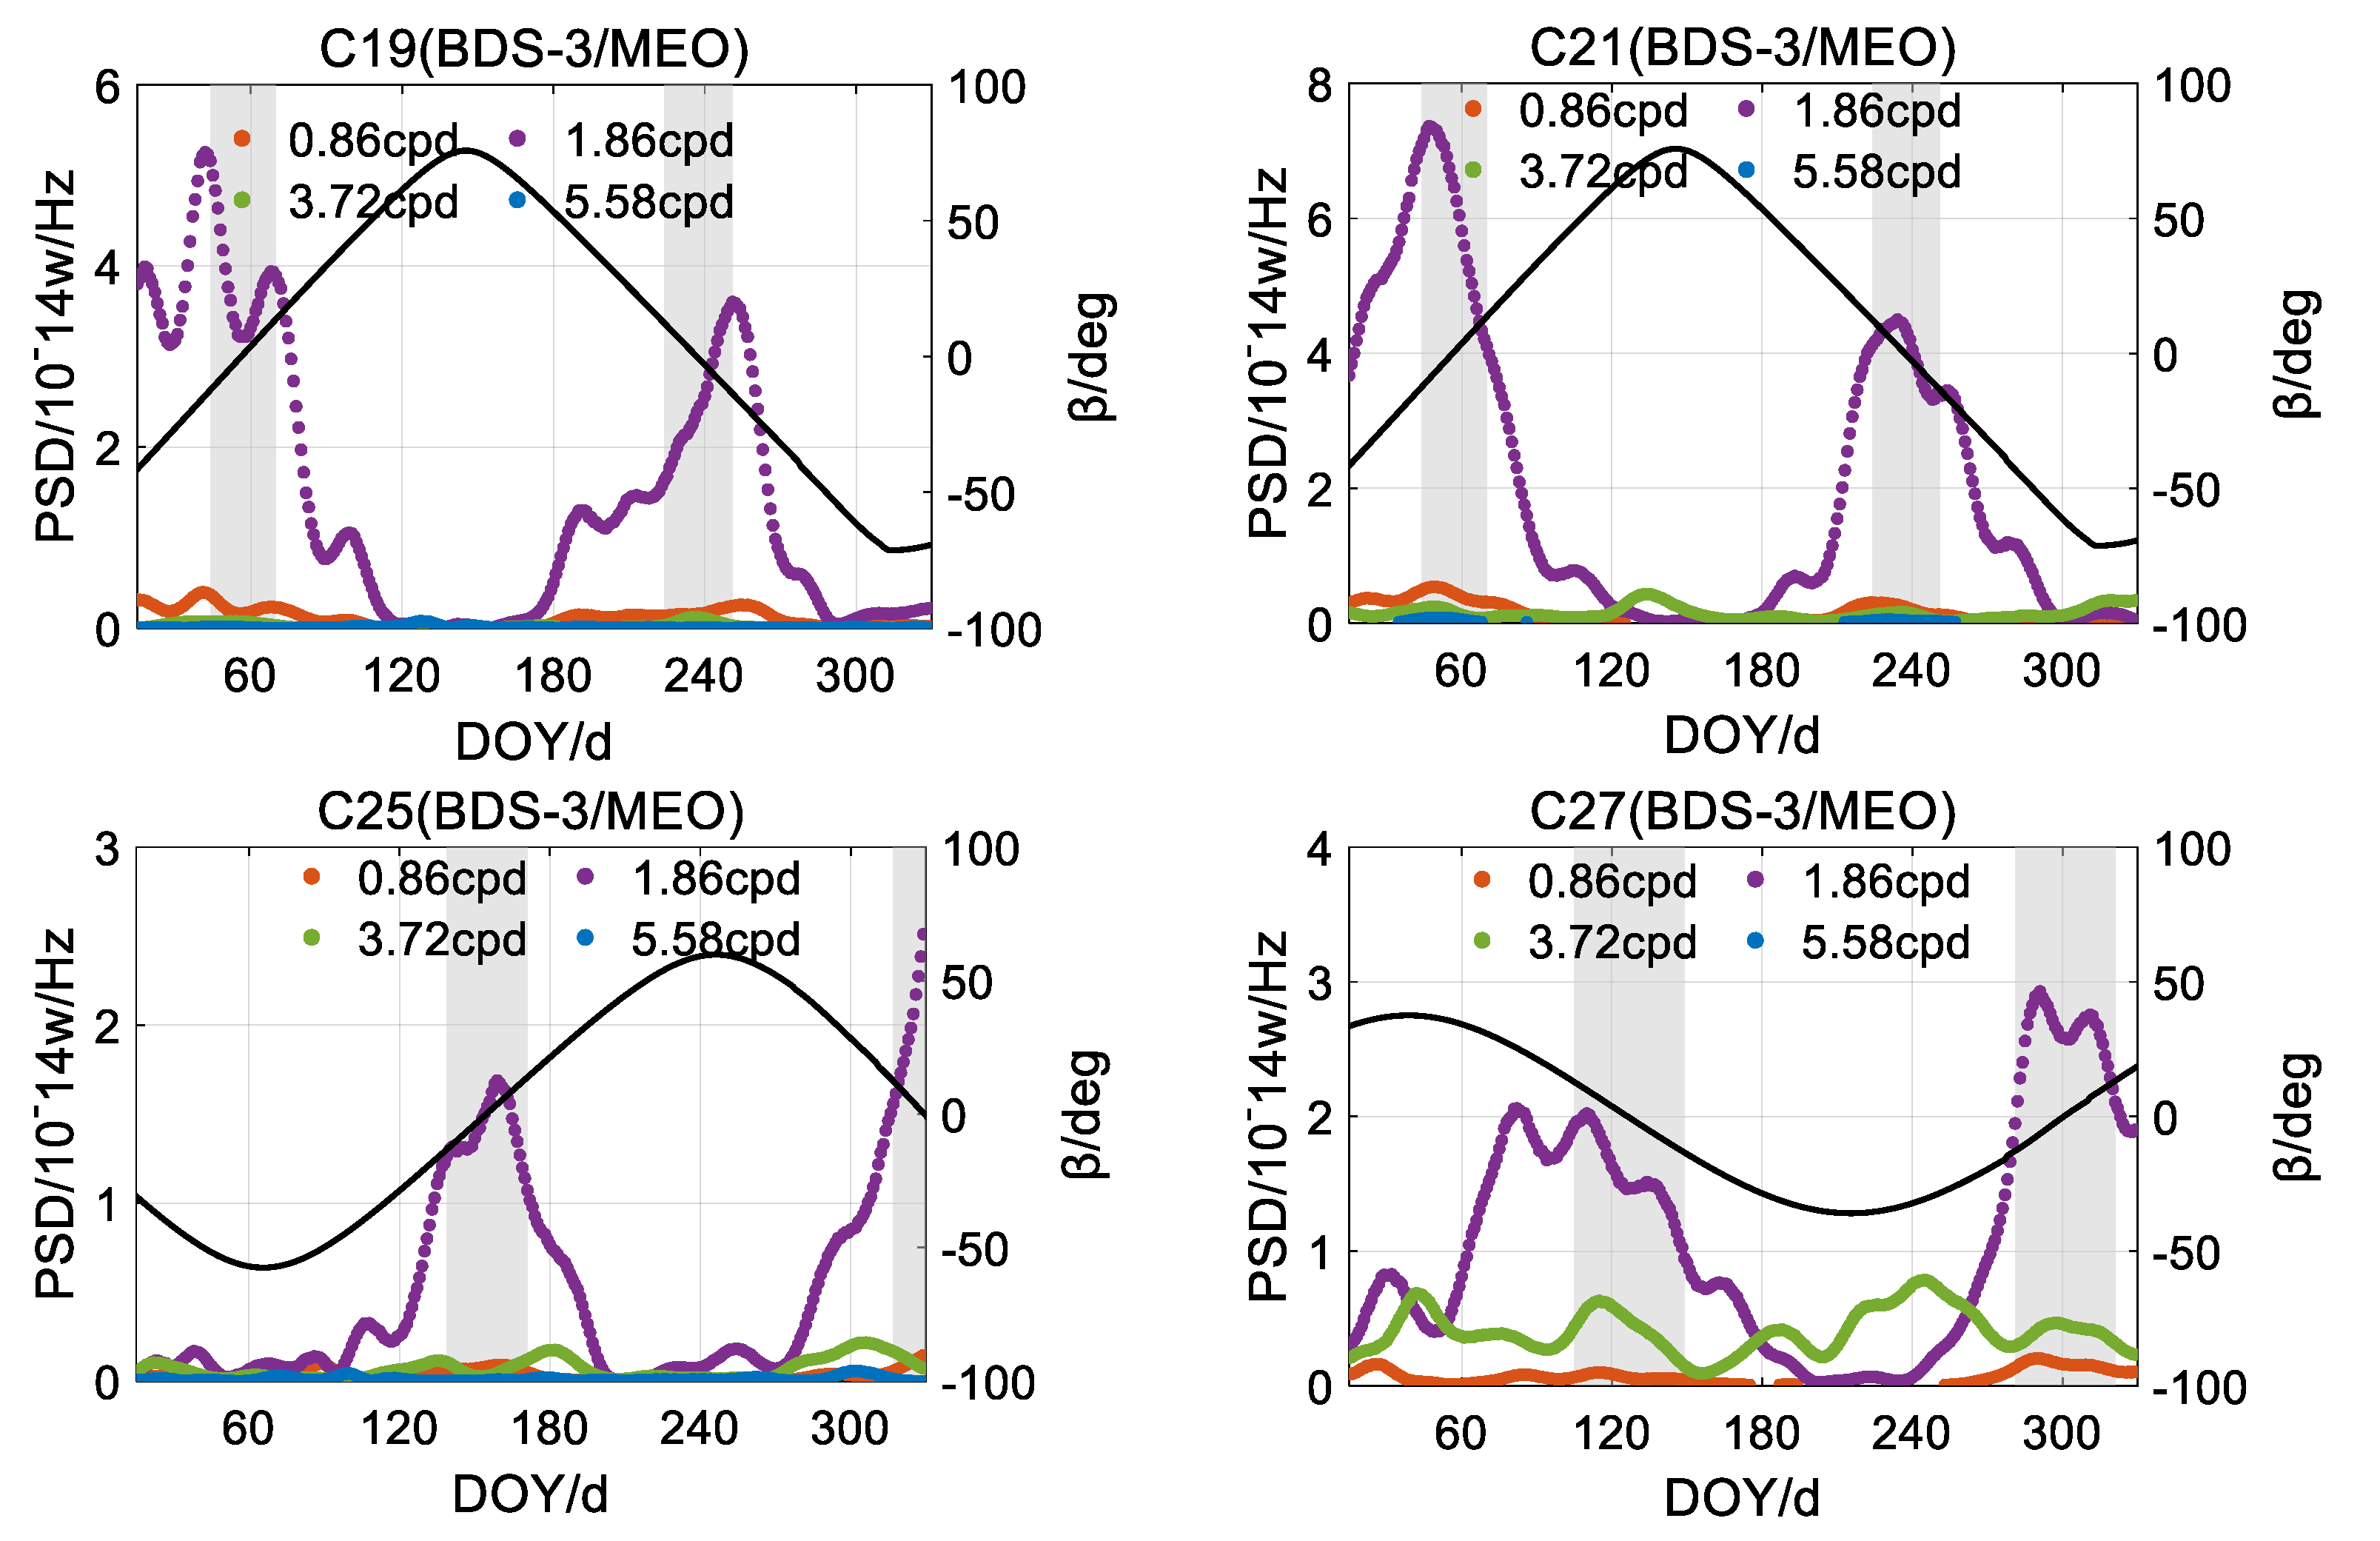
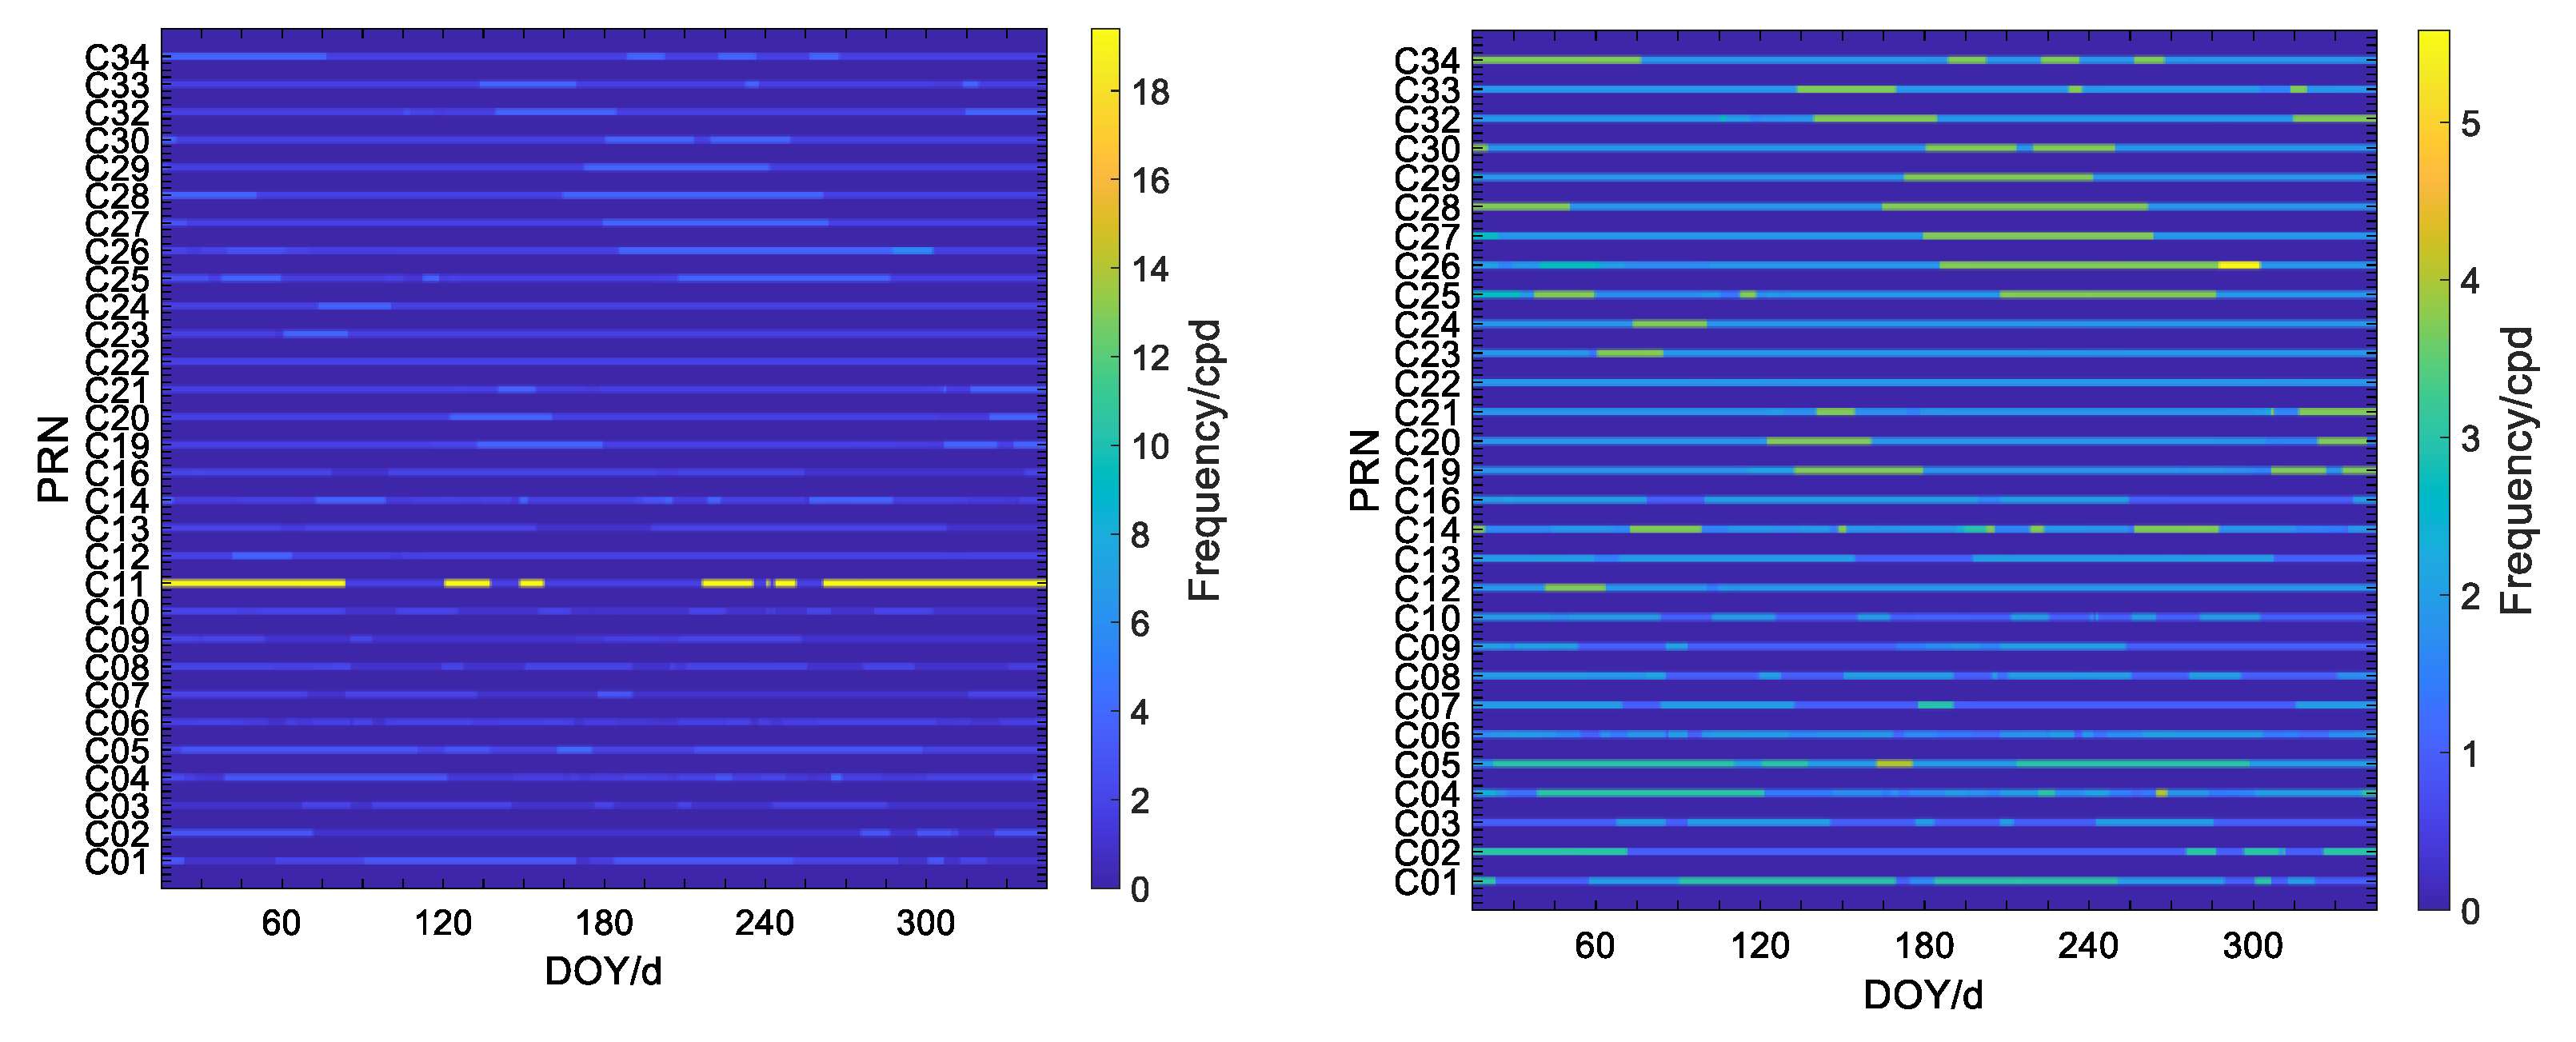
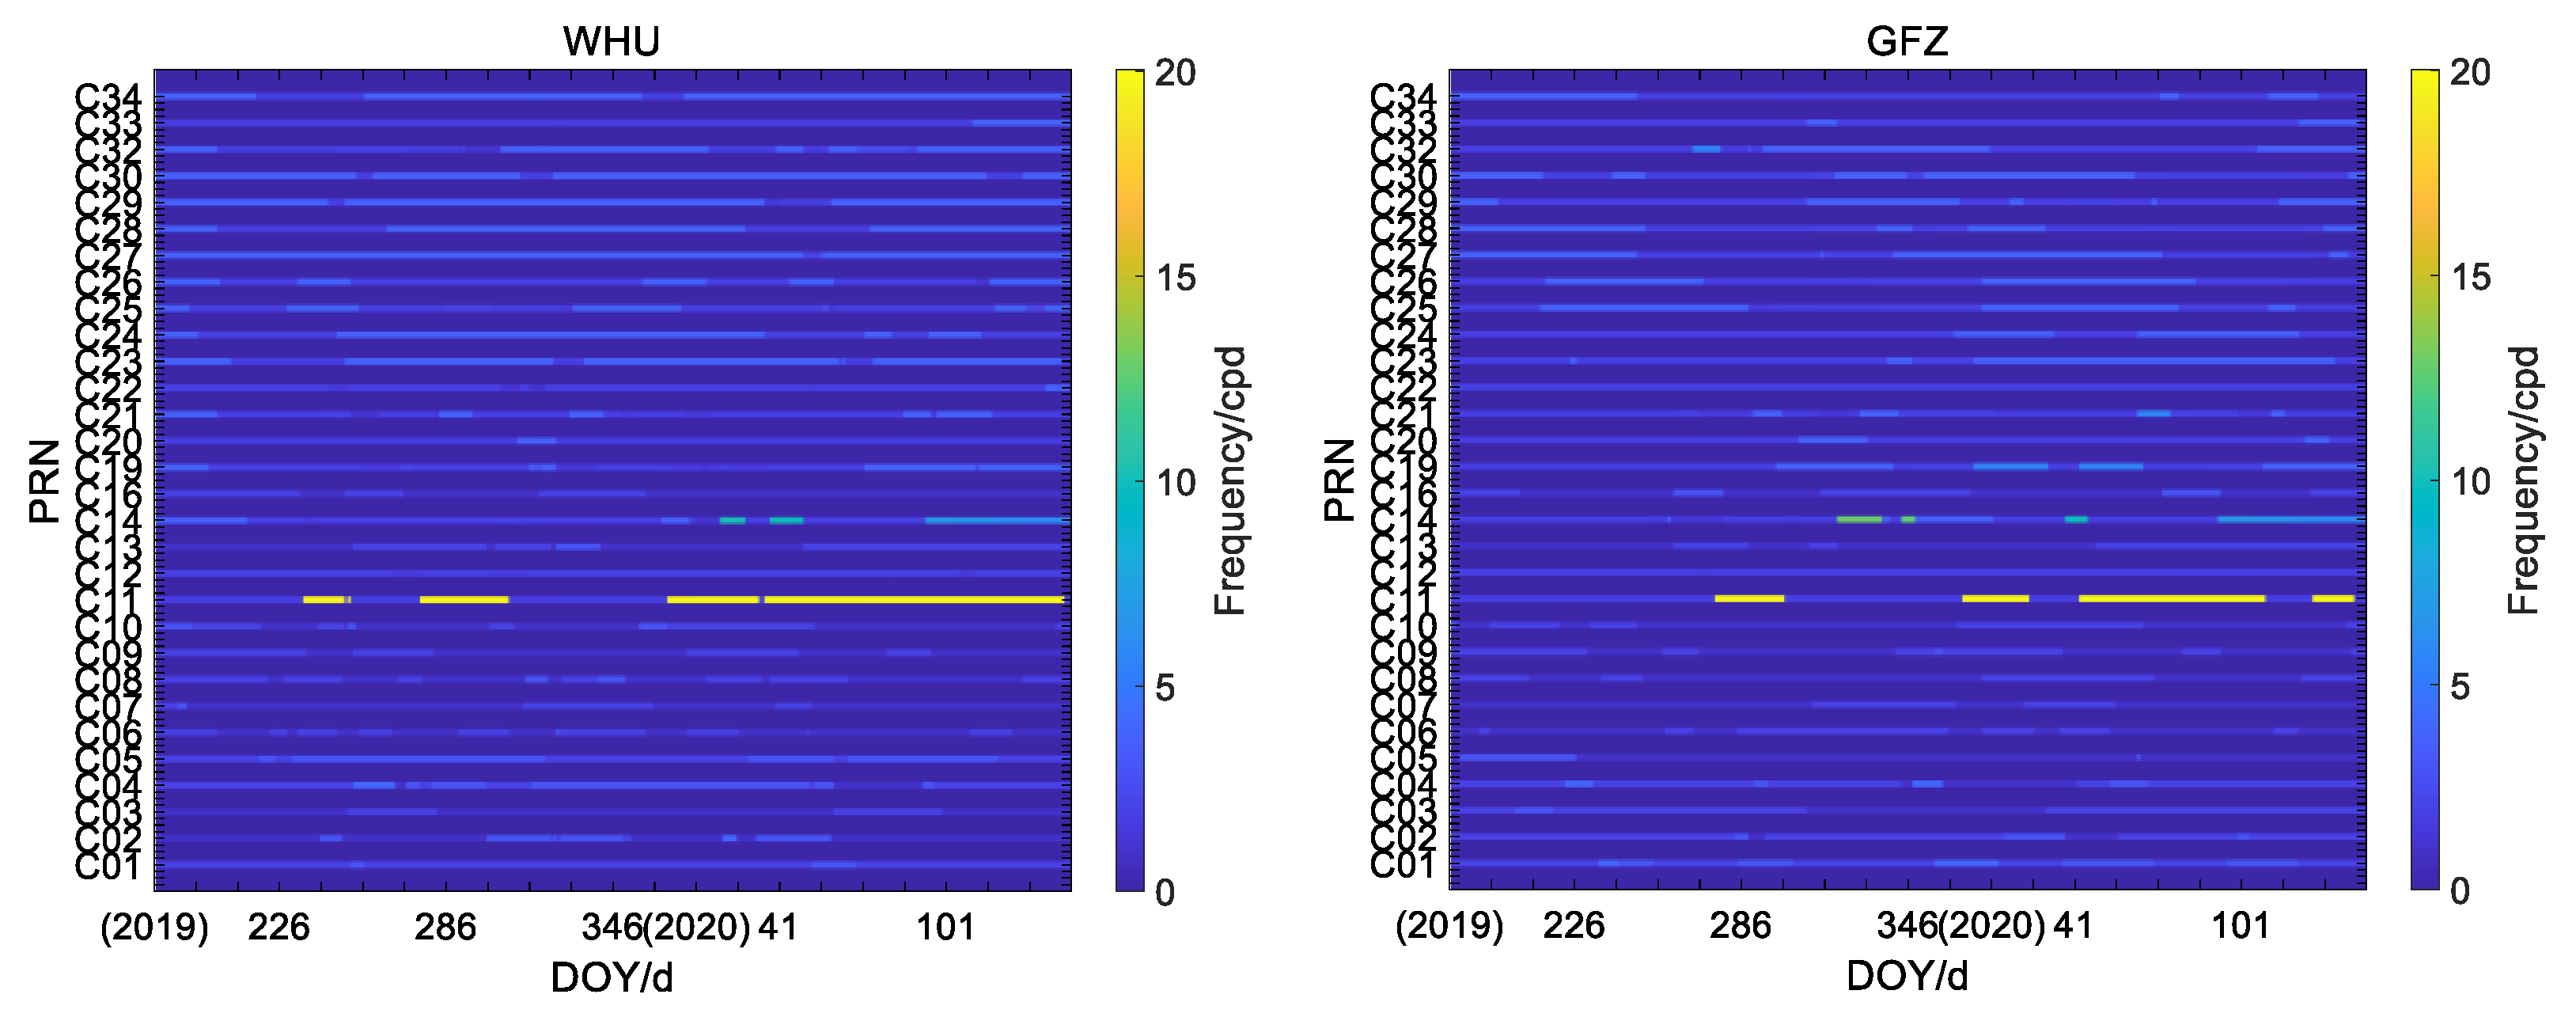
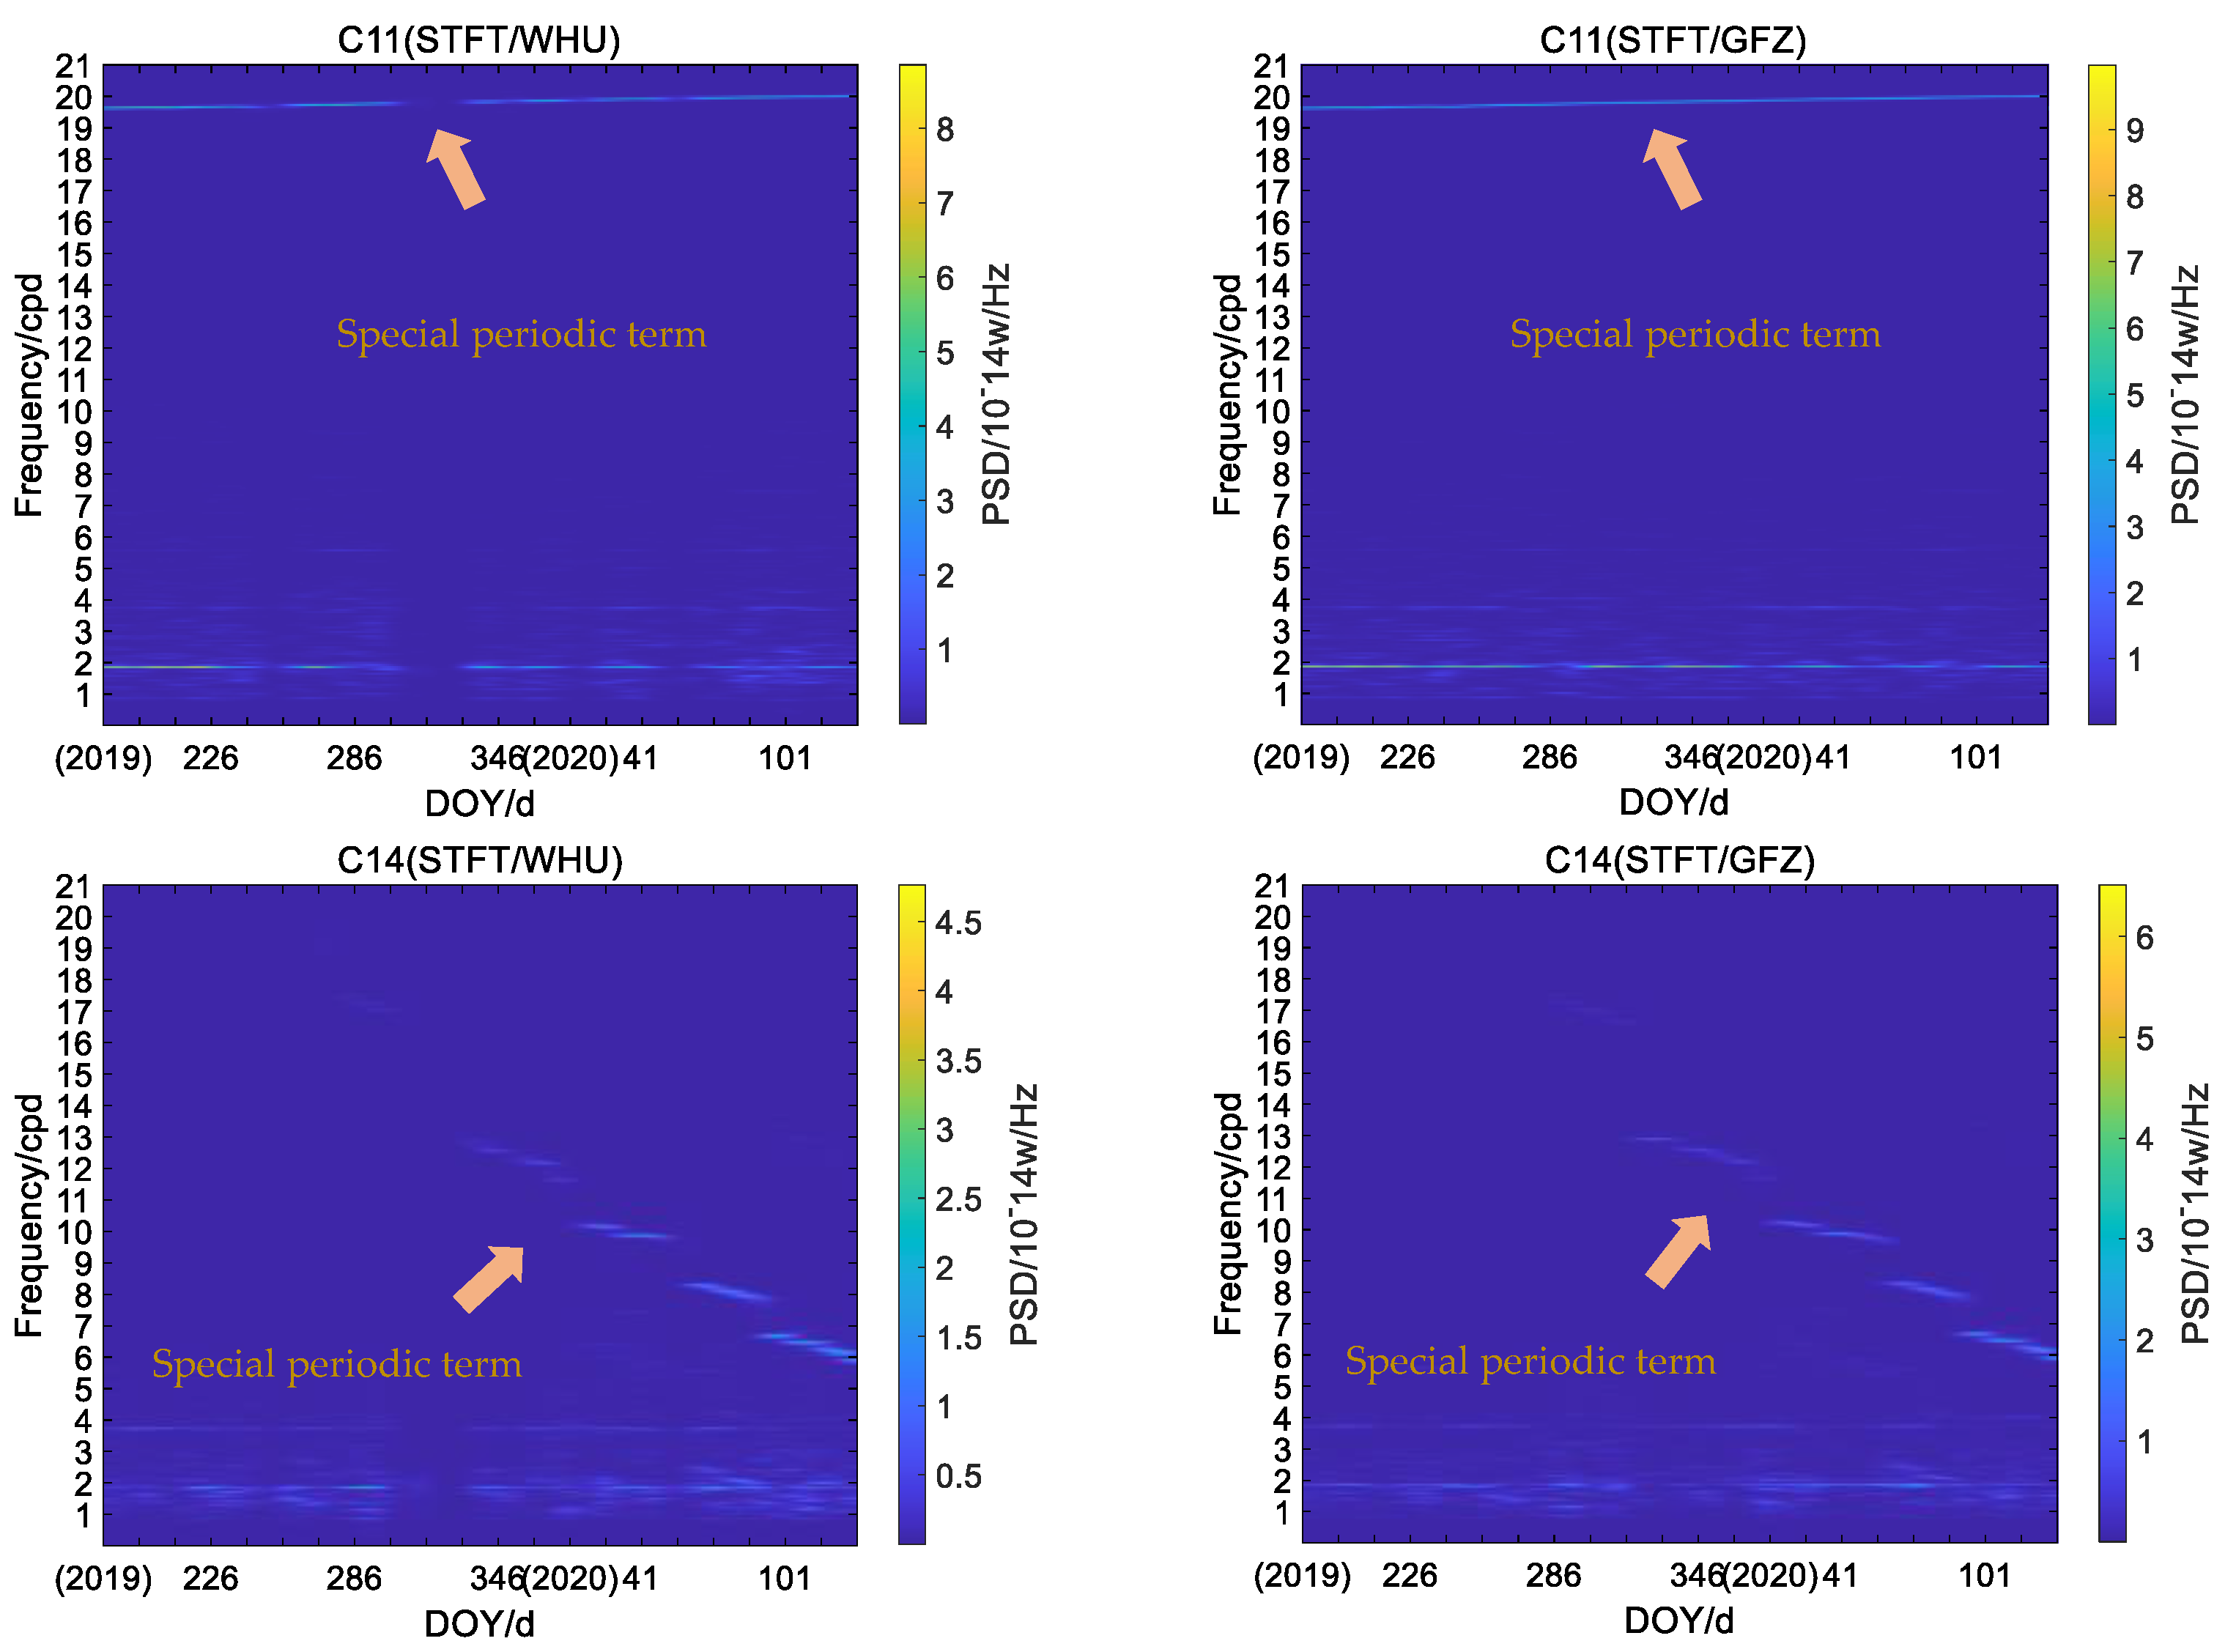
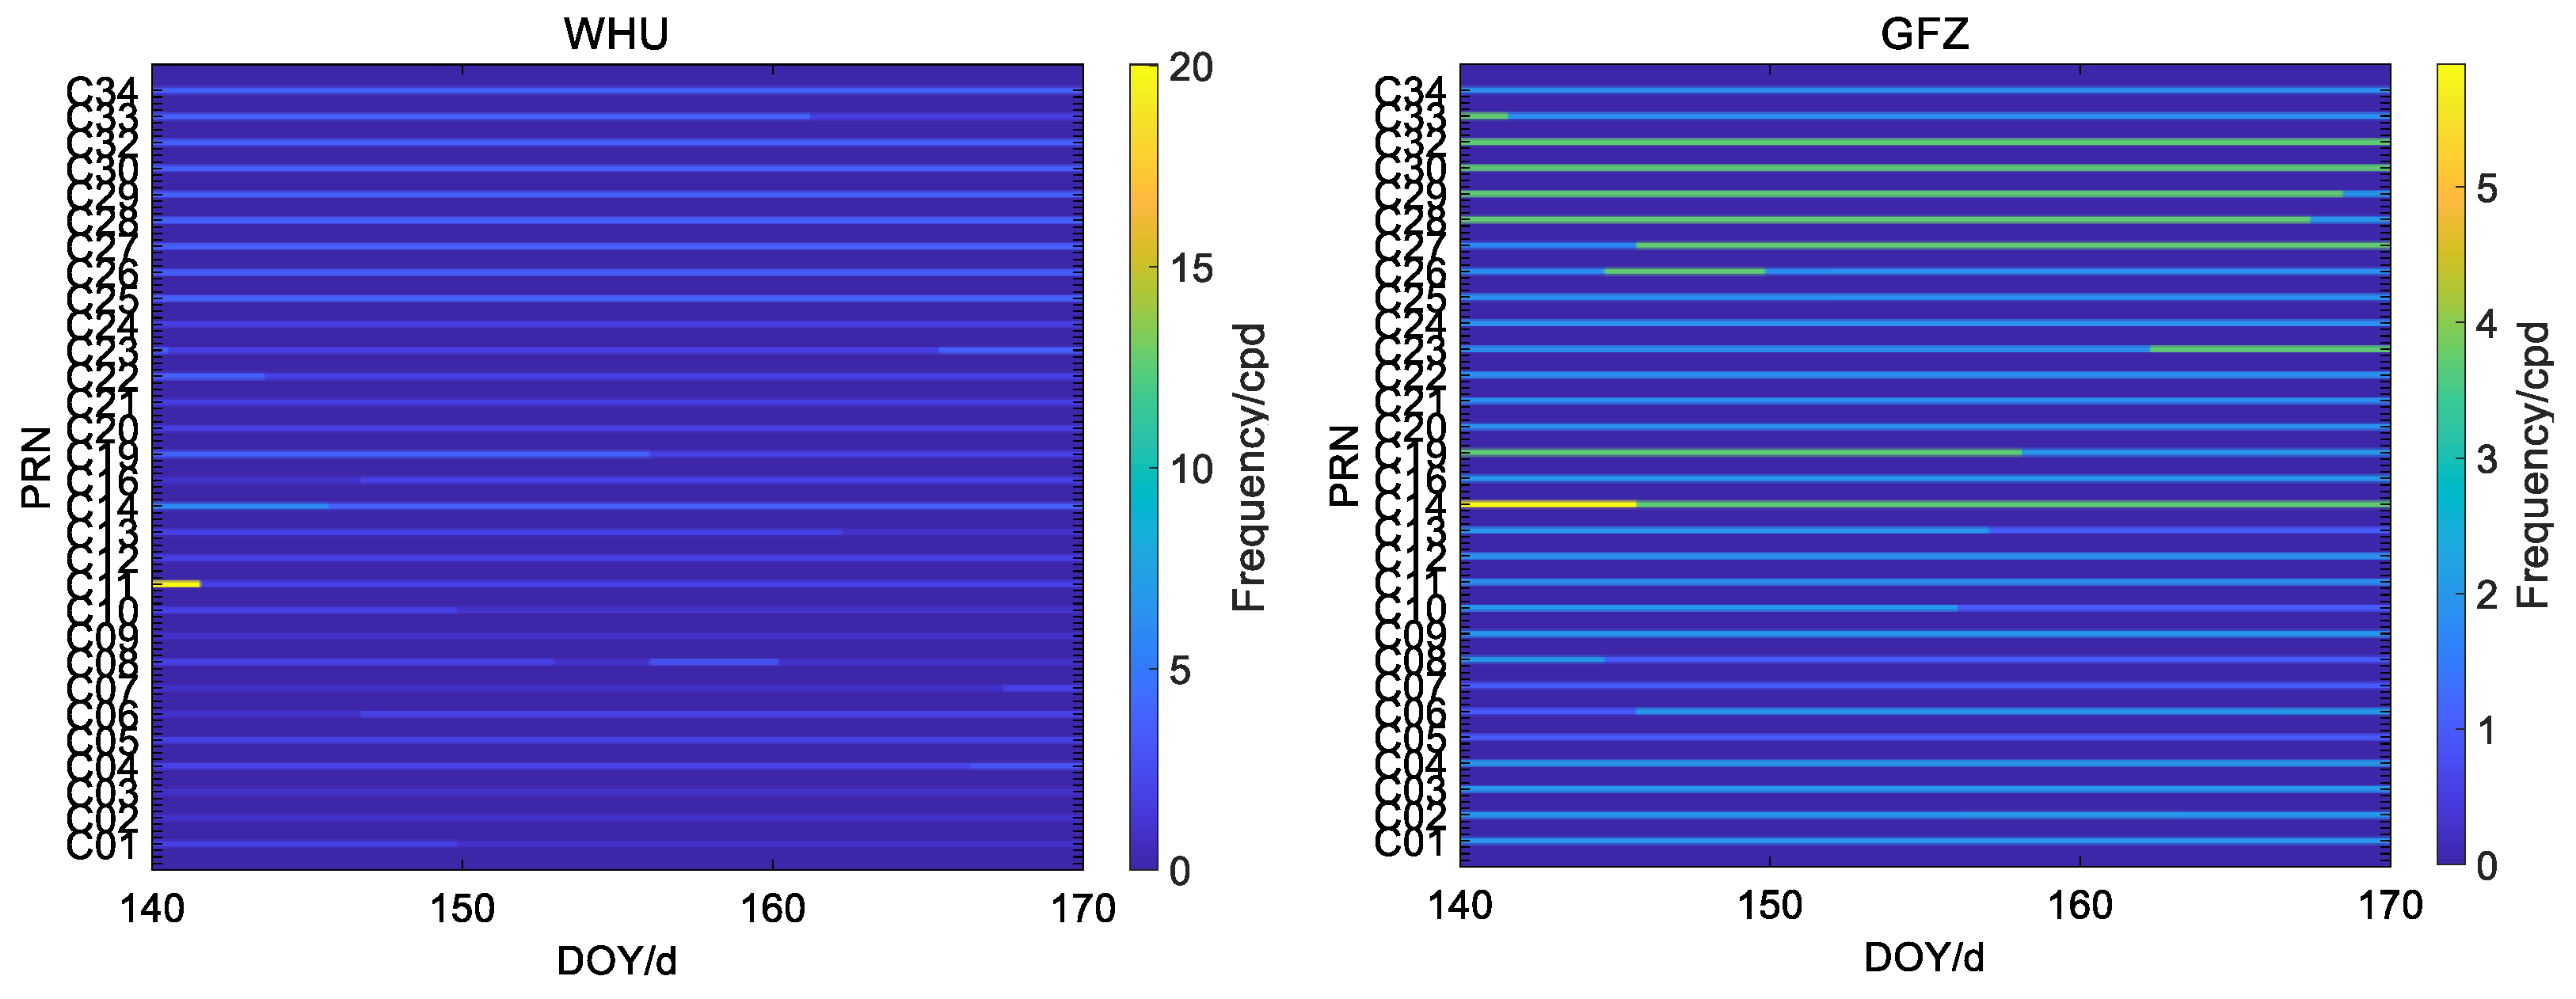
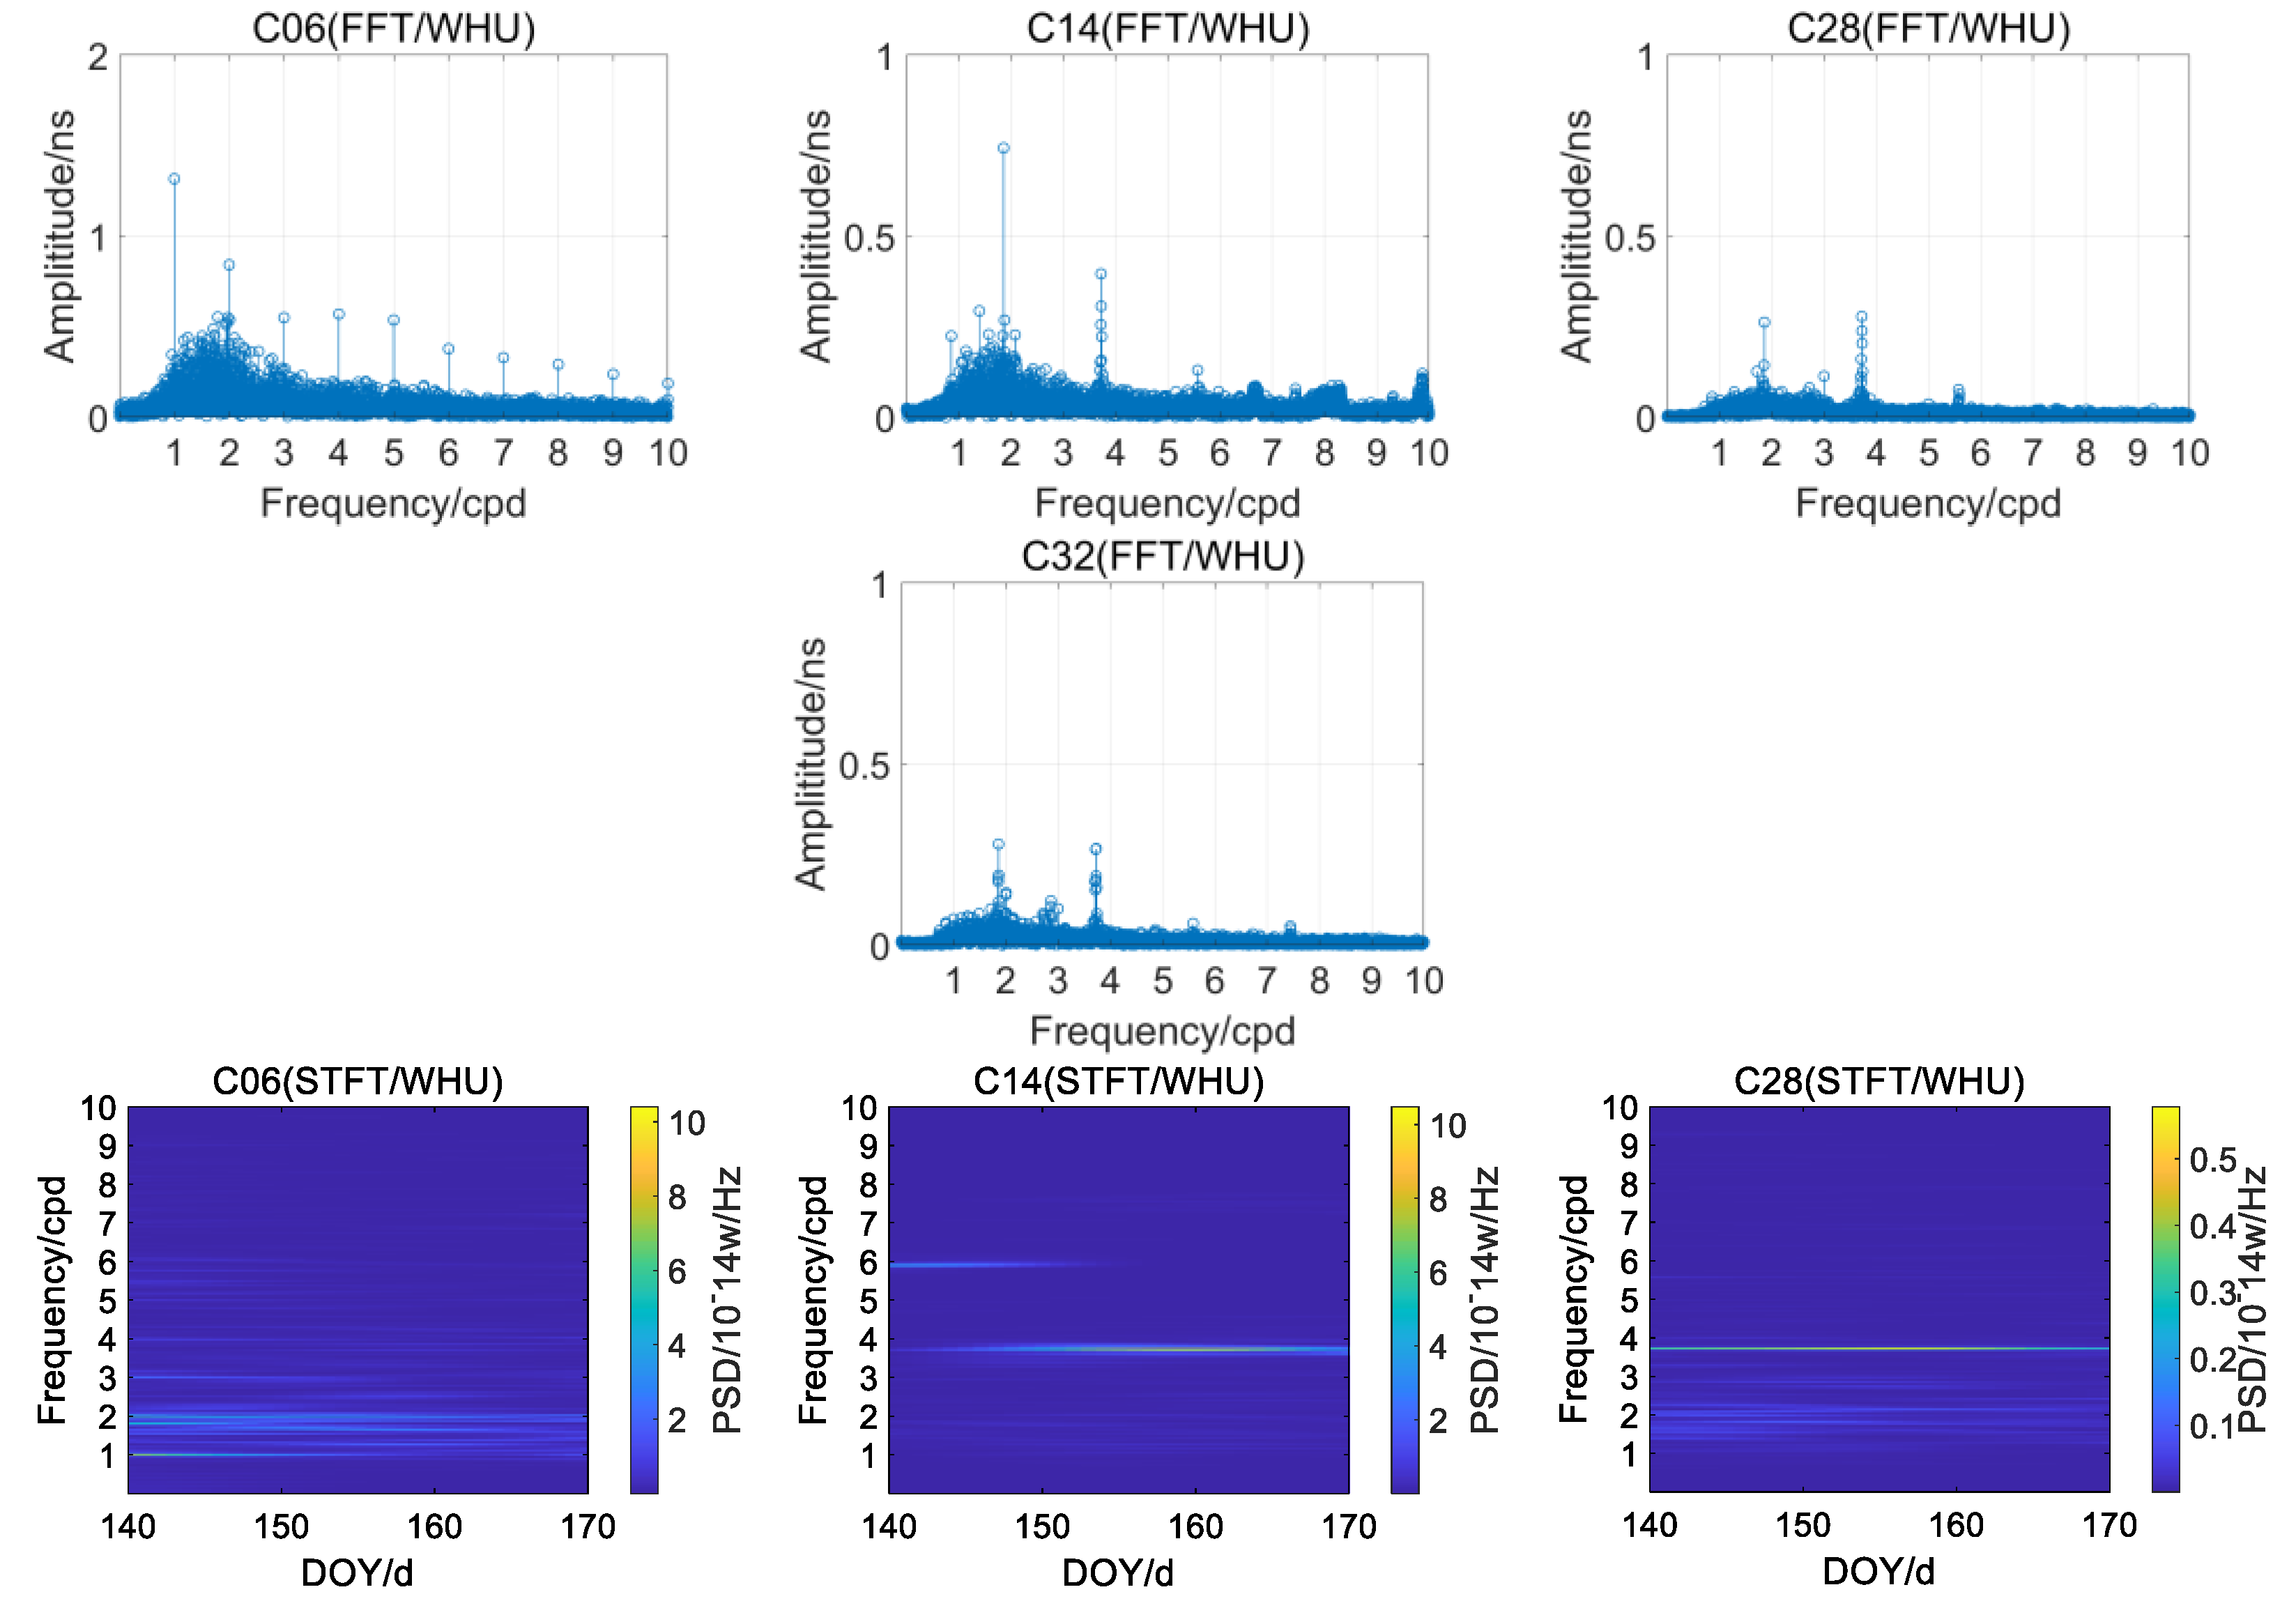
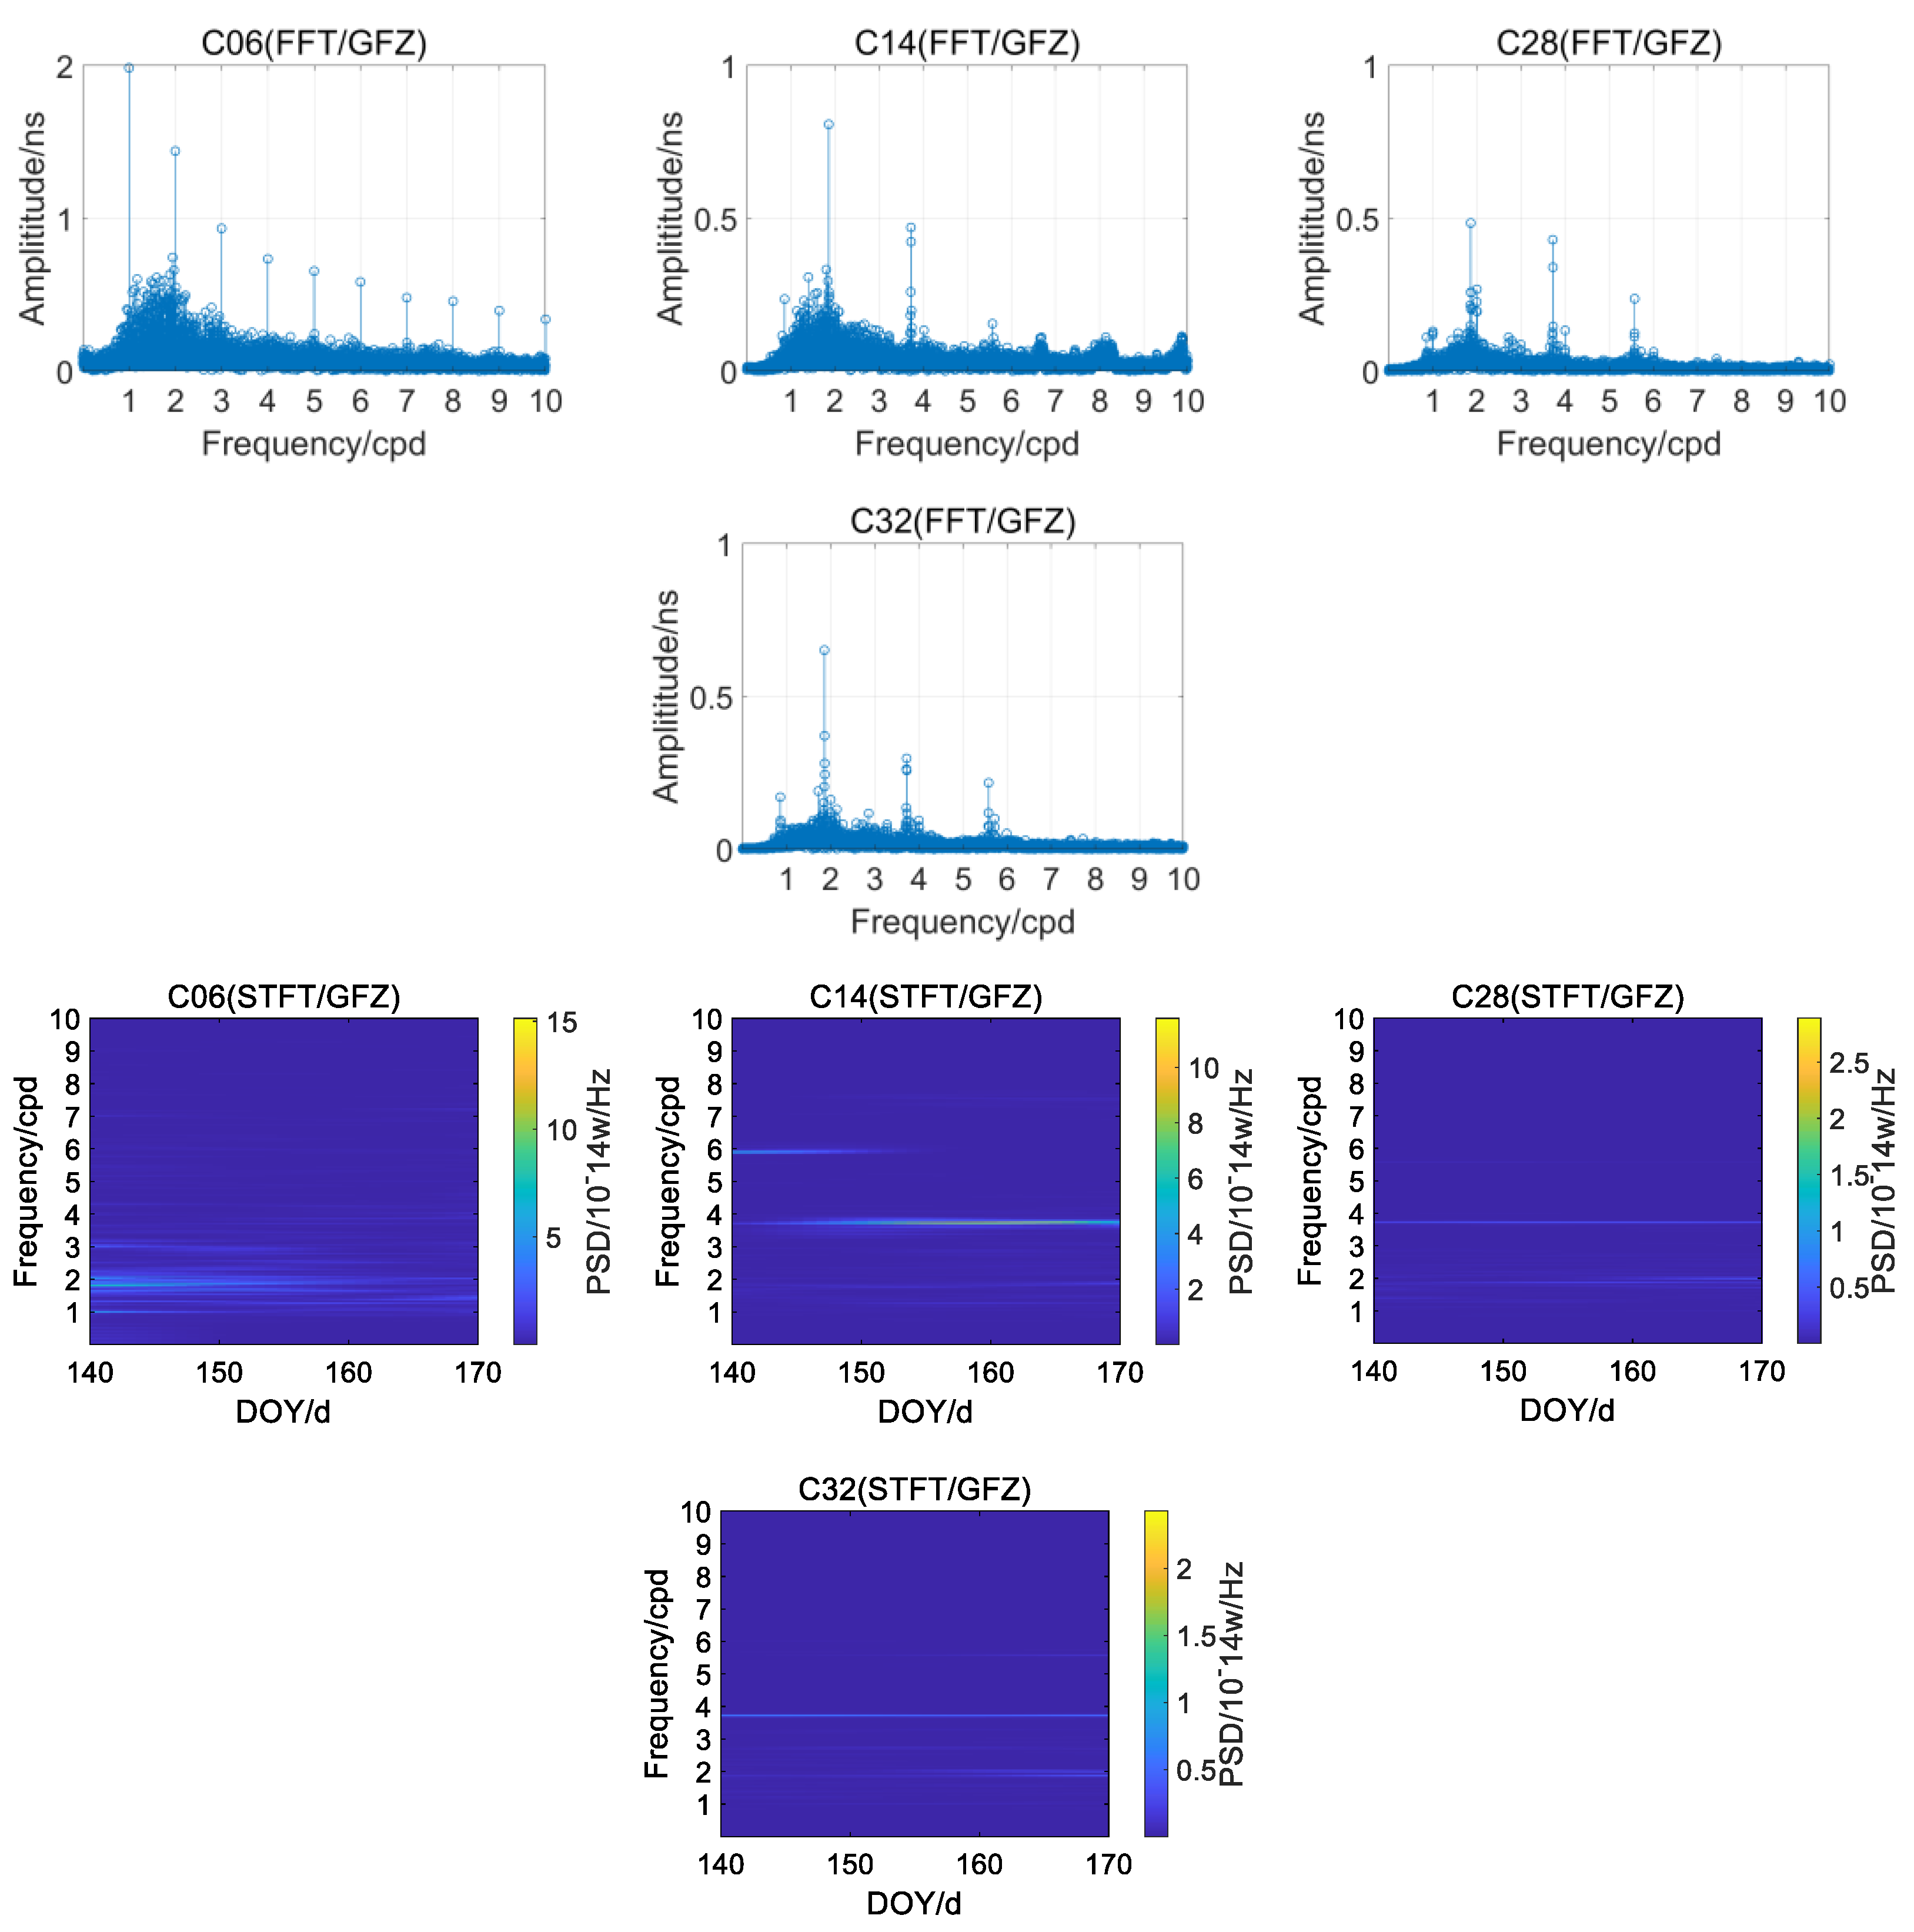
  • Both the amplitude and frequency of periodic terms in clock offsets vary with time for all BDS satellites discussed in this paper.
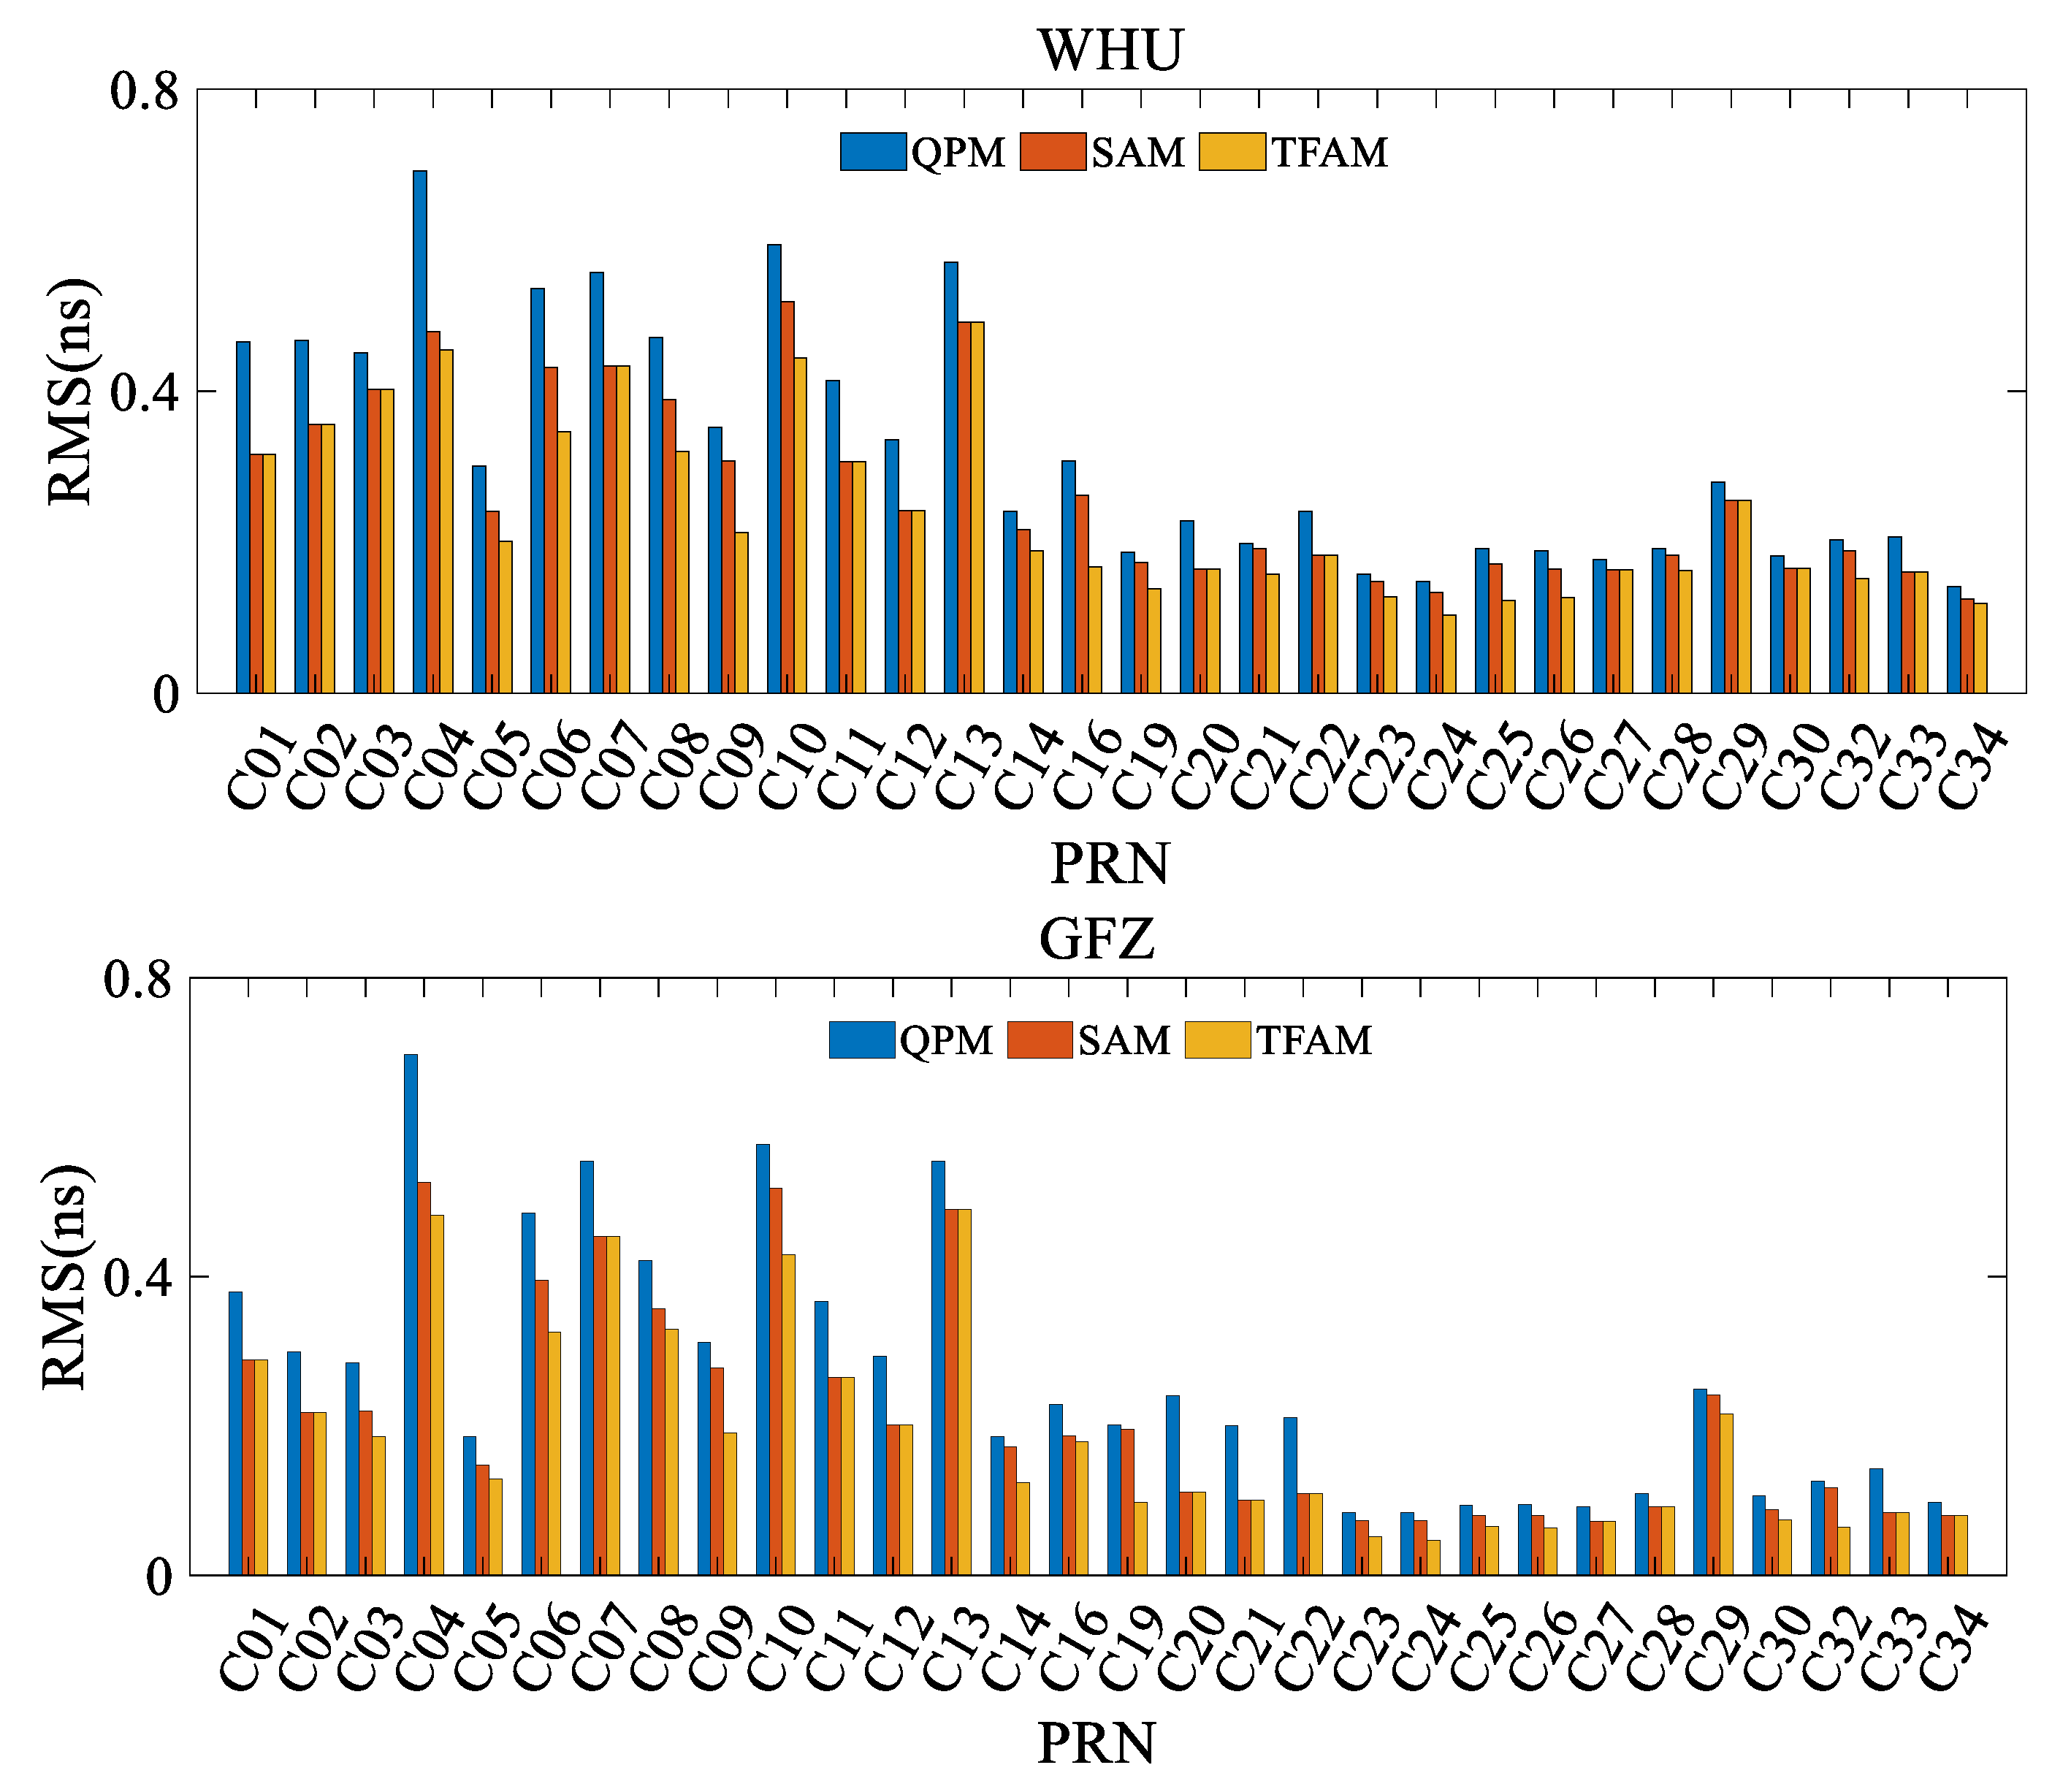
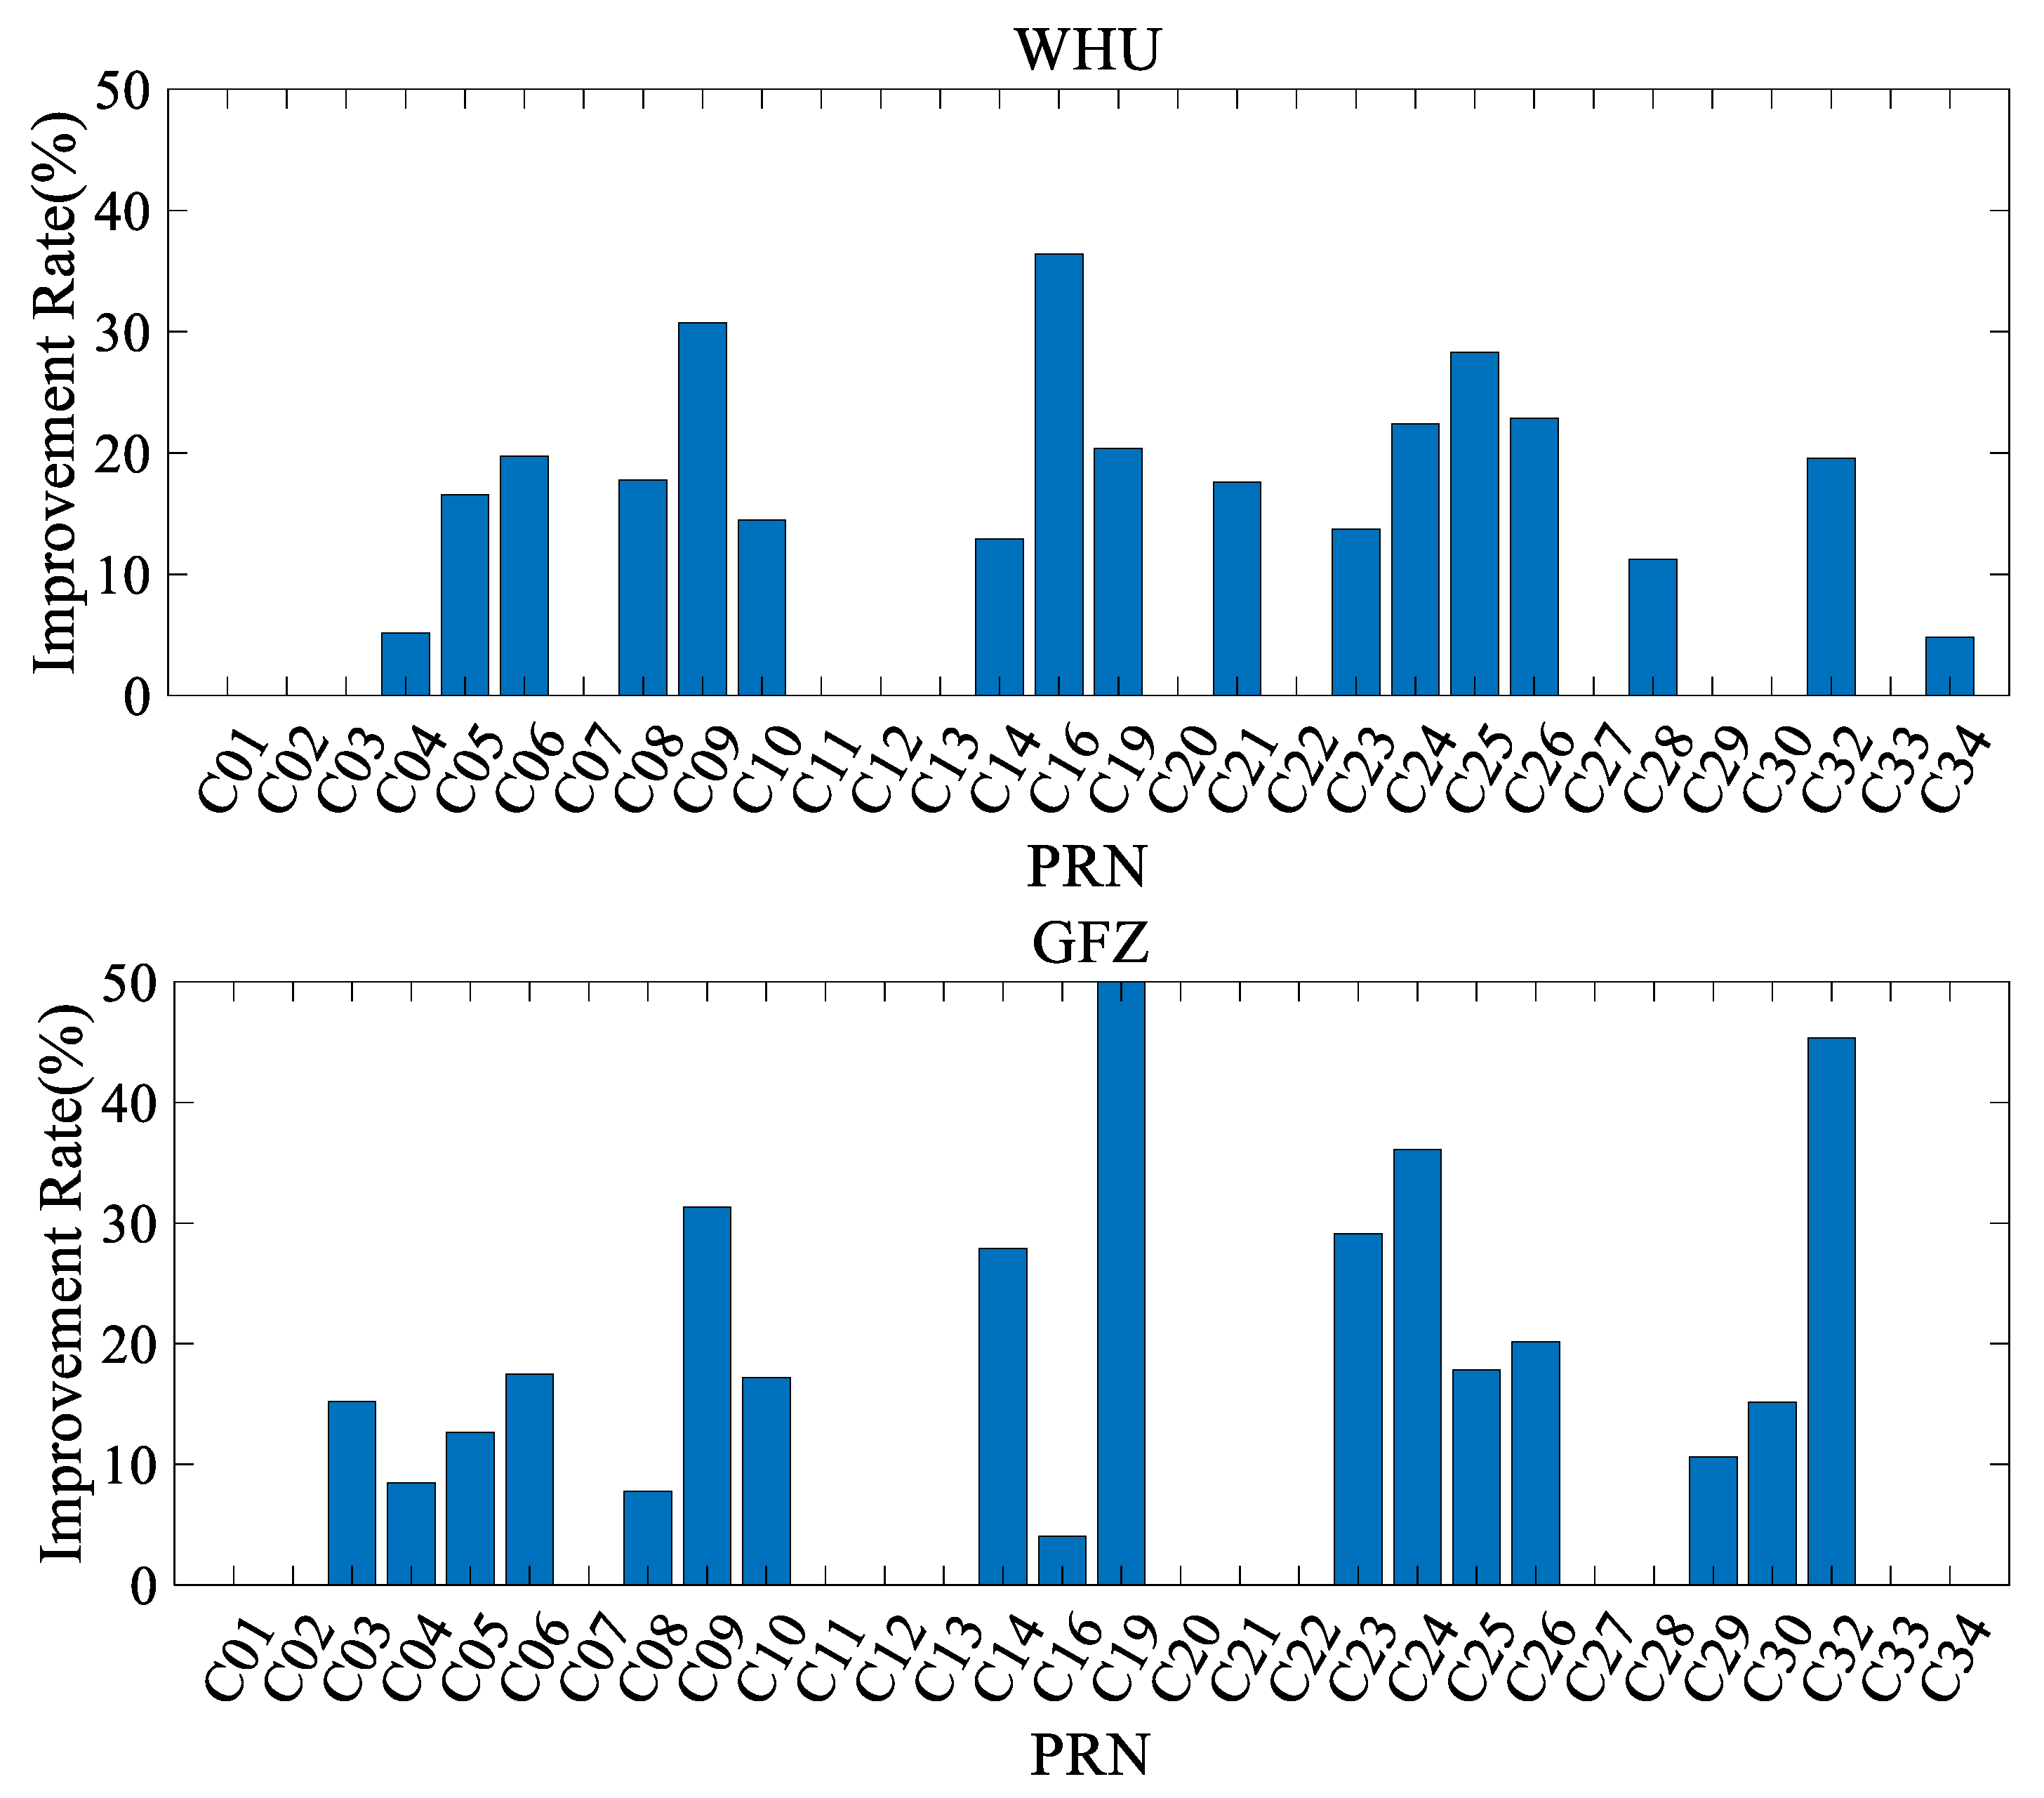
  • For satellites with marked periodic variations, the fitting accuracy of TFAM is significantly improved. Compared with SAM, the mean RMS of the TFAM fitting residuals increases by 10.5% for WHU clock offsets and 12.2% for GFZ clock offsets.
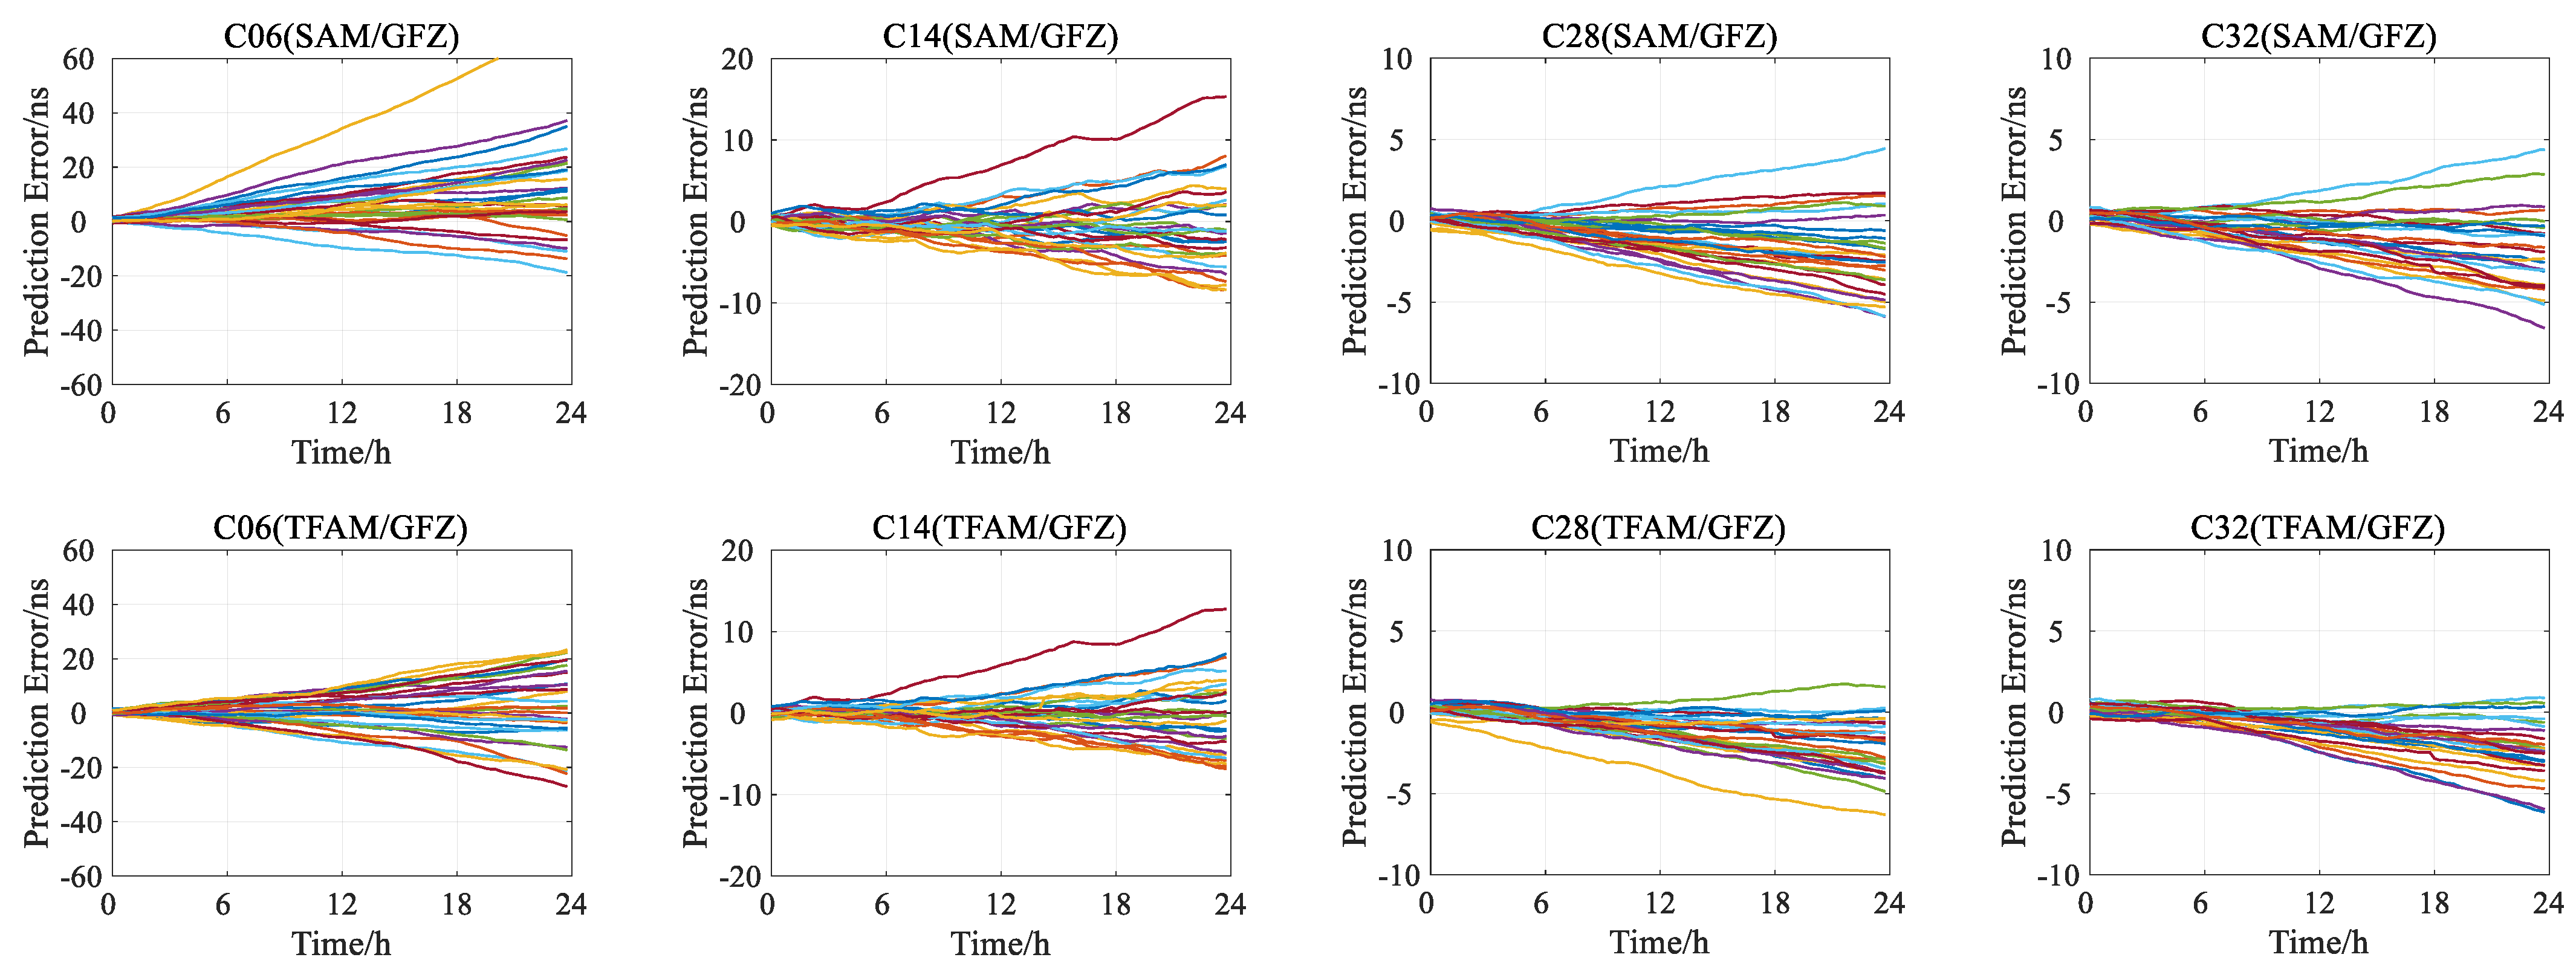
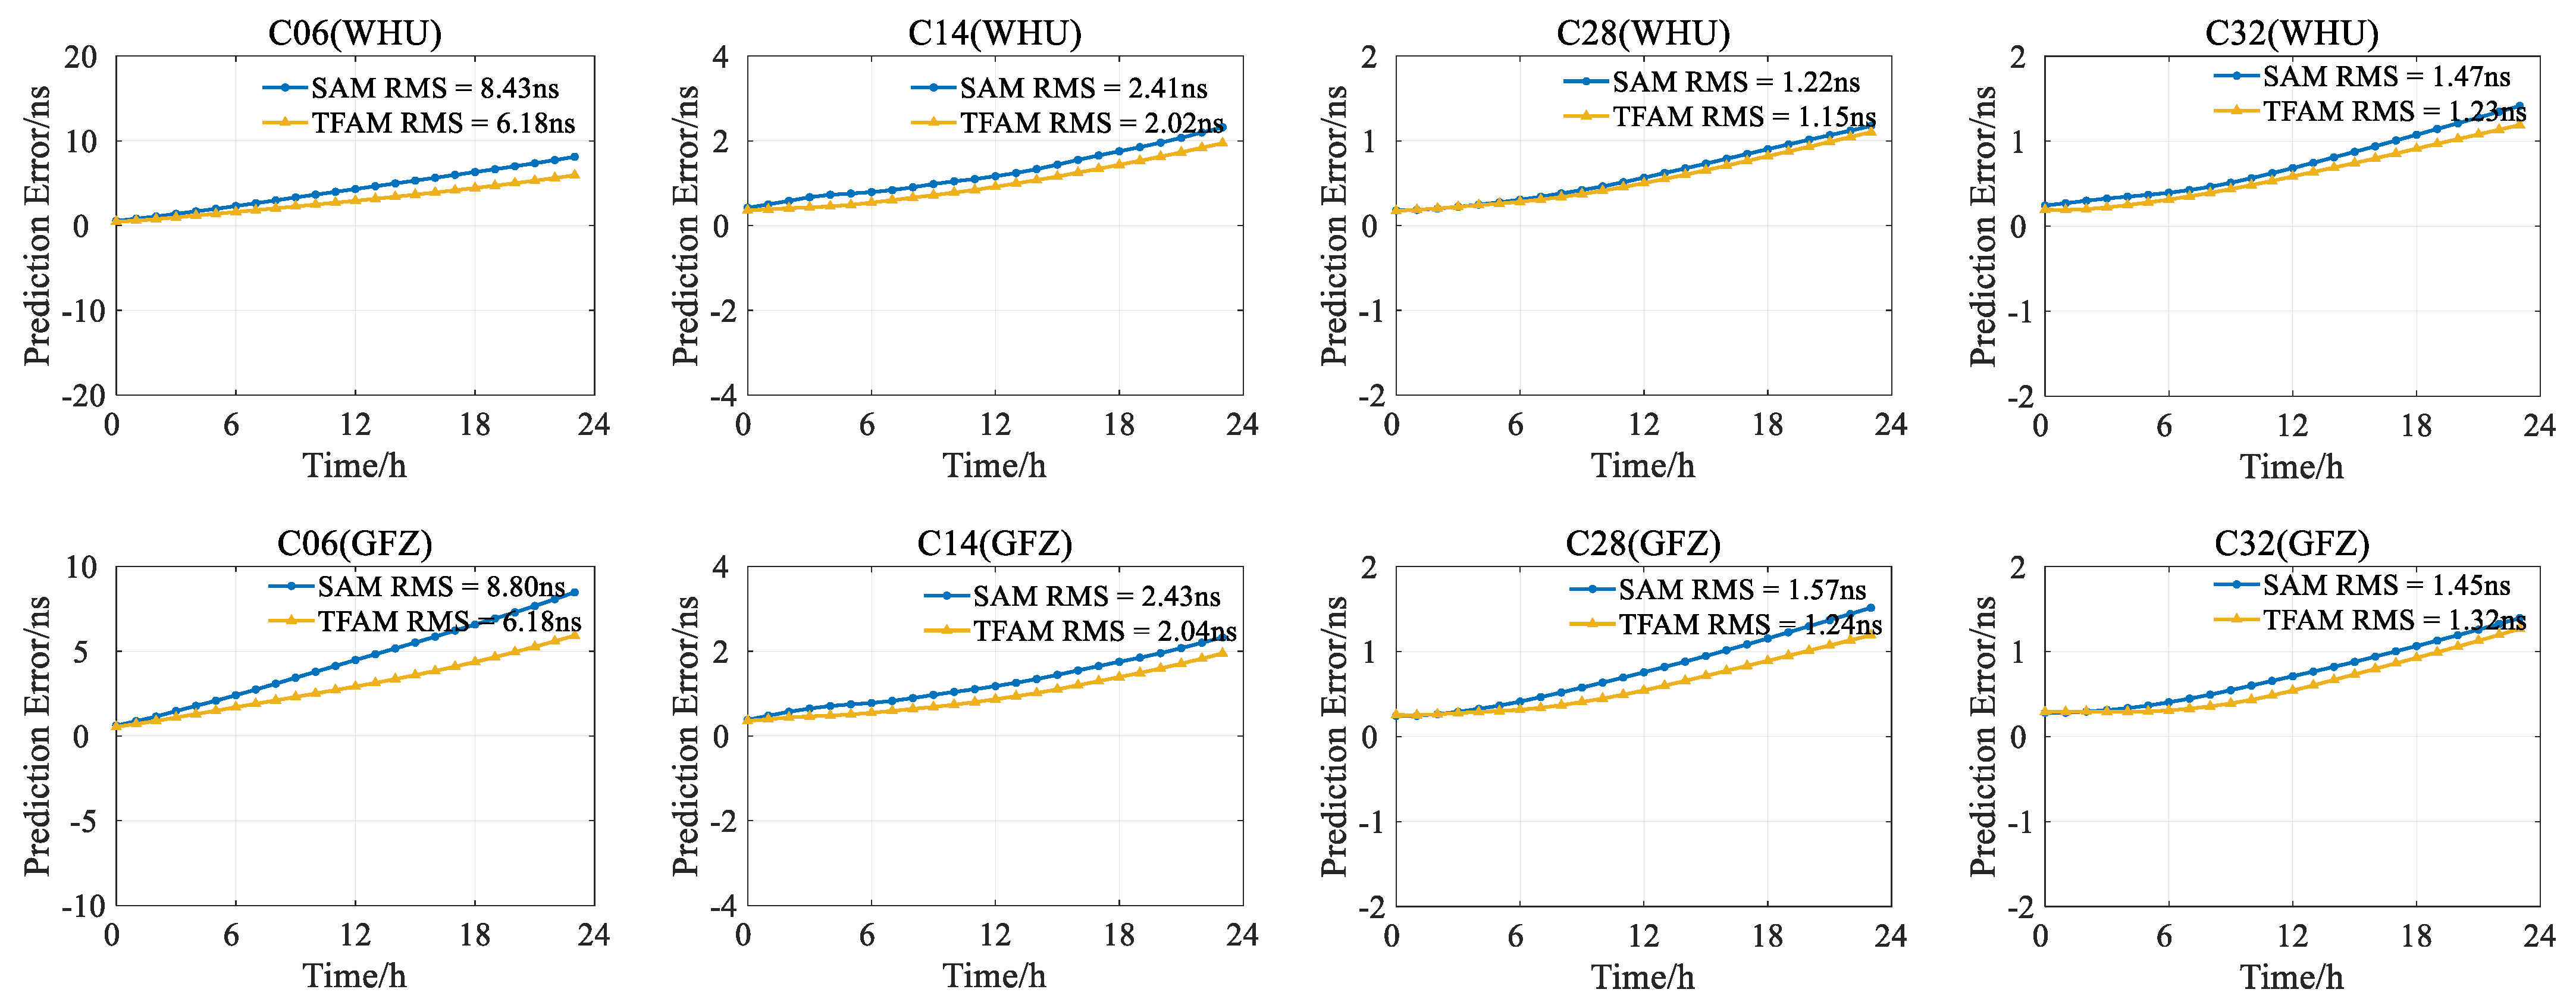
  • TFAM can improve the average prediction accuracy of the SAM. Compared with SAM, the improvement rate of the prediction accuracy using TFAM of the 6 h, 12 h, 18 h and 24 h is in the range of 6.4% to 10% for WHU clock offsets, while 11.1% to 14.4% for GFZ clock offsets.
  • Compared with SAM, for C06, C14, and C32 with marked periodic variations, the prediction accuracy using TFAM is improved by 26.7%, 16.2%, and 16.3% for WHU clock offsets, and 29.8%, 16.0%, 21.0%, and 9.0% of C06, C14, C28, and C32 for GFZ clock offsets.

Author Contributions

Conceptualization, L.Z., H.L. and N.L.; methodology, L.Z., H.L.; validation, N.L., R.W. and M.L.; formal analysis, H.L. and R.W.; investigation, N.L.; resources, L.Z. and H.L.; data curation, N.L. and M.L.; writing—original draft preparation, N.L.; writing—review and editing, H.L. and N.L.; visualization, N.L. and R.W.; supervision, L.Z. and H.L.; project administration, H.L. All authors have read and agreed to the published version of the manuscript.

Funding

This research was funded by the National Natural Science Foundation of China (Nos. 61773132, 61803115), the China Postdoctoral Science Foundation (No. 2020M681078), the Qingdao Postdoctoral Foundation (No. QDBSHYYYJXM20200101), Shandong Province Postdoctoral Innovation Project (No. 202003050), and the Fundamental Research Funds for Central Universities (No. 3072021CFJ0404).

Institutional Review Board Statement

Not applicable.

Informed Consent Statement

Not applicable.

Data Availability Statement

The data supporting this research can be found at the hyperlinks as: https://cddis.nasa.gov/archive/gnss/products/mgex, accessed on 14 August 2021.

Acknowledgments

The authors acknowledge the GNSS Research Center of Wuhan University and the Geo Forschungs Zentrum for providing the data.

Conflicts of Interest

The authors declare no conflict of interest.

References

  1. Zhou, P.; Yang, H.; Xiao, G.; Du, L.; Gao, Y. Estimation of GPS LNAV based on IGS products for real-time PPP. GPS Solut. 2019, 23, 27. [Google Scholar] [CrossRef]
  2. Hadas, T.; Bosy, J. IGS RTS precise orbits and clocks verification and quality degradation over time. GPS Solut. 2015, 19, 93–105. [Google Scholar] [CrossRef] [Green Version]
  3. Yan, X.; Li, W.; Yang, Y.; Li, W.; Yang, Y.; Pan, X. BDS satellite clock prediction based on a semiparametric adjustment model considering model errors. Satell. Navig. 2020, 1, 11. [Google Scholar] [CrossRef]
  4. Han, T. Fractal behavior of BDS-2 satellite clock offsets and its application to real-time clock offsets prediction. GPS Solut. 2020, 24, 35. [Google Scholar] [CrossRef]
  5. El-Mowafy, A.; Deo, M.; Kubo, N. Maintaining real-time precise point positioning during outages of orbit and clock corrections. GPS Solut. 2017, 21, 937–947. [Google Scholar] [CrossRef]
  6. Xue, H.; Xu, T.; Ai, Q.; Wang, S. The Long-Term Performance Analysis and Comparison of BDS on-Board Atomic Clock Based on Precise Clock Products of IGS Analysis Centers. In China Satellite Navigation Conference (CSNC) 2018 Proceedings; CSNC 2018, Harbin, China, May 2018; Sun, J., Yang, C., Guo, S., Eds.; Springer: Singapore, 2018. [Google Scholar]
  7. Wang, W.; Wang, Y.; Yu, C.; Xu, F.; Dou, X. Spaceborne Atomic Clock Performance Review of BDS-3 MEO Satellites. Measurement 2021, 175, 109075. [Google Scholar] [CrossRef]
  8. Lv, Y.; Dai, Z.; Zhao, Q.; Yang, S.; Zhou, J.; Liu, J. Improved Short-Term Clock Prediction Method for Real-Time Positioning. Sensors 2017, 17, 1308. [Google Scholar] [CrossRef] [Green Version]
  9. Hu, C.; Wang, Q.; Min, Y.; Mao, Y.; Gong, Y. An improved model for BDS satellite ultra-rapid clock offset prediction based on BDS-2 and BDS-3 combined estimation. Acta. Geod. Geophys. 2019, 54, 513–543. [Google Scholar] [CrossRef]
  10. Janicka, J.; Tomaszewski, D.; Rapinski, J.; Jagoda, M.; Rutkowska, M. The Prediction of Geocentric Corrections during Communication Link Outages in PPP. Sensors 2020, 20, 602. [Google Scholar] [CrossRef] [Green Version]
  11. Nie, Z.; Gao, Y.; Wang, Z.; Ji, S.; Yang, H. An approach to GPS clock prediction for real-time PPP during outages of RTS stream. GPS Solut. 2018, 22, 14. [Google Scholar] [CrossRef]
  12. Huang, G.; Zhang, Q.; Xu, G. Real-time clock offset prediction with an improved model. GPS Solut. 2014, 18, 95–104. [Google Scholar] [CrossRef]
  13. Zheng, Z.; Chen, Y.; Lu, X. An Improved Grey Model and Its Application Research on the Prediction of Real-time GPS Satellite Clock Errors. Chin. Astron. Astrophys. 2009, 33, 72–89. [Google Scholar]
  14. Xu, J.; Zeng, A. Application of ARIMA (0, 2, q) model to prediction of satellite clock error. J. Geod. Geodyn. 2009, 29, 116–120. [Google Scholar]
  15. Xu, T.H.; Nie, W.F.; Yang, Y.G.; Ai, Q.S. An enhanced prediction model for BDS ultra-rapid clock offset that combines singular spectrum analysis, robust estimation and gray model. Meas. Sci. Technol. 2021, 32, 105002. [Google Scholar] [CrossRef]
  16. Huang, G.; Cui, B.; Zhang, Q.; Li, P.; Xie, W. Switching and performance variations of on-orbit BDS satellite clocks. Adv. Space Res. 2018, 63, 1681–1696. [Google Scholar] [CrossRef]
  17. Lv, Y.; Geng, T.; Zhao, Q.; Liu, J. Characteristics of BeiDou-3 Experimental Satellite Clocks. Remote. Sens. 2018, 10, 1847. [Google Scholar] [CrossRef] [Green Version]
  18. Yang, H.; Xu, C.; Gao, Y. Analysis of GPS satellite clock prediction performance with different update intervals and application to real-time PPP. Surv. Rev. 2017, 51, 43–52. [Google Scholar] [CrossRef]
  19. Hauschild, H.; Montenbruck, O.; Steigenberger, P. Short-term analysis of GNSS clocks. GPS Solut. 2013, 17, 295–307. [Google Scholar] [CrossRef]
  20. Zhou, P.; Du, L.; Lu, Y.; Fang, S.; Zhang, Z.; Yang, L. Periodic variations of BeiDou Satellite Clock Offsets Derived from Multi-satellite Orbit Determination. J. Geod. Geoinf. Sci. 2015, 44, 1299–1306. [Google Scholar]
  21. Guo, J.; Xu, X.; Zhao, Q.; Liu, J. Precise orbit determination for quad-constellation satellites at Wuhan University: Strategy, result validation, and comparison. J. Geod. 2016, 90, 143–159. [Google Scholar] [CrossRef]
  22. Bhattarai, S. Satellite Clock Time Offset Prediction in Global Navigation Satellite Systems. Ph.D. Thesis, University College London, London, UK, 2015. [Google Scholar]
  23. Youn, J.H.; Jeongho, C.; Moon, B.H. Improving prediction accuracy of GPS satellite clocks with periodic variation behavior. Meas. Sci. Technol. 2010, 21, 073001. [Google Scholar]
  24. Montenbruck, O.; Hugentobler, U.; Dach, R.; Steigenberger, P.; Hauschild, A. Apparent clock variations of the Block IIF-1 (SVN62) GPS satellite. GPS Solut. 2012, 16, 303–313. [Google Scholar] [CrossRef]
  25. Xu, B.; Wang, L.; Fu, W.; Chen, R.; Li, T.; Zhang, X. A Practical Adaptive Clock Offset Prediction Model for the Beidou-2 System. Remote. Sens. 2019, 11, 1850. [Google Scholar] [CrossRef] [Green Version]
  26. Huang, G.; Cui, B.; Zhang, Q.; Fu, W.; Li, P. An Improved Predicted Model for BDS Ultra-Rapid Satellite Clock Offsets. Remote Sens. 2018, 10, 60. [Google Scholar] [CrossRef] [Green Version]
  27. He, L.; Zho, H.; Liu, Z.; Wen, Y. Improving Clock Prediction Algorithm for BDS-2/3 Satellites Based on LS-SVM Method. Remote Sens. 2019, 11, 2554. [Google Scholar] [CrossRef] [Green Version]
  28. Chen, Q.; Dam, T.V.; Sneeuw, N.; Collilieux, X.; Weigelt, M.; Rebischung, P. Singular spectrum analysis for modeling seasonal signals from GPS time series. J. Geodyn. 2013, 72, 25–35. [Google Scholar] [CrossRef]
  29. Senior, K.L.; Ray, J.R.; Beard, R.L. Characterization of periodic variations in the GPS satellite clocks. GPS Solut. 2008, 12, 211–225. [Google Scholar] [CrossRef]
  30. Formichella, V.; Galleani, L.; Signorile, G.; Sesia, L. Time–frequency analysis of the Galileo satellite clocks: Looking for the J2 relativistic effect and other periodic variations. GPS Solut. 2021, 25, 56. [Google Scholar] [CrossRef]
  31. Wang, B.; Lou, Y.; Liu, J.; Zhao, Q.; Su, X. Analysis of BDS satellite clocks in orbit. GPS Solut. 2016, 20, 783–794. [Google Scholar] [CrossRef]
  32. Wang, G.; Liu, L.; Xu, A.; Pan, F.; Cai, Z.; Xiao, S.; Tu, Y.; Li, Z. On the capabilities of the inaction method for extracting the periodic components from GPS clock data. GPS Solut. 2018, 22, 92. [Google Scholar] [CrossRef] [Green Version]
  33. Wang, D.; Guo, R.; Xiao, S.; Xin, J.; Tang, T.; Yuan, Y. Atomic clock performance and combined clock error prediction for the new generation of BeiDou navigation satellites. Adv. Space Res. 2018, 63, 2889–2898. [Google Scholar] [CrossRef]
  34. Tian, J.; Huang, G.; Wang, L.; Zhang, Q.; Liu, W. A Data Quality Control Method for the Beidou-2 Satellite Clock bias. J. Geod. Geodyn. 2017, 37, 215–220. [Google Scholar]
  35. Wang, C. Solar radiation pressure modelling for BeiDou navigation satellites. Ph.D. Thesis, Wuhan University, Wuhan, China, 2019. [Google Scholar]
  36. Tan, B.; Yuan, Y.; Zhang, B.; Hsu, H.; Ou, J. A new analytical solar radiation pressure model for current BeiDou satellites: IGGBSPM. Sci. Rep. 2016, 6, 32967. [Google Scholar] [CrossRef]
  37. Wang, C.; Guo, J.; Zhao, Q.; Liu, J. Empirically derived model of solar radiation pressure for BeiDou GEO satellites. J. Geod. 2018, 93, 791–807. [Google Scholar] [CrossRef]
  38. Pavlis, N.; Holmes, S.; Kenyon, S.; Factor, J. The development and evaluation of the earth gravitational model 2008 (EGM2008). J. Geophys. Res. Solid Earth 2013, 118, 2633. [Google Scholar] [CrossRef]
  39. Lyard, F.; Lefevre, F.; Letellier, T.; Letellier, T.; Francis, O. Modelling the global ocean tides: Modern insights from ES2004. J. Geophys. Res. Atmos. 2004, 56, 394–415. [Google Scholar] [CrossRef]
  40. Petit, G.; Luzum, B. IERS Conventions 2010; Technical Report; IERS Convention Center: Frankfurt, Germany, 2010. [Google Scholar]
  41. Beutler, G.; Brockmann, E.; Gurtner, W.; Hugentobler, U.; Mervart, L.; Rothacher, M. Extended orbit modelling techniques at the CODE processing center of the international GPS service for geodynamics (IGS): Theory and initial results. Eur. Respir. J. 1994, 19, 367–386. [Google Scholar]
  42. Steigenberger, P.; Thoelert, S.; Montenbruck, O. GNSS satellite transmit power and its impact on orbit determination. J. Geod. 2018, 92, 609–624. [Google Scholar] [CrossRef]
  43. Rodriguez-Solano, C.J. Impact of the albedo modeling on GPS orbits. Ph.D. Thesis, Technische Universität München (TUM), München, Germany, 2009. [Google Scholar]
  44. Peng, H.; Yang, Y.; Wang, G. Performance Analysis of BDS Satellite Orbits during Eclipse Periods: Results of Satellite Laser Ranging Validation. Acta Geod. Cartogr. Sin. 2016, 45, 639–645. [Google Scholar]
  45. Xia, F.; Ye, S.; Chen, D.; Jiang, N. Observation of BDS-2 IGSO/MEOs yaw-attitude behavior during eclipse seasons. GPS Solut. 2019, 23, 71. [Google Scholar] [CrossRef]
  46. Duan, B.; Hugentobler, U. Enhanced solar radiation pressure model for GPS satellites considering various physical effects. GPS Solut. 2021, 25, 42. [Google Scholar] [CrossRef]
  47. Lou, Y.; Zhang, W.; Wang, C.; Yao, X.; Shi, C.; Liu, J. The impact of orbital errors on the estimation of satellite clock errors and PPP. Adv. Space Res. 2014, 54, 1571–1580. [Google Scholar] [CrossRef]
Figure 1. The flowchart of double MAD detection.
Remotesensing 13 04058 g001
Figure 2. Amplitude spectrums of 90-day, 180-day, and 270-day for C01, C10, and C25.
Remotesensing 13 04058 g002aRemotesensing 13 04058 g002b
Figure 3. Residuals (top), amplitude spectrum (middle), and spectrogram (bottom) of C01, C07, and C27, respectively.
Remotesensing 13 04058 g003
Figure 4. PSD of four significant periodic terms with respect to the β angle.
Remotesensing 13 04058 g004aRemotesensing 13 04058 g004b
Figure 5. The frequency variations of main periodic term for 30 satellites (left), and 29 satellites except C11 (right).
Remotesensing 13 04058 g005
Figure 6. The frequency variations of main periodic term for WHU (left) and GFZ (right) clock offsets.
Remotesensing 13 04058 g006
Figure 7. The spectrogram of C11 and C14 for WHU (left) and GFZ (right) clock offsets.
Remotesensing 13 04058 g007
Figure 8. Mean RMS of the QPM, the SAM, and the TFAM fitting residuals.
Remotesensing 13 04058 g008
Figure 9. Improvement of the TFAM relative to the SAM.
Remotesensing 13 04058 g009
Figure 10. Frequency variations of main periodic term from DOY 140 to 169 in 2021.
Remotesensing 13 04058 g010
Figure 11. Amplitude spectrums and spectrograms of WHU clock offsets.
Remotesensing 13 04058 g011aRemotesensing 13 04058 g011b
Figure 12. Amplitude spectrums and spectrograms of GFZ clock offsets.
Remotesensing 13 04058 g012
Figure 13. Prediction errors of WHU clock offsets for 30-day.
Remotesensing 13 04058 g013
Figure 14. Prediction errors of GFZ clock offsets for 30-day.
Remotesensing 13 04058 g014
Figure 15. Mean RMS of the SAM and the TFAM prediction errors.
Remotesensing 13 04058 g015
Table 1. Processing strategies of WHU BDS precise orbit determination [35,37].
ItemsModels
Satellite attitudeBDS-2 (GEO: orbit-normal; IGSO/MEO: yaw-steering and orbit-normal); BDS-3: continuous yaw-steering
Satellite antenna PCO/PCVPCO according to igs14.atx; ignoring PCV
Reference frameIGb14
Geopotential12 × 12 EGM2008 model [38]
N-bodyJet Propulsion Laboratory (JPL) DE405
ocean tidesFES2004 [39]
Solid earth tidesIERS conventions 2010 [40]
pole tidesIERS conventions 2010 [40]
RelativityIERS conventions 2010 [40]
Solar radiationThe 5-parameter ECOM1 model [35,41]
Antenna thrustBDS-2 (GEO: none; IGSO: 185 W; MEO: 130 W [42]); BDS-3 (MEO: 130 W)
Earth Rotation ParametersStatic Earth’s Albedo model [43]
Table 2. The types of BDS satellites (http://www.csno-tarc.cn/, accessed on 14 August 2021).
SystemSatellite TypeClock TypeManufPRN
BDS-2GEORbCASTC01, C02, C03, C04, C05
IGSORbCASTC06, C07, C08, C09, C10, C13, C16
MEORbCASTC11, C12, C14
BDS-3MEORbCASTC19, C20, C21, C22, C23, C24, C32, C33
HSECMC25, C26, C27, C28, C29, C30, C34
Table 3. The mean prediction RMS based on the SAM and TFAM (unit: ns).
Clock ProductsSystemSatellite Type6 h12 h18 h24 h
SAMTFAMIMPSAMTFAMIMPSAMTFAMIMPSAMTFAMIMP
WHUBDS-2GEO (CASC)1.521.463.9%2.522.520%3.733.681.3%5.165.091.4%
IGSO (CASC)1.751.5014.3%3.523.0014.7%5.314.6312.8%6.976.368.8%
MEO (CASC)0.910.8012.1%1.561.438.3%2.322.166.9%2.772.577.2%
BDS-3MEO (CASC)0.480.4310.4%0.850.797.1%1.281.197.0%1.771.666.2%
MEO (SECM)0.350.3111.4%0.660.5812.1%1.040.9112.5%1.431.2711.2%
Total1.000.9010.0%1.821.668.8%2.742.518.4%3.623.396.4%
GFZBDS-2GEO (CASC)1.831.811.1%2.742.740%3.763.750.2%5.065.050.1%
IGSO (CASC)1.791.3822.9%3.762.8125.3%5.784.4223.5%7.646.1519.5%
MEO (CASC)0.860.7611.6%1.501.3410.7%2.232.048.5%2.752.547.6%
BDS-3MEO (CASC)0.450.418.9%0.870.7612.6%1.331.1811.2%1.831.678.7%
MEO (SECM)0.410.3612.2%0.800.6617.5%1.231.0613.8%1.701.4912.3%
Total1.070. 9412.1%1.941.6614.4%2.872.4913.2%3.83.3811.1%
Publisher’s Note: MDPI stays neutral with regard to jurisdictional claims in published maps and institutional affiliations.

