
Atmospheric Anomaly Analysis Related to Ms > 6.0 Earthquakes in China during 2020–2021

Abstract
:1. Introduction
2. Data and Methods
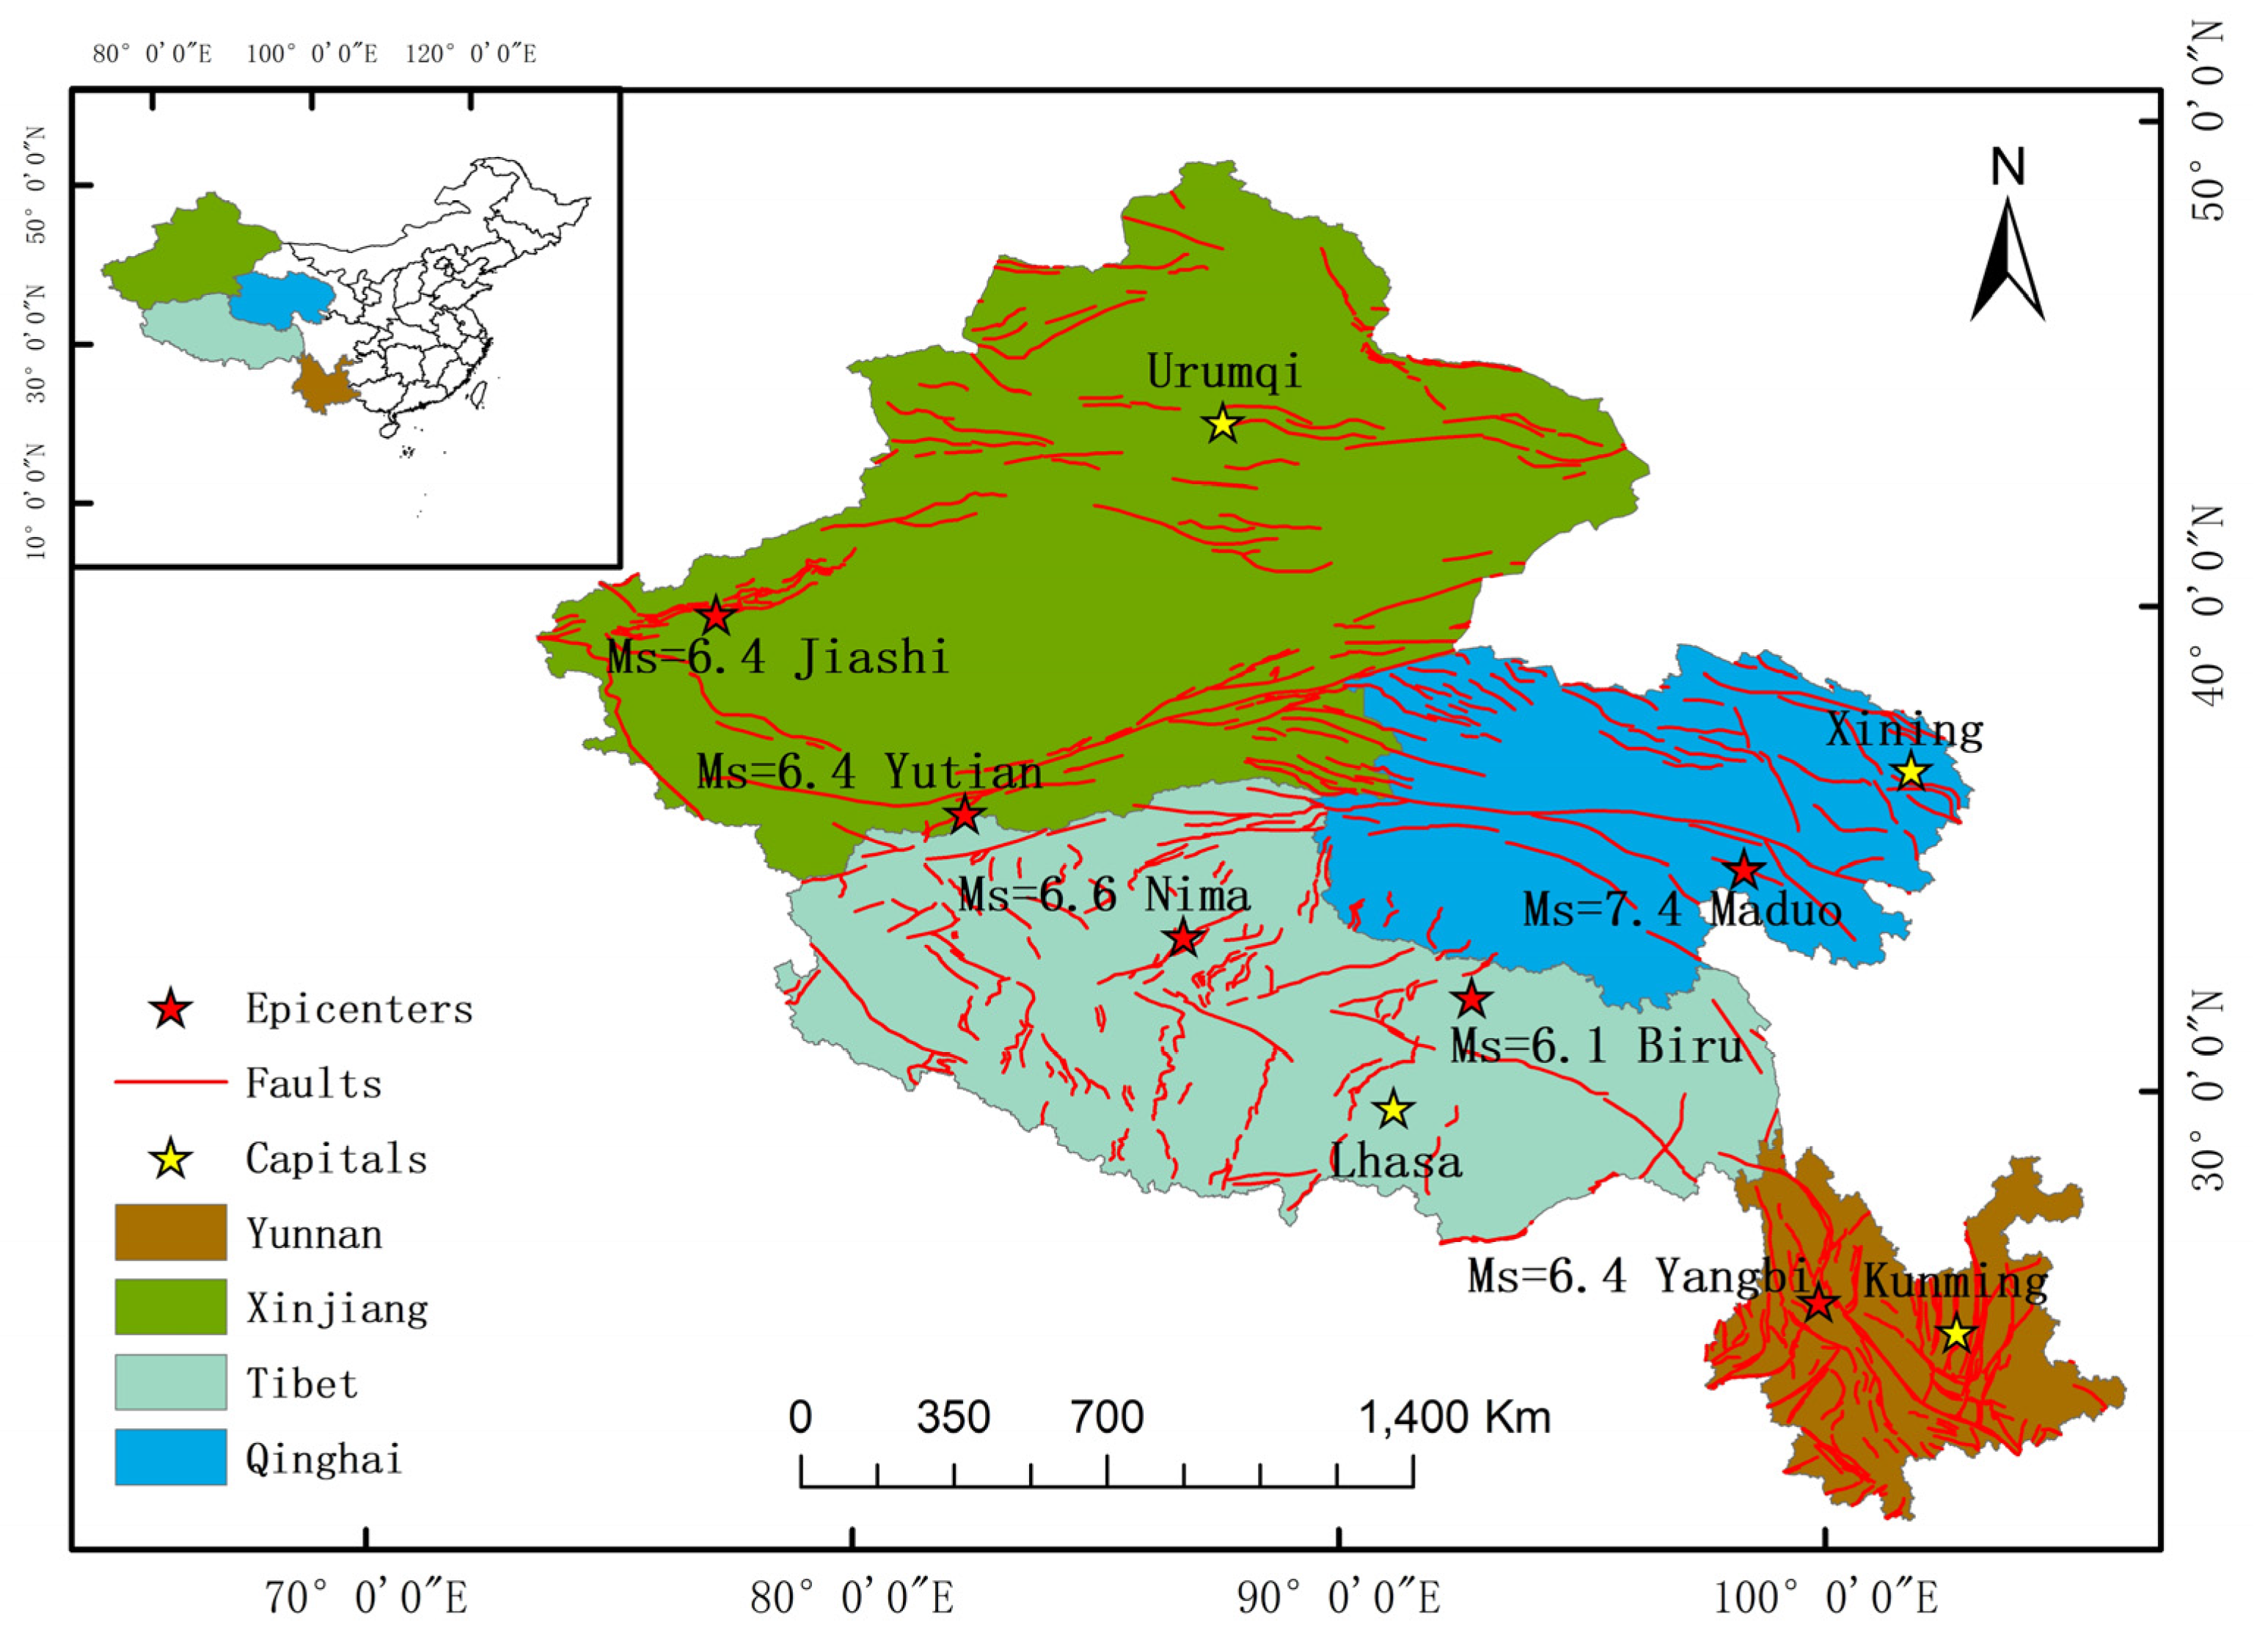
2.1. Tectonic Environment of Earthquakes
2.2. Meteorological Data
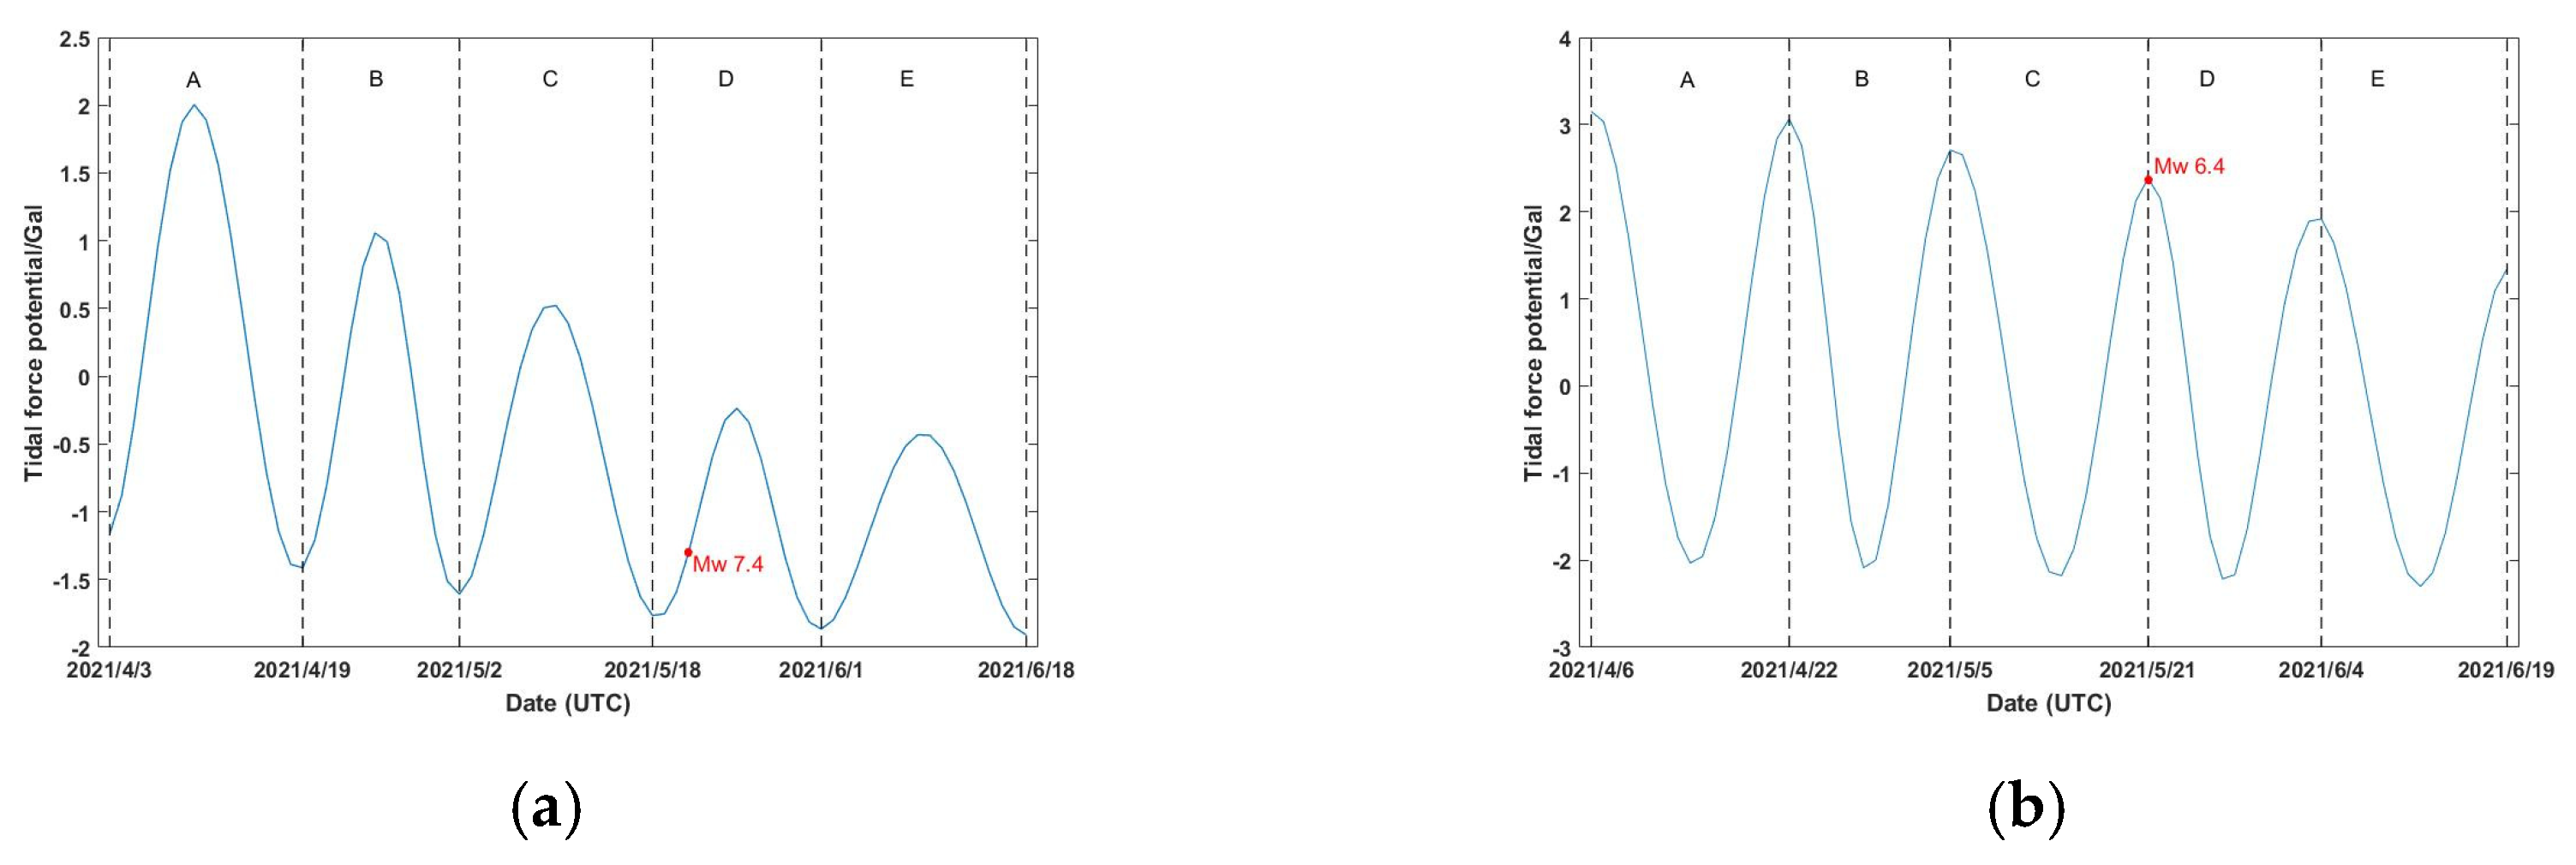
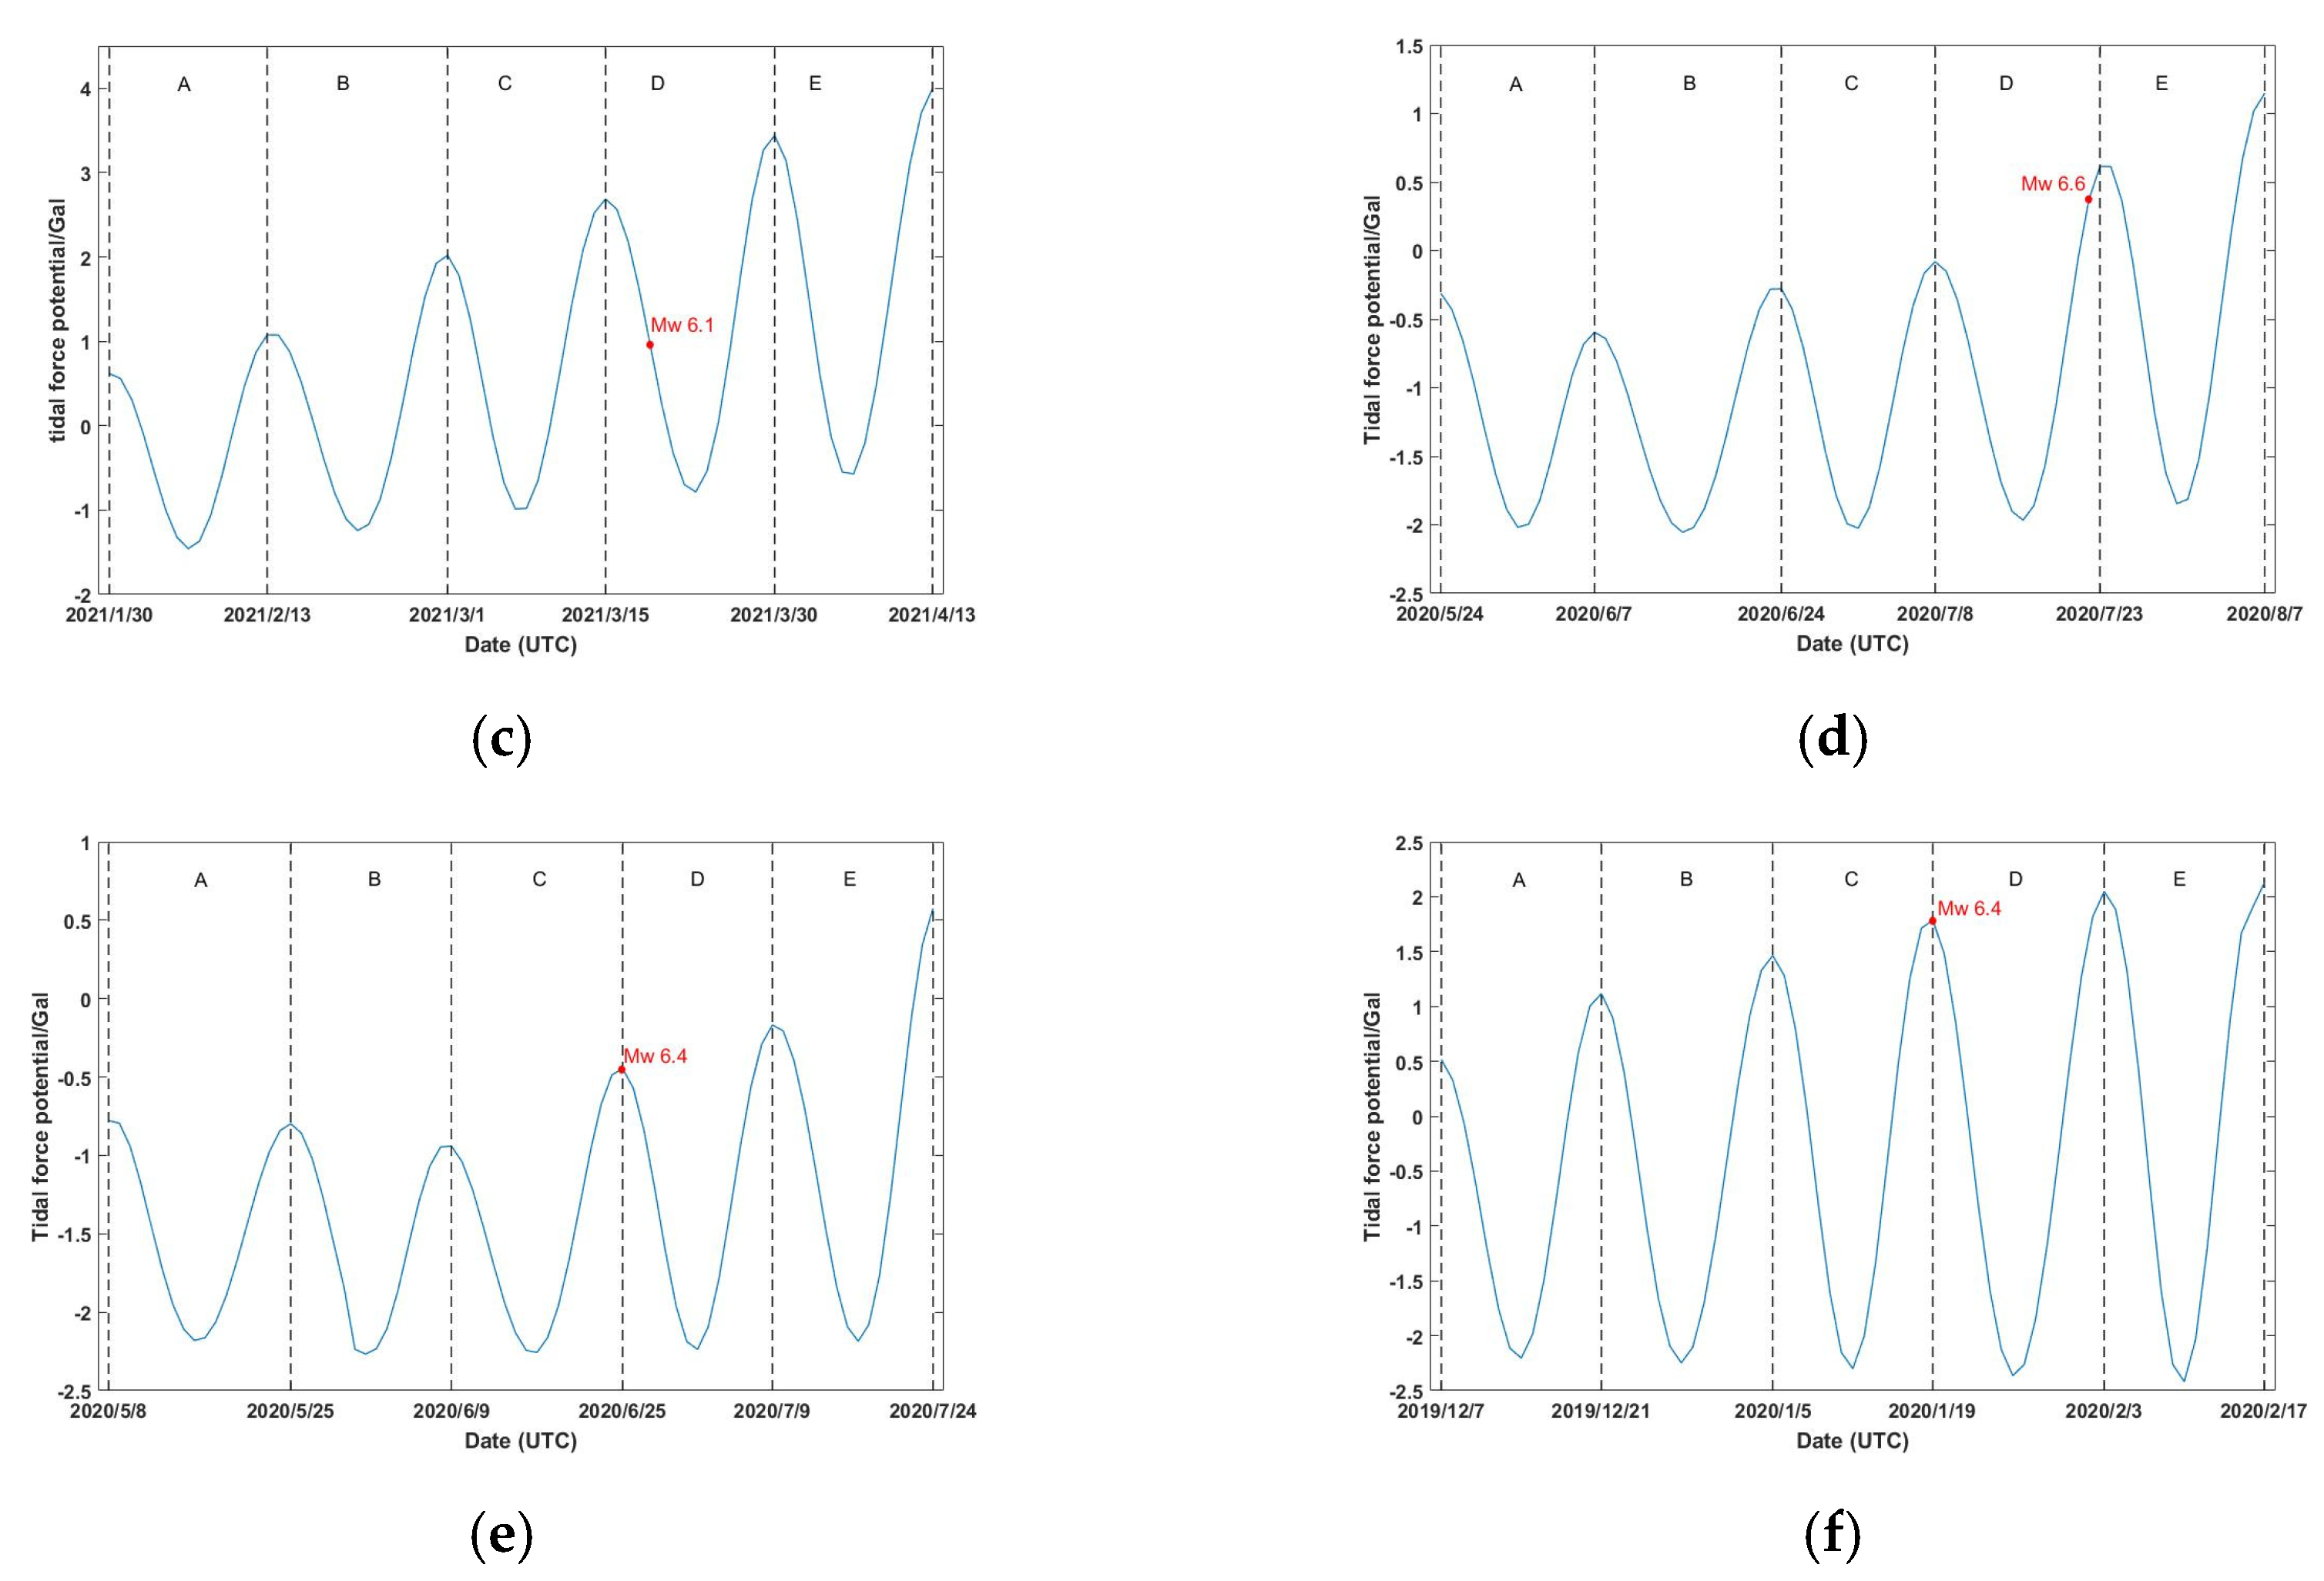
2.3. Tidal Force and the TFFA Method
- If the earthquake occurred at the top of tidal force, then each top is taken as the first day of each period. Similarly, if the earthquake occurred at the trough, then each trough is taken as the first day of each period.
- If the earthquake did not occur at the trough or the top, time distance is used as the standard. We choose the one closer to the time of earthquake. If the trough and top are equidistant from the time of earthquake, the preceding trough or top is taken as the first day of each period.
2.4. Specific Criteria for Selecting Atmospheric Thermal Anomalies Related to Earthquakes
- The threshold φ is used to detect thermal anomalies;
- Thermal anomalies appear at the bottom and lift towards the top. As height increases, the thermal anomalies diminish;
- The distribution of thermal anomaly at each vertical level coincide with the fault pattern;
- Thermal anomalies should be extended on time scale, so that thermal anomalies should last two consecutive days at least.
3. Results
3.1. Change in Tidal Force and Determination of Period
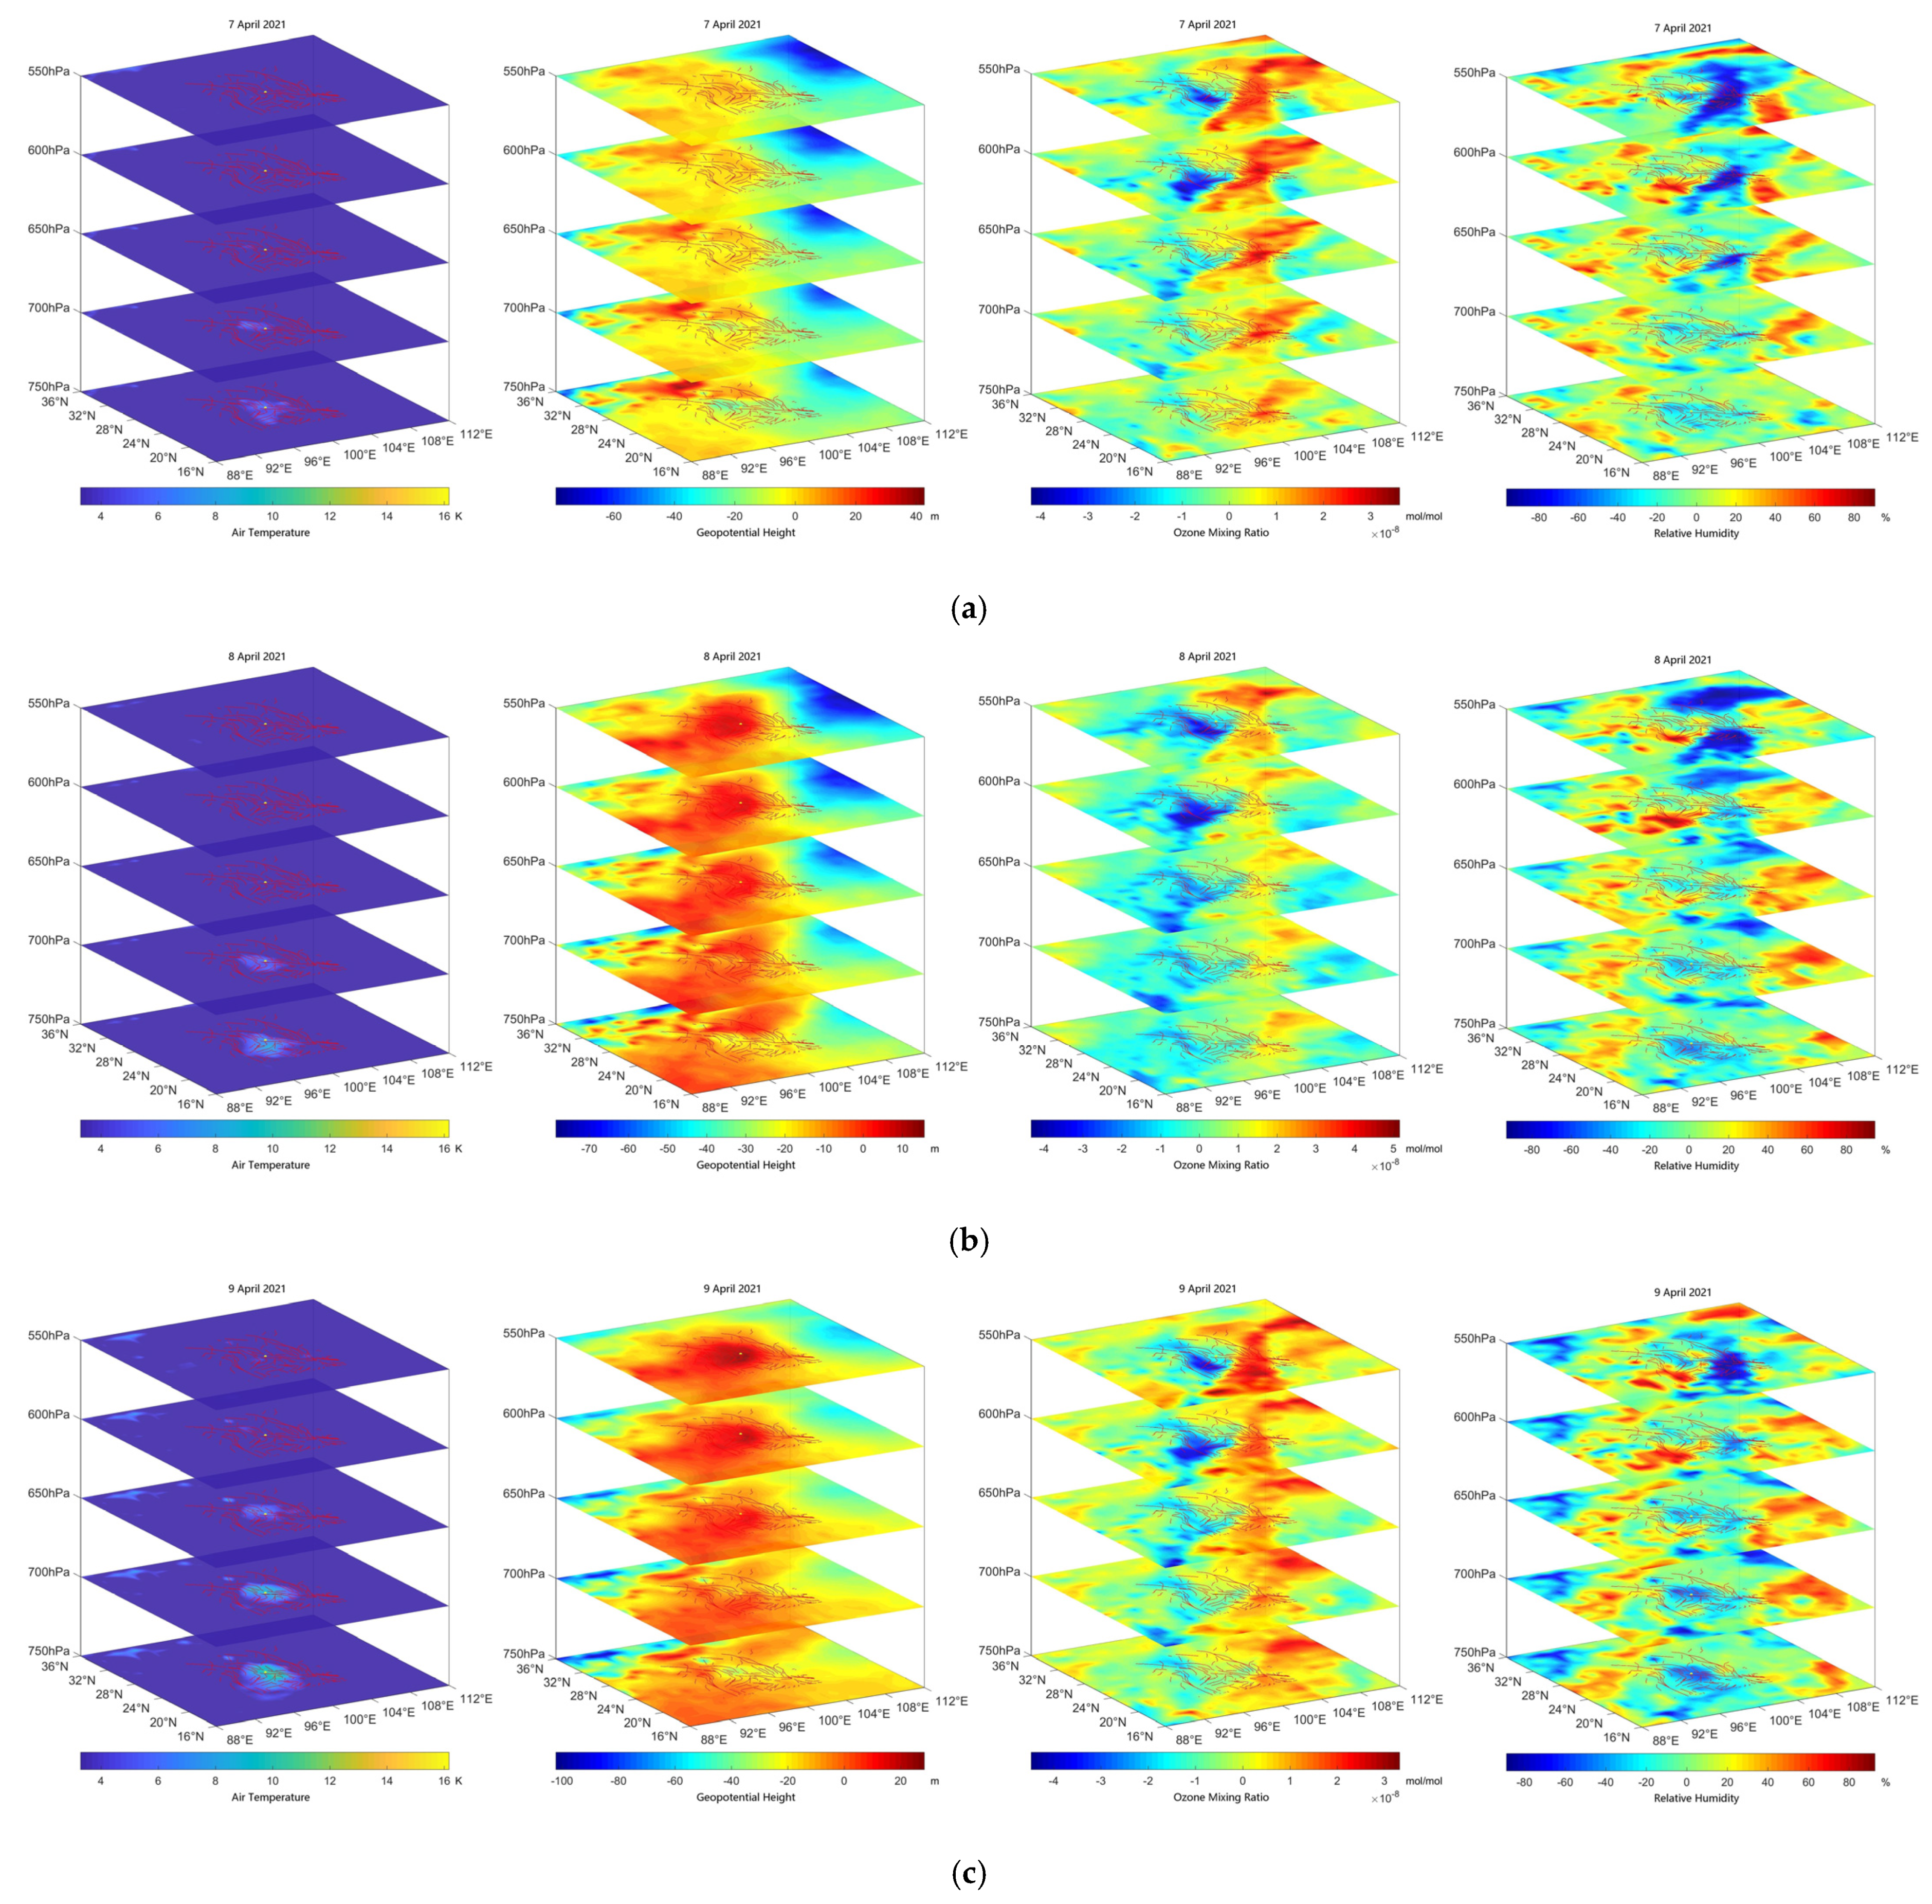
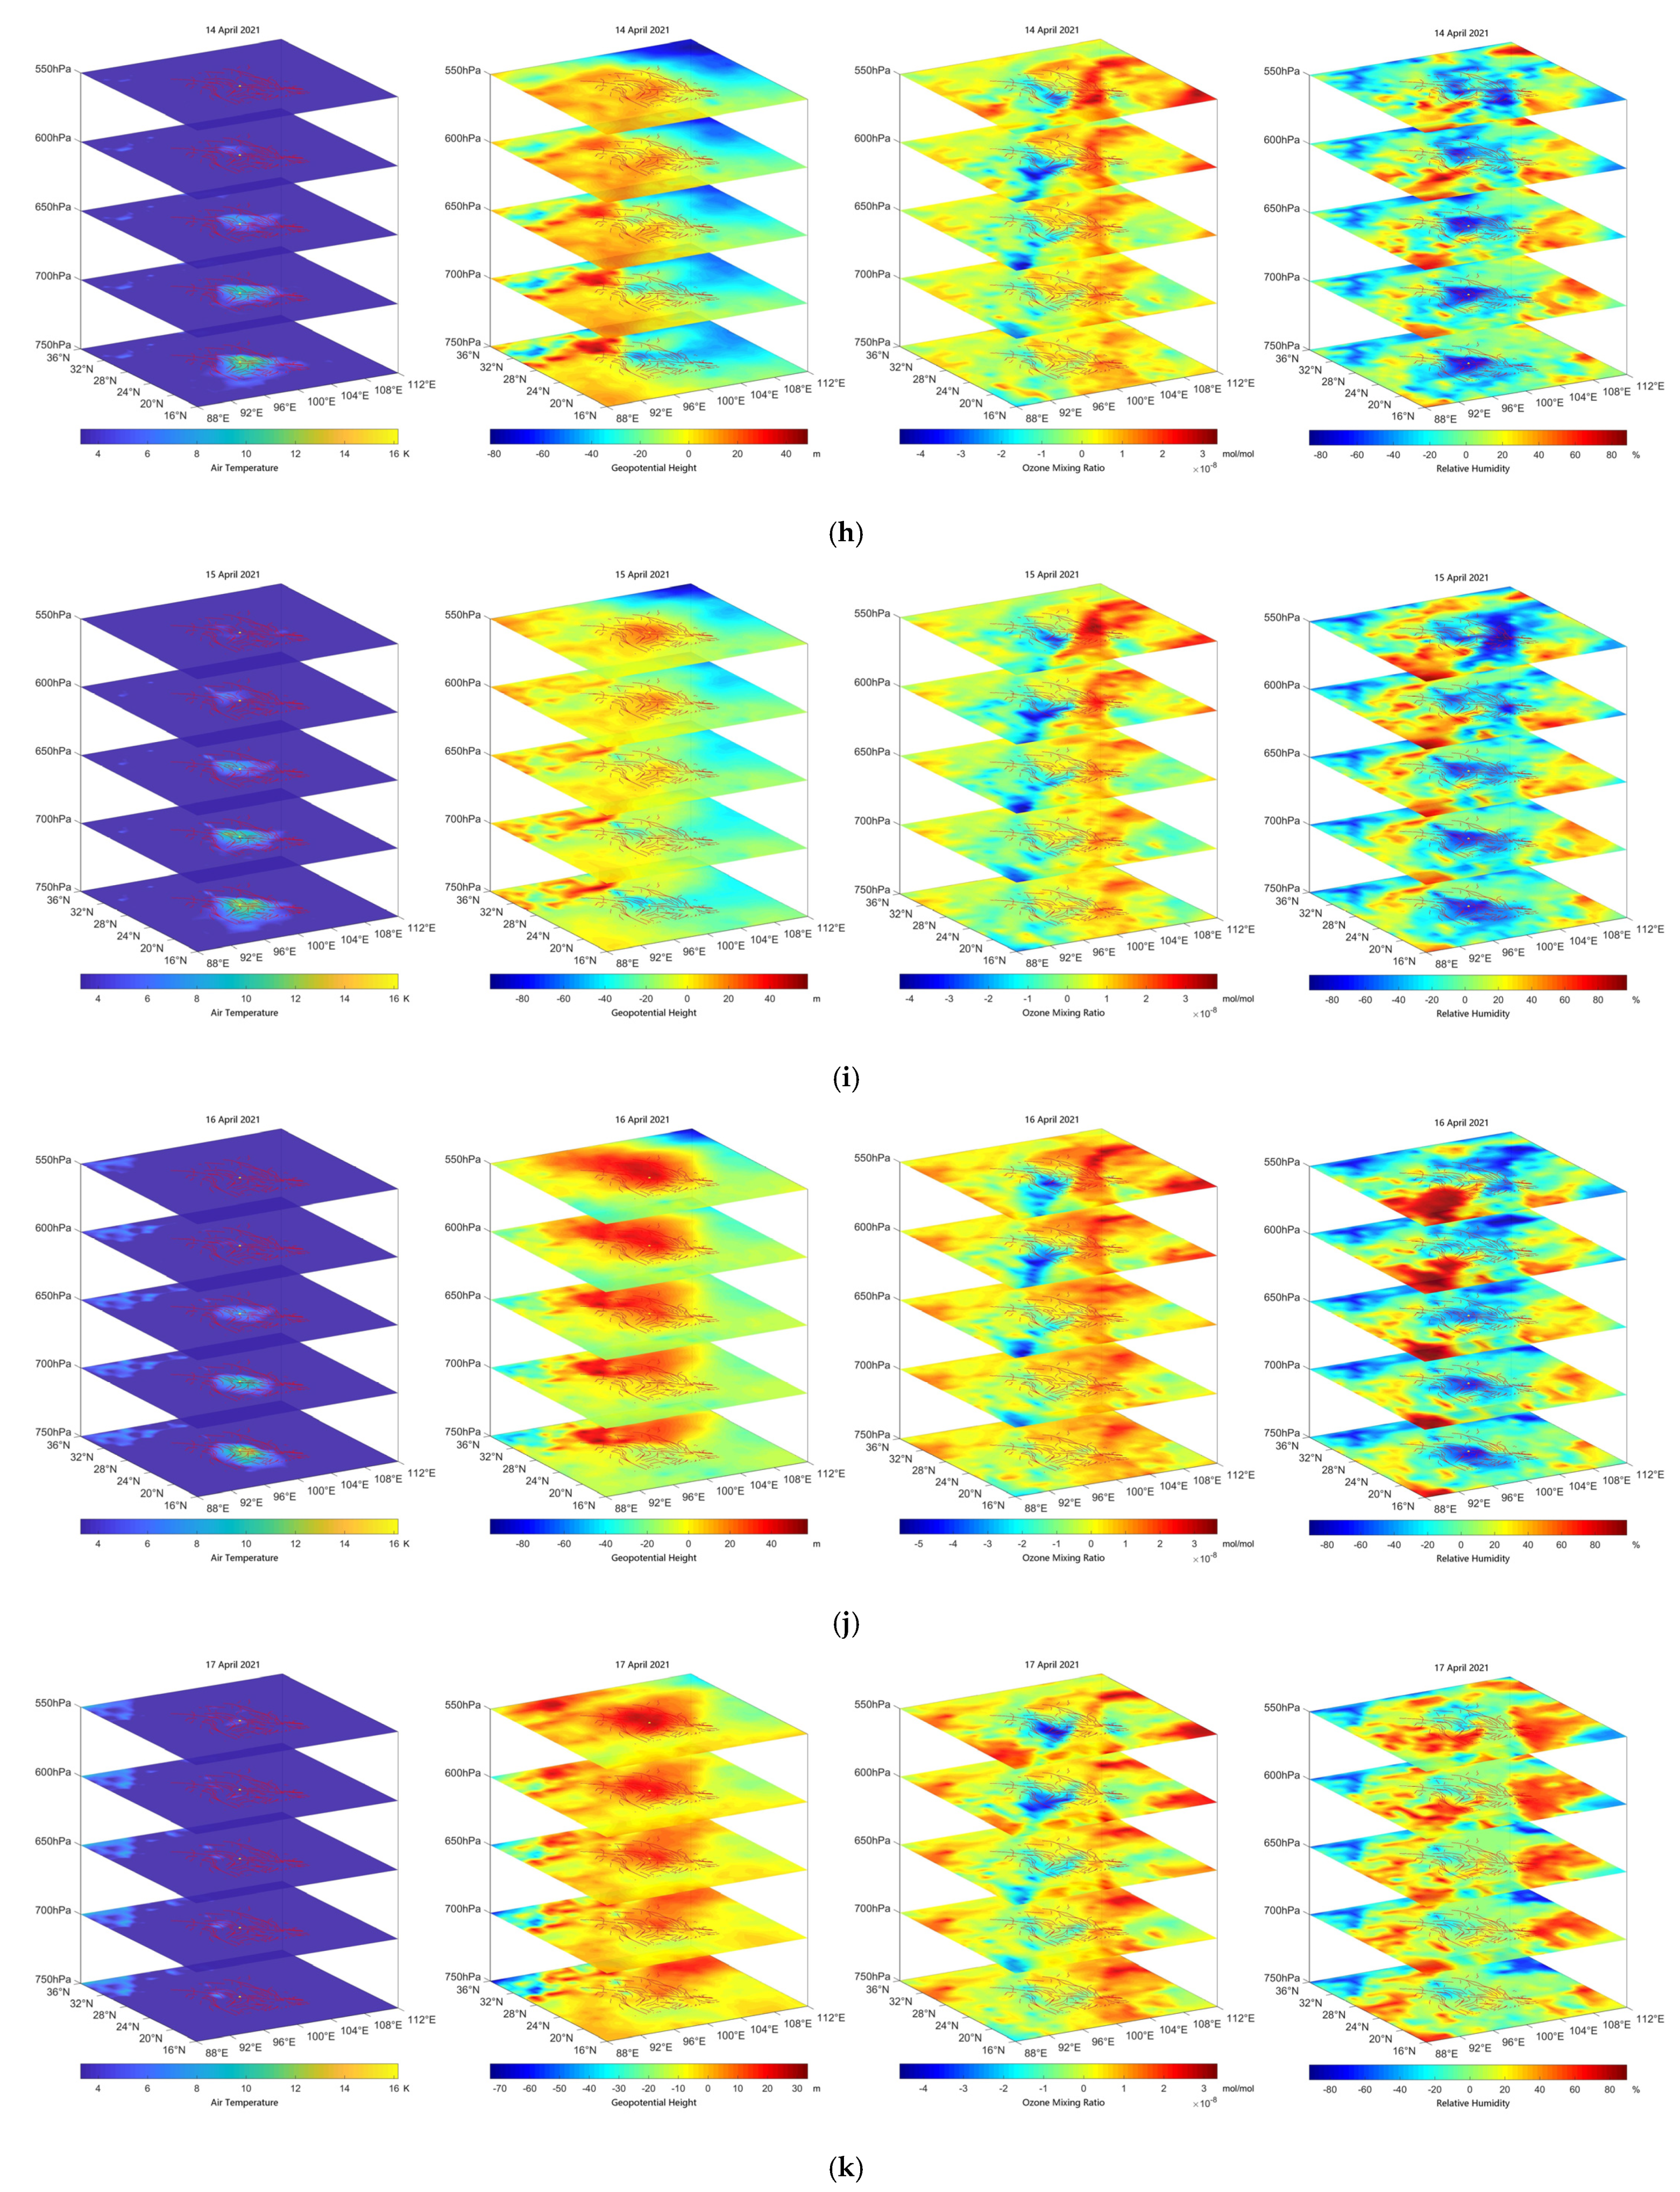
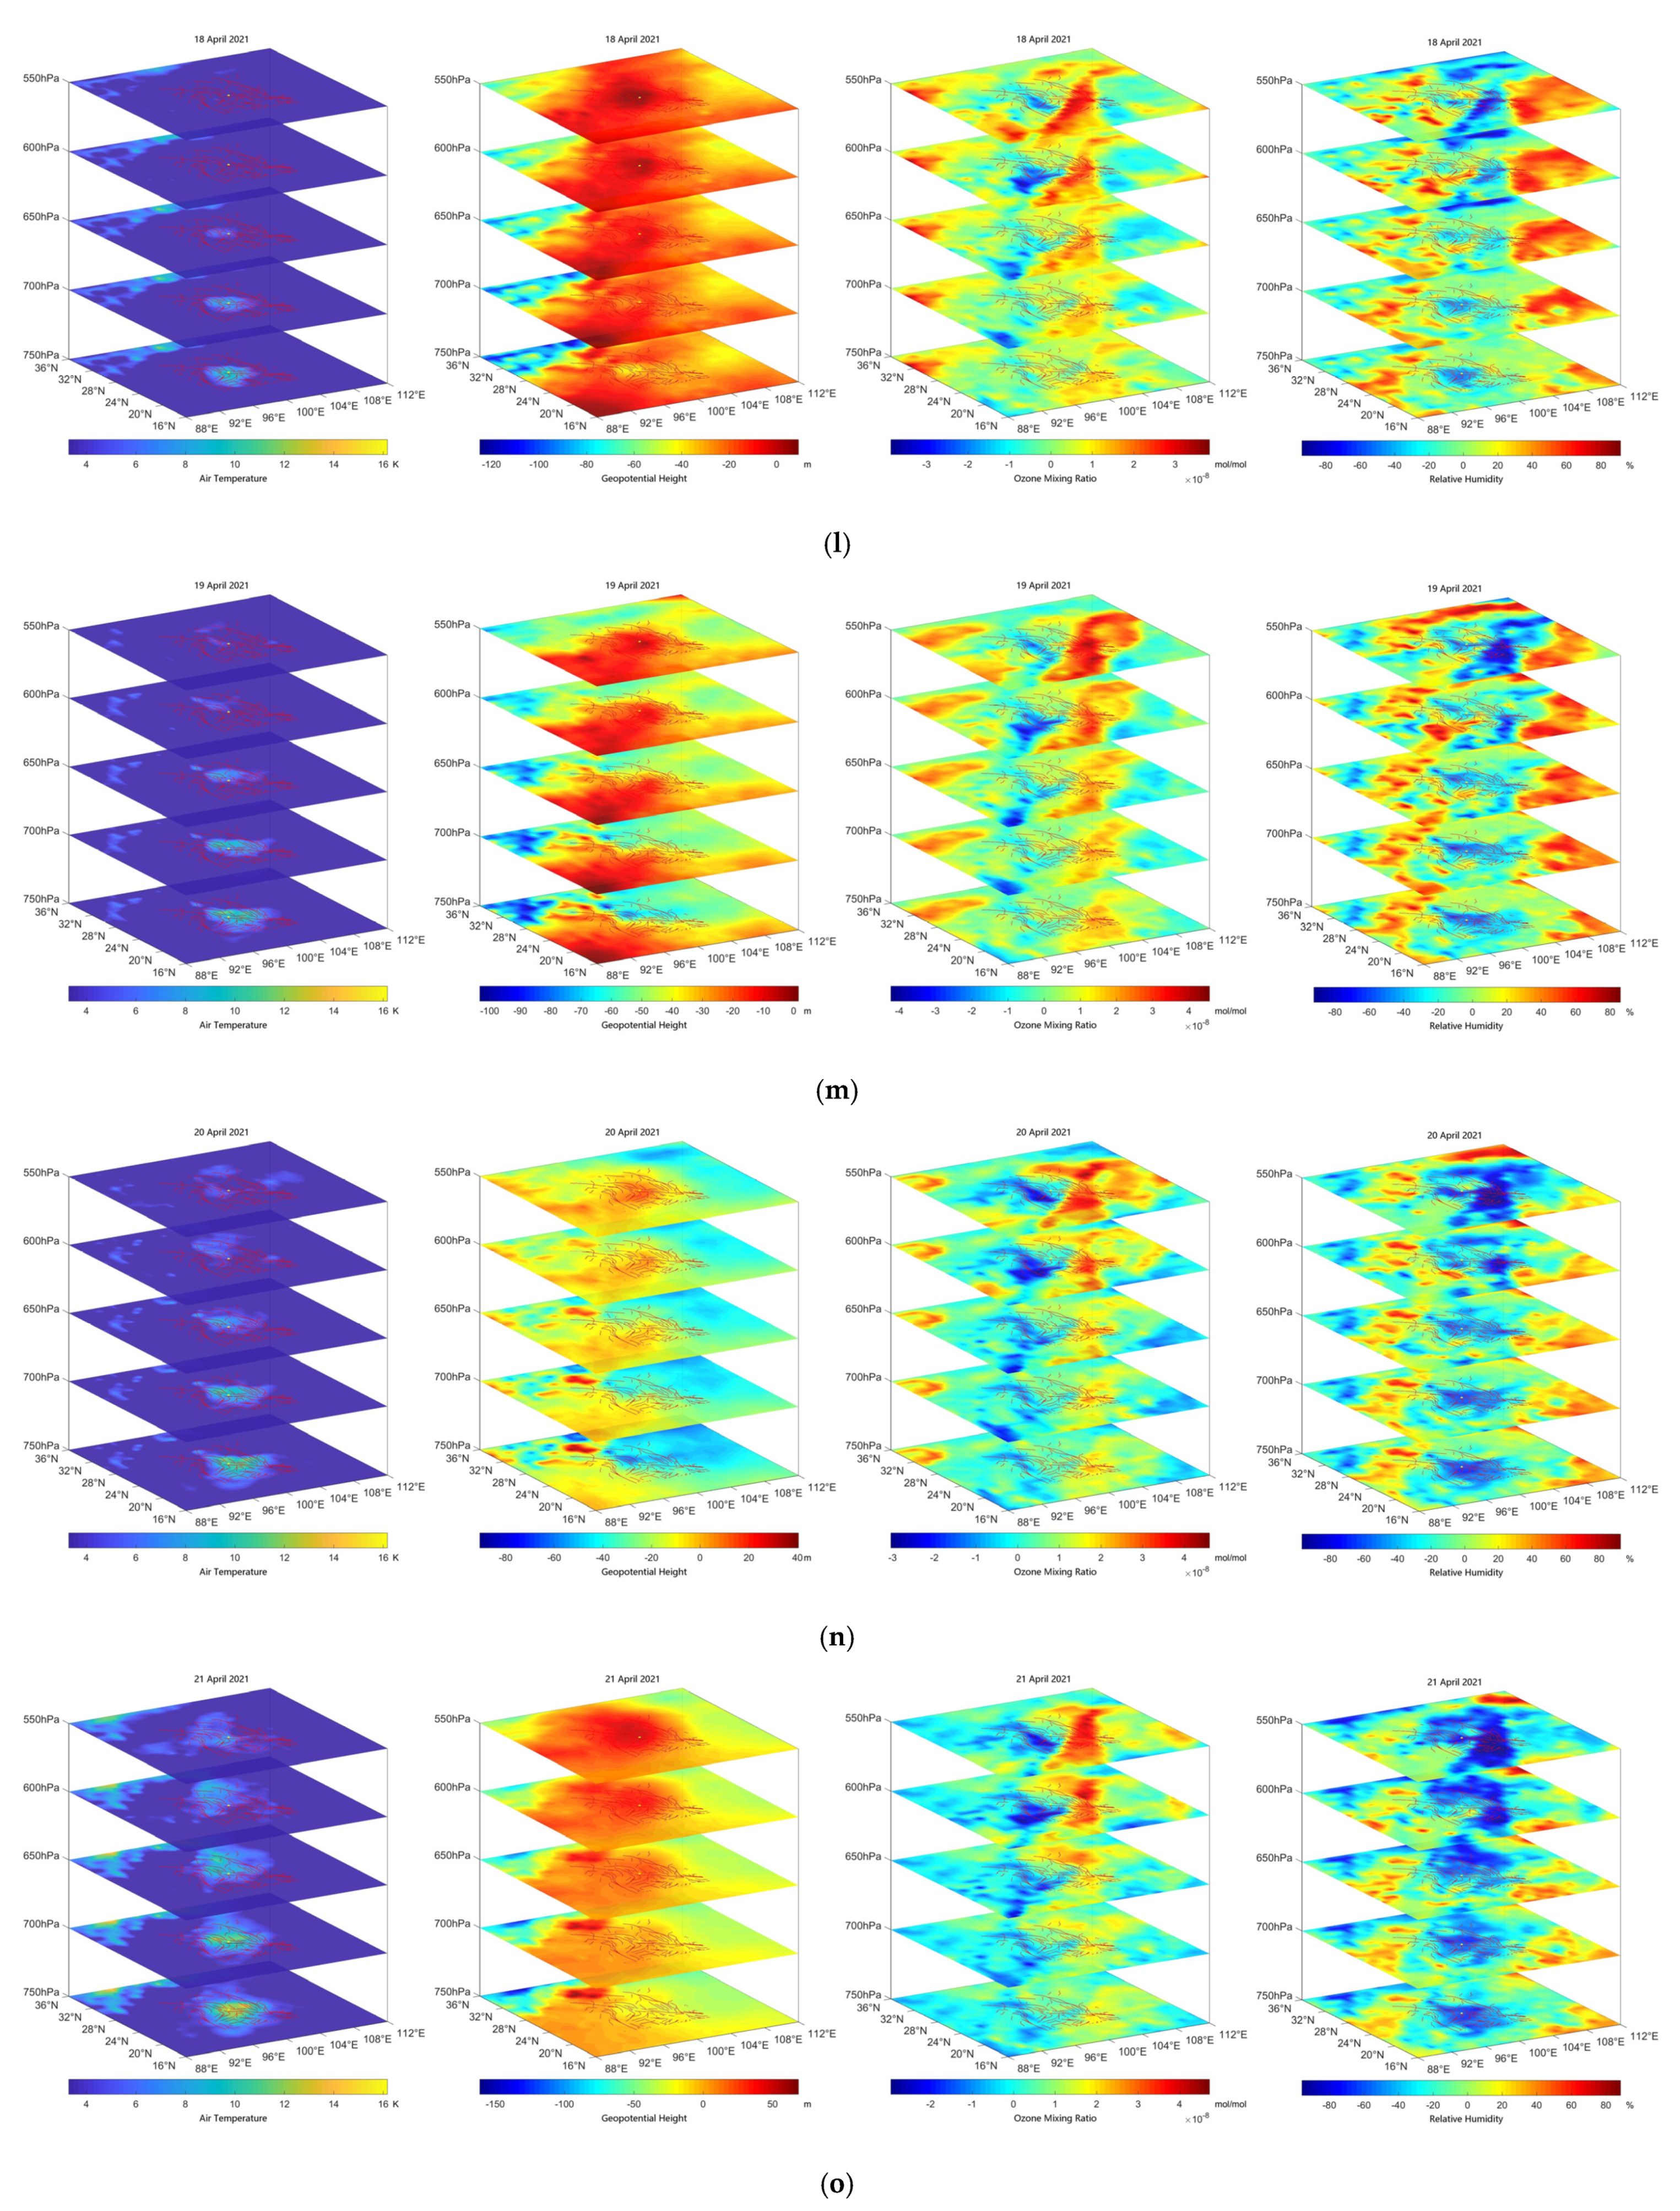
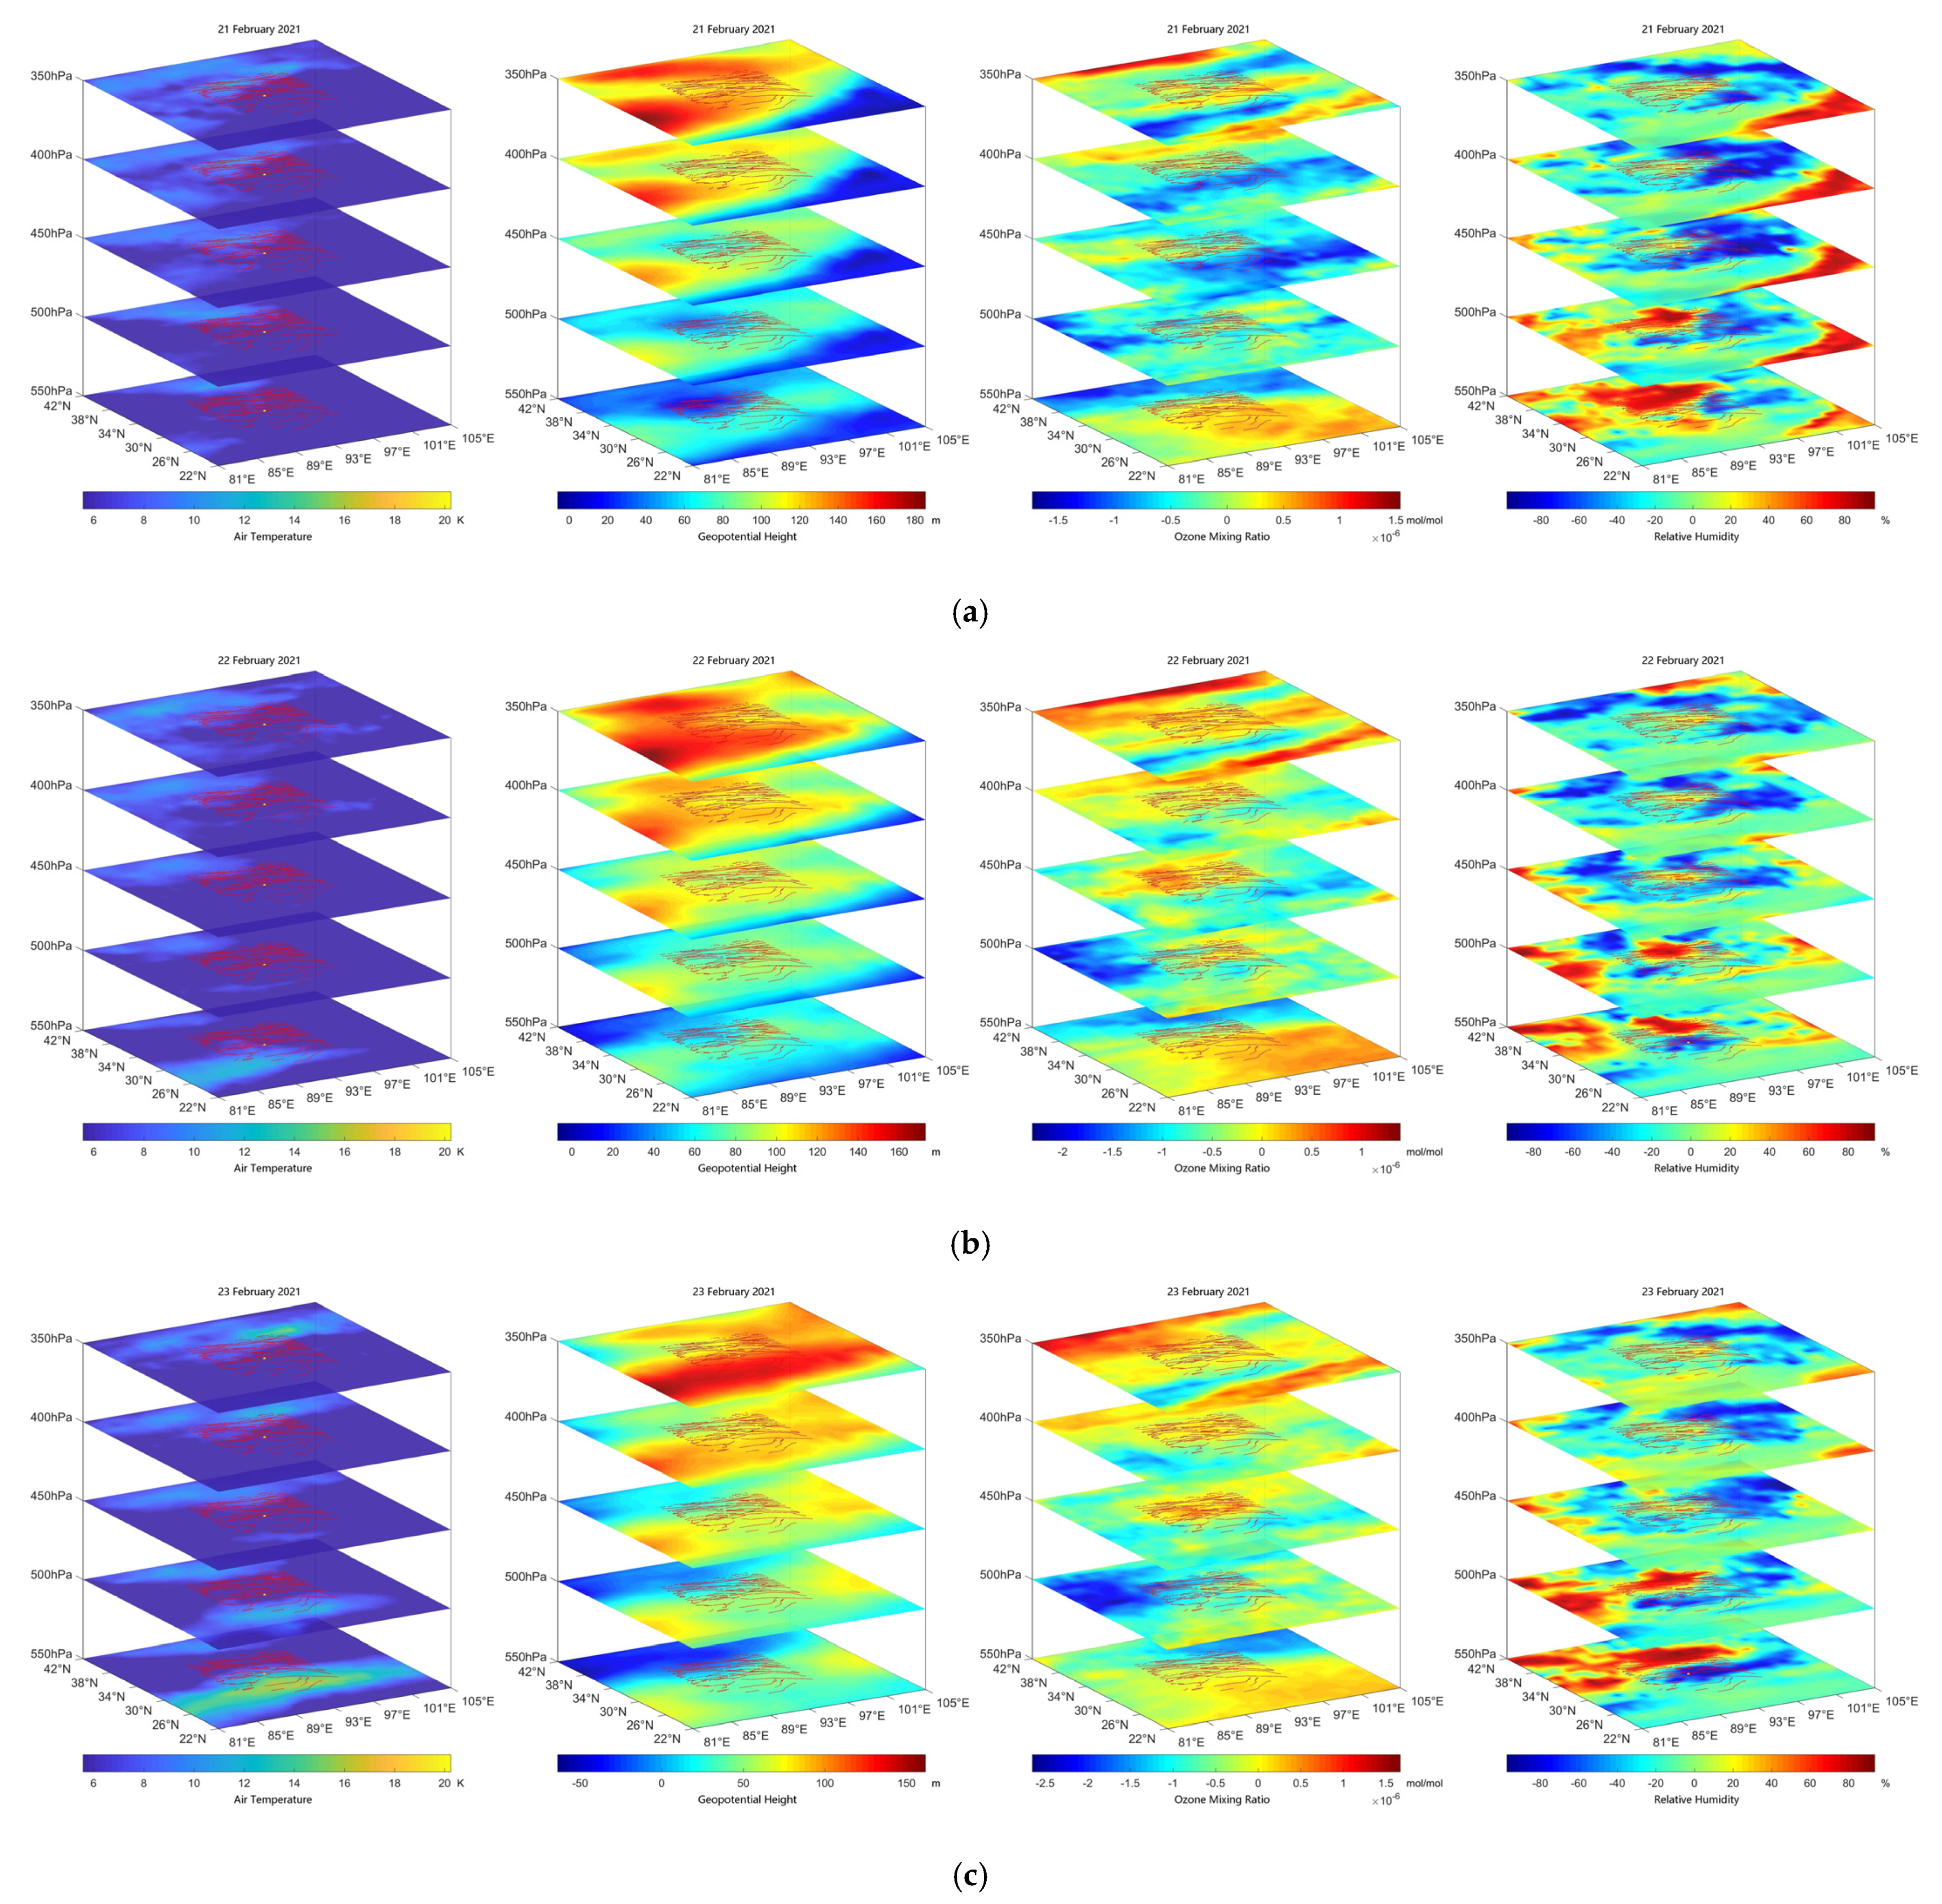
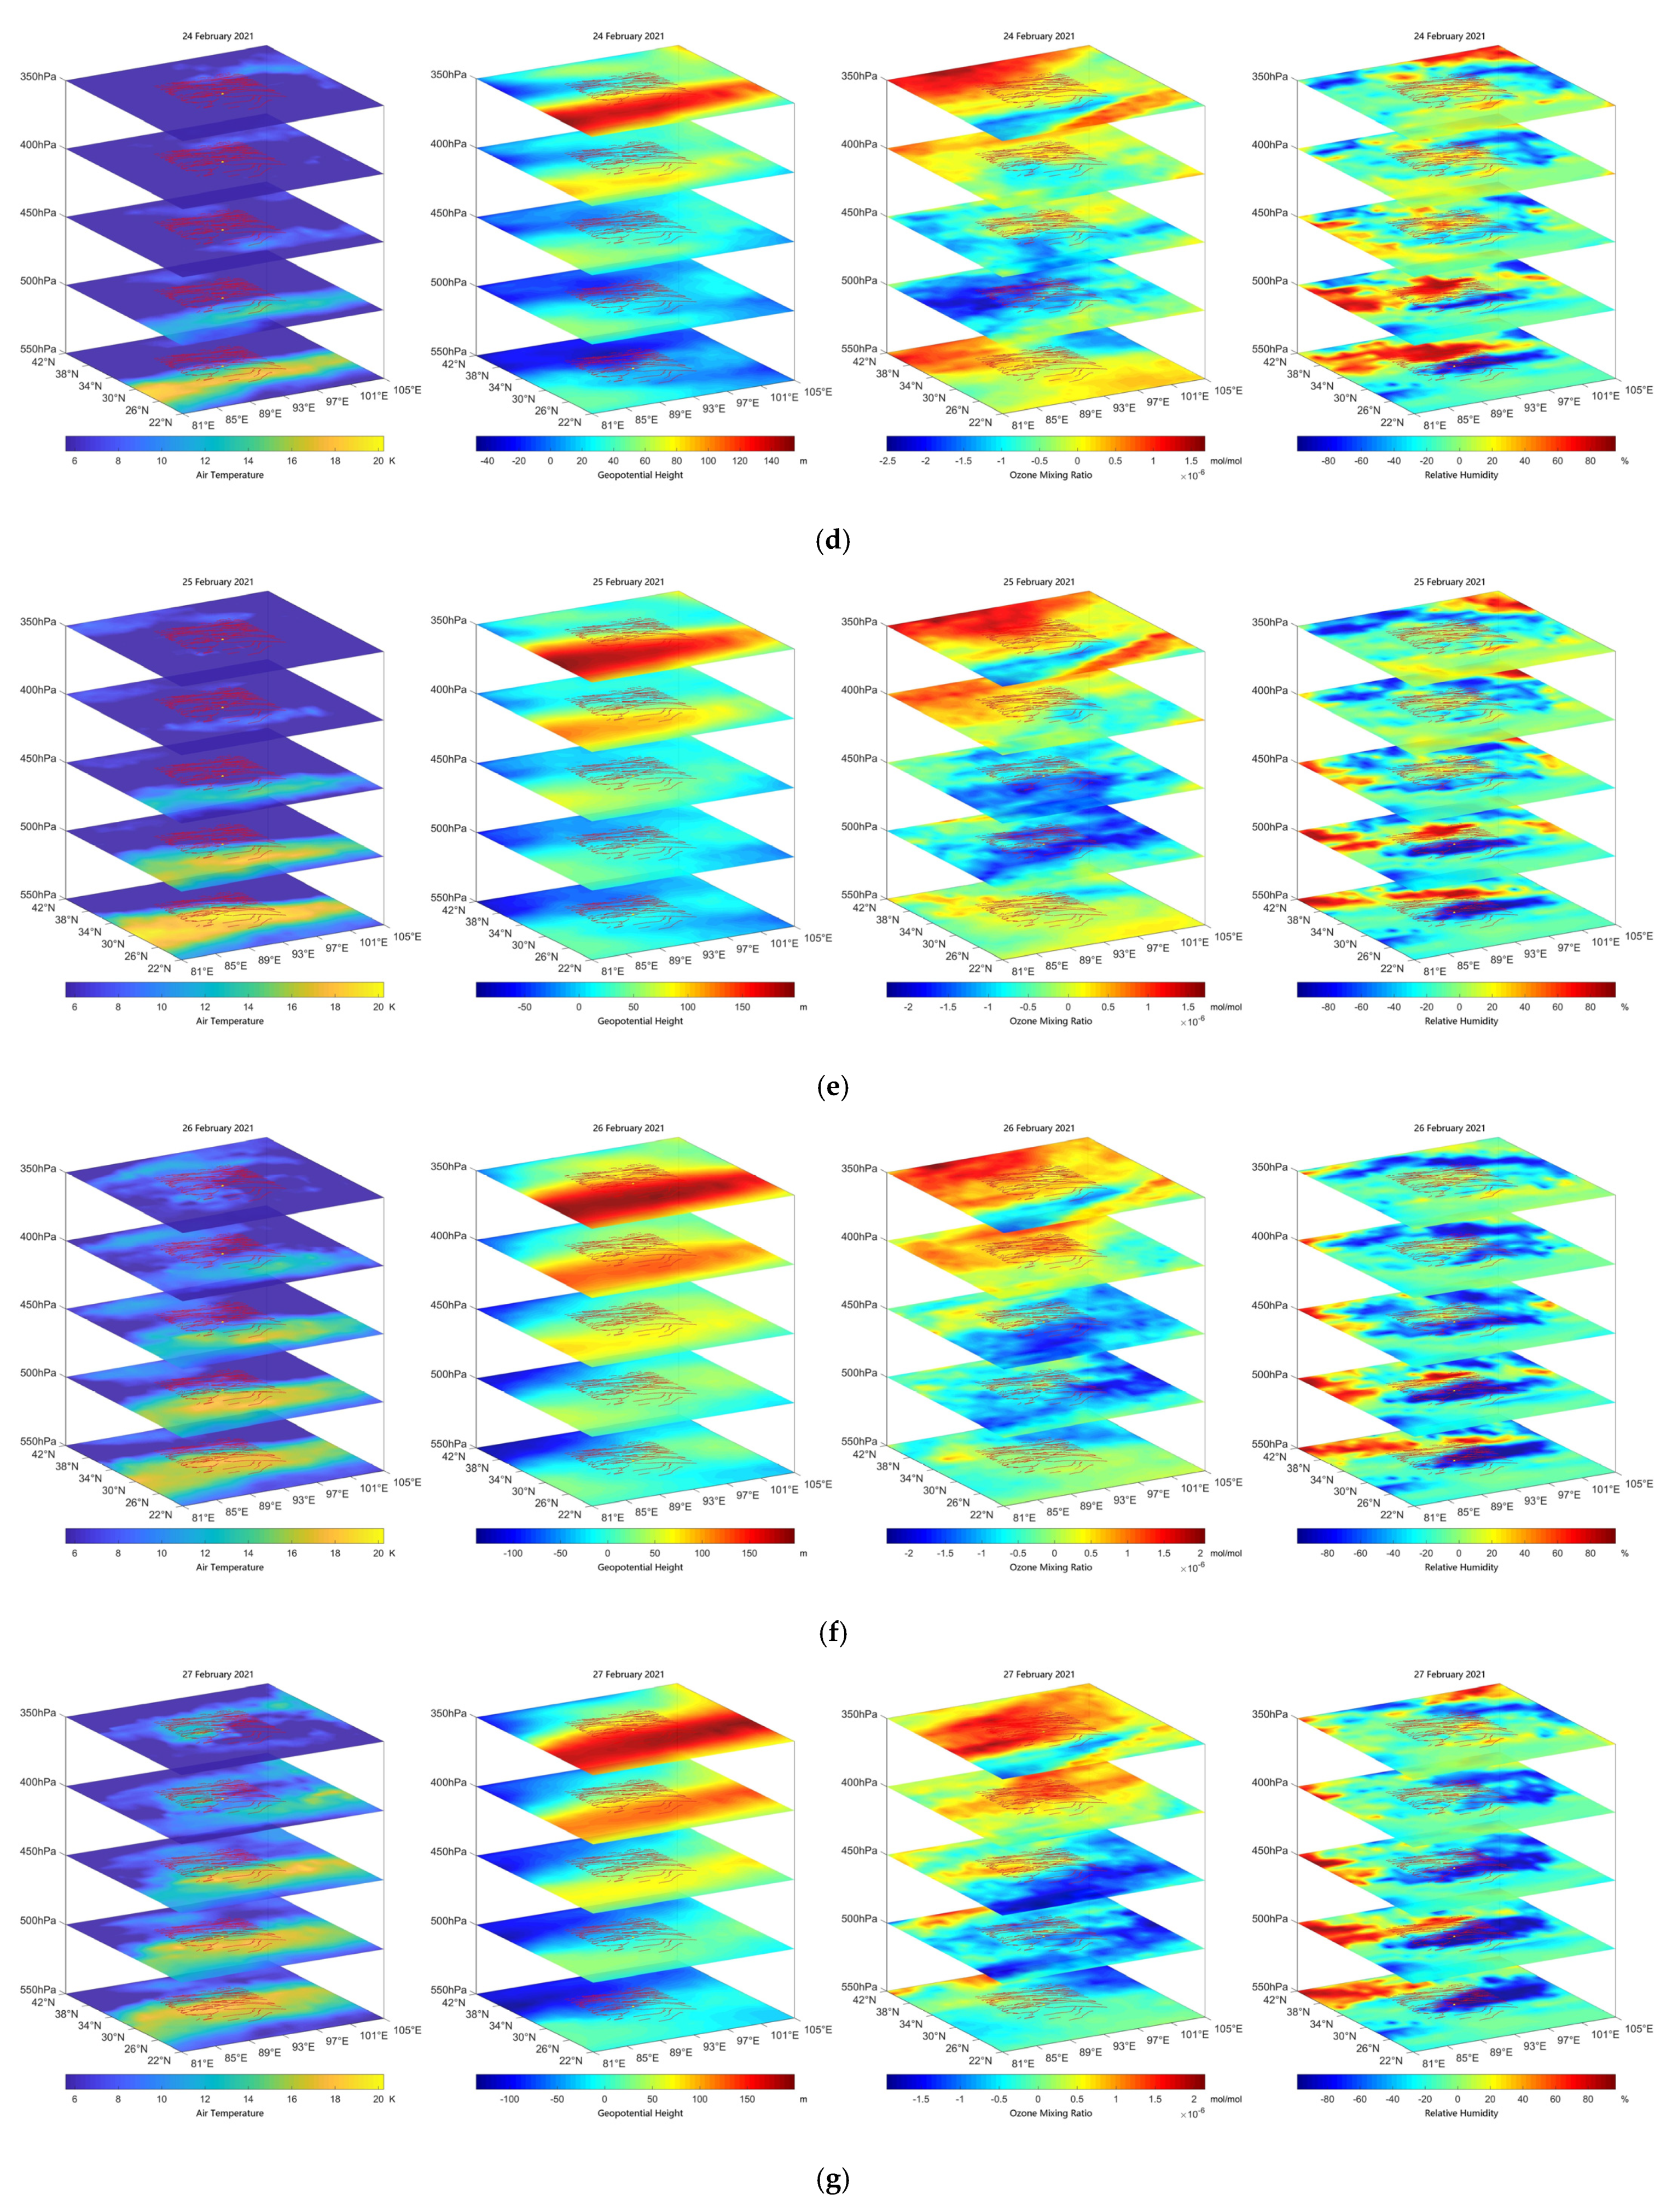
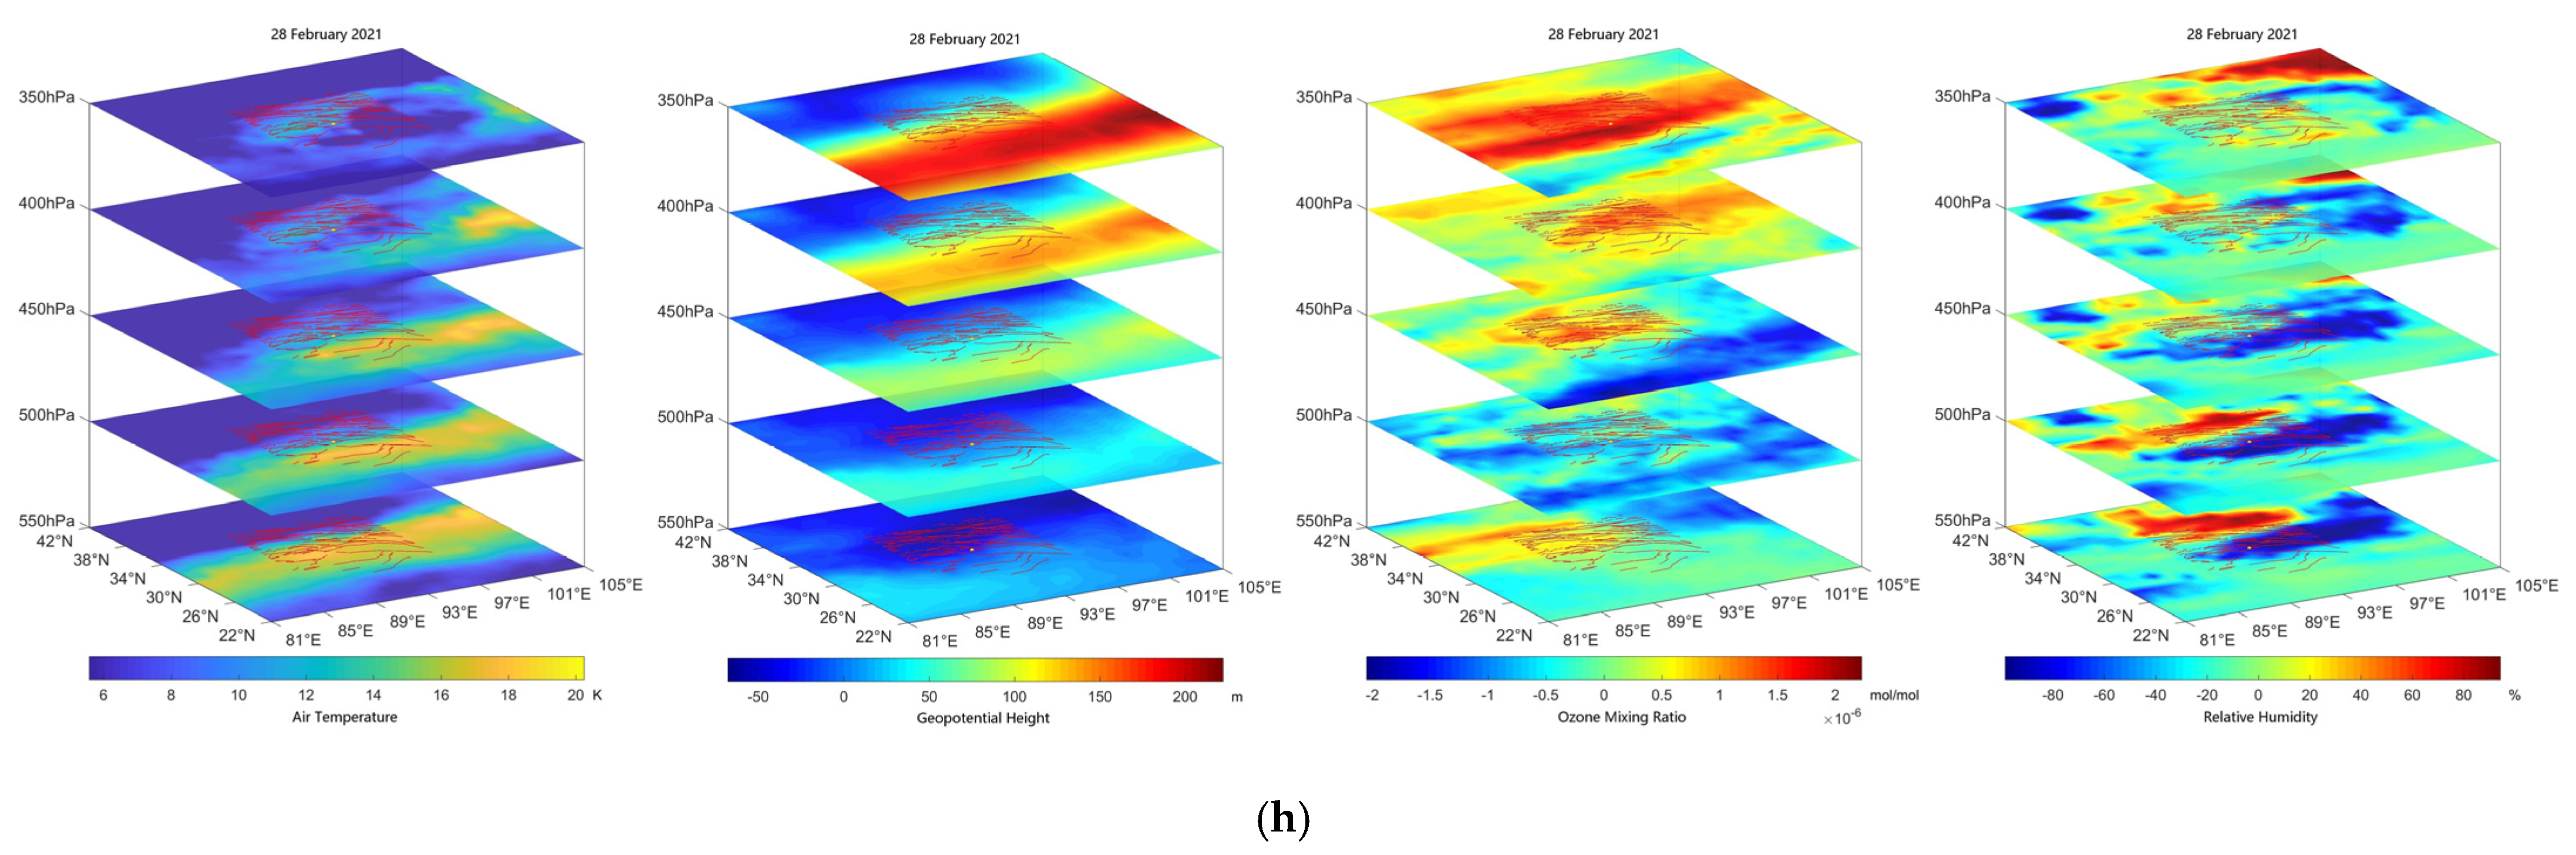
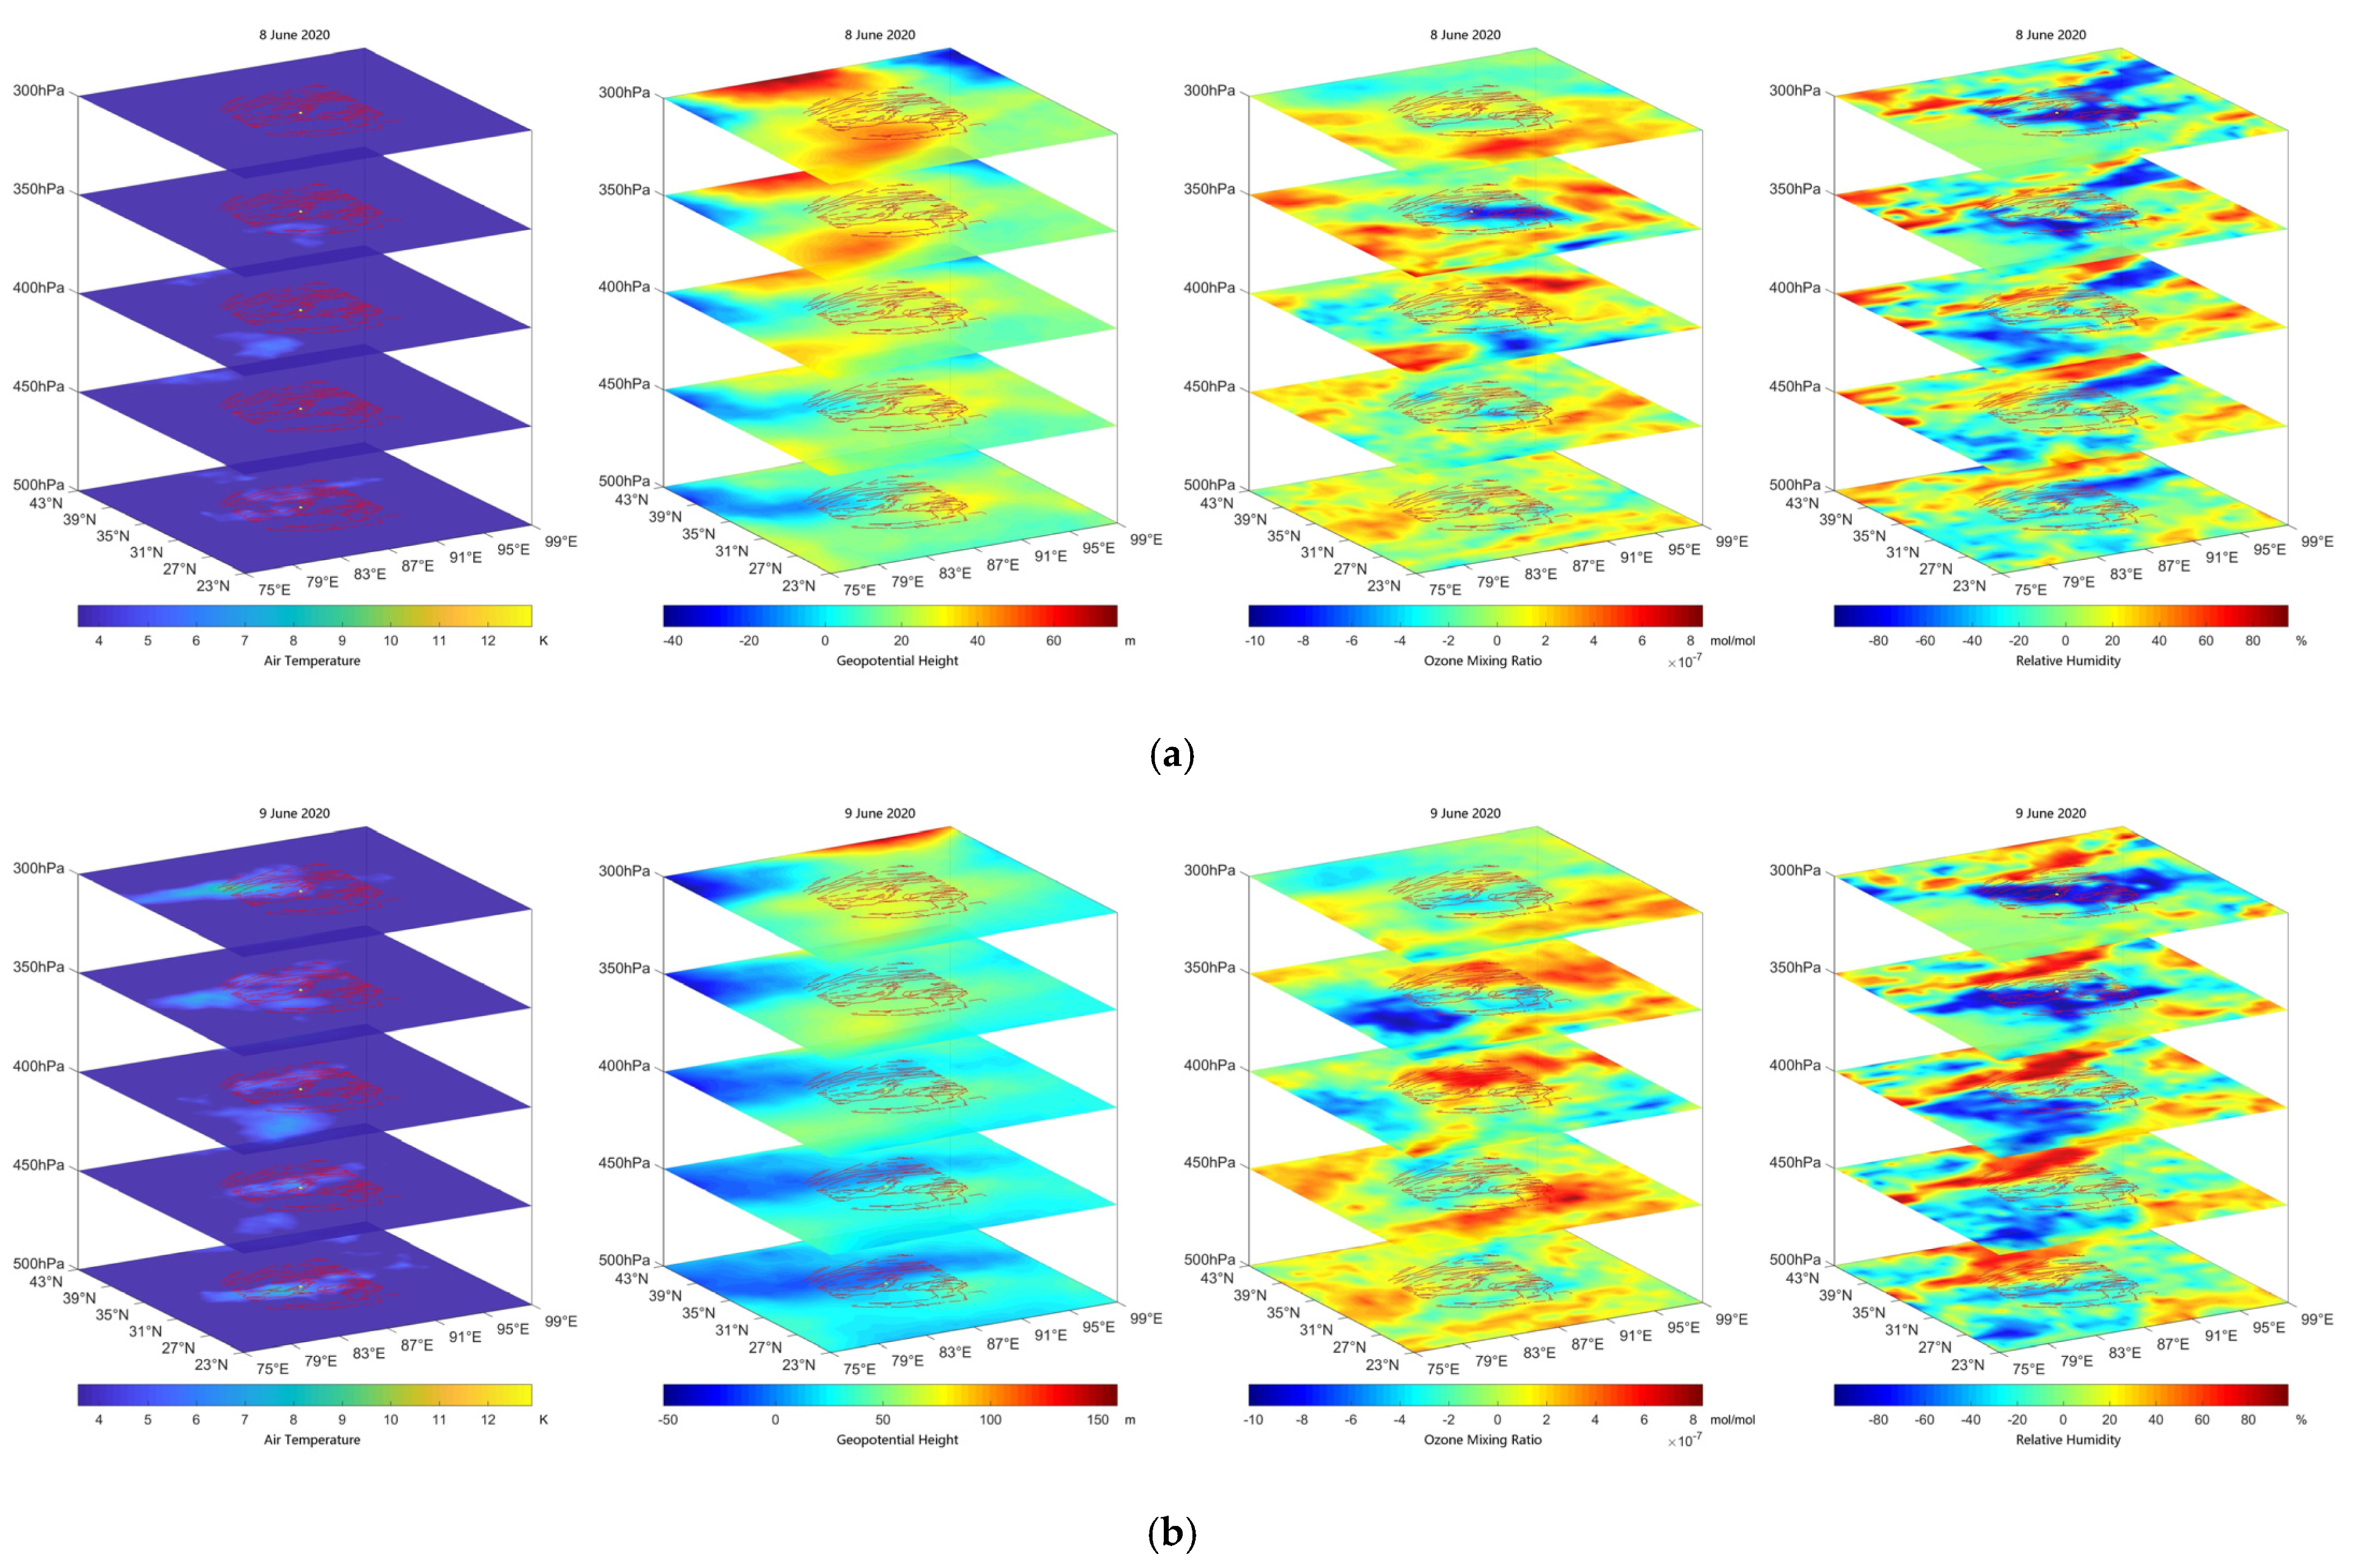
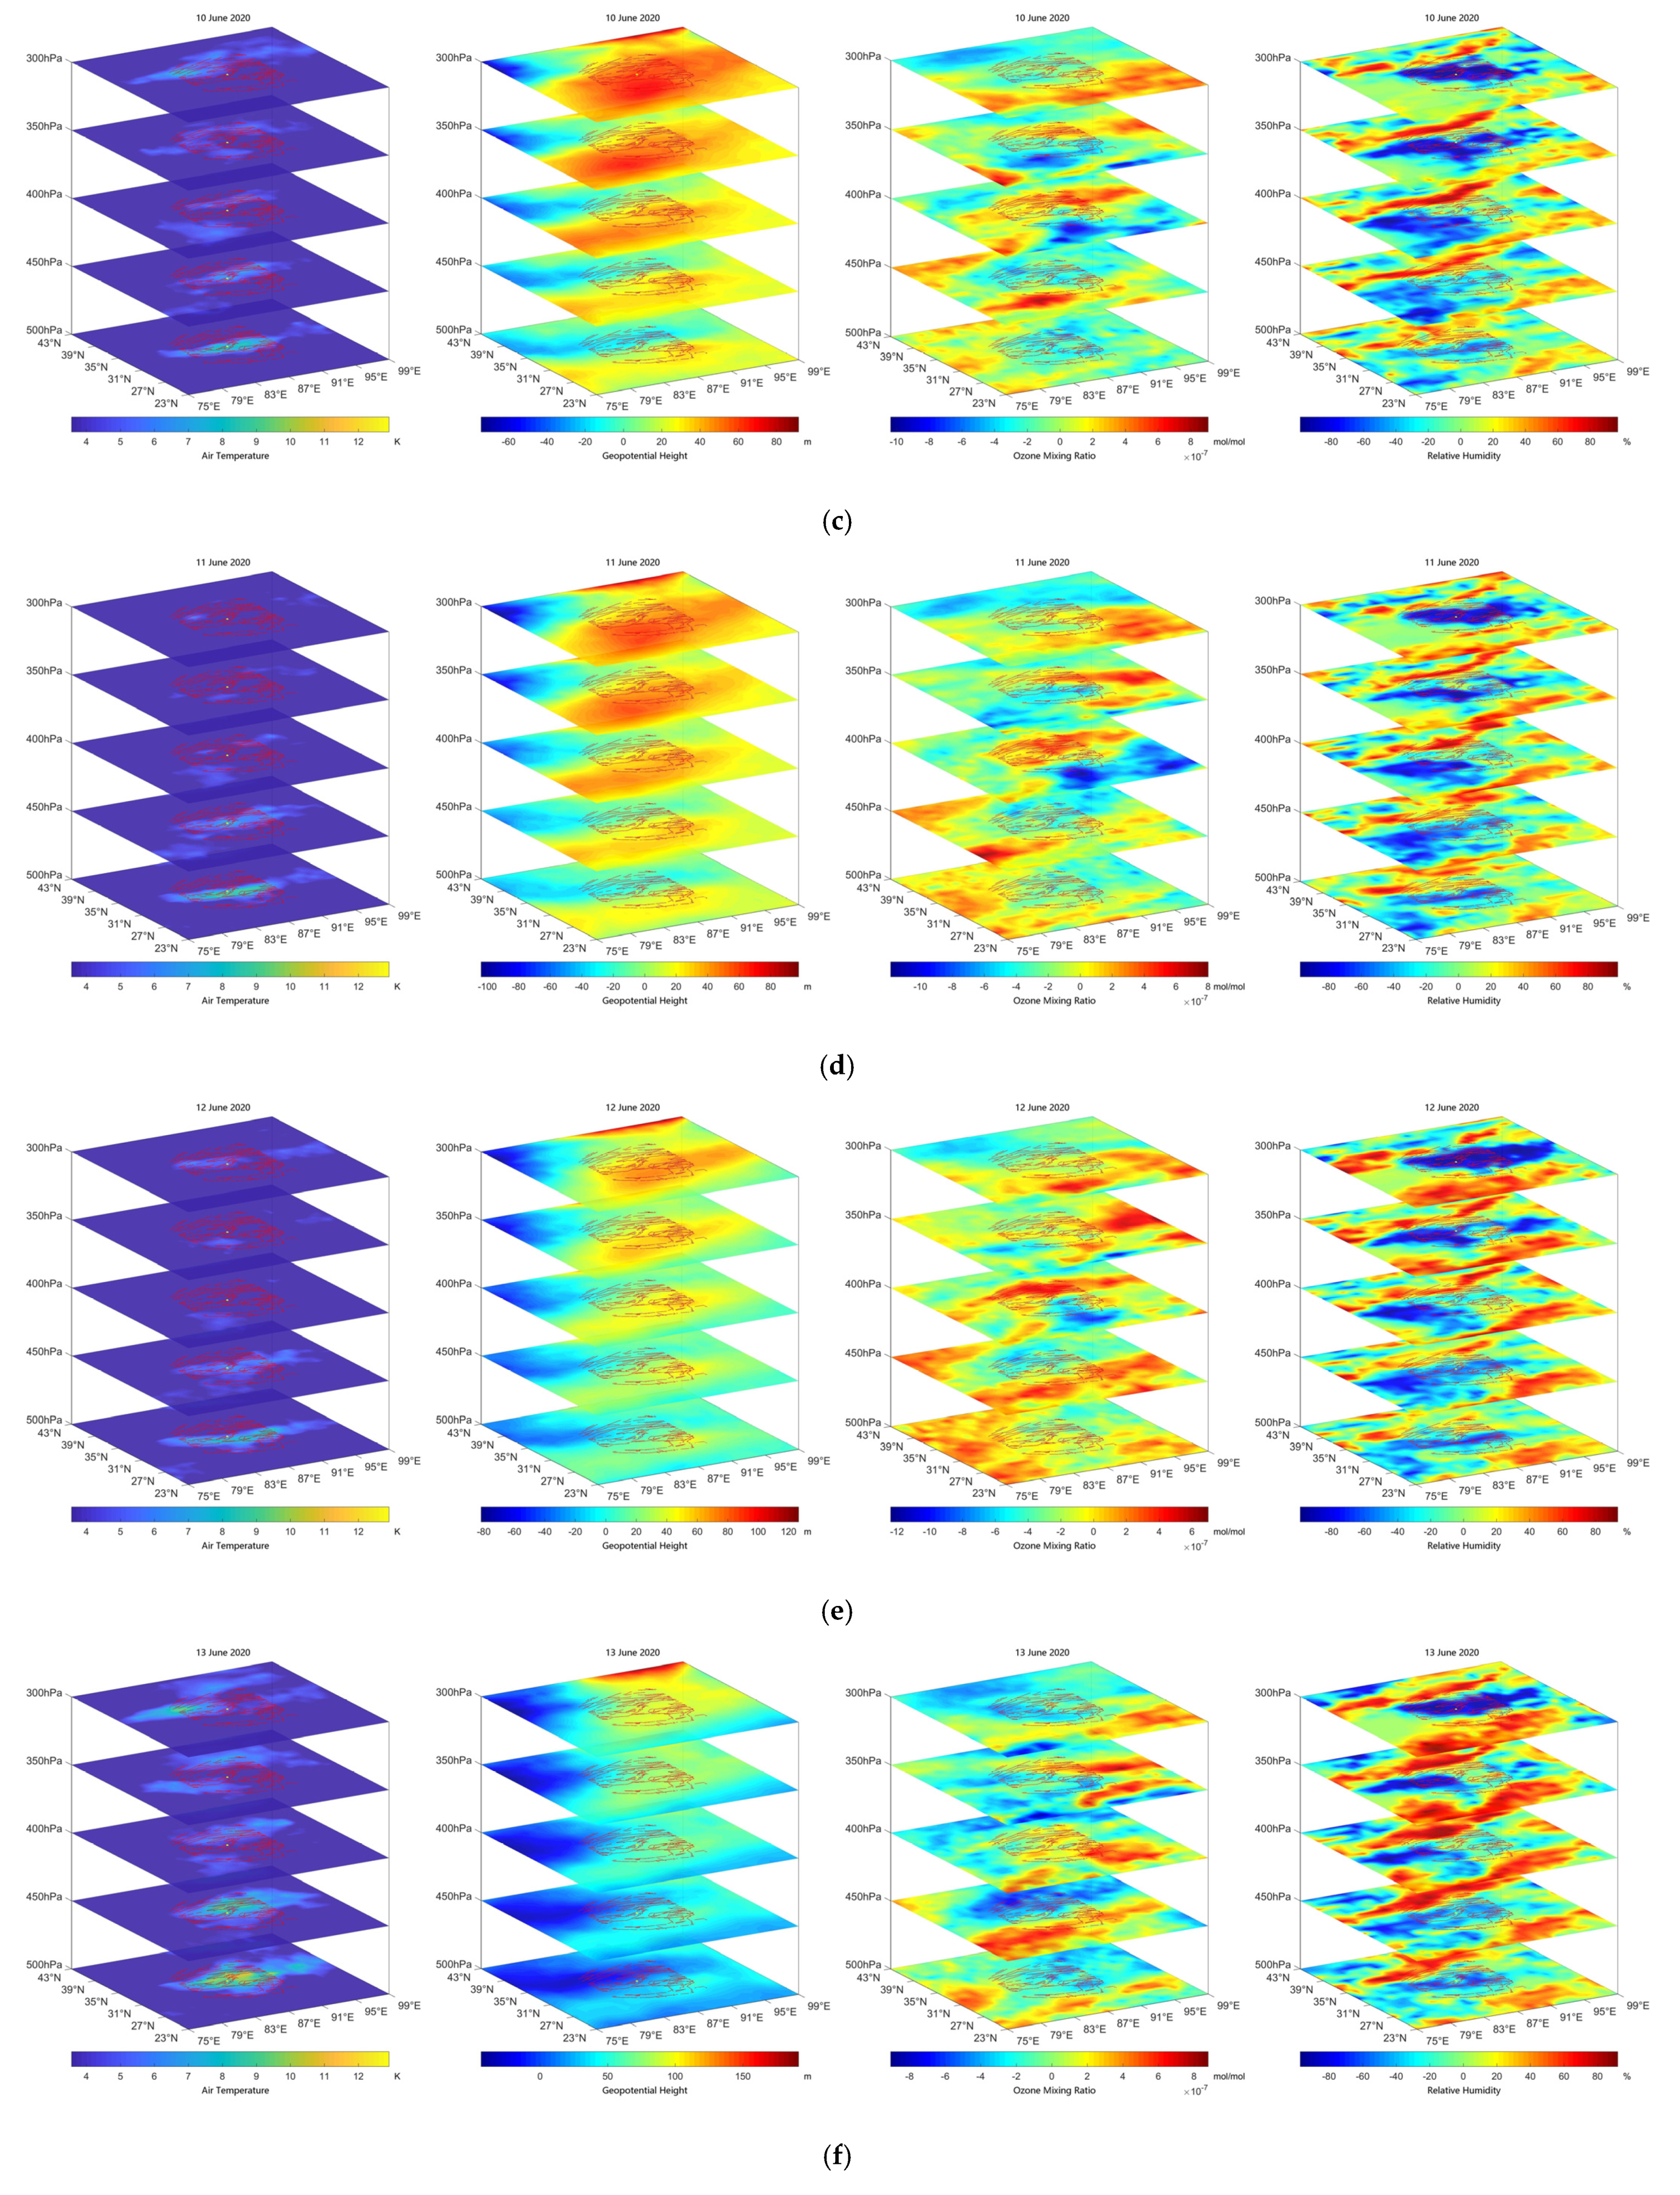
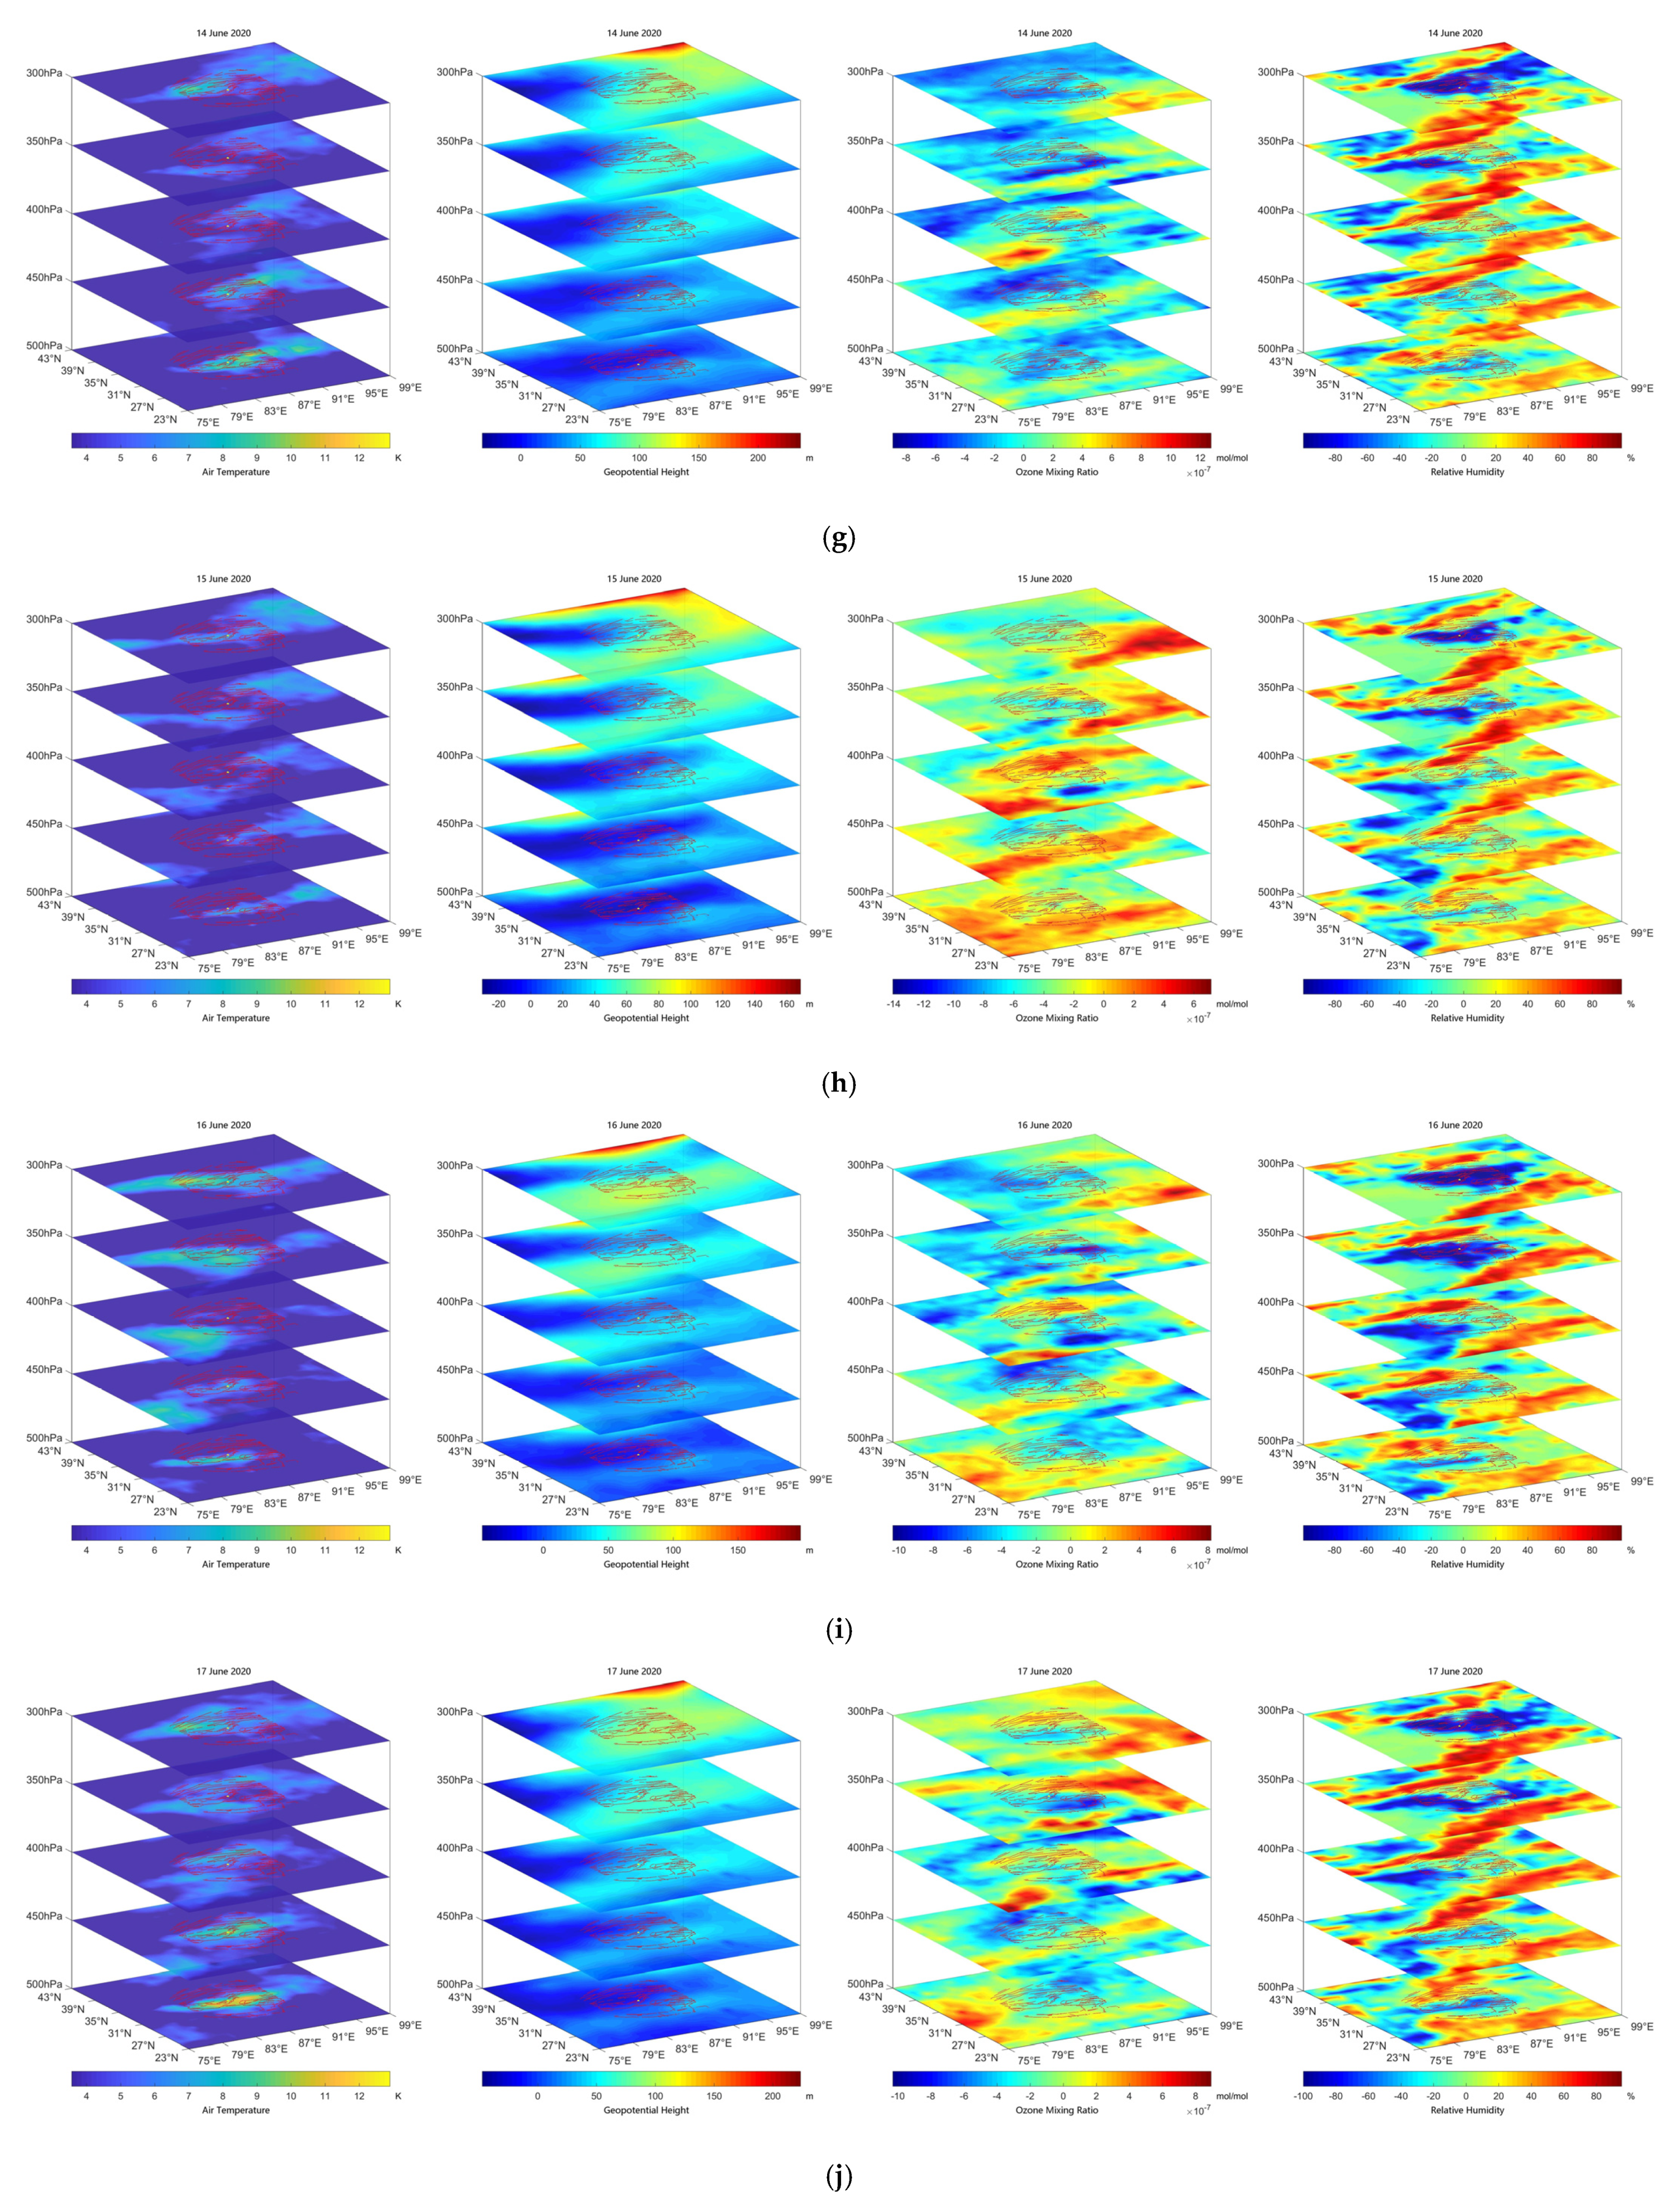
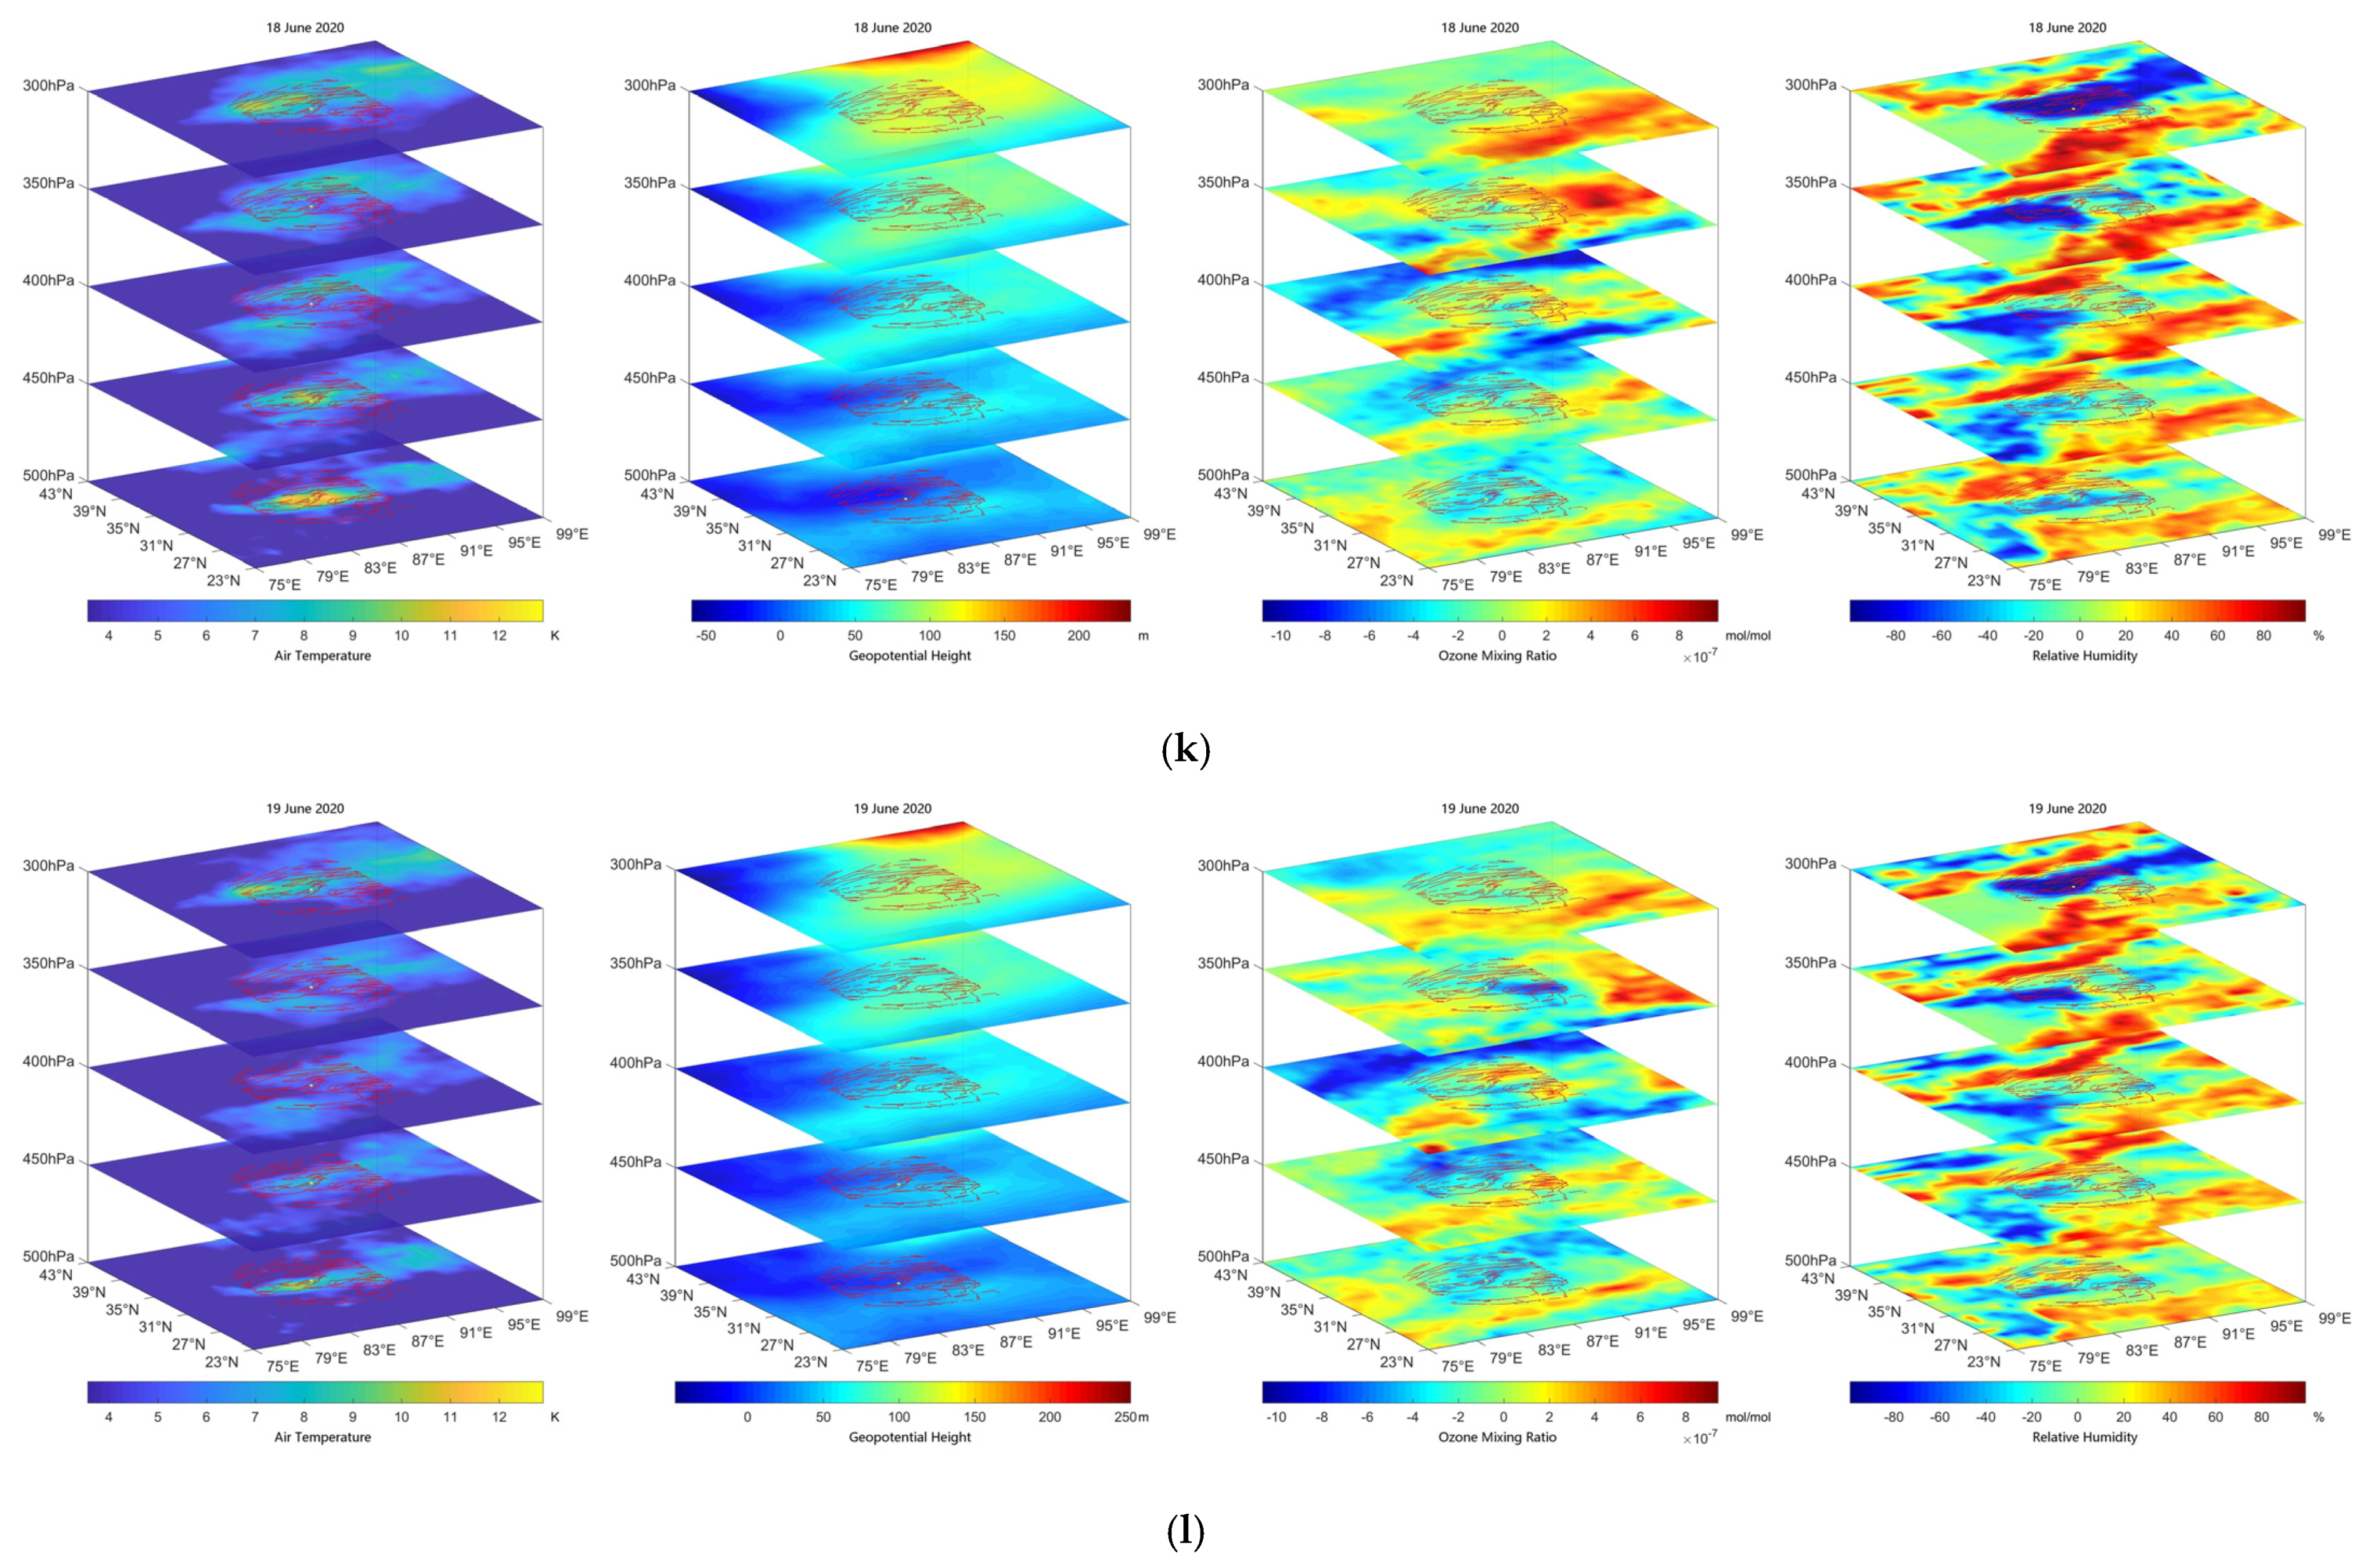
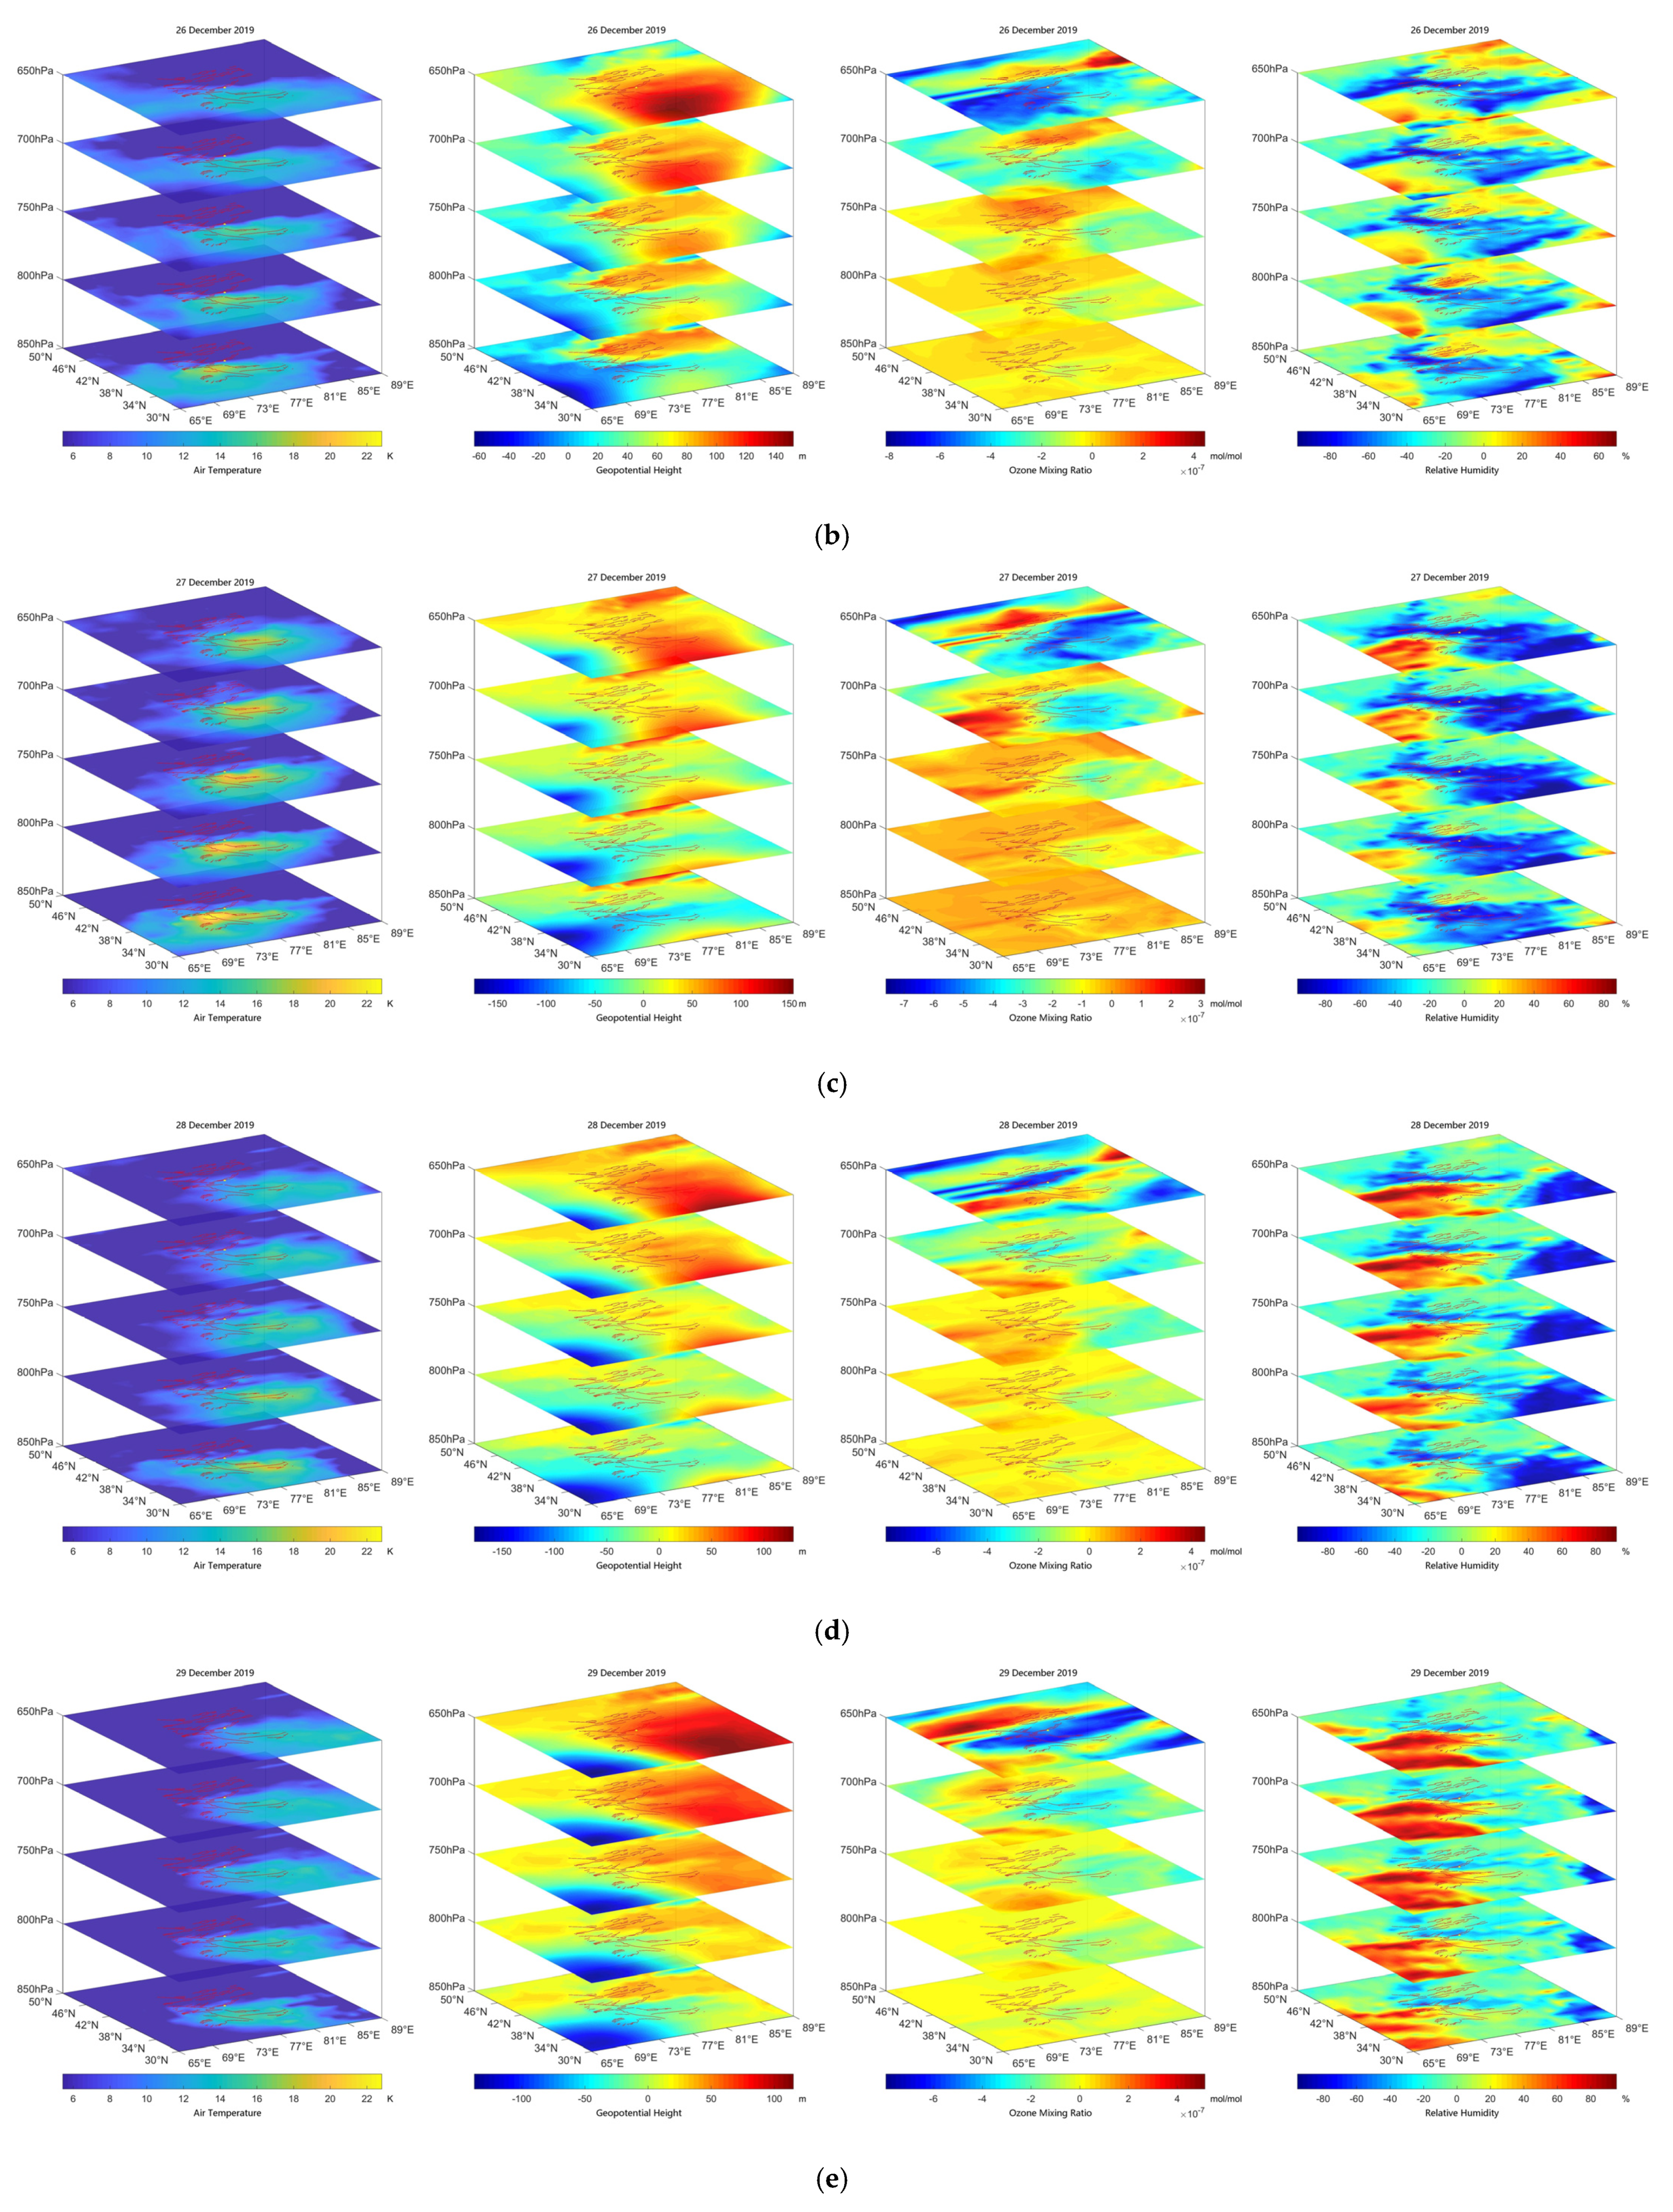
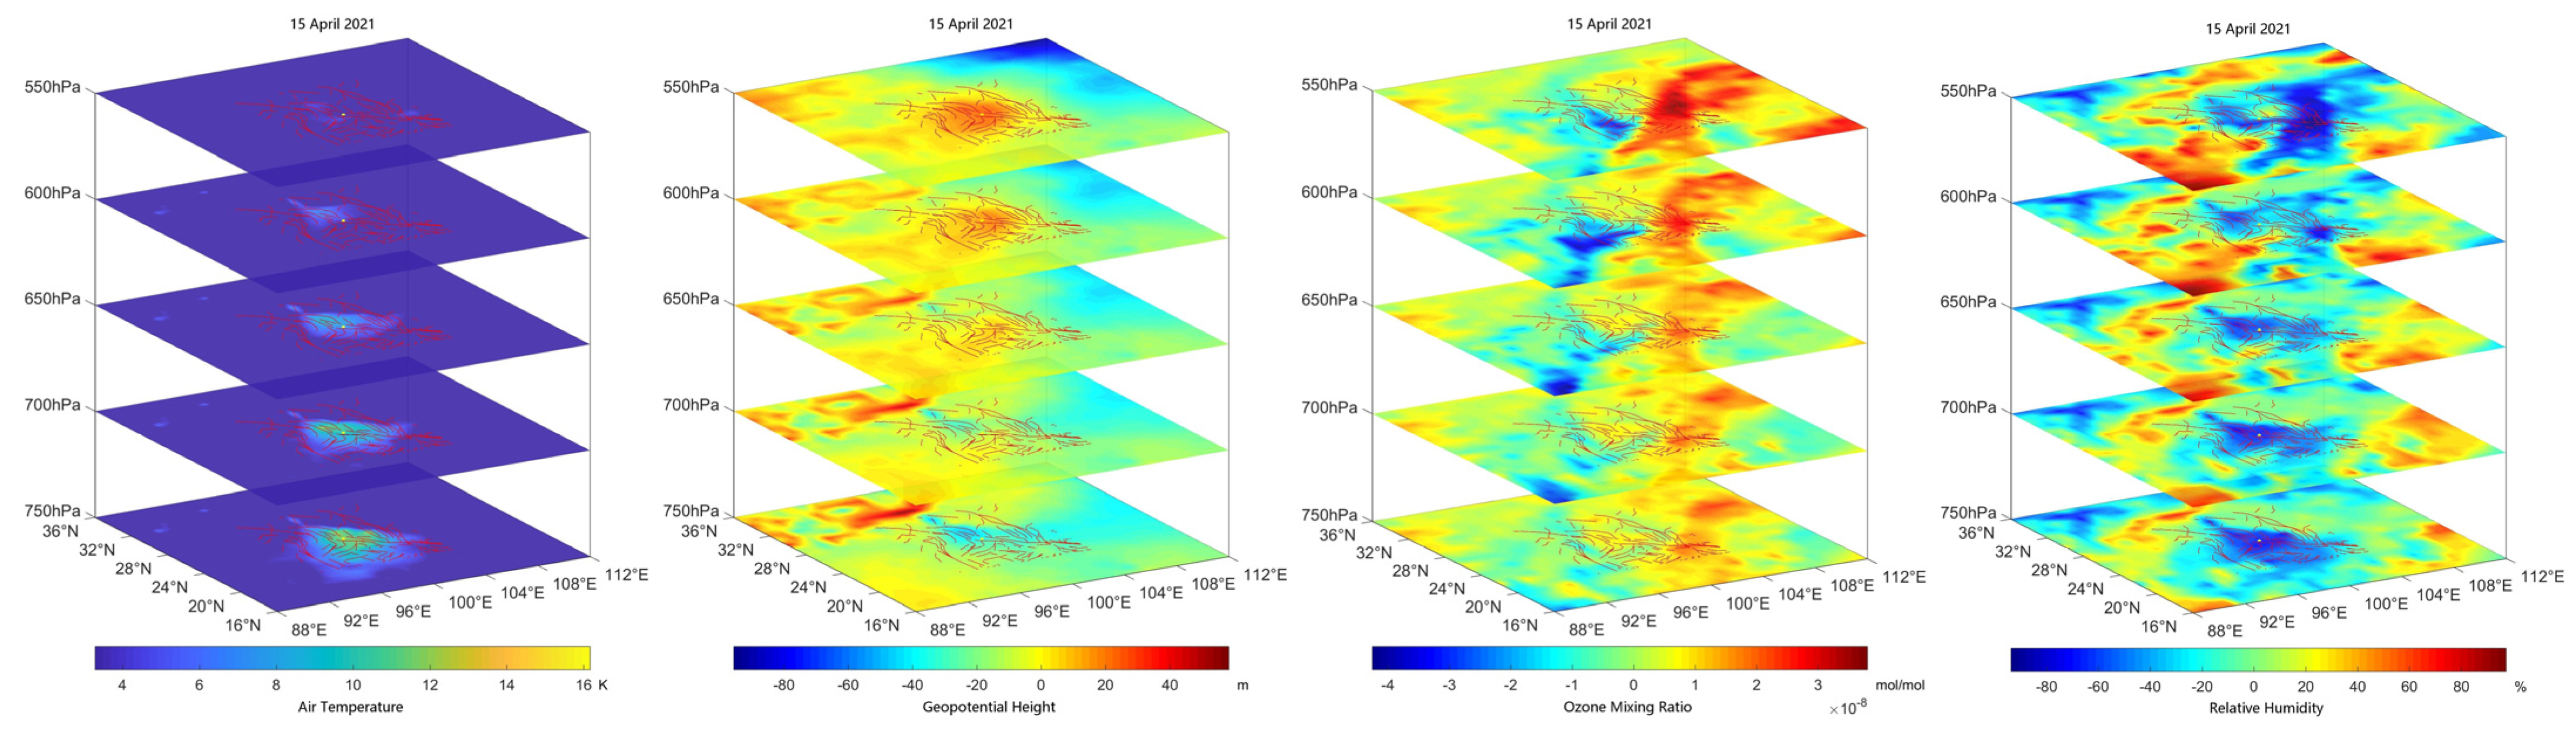
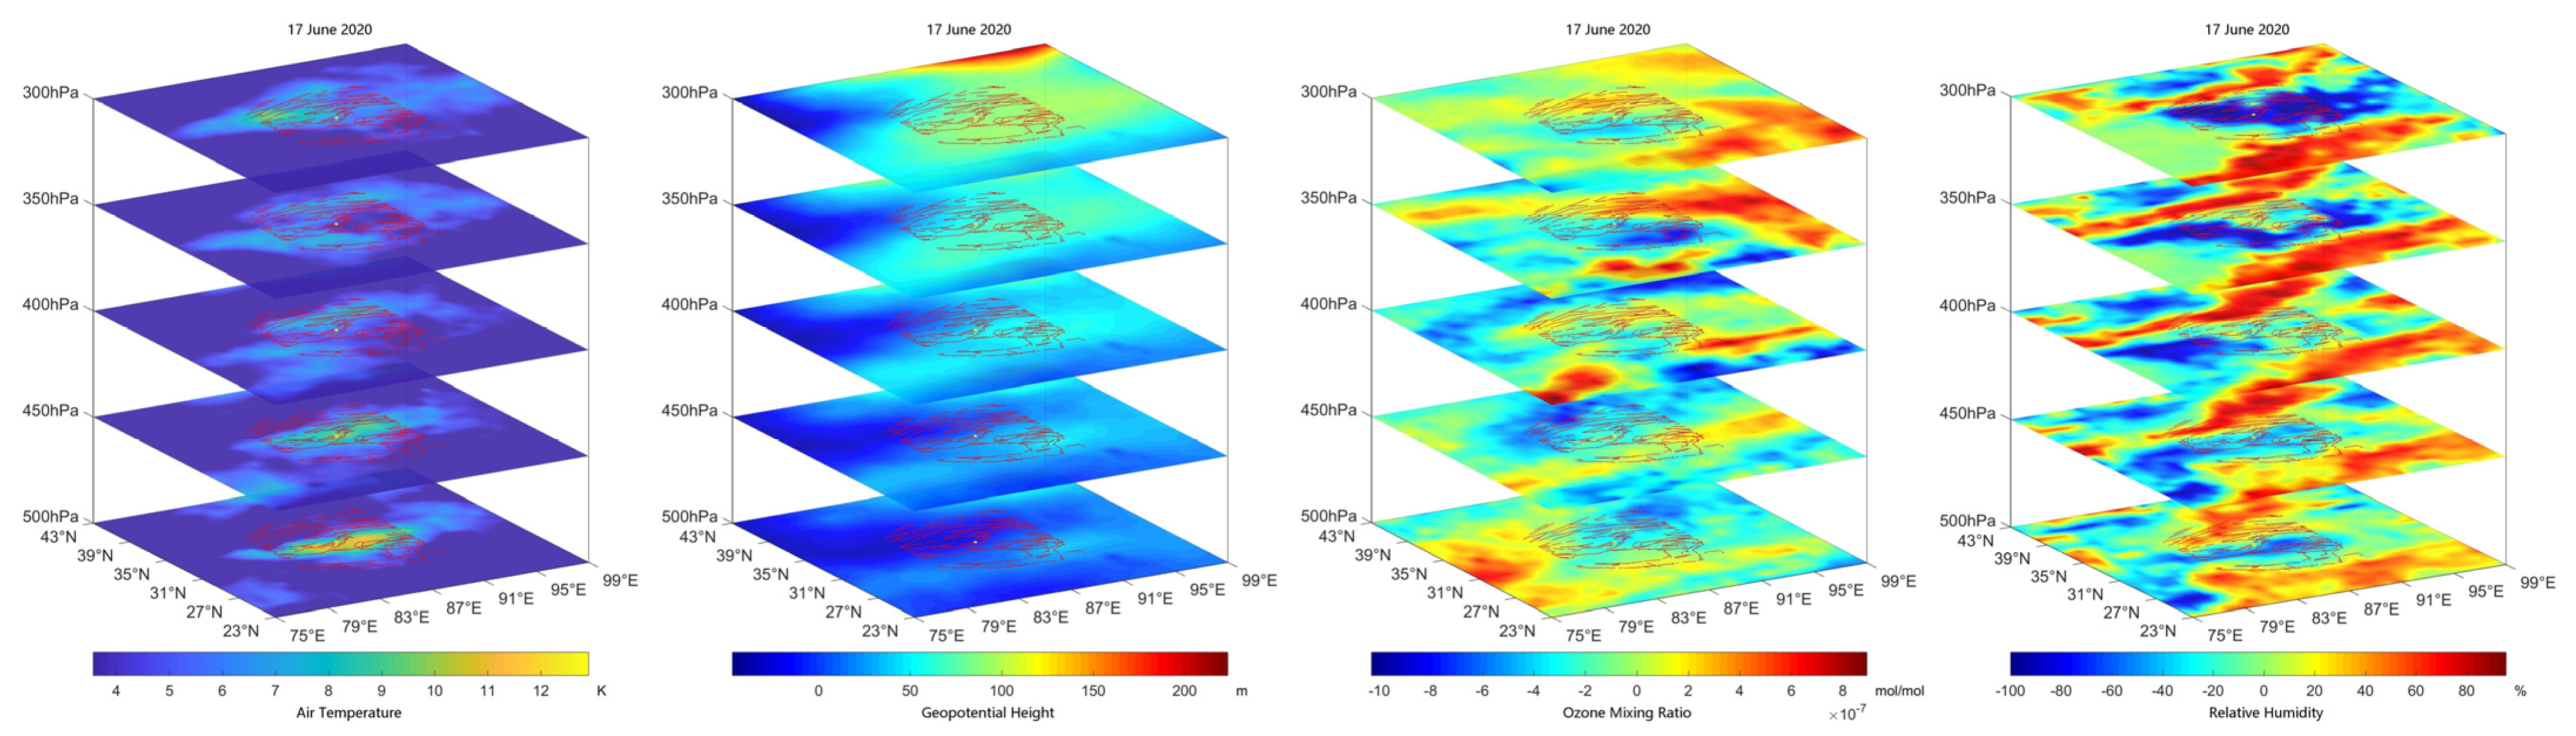
3.2. Atmosphere Evolution during Atmospheric Thermal Anomalies
4. Discussion
5. Conclusions
Author Contributions
Funding
Acknowledgments
Conflicts of Interest
Appendix A


References
- Singh, R.; Cervone, G.; Kafatos, M.; Prasad, A.; Sahoo, A.; Sun, D.; Tang, D.; Yang, R. Multi-sensor studies of the Sumatra earthquake and tsunami of 26 December 2004. Int. J. Remote Sens. 2007, 28, 2885–2896. [Google Scholar] [CrossRef]
- Ouzounov, D.; Freund, F. Mid-infrared emission prior to strong earthquakes analyzed by remote sensing data. Adv. Space Res. 2004, 33, 268–273. [Google Scholar] [CrossRef]
- Panda, S.; Choudhury, S.; Saraf, A.; Das, J. MODIS land surface temperature data detects thermal anomaly preceding 8 October 2005 Kashmir earthquake. Int. J. Remote Sens. 2007, 28, 4587–4596. [Google Scholar] [CrossRef]
- Pulinets, S.; Ouzounov, D.; Ciraolo, L.; Singh, R.; Cervone, G.; Leyva, A.; Dunajecka, M.; Karelin, A.; Boyarchuk, K.; Kotsarenko, A. Thermal, atmospheric and ionospheric anomalies around the time of the Colima M7. 8 earthquake of 21 January 2003. Ann. Geophys. 2006, 24, 835–849. [Google Scholar] [CrossRef] [Green Version]
- Jing, F.; Shen, X.; Kang, C.; Xiong, P. Variations of multi-parameter observations in atmosphere related to earthquake. Nat. Hazards Earth Syst. Sci. 2013, 13, 27–33. [Google Scholar] [CrossRef] [Green Version]
- Wu, L.; Zheng, S.; De Santis, A.; Qin, K.; Mauro, R.D.; Liu, S.; Rainone, M.L. Geosphere coupling and hydrothermal anomalies before the 2009 M w 6.3 L’Aquila earthquake in Italy. Nat. Hazards Earth Syst. Sci. 2016, 16, 1859–1880. [Google Scholar] [CrossRef] [Green Version]
- Lu, X.; Meng, Q.; Gu, X.; Zhang, X.; Xie, T.; Geng, F. Thermal infrared anomalies associated with multi-year earthquakes in the Tibet region based on China’s FY-2E satellite data. Adv. Space Res. 2016, 58, 989–1001. [Google Scholar] [CrossRef]
- Shah, M.; Tariq, M.A.; Naqvi, N.A. Atmospheric anomalies associated with Mw> 6.0 earthquakes in Pakistan and Iran during 2010–2017. J. Atmos. Sol.-Terr. Phys. 2019, 191, 105056. [Google Scholar] [CrossRef]
- Jing, F.; Singh, R.P.; Shen, X. Land–atmosphere–meteorological coupling associated with the 2015 Gorkha (M 7.8) and Dolakha (M 7.3) Nepal earthquakes. Geomat. Nat. Hazards Risk 2019, 10, 1267–1284. [Google Scholar] [CrossRef] [Green Version]
- Qi, Y.; Wu, L.; Mao, W.; Ding, Y.; He, M. Discriminating possible causes of microwave brightness temperature positive anomalies related with May 2008 Wenchuan earthquake sequence. IEEE Trans. Geosci. Remote Sens. 2020, 59, 1903–1916. [Google Scholar] [CrossRef]
- Tramutoli, V.; Corrado, R.; Filizzola, C.; Genzano, N.; Lisi, M.; Pergola, N. From visual comparison to Robust Satellite Techniques: 30 years of thermal infrared satellite data analyses for the study of earthquake preparation phases. Boll. Di Geofis. Teor. Ed Appl. 2015, 56, 167–202. [Google Scholar]
- Qiang, Z.; Dian, C.; Li, L.; Xu, M.; Ge, F.; Liu, T.; Zhao, Y.; Guo, M. Atellitic thermal infrared brightness temperature anomaly image—short-term and impending earthquake precursors. Sci. China Ser. D: Earth Sci. 1999, 42, 313–324. [Google Scholar] [CrossRef]
- Tronin, A.A.; Hayakawa, M.; Molchanov, O.A. Thermal IR satellite data application for earthquake research in Japan and China. J. Geodyn. 2002, 33, 519–534. [Google Scholar] [CrossRef]
- Tramutoli, V. Robust Satellite Techniques (RST) for natural and environmental hazards monitoring and mitigation: Ten years of successful applications. In Proceedings of the ISPMSRS 2005 Conference, Beijing, China, 17–19 October 2005. [Google Scholar]
- Tramutoli, V. Robust satellite techniques (RST) for natural and environmental hazards monitoring and mitigation: Theory and applications. In Proceedings of the 2007 International Workshop on the Analysis of Multi-temporal Remote Sensing Images, Leuven, Belgium, 18–20 July 2007; pp. 1–6. [Google Scholar]
- Zhang, Y.; Guo, X.; Zhong, M.; Shen, W.; Li, W.; He, B. Wenchuan earthquake: Brightness temperature changes from satellite infrared information. Chin. Sci. Bull. 2010, 55, 1917–1924. [Google Scholar] [CrossRef]
- Chen, S.; Liu, P.; Feng, T.; Wang, D.; Jiao, Z.; Chen, L.; Xu, Z.; Zhang, G. Exploring Changes in Land Surface Temperature Possibly Associated with Earthquake: Case of the April 2015 Nepal Mw 7.9 Earthquake. Entropy 2020, 22, 377. [Google Scholar] [CrossRef] [Green Version]
- Blackett, M.; Wooster, M.J.; Malamud, B.D. Exploring land surface temperature earthquake precursors: A focus on the Gujarat (India) earthquake of 2001. Geophys. Res. Lett. 2011, 38. [Google Scholar] [CrossRef]
- Guangmeng, G.; Bin, W. Cloud anomaly before Iran earthquake. Int. J. Remote Sens. 2008, 29, 1921–1928. [Google Scholar]
- Guangmeng, G.; Jie, Y. Three attempts of earthquake prediction with satellite cloud images. Nat. Hazards Earth Syst. Sci. 2013, 13, 91–95. [Google Scholar] [CrossRef] [Green Version]
- Zhang, Y.; Meng, Q. A statistical analysis of TIR anomalies extracted by RSTs in relation to an earthquake in the Sichuan area using MODIS LST data. Nat. Hazards Earth Syst. Sci. 2019, 19, 535–549. [Google Scholar] [CrossRef] [Green Version]
- Kilston, S.; Knopoff, L. Lunar–solar periodicities of large earthquakes in southern California. Nature 1983, 304, 21–25. [Google Scholar] [CrossRef]
- Zhang, X.; Kang, C.; Ma, W.; Ren, J.; Wang, Y. Study on thermal anomalies of earthquake process by using tidal-force and outgoing-longwave-radiation. Therm. Sci. 2018, 22, 767–776. [Google Scholar] [CrossRef]
- Heaton, T.H. Tidal triggering of earthquakes. Geophys. J. Int. 1975, 43, 307–326. [Google Scholar] [CrossRef] [Green Version]
- Zhang, Y.; Meng, Q.; Wang, Z.; Lu, X.; Hu, D. Temperature Variations in Multiple Air Layers before the Mw 6.2 2014 Ludian Earthquake, Yunnan, China. Remote Sens. 2021, 13, 884. [Google Scholar] [CrossRef]
- Ma, W.; Zhang, X.; Liu, J.; Yao, Q.; Zhou, B.; Yue, C.; Kang, C.; Lu, X. Influences of multiple layers of air temperature differences on tidal forces and tectonic stress before, during and after the Jiujiang earthquake. Remote Sens. Environ. 2018, 210, 159–165. [Google Scholar]
- Cui, Y.; Ouzounov, D.; Hatzopoulos, N.; Sun, K.; Zou, Z.; Du, J. Satellite observation of CH4 and CO anomalies associated with the Wenchuan MS 8.0 and Lushan MS 7.0 earthquakes in China. Chem. Geol. 2017, 469, 185–191. [Google Scholar] [CrossRef] [Green Version]
- Cui, J.; Shen, X.; Zhang, J.; Ma, W.; Chu, W. Analysis of spatiotemporal variations in middle-tropospheric to upper-tropospheric methane during the Wenchuan M s = 8.0 earthquake by three indices. Nat. Hazards Earth Syst. Sci. 2019, 19, 2841–2854. [Google Scholar] [CrossRef] [Green Version]
- Liu, Q.; De Santis, A.; Piscini, A.; Cianchini, G.; Ventura, G.; Shen, X. Multi-parametric climatological analysis reveals the involvement of fluids in the preparation phase of the 2008 Ms 8.0 wenchuan and 2013 Ms 7.0 lushan earthquakes. Remote Sens. 2020, 12, 1663. [Google Scholar] [CrossRef]
- Dunajecka, M.; Pulinets, S. Atmospheric and thermal anomalies observed around the time of strong earthquakes in Mexico. Atmósfera 2005, 18, 235–247. [Google Scholar]
- Shah, M.; Aibar, A.C.; Tariq, M.A.; Ahmed, J.; Ahmed, A. Possible ionosphere and atmosphere precursory analysis related to Mw> 6.0 earthquakes in Japan. Remote Sens. Environ. 2020, 239, 111620. [Google Scholar] [CrossRef]
- Pulinets, S.; Ouzounov, D. Lithosphere—Atmosphere—Ionosphere Coupling (LAIC) model—An unified concept for earthquake precursors validation. J. Asian Earth Sci. 2011, 41, 371–382. [Google Scholar] [CrossRef]
- Akhoondzadeh, M.; De Santis, A.; Marchetti, D.; Piscini, A.; Cianchini, G. Multi precursors analysis associated with the powerful Ecuador (M W =7.8) earthquake of 16 April 2016 using Swarm satellites data in conjunction with other multi-platform satellite and ground data. Adv. Space Res. 2018, 61, 248–263. [Google Scholar] [CrossRef] [Green Version]
- Qin, K.; Wu, L.; Santis, A.D.; Meng, J.; Ma, W.; Cianchini, G. Quasi-synchronous multi-parameter anomalies associated with the 2010–2011 New Zealand earthquake sequence. Nat. Hazards Earth Syst. Sci. 2012, 12, 1059–1072. [Google Scholar] [CrossRef]
- Genzano, N.; Filizzola, C.; Hattori, K.; Pergola, N.; Tramutoli, V. Statistical Correlation Analysis Between Thermal Infrared Anomalies Observed from MTSATs and Large Earthquakes Occurred in Japan (2005–2015). J. Geophys. Res. Solid Earth 2021, 126, e2020JB020108. [Google Scholar] [CrossRef]
- Kalnay, E.; Kanamitsu, M.; Kistler, R.; Collins, W.; Deaven, D.; Gandin, L.; Iredell, M.; Saha, S.; White, G.; Woollen, J. The NCEP/NCAR 40-year reanalysis project. Bull. Am. Meteorol. Soc. 1996, 77, 437–472. [Google Scholar] [CrossRef] [Green Version]
- Kistler, R.; Kalnay, E.; Collins, W.; Saha, S.; White, G.; Woollen, J.; Chelliah, M.; Ebisuzaki, W.; Kanamitsu, M.; Kousky, V. The NCEP/NCAR 50-year reanalysis: Documentation and monthly-means CD-ROM. Bull. Am. Meteorol. Soc. 2001, 82. [Google Scholar] [CrossRef]
- Straser, V. Variations in gravitational field, tidal force, electromagnetic waves and earthquakes. New Concepts Glob. Tecton. Newsl. 2010, 57, 98–108. [Google Scholar]
- Ma, W.; Wang, H.; Li, F.; Ma, W. Relation between the celestial tide-generating stress and the temperature variations of the Abruzzo M= 6.3 Earthquake in April 2009. Nat. Hazards Earth Syst. Sci. 2012, 12, 819–827. [Google Scholar] [CrossRef] [Green Version]
- Zhou, S.; Zhang, R. Decadal variations of temperature and geopotential height over the Tibetan Plateau and their relations with Tibet ozone depletion. Geophys. Res. Lett. 2005, 32, 32. [Google Scholar] [CrossRef]
- Tomczyk, A.M.; Bednorz, E. Heat waves in Central Europe and tropospheric anomalies of temperature and geopotential heights. Int. J. Climatol. 2019, 39, 4189–4205. [Google Scholar] [CrossRef]
- Zheng, S.; Singh, R.P. Aerosol and meteorological parameters associated with the intense dust event of 15 April 2015 over Beijing, China. Remote Sens. 2018, 10, 957. [Google Scholar] [CrossRef] [Green Version]
- Jing, F.; Chauhan, A.; P. Singh, R.; Dash, P. Changes in atmospheric, meteorological, and ocean parameters associated with the 12 January 2020 Taal volcanic eruption. Remote Sens. 2020, 12, 1026. [Google Scholar] [CrossRef] [Green Version]
- Piscini, A.; De Santis, A.; Marchetti, D.; Cianchini, G. A Multi-parametric climatological approach to study the 2016 Amatrice–Norcia (Central Italy) earthquake preparatory phase. Pure Appl. Geophys. 2017, 174, 3673–3688. [Google Scholar] [CrossRef]
- Xiong, P.; Tong, L.; Zhang, K.; Shen, X.; Battiston, R.; Ouzounov, D.; Iuppa, R.; Crookes, D.; Long, C.; Zhou, H. Towards advancing the earthquake forecasting by machine learning of satellite data. Sci. Total. Environ. 2021, 771, 145256. [Google Scholar] [CrossRef]
- Jing, F.; Singh, R.P. Changes in Tropospheric Ozone Associated with Strong Earthquakes and Possible Mechanism. IEEE J. Sel. Top. Appl. Earth Obs. Remote Sens. 2021, 14, 5300–5310. [Google Scholar] [CrossRef]
- Ouzounov, D.; Pulinets, S.; Liu, J.Y.; Hattori, K.; Han, P. Multiparameter Assessment of Pre-Earthquake Atmospheric Signals. In Pre-Earthquake Processes: A Multidisciplinary Approach to Earthquake Prediction Studies; AGU/Wiley: Hoboken, NJ, USA, 2018; pp. 339–359. [Google Scholar]
- Meng, Q.; Zhang, Y. Discovery of spatial-temporal causal interactions between thermal and methane anomalies associated with the Wenchuan earthquake. Eur. Phys. J. Spec. Top. 2021, 230, 247–261. [Google Scholar] [CrossRef]
- Varotsos, C.A.; Efstathiou, M.N.; Cracknell, A.P. On the association of aerosol optical depth and total ozone fluctuations with recent earthquakes in Greece. Acta Geophys. 2017, 65, 659–665. [Google Scholar] [CrossRef]


| Site | UTC Time | Epicenter Location (°) | Ms | Depth (km) | Altitude (m) | Epicenter Fault |
|---|---|---|---|---|---|---|
| Maduo county, Qinghai | 18:04, 21 May 2021 | N34.59–E98.34 | 7.4 | 10 | 4236 | Maduo-Gande |
| Yangbi county, Yunnan | 13:48, 21 May 2021 | N25.67–E99.87 | 6.4 | 9 | 2291 | Weixi-Qiaohou |
| Biru county, Tibet | 06:11, 19 March 2021 | N31.94–E92.74 | 6.1 | 8 | 4474 | Southern Margin of Ando Basin |
| Nima county, Tibet | 20:07, 22 July 2020 | N33.19–E86.81 | 6.6 | 10 | 5378 | Yibug Caka-Rigain Pünco |
| Yutian county, Xinjiang | 21:05, 25 June 2020 | N35.73–E82.33 | 6.4 | 10 | 5279 | Altun Tagh |
| Jiashi county, Xinjiang | 13:27, 19 January 2020 | N39.83–E77.21 | 6.4 | 5.6 | 1399 | Kalpintag |
| Earthquake | Isobaric Surfaces | Data Time |
|---|---|---|
| Maduo | 550 hPa, 500 hPa, 450 hPa, 400 hPa, 350 hPa | UTC-18:00 |
| Yangbi | 750 hPa, 700 hPa, 650 hPa, 600 hPa, 550 hPa | UTC-12:00 |
| Biru | 550 hPa, 500 hPa, 450 hPa, 400 hPa, 350 hPa | UTC-06:00 |
| Nima | 500 hPa, 450 hPa, 400 hPa, 350 hPa, 300 hPa | UTC-18:00 |
| Yutian | 500 hPa, 450 hPa, 400 hPa, 350 hPa, 300 hPa | UTC-0:00 (next day) |
| Jiashi | 850 hpa, 800 hPa, 750 hPa, 700 hPa, 650 hPa | UTC-12:00 |
| Earthquake | Period A | Period B | Period C | Period D | Period E |
|---|---|---|---|---|---|
| Maduo | 3 April−18 April | 19 April−1 May | 2 May−17 May | 18 May−31 May | 1 June−17 June |
| Yangbi | 6 April−21 April | 22 April−4 May | 5 May−20 May | 21 May−3 June | 4 June−18 June |
| Biru | 30 January−12 February | 13 February−28 February | 1 March−14 March | 15 March−29 March | 30 March−12 April |
| Nima | 24 May−6 June | 7 June−23 June | 24 June−7 July | 8 July−22 July | 23 July−6 August |
| Yutian | 8 May−24 May | 25 May−8 June | 9 June−24 June | 25 June−8 July | 9 July−23 July |
| Jiashi | 7 December−20 December | 21 December−4 January | 5 January−18 January | 19 January−2 February | 3 February−16 February |
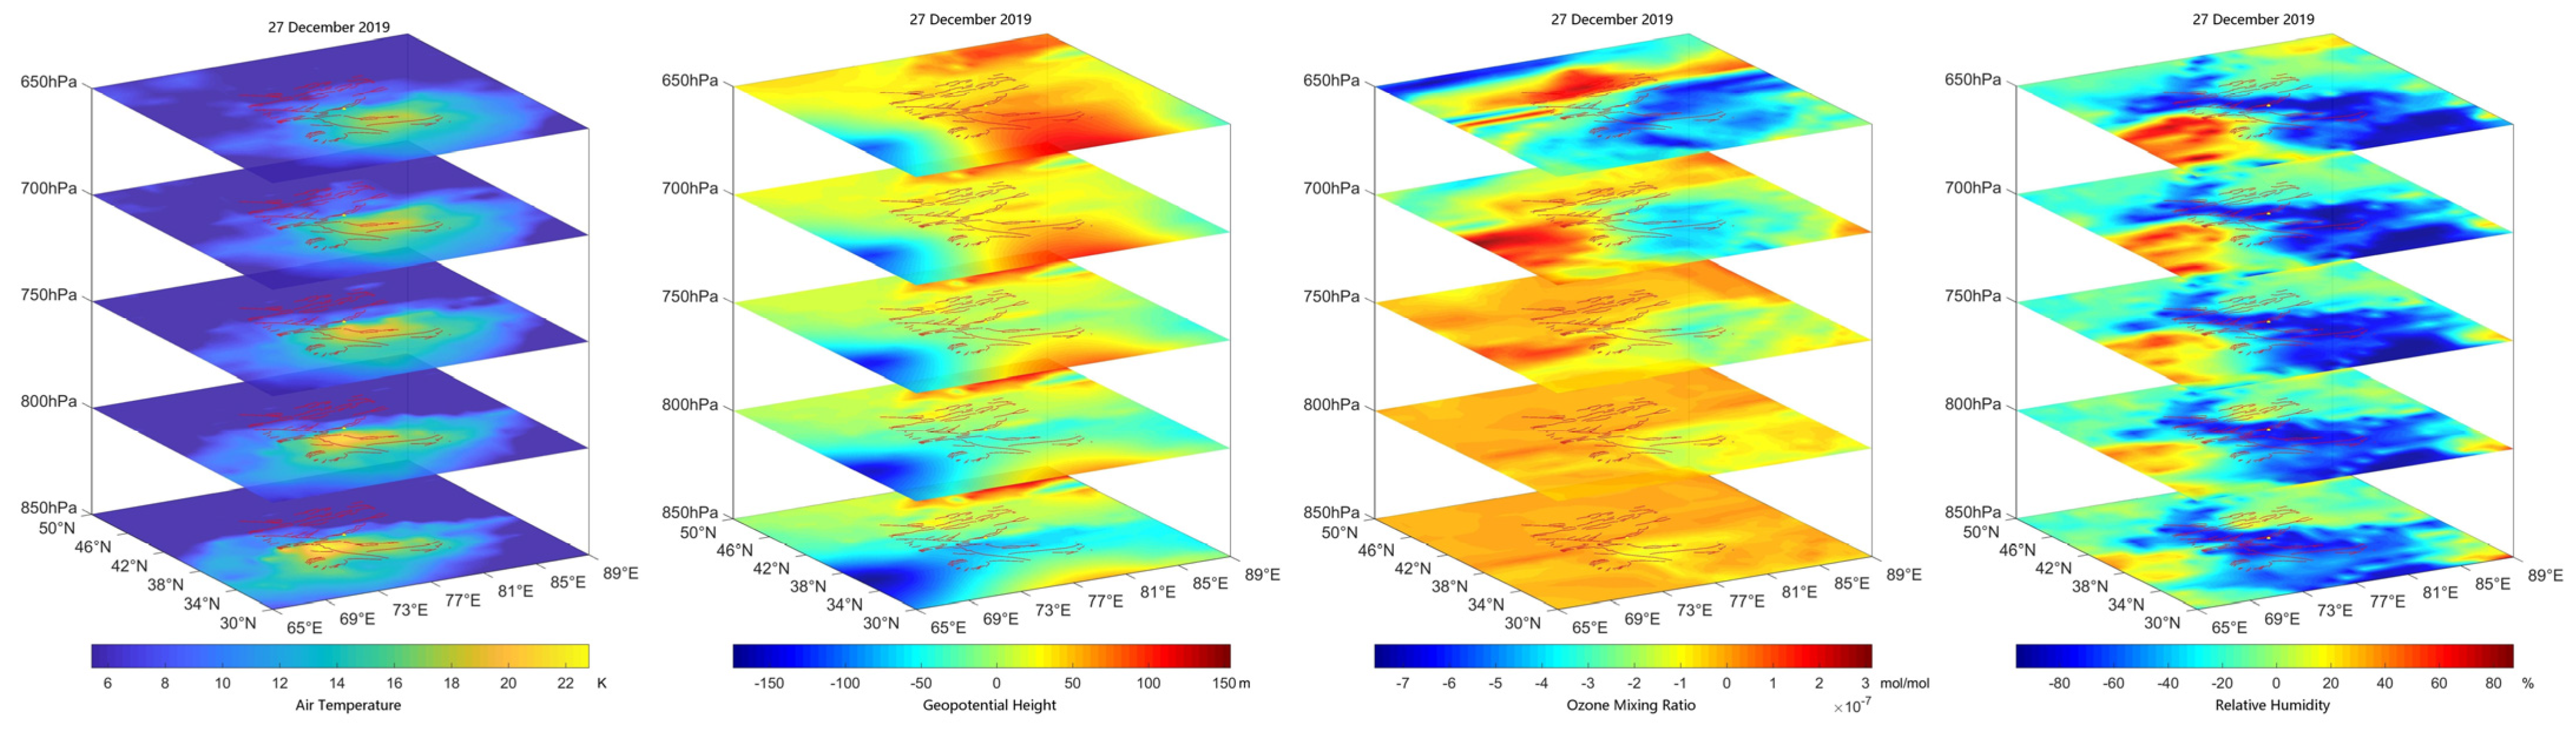
| Earthquake | Period of Atmospheric Thermal Anomalies | Specific Date |
|---|---|---|
| Maduo | - | - |
| Yangbi | A | 7 April−21 April |
| Biru | B | 21 February−28 February |
| Nima | B | 8 June−19 June |
| Yutian | - | - |
| Jiashi | B | 25 December−29 December |
Publisher’s Note: MDPI stays neutral with regard to jurisdictional claims in published maps and institutional affiliations. |
© 2021 by the authors. Licensee MDPI, Basel, Switzerland. This article is an open access article distributed under the terms and conditions of the Creative Commons Attribution (CC BY) license (https://creativecommons.org/licenses/by/4.0/).
Share and Cite
Xu, X.; Chen, S.; Yu, Y.; Zhang, S. Atmospheric Anomaly Analysis Related to Ms > 6.0 Earthquakes in China during 2020–2021. Remote Sens. 2021, 13, 4052. https://doi.org/10.3390/rs13204052
Xu X, Chen S, Yu Y, Zhang S. Atmospheric Anomaly Analysis Related to Ms > 6.0 Earthquakes in China during 2020–2021. Remote Sensing. 2021; 13(20):4052. https://doi.org/10.3390/rs13204052
Chicago/Turabian StyleXu, Xitong, Shengbo Chen, Yan Yu, and Sen Zhang. 2021. "Atmospheric Anomaly Analysis Related to Ms > 6.0 Earthquakes in China during 2020–2021" Remote Sensing 13, no. 20: 4052. https://doi.org/10.3390/rs13204052
APA StyleXu, X., Chen, S., Yu, Y., & Zhang, S. (2021). Atmospheric Anomaly Analysis Related to Ms > 6.0 Earthquakes in China during 2020–2021. Remote Sensing, 13(20), 4052. https://doi.org/10.3390/rs13204052