Article

Analysis of the Geological Controls and Kinematics of the Chgega Landslide (Mateur, Tunisia) Exploiting Photogrammetry and InSAR Technologies

by
Seifeddine Gaidi
1,2,*,
Jorge Pedro Galve
2,
Fetheddine Melki
1,
Patricia Ruano
2,3,
Cristina Reyes-Carmona
2,4,
Wissem Marzougui
5,
Stefano Devoto
6,
José Vicente Pérez-Peña
2,7,
José Miguel Azañón
2,7,
Haifa Chouaieb
5,
Fouad Zargouni
1 and
Guillermo Booth-Rea
2,3
1
Faculté des Sciences de Tunis, Université de Tunis El Manar, Tunis 1068, Tunisia
2
Departamento de Geodinámica, Universidad de Granada, 18071 Granada, Spain
3
CISC-UGR, Instituto Andaluz de Ciencias de la Tierra (IACT), 18100 Armilla, Spain
4
Geohazards InSAR Laboratory and Modelling Group (InSARlab), Geoscience Research Department, Geological Survey of Spain (IGME), 28003 Madrid, Spain
5
Office National des Mines, Tunis 2035, Tunisia
6
Department of Mathematics and Geosciences, University of Trieste, via Weiss 2, 34127 Trieste, Italy
7
Instituto Andaluz de Geofísica (IAG), Universidad de Granada, 18071 Granada, Spain
*
Author to whom correspondence should be addressed.
Remote Sens. 2021, 13(20), 4048; https://doi.org/10.3390/rs13204048
Submission received: 30 August 2021 / Revised: 28 September 2021 / Accepted: 4 October 2021 / Published: 10 October 2021

Abstract

:
Exploration of territories not previously analyzed by landslide experts provides interesting findings. The Chgega landslide, in northern Tunisia, represents a paradigmatic mass movement. It can be classified as a complex landslide, or more specifically as vast rock spreading that evolved into a block slide. It involves a great block of limestone—about 900 m long and 400 m wide—sliding over ductile clays and marls. The viscoplastic creep of the clays drives the landslide and creates, in its crown, a graben ~800 m long and ~120 m wide that breaks the summit of Chgega Mountain. Using Interferometric Synthetic Aperture Radar (InSAR) technologies, we demonstrate that this complex landslide is currently active and moreover shows progressive movement without clear episodic accelerations. The velocity of the limestone block is just above 2 mm/yr. The occurrence of gravity-induced joints indicates that the movement has an orientation towards 333° of azimuth on average, conditioned by the landscape around Chgega. These results were obtained through the analysis of a 3D model and a high-resolution orthoimage created from photographs acquired by an Uncrewed Aerial Vehicle (UAV). We may conclude that the landslide movement is determined by normal faults with directions N060°E and N140–150°E. This characterization of the Chgega landslide can serve as the basis for future studies about the origin of this slope movement. Furthermore, the data provided here may support the recognition of Chgega as a singular geological point that deserves to be declared a geosite.

Graphical Abstract

1. Introduction

The development of landslide research in countries not traditionally involved in this topic, together with continuous exploration of further territories, will surely shed new light on mass movements and emblematic landslides. The largest known landslide in the world was recently described along the coast of Kara-Bogaz-Gol lagoon (Turkmenistan) [1]. In this paper we present another outstanding landslide, identified in Northern Tunisia, on Chgega Mountain. It can be considered paradigmatic of its kind in the Mediterranean basin because of the particular landscape it creates, classified by Gaidi et al. [2] as a “rock spreading”. According to Pasuto and Soldati [3], there are two types of rock spreading phenomena: one developed in homogeneous rock masses and another that involves rigid rock formations overlying ductile terrains, as in this case. Still, the classification of this landslide is complex, as we explain in this paper. It may be categorized as a Deep-seated Gravitational Slope Deformation (DGSD) according to Pasuto and Soldati [3] or as a rock spreading that evolves into a large rock planar slide. The latter can also be called block slide according to the recent classification developed by Hungr et al. [4]. These terms describe slow-moving landslides that involve large slopes and that produce peculiar gravity-induced landforms. The areas where such landslides occur typically show persistent joints, double ridges, uphill-facing scarps, infilled troughs, trenches, gulls, grabens, pseudo-karst features, and bulges [3]. In the subsurface, this type of landslide also generates crevice caves (term used by Halliday [5]). Good examples can be found in the non-karstic cavities described in the flysch units of the Western Carpathians [6].
The Crimean Mountains (Ukraine) harbor some examples of mass movements similar to the one described in this paper—namely, large-scale slope movements with blocks of limestone of great dimensions mobilized by sliding over marl and claystone units. This phenomenon creates an unusual rugged relief formed by lateral spreading and block sliding processes [7]. Other places where large lateral spreading and block-type slope movements of carbonate rock formations overlie clayey-marly rocks can be found include Malta [8,9], Sicily [10], and Roccalbegna-Mt.Labbro (Italy) [11]. The combination of morphological features produced by this type of movement can create landmark sceneries, even regional symbols for the local population (e.g., the Trotternish landslides on the Isle of Skye, Scotland [12]) and some are nominated as geosites (e.g., crevice caves generated by mass movements in the UK [13]).
In the case described in this paper, the landforms associated with the landslide could qualify as a geosite. One singular characteristic is a spectacular graben structure that breaks the ridge of the hill impacted by the mass movement, Chgega Mountain. The local name of this structure is “Kef Chgega” (كاف الشقاق), which means “the open fracture of Chgega Mountain”. Although the site is a well-known landmark in the region of Mateur and forms a remarkable spot from different standpoints, only brief descriptions of it can be found in the scientific literature [2,14,15].
This paper completes previous contributions by describing in greater detail the characteristics of this large landslide, its main singularities, and the conditions favoring the geomorphological evolution of this impressive DGSD. Our description of Chgega Mountain has benefited from new data gathered through up-to-date remote sensing (RS) techniques: landscape analysis, Uncrewed Aerial Vehicle Digital Photogrammetry (UAV-DP), and advanced Satellite InSAR techniques. The combination of the two latter techniques has already proven its usefulness for landslide characterization elsewhere (see for example the studies of Cigna et al. [16] in Ireland, Mateos et al. [17] in Spain, or Hopffer Martins et al. [18] in Timor-Leste). The focus here, in turn, is on a region where RS methods are not yet common. Indeed, the use of InSAR techniques in North Africa is scarcely documented in the literature: Fonseca [19] investigated failure mechanisms of DGSDs in the Rif Mountains (North Morocco) and Beladam et al. [20] correlated surface displacements detected by InSAR with known landslides in Constantine (Algeria). Photogrammetry has been applied to aerial photographs to study the El Biar Landslide in Algiers, Algeria [21], but no other publication about North Africa used UAV images until the very recent paper by Bounab et al. [22]. They undertook a study similar to ours in northern Morocco, integrating UAV-DP, InSAR, and geophysics to analyze a slow-moving landslide by the coast of the Alboran Sea. This paper complements the aforementioned case studies providing two new innovative aspects for UAV-DP and InSAR analyses: (1) we took advantage of a cloud-computing platform to perform the InSAR analyses. This platform provided us with displacement maps with no need for software or SAR images to develop the analysis. (2) We exploit the capacity of UAV-DP to generate a 3D model, an orthoimage, and a digital elevation model (DEM) to perform structural analysis in a virtual environment, enriching the information gathered in the field. The use of UAV-DP and its products considerably reduced both the fieldwork time and the resources needed to carry out our survey.
Thus, by combining the above technologies, it was possible to maximize the yield of the available study resources. They allowed us to gather a considerable volume of data within a limited time frame, to characterize the Chgega landslide without sacrificing the quality of the results. This research might therefore serve as a benchmark for similar investigations that need to optimize time and funding when applying new technologies. At the same time, the results of UAV-DP and InSAR enabled us to carry out not only a general portrayal of the mass movement but also a comprehensive characterization of its kinematics. This characterization should prove useful for future research into the origins of the Chgega landslide and to explain why it takes place in a region having low relief.

2. Geological and Geomorphological Setting

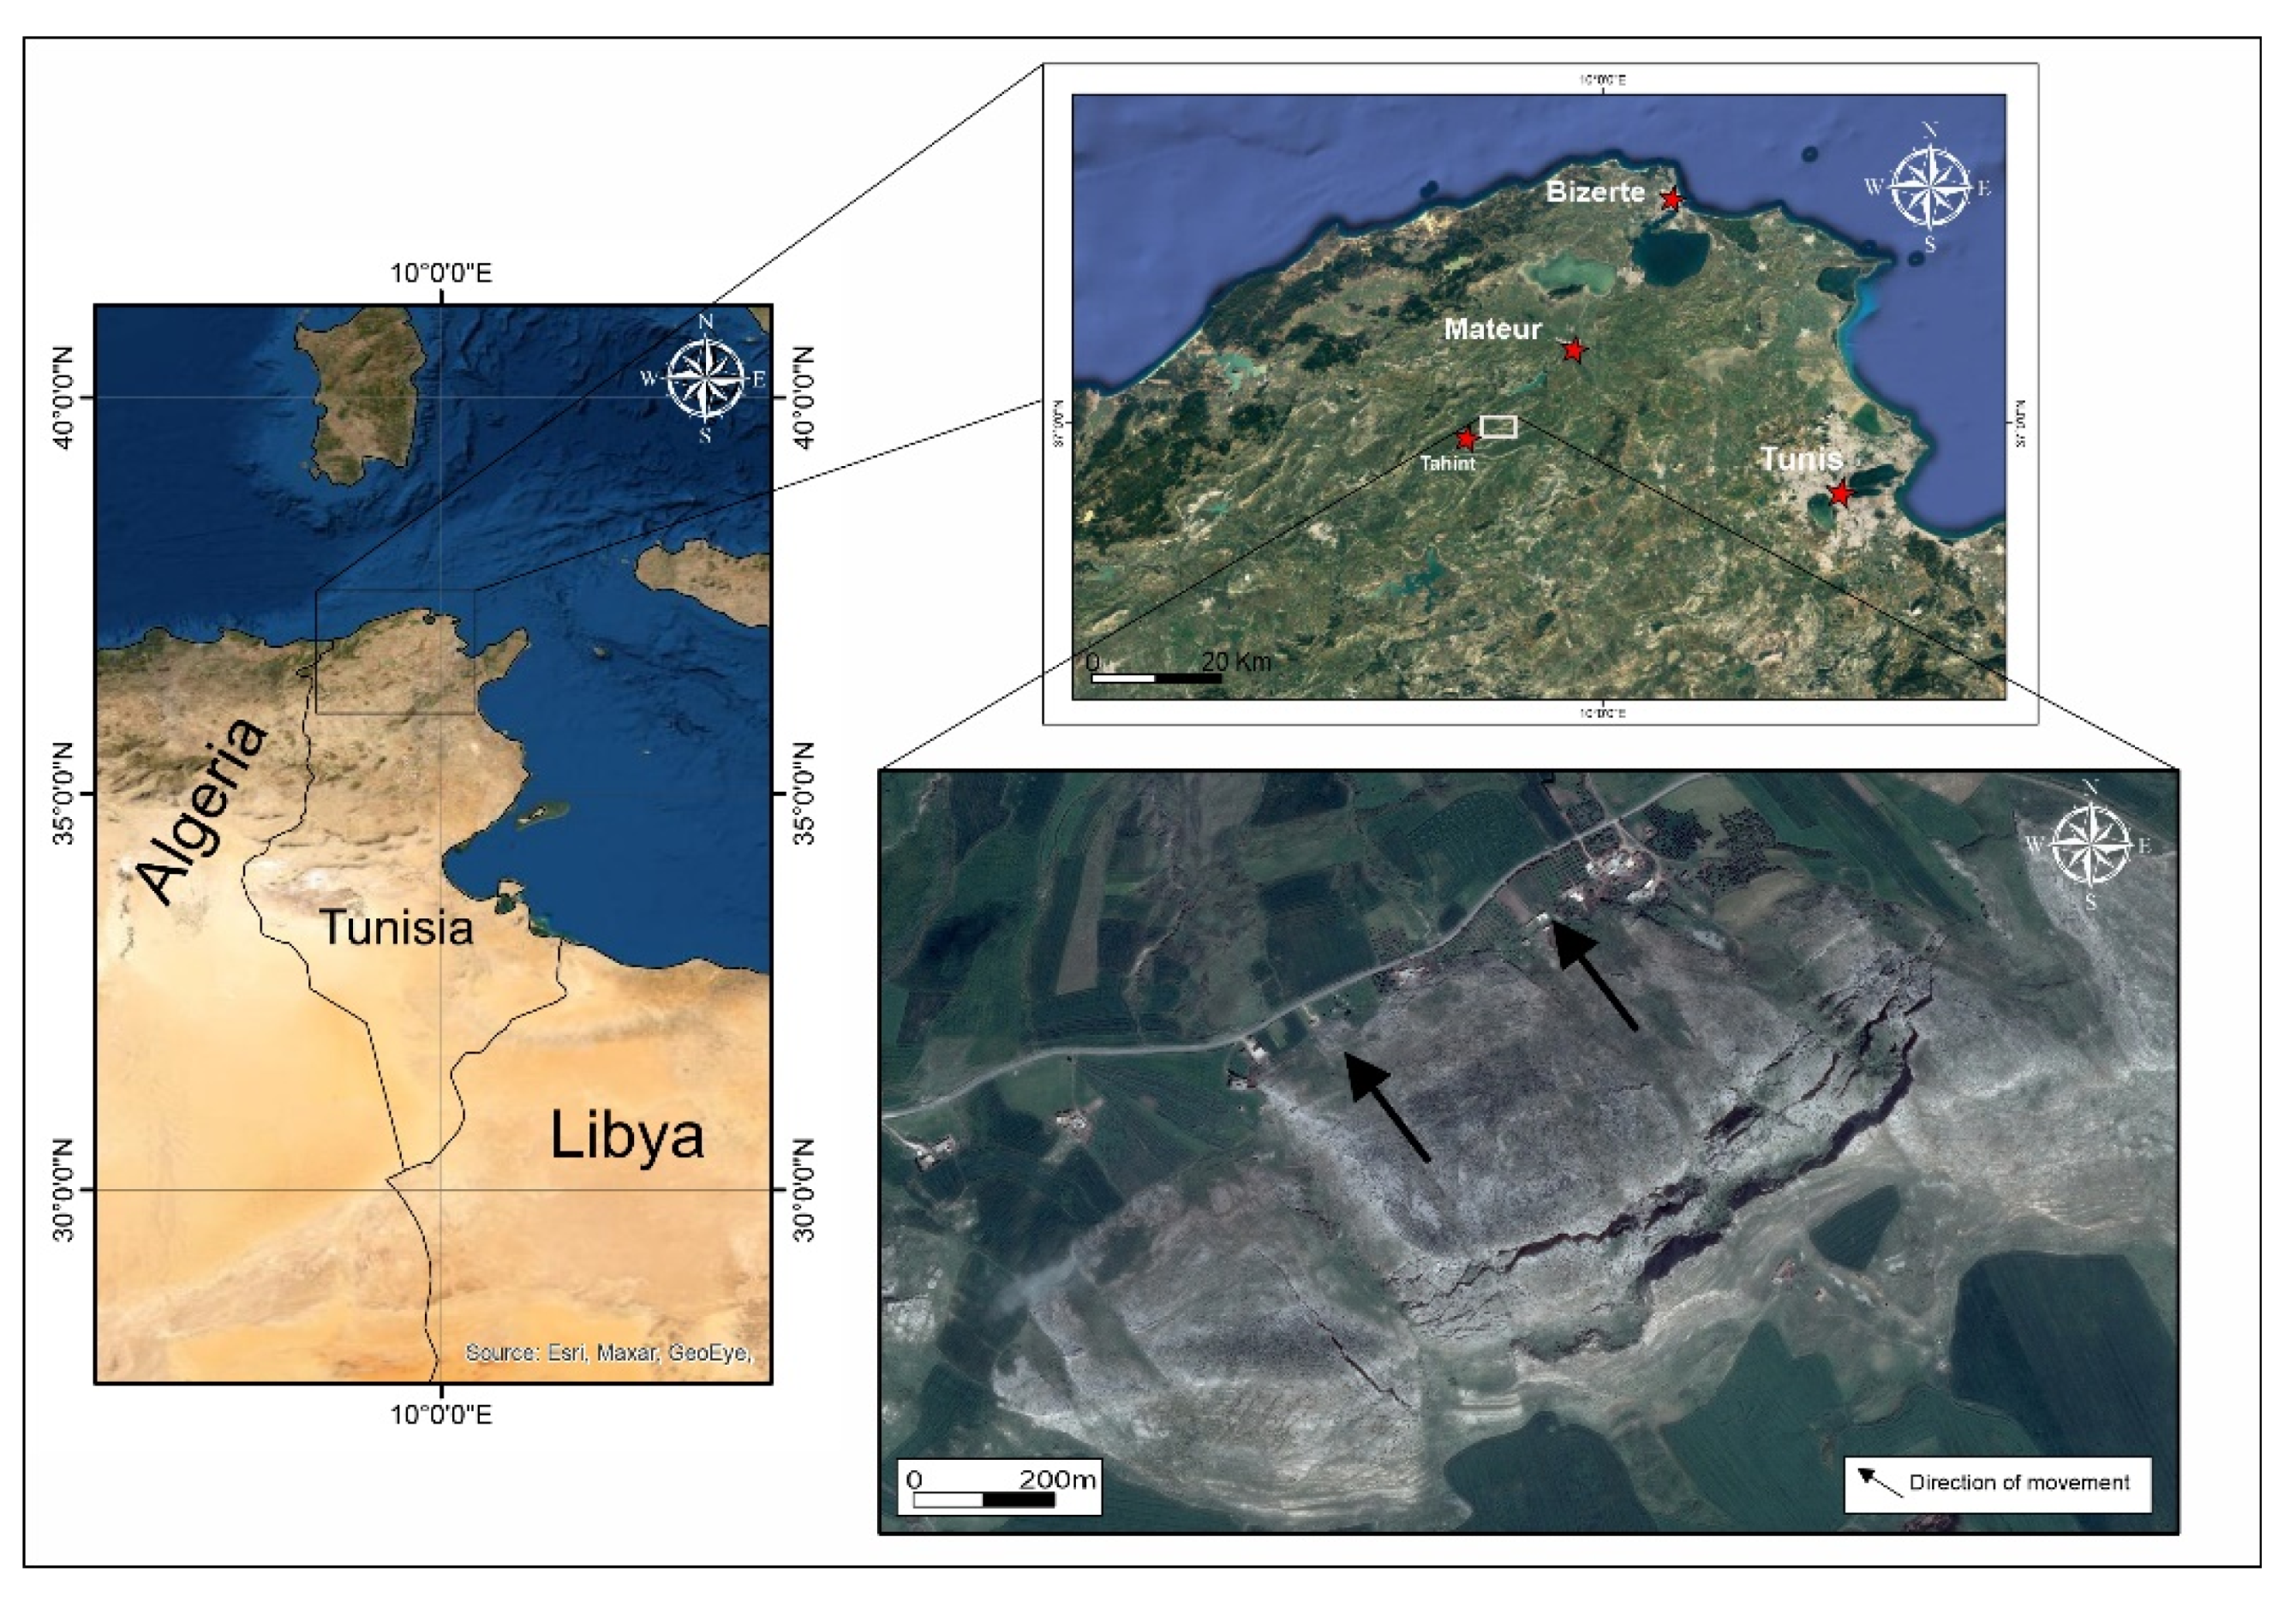
Chgega is a mountain culminating at 553 m.a.s.l. located in the Mateur region of Northern Tunisia, near Tahint village (Figure 1). From the geological viewpoint, Chgega forms part of the reliefs created by the Tell belt, formed by the Mesozoic and Cenozoic sedimentary cover of the Maghrebian Tethys realm, overthrusted and folded [23,24]. This belt, together with the Atlas belt further south, was produced in a context of NW-SE to N-S plate convergence between Africa and Eurasia since the late Cretaceous.
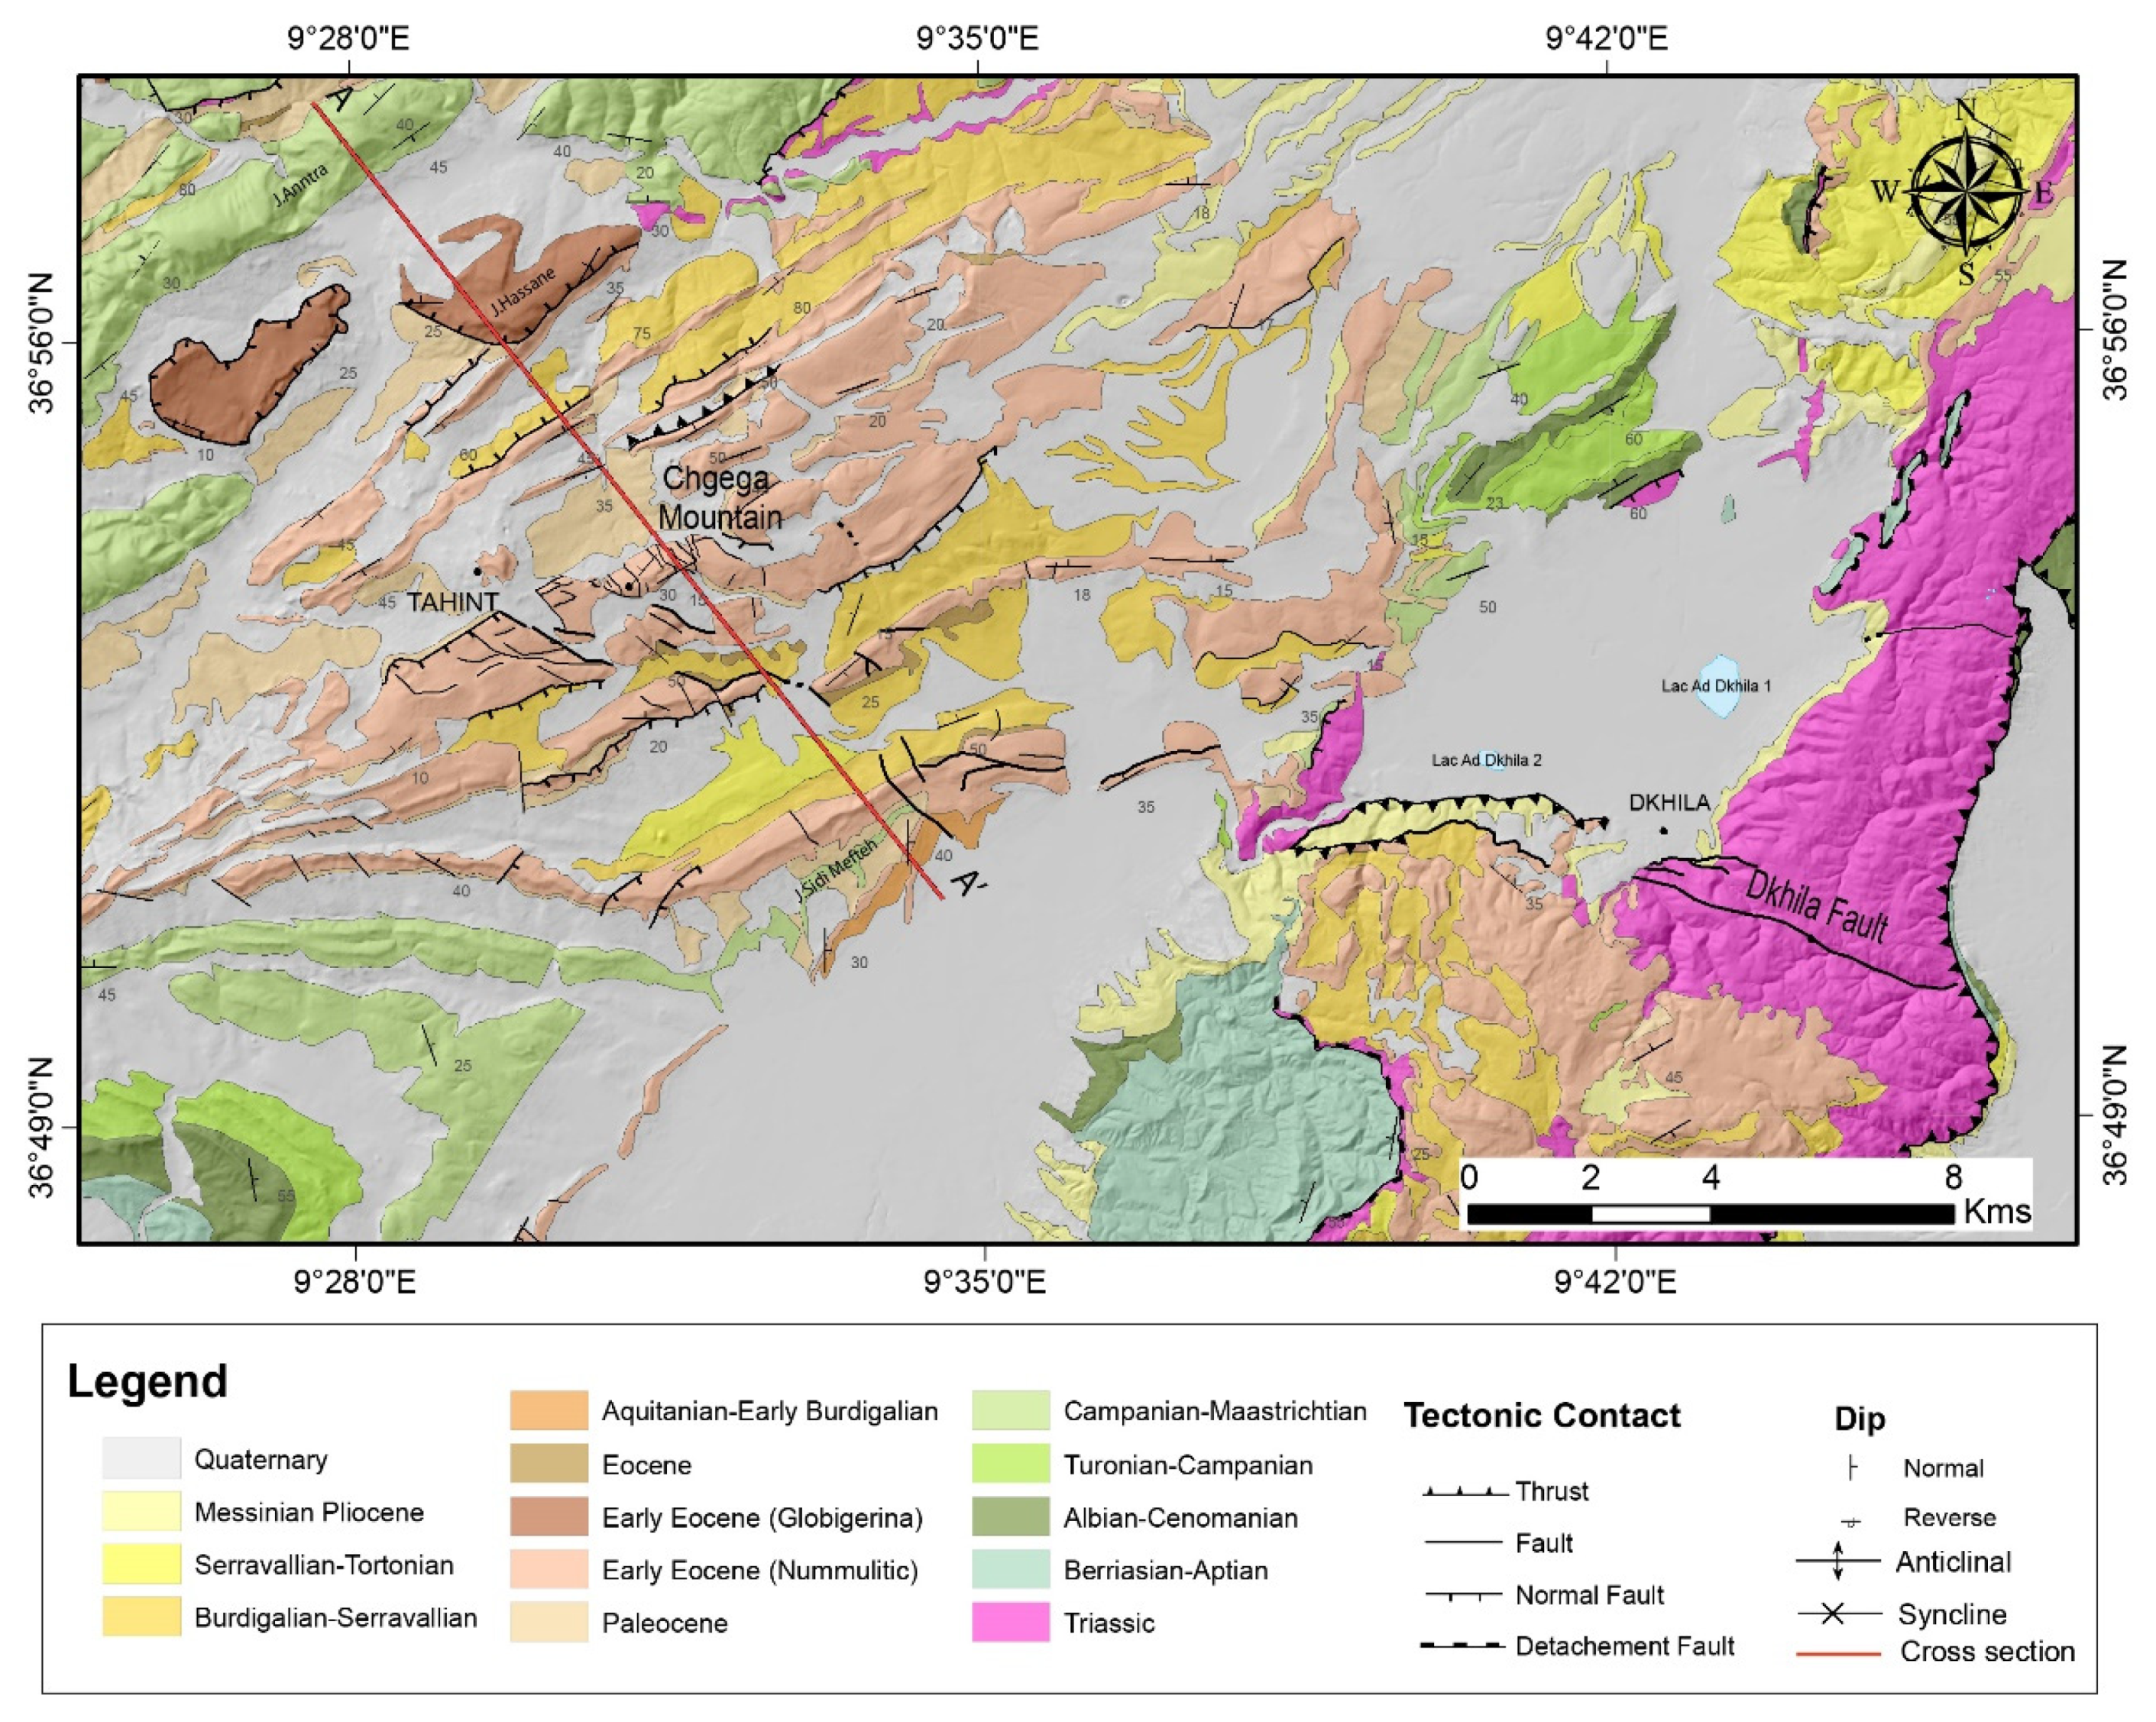
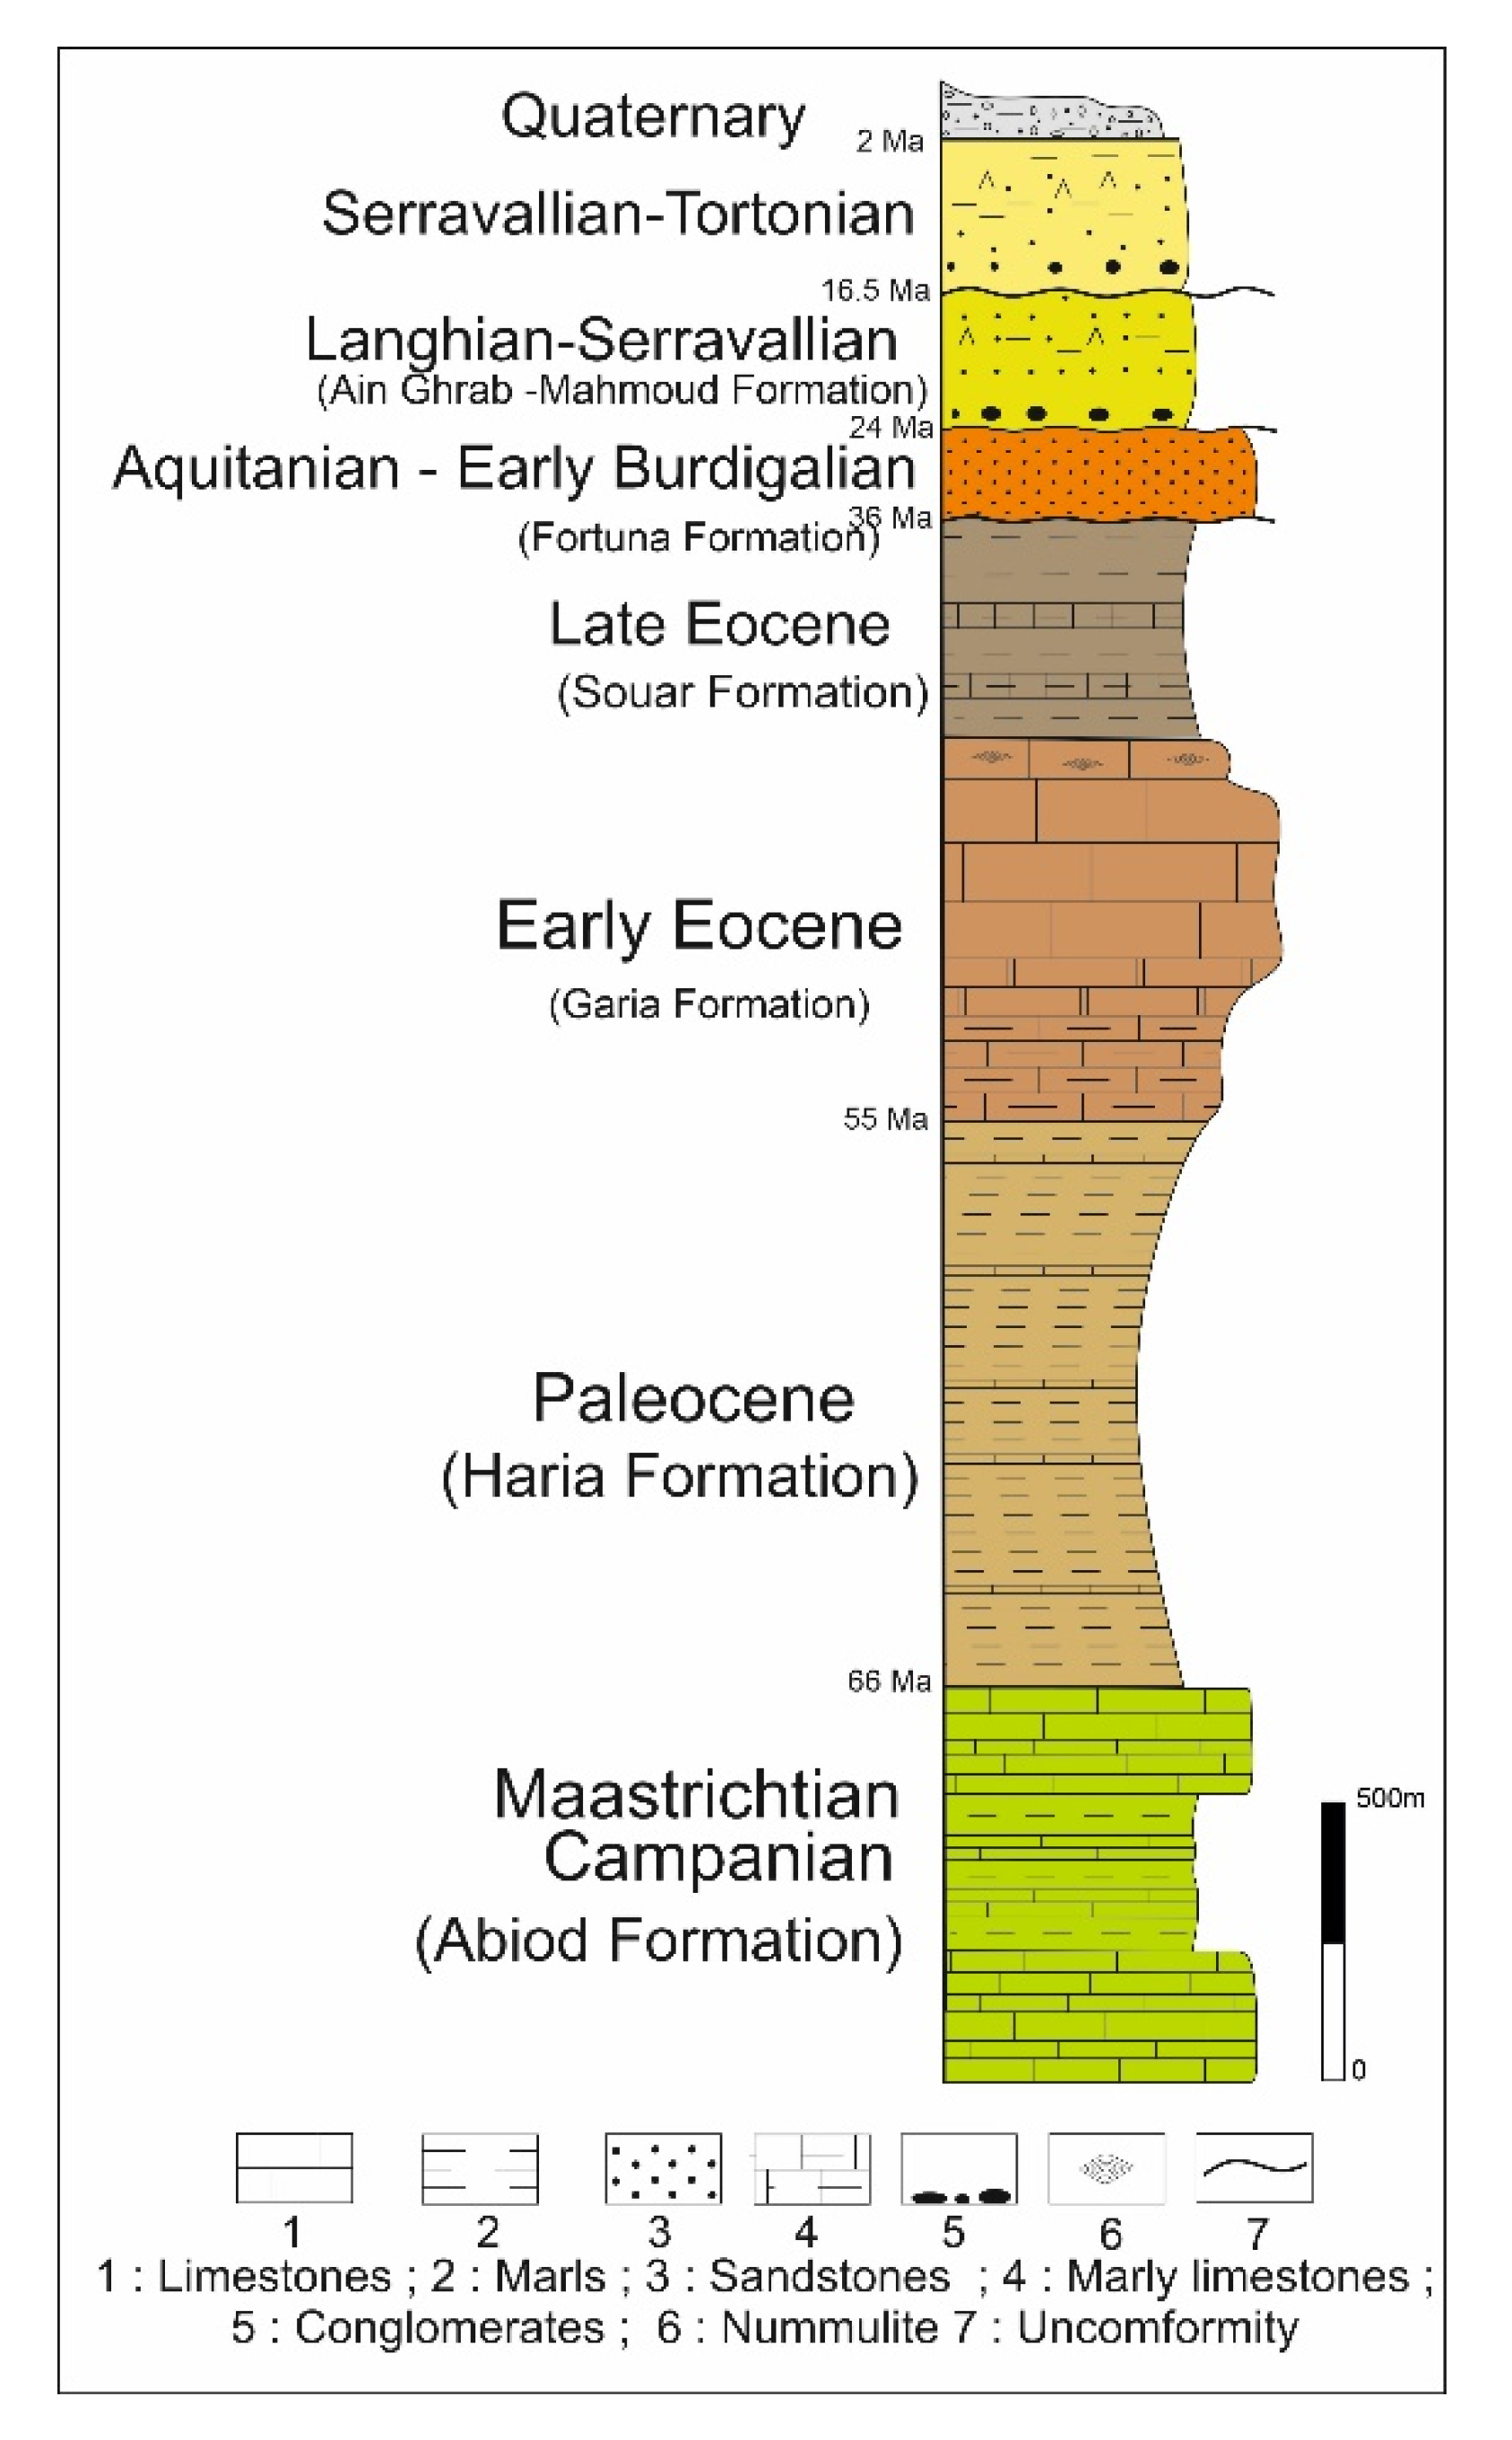
The topography of Northern Tunisia is therefore strongly influenced by this general convergent setting. However, it does not show the landscape characteristics of a mature orogenic belt with a well-developed transverse drainage system [15,25,26]. A smooth and low relief largely characterizes the entire region. Over this structural landscape, the greatest reliefs coincide with anticlinal ridges or the hanging wall of shortening structures; in turn, the topographic depressions and axial valleys occur in relation to synforms and the footwall of reverse faults [15,27,28]. Large NE-SW oriented axial valleys such as the Mejerda, Tine, Joumine, and Ghezala river valleys run parallel to the main shortening structures, e.g., the Alia-Thibar fault zone [28]. The landscape is furthermore influenced by rheological contrasts between competent and incompetent lithologies—respectively, limestones and pelites. For instance, the folded region where Chgega Mountain is situated shows a differential relief marked by the erodibility contrast between the Early Eocene nummulitic limestones of the Garia Formation and the Palaeogene or Late Eocene clays and marls of the Haria and Souar Formations, respectively [29,30] (Figure 2 and Figure 3). Miocene half-grabens subparallel to the fold hinges in the region further stand out against the Eocene limestones in the uplifted footwall of the normal faults [31].
Since the Late Pliocene topographic incision and rejuvenation in Northern Tunisia, the landscape evolution is mostly driven by NW-SE directed tectonic shortening, accommodated along reverse and strike-slip faults and associated folds, which favor the development of incipient transverse drainage through recent fluvial captures [15,28].
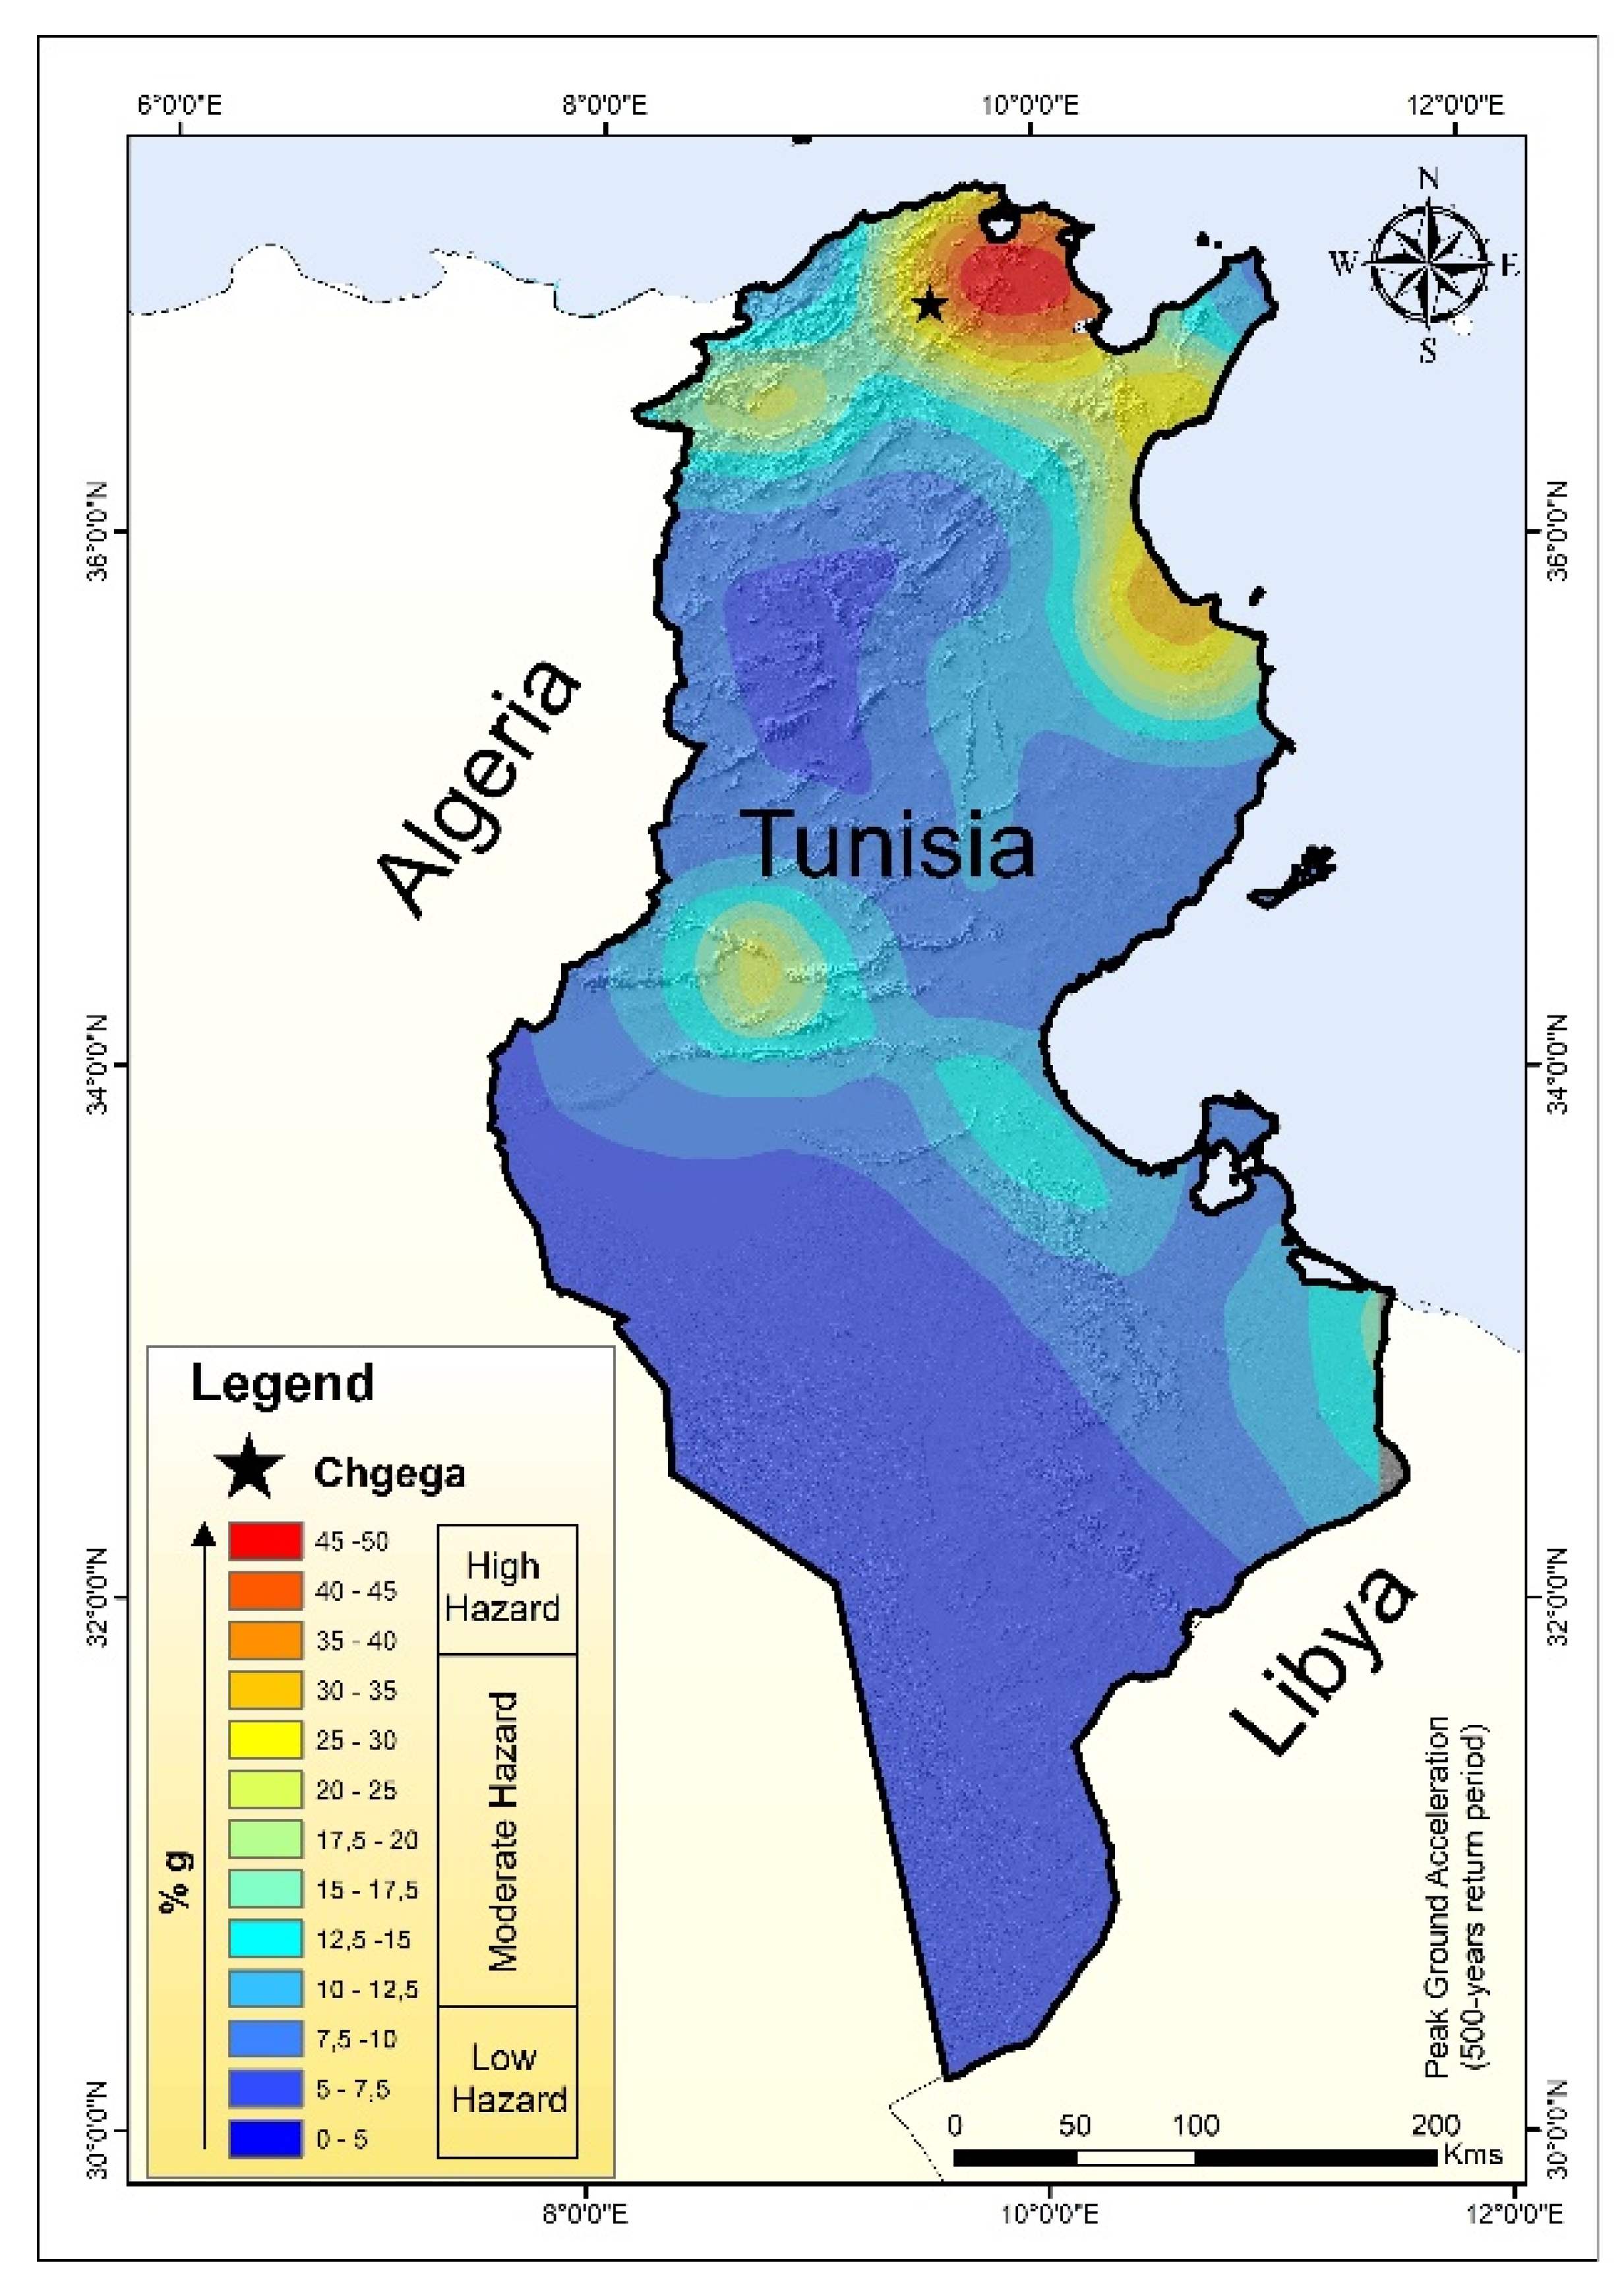
This active tectonic shortening is the cause of damaging earthquakes—the 410 AD Utique and the 856 AD Tunis seismic events—related to the activity of the Alia-Thibar fault system [36,37]. The maximum observed seismic intensity maps for Tunisia indicate higher intensity registered in the proximity of the western end of the fault system, near the village of Thibar [38]. The seismic hazard map of Tunisia indicates the highest hazard in the region near Tunis, including our studied area [39] (Figure 4). The Chgega landslide occurs within the horsetail splay zone of one of the Alia-Thibar fault segments, corresponding to the Dhkila dextral fault [15] (Figure 2). In addition to the Dhkila fault, the region of Chgega Mountain is well known for the presence of an imbricate fold and thrust stack that involves mostly the Tertiary Atlassic sedimentary cover [31,40,41,42] that is overprinted by late Miocene half-grabens [32,43]. One of the normal faults forming these half-grabens determines the Chgega landslide, as we shall see.
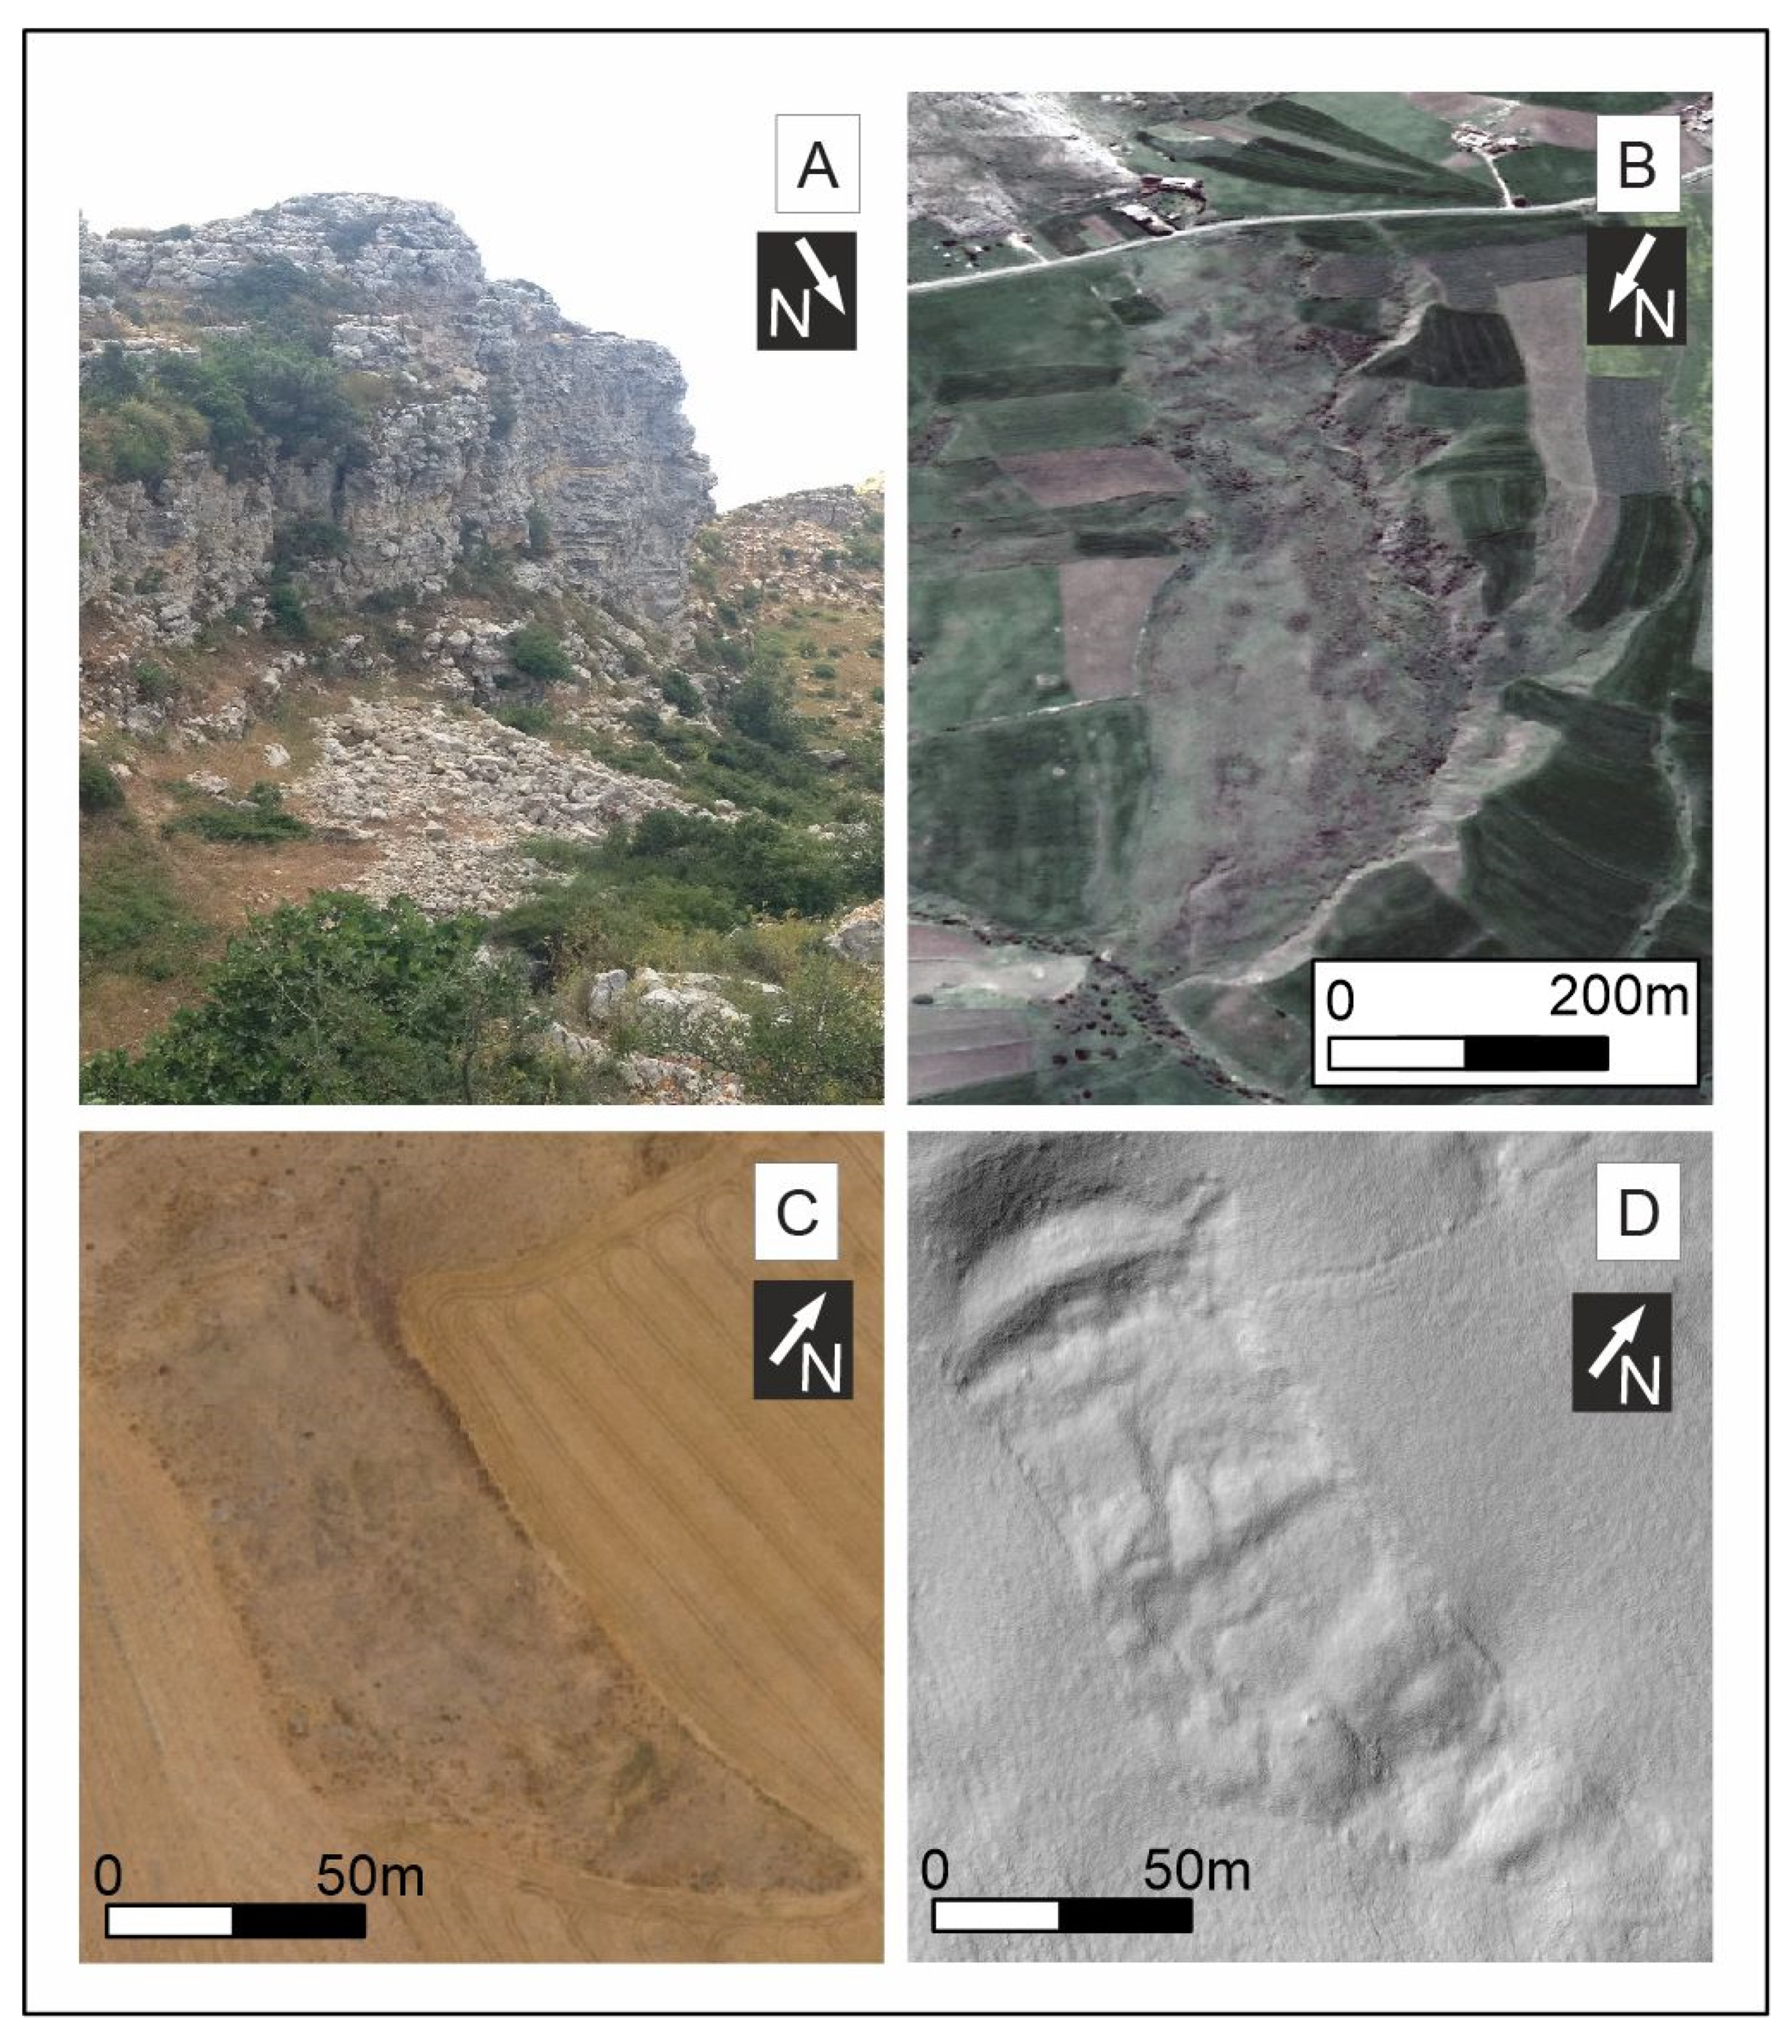
The landslides in the region are commonly associated with clays and marls of the Haria Formation. The most common type would be slow-moving flows forming long tongues of clay materials moving downhill through low-angle slopes (Figure 5B–D). Less common are rockfalls, present only in a few cliffs amid the limestones of the Garia Formation (Figure 5A). Landslides similar to that of Chgega can be found in the hill right in Tahint village, where limestones of the Garia Formation slide over the clays of the Haria Formation and in the relief SW of Tahint, where rock spreading of smaller dimensions was recognized by us.
The area of Chgega Mountain features a warm climate, which is dry in summer and mild and wet in winter. July and August are the months of maximum temperature, evapotranspiration, and hours of sunshine, while humidity and precipitation are minimal. Average annual temperatures in the area targeted by the study are approximately 17 to 20 °C, with a monthly average of 27 to 29 °C; the average maxima is 33 to 34 °C in July–August. Total annual rainfall is around 521 mm and the average annual potential evaporation is between 1300 and 1800 mm. The average annual relative humidity is 60 to 68%, with maxima of 75 to 85% in the rainy season, from December to January, and lows of 49 to 60% in July–August. During historical times (Late to 4500 B.P), the Maghreb, hence Northern Tunisia, had a more humid climate than the present one, as attested by paleo-vegetation, sedimentological, and geomorphological studies [44,45,46]. Within this interval, four dry episodes are identified (4700, 3000, 1600, and 400 B.P) (see reviews in [45]).

3. Methodology

In characterizing the Chgega landslide, we combined traditional methods and RS techniques. Classical methods included geological and geomorphological field surveys describing outcrops and landforms, with measurements of geological structures. Modern techniques encompassed morphometrical analysis of DEMs and interpretation of aerial photographs, orthoimages and hillshade models in a GIS environment, along with analysis of terrain 3D models to extract virtual measurements and better observe the morphological features. Additionally, we performed preliminary InSAR analysis to roughly estimate the regime and velocity of the landslide movement. The more innovative and specific techniques applied in Chgega landslide are detailed below.

3.1. Terrain 3D Model Production

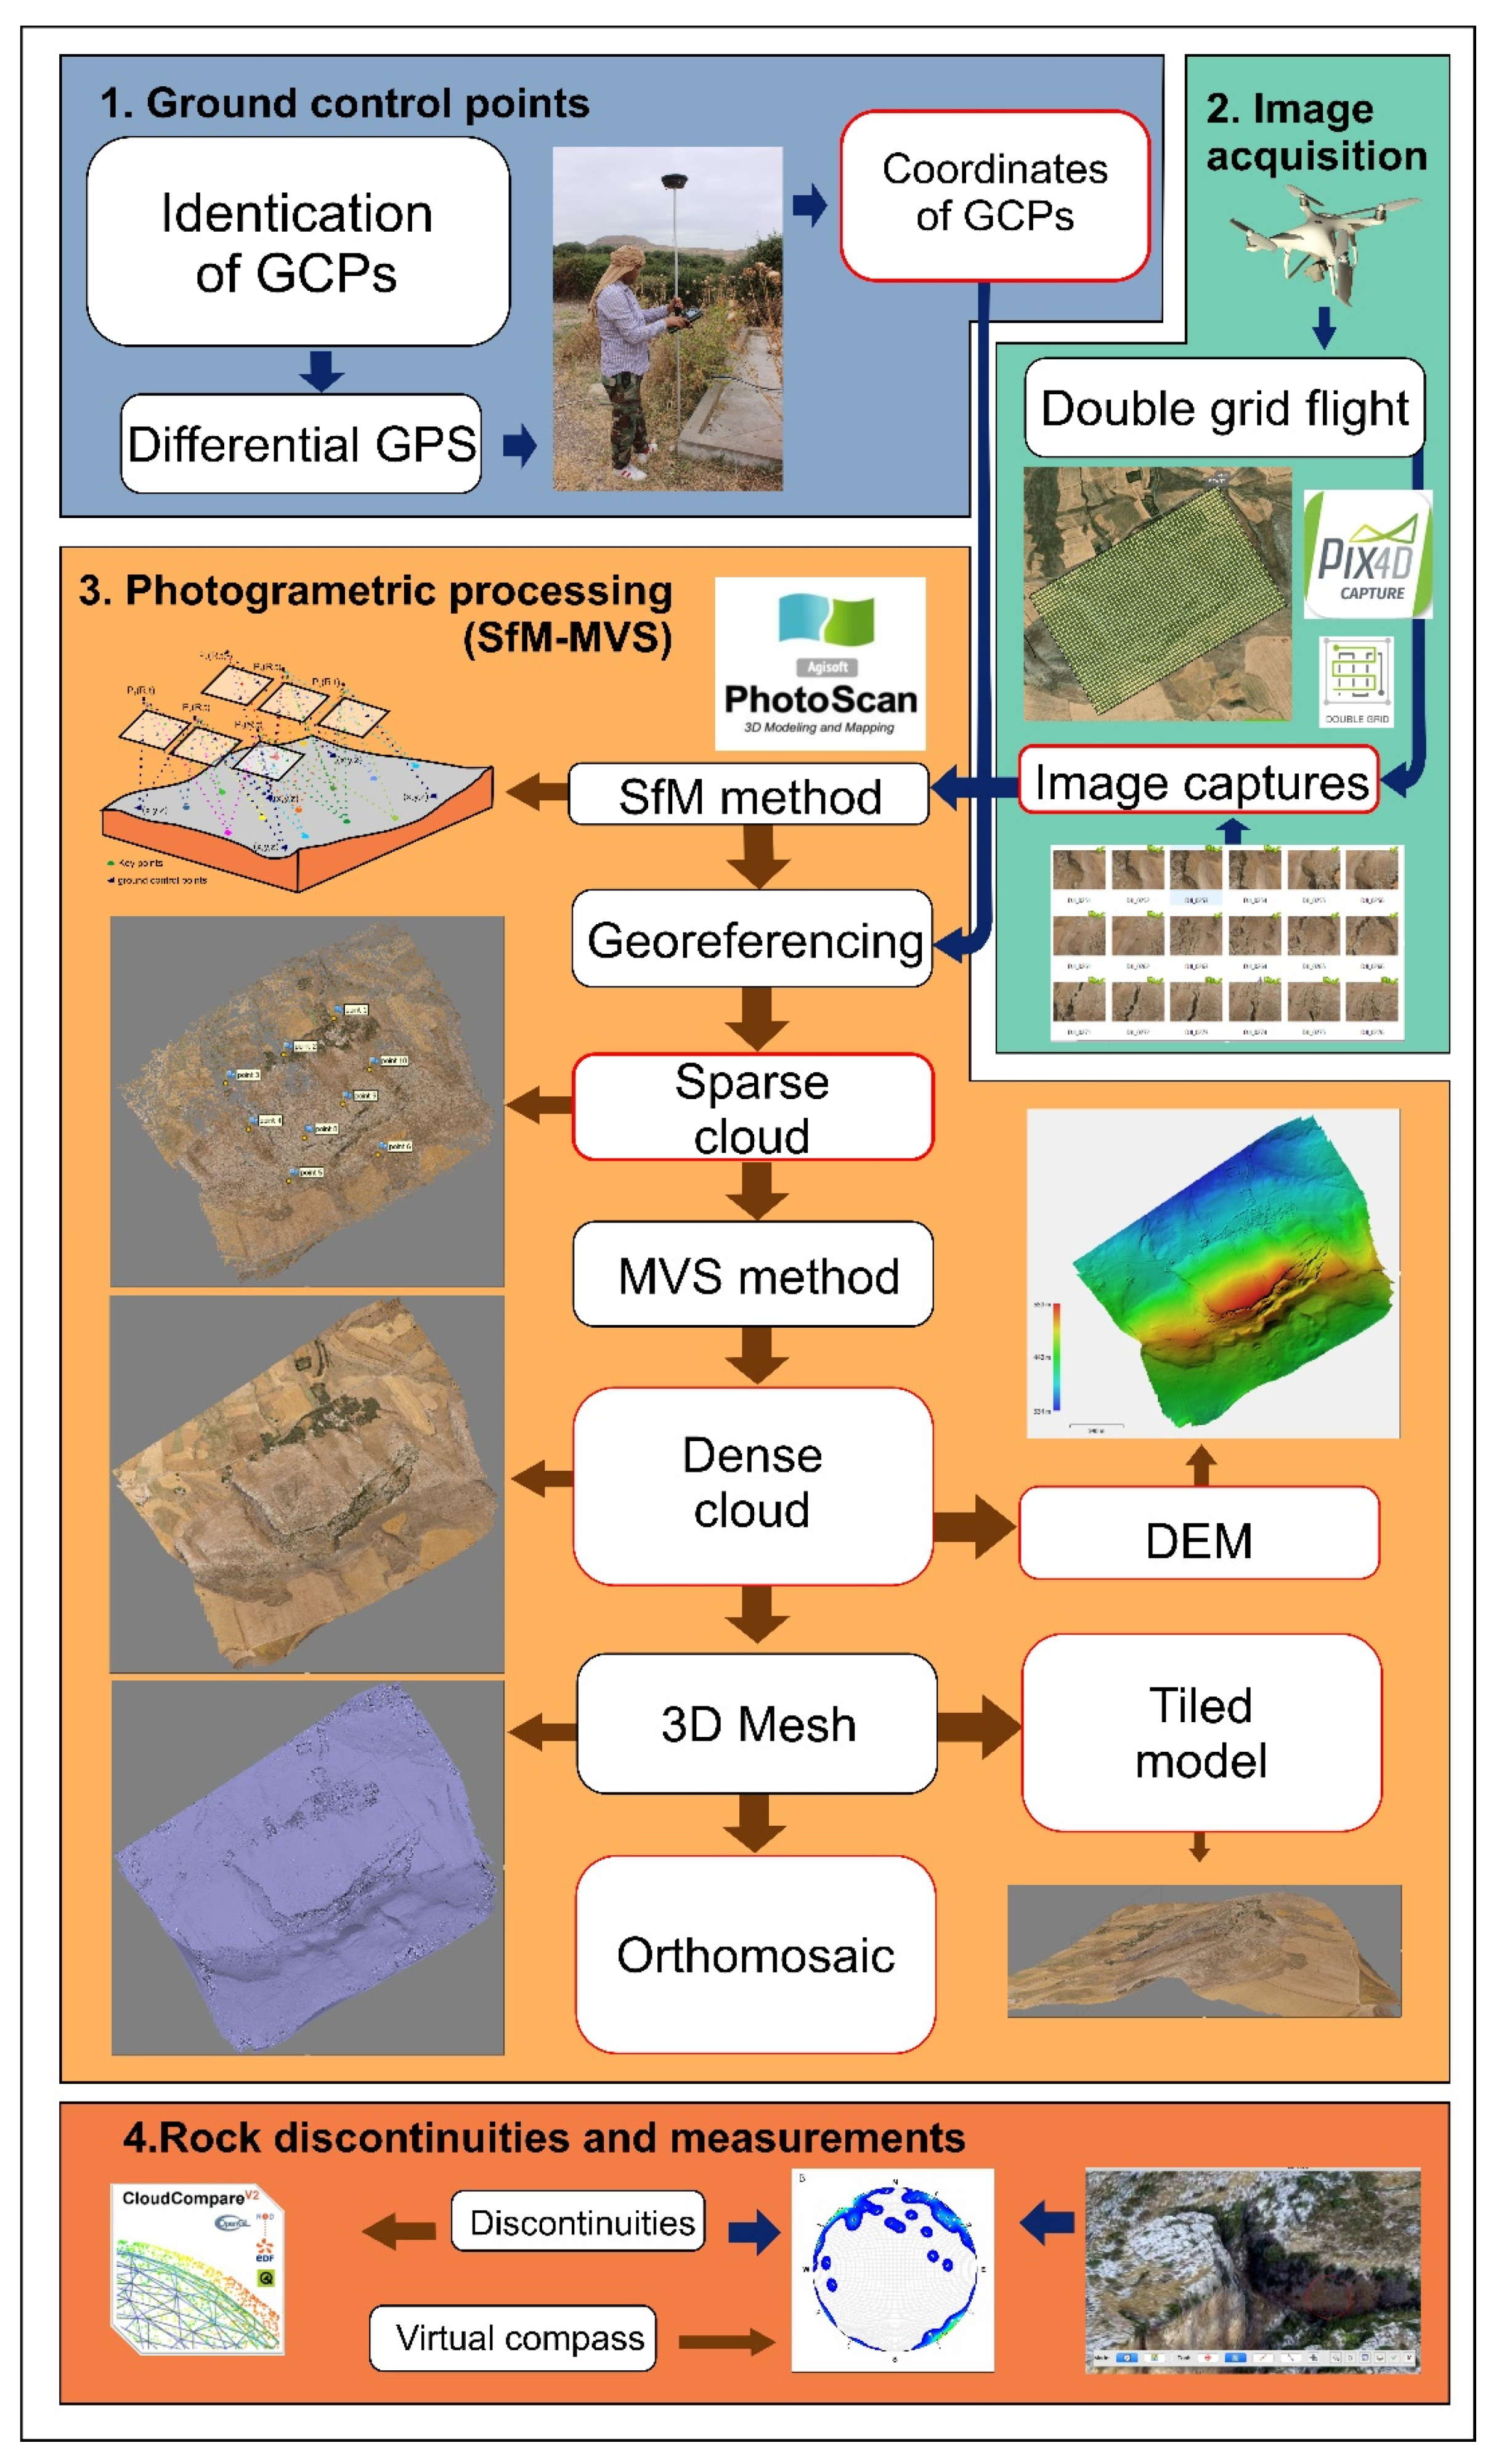
Producing the 3D model of Chgega Mountain was a challenge because of the following main constraints: (1) the team involved in this research was unable to use its own UAV because introducing this equipment in Tunisia was prohibited; (2) at the time there were no professionals available in Tunisia specialized in performing this kind of task; and (3) there was a major constraint in the use of UAV due to the country’s security situation. To overcome the administrative constraints, we leased a UAV service to a media professional and advised him how to project a mission of aerial photo acquisition aimed at creating 3D models. The flight was performed in the early morning to avoid the strong wind that rises in the late morning in the study area. The UAV used in this work was a DJI Phantom 4 equipped with a three-axis stabilized camera having a resolution of 12.4 megapixels and a 1-inch 20 MP CMOS sensor. We designed the acquisition missions with the Pix4D Capture software. A normal double grid mission of 1200 × 750 m with multiple battery changes was designed because the range of the UAV was insufficient to cover the entire study area due to battery life issues. The elevation of flight was 100 m above the summit of Chgega Mountain. We programmed a 70% front and side overlap; the angle of the camera was 70°. Subsequently, we carried out a topographic survey to measure 9 ground control points (GCPs) on places easy to recognize in the UAV photo captures, such as artificial structures and targets (Figure 6).
The survey was performed using a GNSS LEICA GS07. The UAV surveys acquired 967 superposed images that we processed by means of Agisoft PhotoScan Professional software—Version 1.4.3—to construct the 3D model and produce the DEM and orthoimage of the Chgega Mountain at high resolution. The Structure from Motion (SfM, [47]) algorithms of Multiple-View Stereo (MVS, [48]) images served to process UAV-based images using GCPs.
We applied the conventional workflow with the following steps, in this order: (1) preliminary image selection and alignment; (2) import GCPs as markers, georeferencing and automatically allocated markers due to image matching by the scale invariant feature transform (SIFT) operator [49]; (3) manual marker matched in each image; (4) alignment optimizations, refinement that obtained a sparse cloud from tie points (SfM); (5) construction of a high-quality 3D dense-cloud with 107 million points (Point density: 47 points/m2; Point spacing: 14.6 cm) and Mesh generation and refinement using a par depth map (Arbitrary 3D) and Multiview Stereo (i.e., Fast method; [50]); (6) building a DEM with a 16.4 cm/pix resolution and tiled model based on the dense cloud; and (7) deriving an orthomosaic with 8.19 cm/pix resolution.
It is worth noting that there is no high-resolution topographic information in the study area to compare with and validate our results using photogrammetry. The most precise topography available for this region is a 1:25,000-scale topographical map. To evaluate the accuracy of our results, we first compared the produced orthoimage with the high-resolution imagery available through Google EarthTM. Secondly, we checked the elevation with a DEM generated using contours and elevation points extracted from the 1:25,000-scale topographical map. Third, we evaluated the 3D model comparing our measurements in the field with those taken in the virtual environment. We verified that our 3D model, orthoimage, and DEM fit the mentioned data.

3.2. DInSAR Analysis

We carried out DInSAR analysis by taking advantage of a powerful SAR image-processing tool implemented in a web platform of the European Space Agency (ESA). This tool is the Parallel Small Baseline Subset (P-SBAS) processing service of the Geohazards Exploitation Platform (GEP) [51,52,53]. We selected from this platform SAR images with a descending orbit, as the corresponding geometry proves most adequate to obtain sound results for the Chgega landslide. The landslide is moving towards the NW and the Line of Sight (LOS) of the satellite has roughly the same orientation.
We processed 24 Sentinel-1A images acquired between 15 April 2015 and 19 January 2020 (4.7 years) by means of a multi-temporal method. The mean temporal sampling was 70 days, the coherence threshold was set at 0.95, and the reference point was situated 3 km away from Chgega Mountain at the following coordinates: Latitude 36.92511, Longitude 9.5369546 (WGS84 projection).
Before the aforementioned multi-temporal analysis, we ran several preliminary processing trials with the following objectives: to check if the slope was in motion in the analyzed period of time and if so, to know the approximate velocity of the movement, and finally, to fine-tune the processing. When we found that Chgega landslide appeared to be in motion but at a very-low velocity—because we were able to recognize the pattern of the movement, but below the common error range of this kind of analysis with Sentinel-1 images (i.e., ±5 mm/yr)—we decided to increase the precision of our measurements through two strategies: (1) selecting a reference point close to the landslide that showed great coherence and stability; and (2) defining a high coherence threshold. Thus, we reduced the error range to ±2 mm/yr, increasing the sensitivity of our analysis.
The rapid processing performance of GEP was well suited to make these adjustments. We checked different numbers and combinations of images in order to improve the quality of the results. SAR image processing was performed in the cloud, without downloading SAR images and no need to own specific software to perform the image analysis. This greatly facilitated our work.
The results provided by GEP conformed a CSV table with information about the location of the measured points, the mean velocity in the analyzed period, and a time series of displacements. Velocity and displacements are referred to the satellite LOS direction. The velocity of this movement may be underestimated owing to the different geometry between the acquisition of the satellite and the general direction and orientation of the movement. Therefore, we estimated an approximation of the real velocity through the Vslope method that transforms LOS velocity to the velocity along the slope [54]. The difference between those two types of velocities was found to be below a tenth of millimeter per year in the case of Chgega landslide. Therefore, we used the LOS velocity as a good approximation of the real velocity. We also obtained time series to identify accelerations in the movement related to rainfall or seismic shakes, so as to constrain what kind of phenomena might trigger or reactivate the mass movement. However, the precision of the measurements with regard to the velocity of the movement was insufficient to detect temporal correlations with those phenomena.
The reliability of the InSAR results was checked by trying different values in the processing parameters and different SAR images, discovering that the displacements appear in all cases. Furthermore, InSAR techniques and the GEP platform have already demonstrated reliability in their results through a test period of 6 years (https://geohazards-tep.eu, accessed on 31 April 2021). We are moreover convinced of the active movement of the landslide because of field evidence pointing to displacements, e.g., open gravity-induced joints with a fresh appearance. Indeed, we were surprised by the slow motion of the landslide, having expected a greater velocity according to the features observed in the field.

3.3. Geological Study Taking Advantage of Cutting-Edge Techniques

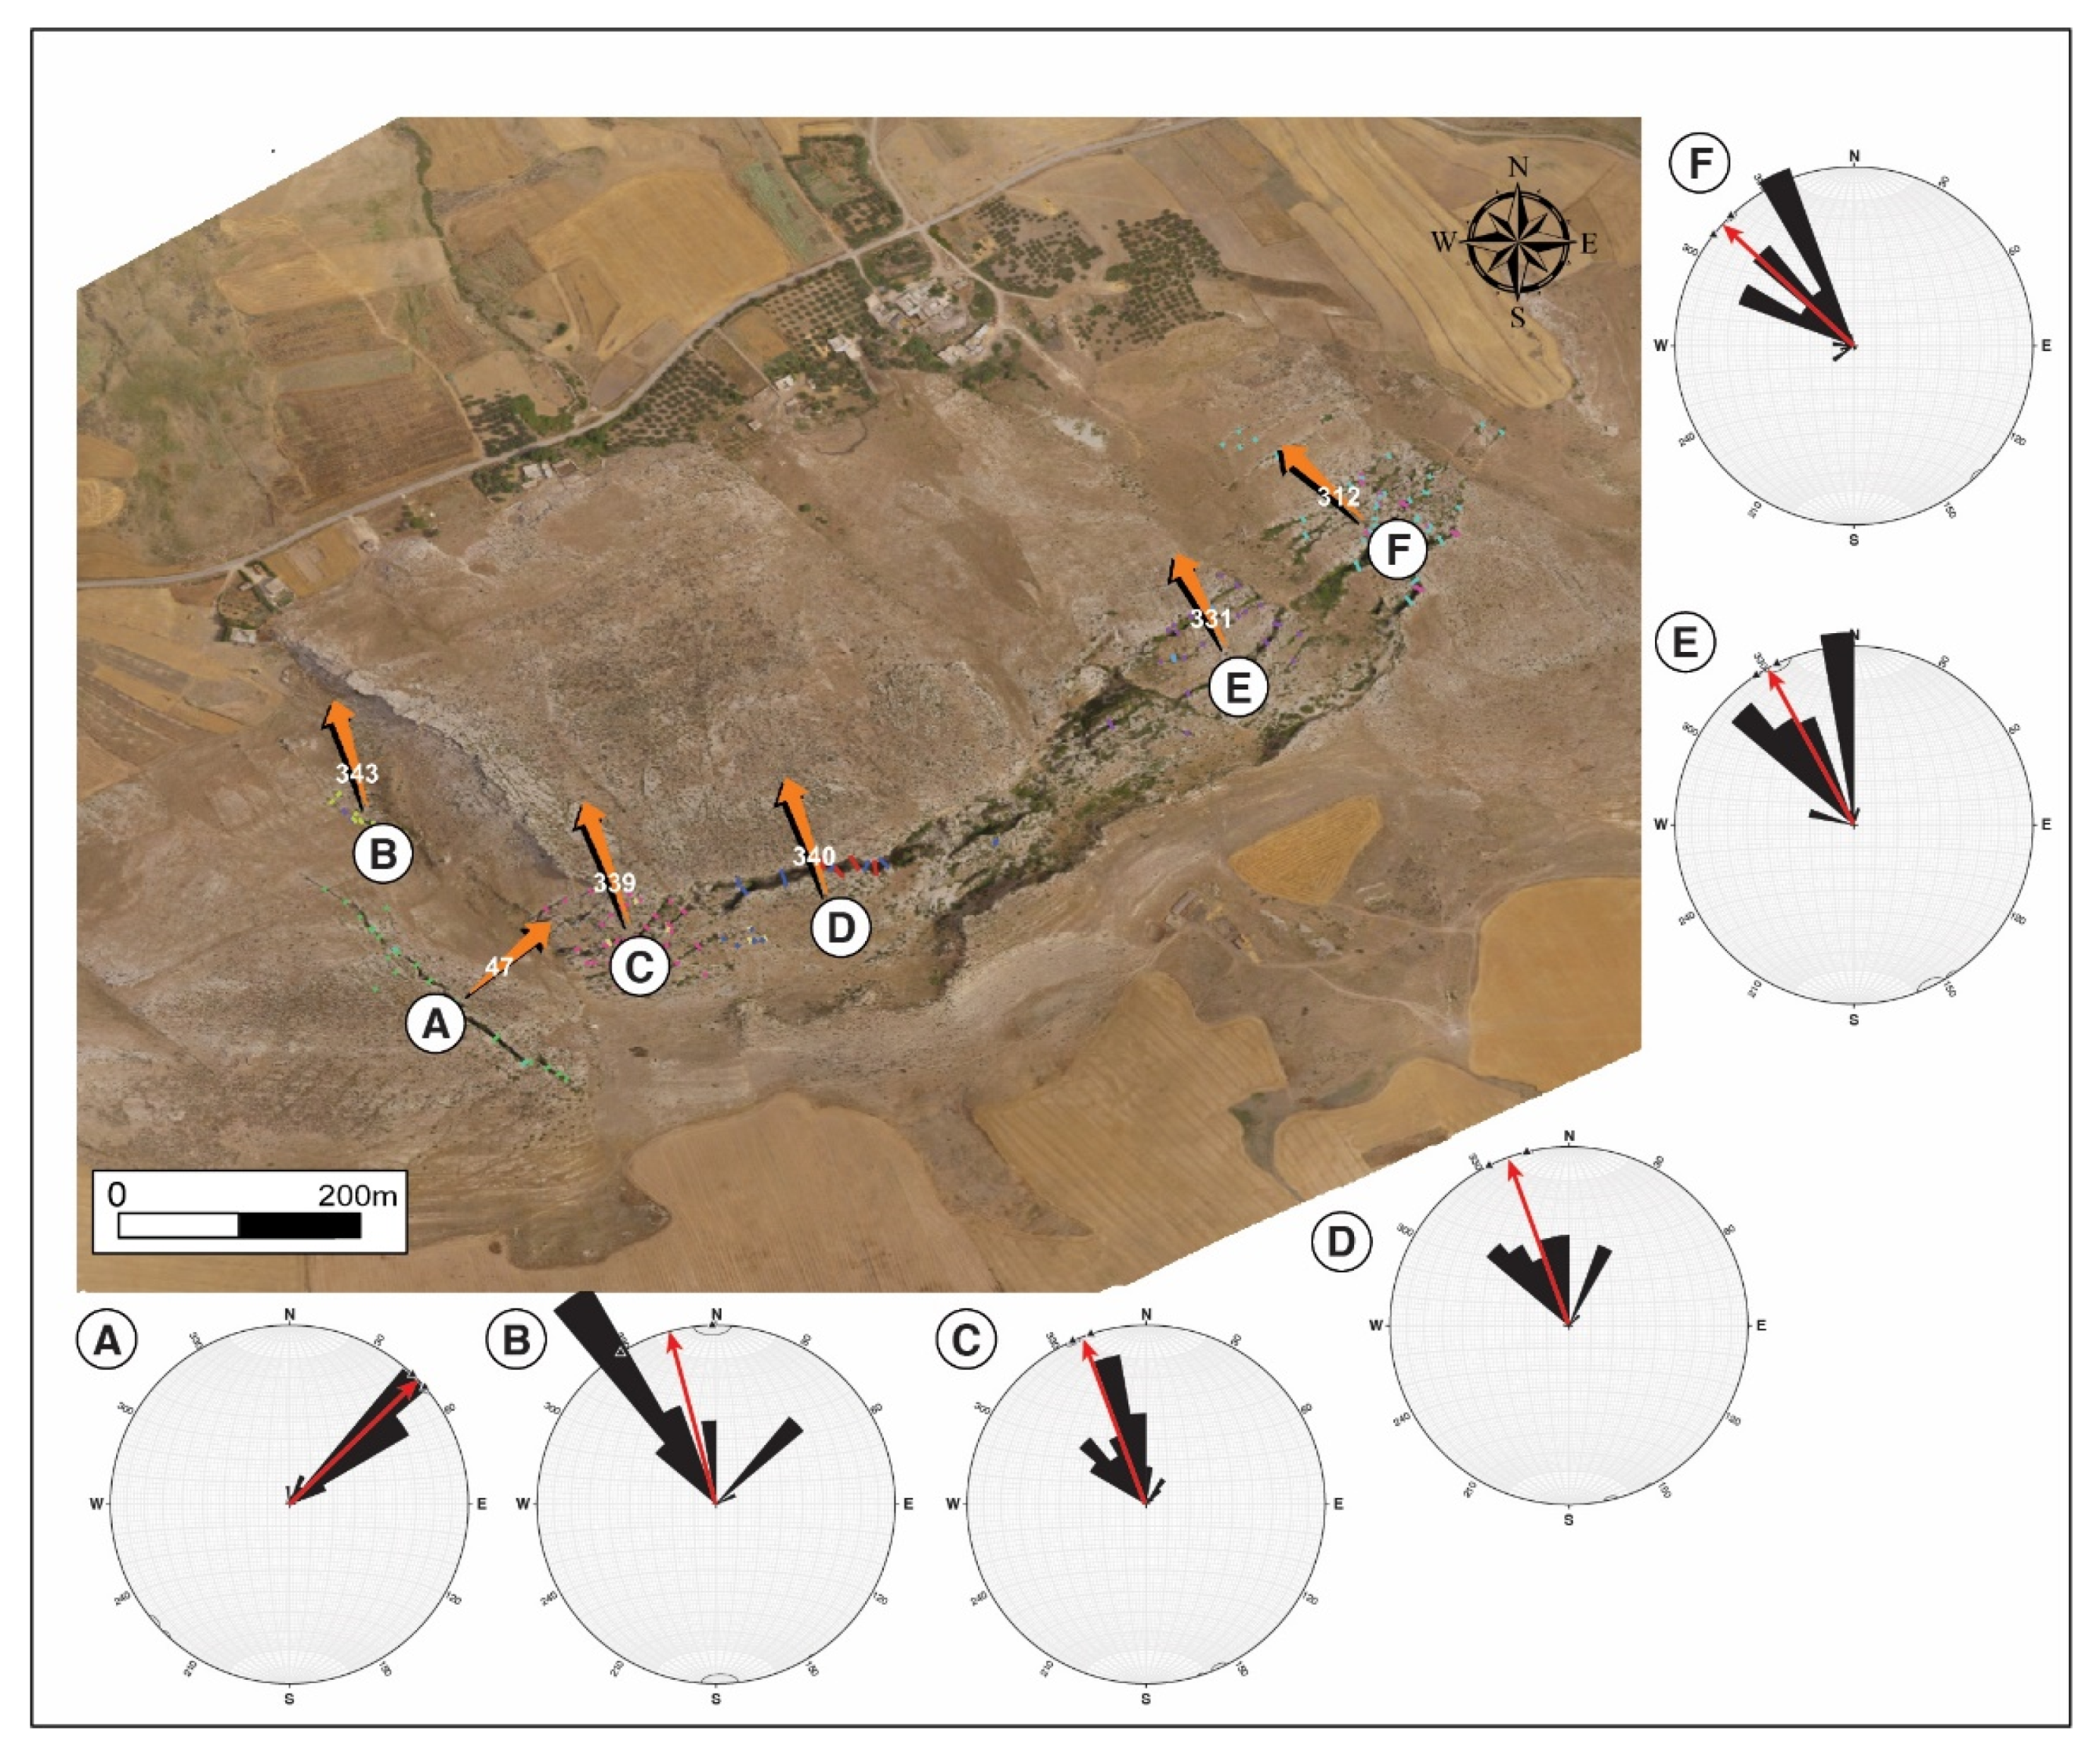
As mentioned above, we carried out a detailed geological and geomorphological field survey taking structural measurements and describing outcrops and landforms. In addition to that classical work, we took full advantage of the UAV-DP products (3D model, DEMs, orthoimages, aerial photographs) to derive and extract useful data for a comprehensive description of the Chgega landslide. Accordingly, we complete our in-situ structural data with measurements taken in the 3D model using the virtual compass implemented in the Cloud Compare open-source software (https://www.danielgm.net/cc/, accessed on 10 May 2021). This tool was used (manually) to measure the orientation of planar surfaces mostly related to rock discontinuities [55]. The high resolution DEM and the orthoimage produced using the UAV-DP techniques served to take planimetric measurements and accurately map structures, gravity induced joints, and landforms using QGIS v. 3.10. In this sense, we developed a detailed study of the landslide displacement orientation in order to understand, in depth, the nature of this slope movement. Vectors were generated taking into account the joints opened to extract the orientation and magnitude of the movement in each sector of the landslide.
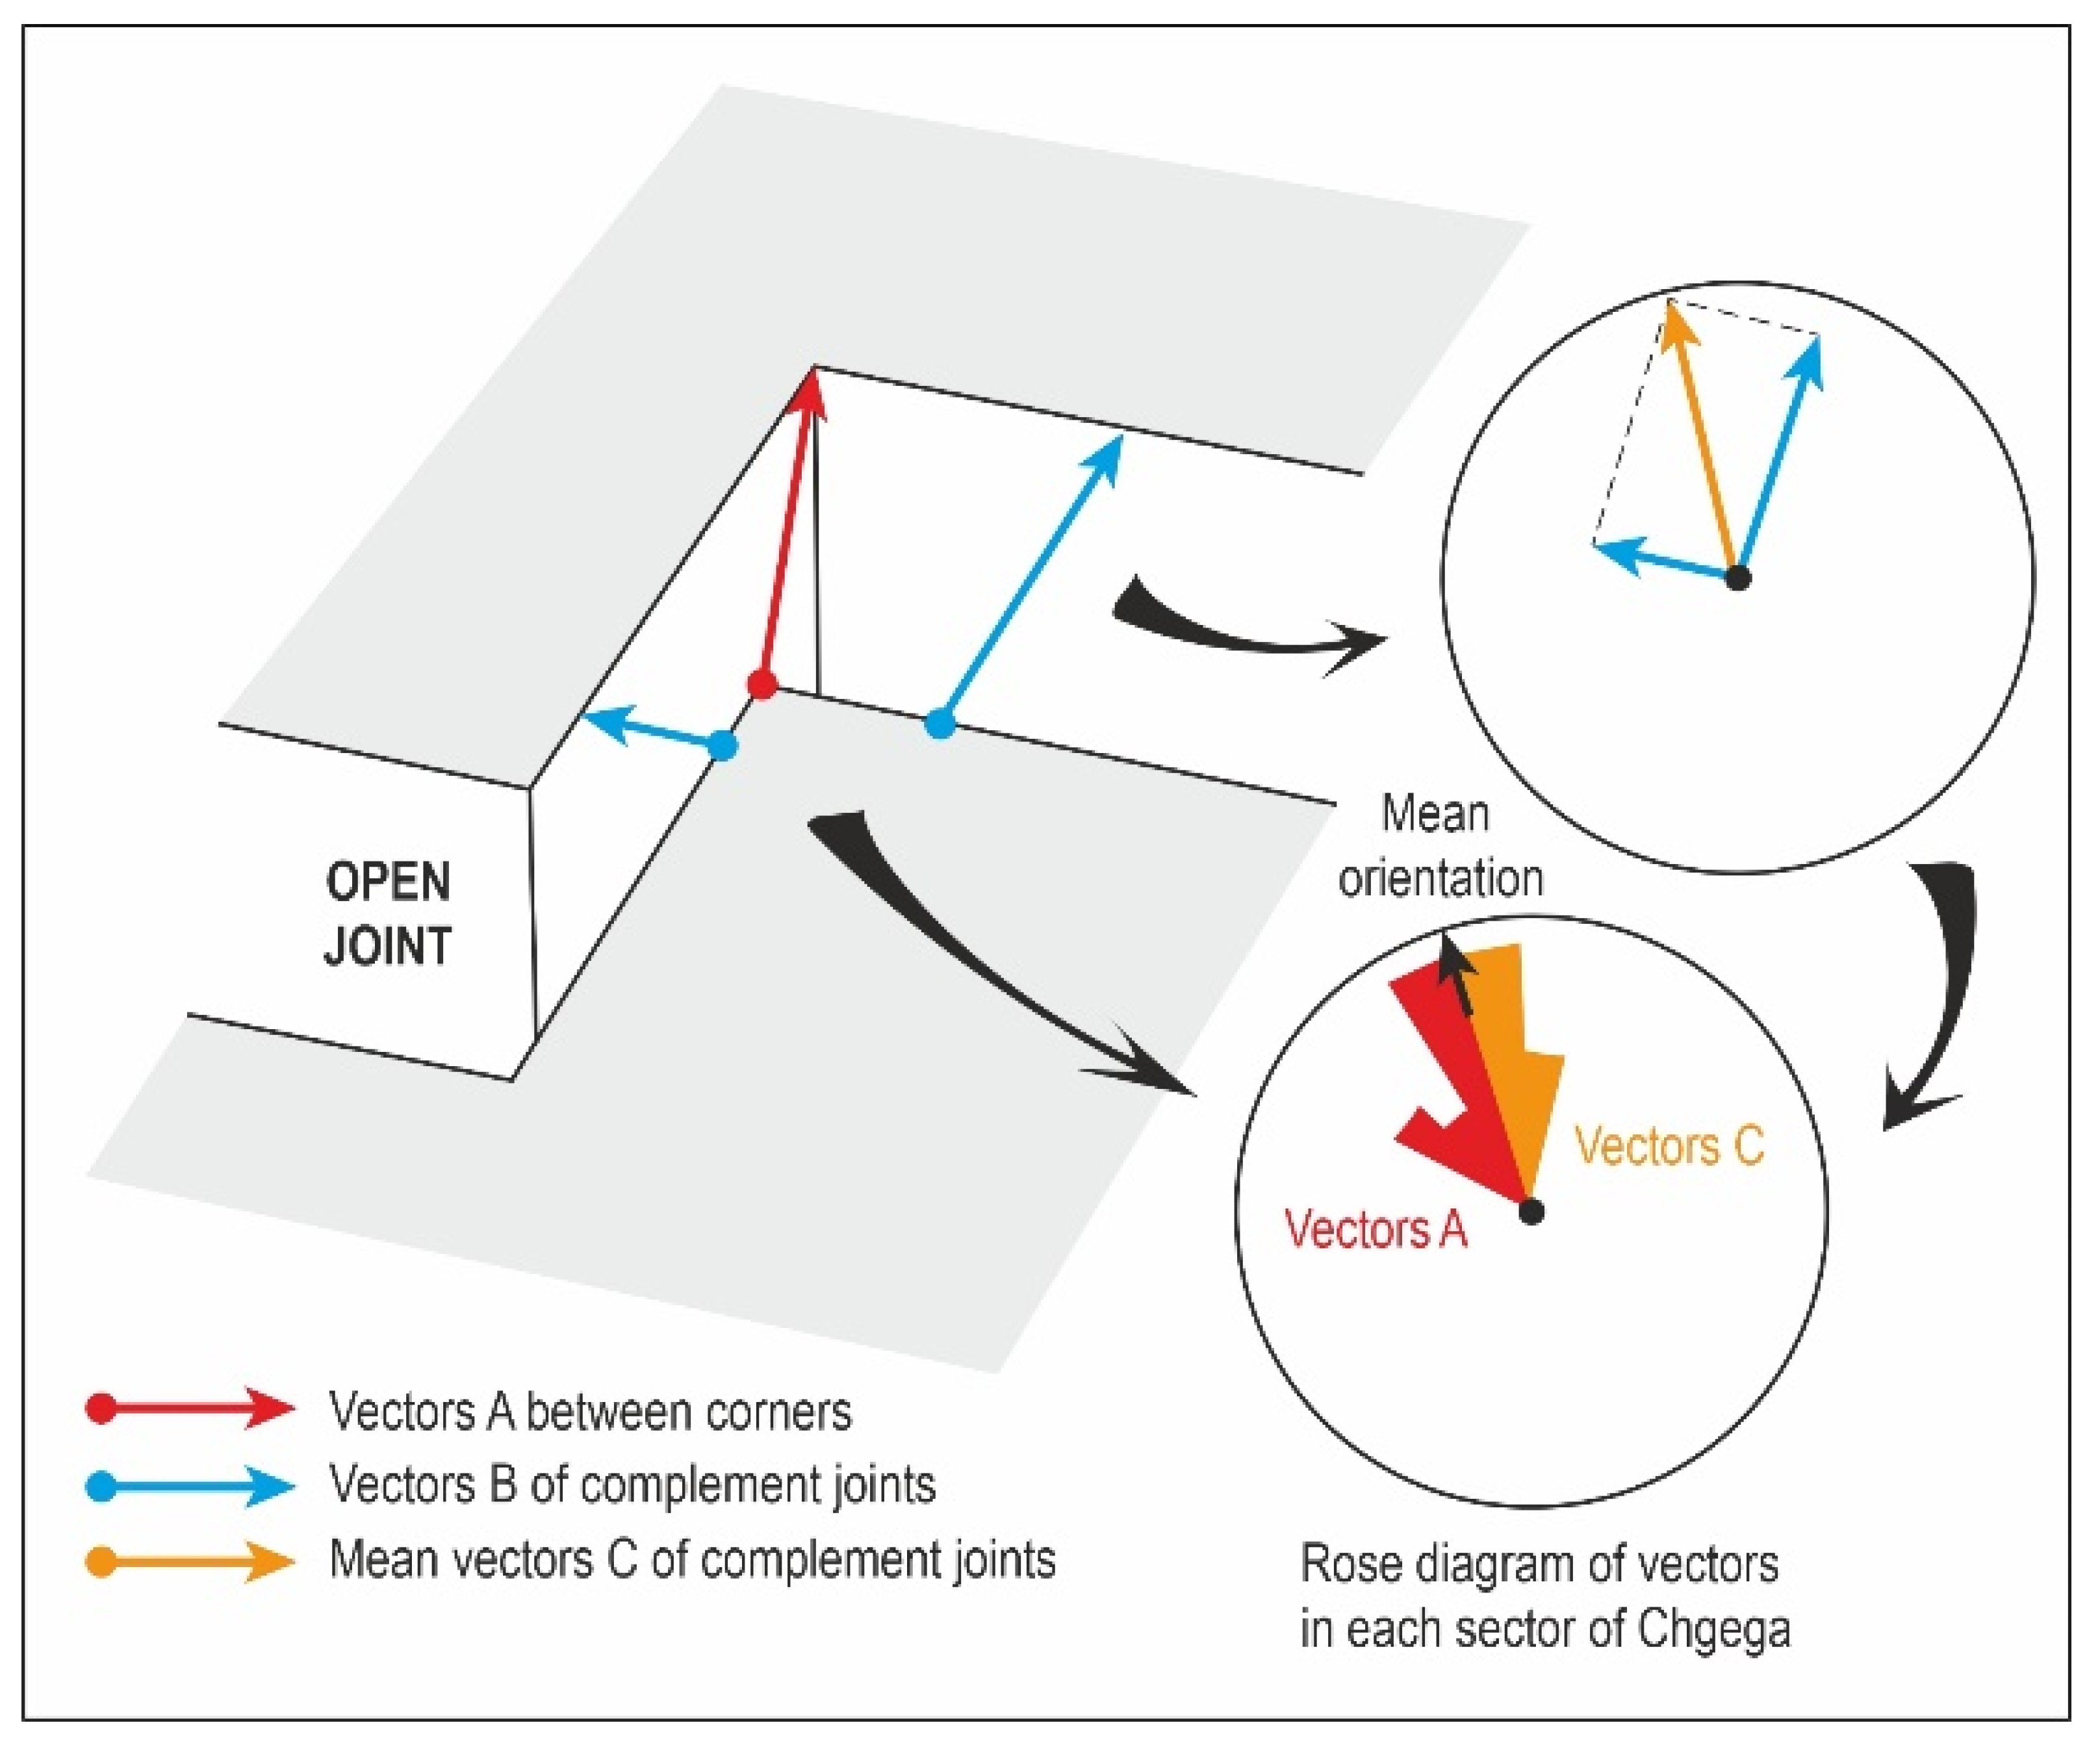
Figure 7 outlines the procedure used to calculate the mean vectors of movement. First, we recognized rock corners in the two margins of the joints that matched perfectly, and we measured the azimuth of the line connecting these corners. Second, we measured pairs of azimuths in complementary joints where clear corners were not present. These azimuths were those of the lines perpendicular to the joints. The mean azimuth of these lines marks the azimuth of the joint opening in this case. We measured discontinuities with openings clearly recognizable in the orthoimage (resolution: 8.19 cm/pix). The aperture is generally of more than 50 cm.
To grasp the big picture and gain a more complete understanding of the Chgega landslide setting, we also performed analyses of the Chgega’s region relief. In this regard, we analyzed the topography and drainage network of the area through morphometric tools applied to a regional DEM derived from the 1:25,000-scale topographic map. We calculated the bulk erosion and local relief to compare the characteristics of the landscape surrounding Chgega landslide with those of the adjacent areas having the same rocks, noting the singularities of the place where the slope movement developed.

4. Results

4.1. Geomorphology and Classification of the Chgega Landslide

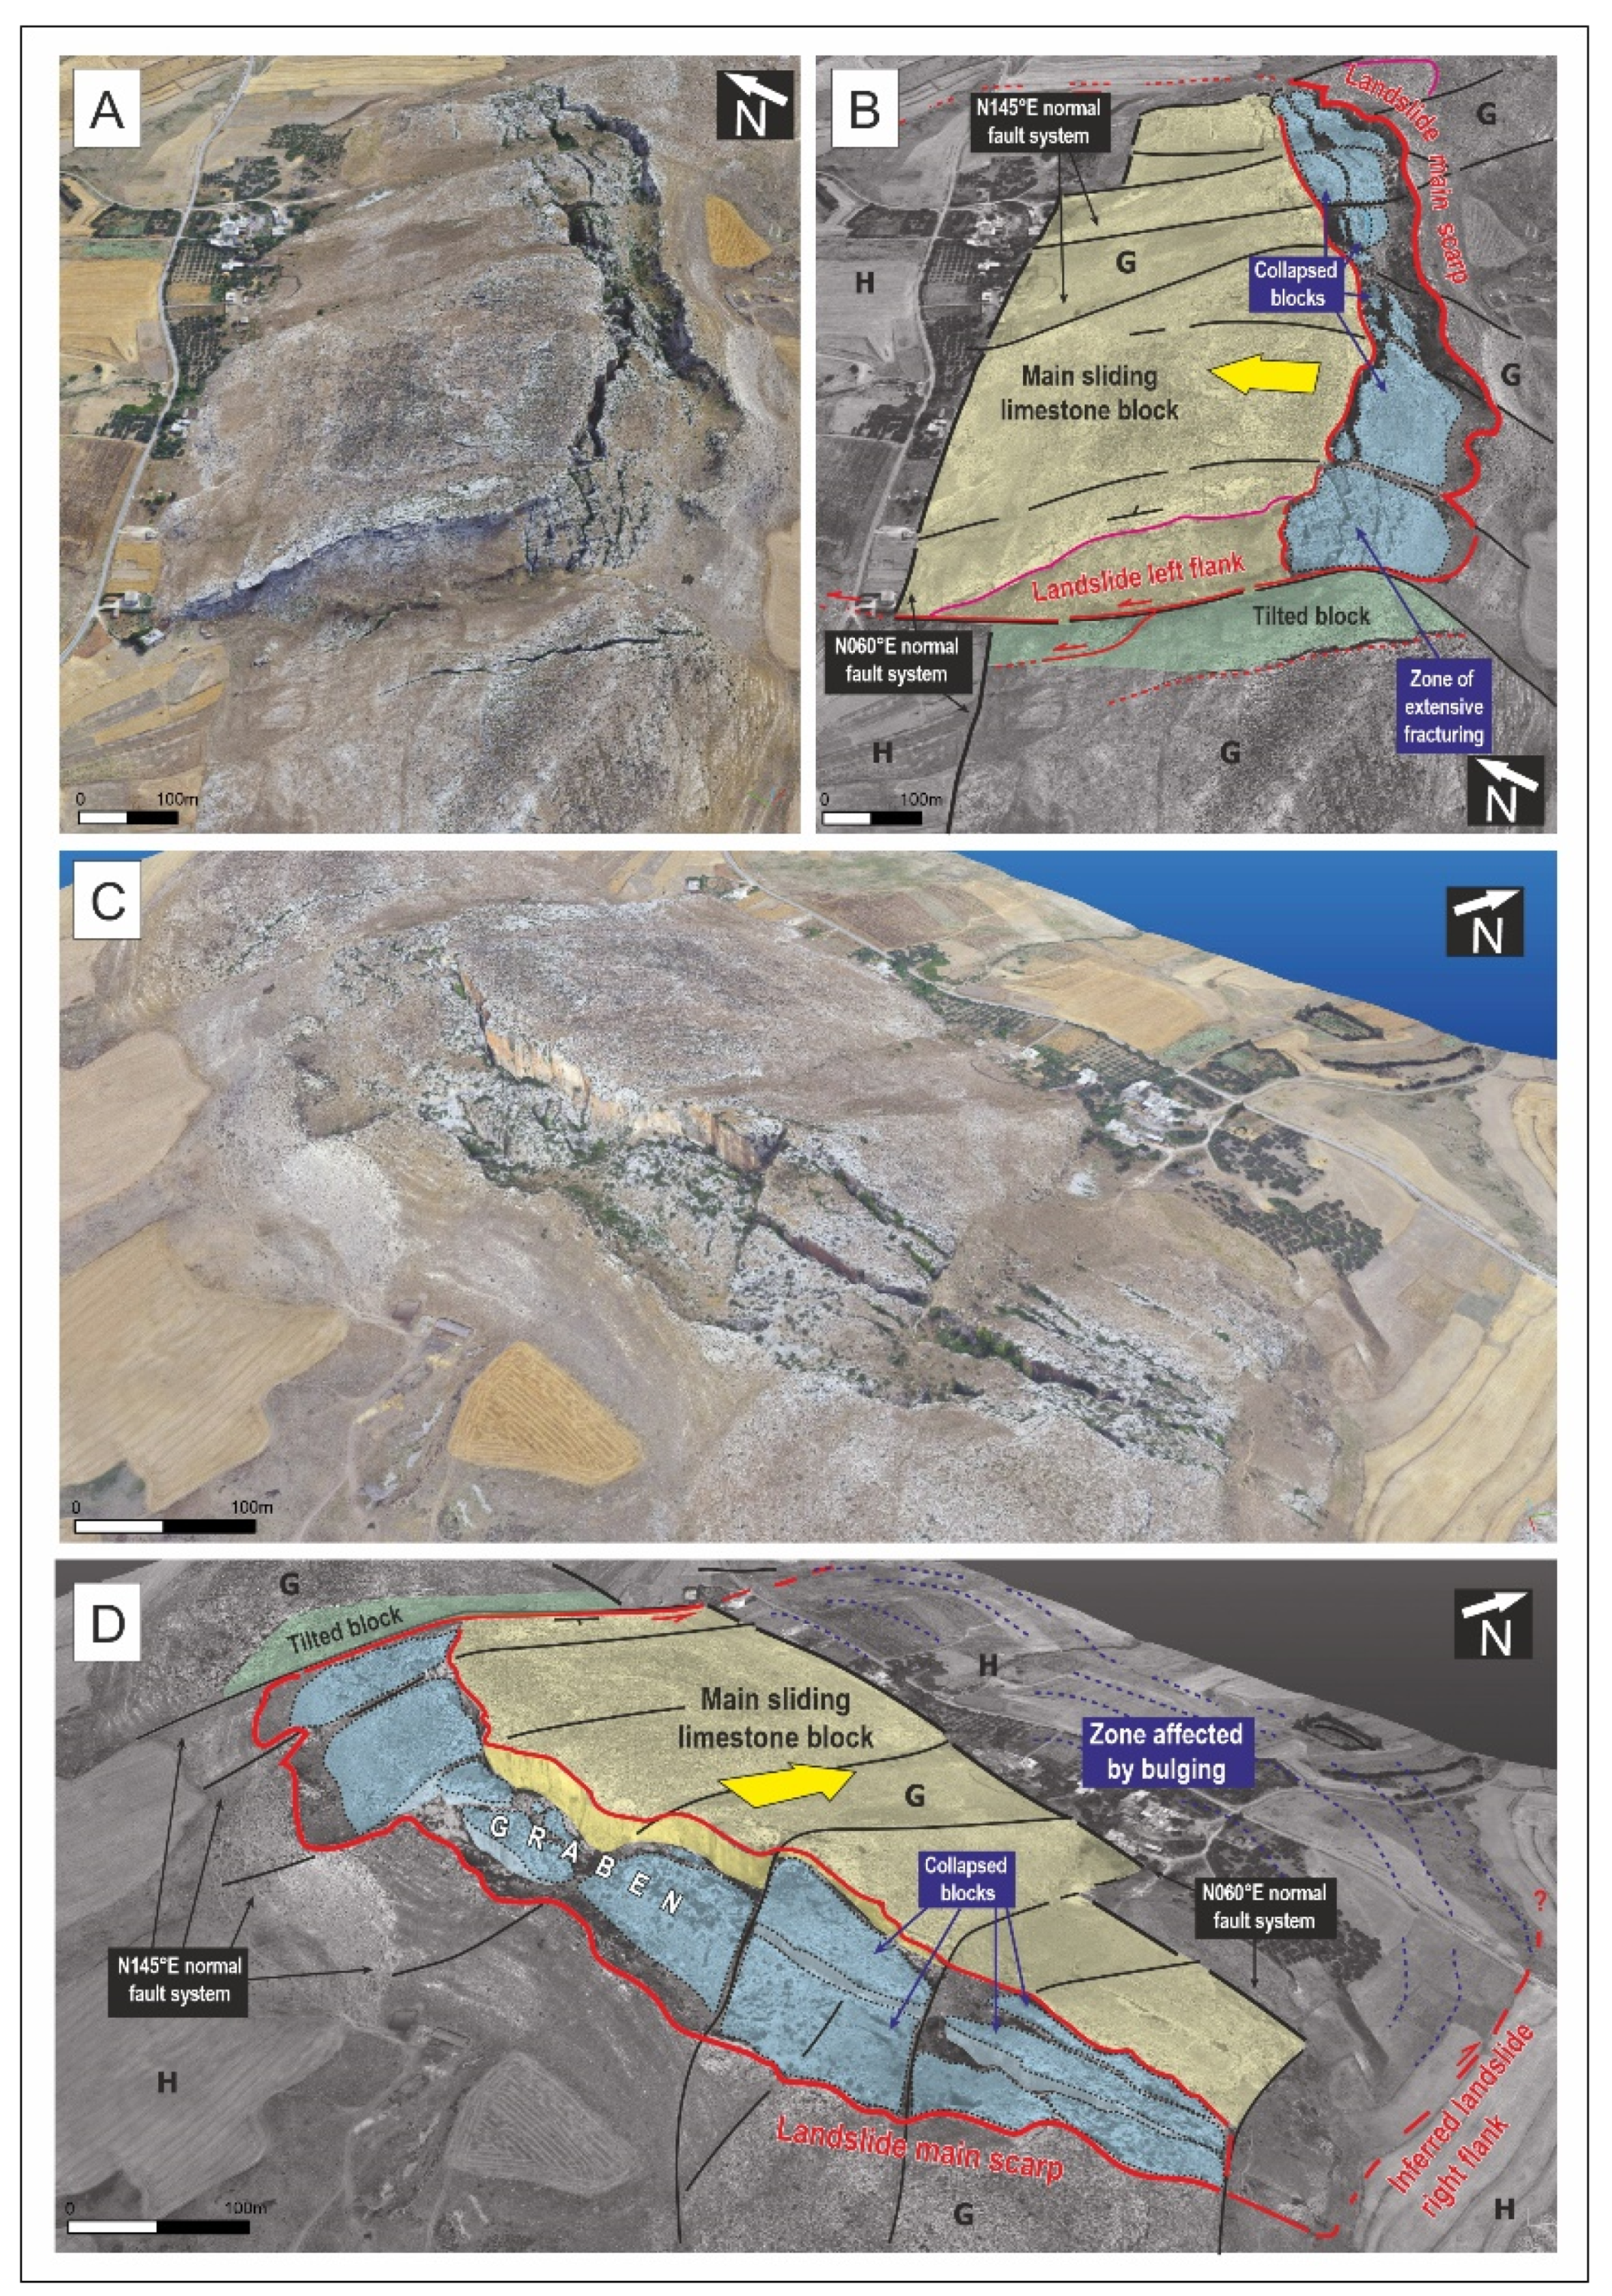
The Chgega Mountain is impacted by a landslide that entails a large block of limestone from the Garia Formation, some 900 m long and 400 m wide, sliding over marls and clays of the Haria Formation. The lateral margins of this block are defined by several faults with N140°E direction that cut the Garia Formation in this sector. In turn, a N060°E normal fault puts the front of the moving limestone block in direct contact with the Haria Formation, allowing movement of the block downhill. In its current situation, the rigid limestone block can therefore push against the clays, deforming them. This plastic deformation explains the slight bulge observed in the Haria outcrop at the base of the mountain (Figure 8).
The lateral movement of the limestone block produces a graben in the upper part of the relief. The graben forms a closed depression ~800 m long and ~120 m wide; its maximum depth is estimated to coincide with the Garia Formation thickness (~60 m [30]) (Figure 8 and Figure 9B,C). The elongation of the graben follows a N060°E direction and has a slightly curved geometry. Its boundary in the NW sector is sharp, coinciding with the limits of the limestone block. A scarp—neither clear nor regular—limits the other side of the graben. Inside the graben are several limestone blocks having decametric to metric dimensions. These blocks are tilted towards the NW, giving an overall impression that they have collapsed into the graben or toppled within it.
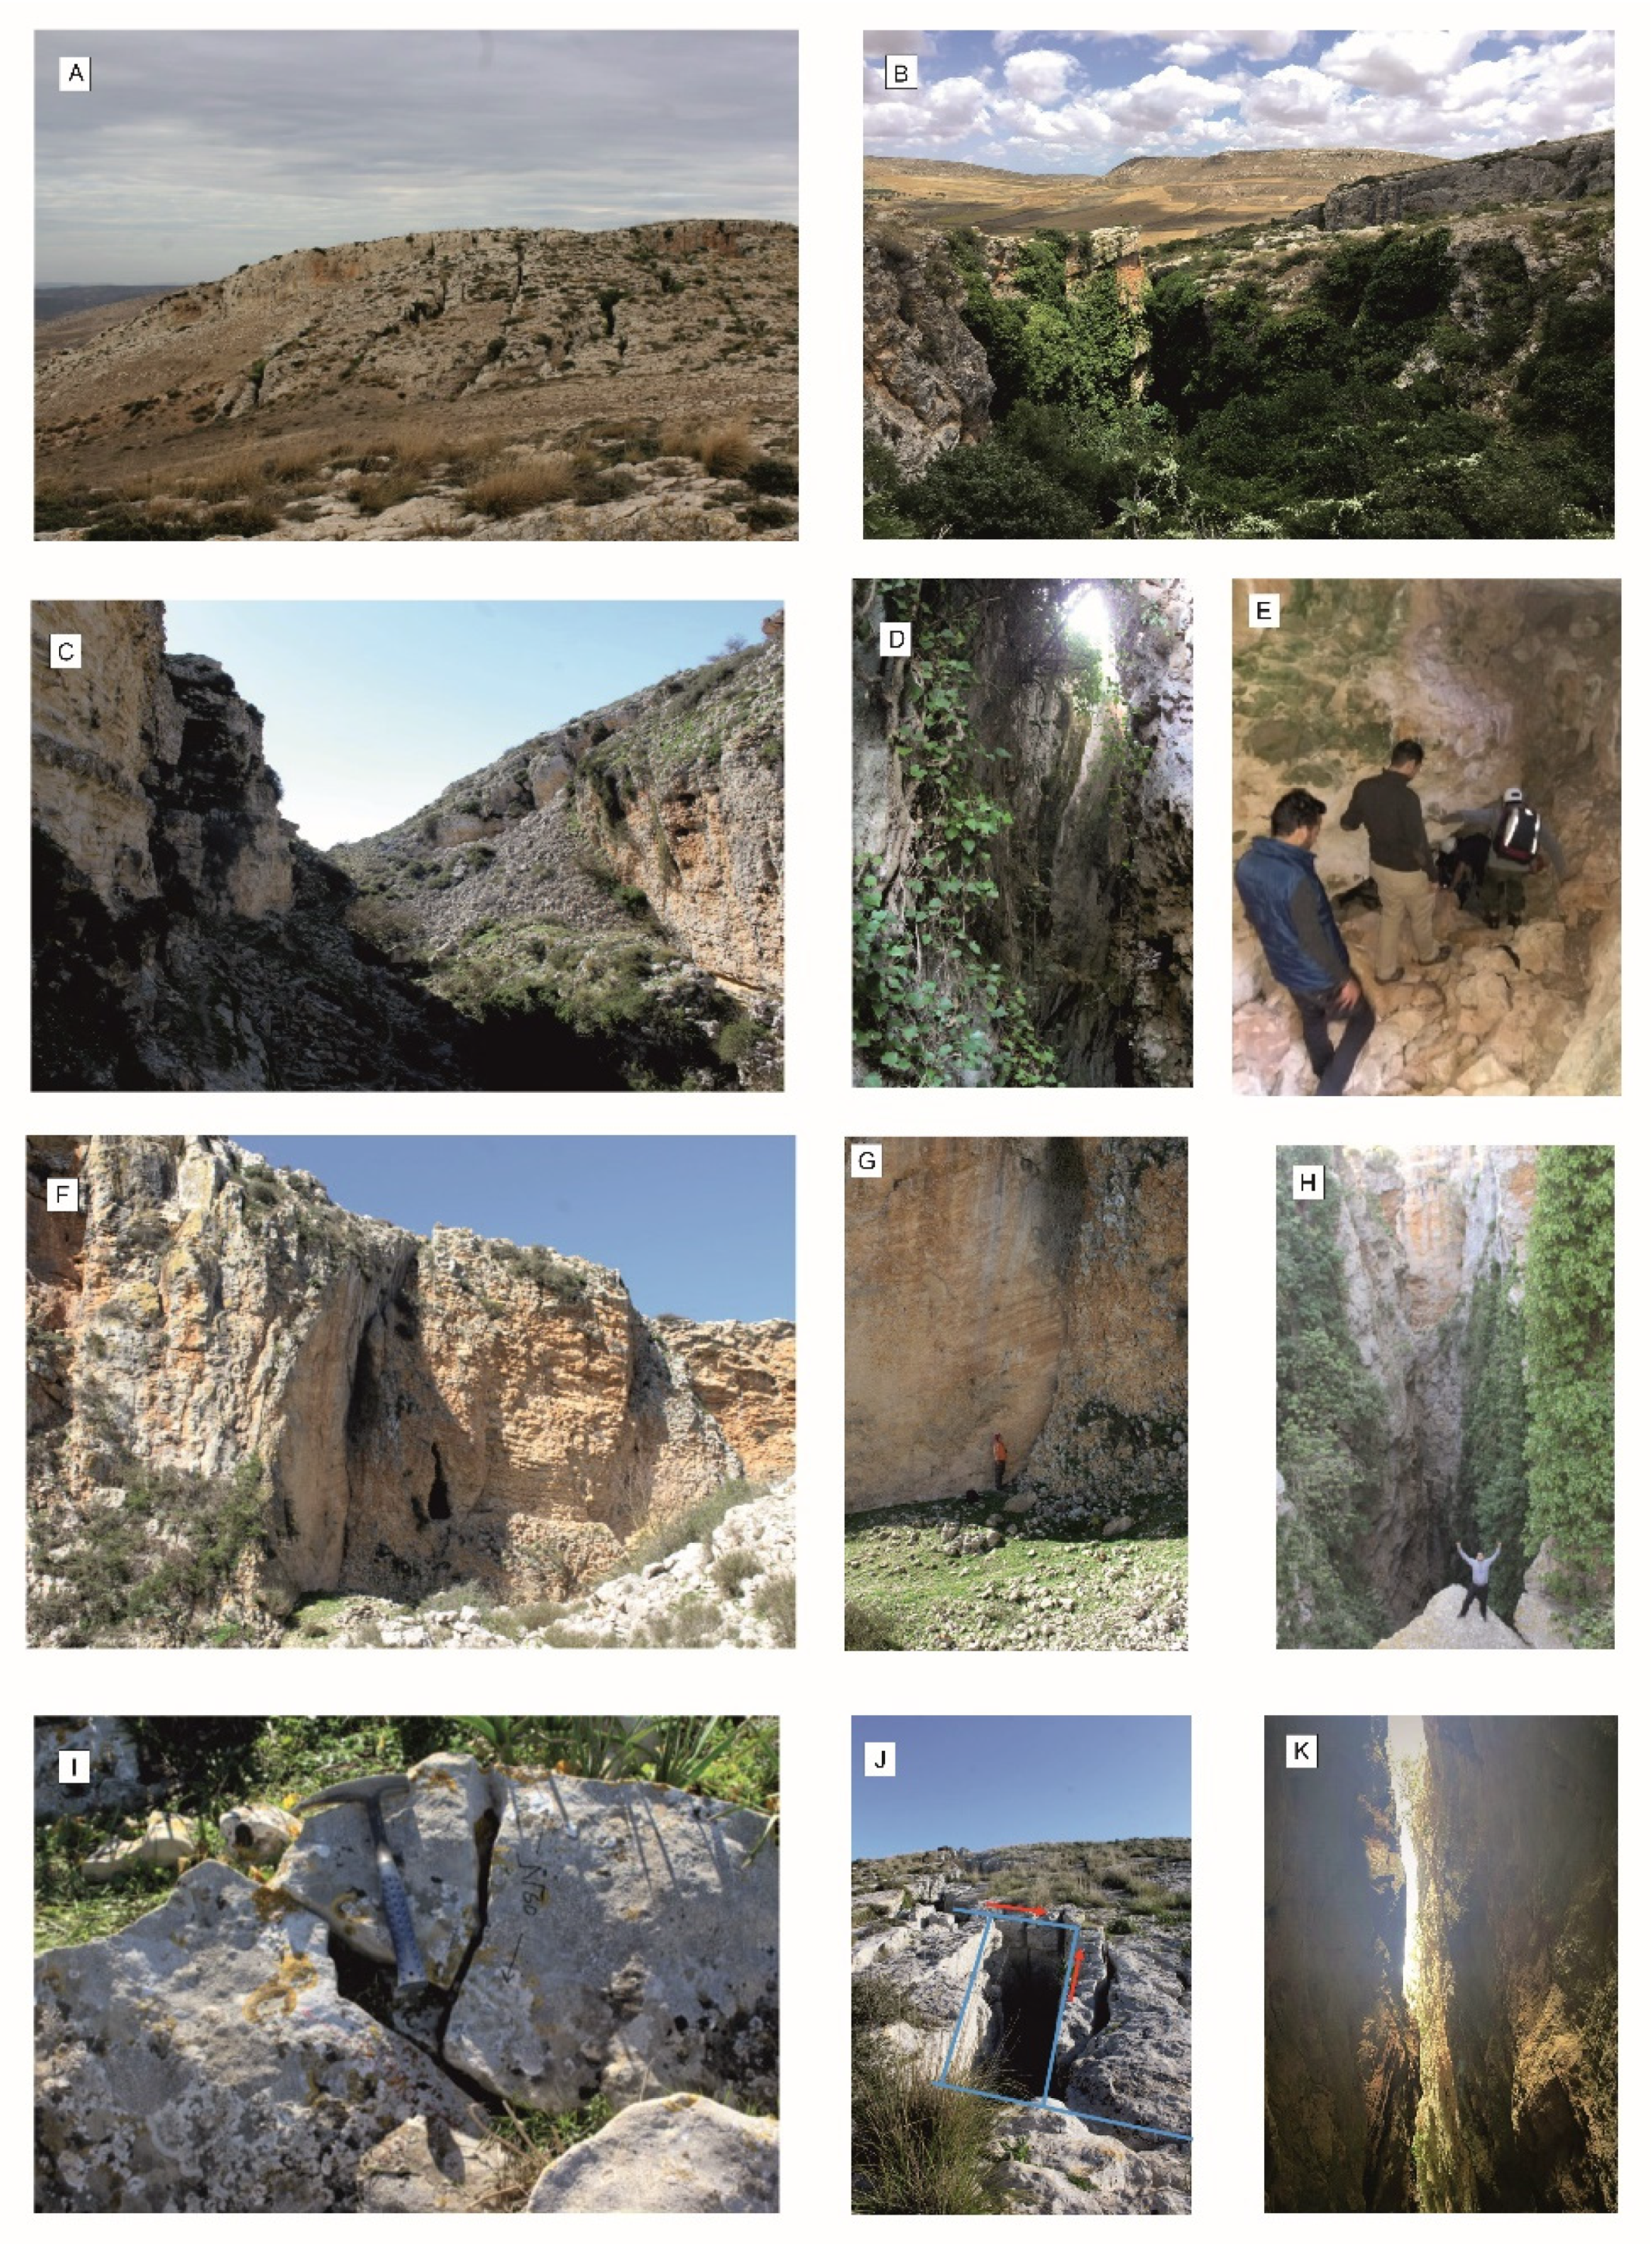
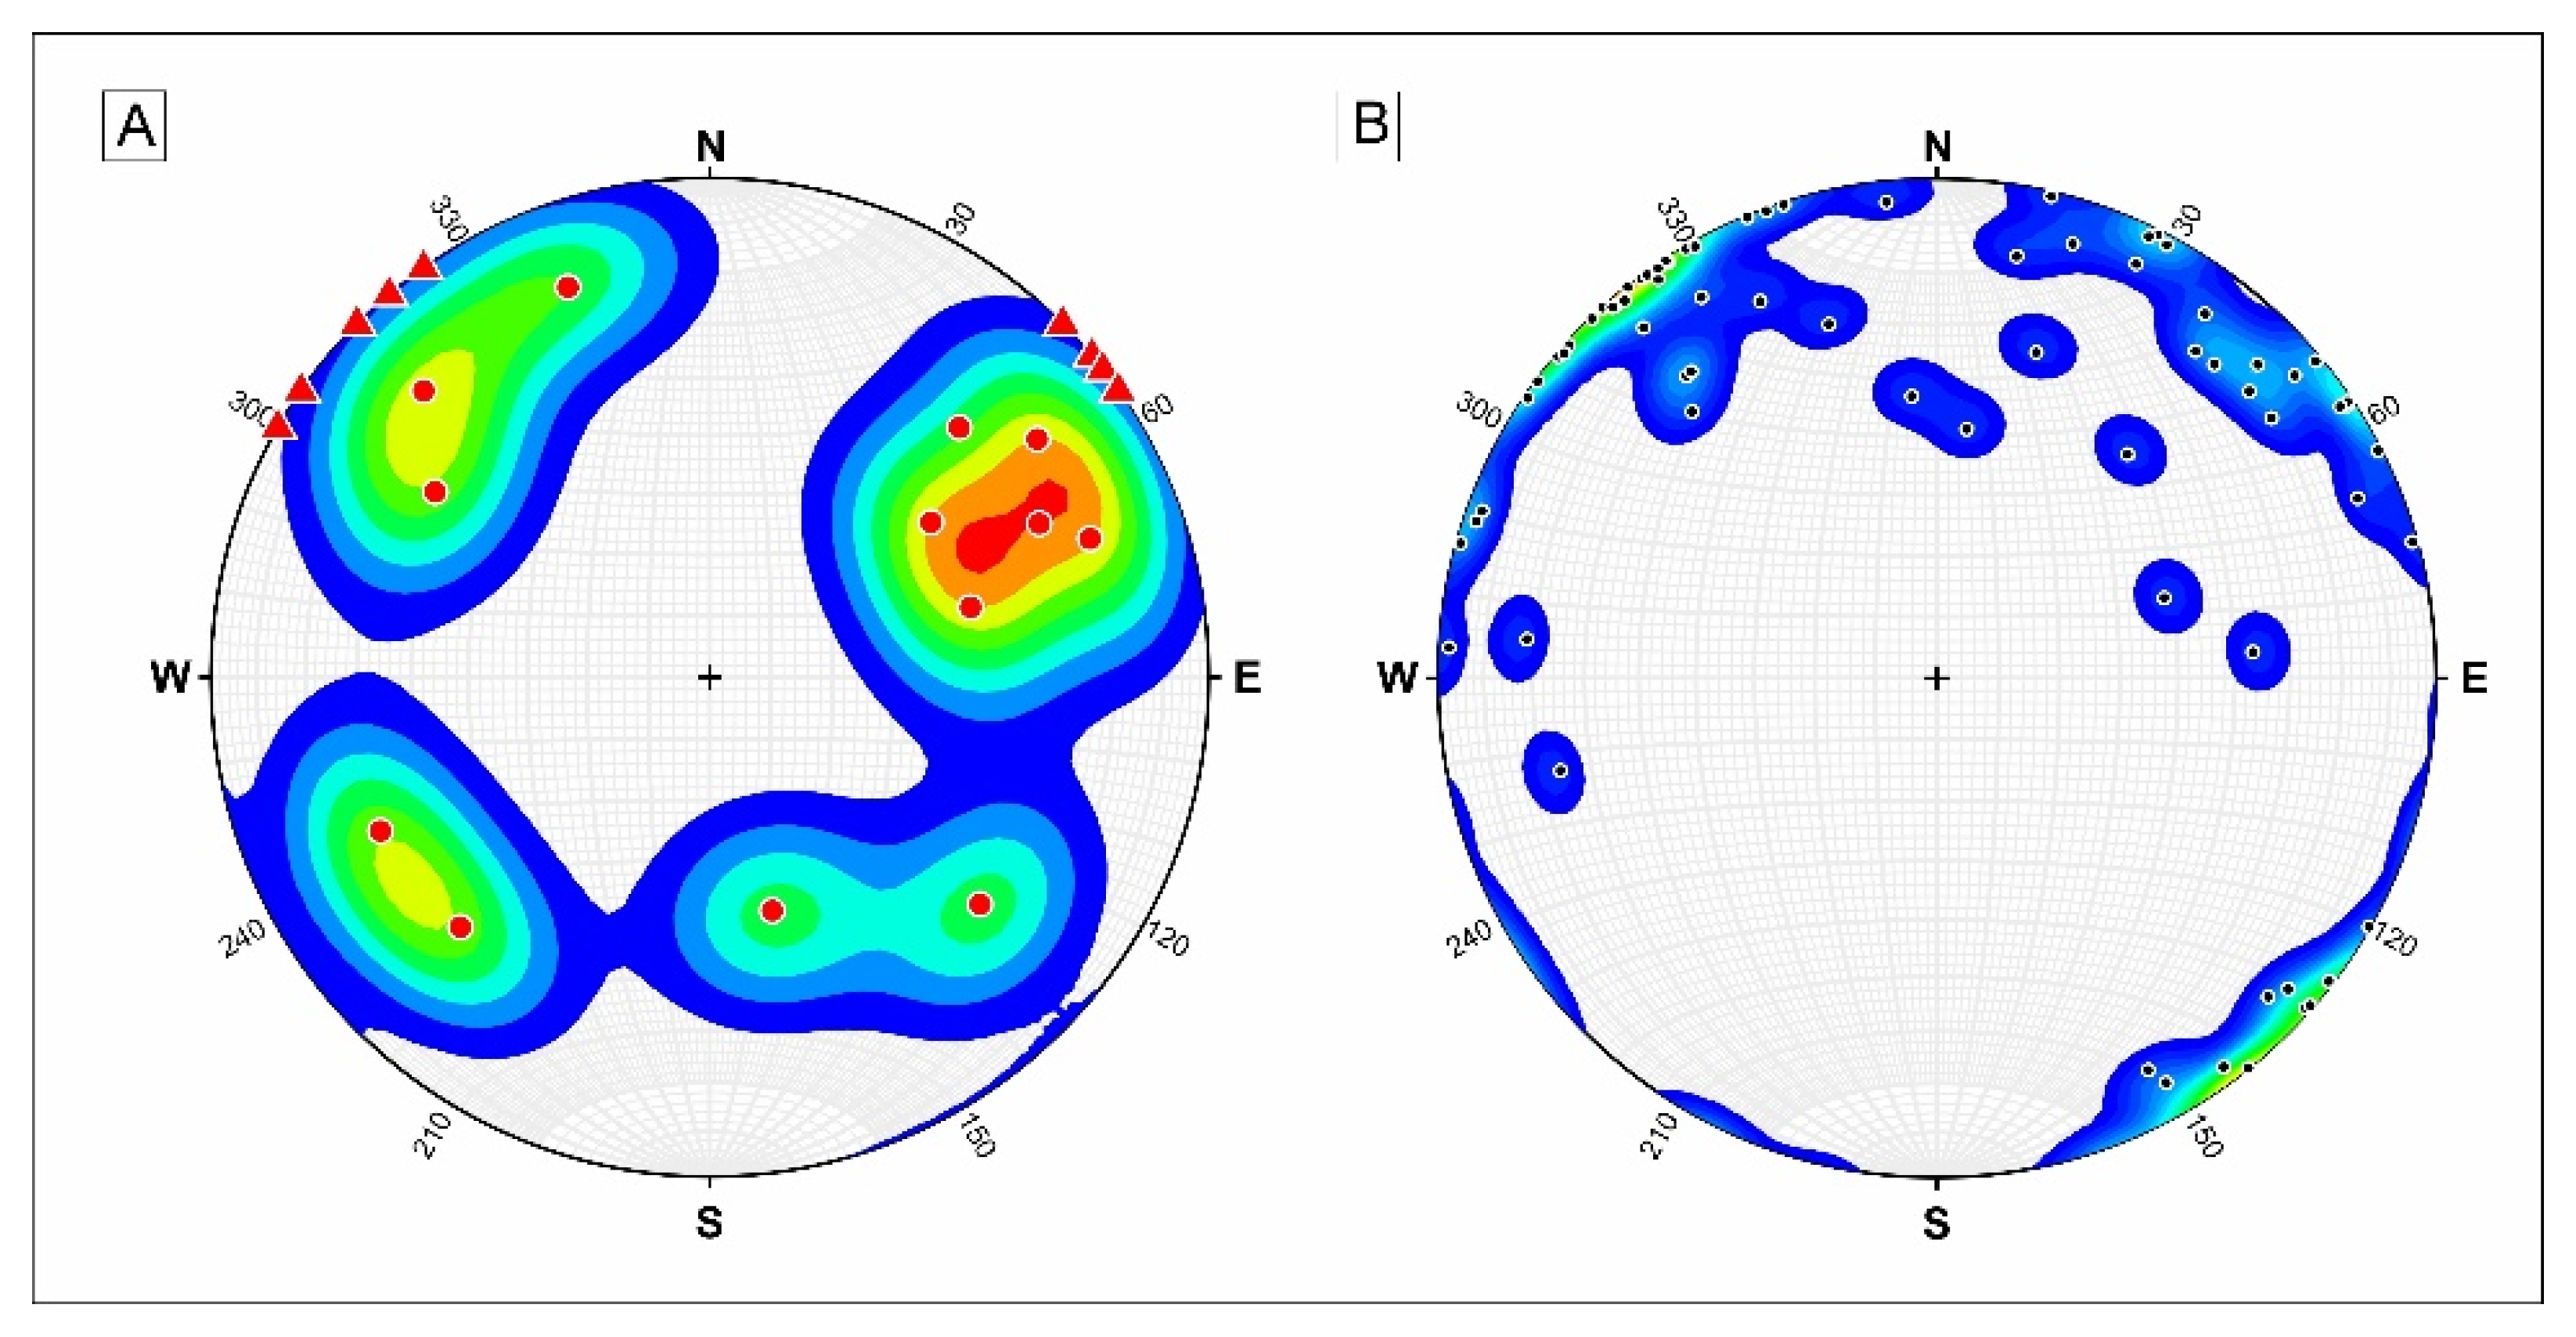
Rockfall deposits, open joints, small rock pinnacles, and a ruiniform relief occupy the interior of the graben (Figure 9A–C). At the bottom of this landform there are cavities as well. The cavities are probably not of karstic origin, because they show angular sections and speleothems are not present. They can be considered as crevice caves that formed in large slope movements favored by the progressive opening of fractures (Figure 9E) [5,6]. At either end of the graben the rock mass shows a complex network of open and deep fractures, finishing in the lateral faults that limit the main block of the mass movement (Figure 9D,F–H,K). All joints have directions of N040-060°E and N140–150°E (Figure 10) corresponding to the main discontinuity sets observed elsewhere in the Garia Formation (e.g., [56,57]; Figure 9A,I,J). Initially, these discontinuities correspond to joints inherited from the subsequent tectonic events affecting Northern Tunisia. Thus, a simple explanation for the opened cracks is that they represent reactivated joints during Chgega mass movement.
All the aforementioned characteristics indicate that the Chgega landslide can be classified as a “complex landslide” including a “rock planar slide” or a “block slide” according to the classification of Hungr et al. [5]; and the upper part of the landslide can be described as a “lateral spreading” based on the Pasuto and Soldati descriptions [3,58,59]. Combining the mentioned classifications and also the “block slide” concept of Ibsen et al. [60], Chgega can be described as a “lateral spreading that evolves into a block slide”.

4.2. Relief Conditions for the Chgega Landslide Occurrence

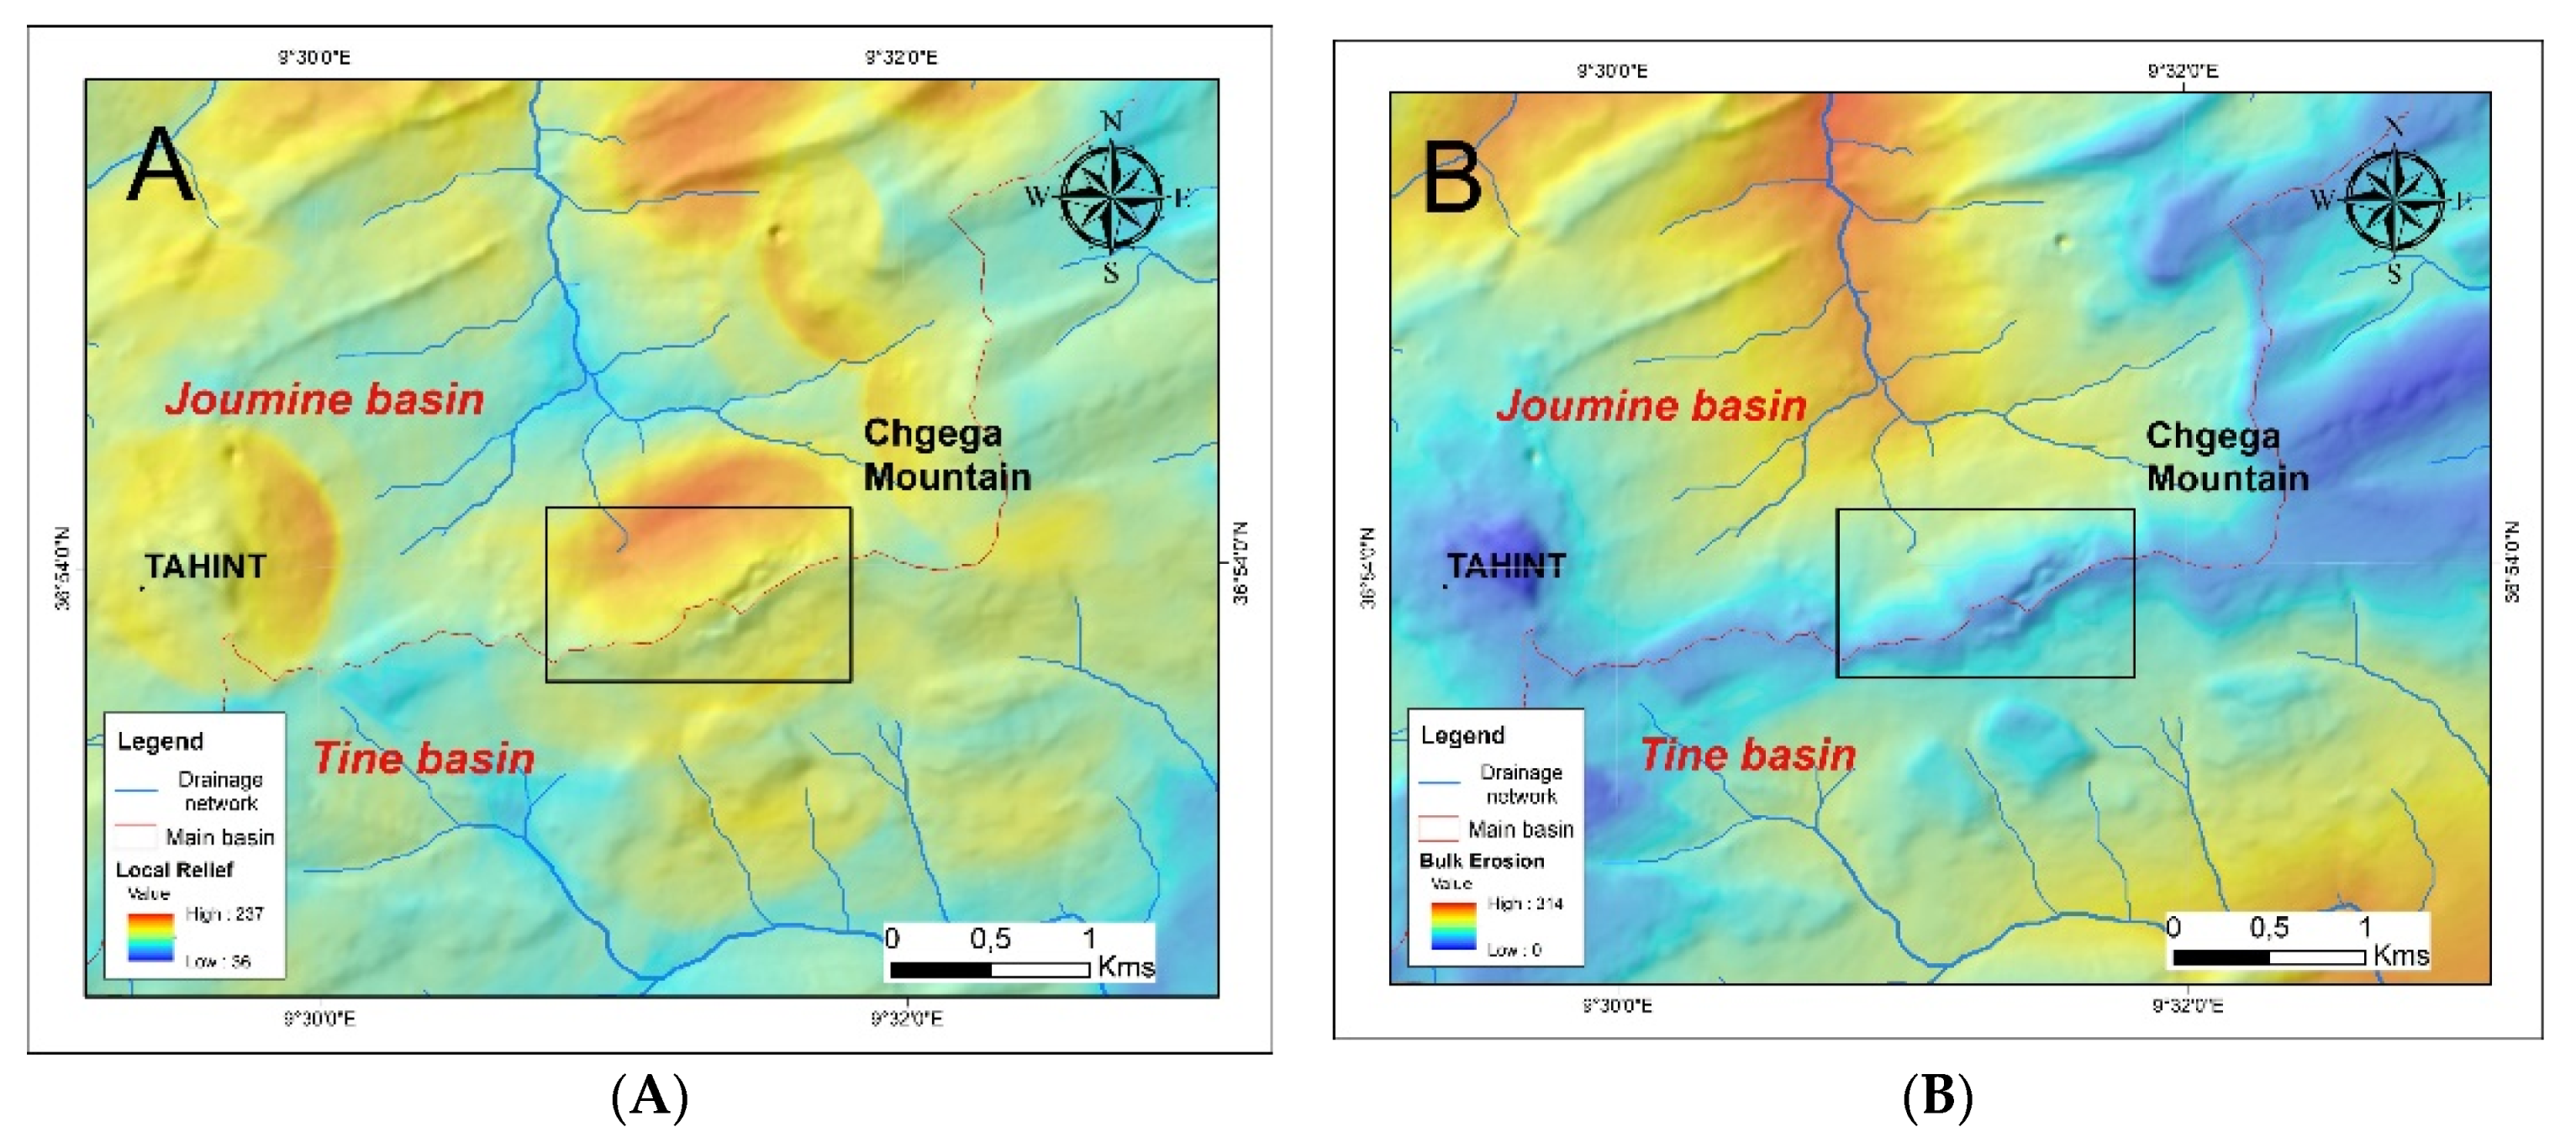
The relief of the Chgega region can partially explain the occurrence of the landslide. Our geomorphological analysis shows that the Chgega Mountain is located in the divide between the Joumin and Tine River basins, being the highest peak along this divide. Moreover, the slope impacted by block slide shows a highest local relief along the mentioned divide (Figure 11A) and the mountain flank of the river basin, where fluvial erosion processes have been more intense (Figure 11B). The ongoing erosion of the Joumine River comes just to the foot of Chgega Mountain, creating higher gradients on the NW side of the range than on the SE side. This condition, together with the geological structure of the Chgega Mountain, has generated an unfavorable situation for the relief’s stability, promoting its sliding. For the same apparent reason, mass movement developed SW of Tahint (Figure 11A,B ), where the gradient and the local relief are likewise steeper than in the surroundings.

4.3. Kinematics of the Chgega Landslide Derived from Open Joints

Regarding the kinematics of the landslide, the recent displacements recorded by the present open joints have a mean azimuth of 333° (Figure 12). This orientation is similar to the general one of the hillside, about 315–330°. However, we observe a slight decoupling between the orientation of the line of maximum slope and the mean vector of displacement. For this reason, we measured a mean displacement vector in the SW sector of the landslide oriented towards 340°, where the mean orientation of the slope is 310° (Figure 12B–D). This difference decreases towards the NE. In the northwestern sector of the graben, the opening of the joints indicates a movement oriented according to the line of maximum slope. In sum, the displacement has an orientation different than originally expected (Figure 12).
Associated with the landslide and adjacent to it is another block of limestone, limited by an open and deep fracture with a N140°E direction that evidences the rupture and slide of that block, probably triggered by the displacement of the main Chgega landslide. This could be considered a secondary failure. This block does not accompany the mobilized mass and its destabilization appears to be more recent. The measurements taken at the main joints indicate a movement towards 47° that does not match the orientation of the displacement in the main body of the Chgega landslide (Figure 12).

4.4. Estimated Velocity of Chgega Landslide by InSAR

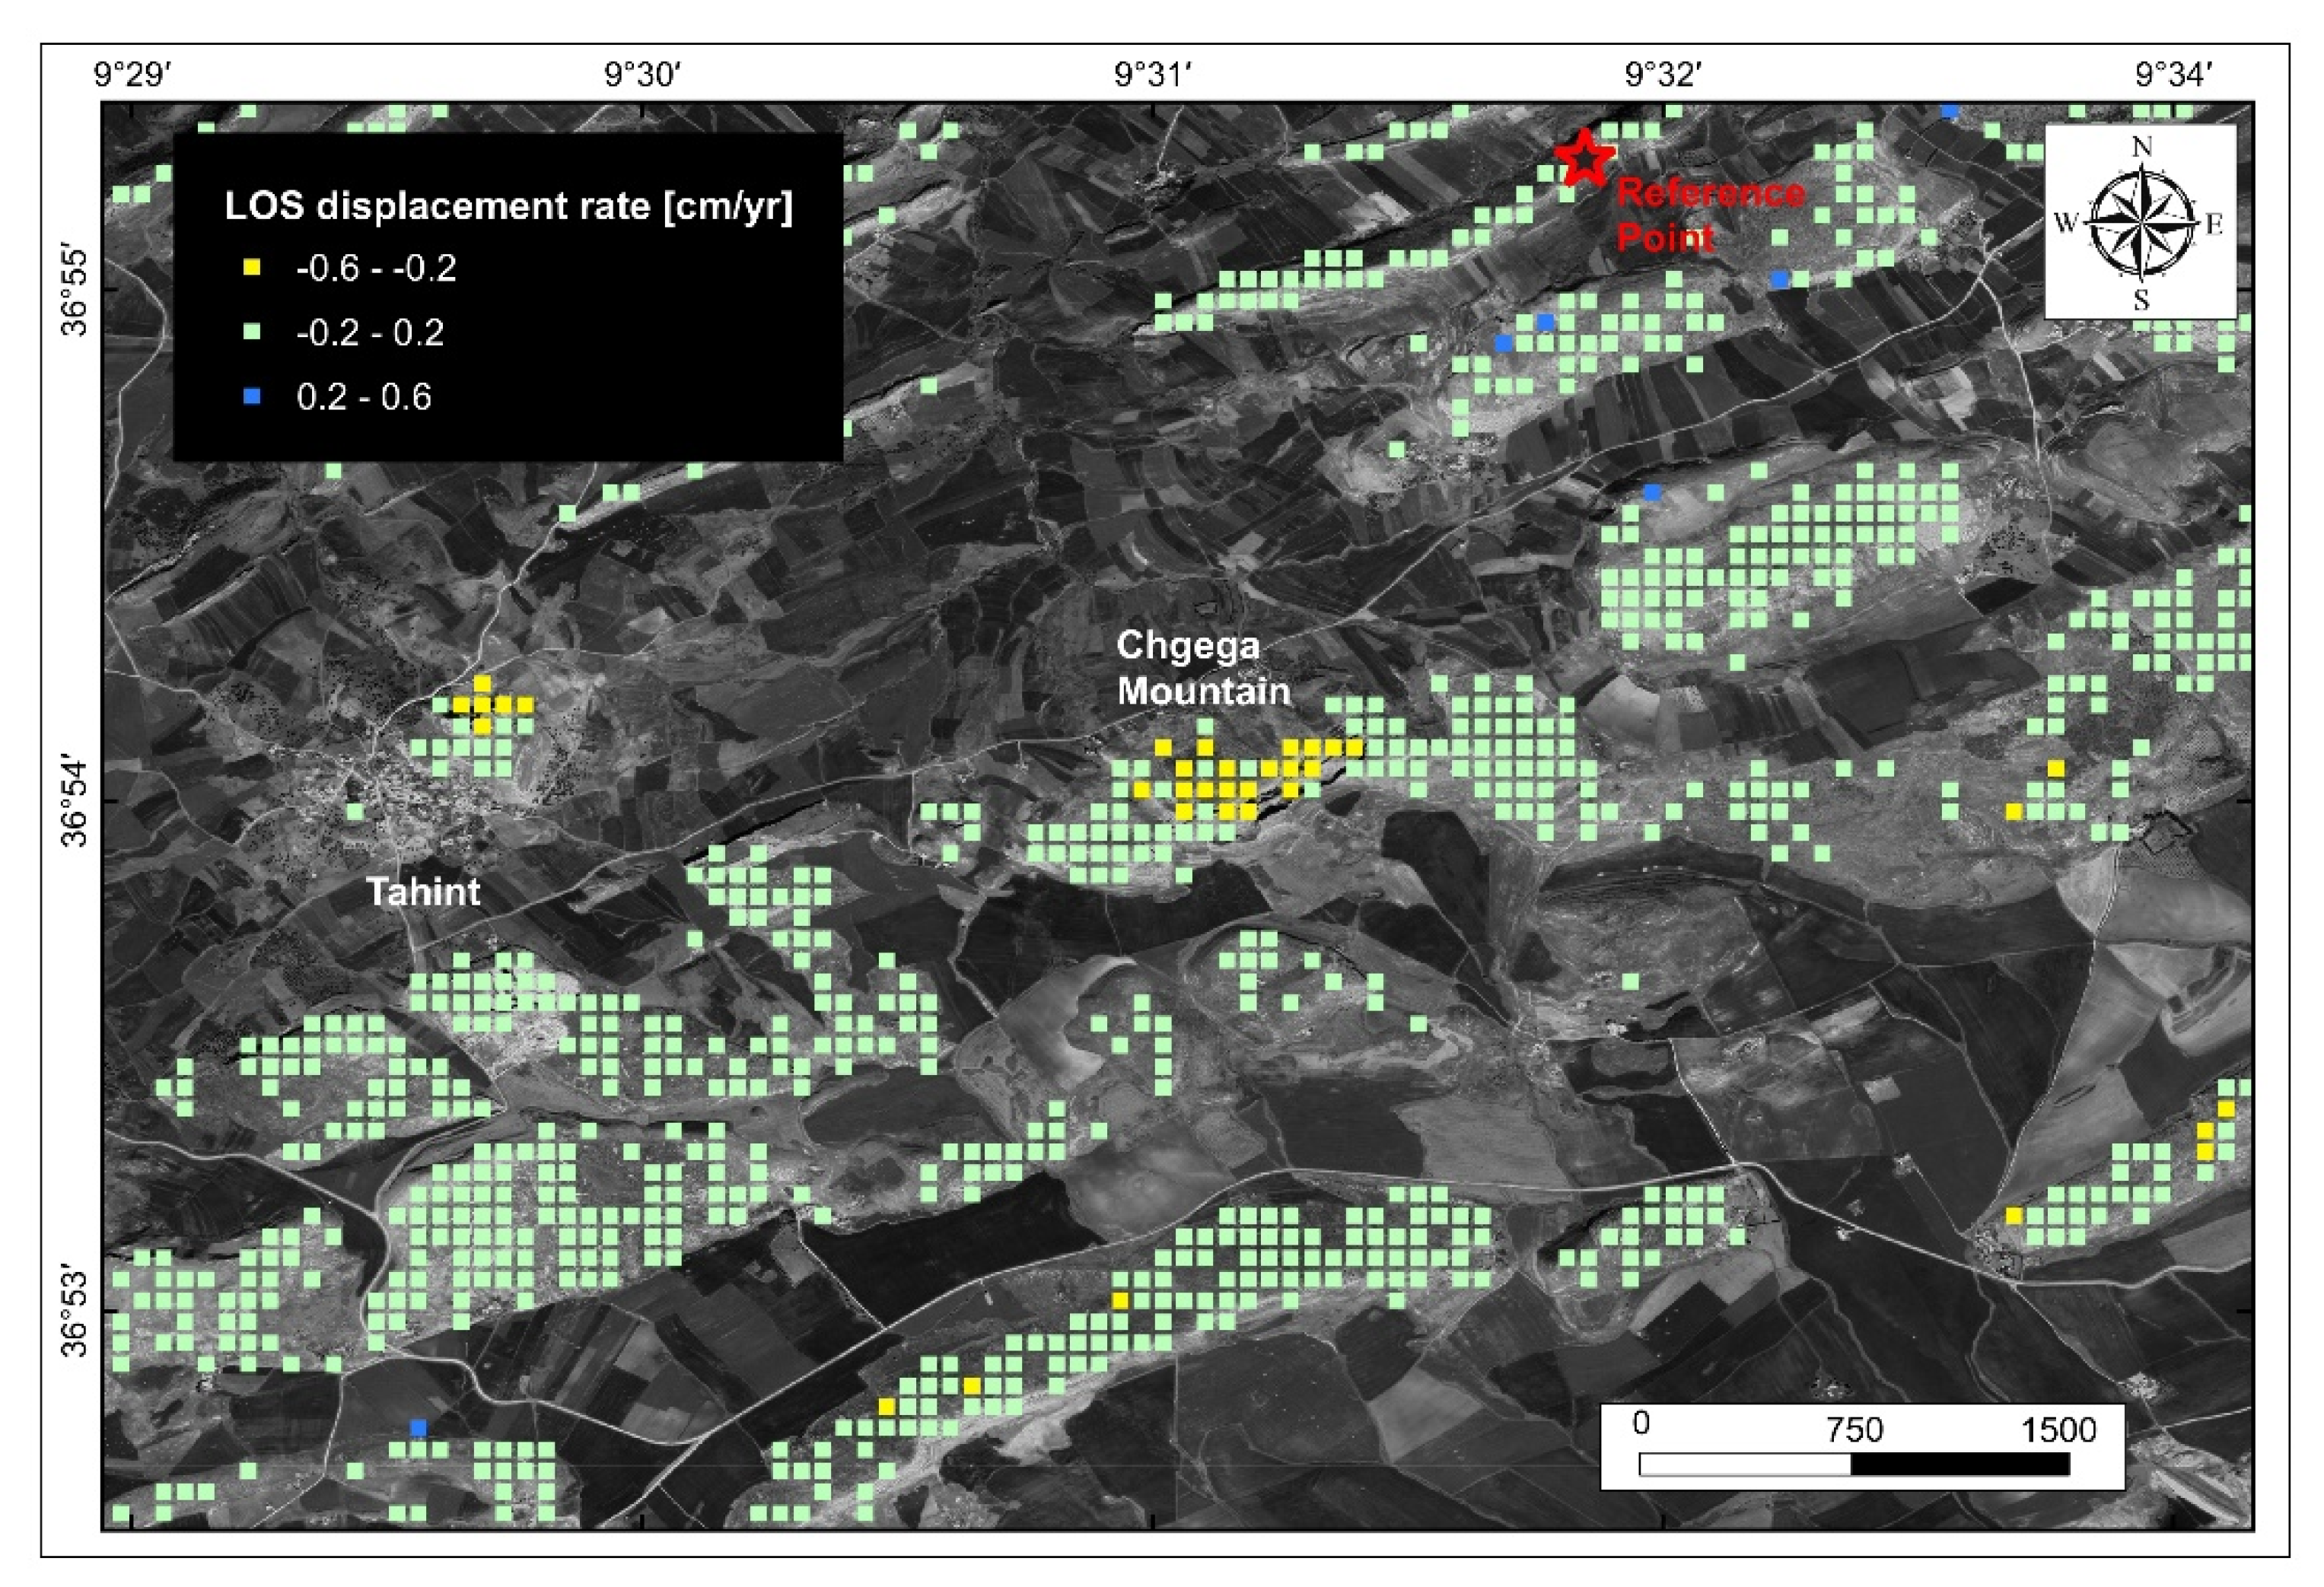
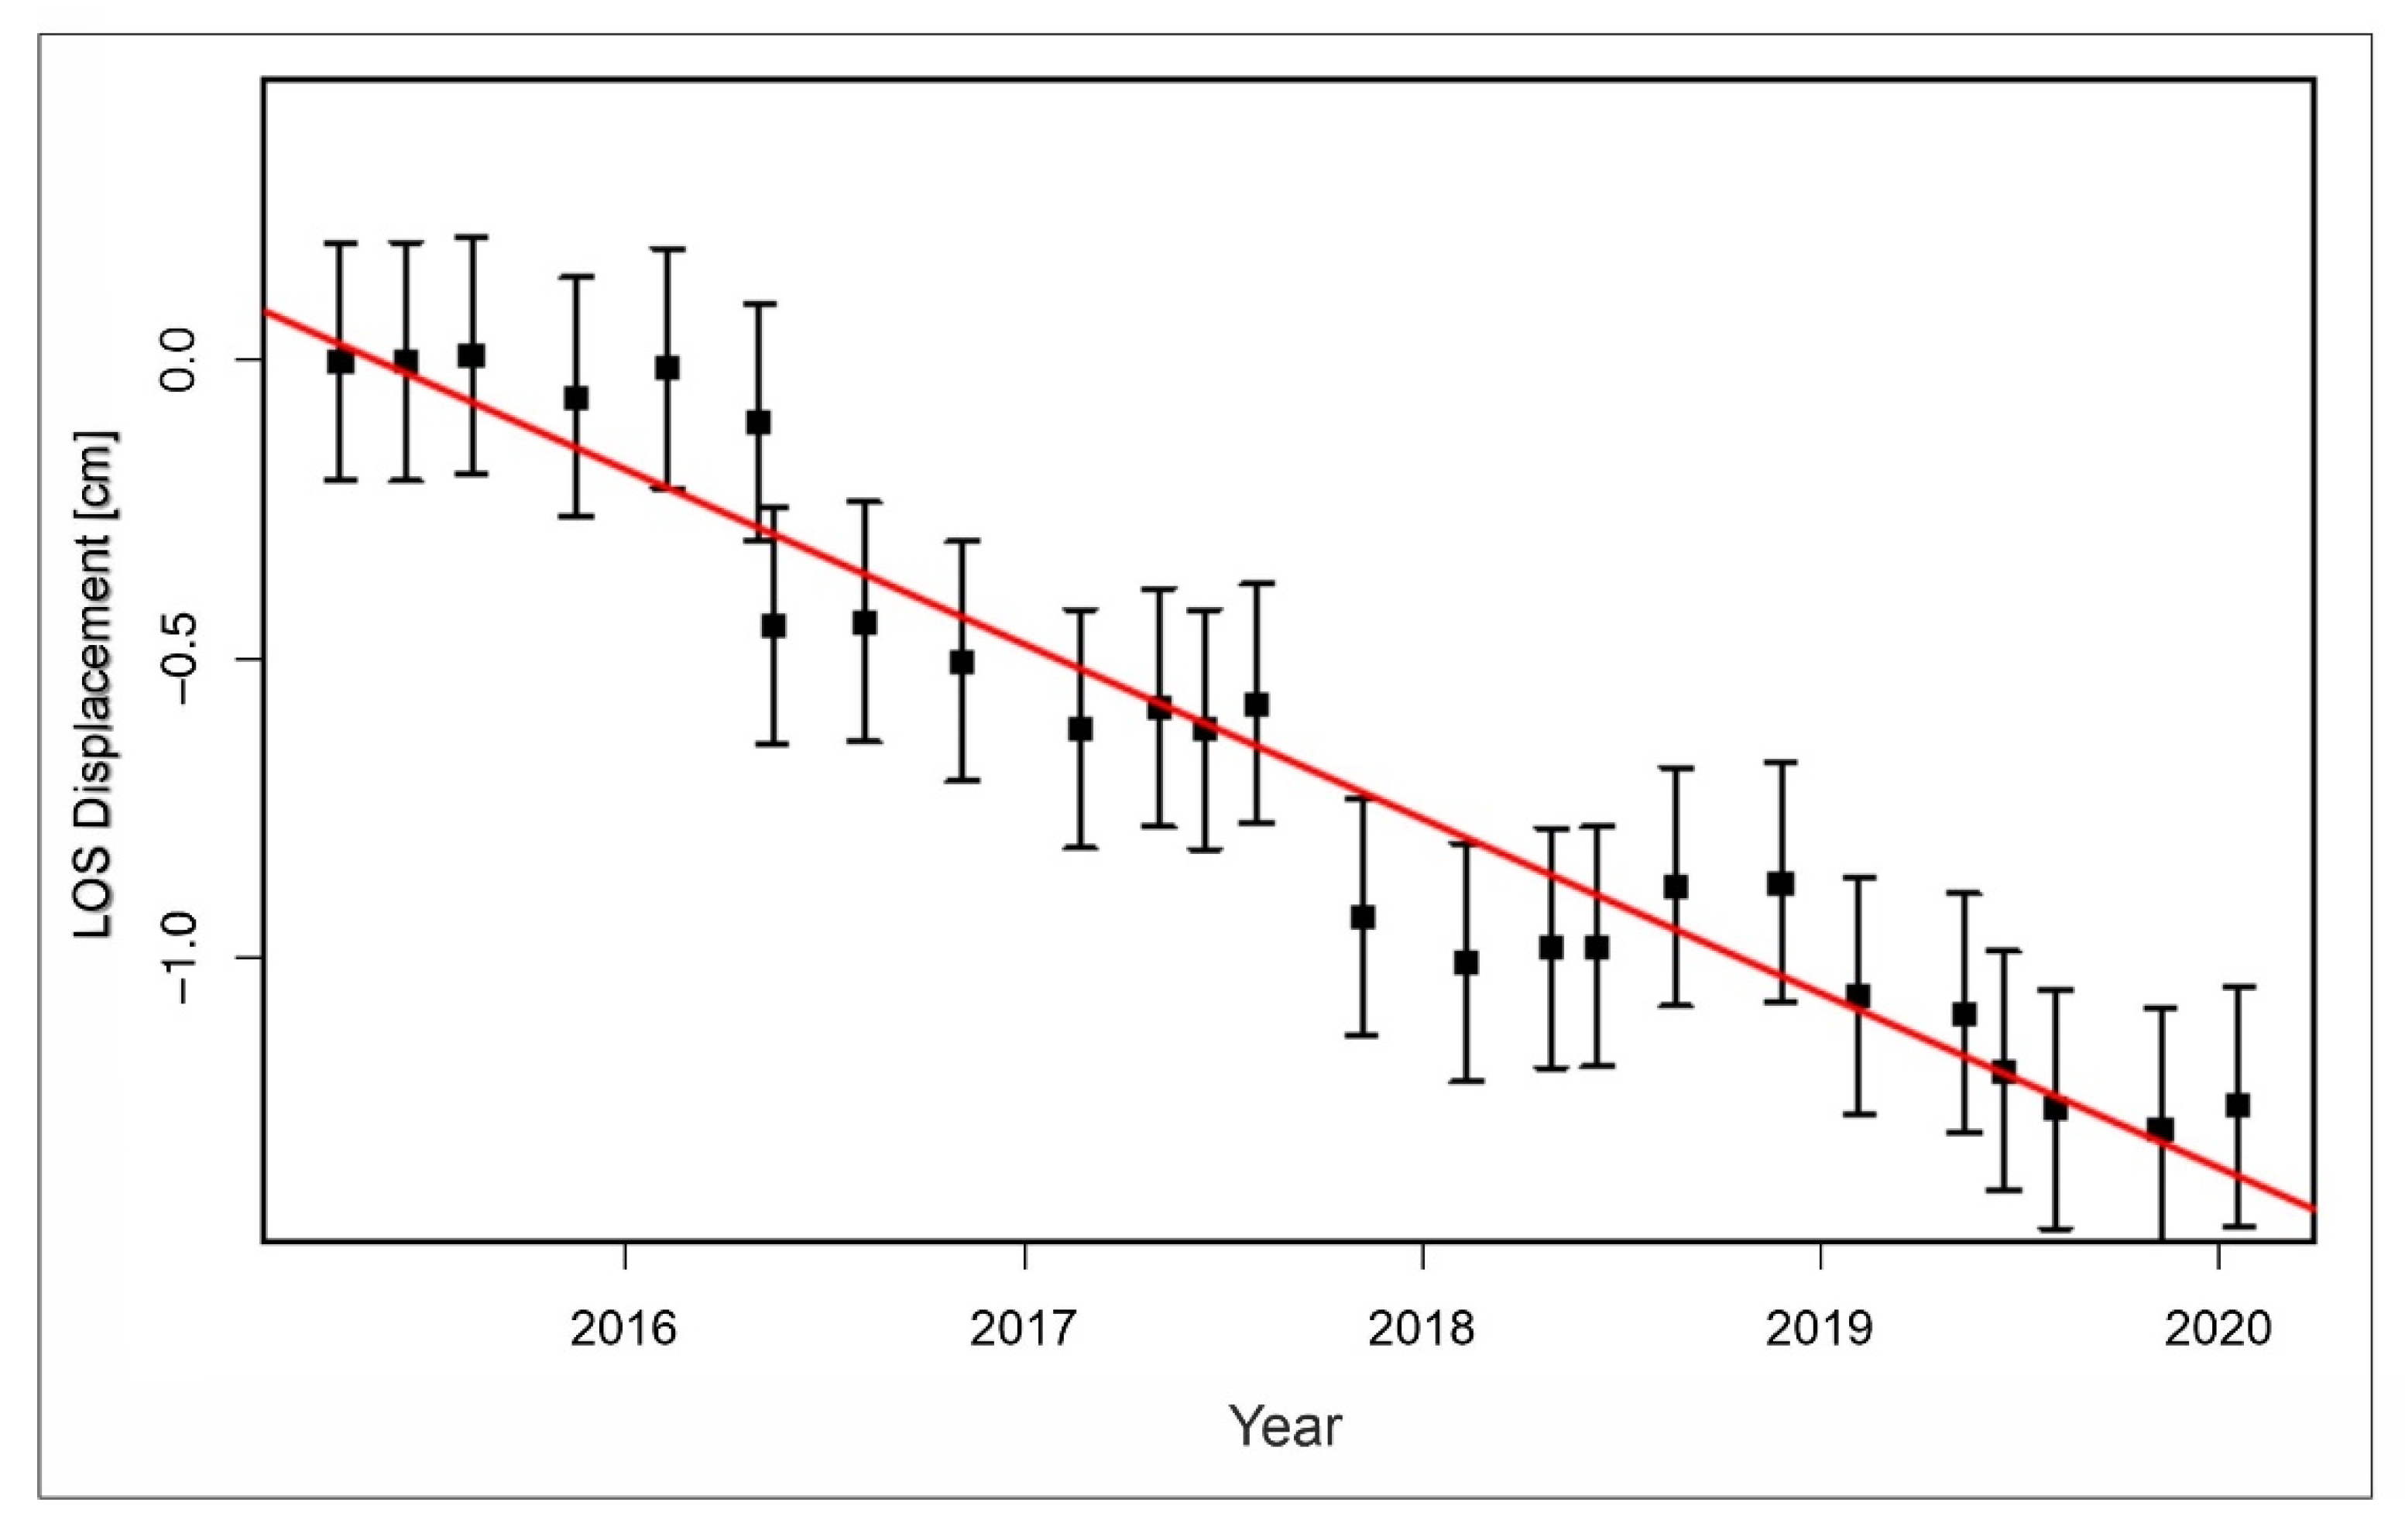
Regarding the present displacements estimated with InSAR techniques, we show that the velocity of the slope movement is in the limit of our DInSAR analysis sensitivity. We set a very high coherence threshold (95%) in order to enhance the accuracy of our measurements, reducing the error range to 2 mm/yr. This means that we cannot recognize movements with velocities below 2 mm/yr. The maximum LOS velocity measured in the landslide is 4 mm/yr, while many points are just above 2 mm/yr and some are below this value. The pattern of the measured velocities seems to indicate that the entire limestone block is moving but at a very low speed, just above our measurement accuracy (Figure 13). The total LOS displacement during 4.7 years was on average ~1 cm, almost unnoticeable. The magnitude of the movements is so low that the temporal variations observed in the time series cannot be defined as accelerations or reductions of the displacement rate, being within the error range (Figure 14). Therefore, we lack sufficient accuracy in the actual measurements to link the movements with triggering factors such as rainfall or seismic events.

5. Discussion

5.1. Relationship between Chgega Landslide and the Geological Structure

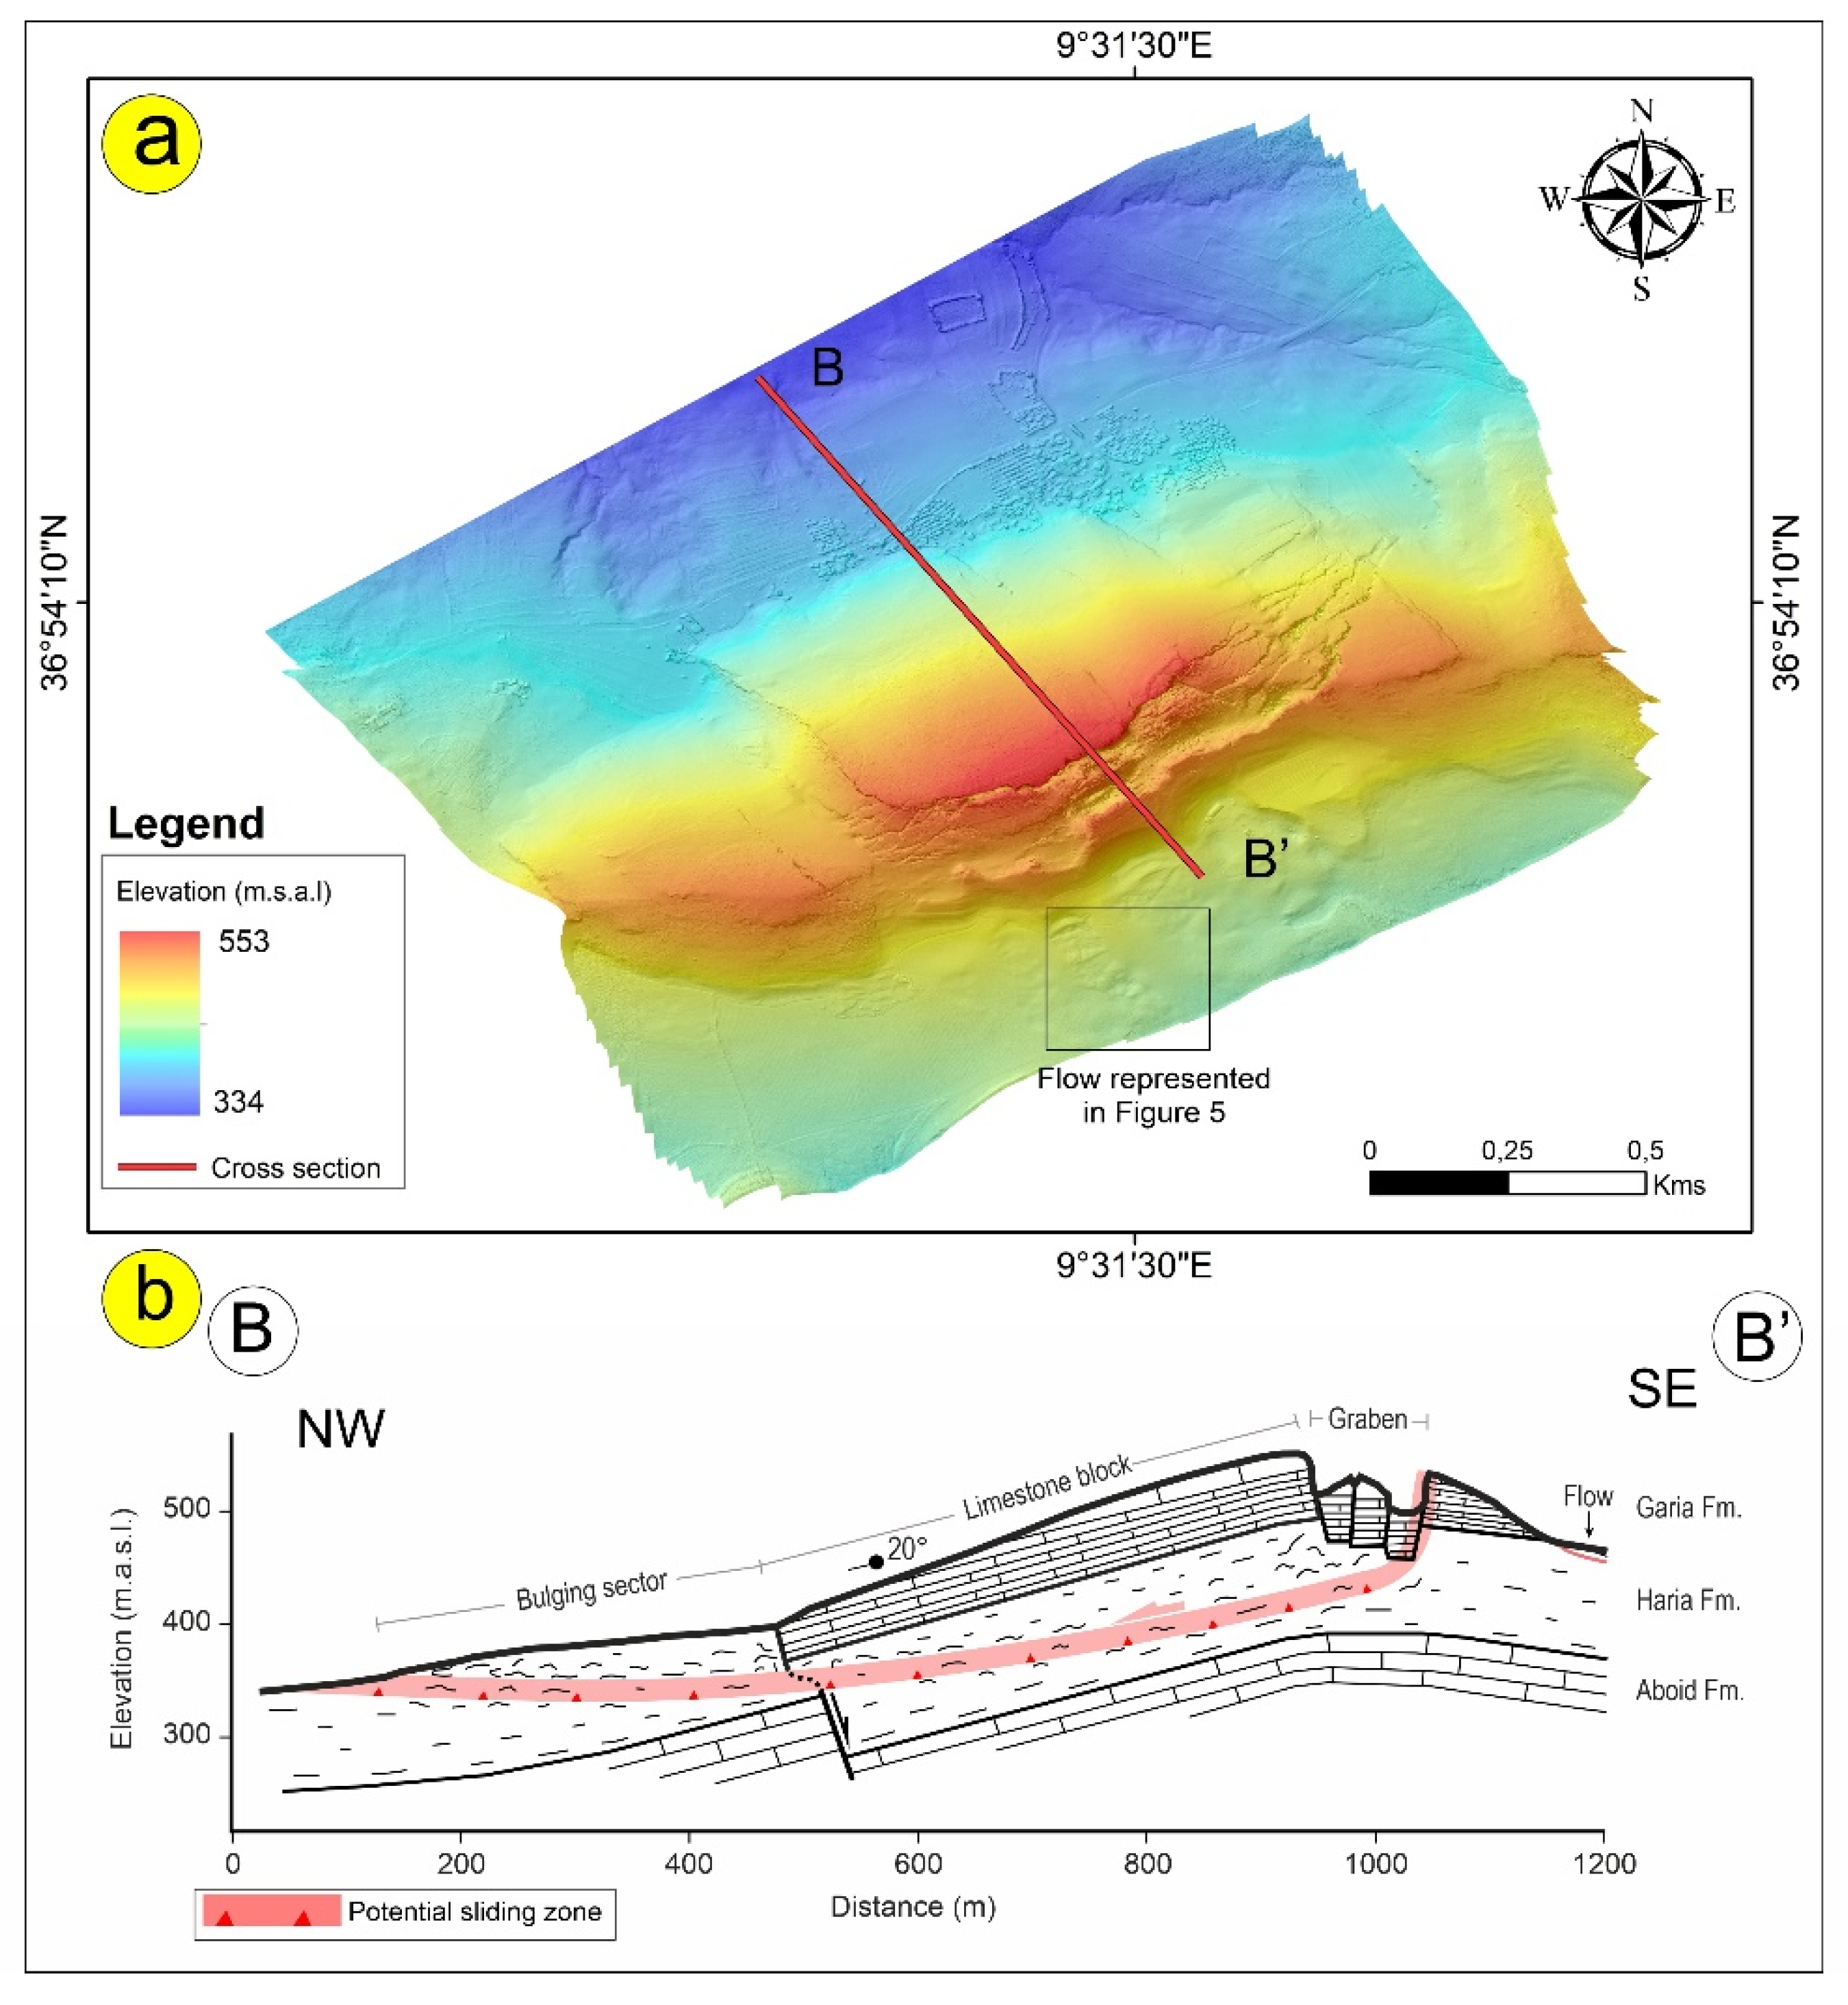
The area where the Chgega landslide is located presents a hilly landscape configured by NE-SW trending bands of clays and marls of the Haria formation and limestones of the Garia Formation. The former form valleys and the latter form ridges. These alternations are due to the interference of two different types of structures—earlier NE-SW trending folds and more recent normal faults—that cut the series parallel to the previous fold axes [31]. The bands are further cut by a system of NW-SE trending normal faults. Finally, all these structures are cut by WNW-ESE to NW-SE dextral fault segments of the Dhkila fault´s northwestern splay termination (Figure 2). The lithologies cropping out in the area, along with all these faults and folds, clearly determine the development of the Chgega landslide. First, the common configuration of rock spreads described by Pasuto and Soldati [3] is present: rigid rock masses (Garia Formation limestones) cap ductile terrains, such as clays and the marls of the Haria Formation [61] (Figure 15). Second, the activity of the NE-SW normal fault system cut and tilted towards the NW the previously folded Garia limestone unit, producing the currently unfavorable conditions of slope instability, with the bedding inclined parallel to the hillslope (Figure 15). Third, these blocks are also configured by a different transverse set of NW-SE faults that appear to guide the movement of the main block. This block shows a motion towards 330° in correspondence with the N145°E direction of the mentioned faults (Figure 12). Such an effect would explain the decoupling between the line of maximum slope and the movement orientation inferred from open joints, as observed in the SW sector of the landslide.
We infer that the viscoplastic creep of the clay terrains of the Haria Formation subjacent to the limestones with 20° dip to the NW permitted the lateral expansion of the latter, creating the large graben in the landslide crown as well as the bulge at its toe—two typical features of rock spreading according to Pasuto and Soldati [3] (Figure 15). The failure plane would accordingly be located inside the Haria Formation and may crop out alongside the boundary of the bulge observed in the landslide toe (Figure 8 and Figure 15). Therefore, it appears that (1) the soft terrains of the Haria Formation are the ones that have failed; (2) their movement caused the fracturing process of the Garia limestone, producing the graben of the landslide crown and the individualization of a large limestone block; and (3) this limestone block was initially set in motion, i.e., dragged, by the underlying clay and marls to eventually become part of the slide mass (Figure 15).
Punctual events or periods of extreme rainfall often trigger or reactivate this kind of mass movement. The consulted paleoclimate data [44,45,46] indicate that the general climatic conditions prevailing were more humid than at present, a factor that may play a key role in the activation of the Chgega landslide. Yet neither this information nor our InSAR time series can demonstrate a direct relationship between precipitation and the Chgega landslide occurrence. On the other hand, Gaidi et al. [2] suggested there may be a relationship between the seismicity of the Dhkila fault and the initial opening of the Chgega joints. This is actually not a far-fetched hypothesis, because the map of Soumaya et al. [39] (Figure 4) demonstrates that the Chgega landslide is in a high seismic hazard region, surrounded by active faults, the closest being the Dhkila fault. Hence, the main open-fracture system bounding the landslide coincides with the directions of the Dhkila fault segments, having open tension joints trending N30–60°E, parallel to the direction of reverse faults and folds affecting Quaternary sediments in the region. These open joints are moreover linked by sinistral N130–150°E fractures, parallel to the main dextral Dhkila fault segments (Figure 2). Further research is needed to correlate the landslide origin with the regional seismicity.

5.2. Motion Detected in Chgega and in Other Similar Landslide

The Chgega landslide has been moving at a little more than 2 mm/yr under the climatic conditions of the analyzed period (2015–2020). Although this is an extremely low velocity, it is in accordance with the velocities measured for other similar landslides, as for example, Crosta et al. [62] reported in the Alps. These authors show that most (75%) of the DGSD analyzed had a velocity below 5 mm/yr. Specifically, DGSDs developed in a geological setting similar to Chgega, with carbonate units overlying soft terrains, also show extremely slow motion. Delgado et al. [63] measured by InSAR rates resembling that of Chgega (2–4 mm/yr) in a compound rotational DGSD of large dimensions in the Sierra de Aitana (Spain). Mateos et al. [17] reported an average velocity of the same order of magnitude (5.2 mm/yr) in a large lateral spreading along the North coast of Majorca (Spain). Extensive lateral spreading and block sliding processes in a geological setting comparable to the Chgega landslide have been under investigation since 2006 in the North part of Malta [8,9,64,65,66]. In this area, long-term differential GNSS monitoring outputs carried out gave displacement rates between 0.8 and 2.4 cm/yr in a limestone plateau affected by lateral spreads and downslope blocks moved from block slides [64]. InSAR analysis of ERS and Envisat satellite images covering a 20-year period measured, in the same area, velocities of less than 7 mm/yr [65]. A comparison of our InSAR results with those of the cited studies confirms that the extremely slow motion identified in the Chgega landslide is not unusual for mass movements of its kind. Further research on Chgega, in greater detail, is required to determine if the observed motion is constant or if it changes due to external factors.

5.3. Significance of the Chgega Landslide

The Chgega landslide is an important spot for the landslide scientist community because it shows a paradigmatic rock spreading process in its crown. This type of landslide can be easily understood in places like Chgega given its dimensions and the fresh appearance of its morphological features. Good outcrops—that is, easily recognizable ones of convenient access—can be key to controlling movement magnitudes; such features make Chgega a potential natural laboratory for the study of these phenomena.
Chgega could also be a key place to analyze paleoseismicity in northern Tunisia. For this reason, the study of the relationship between this landslide with earthquakes must be addressed, as has been done in other DGSD (see, for example, the research of Gutiérrez et al. in the Pyreness [67]). New detailed analyses putting the focus on the recognition of features that evidence some participation of seismic shaking in the origin and in the displacement of the complex landslide must be developed. Once these features are found, their study using geochronological methods could offer useful information about the earthquake recurrence in a given region.
As we brought out in the “Introduction” section, significant rock spreading phenomena tend to become symbols for local cultures, and some of them have become geosites. In our opinion, Chgega is a sound candidate for geosite status. In addition to all the characteristics mentioned above, Chgega is interesting from an ecological viewpoint, since the graben creates local conditions permitting the presence of particular plant and animal species. It stands as a refuge for species not well adapted to the arid environment of the region and offers nesting cliffs for diverse raptors. The cultural significance of this place and the archaeological remains found there are likely to attract the attention of researchers in the near future. Chgega has many facets and all of them make it a special place deserving study and protection.

6. Conclusions

The Chgega landslide represents a spectacular example of a lateral spread that evolves into a block slide when a large block of limestone from the Garia Formation slides over the ductile clays and marls from the Haria Formation. For the presence of two different landslide mechanisms, this large landslide can be also classified as a complex landslide. The most prominent gravity-induced landform is a large graben ~800 m long and ~120 m wide that breaks the summit of the Chgega Mountain creating a double ridge. This landslide is currently active and shows a progressive movement without clear episodic accelerations. InSAR measurements show extremely slow speed, just above 2 mm/yr, with maximums of 4 mm/yr. The movement has an orientation towards 333° of azimuth; it is conditioned by the geological structure of the Chgega Mountain and more specifically by the normal faults with directions N060°E and N140–150°E that crosscut it. The latter fault system appears to guide the displacement of the main rock block. Further investigations are needed to elucidate why this large-scale movement was produced in a region of low relief and to determine the relationship between the landslide itself and the overall seismic activity of the region. Moreover, the presence of this large graben and several cavities make it a good candidate for becoming a geosite. The 3D model developed for this study could be used in future geological and paleoseismological investigations as well as to explain and divulge the unique landscape created by this large landslide.

Author Contributions

Conceptualization, S.G., J.P.G., F.M., and G.B.-R.; methodology, S.G., J.P.G., F.M., P.R., C.R.-C., W.M., H.C., J.V.P.-P., and G.B.-R.; resources, S.D., F.Z., W.M., and J.M.A.; formal analysis, S.G., J.P.G., F.M., P.R., C.R.-C., and G.B.-R.; writing—original draft, S.G., J.P.G., and G.B.-R.; supervision, G.B.-R.; project administration, J.P.G., F.M., W.M., and J.M.A.; funding acquisition, J.P.G., F.M., W.M., S.D., J.M.A., and G.B.-R.; writing—review and editing, all authors. All authors have read and agreed to the published version of the manuscript.

Funding

This research was funded by very different sources. The work of J.P.G., P.R., J.V.P.-P., J.M.A., and G.B.-R. was supported by the “Ramón y Cajal” Programme (RYC-2017-23335) of the Spanish Ministry of Science, the project “MORPHOMED”-PID2019-107138RB-I00/SRA (State Research Agency/10.13039/501100011033) and the project “RADANDALUS” (P18-RT-3632), and B-RNM-305-UGR1818 of the FEDER/Junta de Andalucía-Consejería de Transformación Económica, Industria, Conocimiento y Universidades. The access to the Geohazard Exploitation Platform (GEP) of the European Space Agency (ESA) was provided by the Early Adopters Programme. The UAV campaign was carried out with the financial support of the company “Falck Group” (Italy). This study was supported by research projects CGL2015-67130-C2-1-R, Erasmus Mundus External Cooperation Window, and by Scientific Cooperation Agreement 0534 between the Office National des Mines (ONM), the Tunis el Manar University, and the Group for Relief and Active Processes Analysis (ARPA) from the University of Granada.

Data Availability Statement

Data available on request.

Acknowledgments

We would like to thank the three anonymous reviewers for their constructive suggestions and comments.

Conflicts of Interest

The authors declare no conflict of interest.

References

  1. Aslan, G.; De Michele, M.; Raucoules, D.; Bernardie, S.; Cakir, Z. Transient motion of the largest landslide on earth, modulated by hydrological forces. Sci. Rep. 2021, 11, 1–12. [Google Scholar] [CrossRef]
  2. Gaidi, S.; Carmona, C.R.; Arnedo, J.P.G.; Pérez, J.V.; Melki, F.; Guillermo, B.R.; Jabaloy, A.; Marzougui, W.; Azañón, J.M. Paradigmatic Examples of Lateral Spreading Phenomena in the Betic-Rif and Maghrebian Chains. In Conference of the Arabian Journal of Geosciences; Springer: Cham, Switzerland, 2019; pp. 263–266. [Google Scholar] [CrossRef]
  3. Pasuto, A.; Soldati, M. 7.25 Lateral Spreading. Treatise Geomorphol. 2013, 7, 239–248. [Google Scholar] [CrossRef]
  4. Hungr, O.; Leroueil, S.; Picarelli, L. The Varnes classification of landslide types, an update. Landslides 2014, 11, 167–194. [Google Scholar] [CrossRef]
  5. Halliday, G.S.; McKelvey, R.J. Video-analysis of an extremely rapid rockslope failure, Nevis Bluff, New Zealand. In Landslides: Evaluation and Stabilization; Taylor & Francis Group: London, UK; 2004, pp. 1355–1360. Available online: http://old.geosolve.co.nz/assets/publication-articles/Video-analysis-of-an-extremely-rapid-rockslope-failure-Nevis-Bluff-New-Zealand.pdf (accessed on 28 August 2021).
  6. Lenart, J.; Pánek, T.; Dušek, R. Genesis, types and evolution of crevice-type caves in the flysch belt of the Western Carpathians (Czech Republic). Geomorphology 2014, 204, 459–476. [Google Scholar] [CrossRef]
  7. Pánek, T.; Hradecký, J.; Smolková, V.; Šilhán, K. Gigantic low-gradient landslides in the northern periphery of the Crimean Mountains (Ukraine). Geomorphology 2008, 95, 449–473. [Google Scholar] [CrossRef]
  8. Soldati, M.; Devoto, S.; Prampolini, M.; Pasuto, A. The spectacular landslide-controlled landscape of the northwestern coast of Malta. In Landscapes and Landforms of the Maltese Islands; Gauci, R., Schembri, J.A., Eds.; Springer: Cham, Switzerland, 2019; pp. 167–178. [Google Scholar]
  9. Devoto, S.; Hastewell, L.J.; Prampolini, M.; Furlani, S. Dataset of Gravity-Induced Landforms and Sinkholes of the Northeast Coast of Malta (Central Mediterranean Sea). Data 2021, 6, 81. [Google Scholar] [CrossRef]
  10. Di Maggio, C.; Madonia, G.; Vattano, M. Deep-seated gravitational slope deformations in western Sicily: Controlling factors, triggering mechanisms, and morphoevolutionary models. Geomorphology 2014, 208, 173–189. [Google Scholar] [CrossRef]
  11. Iotti, A.; Tarchiani, U. Notes on Some Lateral Spreading Phenomena around Roccalbegna-Mt.Labbro (Tuscany, Italy). Geogr. Fis. E Din. Quat. 1996, 19, 343–349. [Google Scholar]
  12. Fenton, C.; Martin, P.; Cheng, F.; Murphy, B. Geomorphological Analysis of Large Scale Slope Instability, Trotternish, Isle of Skye. In Engineering Geology for Society and Territory; Lollino, G., Giordan, D., Crosta, G.B., Corominas, J., Azzam, R., Wasowski, J., Sciarra, N., Eds.; Springer: Cham, Switzerland, 2015; Volume 2, pp. 1037–1040. [Google Scholar]
  13. Cooper, R.G. Mass movement caves in Great Britain. Stud. Speleol. 1983, 4, 37–44. [Google Scholar]
  14. Galve, J.P.; Carrión, M.; Carmona, C.R.; Gaidi, S.; Booth-Rea, G.; Sánchez, A.J.; Ruano, P.; Peña, J.V.P.; Hernández, J.M.A.; Melki, F. Formas del relieve generadas por fenómenos de expansión lateral y deslizamiento de bloques: De fortalezas naturales y lugares sagrados a valiosos recursos arqueológicos y paisajísticos. In Proceedings of the XV Reunión Nacional de Cuaternario Bizkaia Aretoa, Bilbao, Spain, 1–5 July 2019; pp. 406–409. [Google Scholar]
  15. Camafort, M.; Pérez-Peña, J.V.; Booth-Rea, G.; Melki, F.; Gràcia, E.; Azañón, J.M.; Galve, J.P.; Marzougui, W.; Gaidi, S.; Ranero, C.R. Active tectonics and drainage evolution in the Tunisian Atlas driven by interaction between crustal shortening and mantle dynamics. Geomorphology 2020, 351, 106954. [Google Scholar] [CrossRef]
  16. Cigna, F.; Banks, V.J.; Donald, A.W.; Donohue, S.; Graham, C.; Hughes, D.; McKinley, J.M.; Parker, K. Mapping ground instability in areas of geotechnical infrastructure using satellite InSAR and Small UAV surveying: A case study in Northern Ireland. Geosciences 2017, 7, 51. [Google Scholar] [CrossRef] [Green Version]
  17. Mateos, R.M.; Ezquerro, P.; Azañón, J.M.; Gelabert, B.; Herrera, G.; Fernández-Merodo, J.A.; Spizzichino, D.; Sarro, R.; García-Moreno, I.; Béjar-Pizarro, M. Coastal lateral spreading in the world heritage site of the Tramuntana Range (Majorca, Spain). The use of PSInSAR monitoring to identify vulnerability. Landslides 2018, 15, 797–809. [Google Scholar] [CrossRef]
  18. Martins, B.H.; Suzuki, M.; Yastika, P.E.; Shimizu, N. Ground Surface Deformation Detection in Complex Landslide Area—Bobonaro, Timor-Leste—Using SBAS DInSAR, UAV Photogrammetry, and Field Observations. Geosciences 2020, 10, 245. [Google Scholar] [CrossRef]
  19. Fonseca, A.F.d.P.S.C. Large Deep-Seated Landslides in the Northern Rif Mountains (Northern Morocco): Inventory and Analysis; Universidade de Lisbona 170. PhD diss. 2014. Available online: http://hdl.handle.net/10451/15604 (accessed on 1 March 2021).
  20. Beladam, O.; Balz, T.; Mohamadi, B.; Abdalhak, M. Using PS-InSAR with Sentinel-1 images for deformation monitoring in northeast Algeria. Geosciences 2019, 9, 315. [Google Scholar] [CrossRef] [Green Version]
  21. Laribi, A.; Walstra, J.; Ougrine, M.; Seridi, A.; Dechemi, N. Use of digital photogrammetry for the study of unstable slopes in urban areas: Case study of the El Biar landslide, Algiers. Eng. Geol. 2015, 187, 73–83. [Google Scholar] [CrossRef]
  22. Bounab, A.; El Kharim, Y.; El Hamdouni, R.; Hlila, R. A multidisciplinary approach to study slope instability in the Alboran Sea shoreline: Study of the Tamegaret deep-seated slow-moving landslide in Northern Morocco. J. Afr. Earth Sci. 2021, 184, 104345. [Google Scholar] [CrossRef]
  23. Frizon De Lamotte, D.F.; Saint Bezar, B.; Bracène, R.; Mercier, E. The two main steps of the atlas building and geodynamics of the Western Mediterranean. Tectonics 2000, 19, 740–761. [Google Scholar] [CrossRef]
  24. Khomsi, S.; Ghazi, M.; Jemia, B.; Frizon, D.; Lamotte, D.; Maherssi, C.; Echihi, O.; Mezni, R.; Ben Jemia, M.G.; de Lamotte, D.F.; et al. An overview of the Late Cretaceous–Eocene positive inversions and Oligo-Miocene subsidence events in the foreland of the Tunisian Atlas: Structural style and implications for the tectonic agenda of the Maghrebian Atlas system. Tectonophysics 2009, 475, 38–58. [Google Scholar] [CrossRef]
  25. DeCelles, P.G.; Giles, K.A. Foreland basin systems. Basin Res. 1996, 8, 105–123. [Google Scholar] [CrossRef]
  26. Babault, J.; Van Den Driessche, J.; Teixell, A. Longitudinal to transverse drainage network evolution in the High Atlas (Morocco): The role of tectonics. Tectonics 2012, 31, 1–15. [Google Scholar] [CrossRef] [Green Version]
  27. Melki, F.; Zouaghi, T.; Harrab, S.; Sainz, A.C.; Bédir, M.; Zargouni, F. Structuring and evolution of Neogene transcurrent basins in the Tellian foreland domain, north-eastern Tunisia. J. Geodyn. 2011, 52, 57–69. [Google Scholar] [CrossRef]
  28. Gaidi, S.; Booth-Rea, G.; Melki, F.; Marzougui, W.; Ruano, P.; Pérez-Peña, J.V.; Azañón, J.M.; Zargouni, F.; Chouaieb, H.; Galve, J.P. Active fault segmentation in Northern Tunisia. J. Struct. Geol. 2020, 139, 104146. [Google Scholar] [CrossRef]
  29. Burollet, P.F. Contribution à l’étude stratigraphique de la Tunisie centrale. Ann. Mines Géol. 1956, 18, 350. [Google Scholar]
  30. Rouvier, H. Gelogie de l’Extreme-Nord tunisien: Tectoniques et paleogeographies superposees a l’extremite orientale de la chaine nord-maghrebine. These Dr. Es Sc. Univ. Pierre Marie Curie. 1977. Available online: https://ci.nii.ac.jp/naid/20000798171 (accessed on 1 March 2021).
  31. Cohen, C.R.; Schamel, S.; Boyd-Kaygi, P. Neogene deformation in northern Tunisia: Origin of the eastern Atlas by microplate—Continental margin collision. Geol. Soc. Am. Bull. 1980, 91, 225–237. [Google Scholar] [CrossRef]
  32. Fournet, A.; Lajmi, T.; Pini, S. Carte géologique de la Tunisie au 1/50.000, la feuille n° 12 de Mateur. Off. Natl. Des Mines Tunis Tunisie. 1994. Available online: www.onm.nat.tn (accessed on 1 March 2021).
  33. Batik, P. Carte géologique de la Tunisie au 1/50.000, la feuille n° 11 de Hedhil. Off. Natl. Des Mines Tunis Tunisie. 1980. Available online: www.onm.nat.tn (accessed on 1 March 2021).
  34. Biely, A.; Maamouri, M.; Stranik, Z. Carte géologique de la Tunisie au 1/50.000, la feuille n° 18 de Beja. Off. Natl. Des Mines Tunis Tunisie. 1982. Available online: www.onm.nat.tn (accessed on 1 March 2021).
  35. Fournet, A.; Zargouni, F.; Burollet, P.F.; Dalmerac, B. Carte Géologique de la Tunisie au 1: 50 000, Feuille no 19, Tébourba éd. Serv. Géol., Tunis. 1999. Available online: www.onm.nat.tn (accessed on 1 March 2021).
  36. Mejri, L.; Regard, V.; Carretier, S.; Brusset, S.; Dlala, M. Evidence of Quaternary active folding near Utique (Northeast Tunisia) from tectonic observations and a seismic profile. Comptes Rendus—Geosci. 2010, 342, 864–872. [Google Scholar] [CrossRef]
  37. Bahrouni, N.; Bouaziz, S.; Soumaya, A.; Ben Ayed, N.; Attafi, K.; Houla, Y.; El Ghali, A.; Rebai, N. Neotectonic and seismotectonic investigation of seismically active regions in Tunisia: A multidisciplinary approach. J. Seismol. 2014, 18, 235–256. [Google Scholar] [CrossRef]
  38. Kharrat, S.; Harbi, A.; Meghraoui, M.; Bouaziz, S. The Tunisian Homogenized Macroseismic Database (Second Century–1981): First Investigations. Seismol. Res. Lett. 2018, 90, 347–357. [Google Scholar] [CrossRef]
  39. Soumaya, A.; Ben Ayed, N.; Khayati Ammar, H.; Tayech, M.; Ghanmi, M. Seismotectonic and seismic hazard map of Tunisia. In Proceedings of the AGU Fall Meeting Abstracts, San Francisco, CA, USA, 12–16 December 2016; Volume 2016, pp. T13A–2672. Available online: www.researchgate.net/publication/311740643_Seismotectonic_and_Seismic_Hazards_Map_of_Tunisia (accessed on 1 March 2021).
  40. Kujawski, H. Resultats de nouvelles observations a l’est des Hedil (Tunisie septentrionale). Bull. La Société Géologique Fr. 1967, 7, 735–740. [Google Scholar] [CrossRef]
  41. Marzougui, W.; Melki, F.; Arfaoui, M.; Houla, Y.; Zargouni, F. Major faults, salt structures and paleo-ridge at tectonic nodes in Northern Tunisia: Contribution of tectonics and gravity analysis. Arab. J. Geosci. 2014, 8, 7601–7617. [Google Scholar] [CrossRef]
  42. Atawa, M.; Boukerbout, H.; Zouaghi, T.; Mzali, H.; Saibi, H.; Abtout, A. Interpretation of gravity data using 3D inversion and 2D continuous wavelet transform in Hedil deformed structures, northern Tunisia. J. Afr. Earth Sci. 2019, 151, 371–390. [Google Scholar] [CrossRef]
  43. Booth-Rea, G.; Gaidi, S.; Melki, F.; Marzougui, W.; Azañón, J.M.; Zargouni, F.; Galvé, J.P.; Pérez-Peña, J. V Late Miocene Extensional Collapse of Northern Tunisia. Tectonics 2018, 37, 1626–1647. [Google Scholar] [CrossRef]
  44. Paskoff, R.; Sanlaville, P. Oscillations climatiques en Tunisie littorale depuis le dernier interglaciaire jusqu’au début de l’Holocène. Quaternaire 1986, 23, 78–83. [Google Scholar] [CrossRef]
  45. Leveau, P. Phénomènes météorologiques extrêmes et stratégies d’adaptation urbaine au Maghreb durant les premiers siècles de l’ère. In Var. environnementales, Mutat. Soc. nature, intensités, échelles temporalités des Chang. XXXIIe rencontres internationales d’archéologie et d’histoire d’Antibes Sous la direction; de Bertoncello, F., et Braemer, F., Eds.; Éditions APDCA: Antibes, France, 2012; pp. 221–232. [Google Scholar]
  46. Brun, A. Microflores et paléovégétations en Afrique du Nord depuis 30 000 ans. Bull. La Société Géologique Fr. 1989, 1, 25–33. [Google Scholar] [CrossRef]
  47. Ullman, S. The Interpretation of Visual Motion; Massachusetts Institute of Technology Pr: Oxford, UK, 1979; ISBN 026221007X. [Google Scholar]
  48. Seitz, S.M.; Curless, B.; Diebel, J.; Scharstein, D.; Szeliski, R. A comparison and evaluation of multi-view stereo reconstruction algorithms. In Proceedings of the 2006 IEEE Computer Society Conference on Computer Vision and Pattern Recognition (CVPR’06), Washington, DC, USA, IEEE; 2006; Volume 1, pp. 519–528. [Google Scholar] [CrossRef]
  49. Lowe, D.G. Object recognition from local scale-invariant features. In Proceedings of the Seventh IEEE International Conference on Computer Vision, IEEE; 1999; Volume 2, pp. 1150–1157. [Google Scholar] [CrossRef]
  50. Semyonov, D. Algorithms used in photoscan. In Proceedings of the Agisoft PhotoScan Forum; 2011; Volume 3. Available online: www.agisoft.com/forum/index.php?topic=89.0 (accessed on 1 March 2021).
  51. Casu, F.; Elefante, S.; Imperatore, P.; Zinno, I.; Manunta, M.; De Luca, C.; Lanari, R. SBAS-DInSAR parallel processing for deformation time-series computation. IEEE J. Sel. Top. Appl. Earth Obs. Remote Sens. 2014, 7, 3285–3296. [Google Scholar] [CrossRef]
  52. De Luca, C.; Cuccu, R.; Elefante, S.; Zinno, I.; Manunta, M.; Casola, V.; Rivolta, G.; Lanari, R.; Casu, F. An on-demand web tool for the unsupervised retrieval of earth’s surface deformation from SAR data: The P-SBAS service within the ESA G-POD environment. Remote Sens. 2015, 7, 15630–15650. [Google Scholar] [CrossRef] [Green Version]
  53. Manunta, M.; De Luca, C.; Zinno, I.; Casu, F.; Manzo, M.; Bonano, M.; Fusco, A.; Pepe, A.; Onorato, G.; Berardino, P. The parallel SBAS approach for sentinel-1 interferometric wide swath deformation time-series generation: Algorithm description and products quality assessment. IEEE Trans. Geosci. Remote Sens. 2019, 57, 6259–6281. [Google Scholar] [CrossRef]
  54. Notti, D.; Herrera, G.; Bianchini, S.; Meisina, C.; García-Davalillo, J.C.; Zucca, F. A methodology for improving landslide PSI data analysis. Int. J. Remote Sens. 2014, 35, 2186–2214. [Google Scholar] [CrossRef]
  55. Thiele, S.T.; Grose, L.; Samsu, A.; Micklethwaite, S.; Vollgger, S.A.; Cruden, A.R. Rapid, semi-automatic fracture and contact mapping for point clouds, images and geophysical data. Solid Earth 2017, 8, 1241–1253. [Google Scholar] [CrossRef] [Green Version]
  56. Erraioui, L. Environnements Sédimentaires Et Géochimie Des Séries De l’Eocène Du Nord-Est De La Tunisie, Tunis (Tunisia); Thése de doctorat de spécialité, Université Tunis II, 1994; 244p. [Google Scholar]
  57. Redhaounia, B.; Aktarakçi, H.; Ilondo, B.O.; Gabtni, H.; Khomsi, S.; Bédir, M. Hydro-geophysical interpretation of fractured and karstified limestones reservoirs: A case study from Amdoun region (NW Tunisia) using electrical resistivity tomography, digital elevation model (DEM) and hydro-geochemical approaches. J. Afr. Earth Sci. 2015, 112, 328–338. [Google Scholar] [CrossRef]
  58. Soldati, M. Deep-Seated Gravitational Slope Deformation. In Encyclopedia of Natural Hazards; Bobrowsky, P.T., Ed.; Springer: Dordrecht, The Netherlands, 2013; pp. 151–155. [Google Scholar]
  59. Pasuto, A.; Soldati, M. Rock Spreading. In Landslide Recognition: Identification, Movement and Courses; Dikau, R., Brunsden, D., Schrott, L., Ibsen, M.-L., Eds.; Wiley: Chichester, England, 1996; Pubblication No. 5; pp. 122–136. [Google Scholar]
  60. Ibsen, M.-L.; Brunsden, D.; Bromhead, E.; Collison, A. Block Slide. In Landslide Recognition: Identification, Movement and Courses; Dikau, R., Brunsden, D., Schrott, L., Ibsen, M.-L., Eds.; Wiley: Chichester, England, 1996; Pubblication No. 5; pp. 64–77. [Google Scholar]
  61. Bejaoui, H.; Aïfa, T.; Melki, F.; Zargouni, F. Structural evolution of Cenozoic basins in northeastern Tunisia, in response to sinistral strike-slip movement on the El Alia-Teboursouk Fault. J. Afr. Earth Sci. 2017, 134, 174–197. [Google Scholar] [CrossRef]
  62. Crosta, G.B.; Frattini, P.; Agliardi, F. Deep seated gravitational slope deformations in the European Alps. Tectonophysics 2013, 605, 13–33. [Google Scholar] [CrossRef]
  63. Delgado, J.; Vicente, F.; García-Tortosa, F.; Alfaro, P.; Estévez, A.; Lopez-Sanchez, J.M.; Tomás, R.; Mallorquí, J.J. A deep seated compound rotational rockslide and rock spread in SE Spain: Structural control and DInSAR monitoring. Geomorphology 2011, 129, 252–262. [Google Scholar] [CrossRef]
  64. Mantovani, M.; Devoto, S.; Forte, E.; Mocnik, A.; Pasuto, A.; Piacentini, D.; Soldati, M. A multidisciplinary approach for rock spreading and block sliding investigation in the north-western coast of Malta. Landslides 2013, 10, 611–622. [Google Scholar] [CrossRef]
  65. Mantovani, M.; Devoto, S.; Piacentini, D.; Prampolini, M.; Soldati, M.; Pasuto, A. Advanced SAR interferometric analysis to support geomorphological interpretation of slow-moving coastal landslides (Malta, Mediterranean Sea). Remote Sens. 2016, 8, 443. [Google Scholar] [CrossRef] [Green Version]
  66. Devoto, S.; Macovaz, V.; Mantovani, M.; Soldati, M.; Furlani, S. Advantages of using UAV digital photogrammetry in the study of slow-moving coastal landslides. Remote Sens. 2020, 12, 3566. [Google Scholar] [CrossRef]
  67. Gutiérrez, F.; Ortuño, M.; Lucha, P.; Guerrero, J.; Acosta, E.; Coratza, P.; Piacentini, D.; Soldati, M. Late Quaternary Episodic Displacement on a Sackung Scarp in the Central Spanish Pyrenees. Secondary Paleoseismic Evidence? Geodin. Acta 2008, 21, 187–202. [Google Scholar] [CrossRef] [Green Version]
Figure 1. Location of the Chgega landslide.
Remotesensing 13 04048 g001
Figure 2. Geological map based on existing 1:50,000 maps published by Office Nationale des Mines [32,33,34,35] and stratigraphic column of the Chgega landslide region.
Remotesensing 13 04048 g002aRemotesensing 13 04048 g002b
Figure 3. NW-SE cross-section highlighting the main structures of the study area (AA’). Position of AA’ is given in Figure 2.
Remotesensing 13 04048 g003
Figure 4. Seismic hazard of Tunisia according to Soumaya et al. [39].
Remotesensing 13 04048 g004
Figure 5. Landslide types observed in the region of Mateur. (A) Rockfall deposits at the foot of a scarp in the limestones of the Garia Formation. (B) Slow-moving flow developed in clays of the Haria Formation (Source: Google Earth™). (C,D) Orthoimage (C) and hillshade model (D) of a flow that occurred in a cereal crop adjacent to Chgega Mountain. Images obtained from the 3D model created in this study (see following sections for more details).
Remotesensing 13 04048 g005
Figure 6. Flow diagram of the UAV survey, 3D model production, and discontinuity investigations.
Remotesensing 13 04048 g006
Figure 7. Graphic explanation of the measures taken in the open joints of Chgega and the data treatment performed. According to the scheme, we measured two types of vectors, A and B. Vectors A point out the orientation of the movement but they are scarce. To analyze more information, we added vectors B to calculate vectors C, which are an approximation of the orientation of the movement. Finally, we calculated the A and C average vectors in each sector of the mass movement.
Remotesensing 13 04048 g007
Figure 8. Virtual oblique aerial views of Chgega landslide from the Southwest (A,B) and from the East (C,D). The main morphological features of the complex landslide and the geological structures are highlighted in B and D. G: Garia Formation; H: Haria Formation. The views were generated using the 3D model produced by means of SfM methods.
Remotesensing 13 04048 g008
Figure 9. Photographs of various sectors of the Chgega Mountain. (A) Open joints in the southwestern sector. (B) Deep trench in the northeastern sector. (C) Interior of the gravity-induced graben where tilted blocks and rockfall deposits are observed. (D) View of a deep open fracture from its bottom. (E) Entrance to crevice-type cavities. (F) Rock walls forming the boundary of the graben. The center cliff is formed by fault breccia. (G) Slickenside cropping out in the graben. (H) Deep open fracture in the eastern sector. (I,J) Main discontinuity sets observed in the Chgega Mountain. (K) Narrow passage through an open fracture.
Remotesensing 13 04048 g009
Figure 10. Stereonets of the main rock discontinuities observed in the Chgega Mountain (pole faults in circle and joints in triangle). The diagrams were elaborated on the basis of field measurements (A) and virtual measurements using a compass (B).
Remotesensing 13 04048 g010
Figure 11. (A) Map of the local relief of the Chgega surroundings. Local relief was calculated estimating the elevation range at 500 m of each point of the terrain. Note that Chgega shows the highest values in the ridge that define the limit between the Joumine and Tine River basins. (B) Map of the bulk erosion volume (proxy for maximum potential erosion) of the Chgega surroundings.
Remotesensing 13 04048 g011
Figure 12. Rose diagrams and orientation of the mean movement vectors for each sector of the Chgega landslide obtained through analysis of the open joints.
Remotesensing 13 04048 g012
Figure 13. LOS velocity map of the region of the Chgega Mountain using DINSAR. Note the movement detected in the Chgega landslide and in the northern slope of the hill adjacent to Tahint village.
Remotesensing 13 04048 g013
Figure 14. Time series of LOS displacement in the Chgega landslide.
Remotesensing 13 04048 g014
Figure 15. (a) High resolution DEM generated using UAV-DP technique and (b) BB’ detailed cross-section showing the Chgega Mountain.
Remotesensing 13 04048 g015
Publisher’s Note: MDPI stays neutral with regard to jurisdictional claims in published maps and institutional affiliations.