Abstract
The Pamir Plateau is an extremely important water resource area for over 60 million people in Central Asia. With the increasingly significant response of water resources to climate change, timely hydrological predictions for the future supply are necessary. In the plateau, accessing and monitoring the glaciers and their melt outflow are challenging due to the harsh geographic environments. Unmanned aerial vehicles (UAVs) combined with remote sensing technologies offer great potential for providing information to improve water resources management and decision-making. In this study, we integrated UAV and satellite remote sensing data, and applied a water balance model to estimate monthly and annual river discharges for the ten river sections in the Eastern Pamir Plateau, China from 1999 to 2020. We found that the glacier area in the controlled basins of these sections has decreased by approximately 63% from 1999 to 2020. Basins with smaller glacier areas are more sensitive to climate change. The ten river sections are characterized by decreasing trends in monthly river discharge, with an average reduction of −21.05%. The annual variation of total runoff and glacial meltwater discharge is consistent with the monthly variation of discharge, and the average discharge from glacier meltwater accounts for 83% of the total runoff. We conclude that the overall decreasing trend of discharge is closely related to the recession of glaciers. Under the background of climate warming in the region, glaciers are no longer sufficient to support the increase in river discharge, which has passed its peak value and shows a decreasing trend.
1. Introduction
During the past decades, freshwater scarcity has become an increasing threat to the sustainability of human society [1]. In its most recent annual risk report, the World Economic Forum listed water crises as the largest global risk in terms of potential impacts [2]. Rivers are the most vital freshwater resources. In many regions of the world, they are the only water source supporting local socioeconomic development. The quantification and monitoring of river discharge are important to the sustainable management of this valuable resource and the prediction of its future conditions.
In alpine regions, most rivers are fed by glaciers, which represent essential water reservoirs and thus contribute substantially to human society of the downstream oasis [3]. Glaciers are known to have a significant impact on the regional water cycle. As the global climate continues to warm, there is increasing evidence that glaciers have become most sensitive to regional climate change [4,5,6]. Studies in various regions of the world indicate that continuous warming affects the energy and mass balance of the glacier surface, causing significant melting of the glacier, leading to changes in regional hydrological processes [7,8,9,10]. However, the response of meltwater to climate change varies dramatically in different geographic environments. In the Himalayas, glaciers are shrinking due to climate warming, but river runoff is increasing, and high and low altitudes are more sensitive to climate change than moderate elevation areas [11]. The rapid melting of glaciers has also been observed in Peru, causing a complex impact on upstream hydrology, and reveals a declining contribution of meltwater to the watershed outflows [12]. A contrasting study in the Tian Shan–Pamir–Karakoram Mountain regions found that the glacier mass loss caused by climate change leads to different runoff changes on eastern and western slope basins, and runoff will more likely decrease in the future [6]. For river basins that are greatly affected by glacial meltwater, such as the Yellow River Basin, the Brahmaputra River Basin, and Tarim River Basin, runoff changes in the source area have a nonnegligible impact on the ecological environment in the downstream area [13,14]. As temperature rises, the accelerated melting of glaciers increases river runoff, which can provide more water resources to the downstream in the short term [12]. However, in the long run, the growth time is limited, and the continuous decline of glaciers makes the increase of glacier runoff unsustainable, which will eventually lead to a decrease or even depletion of runoff [15].
In recent years, research on when runoff changes from increasing to decreasing, and the response of glacier-fed river basins, has attracted great attention in related fields. Previous studies pointed out that the reduction of glacial meltwater runoff is not only related to the warming climate but also dependent on the glacier area, proportion, and the geographical location of the basin [16,17]. In basins with large glaciers, the time of runoff reduction may be delayed, while in low-latitude glacial basins dominated by small glaciers, runoff reduction has already occurred or is about to occur [18]. Huss and Hock [17] estimated the response of glacial runoff to climate change in 56 basins around the world under different climate scenarios based on the glacier mass balance model. They concluded that the glacial meltwater runoff showed a decreasing trend in 45% of basins but will tend to decrease in the next few decades in the rest of the basins. Zhao et al. [13] used downscaled climate data to predict the response of runoff to the future climate in the Yellow, Yangtze, Mekong, Salween, and Brahmaputra rivers. The results showed that the glacial meltwater runoff in the Yangtze River Basin is projected to decrease after the 2030s, while the glacial meltwater runoff in the source areas of the Yellow, Mekong, Salween, and Brahmaputra River basins began to decrease at the beginning of the 21st century. Under the background of global warming, understanding the long-term change characteristics of meltwater runoff and exploring its response to climate change have a practical significance.
The Pamir Plateau is a great source of snow and ice reserves and is the main freshwater provider to billions of people in Central Asia [19]. However, the future volume and change of the high mountain water resources, especially in the Pamir Plateau, is yet unclear in a warming climate [20]. The main reason might be the extremely complex landscapes such as high mountains, deep valleys, rush water, frequently damaged roads, and low oxygen, making it a great challenge to setting up monitoring stations. Therefore, the hydrological process of this area is also significantly different from other areas. Several recent studies have reported the mountain glacier/snow changes and their associated hydrological impacts on the Pamir Plateau [6,19,21,22,23], but most of them were conducted on large scales or single glaciers neglecting sub-basins located at the headwaters of rivers. Runoff changes in the headwater of rivers usually greatly impact the water mass and ecological environment of the downstream area. However, our current knowledge on the potential and complex effects of changes in the headwater on the downstream area is still limited. Therefore, it is necessary to investigate the runoff changes in the headwater of rivers for providing regionally applicable water management strategies as global water resources continue to be affected by climate warming.
In high-altitude areas, researchers are frequently faced with problems, such as sparse hydrometeorological stations and discontinuous data, which pose great challenges to hydrological simulation. In the past, the acquisition of time series river runoff data was mainly acquired through the establishment of hydrological stations for manual observation. However, many high-altitude areas lacked the basic conditions for establishing hydrological stations due to adverse factors such as complex landscapes [24]. Nowadays, remote sensing technology has been widely used in different fields due to its various advantages, such as fast data acquisition, rich data resources, and traceable historical information [25,26,27,28]. There have also been many remote sensing applications in river discharge monitoring. Gleason and Wang [29] obtained river width information from Landsat TM images and successfully estimated river discharge by using at-many-stations hydraulic geometry. Huang et al. [30] applied Landsat and Sentinel time series data to observe river width and water depth in the Upper Brahmaputra River, and calculated the discharge through the improved Manning formula. However, satellite remote sensing data have certain limitations, and the direct or indirect data acquisition of small-sized rivers is still challenging [31,32]. Instead, low-altitude UAVs can be used to quickly acquire high-resolution remote sensing data without time limitations and are easy to operate [33]. Zhao et al. [34] coupled high-resolution UAV and ground monitoring to fit the shape of the river-course cross-sections and estimated the discharge of small rivers. Lewin and Gibbard [35] employed high-precision topographic data obtained by UAVs to examine river terraces for analyzing the evolution process of river channels. In summary, UAVs have added value and reliability in discharge estimation compared to satellite remote sensing.
In 2019, Yang et al. [36,37] proposed an efficient method for river discharge inversion—remote sensing hydrological station technology. Based on the previous domestic and foreign remote sensing runoff estimation methods, this method takes advantage of the high accuracy and easy acquisition of UAV data. By combining aerial survey data with classic hydrological formulas, they presented a new way to estimate river runoff in areas suffering from data scarcity [38]. Lou et al. [39] applied the remote sensing hydrological station technology in ungauged regions on the Tibetan Plateau to determine river discharges of 24 rivers, and demonstrated that this method was reliable to estimate the discharges in ungauged tributaries. Yang et al. [40] used UAV data combined with sediment mobility to calculate the flood peak discharge of ephemeral rivers in northwestern China. In comparison with satellite remote sensing approaches, the remote sensing hydrological station method has higher accuracy, owing to the construction of a high-precision river channel model, to a large extent.
Overall, the objectives of this study are: (1) to estimate river discharge and its long-term variations in the Pamir Plateau; and (2) to explore the contribution of glacier meltwater discharge to the total runoff in the high mountainous region from 1999 to 2020. With respect to method, UAVs were used to acquire image data for tributaries and to model the shapes of river sections; satellite remote sensing data was coupled with UAV data for long-term river discharge prediction. Based on the assessment of glacier changes across basins and over time, a water balance model was used, and annual variation trends of total runoff and glacier meltwater discharge were examined.
2. Materials and Methods
2.1. Study Area
The Pamir Plateau is located in the heart of Central Asia. It is the gathering place of many major mountain ranges in Asia, with an average elevation of more than 4500 m and main peaks of more than 6000 m. There are a large number of modern glaciers in the high mountains, reaching more than 1000, covering a total area of about 10,500 km2 [41]. The main rivers in the arid regions of Central Asia, such as the Amu Darya River and the Tarim River, all originate here. The climate in the Pamir Plateau is a typical arid climate, with very cold winters while summers are warm and dry. Its eastern part is located in China, within the Kizilsu Kirgiz Autonomous Prefecture and the Kashgar region. Muji Valley and Taxkorgan Valley mark the boundaries of the Eastern Pamir in the east and are adjacent to Kunlun and Karakorum Mountain in the south. Due to environmental constraints, hydrological observations in this area have been relatively scarce. Currently, there are only three stations with long-term runoff observation data (Figure 1).
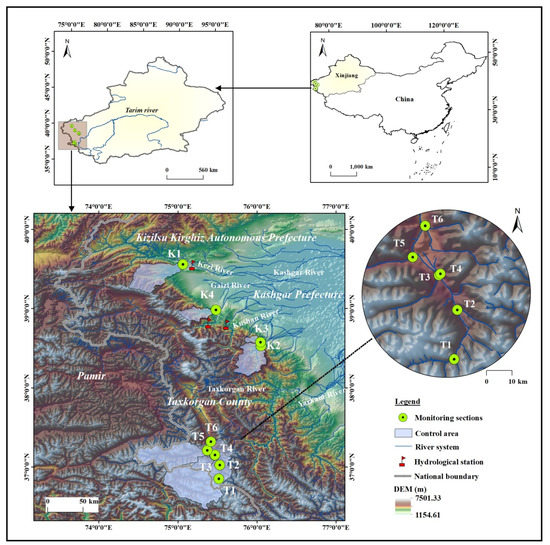
Figure 1.
Locations of monitoring sections and their control areas.
In this study, the eastern part of the Pamir Plateau (36°23′–39°44′N, 74°08′–76°18′E) is examined. Hydrologically, this area is ungauged and provides key water resources for southern Xinjiang. We chose ten representative glacier-fed river sections (Figure 1), where in-situ experiments, including UAV flying, river discharge measurement, and depth surveys, were carried out to characterize multiyear variations of alpine glacial meltwater runoff.
2.2. Data
2.2.1. UAV Data and River Sections
Topographic data about the rivers were collected on the southern edge of the Taklimakan Desert in Xinjiang, China (Figure 1) in August 2017. Low-altitude remote sensing imagery was obtained using a DJI Phantom 4 Professional UAV (Dajiang Company, Shenzhen, China, https://www.dji.com/cn. Accessed on 19 November 2019). The DJI 4 was used to fly on a fixed route to obtain high-definition image data. An action camera (FC300X) was mounted on the Phantom 4, which can shoot 4K video or 12-megapixel stills.
Before the execution of the UAV flight plan, it is necessary to select the monitored river sections and plan the routes. According to the underlying surface characteristics, such as vegetation coverage, soil type, and topographic relief of the monitored area, the flight belt is determined in advance. The UAV’s flight altitude was calculated through indicators including the UAV sensor’s field of view, focal length, and number of CCDs. Ground control points were arranged along the predetermined flight belt. The forward photo overlap is set to 90% to ensure the subsequent generation of stereoscopic image pairs, and 200–300 photos were obtained at each trajectory. The flying height is 120 m, with a scanning area of 300 × 500 m and a flight time of about 30 min. The monitored river section was chosen to be as straight as possible with less erosion and deposition on riverbanks.
After the acquisition of the data, laboratory data processing was undertaken. This included data preprocessing, point cloud encryption through the Pix4D software (https://pix4d.com/. Accessed on 30 June 2020), generation of high-precision digital orthophoto map (DOM), and generation of digital surface model (DSM) [42,43] (Figure 2). Our earlier study verified the UAV-based topographic survey precision. As controlled by the professional software, the survey accuracy of the Phantom 4 can reach as high as centimeter grade [44]. In this study, we used the same equipment and data processing methods from our previous study to obtain river section information.
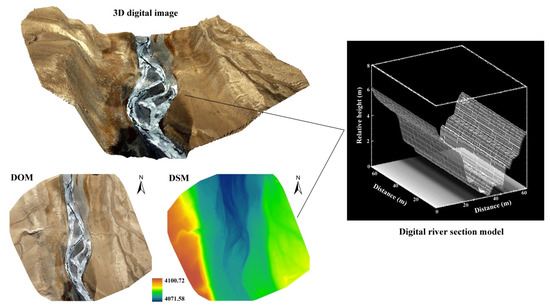
Figure 2.
River section information obtained from UAV.
Ten river sections were selected for long-term discharge analysis, of which four were located in the Kashgar River Basin and six were located in the Taxkorgan River Basin (Table 1). The Kashgar River Basin is situated at the foot of the Pamirs. There are six independent larger rivers in the basin, such as the Kezi, Gaizi, and Kushan Rivers. Section K1 flows into the Kezi River, the largest river in the basin. The Kezi River is replenished by a mixture of glacial meltwater in the high mountains and rainfall in the middle and low mountains [45]. However, the K1 section is located on the Borituokuoyisu, a tributary on the south side of the Kezi River. It originates from the Pamir Plateau, with an average altitude of 3825 m in the controlled watershed. Therefore, it can be considered that K1 belongs to the high mountain belt and is mainly supplied by melting water from glaciers and snow. Sections K2 and K3 flow into the Kushan River, the third major tributary of the Kashgar River system. K4 originates from the Shalikuoleling in the Pamir Plateau and joins the Gaizi River, the second-longest river in the Kashgar River Basin. The Gaizi River and the Kushan River are mainly supplied by glacier meltwater [46]. Sections T1 to T6 are located in the upper reaches of the Taxkorgan River. The Taxkorgan River is one of the major tributaries of the Yarkant River. It originates from the confluence of the Karakoram and Kunlun Mountains in the south and is fed mainly by glacial meltwater. Overall, we can conclude that the ten sections in our study are mainly supplied by meltwater from the alpine glaciers in the Pamirs.

Table 1.
River section information.
2.2.2. Satellite Remote Sensing Data
The Landsat program offers a continuous record of Earth’s surface at 30 m spatial resolution and is widely used in land change studies [47]. To explore the characteristics of long-term discharge changes, the width of rivers in different periods can be obtained from satellite remote sensing data to further estimate the river discharge. In this study, Landsat 7 ETM+ images, acquired from January 1999 to March 2013, and Landsat 8 OLI images, acquired from April 2013 to December 2020, were used to determine water surface extent. The images were from Landsat paths 149 to 150 and rows 33 to 35. A total of 880 images were collected between January 1999 to December 2020. Furthermore, in order to estimate glacial meltwater runoff and assess the glacier area changes in the basins controlled by ten study sections, Landsat images were also used, and the spatial variation of glaciers of different basins in different time steps was obtained. Due to the high elevation of the study area, the cloud coverage of the image was relatively high. The images with no cloud or a small amount of cloud were selected as much as possible.
Owing to the lack of hydrometeorological stations in high-altitude areas, the climatic data of stations located in plain areas cannot truly reflect the climate changes of high-altitude areas. Thus, the temperature and precipitation datasets were obtained utilizing the reanalysis (ERA-Interim) system from the European Centre for Medium-Range Weather Forecasts. ERA-Interim reanalysis data provides meteorological fields at spatial resolution from 0.125° to 2.5° and at four times (00, 06, 12, and 18 UTC) every day [48]. Since the dataset covers the period from January 1979 to August 2019, data with spatial resolution of 0.125° × 0.125° from January 1999 to August 2019 was used in this study.
2.2.3. Field Measurement Data
Since the UAV only carries a visible-light camera sensor which cannot directly measure the underwater topography [33], the essential hydrological data for discharge estimation were measured during the UAV flight, including flow velocity, river discharge, water depth, and underwater topography. The flow velocity was measured using a surface velocity radar (SVR, USA), the river discharge was measured using a portable Ponolflow-VA Doppler flow instrument, with a depth range of 0~5 m, and water depth was measured using a staff gauge to survey. These measured data provide input data for the discharge calculation formula and were used to validate the estimation results.
2.3. Methods
2.3.1. Remote Sensing Hydrological Station Technology
In this study, a method from the newly published article “Remote Sensing Hydrological Station” was used to estimate discharge [36,37,38,39,40]. Based on UAV images and in-situ measured data, water surface width, roughness, and surface gradient were obtained, and river discharge was calculated by a hydraulic method. The advantage of this method is that it can be combined with satellite remote sensing images to calculate the river discharge in different periods. It can also be applied for the inversion of river discharges in the long term and at different width scales. The main algorithm is as follows (Figure 3):
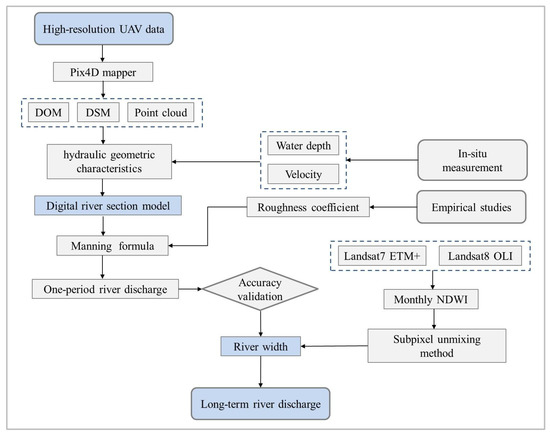
Figure 3.
Flowchart of remote sensing hydrological station technology.
(1) Generate DOM and DSM using high-resolution UAV data. Model the shape of each river section.
(2) Acquire the width of water surface. Draw the curve of the width and depth of the water surface and establish the digital river section model.
(3) Extract the water bodies in the valley based on the subpixel unmixing method. Combine them with the digital river section model to calculate relevant hydrological parameters so as to estimate river discharge in the long term.
The remote sensing hydrological station algorithm is based on the Manning–Strickler formula; its general form is written as:
where Q is the river discharge, m3/s; V is the velocity, m/s; A is the area of the river cross-section, m2, which is determined by the water depth and the water surface width; V is the average velocity of the flow; k is a conversion factor, m1/3/s, regarded as 1 in this study; n is the roughness coefficient; R is the hydraulic radius, and J is the hydraulic gradient.
2.3.2. Estimation of Rivers’ Width
Rivers’ width data is essential in calculating the river discharge, and they were obtained by using satellite remote sensing. The Normalized Difference Water Index (NDWI) makes use of reflected near-infrared radiation and visible green light to enhance the presence of water features while eliminating the presence of soil and terrestrial vegetation features [49]. It was used in our study to extract the width of water surface. Its expression is as follows [50,51]:
where Green and NIR are the surface reflectance of the green band and near-infrared band, respectively. They correspond to band 2 and band 4 in Landsat7 ETM+, and band 3 and band 5 in Landsat 8 OLI imagery.
Although satellite remote sensing has a high temporal resolution, the spatial resolution of satellite remote sensing is limited. For narrow rivers, it is difficult to directly calculate their width. To address this issue, the spectral unmixing method was applied to Landsat images [52]. The rivers from Landsat images were in the same period as the UAV flight. There are some outliers in the extracted results of river width because of the dry-flow in some sections or the freezing of rivers caused by cold weather. To ensure the estimation accuracy, these outliers were removed. River discharge can then be estimated using the digital river section model and the extracted river width. Assuming that the daily discharge obtained from remote sensing images is taken as the average discharge of the current month, the monthly discharge can be calculated by conversion. Due to removing the outliers, we cannot obtain all the data for each section from January to December each year, in which some of the monthly data were discontinuous. Therefore, the results were analyzed on a monthly scale.
2.3.3. Estimation of Discharge in High Mountain Glacierized Basin
We used the water balance model to estimate discharge of glacier meltwater. The water balance model refers to the calculation of water storage, recharge, and consumption of a watershed or region in a certain period based on the law of conservation of matter. For a glacierized basin, the change in water storage is actually reflected in the change of the glaciers in the basin. The sum of glacial meltwater runoff and precipitation runoff in non-glacier areas is equal to the total runoff in the basin. The input variables of this method are relatively easy to obtain, especially for the high-latitude, high-altitude, or complicated terrain.
The water balance equation of the high mountain glacierized basin we studied can be expressed as
where R is annual total runoff, Ra is annual glacier runoff, and Rb is rainfall runoff in non-glacier areas of the basin. In the ideal state, without considering the evaporation and infiltration process [15], Rb can be estimated as:
where P is annual precipitation, Ac is the basin area, Ag is the glacier area, and αng is the runoff coefficient of the non-glacial area, which can be determined according to previous studies.
The annual total runoff was calculated based on the estimation results of remote sensing hydrological station technology. Specifically, we estimated monthly runoff for a total of 22 years from 1999 to 2020, with several months lacking data due to the accuracy limitation of the river width inversion method. Therefore, we take the year with relatively complete monthly data as representative and accumulate monthly data to obtain annual data of the river section. Some river sections have data for only a few years (K1, T1), while some river sections have complete data for 22 years (K4).
In the water balance model, annual glacier area is an important input factor. In this study, the annual glacier area of each basin was obtained by classified the Landsat images based on the SVM method (See Section 2.3.4 for details). Using ERA-Interim data, the precipitation in non-glacier areas of the basin was obtained. The basin area of each section was obtained through hydrological analysis of 30 m spatial resolution DEM data using ArcGIS 10.5 software.
2.3.4. Assessment of Glacier Area Changes
The glacier information obtained from the glacier monitoring station is of high accuracy. As for the long-term glacier data, a remote sensing technique was used. We applied the support vector machine (SVM) method [53,54] to determine the glacier area. The Landsat 7 ETM+ and Landsat 8 OLI images were preprocessed. Images that had data gaps (showing as black stripes on the images) were repaired first, and the supervised classification was then performed based on signatures from false-color composite images (bands 7, 4, and 3 for Landsat 7 and bands 6, 5, and 2 for Landsat 8). By overlaying the boundaries of glaciers in different periods, the change information was obtained and analyzed.
2.3.5. Accuracy Assessment
3. Results
3.1. Changes of Glacier Area
Using Landsat images between 1999 and 2020, we analyzed the changes in the glacier area of the studied river section basins. Figure 4 shows the spatial distribution of glaciers in the basin controlled by the ten river sections in 1999 and 2020. It can be seen that the glacier recession has taken place in all basins, and the total glacier area has decreased by approximately 63% during the past two decades. The results of the glacier recession correspond with previous reports [6,55].
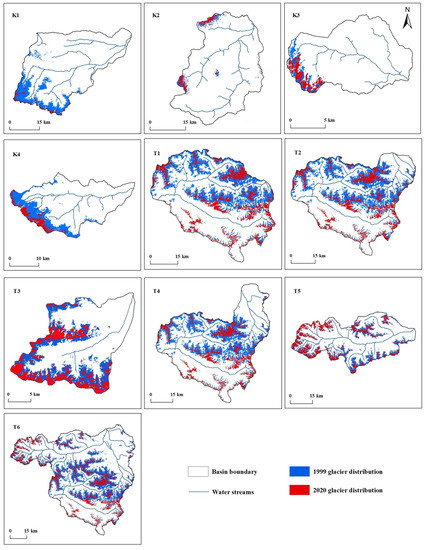
Figure 4.
Glacier distribution in the basins controlled by the studied river sections.
Comparing the river sections of the two largest basins, the decreased area of glaciers in the Kashgar River Basin was more than that in the Taxkorgan River Basin (Figure 5). The four sections (K1–K4) which are located at Kashgar River Basin control a small watershed area. These areas are characterized by a small glacier coverage but large glacier recession. In 1999, the total glacier area in the basins of K1–K4 sections was about 318.54 km2. By 2020, the total glacier area shrank to 52.71 km2, with an average reduction of about 69%. Among them, the area of glacier recession in the K1 section was the largest, with 91% glacier coverage disappearing. In contrast, the watershed area controlled by the T1–T6 section located at the Taxkorgan River Basin is relatively large. Glacier coverage in these section basins was high, and the decrease in glacier area was smaller than that of the Kashgar River Basin. In 1999, the total glacier area in the basins of T1–T6 sections was about 4906.29 km2. In 2020, the glacier area reduced to 1874.26 km2, with an average reduction of 61%. It can be concluded that the basins with smaller glacier areas were more sensitive to climate change as the climate continues to warm.
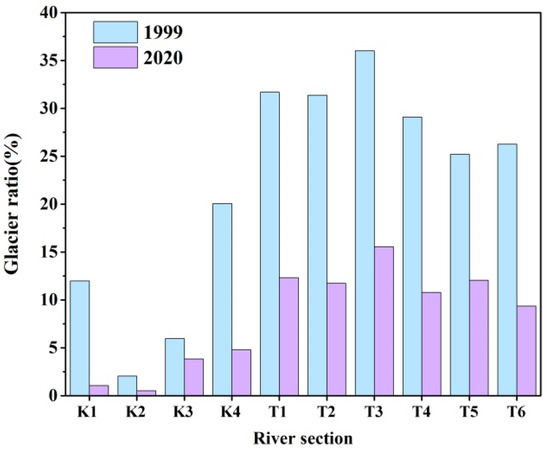
Figure 5.
The proportion of glacier area in the basins of different river sections in 1999 and 2020.
3.2. River Discharge from UAV and Satellite Remote Sensing
We evaluated the estimation accuracy of the river width and discharge data before analyzing the long-term discharge changes. The correlation analysis was performed between the river widths measured by UAV images and satellite images in the same period (Figure 6a). The linear relationship of the two results is significant (R2 = 0.73; p < 0.01). There is no hydrometric station in the high mountain area we studied. The discharges measured from in-situ experiments were reckoned as the true values for validating the calculated river discharges (Figure 6b). There is a high correlation between the measured and the estimated river discharges (R2 = 0.85; p < 0.01). All selected sections were considered as a whole, and the overall simulation accuracy was evaluated. The Nash–Sutcliffe efficiency coefficient (NSE) is 0.81, and the root mean square error (RMSE) is 20.29 m3/s. This means that the method of remote sensing hydrological station was appropriate for this ungauged area.
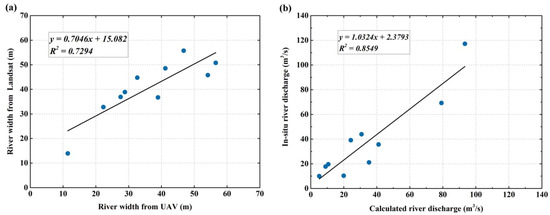
Figure 6.
Validation of the calculated river width (a) and river discharge (b).
The estimated monthly discharges, as well as the linear trends, of each section from 1999 to 2020 are shown in Figure 7. Except for sections T3 and T4, the monthly discharge of the other eight sections shows a decreasing trend, with an average reduction of 21.05%. In accordance with this, it is clear that the river discharge in the Pamirs Plateau has reduced over the past 22 years, but even in the same region, the change trends of the river discharge in different basins appear different. The decrease in the discharge of the Kashgar River Basin is more than that of the Taxkorgan River Basin. Over the whole study period, the average decrease in sections K1 to K4, which are located at Kashgar River Basin, is 35.92%, while the average decrease for sections T1 to T6, which are located at the Taxkorgan River Basin, is 11.13%.
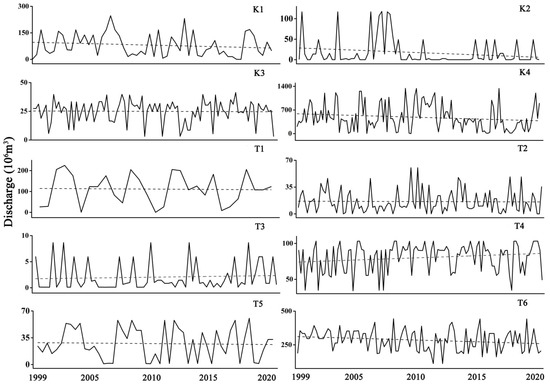
Figure 7.
The changes of monthly discharge in different river sections during 1999–2020.
Although the selected sections are not located far from each other, their locations, basin characteristics, and glacier coverage determine the different responses of estimated discharge to climate change. Among the ten sections, the decreasing trend of monthly discharge in K1 is the most significant, while the decreasing trends of K3, T2, and T3 are not obvious. The decrease of monthly discharge in K1 was 59.46%, followed by K4 (approximately 58.05%). K3 has the smallest increase, reaching approximately 0.69%. Section K1 controls the above watershed of 1497.19 km2, with an altitude of 1850~5885 m. This section has the most obvious monthly discharge reduction from 1999 to 2020, with a reduction of 59%. It is not only the section with the largest control basin area of the four sections in the Kashgar River Basin, but also the section with the largest glacier coverage. According to the changes in monthly discharge and the recession of glacier area in the basin, it can be seen that both the most significant reduction in discharge and the recession of glaciers have occurred in this section. K4 has the maximum discharge. In September 2009, the discharge of K4 was 1342.11 × 106 m3. Section K3 has the minimum value. In June 2002, the discharge of T3 was only 0.12 × 10⁶ m3. The watershed area controlled by T3 is 364.24 km2, and the altitude ranges from 3721 m to 5540 m. T3 is not only the section with the smallest watershed area controlled among the six sections of the Taxkorgan River Basin, but it is also the section with the smallest discharge among the ten sections. The discharge there varies from 0.12 × 10⁶ m3 to 8.66 × 10⁶ m3, with an average value of 2.04 × 10⁶ m3. During the last 22 years, the discharge has showed a slightly increasing trend, with a change of 0.88%. Section T4 controls the area above 3246.58 km2; the altitude is between 3113 m to 6337 m, and the discharge has a 10.83% increase. Section T6 is located on the mainstream of the Taxkorgan River, and it controls the basin of 6150.97 km2 including sections T1 to T5. Due to its large watershed area, it has the largest discharge among the six sections in the Taxkorgan River Basin, with monthly discharge ranging from 111.24 × 10⁶ m3 to 443.09 × 10⁶ m3. The monthly discharge of this section has a significant decreasing trend over the years, with a change of up to 50%.
River runoff in areas dominated by glacial meltwater usually experience an upward and then a downward trend [17]. The studied river sections of our study area are all located in high-altitude areas and the elevations of the basins they control ranges from 1811 m to 6556 m. There is a wide range of glaciers in the basin, and the rivers are mainly supplied by glacial meltwater. In terms of the characteristics of the underlying surface, the inconsistency of discharge changes at different river sections mainly depends on the difference in glacier coverage in the basin. The overall decreasing trend of discharge in our study sections could be mainly caused by the recession of glaciers in the controlled basin, although some sections illustrate a weak decreasing trend. This indicates that under the background of climate warming, glaciers in the headwaters are no longer sufficient to maintain the increase in river discharge in sub-basins. Therefore, we have considered that discharge of these river sections has passed its peak value and shows a decreasing trend. However, for sections T3 and T4, the reason for the increase in discharge may be that the recession of glaciers is still contributing to the increase in discharge, and the discharge has not yet reached its peak. Their discharge may show the same trend as the other sections within a few years.
3.3. Glacier Discharge from Water Balance Model
According to the water balance model, the discharge from glacier meltwater of the controlled basins in the ten research river sections was calculated. Figure 8 presents the annual changes of total discharge and glacier meltwater discharge in the ten river sections during the past two decades. As such, the multiyear variation of total discharge and glacial meltwater discharge of different sections are consistent with the multiyear monthly variation of discharge. Except for sections T3 and T4, the total discharge and glacial meltwater discharge of the other eight sections shows a decreasing trend.
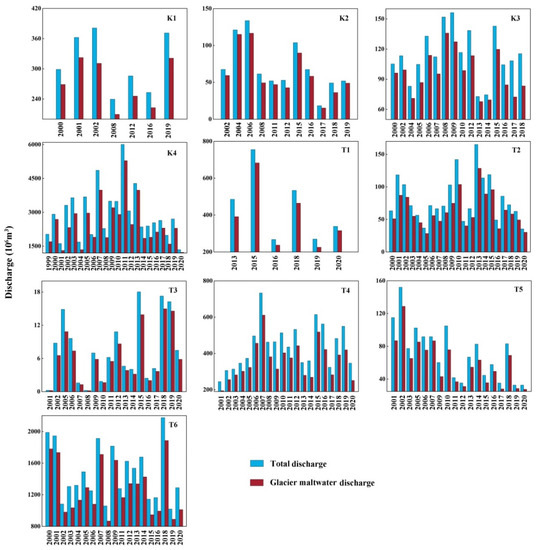
Figure 8.
Annual total discharge and glacier meltwater discharge of studied sections during 1999–2020.
In each glacierized basin, the average discharge from glacier meltwater accounts for 83% of the total discharge in the controlled basin, and the remaining 27% are other runoff components in the basin. Among the ten river sections, the glacier meltwater discharge in the Kashgar River Basin accounts for a larger proportion of the total discharge than in the Taxkorgan River Basin. The glacial meltwater discharge at sections K1–K4 accounts for an average of 85% of the total discharge, while at sections T1–T6, it accounts for 82%. Section T1 has the largest proportion of glacial meltwater discharge (87%), with discharge changes ranging from 683.07 × 10⁶ m3 to 225.79 × 10⁶ m3, averaging 386.29 × 10⁶ m3. Section T2 has the smallest proportion of glacial meltwater discharge (78%), with discharge changes ranging from 128.61 × 10⁶ m3 to 28.43 × 10⁶ m3 and an amount of 63.72 × 10⁶ m3 in average.
4. Discussion
4.1. Motivation and the Study Objective
There are many areas with ungauged or limited observation data around the world. How to make hydrological forecasts in these areas has always been one of the problems that plagued hydrologists at home and abroad [56]. In particular, widespread distributed small and medium-sized rivers are the majority of the data-scarce areas. However, the basin area and flow of these rivers are small, and local government departments can rarely invest in the establishment of hydrological stations [24]. There are human gathering places in the middle and lower reaches of such rivers, and the planning and management of water resources often lacks sufficient hydrological data support. Satellite remote sensing can effectively obtain the underlying surface data of large-scale basins and is widely used in river discharge estimation research. Low-altitude UAVs can effectively compensate for the lower spatiotemporal resolutions of satellite data and is more suitable for small and medium-sized rivers. UAV pixel size can also be controlled by flying altitude, which makes it more flexible for monitoring various-sized rivers [33]. Therefore, UAVs have great research value in estimating the river discharge in headwater sub-basins.
In this context, our study focuses on the practical problem of difficulty in obtaining runoff data in hydrological data-scarce areas, combining low-altitude UAVs with satellite remote sensing data to carry out a quantitative study of time series discharge estimation at high-altitude sub-basins. The main innovation of this research lies in the establishment of remote sensing hydrological stations for river monitoring in the region with scarce hydrological data. Moreover, we explore the feasibility of extending remote sensing discharge estimation methods on time and space scales, thereby alleviating the problem of data acquisition in areas with a lack of hydrological data. The quantitative analysis of discharge changes provides data support and technical reference for the development and utilization of water resources in arid, high-altitude areas.
4.2. Changing of Climatic Factor
We have observed a substantial recession of glacier area since 1999. The warming temperature considered to be the dominant driver for the recent glacier recession in previous research [57] has been illustrated by our study. To determine the influence of the climatic factor on the river discharge of the Pamir region, the temperature changes in the river basins for the period 1999–2019 was plotted (Figure 9). The temperatures in the basin controlled by ten sections all reveal a rising trend, with an average rate of 0.016 °C/year. The result of rising temperature is consistent with that in previous reports published for Pamir regions [58], among which the temperature increase rate in the Kashgar River Basin is the largest, reaching 0.03 °C/year, and the annual average temperature was 6.63 °C. The temperature rising rate in the Taxkorgan River Basin is relatively small, with a rate of −0.007 °C/year and an annual average temperature of 3.69 °C. The average highest temperature of 5.46 °C and average lowest temperature of 4.35 °C were observed in 2007 and 2000, respectively. The rising rate of temperature in K3 is the most significant (0.035 °C/year), and T4 has the smallest rise (0.001 °C/year). The temperature changes of the ten sections do not completely correspond to the changes of discharge, which further indicates that in addition to temperature, the degree of glacier recession in the basin also has a great influence on the discharge variation.
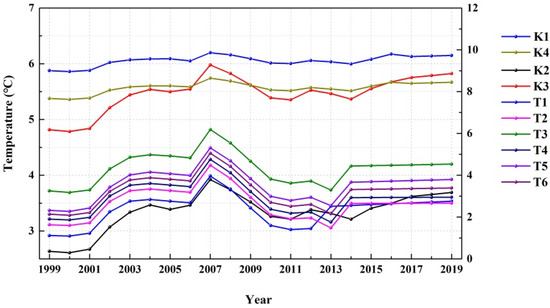
Figure 9.
Annual temperature changes in the basins of ten river sections during 1999–2019.
It is widely acknowledged that precipitation is an important source of replenishment for surface runoff and, thus, plays a pertinent role in maintaining regional ecosystems. Recent studies found that the precipitation in the East Pamir region is increasing due to the influence of the westerlies [59]. However, the river sections in our study are all located in stream headwaters at high altitude, and the glacier meltwater accounts for a large proportion in the basin, which weakens the impact of precipitation on runoff changes. In addition, the rising temperature leads to an increase in evaporation, which offsets the hydrological effect of increased precipitation. Therefore, we have not discussed the impact of precipitation on runoff separately in this article.
4.3. Runoff Characteristics of High-Altitude Headwaters
As the origin of many inland rivers, high-altitude river headwaters determine the amount of water resources exported to the middle and lower reaches, and, in turn, affect the region’s social and economic development. Different from plain areas, there are large areas of glaciers, snow, and frozen soil in high-altitude areas, and the transformation between solid, liquid, and gaseous water plays a very important role in the hydrological cycle. However, the water cycle in the sub-basins of the high-altitude headwater is a very complex process affected by various factors such as regional climate and geographical environment.
In many similar studies of high-altitude areas, river runoff is mainly fed by glacier meltwater, which is detected to increase due to increasing glacier melt [11,60,61]. The Pamir is a typical representative of the high-altitude headwater area. To date, numerous studies have attempted to explore the response of river discharge to climate change, hydrological processes, and changes in water resources. The increasing trend of discharge has been found in the past by Chevallier et al. [62] and is assumed to increase in the next 60 years by Kure et al. [63]. However, in contrast to their studies, the decreasing trend of river discharge in the Eastern Pamir headwaters has been detected in our study. These opposite results suggest that the hydrological responses vary among different watershed systems. In non-alpine areas or a large river basin, because the runoff composition includes many other components besides glacier meltwater (for example rainfall, groundwater, and other mixed recharge sources), the runoff process is influenced by numerous factors. In contrast, for the headwater sub-basins, the runoff component of the tributaries mainly consists of snow and ice meltwater. The contribution of glacier meltwater gradually decreases as the river progresses downstream [6].
It is noteworthy that the solid water sources (glacier) of supply in the headwater basins are limited, and it is difficult to recover its original state once it is melted. There is a negative correlation between glacier retreat rate and glacier size: small-scale glaciers are more sensitive to climate change, while large-scale glaciers are relatively stable [64]. Previous studies have pointed out that there are mostly small glaciers in the Pamirs [6,65]. We have explained in this study that glaciers have disappeared in the Eastern Pamir, and more are expected to follow in the future. Even if glaciers do not disappear completely, it is expected that further glacial recession will result in regional water shortages because of decreased glacial meltwater [66]. Thus, the reduction of discharge in the headwater sub-basins is inevitable.
4.4. Opportunities and Challenges of UAV-Based Survey on High Mountain Areas
Globally, high-altitude mountainous areas are characterized by abundant water resources and large amounts of runoff. Water estimation at these regions is significant because they are the source of water for local and downstream oasis areas. Due to its rugged terrains, harsh weather conditions, low population density, and inconvenient transportation, the high mountainous area makes field investigation more difficult and brings challenges to related alpine research. Hence, most previous studies focused on plain oasis areas, while few studies focused on the mountain regions which hindered the progress of the research on the alpine areas. UAVs have been widely used in agriculture, weather monitoring, forest fire detection, emergency search and rescue, and other numerous fields [67,68,69]. Among them, there is enormous potential for in-field monitoring in alpine regions. Continuous and in-depth research of mountains areas at high altitudes is promising.
Although remote sensing has exerted its great advantages in remoteness areas, it has some shortcomings. For example, special uplifting terrain and temperature difference makes it easy to form clouds in high-altitude mountainous areas, which affects the acquisition of accurate images. In such a case, as a low-altitude remote sensing platform that can fly under clouds, UAVs have great potential for increasing sparse and discontinuous field monitoring by providing high-resolution images at a relatively low cost. On the other hand, UAVs also face a series of problems in harsh high-altitude areas. Influenced by altitude and temperature, the weather changes in mountainous areas are relatively fast, and severe weather causes obstacles to UAV monitoring. Conditions such as high winds, extreme temperatures, and low air density all affect its work efficiency.
In summary, the effective combination of UAV and satellite remote sensing has great application and promotion values. Using UAV, we can obtain the cross section of the river channel and calculate the river flow in one period. However, the control distance of the UAV is limited to 10 km, and every time the data is collected, it needs to reach the vicinity of the research river section. These have restricted the time and space expansion of UAV applications. Satellite remote sensing can provide images of historical periods. In the existing studies, scholars have demonstrated the feasibility of acquiring serial discharge based on satellite images [70,71]. However, satellite remote sensing is limited by its spatial and temporal resolutions and cannot provide high-precision river section profile information. Even if the river width is obtained, there are still large errors for medium and small rivers, so its spatial promotion is not ideal [30,72]. Therefore, giving full consideration to the advantage of high-precision characteristics of low-altitude remote sensing and the long time series of satellite remote sensing can provide a method for continuous discharge monitoring for data scare areas. On the basis of this study, further quantitative analysis of the contribution of satellite imagery and UAV will be our next research focus.
5. Conclusions
Exploration of the changes and causes of water resources in high mountain headwaters in recent decades is of great significance for rational development and optimal utilization of water resources, as well as formulation of regional water resources protection policies in the future. In this study, we integrated UAV and satellite remote sensing data for detailed analyses of discharge changes in the headwater of sub-basins of the Eastern Pamir. Our results provide reference for the assessment of water resources in high-altitude regions suffering data scarcity. The main conclusions are as follows:
(1) The Eastern Pamirs’ solid reservoirs supplied by glaciers have been in a state of continuous loss. The total glacier area has decreased by approximately 63% during 1999–2020. The glacier recession in the Kashgar River Basin (69%) was more pronounced than that in the Taxkorgan River Basin (61%).
(2) Our estimation of river width and discharge is accurate, and the NSE value for estimated discharge reaches 0.81. The long-term monthly discharge of river sections shows a decreasing trend with an average reduction of 21.05%. The annual variation of total discharge and glacial meltwater discharge was consistent with their monthly variation, and glacier meltwater accounts for an average of 83% of the total runoff in the controlled basin.
(3) The overall decreasing trend of discharge is closely related to the recession of glaciers in the basin. Under the background of climate warming, the runoff increases with the increase of meltwater at the expense of glaciers. Glacier storage is limited and cannot maintain the increase in river discharge for a long time. Therefore, the discharge shows a decreasing trend after passing its peak.
Author Contributions
Conceptualization, A.W. and S.Y.; formal analysis, C.L. and L.M.; funding acquisition, H.L.; investigation, S.Y., H.L. and C.L.; methodology, S.Y. and H.L.; visualization, L.M.; writing—original draft, A.W. and Y.C.; writing—review and editing, A.W., Y.C. and L.M. All authors have read and agreed to the published version of the manuscript.
Funding
This research was funded by the National Natural Science Foundation of China (Grant Nos. U1603241; 41661079; U1703341) and the Local People’s Government of the Xinjiang Uygur Autonomous Region in China sent abroad to study a complete set of projects (L06).
Conflicts of Interest
The authors declare no conflict of interest.
References
- Mekonnen, M.; Hoekstra, A. Four billion people facing severe water scarcity. Sci. Adv. 2016, 2, e1500323. [Google Scholar] [CrossRef] [PubMed] [Green Version]
- The World Economic Forum. Global Risks 2015; The World Economic Forum: Geneva, Switzerland, 2015. [Google Scholar]
- Immerzeel, W.W.; van Beek, L.P.H.; Konz, M.; Shrestha, A.B.; Bierkens, M.F.P. Hydrological response to climate change in a glacierized catchment in the Himalayas. Clim. Chang. 2012, 110, 721–736. [Google Scholar] [CrossRef] [PubMed] [Green Version]
- Tak, S.; Keshari, A.K. Investigating mass balance of Parvati glacier in Himalaya using satellite imagery based model. Sci. Rep. 2020, 10, 12211. [Google Scholar] [CrossRef]
- Sakai, A.; Fujita, K. Contrasting glacier responses to recent climate change in high-mountain Asia. Sci. Rep. 2017, 7, 13717. [Google Scholar] [CrossRef] [PubMed]
- Luo, Y.; Xiaolei, W.; Piao, S.; Sun, L.; Ciais, P.; Zhang, Y.; Ma, C.; Gan, R.; He, C. Contrasting streamflow regimes induced by melting glaciers across the Tien Shan—Pamir—North Karakoram. Sci. Rep. 2018, 8, 16470. [Google Scholar] [CrossRef]
- Chen, Y.; Li, W.; Deng, H.; Fang, G.; Li, Z. Changes in central Asia’s water tower: Past, present and future. Sci. Rep. 2016, 6, 35458. [Google Scholar] [CrossRef]
- Miles, E.; McCarthy, M.; Dehecq, A.; Kneib, M.; Fugger, S.; Pellicciotti, F. Health and sustainability of glaciers in High Mountain Asia. Nat. Commun. 2021, 12, 2868. [Google Scholar] [CrossRef]
- Pendleton, S.; Miller, G.; Lifton, N.; Lehman, S.; Southon, J.; Crump, S.; Anderson, R. Rapidly receding Arctic Canada glaciers revealing landscapes continuously ice-covered for more than 40,000 years. Nat. Commun. 2019, 10, 445. [Google Scholar] [CrossRef]
- St Pierre, K.; Lehnherr, I.; Poulain, A.; Gardner, A.; St Louis, V.; Smol, J.; Schiff, S.; Arnott, S.; Findlay, D.; Findlay, W.; et al. Contemporary limnology of the rapidly changing glacierized watershed of the world’s largest High Arctic lake. Sci. Rep. 2019, 9, 4447. [Google Scholar] [CrossRef] [Green Version]
- Singh, D.V.; Jain, S.; Goyal, M. An assessment of snow-glacier melt runoff under climate change scenarios in the Himalayan basin. Stoch. Environ. Res. Risk Assess. 2021, 35, 2067–2092. [Google Scholar] [CrossRef]
- Baraer, M.; Mark, B.; McKenzie, J.; Condom, T.; Bury, J.; Huh, K.; Portocarrero, C.; Gomez, J.; Rathay, S. Glacier recession and water resources in Peru’s Cordillera Blanca. J. Glaciol. 2012, 58, 134–150. [Google Scholar] [CrossRef] [Green Version]
- Zhao, Q.; Ding, Y.; Wang, J.; Gao, H.; Zhang, S.; Zhao, C.; Junli, X.; Han, H.; Shangguan, D. Projecting climate change impacts on hydrological processes on the Tibetan Plateau with model calibration against the Glacier Inventory Data and observed streamflow. J. Hydrol. 2019, 573, 60–81. [Google Scholar] [CrossRef]
- Duethmann, D.; Bolch, T.; Farinotti, D.; Kriegel, D.; Vorogushyn, S.; Merz, B.; Pieczonka, T.; Jiang, T.; Buda, S.; Güntner, A. Attribution of streamflow trends in snow- and glacier melt dominated catchments of the Tarim River, Central Asia. Water Resour. Res. 2015, 51, 4727–4750. [Google Scholar] [CrossRef] [Green Version]
- Huss, M.; Farinotti, D.; Bauder, A.; Funk, M. Modelling runoff from highly glacierized alpine drainage basins in a changing climate. Hydrol. Process. 2008, 22, 3888–3902. [Google Scholar] [CrossRef]
- Bliss, A.; Hock, R.; Radić, V. Global response of glacier runoff to twenty-first century climate change. J. Geophys. Res. Earth Surf. 2014, 119, 717–730. [Google Scholar] [CrossRef]
- Huss, M.; Hock, R. Global-scale hydrological response to future glacier mass loss. Nat. Clim. Chang. 2018, 8, 135–140. [Google Scholar] [CrossRef] [Green Version]
- Sorg, A.; Huss, M.; Rohrer, M. The days of plenty might soon be over in glacierized Central Asian catchments. Environ. Res. Lett. 2014, 9, 104018. [Google Scholar] [CrossRef]
- Pohl, E.; Gloaguen, R.; Andermann, C.; Knoche, M. Glacier melt buffers river runoff in the Pamir Mountains. Water Resour. Res. 2017, 53, 2467–2489. [Google Scholar] [CrossRef]
- Unger-Shayesteh, K.; Vorogushyn, S.; Farinotti, D.; Gafurov, A.; Duethmann, D.; Mandychev, A.; Merz, B. What do we know about past changes in the water cycle of Central Asian headwaters? A review. Glob. Planet. Chang. 2013, 110, 4–25. [Google Scholar] [CrossRef]
- Normatov, I.; Normatov, P. Climate change impact on hydrological characteristics and water availability of the Mountain Pamir Rivers. Proc. Int. Assoc. Hydrol. Sci. 2020, 383, 31–41. [Google Scholar] [CrossRef]
- Hagg, W.; Hoelzle, M.; Wagner, S.; Klose, Z. Estimation of future glaciation and runoff in the Tanimas basin, Eastern Pamirs. Hydrol. Earth Syst. Sci. Discuss. 2011, 8, 62–73. [Google Scholar] [CrossRef]
- Knoche, M.; Merz, R.; Lindner, M.; Weise, S. Bridging glaciological and hydrological trends in the pamir mountains, central Asia. Water 2017, 9, 422. [Google Scholar] [CrossRef] [Green Version]
- Razavi, T.; Coulibaly, P. Streamflow prediction in ungauged basins: Review of regionalization methods. J. Hydrol. Eng. 2013, 18, 958–975. [Google Scholar] [CrossRef]
- Bjerklie, D.M.; Ayotte, J.D.; Cahillane, M.J. Simulating Hydrologic Response to Climate Change Scenarios in Four Selected Watersheds of New Hampshire; U.S. Geological Survey Scientific Investigations Report; United States Geological Survey: Reston, VA, USA, 2015; pp. 2015–5047. [Google Scholar]
- Zarco-Tejada, P.; Whiting, M.; Ustin, S. Temporal and spatial relationships between within-field yield variability in cotton and high-spatial hyperspectral remote sensing imagery. Agron. J. 2005, 97, 641–653. [Google Scholar] [CrossRef] [Green Version]
- Bishop, C.; Liu, J.G.; Mason, P. Hyperspectral remote sensing for mineral exploration in Pulang, Yunnan Province, China. Int. J. Remote Sens. 2011, 32, 2409–2426. [Google Scholar] [CrossRef]
- Heiden, U.; Segl, K.; Roessner, S.; Kaufmann, H. Determination of robust spectral features for identification of urban surface materials in hyperspectral remote sensing data. Remote Sens. Environ. 2007, 111, 537–552. [Google Scholar] [CrossRef] [Green Version]
- Gleason, C.; Wang, J. Theoretical basis for at-many-stations hydraulic geometry (AMHG). Geophys. Res. Lett. 2015, 42, H52D-08. [Google Scholar] [CrossRef] [Green Version]
- Huang, Q.; Long, D.; Du, M.; Zeng, C.; Qiao, G.; Li, X.; Hou, A.; Hong, Y. Discharge estimation in high-mountain regions with improved methods using multisource remote sensing: A case study of the Upper Brahmaputra River. Remote Sens. Environ. 2018, 219, 115–134. [Google Scholar] [CrossRef]
- Garambois, p.-a.; Monnier, J. Inference of effective river properties from remotely sensed observations of water surface. Adv. Water Resour. 2015, 79, 103–120. [Google Scholar] [CrossRef]
- Shi, Z.; Chen, Y.; Liu, Q.; Huang, C. Discharge estimation using harmonized landsat and sentinel-2 product: Case studies in the murray darling basin. Remote Sens. 2020, 12, 2810. [Google Scholar] [CrossRef]
- Kerr, J.; Purkis, S. An algorithm for optically-deriving water depth from multispectral imagery in coral reef landscapes in the absence of ground-truth data. Remote Sens. Environ. 2018, 210, 307–324. [Google Scholar] [CrossRef]
- Zhao, C.S.; Zhang, C.B.; Yang, S.T.; Liu, C.M.; Xiang, H.; Sun, Y.; Yang, Z.Y.; Zhang, Y.; Yu, X.Y.; Shao, N.F.; et al. Calculating e-flow using UAV and ground monitoring. J. Hydrol. 2017, 552, 351–365. [Google Scholar] [CrossRef]
- Lewin, J.; Gibbard, P. Quaternary river terraces in England: Forms, sediments and processes. Geomorphology 2010, 120, 293–311. [Google Scholar] [CrossRef]
- Yang, S.; Wang, P.; Lou, H.; Wang, J.; Zhao, C.; Gong, T. Estimating river discharges in ungauged catchments using the slope area method and unmanned aerial vehicle. Water 2019, 11, 2361. [Google Scholar] [CrossRef] [Green Version]
- Yang, S.; Wang, j.; Wang, P.; Gong, T.; Liu, H. Low altitude unmanned aerial vehicles (UAVs) and satellite remote sensing are used to calculated river discharge attenuation coefficients of ungauged catchments in arid desert. Water 2019, 11, 2633. [Google Scholar] [CrossRef] [Green Version]
- Wang, P.; Yang, S.; Wang, J.; Pan, T.; Zhang, S.; Gong, T. Discharge estimation with hydraulic geometry using unmanned aerial vehicle and remote sensing. J. Hydraul. Eng. 2020, 4, 492–504. [Google Scholar] [CrossRef]
- Lou, H.; Wang, P.; Yang, S.; Hao, F.; Ren, X.; Wang, Y.; Shi, L.; Wang, J.; Gong, T. Combining and comparing an unmanned aerial vehicle and multiple remote sensing satellites to calculate long-term river discharge in an ungauged water source region on the Tibetan plateau. Remote Sens. 2020, 12, 2155. [Google Scholar] [CrossRef]
- Yang, S.; Li, C.; Lou, H.; Wang, P.; Wang, J.; Ren, X. Performance of an unmanned aerial vehicle (UAV) in calculating the flood peak discharge of ephemeral rivers combined with the incipient motion of moving stones in arid ungauged regions. Remote Sens. 2020, 12, 1610. [Google Scholar] [CrossRef]
- RGI Consortium. Randolph Glacier Inventory-A Dataset of Global Glacier Outlines; Version 6.0; Technical Report; Global Land Ice Measurements from Space: Boulder, CO, USA, 2017. [Google Scholar] [CrossRef]
- Turner, D.; Lucieer, A.; Wallace, L. Direct georeferencing of ultrahigh-resolution UAV imagery. IEEE Trans. Geosci. Remote Sens. 2014, 52, 2738–2745. [Google Scholar] [CrossRef]
- Ruzgienė, B.; Berteška, T.; Gečyte, S.; Jakubauskienė, E.; Aksamitauskas, Č. The surface modelling based on UAV Photogrammetry and qualitative estimation. Measurement 2015, 73, 619–623. [Google Scholar] [CrossRef]
- Zhang, C.B.; Yang, S.T.; Zhao, C.S.; Lou, H.Z.; Zhang, Y.C.; Bai, J.; Wang, Z.W.; Guan, Y.B.; Zhang, Y. Topographic data accuracy verification of small consumer UAV. Remote Sens. 2018, 22, 185–195. [Google Scholar] [CrossRef]
- He, C. Hydrological characteristics of Kezi River in Xinjiang. Grand Water 2019, 41, 151–152. [Google Scholar]
- Mao, W.; Sun, B.; Wang, T.; Luo, G.; Zhang, C.; Huo, L. Change trends of temperature, precipitation and runoff volume in the Kaxgar river basin since recent 50 years. Arid Zone Res. 2006, 23, 531–538. [Google Scholar]
- Wulder, M.A.; White, J.C.; Goward, S.N.; Masek, J.G.; Irons, J.R.; Herold, M.; Cohen, W.B.; Loveland, T.R.; Woodcock, C.E. Landsat continuity: Issues and opportunities for land cover monitoring. Remote Sens. Environ. 2008, 112, 955–969. [Google Scholar] [CrossRef]
- Dee, D.P.; Uppala, S.M.; Simmons, A.J.; Berrisford, P.; Poli, P.; Kobayashi, S.; Andrae, U.; Balmaseda, M.A.; Balsamo, G.; Bauer, D.P.; et al. The ERA-Interim reanalysis: Configuration and performance of the data assimilation system. Q. J. R. Meteorol. Soc. 2011, 137, 553–597. [Google Scholar] [CrossRef]
- McFeeters, S.K. The use of normalized difference water index (NDWI) in the delineation of open water features. Int. J. Remote Sens. 1996, 7, 1425–1432. [Google Scholar] [CrossRef]
- Gao, B.-C. NDWI?A normalized difference water index for remote sensing of vegetation liquid water from space. Remote Sens. Environ. 1996, 58, 257–266. [Google Scholar] [CrossRef]
- Xu, H. Modification of normalized difference water index (NDWI) to enhance open water features in remotely sensed imagery. Int. J. Remote Sens. 2006, 27, 3025–3033. [Google Scholar] [CrossRef]
- Keshava, N.; Mustard, J.F. Spectral unmixing. IEEE Signal Process. Mag. 2002, 19, 44–57. [Google Scholar] [CrossRef]
- Pal, M.; Foody, G.M. Feature selection for classification of hyperspectral data by SVM. IEEE Trans. Geosci. Remote Sens. 2010, 48, 2297–2307. [Google Scholar] [CrossRef] [Green Version]
- Mountrakis, G.; Im, J.; Ogole, C. Support vector machines in remote sensing: A review. Isprs J. Photogramm. Remote Sens. 2011, 66, 247–259. [Google Scholar] [CrossRef]
- Zhang, Z.; Liu, S.; Junfeng, W.; Junli, X.; Guo, W.; Bao, W.; Jiang, Z. Mass change of glaciers in Muztag Ata-Kongur Tagh, Eastern Pamir, China from 1971/76 to 2013/14 as derived from remote sensing data. PLoS ONE 2016, 11, e0147327. [Google Scholar] [CrossRef] [PubMed]
- Sivapalan, M.; Takeuchi, K.; Franks, S.; Gupta, V.; Karambiri, H.; Lakshmi, V.; Liang, X.; McDonnell, J.; Mendiondo, E.; O’Connell, E.; et al. IAHS Decade on predictions in ungauged basins (PUB), 2003–2012: Shaping an exciting future for the hydrological sciences. Hydrol. Sci. J. 2003, 48, 857–880. [Google Scholar] [CrossRef] [Green Version]
- Cook, A.; Copland, L.; Noël, B.; Stokes, C.; Bentley, M.; Sharp, M.; Bingham, R.G.; van den Broeke, M. Atmospheric forcing of rapid marine-terminating glacier retreat in the Canadian Arctic Archipelago. Sci. Adv. 2019, 5, eaau8507. [Google Scholar] [CrossRef] [Green Version]
- Mętrak, M.; Chachulski, Ł.; Navruzshoev, D.; Pawlikowski, P.; Rojan, E.; Sulwiński, M.; Suska-Malawska, M. Nature’s patchwork: How water sources and soil salinity determine the distribution and structure of halophytic plant communities in arid environments of the Eastern Pamir. PLoS ONE 2017, 12, e0174496. [Google Scholar] [CrossRef]
- Yao, T.; Thompson, L.; Yang, W.; Yu, W.; Gao, Y.; Guo, X.; Yang, X.; Duan, K.; Zhao, H.; Xu, B.; et al. Different glacier status with atmospheric circulations in Tibetan plateau and surroundings. Nat. Clim. Chang. 2012, 2, 663–667. [Google Scholar] [CrossRef]
- Zhang, L. Climate change and its impact on the eco-environment of the three-rivers headwater region on the Tibetan plateau, China. Int. J. Environ. Res. Public Health 2015, 12, 12057–12081. [Google Scholar] [CrossRef] [Green Version]
- Huss, M. Present and future cotribution of glacier storage change to runoff from macroscale drainage basins in Europe. Water Resour. Res. 2011, 47, W07511. [Google Scholar] [CrossRef] [Green Version]
- Chevallier, P.; Pouyaud, B.; Mojaïsky, M.; Bolgov, M.; Olsson, O.; Bauer, M.; Froebrich, J. River flow regime and snow cover of the Pamir Alay (Central Asia) in a changing climate. Hydrol. Sci. J. 2014, 59, 1491–1506. [Google Scholar] [CrossRef]
- Kure, S.; Jang, S.; Ohara, N.; Kavvas, M.; Chen, Z.Q. Hydrologic impact of regional climate change for the snowfed and glacierfed river basins in the republic of Tajikistan: Hydrological response of flow to climate change. Hydrol. Process. 2013, 27, 4057–4070. [Google Scholar] [CrossRef]
- Bahr, D.; Pfeffer, W.; Sassolas, C.; Meier, M. Response time of glaciers as a function of size and mass balance: 1. Theory. J. Geophys. Res. 1998, 103, 9777–9782. [Google Scholar] [CrossRef]
- Finaev, A. Climatic changes in the mountain glacier area of Pamir. In Ice Physics and the Natural Environment; Springer: Berlin, Germany, 1999; pp. 289–295. [Google Scholar] [CrossRef]
- Barnett, T.; Adam, J.; Lettenmaier, D. Potential impacts of a warming climate on water availability in snow-dominated regions. Nature 2005, 438, 303–309. [Google Scholar] [CrossRef] [PubMed]
- Khan, Z.; Eichi, V.; Haefele, S.; Garnett, T.; Miklavcic, S. Estimation of vegetation indices for high-throughput phenotyping of wheat using aerial imaging. Plant Methods 2018, 14, 20. [Google Scholar] [CrossRef] [PubMed]
- Anderson, K.; Gaston, K.J. Lightweight unmanned aerial vehicles will revolutionize spatial ecology. Front. Ecol. Environ. 2013, 11, 138–146. [Google Scholar] [CrossRef] [Green Version]
- Howell, T.L.; Singh, K.K.; Smart, L. Structure from motion techniques for estimating the volume of wood chips. In High Spatial Resolution Remote Sensing; CRC Press: Boca Raton, FL, USA, 2018; pp. 149–164. [Google Scholar] [CrossRef]
- Bjerklie, D.; Dingman, S.; Vorosmarty, C.; Bolster, C.; Congalton, R. Evaluating the potential for measuring river discharge from space. J. Hydrol. 2003, 278, 17–38. [Google Scholar] [CrossRef]
- Ling, F.; Cai, X.; Li, W.; Xiao, F.; Li, X.; Du, Y. Monitoring river discharge with remotely sensed imagery using river island area as an indicator. J. Appl. Remote Sens. 2012, 6, 063564. [Google Scholar] [CrossRef]
- Watson, C.S.; King, O.; Miles, E.; Quincey, D. Optimising NDWI supraglacial pond classification on Himalayan debris-covered glaciers. Remote Sens. Environ. 2018, 217, 414–425. [Google Scholar] [CrossRef]
Publisher’s Note: MDPI stays neutral with regard to jurisdictional claims in published maps and institutional affiliations. |
© 2021 by the authors. Licensee MDPI, Basel, Switzerland. This article is an open access article distributed under the terms and conditions of the Creative Commons Attribution (CC BY) license (https://creativecommons.org/licenses/by/4.0/).