Technical Note

Feasibility Study on Estimation of Sea Ice Drift from KOMPSAT-5 and COSMO-SkyMed SAR Images

1
Center of Remote Sensing and GIS, Korea Polar Research Institute, Incheon 21990, Korea
2
Nansen Environmental and Remote Sensing Center, 5006 Bergen, Norway
3
Institute of Polar Sciences, National Research Council of Italy, 35127 Padova, Italy
4
Department of Geophysics, Kangwon National University, Chuncheon-si 24341, Korea
5
Department of Energy and Mineral Resources Engineering, Dong-A University, Busan 49315, Korea
*
Author to whom correspondence should be addressed.
Remote Sens. 2021, 13(20), 4038; https://doi.org/10.3390/rs13204038
Submission received: 30 August 2021 / Revised: 30 September 2021 / Accepted: 6 October 2021 / Published: 9 October 2021

Abstract

:
Estimating the sea ice drift field is of importance in both scientific study and activities in the polar ocean. Ice motion is being tracked at large scale (10 km and larger) on a daily basis; however, a higher resolution product is desirable for more reliable monitoring of rapid changes in sea ice. The use of wide-swath SAR has been extensively studied; yet, recent high-resolution X-band SAR sensors have not been tested enough. We examine the feasibility of KOMPSAT-5 and COSMO-SkyMed for retrieving sea ice motion by using the dataset of the MOSAiC expedition. The ice drift match-ups extracted from consecutive SAR image pairs and buoys for more than seven months in the central Arctic were used for a performance evaluation and validation. In addition to individual tests for KOMPSAT-5 and COSMO-SkyMed, a cross-sensor combination of two sensors was tested to overcome the drawback, a relatively long revisit time of high-resolution SAR. The experimental results show that higher accuracies are achievable from both single- and cross-sensor configurations of high-resolution X-band SARs compared to wide-swath C-band SARs, and that sub-daily monitoring is feasible from the cross-sensor approach.

1. Introduction

Sea ice is a dynamic component of the Earth’s cryosphere that varies over time and space in response to winds and ocean currents. Since it plays an important role in the energy balancing between the ocean and atmosphere [1,2], it is one of the most sensitive indicators of climate change. From a thermodynamic point of view, ice growth is limited to the equilibrium thickness according to the surface energy balance [3]; however, the ice–water phase change due to melting and freezing controls the ice–albedo feedback [4]; as a consequence, the change is to be accelerated globally. From a dynamic point of view, the drift of sea ice influences the local redistribution of ice thickness [5,6], which in turn indirectly controls the localized ice–water phase change.
The sea ice drift has been estimated daily by using passive microwave observations at 25 km by a 25 km resolution since 1978 [7]. A substantial decline in Arctic sea ice thickness has been observed for the last decades: −0.58 ± 0.07 m per decade over the period of 2000–2012 [8]. Accompanying this rapid sea ice loss, the averaged ice drift speed increased 10.6 ± 0.9% per decade over the period of 1992–2009 [9]. As the increased mobility enhances ice deformation [10] and the regional variability is significant, the need for a more high-resolution (i.e., sub-kilometer scale) sea ice drift is crucial for analyzing ice deformation and redistribution, both in large and small scales [11]. The assimilation of sea ice drift-derived deformation into a sea ice model having ice damage (i.e., grid scale variable that represents the density of fractures at the sub grid scale) as a model variable [12,13] is also of importance in high-resolution observation.
In the remote sensing approach, sea ice drift is tracked by correlating ice signatures from consecutive satellite images taken with a certain time offset. As long as ice maintains consistent image features during the given time interval, the motion can be computed from the distance between the same positions in each of the images. A number of studies have investigated the way to retrieve the sea ice drift field from various types of satellite sensors: optical radiometer [14], passive microwave radiometer [15], scatterometer [16], and synthetic aperture radar (SAR) [17,18,19,20,21,22]. Among them, the use of SAR images is gaining attention due to its all-weather and night-and-day capability, which is particularly important in polar ocean, where solar illumination is limited to summer months. Recent SAR constellations such as COSMO-SkyMed (Constellation of small Satellites for the Mediterranean basin Observation)-1/2/3/4 (2007-/2007-/2008-/2010-), TerraSAR-X/TanDEM-X/PAZ (2007-/2010-/2018-), Sentinel-1A/1B (2014-/2016-), and RADARSAT Constellation Mission (RCM, 2019-) reduced the revisit time dramatically, enabling a high-resolution hemispherical observation over the entire Arctic Ocean on a near daily basis with their wide-swath imaging capabilities. An operational SAR-based sea ice drift product computed solely from Sentinel-1 data is being serviced by the Copernicus Marine Environment Monitoring Service (CMEMS) [23]. Furthermore, emerging technology pushes forward the use of a much higher number of small SAR satellite constellations for the persistent monitoring of the Earth’s surface [24].
Considering the demand on using higher resolution SAR systems for a better analysis of the Arctic sea ice, it would be beneficial to evaluate the performance of the current X-band high-resolution SAR systems for estimating sea ice drift. The relatively limited observation capability in terms of imaging swath has not allowed an extensive, long-term monitoring of a specific sea ice floe. Previous studies on sea ice drift retrieval focused mostly on the use of wide-swath C-band SAR [17,18,19,20,21,22], while the use of X-band SAR [25] is very limited. However, during the MOSAiC (Multidisciplinary drifting Observatory for the Study of Arctic Climate) expedition [26], which was the first year-round expedition into the central Arctic, dense time series data from various SAR satellites were acquired over the central observatory for the whole mission period. KOMPSAT-5 (Korea Multi-Purpose SATellite-5) [27], the first Korean X-band SAR satellite, and COSMO-SkyMed [28], the Italian SAR constellation, also performed to their full capacity to contribute to the expedition. Along with the satellite observations, the MOSAiC Distributed Network (DN) of ice-tethered buoys [29] recorded a full variation of regional drift and deformation around the central observatory. Combining them provides an ideal set for evaluating and validating satellite-derived sea ice drift in a very high resolution.
Here, we evaluate the feasibility on the estimation of sea ice drift from KOMPSAT-5 and compare the performance with that from another high-resolution X-band SAR satellite with similar hardware specifications, COSMO-SkyMed. The results are validated from the GPS positions of the MOSAiC DN buoys. Furthermore, the synergy of cross-use of these two sensors is tested to overcome the issue of temporal resolution in the determination of SAR-based sea ice drift.

2. Materials and Methods

Figure 1 shows the spatial coverage of the datasets used: KOMPSAT-5, COSMO-SkyMed, and the trajectory of the MOSAiC ice floe in which the DN buoys were centered. The temporal coverage was from 4 October 2019 to 16 May 2020, the period that the ice floe drifted freely without any external interruption. The site was altered afterward by the inevitable temporal leave of the RV (Research Vessel) Polarstern for resupply [30]. Table 1 summarizes the image and sensor parameters of the two SAR satellites. The descriptions of each of the datasets are presented below.

2.1. KOMPSAT-5 Dataset

The Korea Aerospace Research Institute (KARI) KOMPSAT-5 (K5 hereafter) was launched and has been in operation since 2013, well beyond its initial operational lifespan of five years. Similar to other high-resolution modern SAR satellites such as TerraSAR-X/TanDEM-X/PAZ and COSMO-SkyMed, the K5 payload includes X-band SAR with a fixed antenna capable of electronic steering both in the azimuth and the elevation planes, which enables three different types of imaging modes: Stripmap, Spotlight, and ScanSAR. During the MOSAiC expedition, the K5 acquired 215 Stripmap (ES) and 101 ScanSAR (EW) mode image strips (i.e., number of independent orbits) in HH-polarization, with 30 km and 100 km swath widths, respectively. The image products were delivered in processing Level 1C, Geocoded Ellipsoid Corrected (GEC). The acquisition mode-averaged geolocation CE90 (circular error at the 90th percentile) accuracy of the K5 products for the study period (October 2019–May 2020) was 2.6 ± 1.5 m [31,32,33,34].

2.2. COSMO-SkyMed Dataset

The Italian Space Agency (ASI) COSMO-SkyMed (CSK hereafter) consists of four X-band SAR satellites that operate in the same orbital plane with different phases. The four satellites acquired more images than K5, having made more dense time series. In total, 374 Stripmap (HI) and 342 ScanSAR (HR) mode image strips were acquired with VV-polarization, and their swath widths were 40 km and 200 km, respectively. The image products were also delivered in processing Level 1C, GEC. The geolocation accuracies (3-sigma) of the CSK Level 1C products were 11.1 m and 6.4 m for Stripmap and ScanSAR modes, respectively [28].

2.3. MOSAiC Distributed Network Buoys

Autonomous buoy-based systems formed a distributed network around the Central Observatory of MOSAiC ice floe (i.e., RV Polarstern, a German research icebreaker) at distances up to 40 km apart, which was used to measure sea ice and ocean state variables (temperature, salinity, velocity, etc.) at multiple scales throughout the MOSAiC mission period. Among the various types of buoys, only the Surface Velocity Profiler (SVP) buoys were used to evaluate the performance of the sea ice drift retrieval from SAR images because their sampling interval is short (10 min–1 h) compared to other types of buoys.
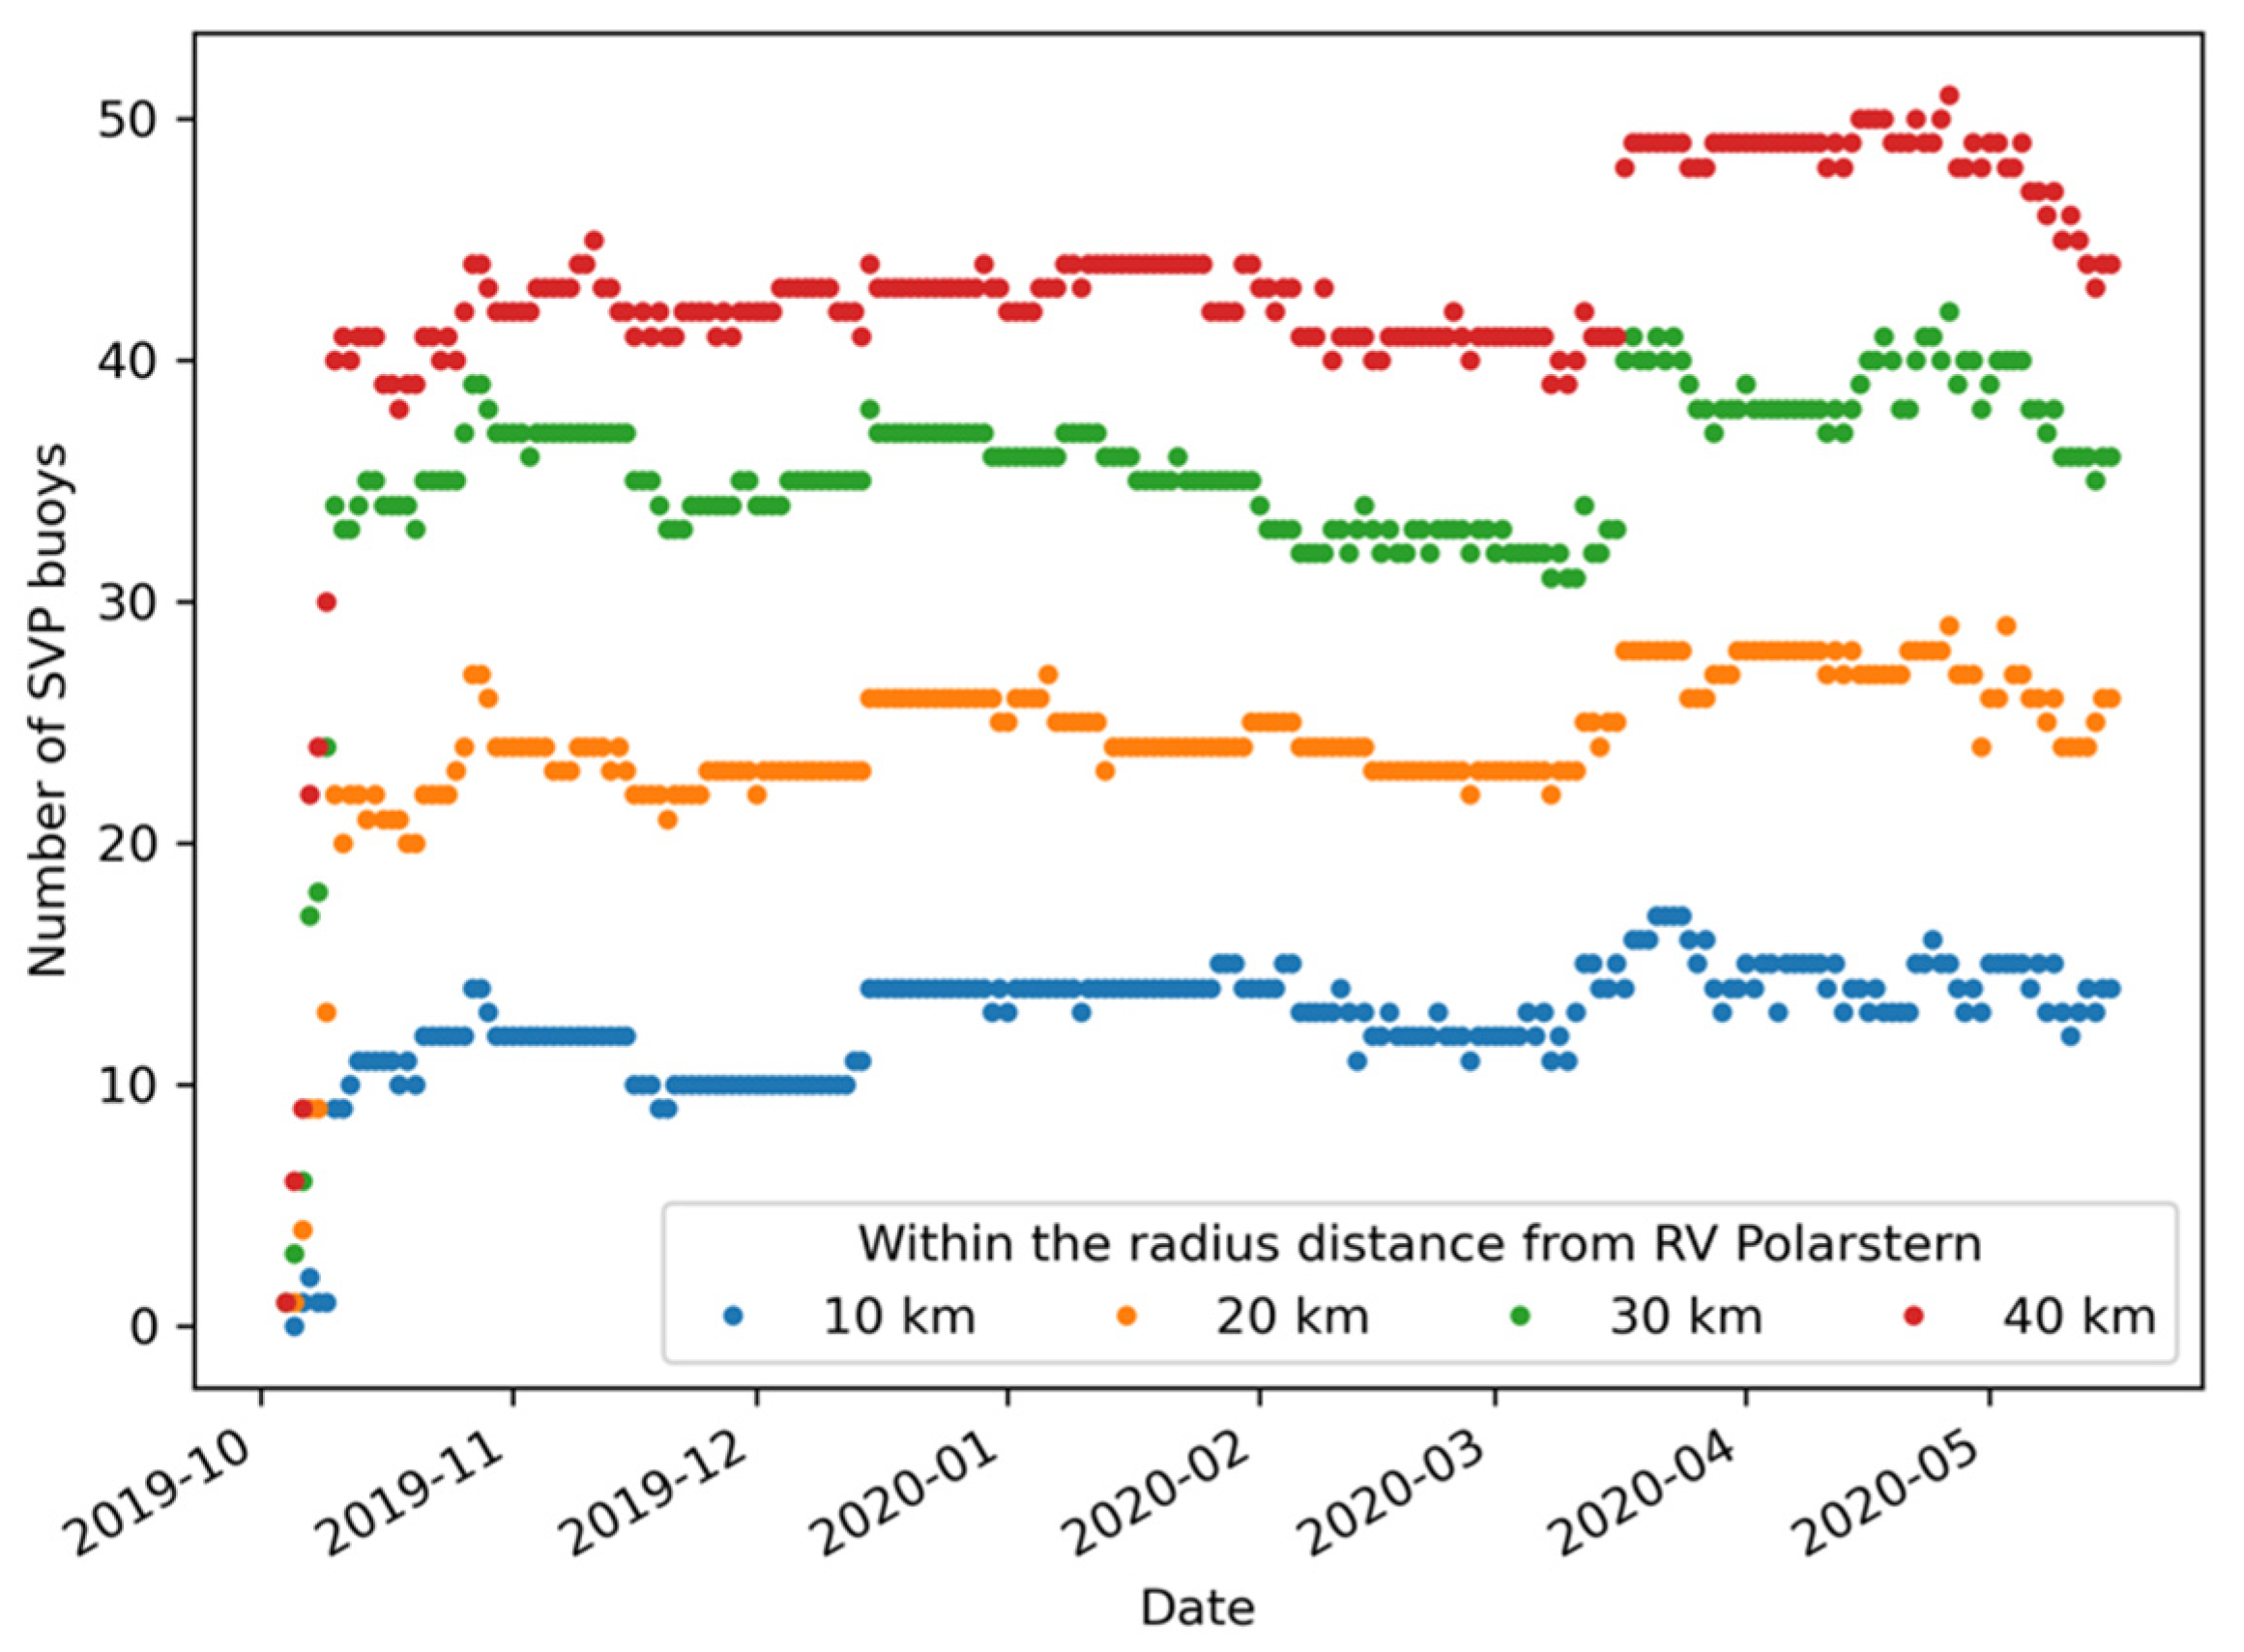
Figure 2 shows the number of the SVP buoys around the RV Polarstern, which was moored to the MOSAiC ice floe. The actual number of available validation points varies for each image pair, changing with the combination of acquisition modes (e.g., Stripmap–Stripmap, Stripmap–ScanSAR, and ScanSAR–ScanSAR) and the overlap fraction of the scanned area. As the position records of some buoys showed unnatural/unrealistic ice motion, records with drift speed higher than 1 m/s in the consecutive time series were excluded in our experiment.

2.4. Sea Ice Drift Retrieval

We used the NERSC (Nansen Environmental and Remote Sensing Center) algorithm [21] developed for estimating sea ice drift motion from Sentinel-1 data. The algorithm is known to have advantages both in high accuracy (positional error is below 300 m) and high computational efficiency (the time for one image pair is 1 min approximately for Sentinel-1). The core is based on a combinational use of feature tracking [35] and pattern matching [36]: the former enables quick but unevenly distributed estimates of matching key points which are to be used for the initial guess, and the latter provides evenly distributed estimates of drift vectors. The algorithm is available as open source (https://github.com/nansencenter/sea_ice_drift accessed on 15 July 2021); however, custom product import modules for the connected toolbox, Nansat [37], were developed in this study in order to import the GEC products of K5 and CSK. Processing parameters such as template size, search range, and Lowe ratio test were optimized to maximize the algorithm’s performance.
To form optimal input image pairs, the images satisfying the following criteria were selected: (i) the acquisition time difference of the pair ranged from 6 to 72 h, (ii) the RV Polarstern and at least one identical SVP buoy were located within the footprints at the time of each of the image acquisitions. As the CSK dataset had a larger imaging swath and denser time series, the geographically overlapped areas were bigger; hence, more SVP buoy positions were available than those for K5 dataset. Note that the geographically overlapped area can be zero when the image acquisition time difference in a pair is long, but this does not mean that the images do not cover the same ice floe because sea ice is mobile.
The pixel spacings of all images were downscaled to 50 m by 50 m, regardless of the acquisition mode. This was performed to reduce speckle noise and make the algorithm run fast. No radiometric calibration was applied because the GEC products were already processed with basic radiometric equalizations, including antenna pattern correction. The projections of the given GEC products were Universal Polar Stereographic (UPS) or Universal Transverse Mercator (UTM) depending on the scene center latitude. The images were used in their own projection during the tracking process without collocating onto the same grid, but the results in latitude–longitude format were converted into UPS grid to obtain the drift distances in meters. For implementing feature tracking and pattern matching algorithm, the template size was set as 40 pixel by 40 pixel, which corresponded to 2 km by 2 km.
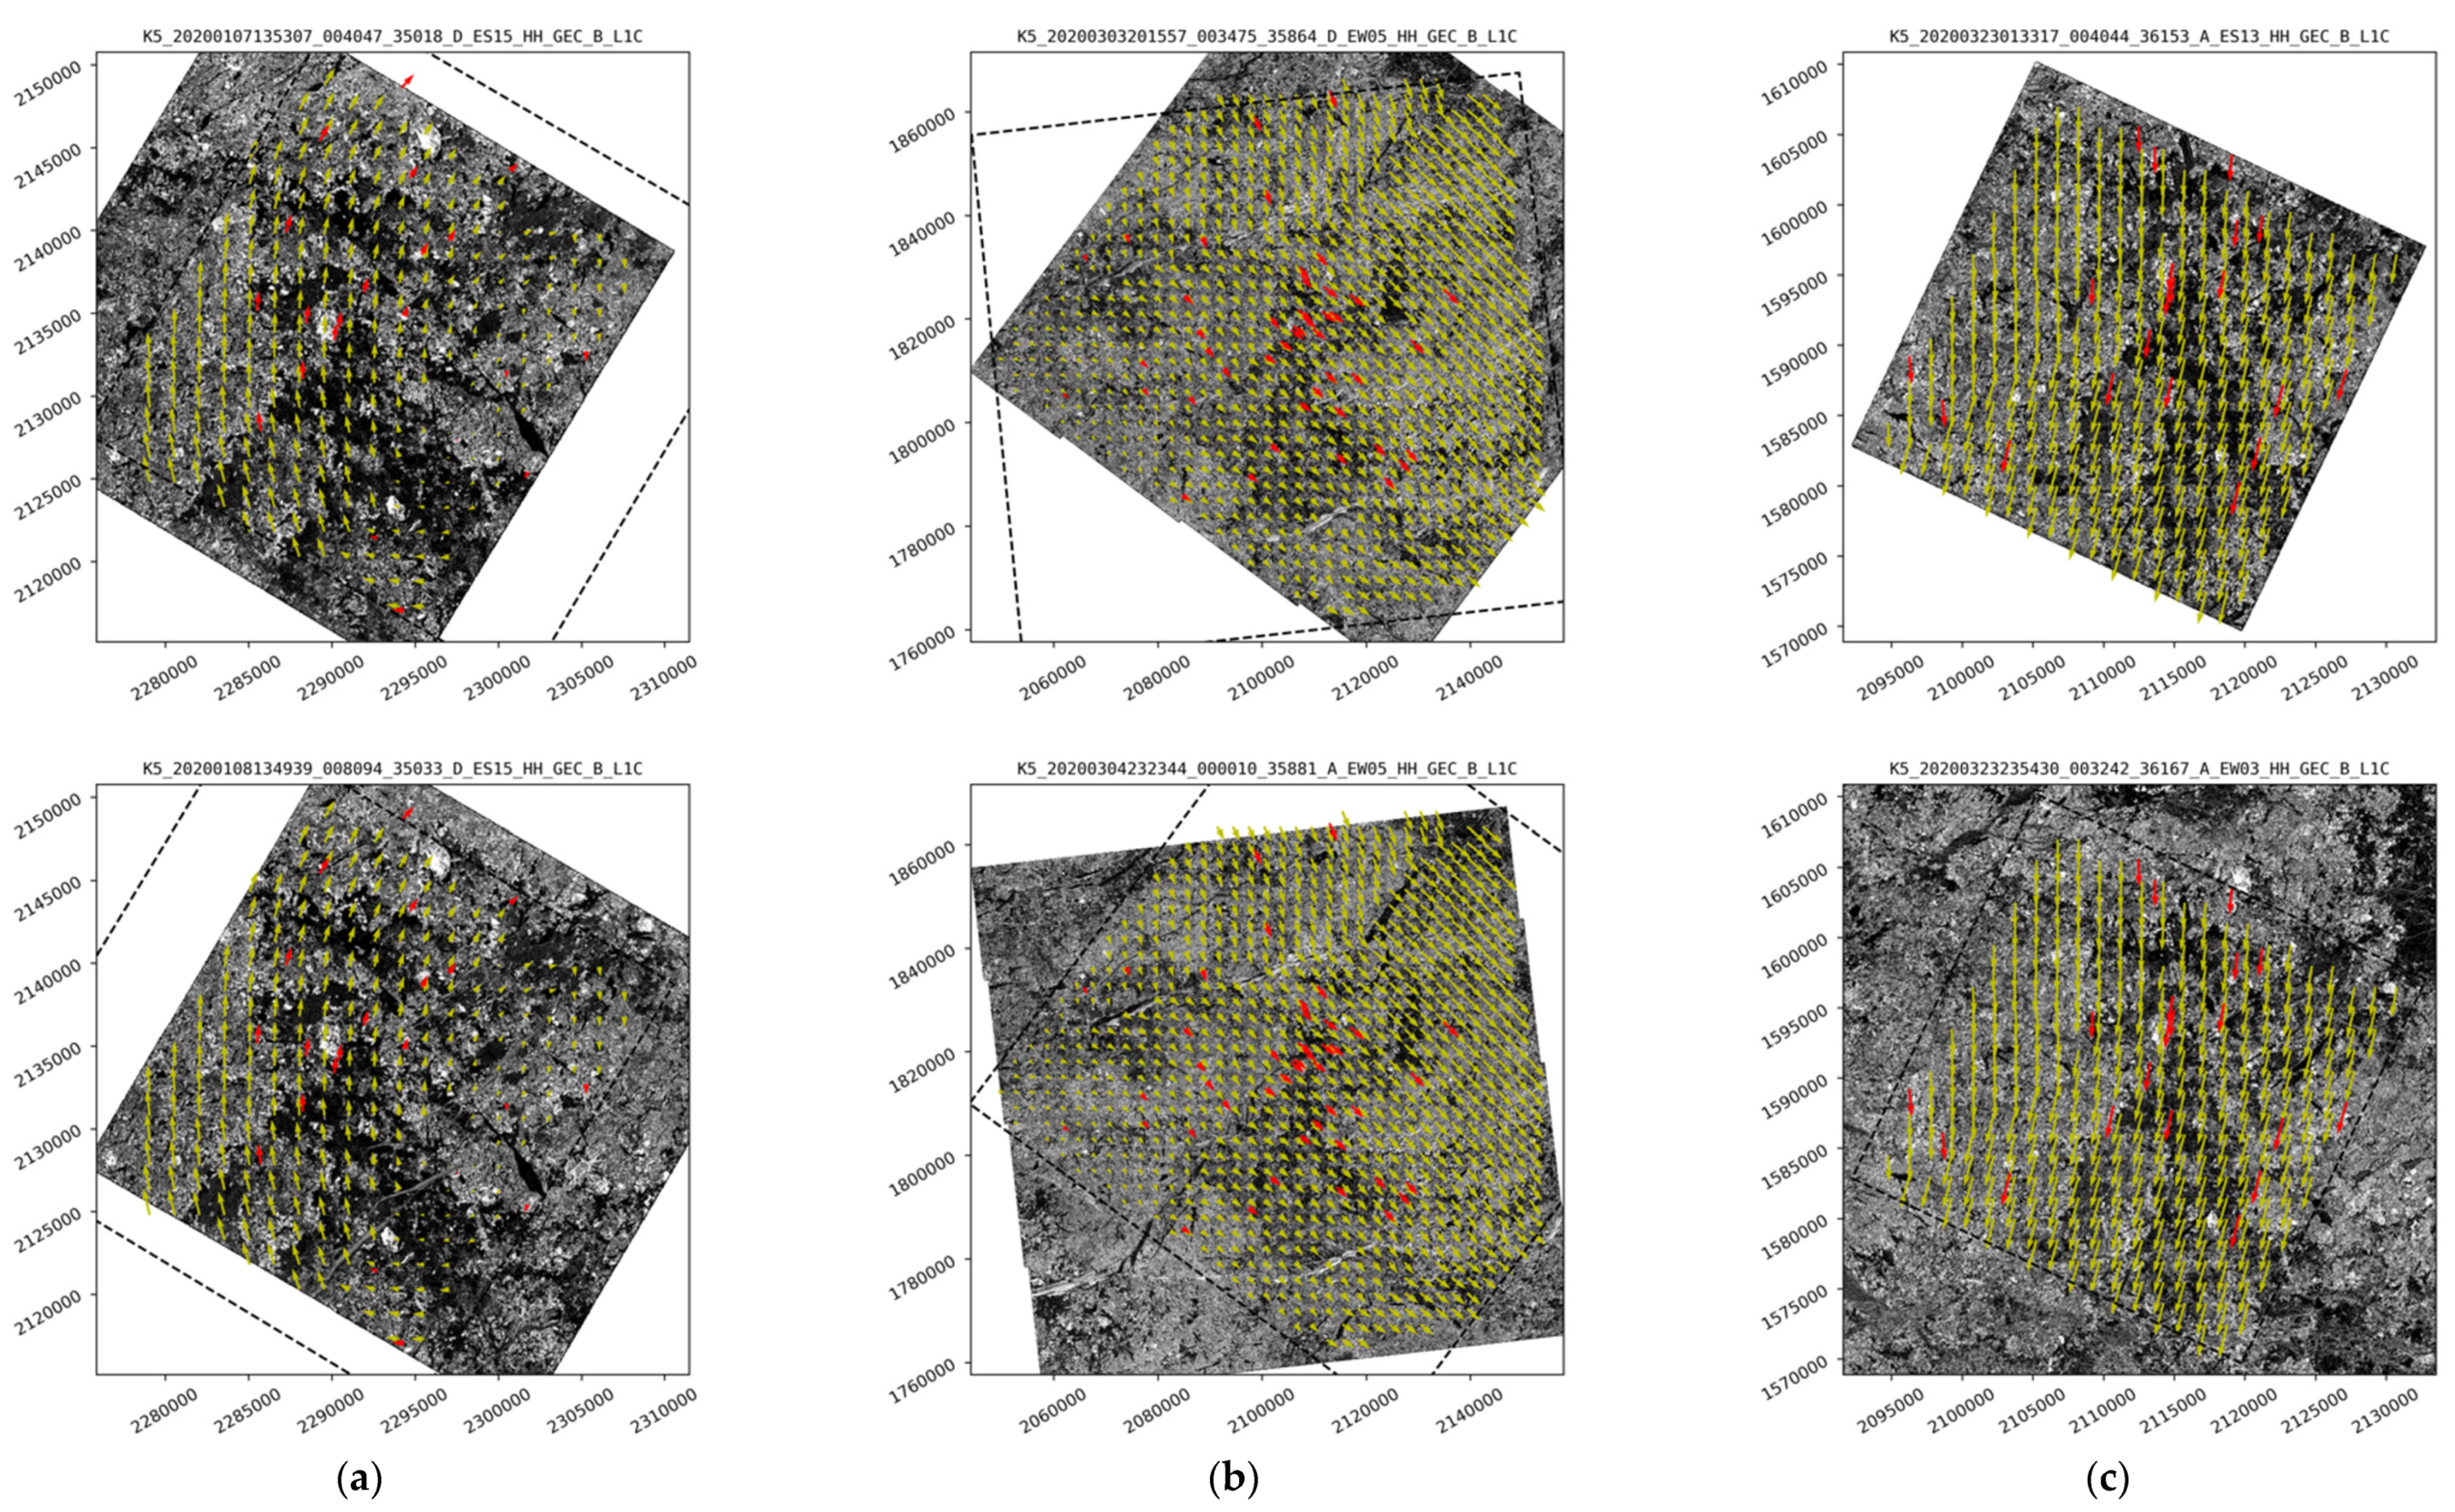
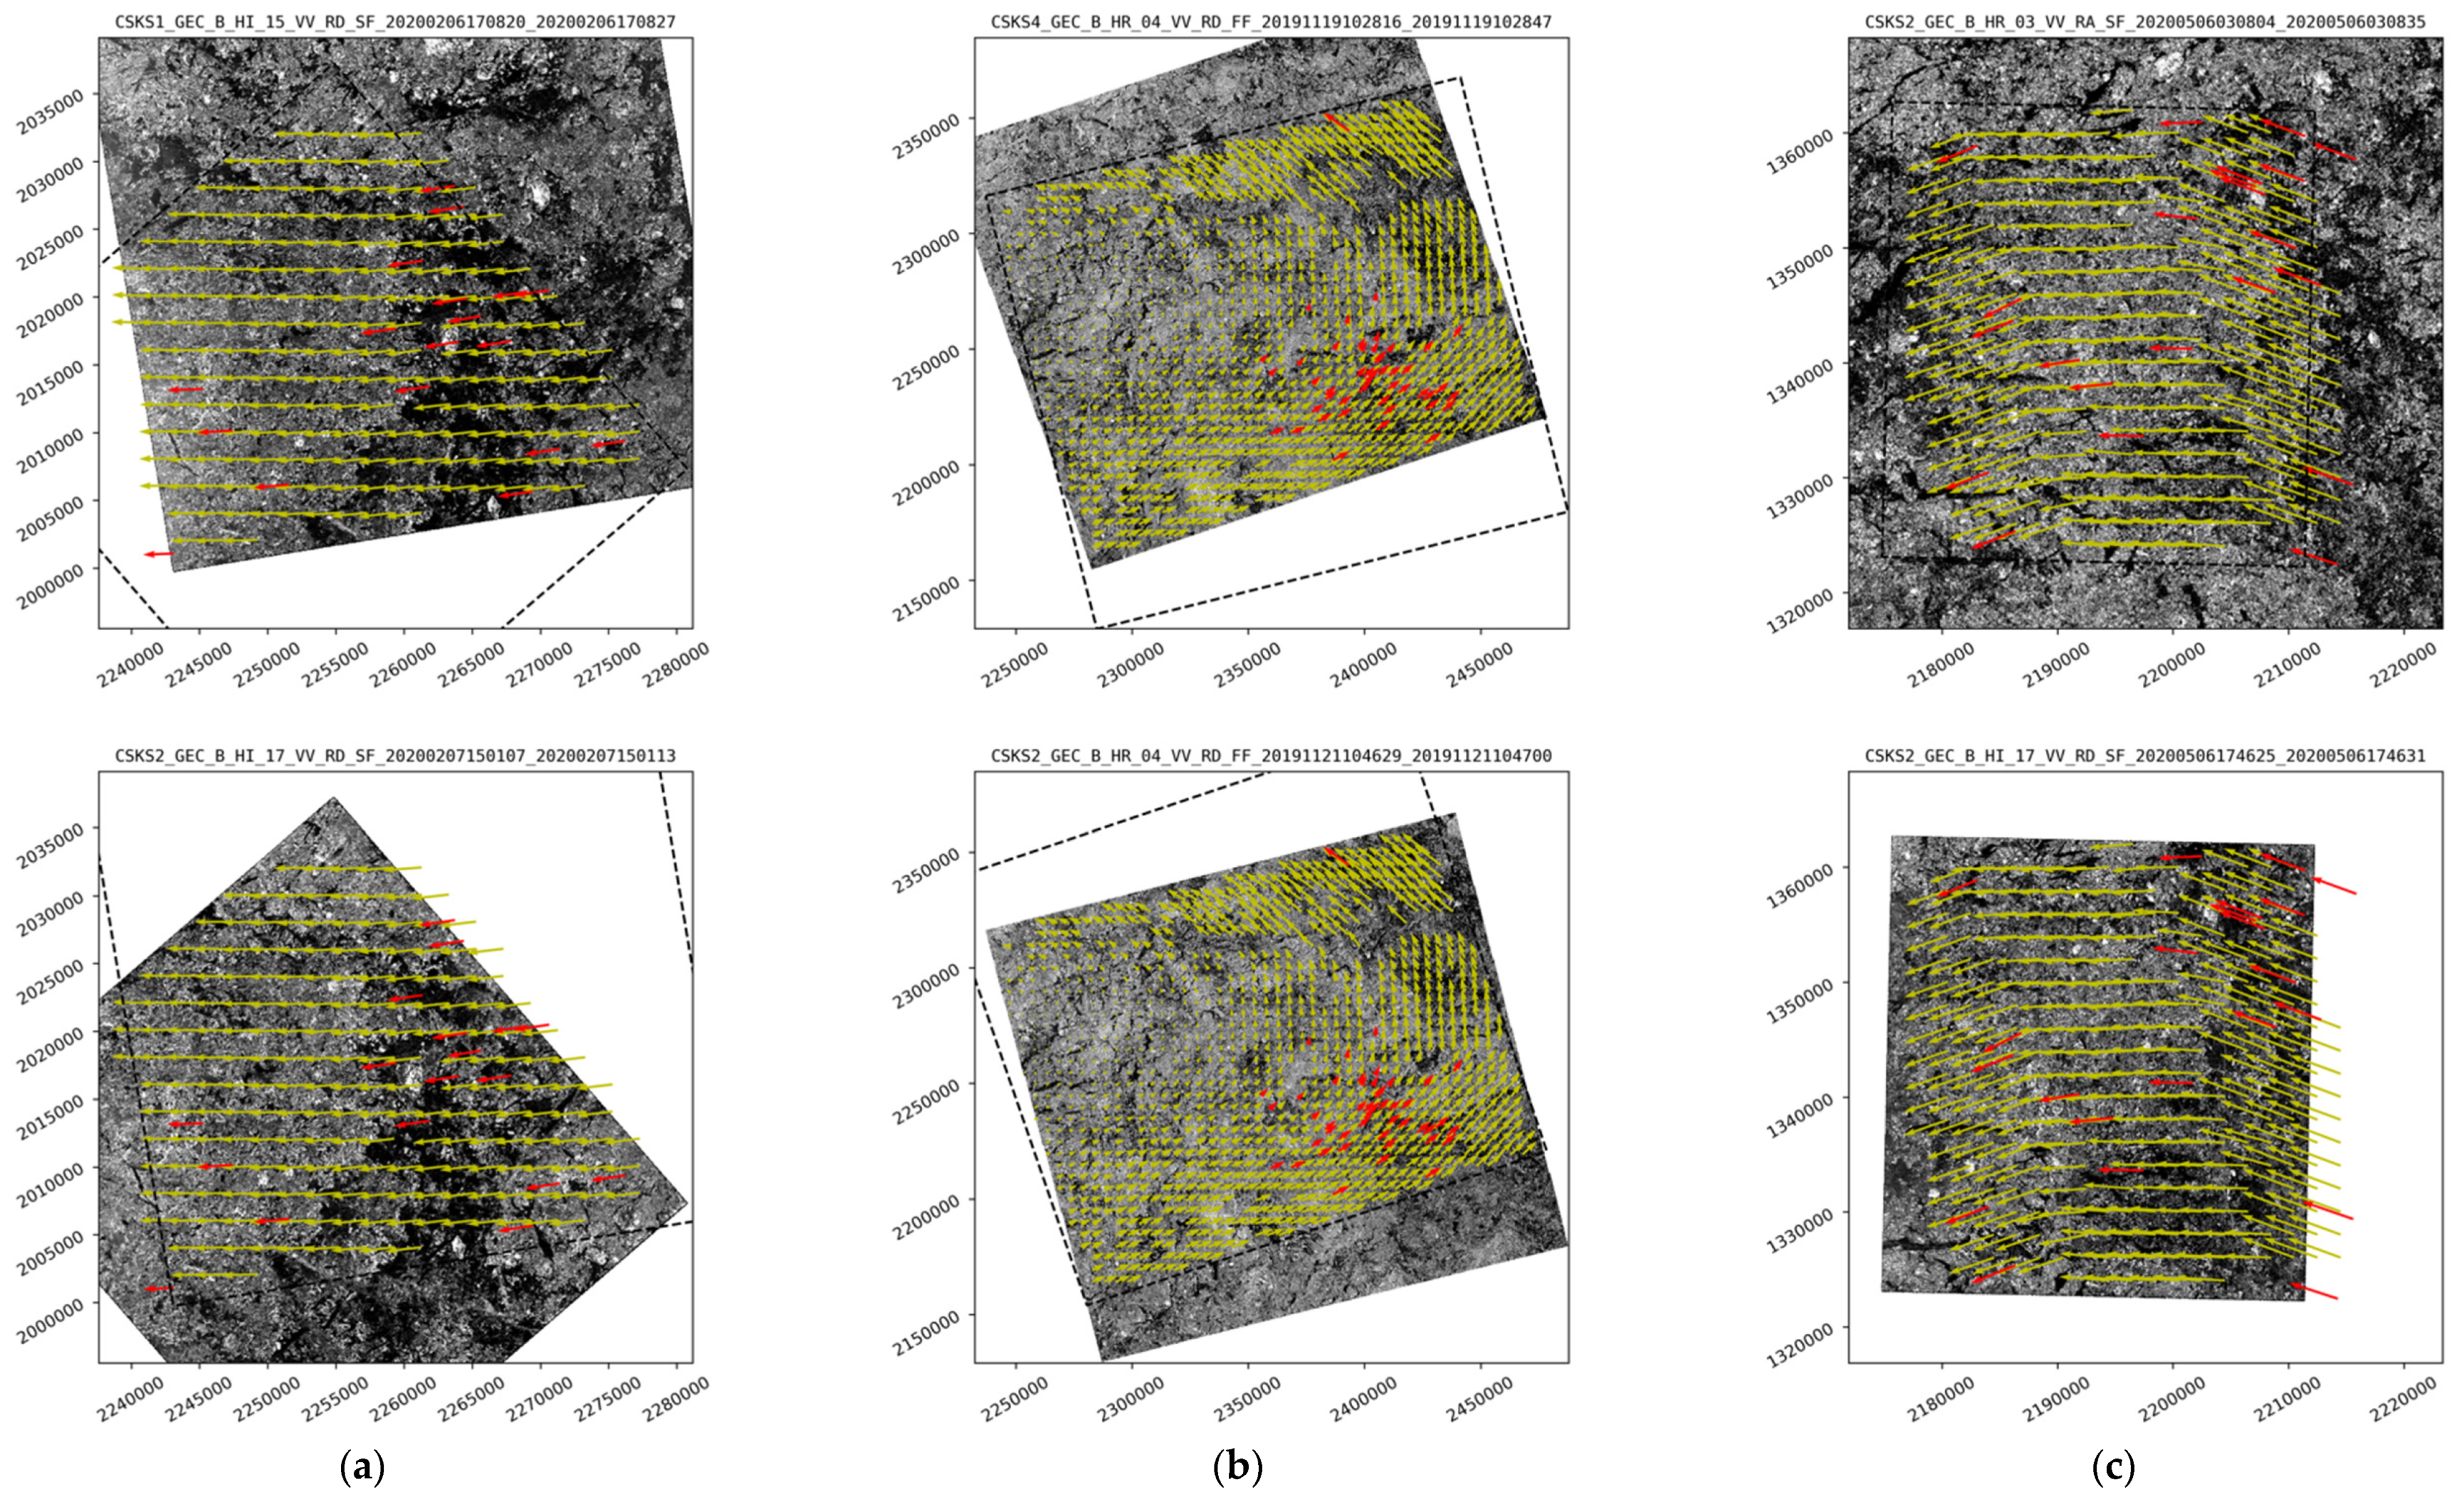
Figure 3 shows exemplary results of the drift vector estimation overlaid on each of the K5 pair images. The top and bottom panels are primary (i.e., earlier time acquisition) and secondary (later time acquisition) images, respectively, and from left to right, different mode combinations (Stripmap–Stripmap, ScanSAR–ScanSAR, Stripmap–ScanSAR) are displayed. Yellow and red arrows represent the sea ice drift vectors estimated from pattern matching and SVP buoy record, respectively. The pattern matching results are shown in subsampled form of the full grid for better visibility. Figure 4 shows another exemplary result for CSK pair images.
From the computation results, validation match-up sets were collected from the pixels where the buoy position resided at the image acquisition time. In case the drift vector extraction fails at the buoy position, the corresponding match-up set was discarded instead of using an interpolated value from the estimations nearby. Statistical parameters of the drift speed and direction were evaluated in terms of bias (i.e., mean and standard deviation of difference), normalized root mean square error (NRMSE) as a percentage, and two types of correlation coefficients: Pearson correlation ( ρ ) for drift speed and vector correlation ( ρ 2 ) for drift direction. The vector correlation [38] provided a scalar measure of consistency between two vector fields and it varied between 0.0 (no correlation) and 2.0 (perfect correlation). All the parameters were also computed with different thresholds of the maximum cross-correlation (MCC) of pattern matching result, to find the optimal condition for securing high confidence level while keeping the number of the successive drift vectors as high as possible.

3. Results

This section presents the experimental results. At first, the datasets from the two sensors were processed separately in order to intercompare their results. Then, the use of a cross-sensor was tested to evaluate the feasibility of a multi-sensor approach for increasing the observation frequency, which is the main obstacle of the conventional single-sensor approach.

3.1. KOMPSAT-5

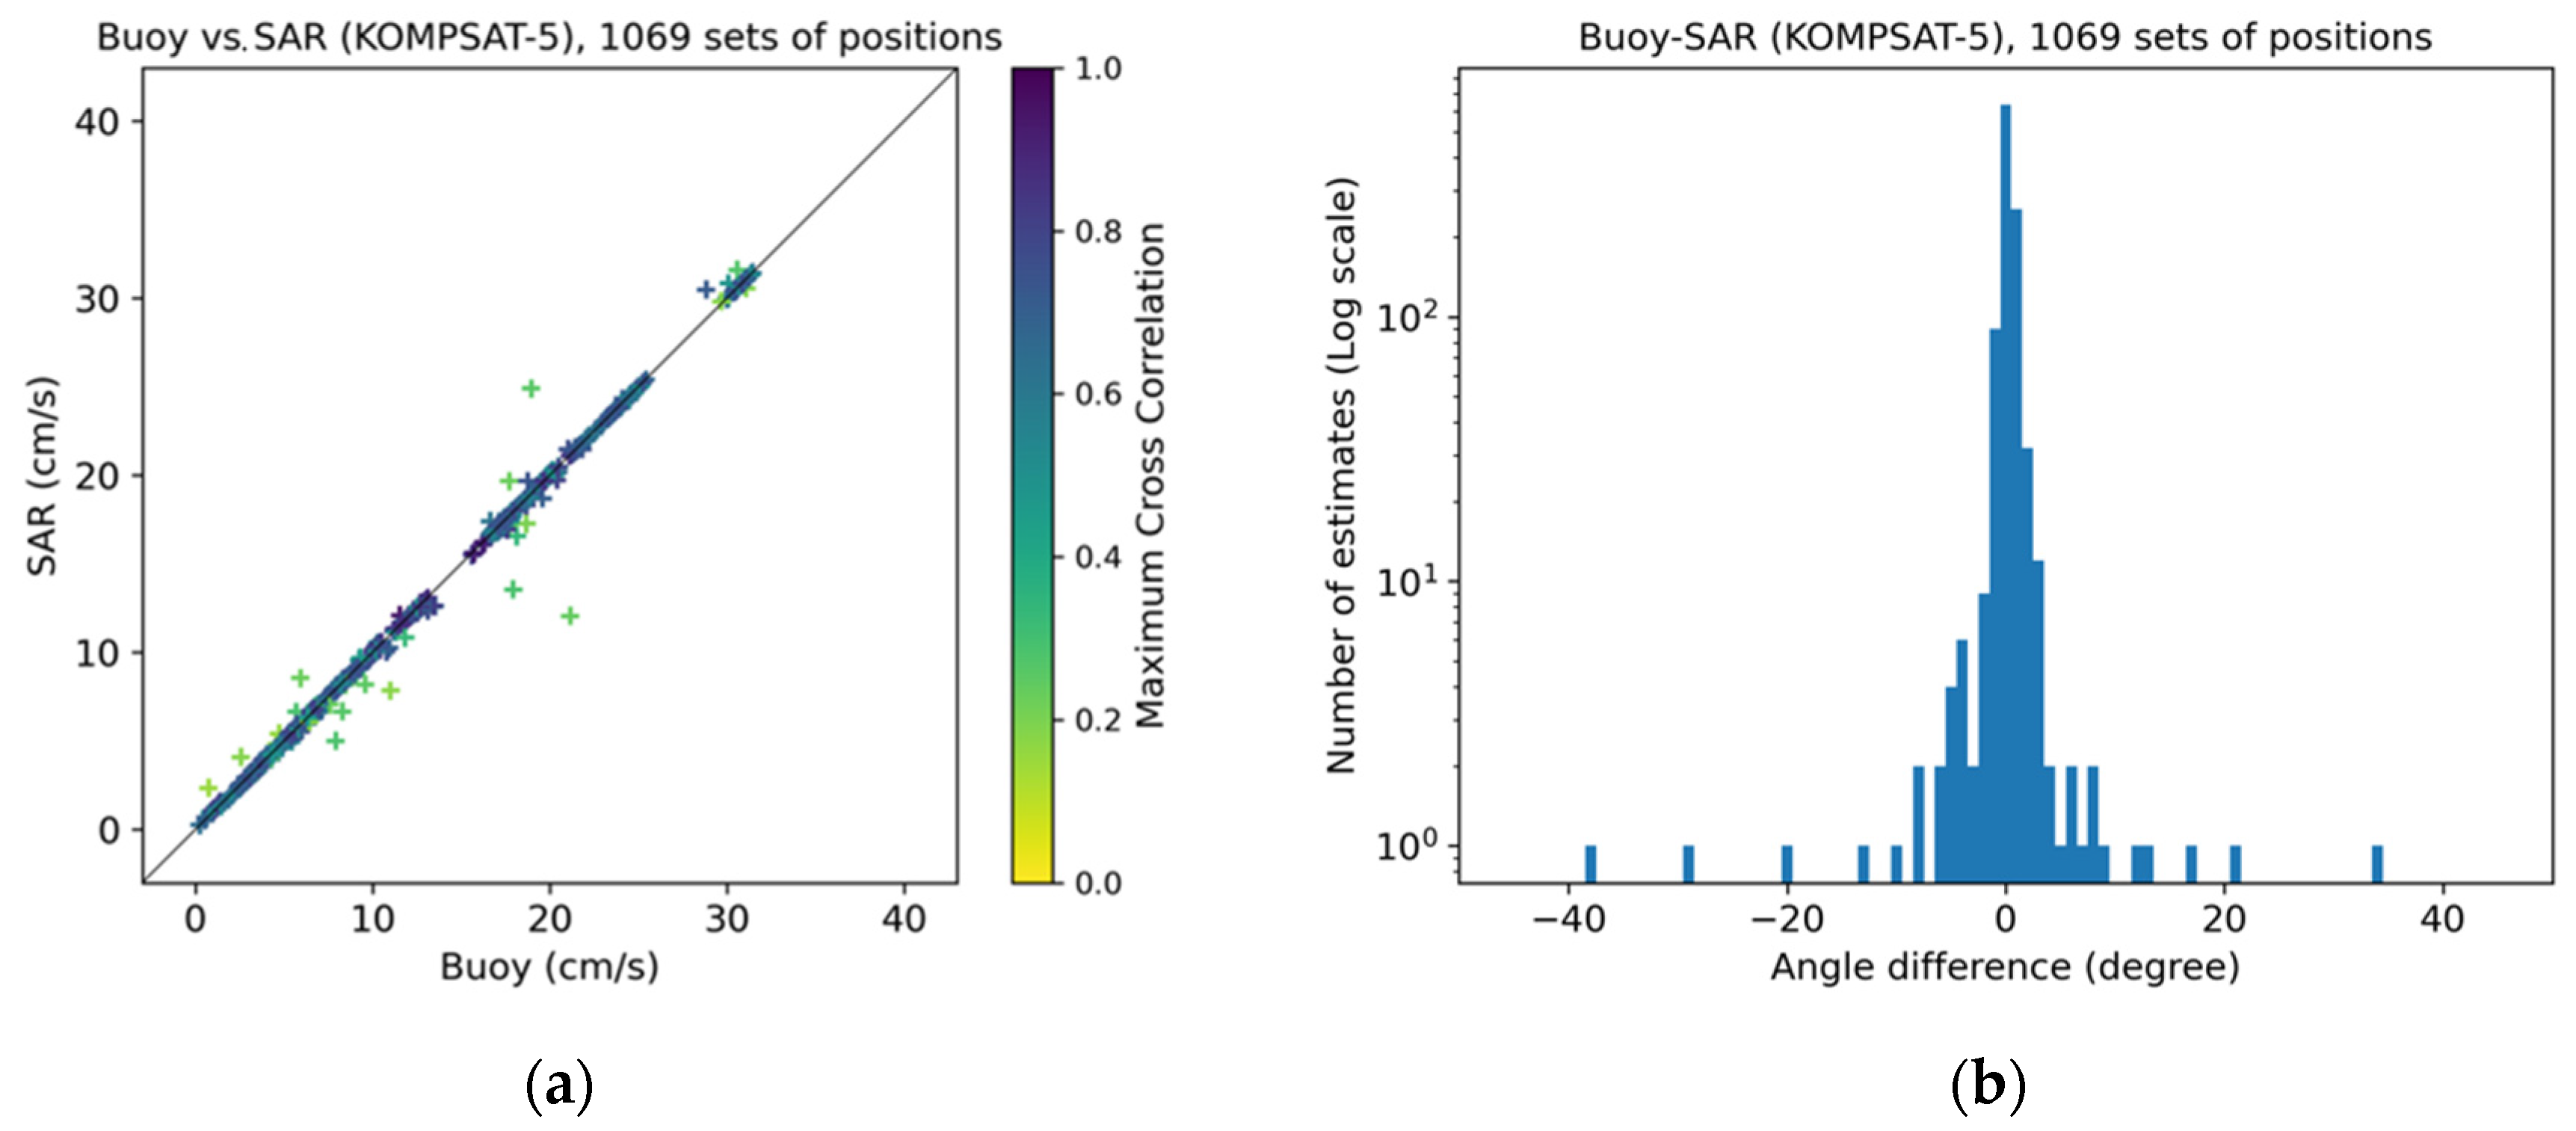
The number of the successive pairs was 66 and the mean time interval was 36.7 h. The combinations of imaging modes were similar in all cases: 27 for Stripmap–Stripmap, 20 for ScanSAR–ScanSAR, 19 for Stripmap–ScanSAR. In total, 1069 drift vector match-up sets were available for validation. Figure 5 shows the comparison of the derived drift vectors in terms of speed and direction. The drift speeds agreed well for most of the match-ups, and the deviations from the line of equality (black diagonal line) was large when the MCC of the pattern matching result was low. The drift directions also agreed well for most of the match-ups, showing a highly concentrated distribution of the angle difference at the near zero degree. Statistical parameters of the drift speed and direction are summarized in Table 2. Stable performance metrics were observed with an MCC threshold higher than 0.3. This was in line with the number given in the NERSC algorithm paper [21]. The loss of the total number of vectors compared to the case without thresholding was only 2.5%, which indicated that a simple MCC thresholding worked well for rejecting erroneous estimations.

3.2. COSMO-SkyMed

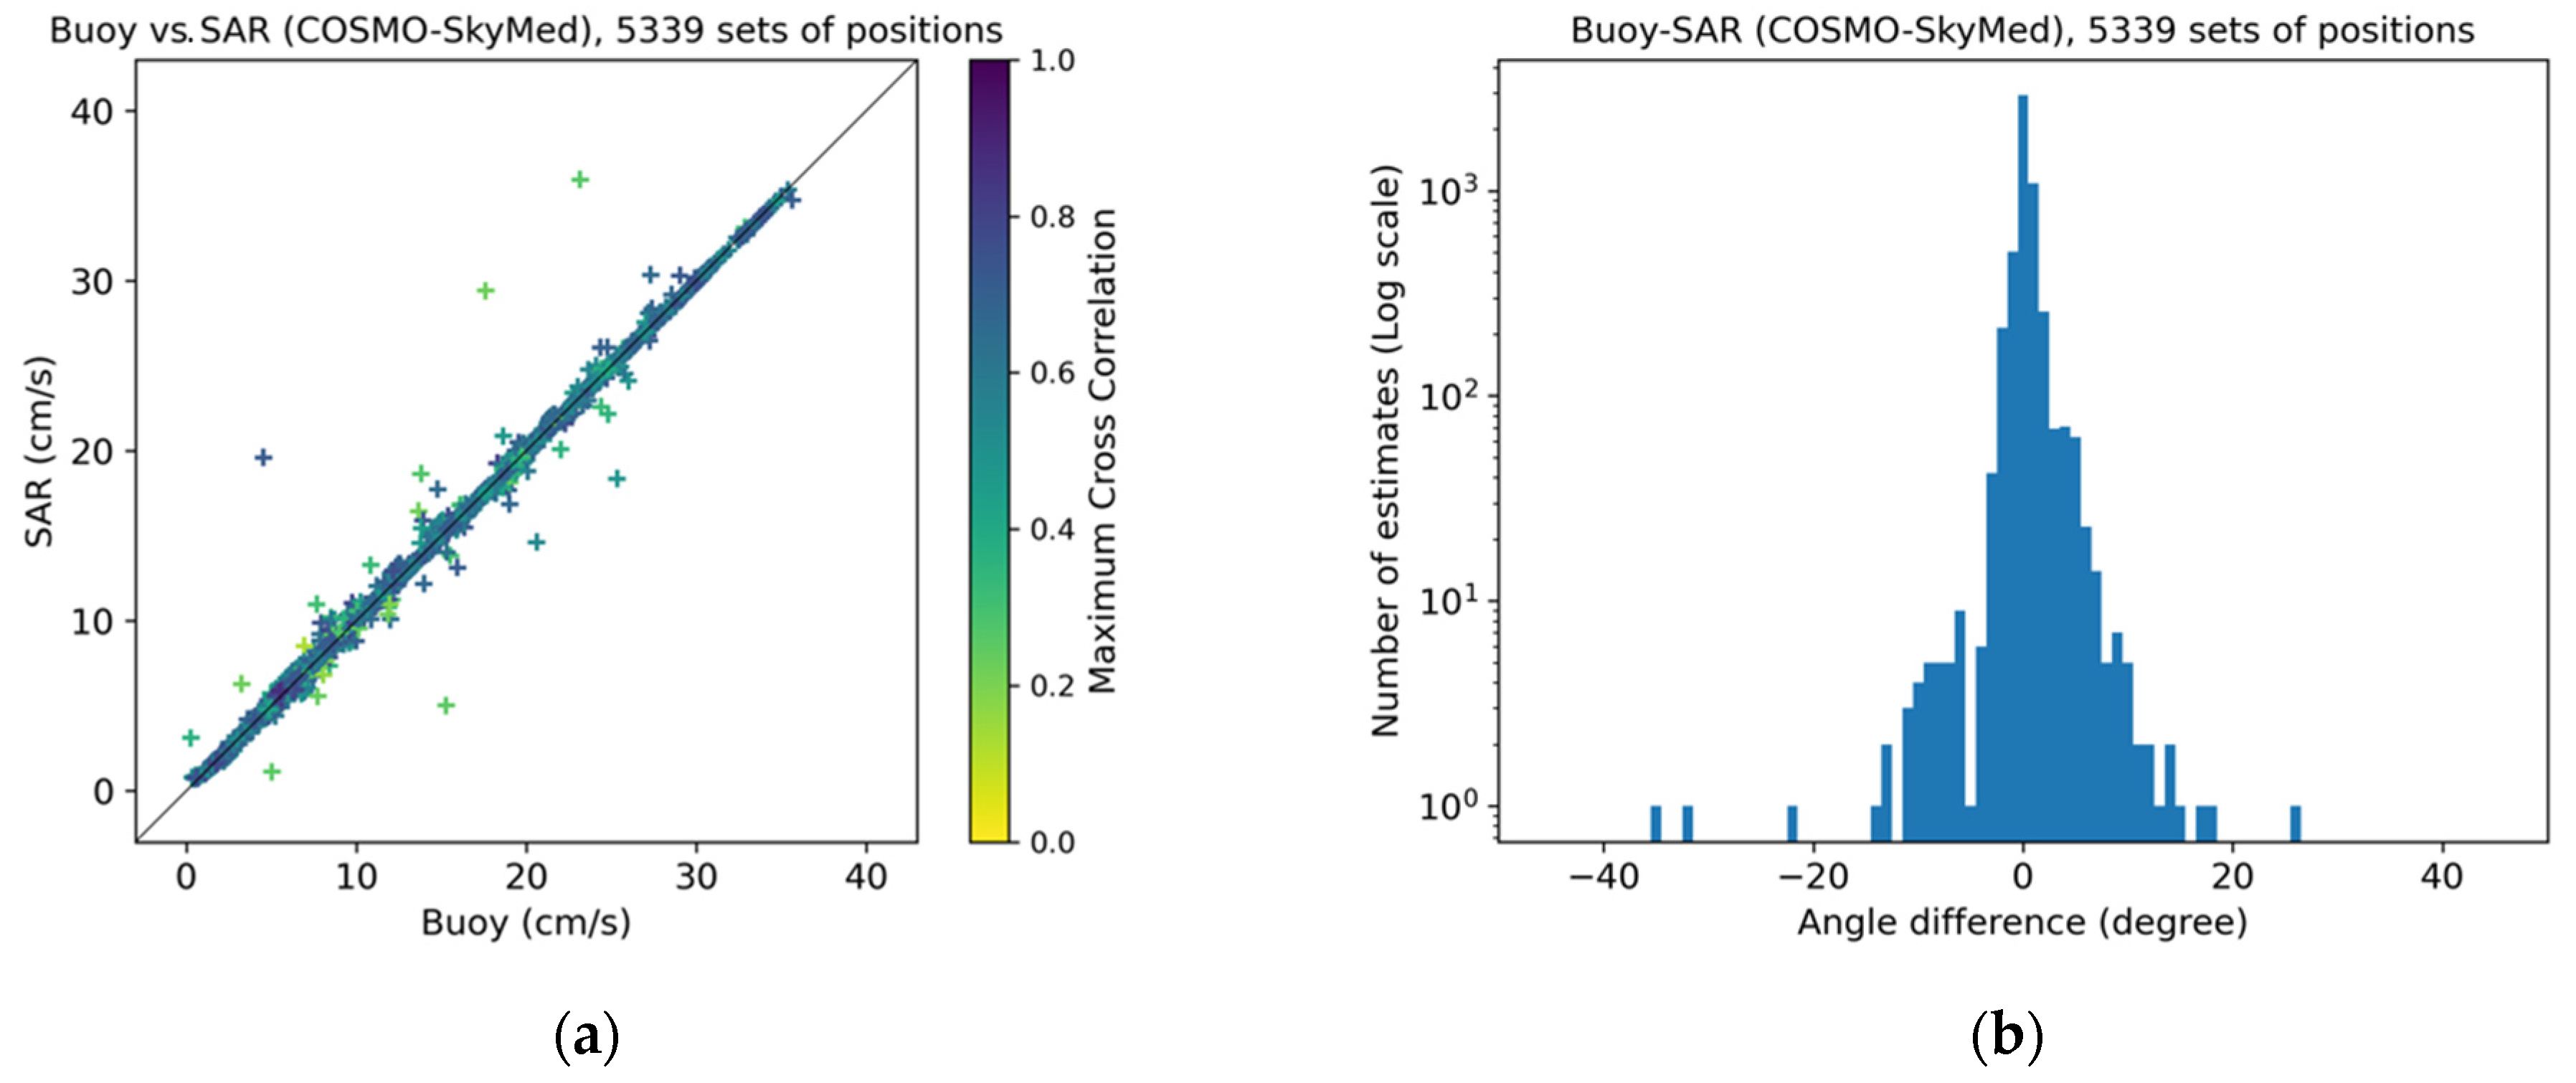
The number of the successive pairs was 167 and the mean time interval was 24.7 h. The combinations of imaging mode were not similar for each of the cases: 11 for Stripmap–Stripmap, 94 for ScanSAR–ScanSAR, 62 for Stripmap–ScanSAR. This was partly because the ScanSAR imaging swath of CSK (200 km) was much larger than that of K5 (100 km), which resulted in more chances to have an overlapped pair. In total, 5339 drift vector match-up sets were available for validation. The number of pairs and drift vector match-ups was much higher than those of K5 as the CSK consisted of four satellites. Figure 6 shows the comparison of the derived drift vectors in terms of speed and direction. Similar to the case of K5, the drift speeds agreed well for most of the match-ups, and the deviations from the line of equality were large when the MCC of the pattern matching result was low. The drift directions also agreed well for most of the match-ups, showing a highly concentrated distribution of the angle difference at the near zero degree. Statistical parameters of the drift speed and direction are summarized in Table 3. Overall metrics were similar to those of K5 (Table 2). Stable performance metrics were also observed with an MCC threshold higher than 0.3. The loss of the total number of vectors was only 0.6% compared to the case without thresholding, which was even lower compared to the case of K5.

3.3. Cross-Sensor (KOMPSAT-5 and COSMO-SkyMed)

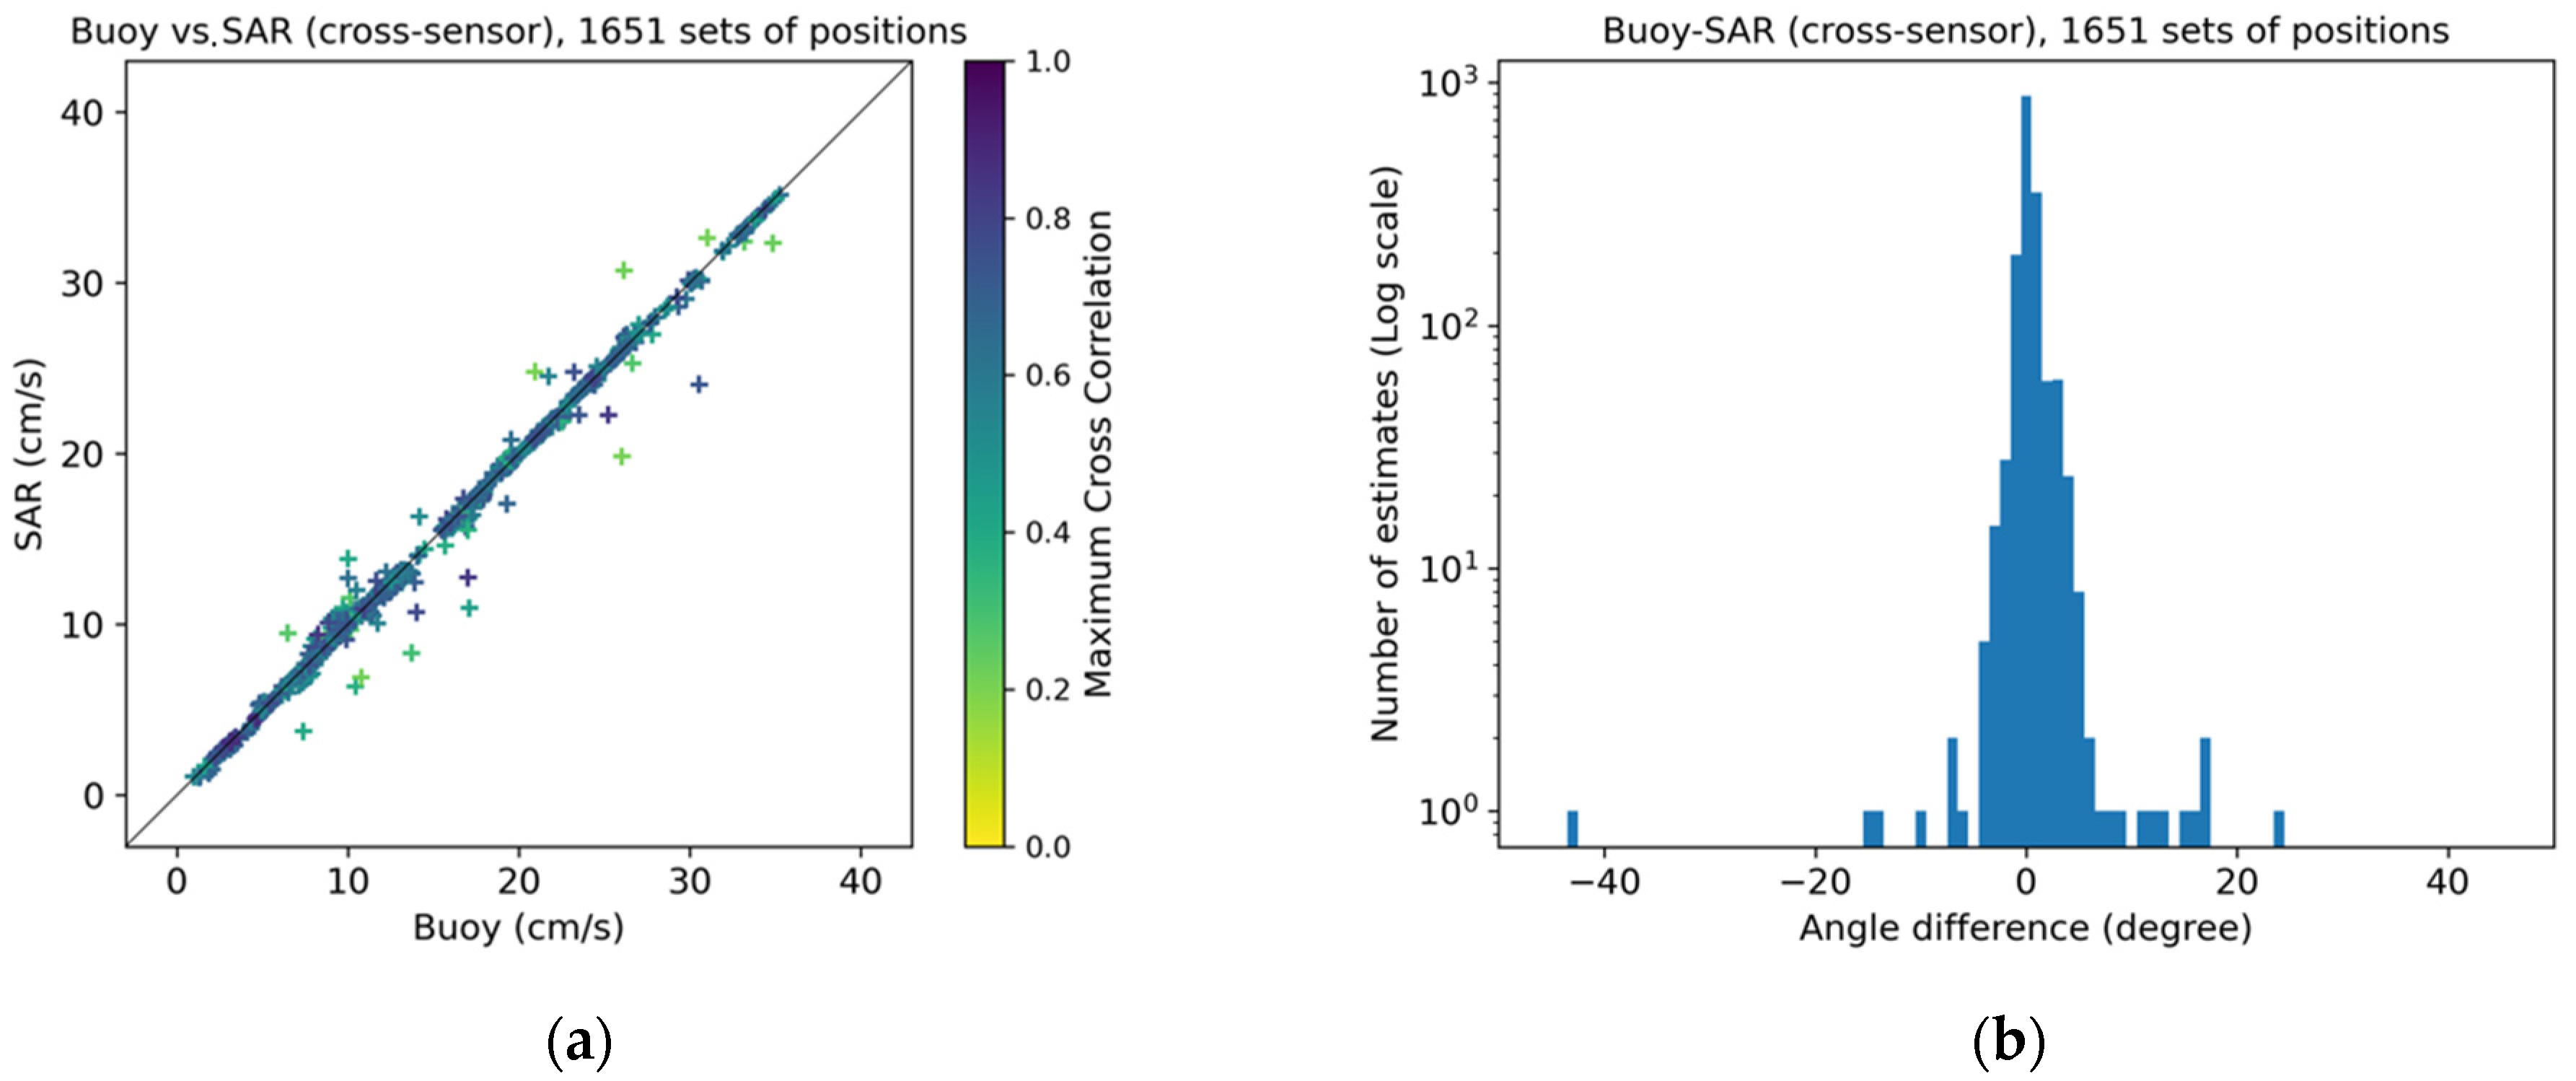
The number of the successive pairs was 82 and the mean time interval was 20.1 h. This numbers counted only for the case when (i) the merged list of K5 and CSK images was sorted by time, (ii) the consecutive images formed pairs, and, then, (iii) the pairs with same satellites were excluded. Thus, the total number of pairs in all combinations (i.e., K5–K5, CSK–CSK, and K5–CSK) was much higher in practice. The combinations of imaging mode were various: 5 for Stripmap–Stripmap, 30 for ScanSAR–ScanSAR, 47 for Stripmap–ScanSAR. In total, 1651 drift vector match-up sets were available for validation. Figure 7 shows the comparison of the derived drift vectors in terms of speed and direction. Similar to the single-sensor cases, the drift speeds agreed well in most of the match-ups, and the deviations from the line of equality were large when the MCC of the pattern matching result was low. The drift directions also agreed well for most of the match-ups, showing a highly concentrated distribution of the angle difference at the near zero degree. Statistical parameters of the drift speed and direction are summarized in Table 4. Again, the overall metrics were also similar to those of K5 and CSK (Table 2 and Table 3); however, stable performance metrics were found with an MCC threshold higher than 0.5, which was larger than the single-sensor cases. The loss of the total number of vectors was 11.8% compared to the case without thresholding, which was also larger compared to the single-sensor cases.

4. Discussion

The geolocation accuracies of K5 and CSK cannot be directly compared because they were evaluated with different standards: CE90 for K5 and three-sigma for CSK. Assuming that the geolocation error of CSK follows a normal distribution, the equivalent CE90 for the given three-sigma values (11.1 m and 6.4 m in Section 2.2) were 4.7 m and 2.7 m for Stripmap and ScanSAR modes, respectively. Nevertheless, considering the average ice drift speed (<10 cm/s) and time interval of the image pair (6–72 h), which implied a few kilometers of drift distance during the given condition, the geolocation errors of both satellite products had only marginal impact on the computed ice speed.
For all three cases (single sensor combinations of K5 and CSK and the cross-sensor combination of the two), the estimated drift vectors agreed well with in situ observations (i.e., SVP buoys); the biases of speed and direction were below 0.08 ± 0.51 cm/s and 0.46 ± 4.46 degree, respectively. The NRMSEs of speed and direction were highest for the cross-sensor case, yet they were 1.06% and 0.89%. The correlation coefficients for speed and direction were higher than 0.99 and 1.99 for all cases.
To compare the performances with those reported in the previous studies, in which the biases were given in terms of the RMSE of displacements and directional difference, the equivalent estimations were computed and presented in Table 5 for the case when the MCC was higher than the thresholds given in Section 3 (0.3 for single-sensor and 0.5 for cross-sensor). The averaged RMSEs in displacement and direction found in this study were around the 202.74 m and 1.63 degree, while those for previous studies with wide-swath C-band sensors (RADARSAT-2, Sentinel-1, and ENVISAT ASAR) were larger (286–1020 m and 3 degrees). This was primarily due to the better spatial resolution of the source image products and, potentially, to the difference in characteristics of the sea ice which varies in time and space. The dataset used in this study was acquired in favorable ice conditions: mostly multi-year ice in the high-latitude region (>80N), where the radar backscattering showed clearer features than that of first-year ice, and without significant surface melting.
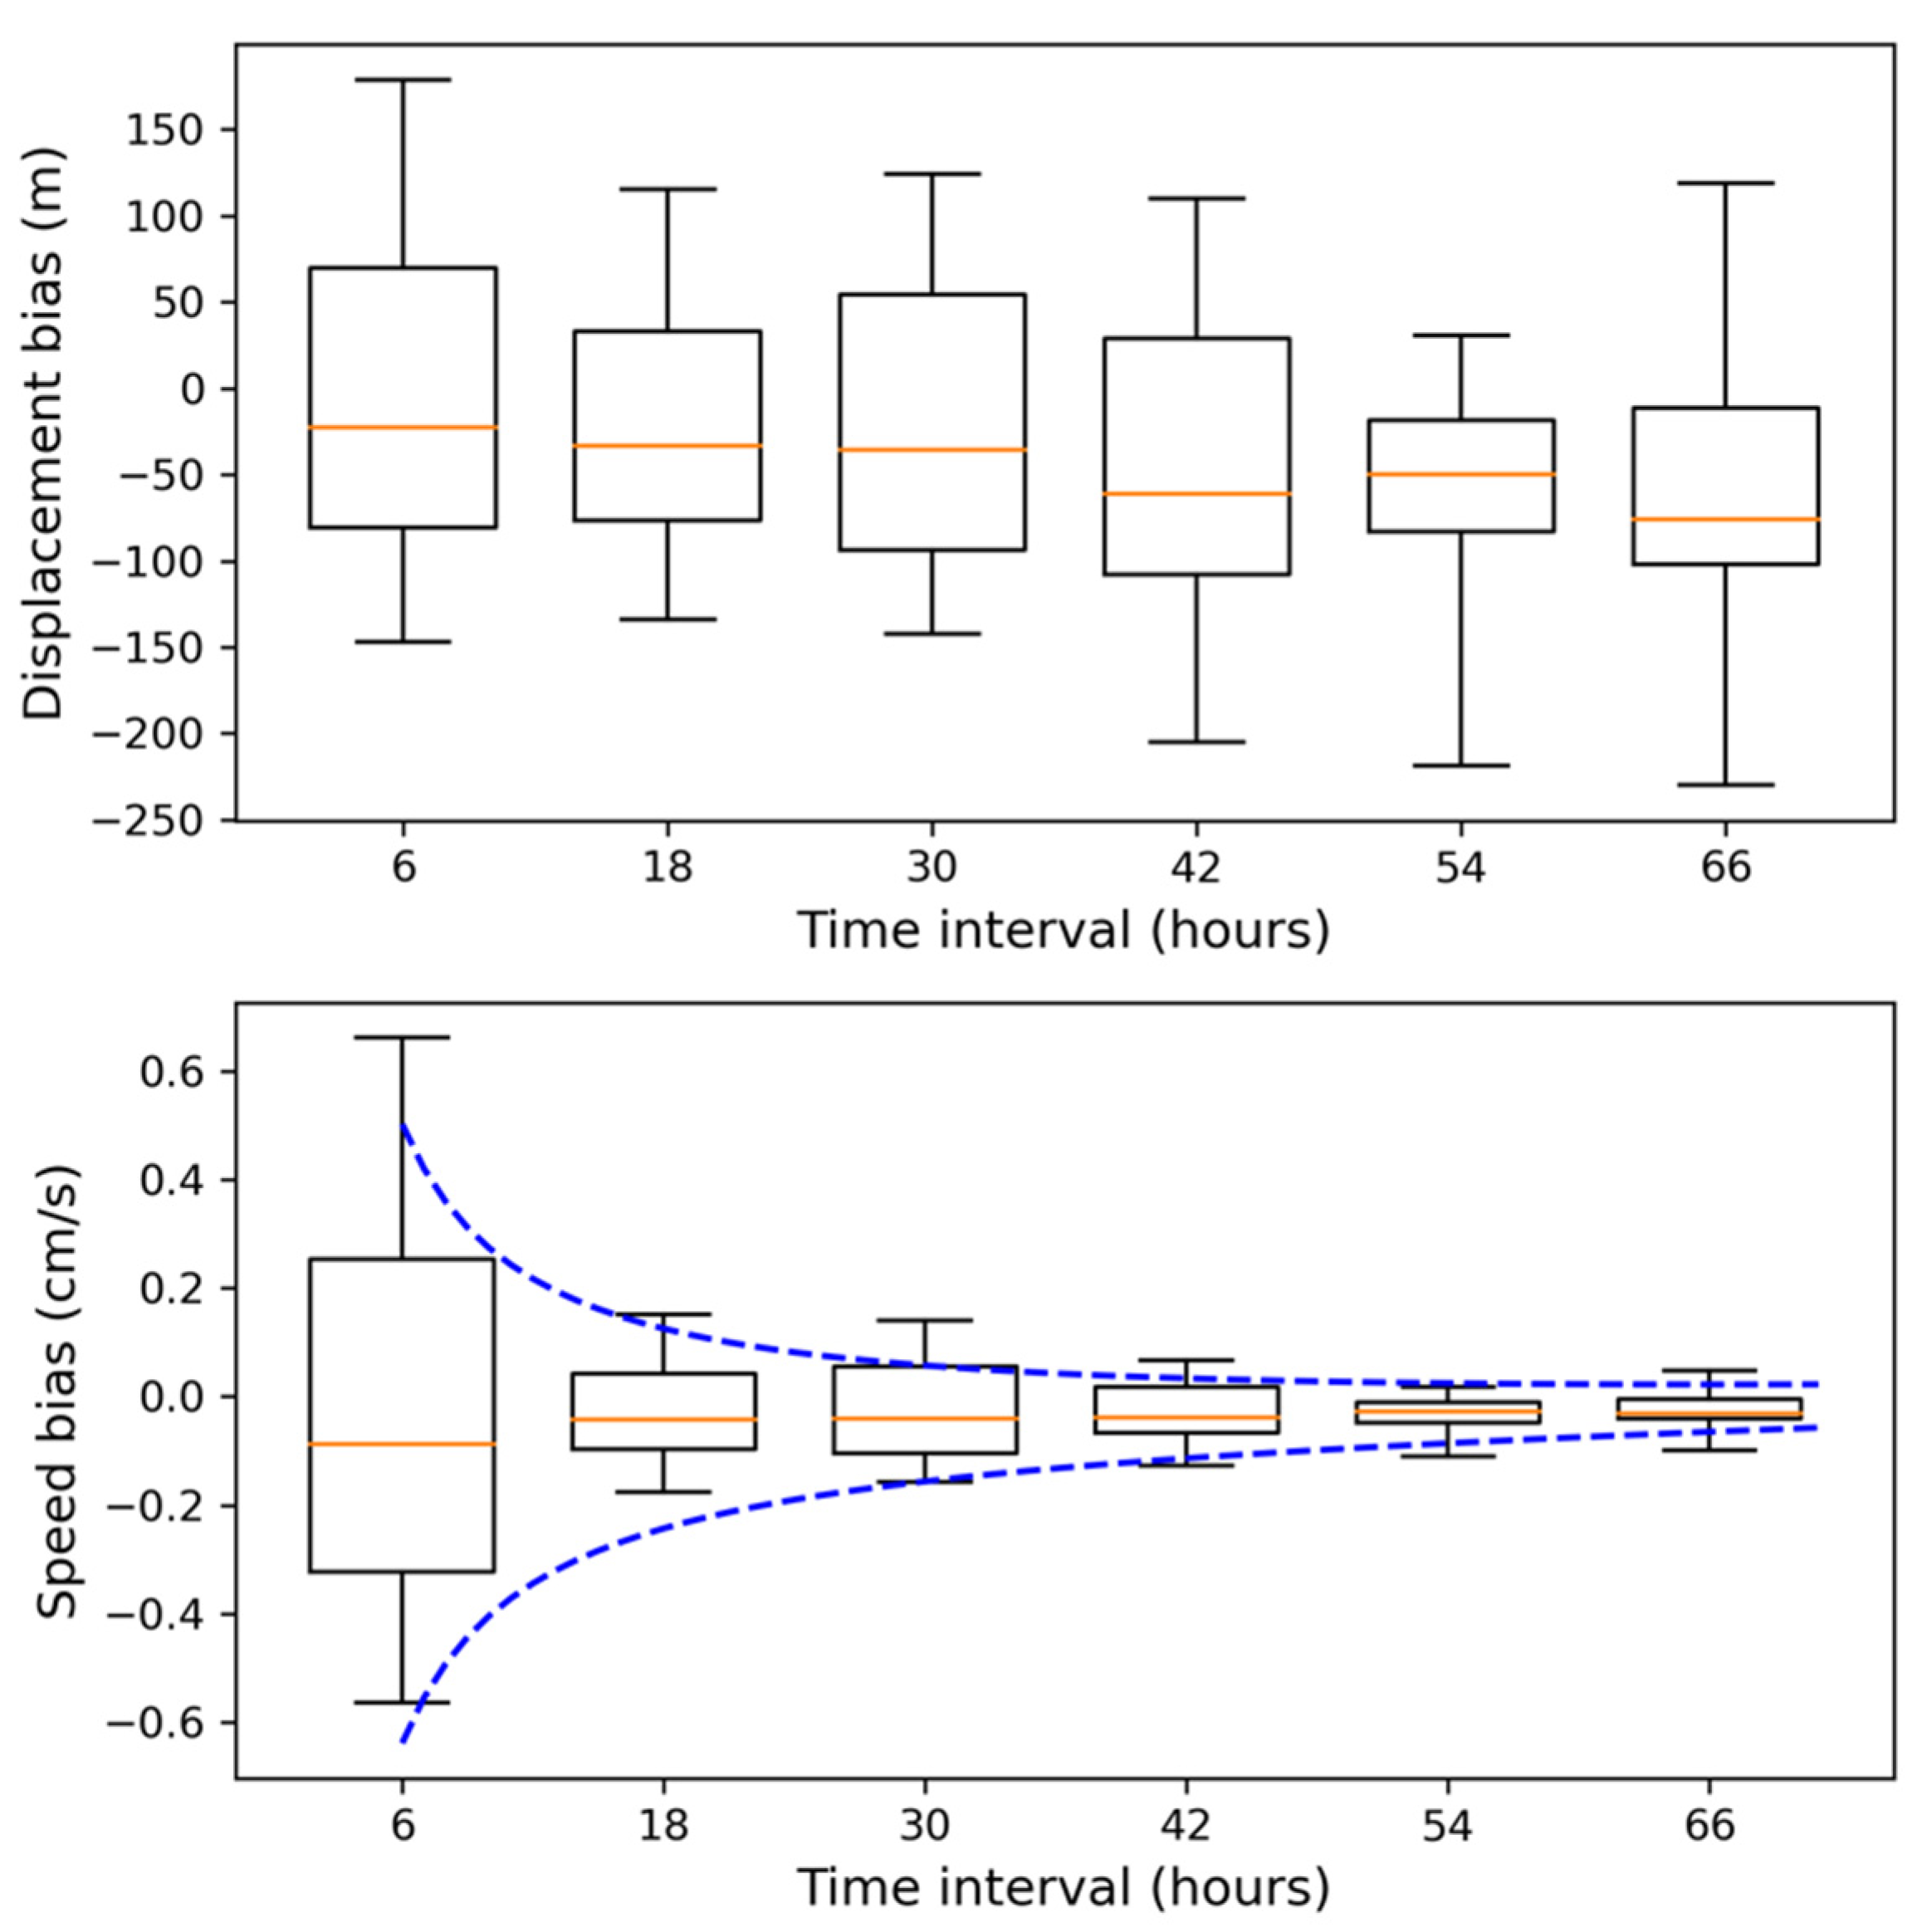
To see the bias dependencies on the time interval of pair and season, the difference in retrieved drift displacements and speeds as a function of them was drawn. Figure 8 shows graphical representations of the statistics on displacement and speed biases with the acquisition time interval between the pair images in every 12-h bins. The box extends from the lower to upper quartile values of the data, with a line at the median. The vertical bars extend from the boxes to show the 5 and 95 percentiles of the data. From the displacement bias in the upper panel, no specific trend was found, indicating the bias was almost independent from the time interval of the pair. However, a clear decreasing trend was observed in the speed bias shown in the lower panel. As the drift speed was computed by dividing the displacement by the time interval of the pair, shorter time interval resulted in larger scaling in the speed bias. Although the two parameters in the bar plot were non-independent, the scale factor was worth investigating to identify the practical relation between the variance of bias and time interval. A simple fit model to this observation could be formulated as:
E = A / Δ t + B
where E is the bias, Δ t is the time interval, and A and B are the scale factor and offset. A least square regression resulted in 3.47 ± 0.29 and −0.01 ± 0.02 for A and B , respectively. The blue dotted lines are the best fit models. According to the regression result, the time interval between primary and secondary images should be larger than 6.9 h to keep the accuracy of drift estimation below 0.5 cm/s. For direction bias, the situation was similar. The least square regression results were 10.37 ± 0.99 and 0.21 ± 0.07 for A and B , respectively, and the corresponding direction bias for 6.9 h of time interval was expected to be 1.7 degrees.
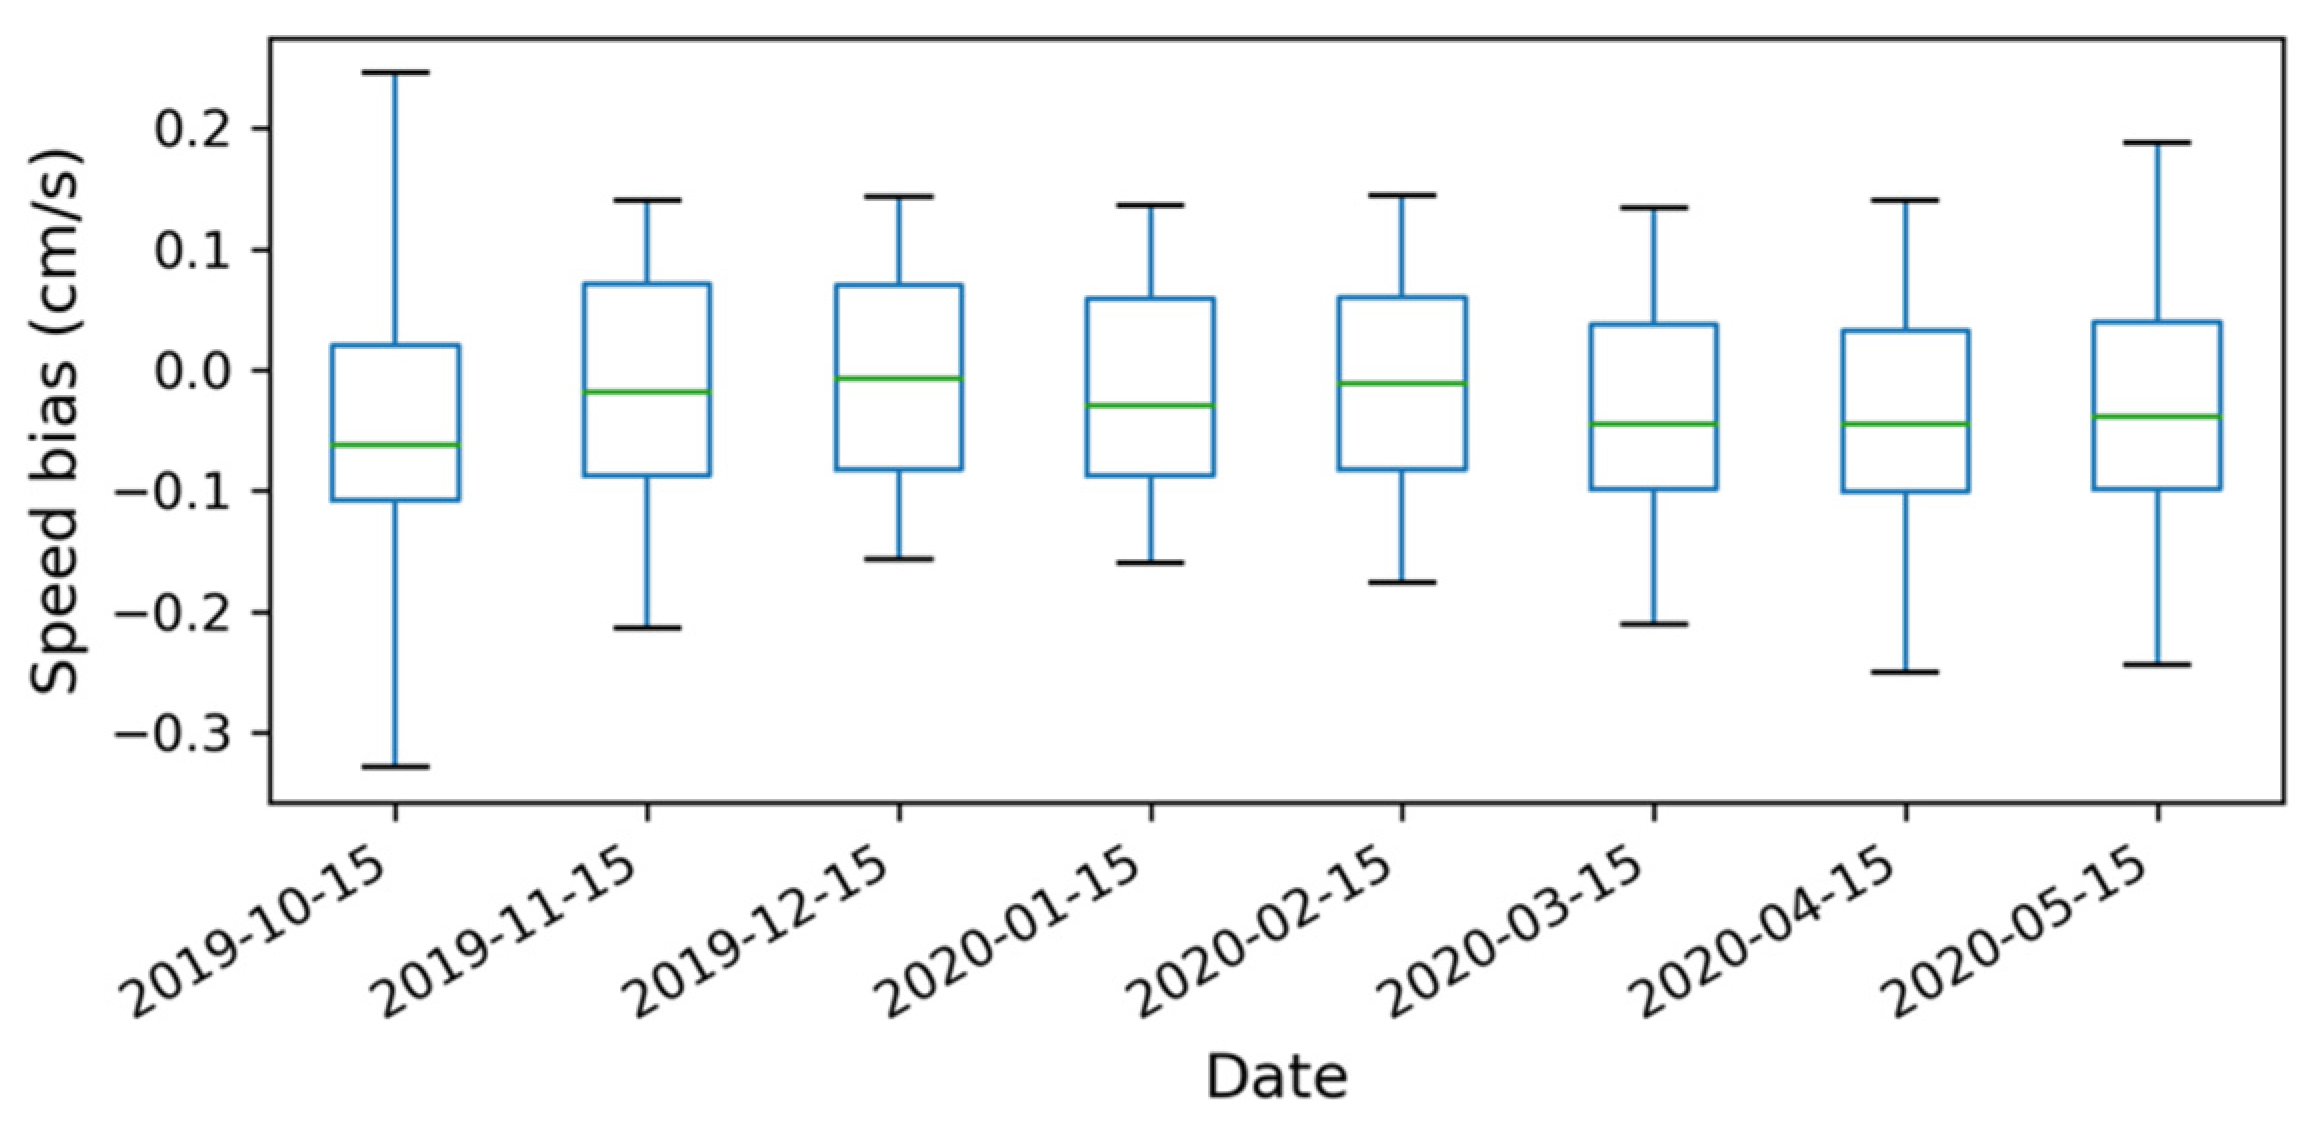
Figure 9 shows the monthly distribution of speed bias to investigate seasonal dependencies. The interquartile range did not change significantly over the given time period; however, from October 2019 to January 2020, the range of 5–95 percentile decreased gradually, indicating the occurrence of the outlier being reduced. This might be related to the consolidation and growth of sea ice which make the image features trackable better. Then, it increased from March 2020 and this seemed partly related to the complex ice deformation caused by external forcing. It was reported that stormy conditions at the MOSAiC floe were encountered in mid-November, late February, mid-April, and late May [30].
The use of a cross-sensor resulted in a good performance; however, a higher MCC threshold was required to achieve a similar level to the single-sensor. This might be caused by the fundamental difference in imaging polarization: HH for K5 and VV for CSK. It is well known that the appearance of sea ice in radar images is affected by the polarization, frequency, incidence angle, noise level, and spatial resolution of the respective SAR system or SAR imaging mode [39]. In that sense, it was expected that area correlation would decrease when images acquired with difference polarization were used. However, considering the findings that (i) the loss of the total number of vectors by increasing the MCC threshold from 0.3 to 0.5 was only 8%, (ii) the accuracies acquired with the MCC threshold of 0.3 was already high, and (iii) the observation (temporal) frequency was down to sub-daily, the advantage of using the cross-sensor approach seemed promising.
Comparing the mean time interval of the pairs using a single-sensor and multi/cross-sensor, it decreased from 36.7 h for single- (one satellite, K5) to 24.7 (four satellites, CSK) for multi-, and 20.1 for cross- (five satellites, K5 and CSK) sensor configurations. From a simple linear trend, this gives 8 h in the case when using eight X-band satellites, which might already be achievable if the datasets from TerraSAR-X/TanDEM-X/PAZ were jointly used in addition to the current dataset from K5 and CSK.
From the technical point of view, the confidence level of the results could change with a different template size and search range of feature tracking/pattern matching besides the time interval and MCC threshold which we controlled. According to the original paper of the NERSC algorithm [21], the estimation error converges when the template size and search range are larger than 40 pixels, which were the conditions that we used in our experiments.
Since the datasets were acquired mostly over the central Arctic Sea where the ice concentration is very high, the performance may not reach the same level over other areas with unfavorable conditions from the radar point of view, such as the marginal ice zone. However, one of the implications of this study was that the use of a cross-sensor is feasible, and the benefit of an increased temporal resolution is clear.

5. Conclusions

The sea ice drift estimation from high-resolution X-band SAR sensors was evaluated and validated using the extensive MOSAiC dataset of SAR images and SVP buoys. A state-of-the-art algorithm of sea ice drift retrieval (i.e., NERSC algorithm [21]) was adapted to process K5 and CSK GEC products acquired both in Stripmap and ScanSAR modes. It was confirmed that the retrieved ice drift match-ups of SAR- and buoy-derived ice motion agreed with each other very well; the statistical differences were below 0.05 ± 0.33 cm/s in speed and 0.34 ± 1.63 degrees in direction for both sensors. The overall accuracies of the high-resolution X-band sensors were better than those of wide-swath C-band sensors reported in the previous studies. From a simple model fit to the observations, the time interval between primary and secondary images of the pair should be at least 6.9 h to keep the accuracy of drift estimation below 0.5 cm/s.
We also tested the feasibility of the multi-sensor approach by using a cross-sensor combination of K5 and CSK. The results were comparable to the single-sensor case, while a slightly stricter error control criterion of the MCC thresholding was required, primarily due to the difference in radar polarization. Since the use of a cross-sensor can reduce the main drawback of high-resolution sensors, the relatively long revisit time, sub-daily monitoring seems to be feasible from the SAR-only observation.

Author Contributions

Conceptualization, J.-W.P.; methodology, J.-W.P., A.K. and D.D.; software, J.-W.P. and A.K.; validation, J.-W.P.; formal analysis, J.-W.P.; investigation, J.-W.P.; resources, H.-C.K. and S.Z.; writing—original draft preparation, J.-W.P.; writing—review and editing, J.-W.P., H.-C.K., A.K., D.D., S.Z., S.H.K., Y.-J.K., H.H. and C.-U.H.; visualization, J.-W.P.; funding acquisition, H.-C.K. All authors have read and agreed to the published version of the manuscript.

Funding

This research was funded by the Korea Polar Research Institute, grant number PE21040.

Institutional Review Board Statement

Not applicable.

Informed Consent Statement

Not applicable.

Data Availability Statement

The KOMPSAT-5 and COSMO-SkyMed datasets are not publicly available due to their data sharing policy. The buoy data is available on https://data.meereisportal.de/data/buoys/processed/MOSAiC/mosaic_buoy_data.zip (accessed on 21 June 2021).

Acknowledgments

Data used in this manuscript were produced as part of the international Multidisciplinary drifting Observatory for the Study of the Arctic Climate (MOSAiC) with the tag MOSAiC20192020. The KOMPSAT-5 data were provided to H.-C.K. based on an agreement between the Korea Polar Research Institute and Korea Aerospace Research Institute. KOMPSAT-5 Product—©KARI—Korea Aerospace Research Institute—(2019–2020). All Rights Reserved. The COSMO-SkyMed data were provided to S.Z. as part of the project IsCSK4Mosaic of the Italian Space Agency and the Institute of Polar Sciences. COSMO-SkyMed Product—©ASI—Agenzia Spaziale Italiana—(2019–2020). All Rights Reserved.

Conflicts of Interest

The authors declare no conflict of interest.

References

  1. Serreze, M.C.; Barrett, A.P.; Slater, A.G.; Steele, M.; Zhang, J.; Trenberth, K.E. The large-scale energy budget of the Arctic. J. Geophys. Res. 2007, 112, D11122. [Google Scholar] [CrossRef] [Green Version]
  2. Vihma, T. Effects of Arctic Sea Ice Decline on Weather and Climate: A Review. Surv. Geophys. 2014, 35, 1175–1214. [Google Scholar] [CrossRef] [Green Version]
  3. Maykut, G.A. The Surface Heat and Mass Balance. In The Geophysics of Sea Ice; Untersteiner, N., Ed.; NATO ASI Series (Series B: Physics); Springer: Boston, MA, USA, 1986. [Google Scholar] [CrossRef]
  4. Curry, J.A.; Schramm, J.L.; Ebert, E.E. Sea Ice-Albedo Climate Feedback Mechanism. J. Clim. 1995, 8, 240–247. [Google Scholar] [CrossRef]
  5. Thorndike, A.S.; Rothrock, D.A.; Maykut, G.A.; Colony, R. The thickness distribution of sea ice. J. Geophys. Res. 1975, 80, 4501–4513. [Google Scholar] [CrossRef]
  6. Kwok, R.; Cunningham, G.F. Contributions of growth and deformation to monthly variability in sea ice thickness north of the coasts of Greenland and the Canadian Arctic Archipelago. Geophys. Res. Lett. 2016, 43, 8097–8105. [Google Scholar] [CrossRef]
  7. Tschudi, M.; Meier, W.N.; Stewart, J.S.; Fowler, C.; Maslanik, J. Polar Pathfinder Daily 25 km EASE-Grid Sea Ice Motion Vectors, Version 4; NASA National Snow and Ice Data Center Distributed Active Archive Center: Boulder, CO, USA, 2019. Available online: https://nsidc.org/data/NSIDC-0116/versions/3 (accessed on 15 July 2021). [CrossRef]
  8. Lindsay, R.; Schweiger, A. Arctic sea ice thickness loss determined using subsurface, aircraft, and satellite observations. Cryosphere 2015, 9, 269–283. [Google Scholar] [CrossRef] [Green Version]
  9. Spreen, G.; Kwok, R.; Menemenlis, D. Trends in Arctic sea ice drift and role of wind forcing: 1992–2009. Geophys. Res. Lett. 2011, 38, L19501. [Google Scholar] [CrossRef] [Green Version]
  10. Rampal, P.; Weiss, J.; Marsan, D. Positive trend in the mean speed and deformation rate of Arctic sea ice, 1979–2007. J. Geophys. Res. 2009, 114, C05013. [Google Scholar] [CrossRef]
  11. Farooq, U.; Rack, W.; McDonald, A.; Howell, S. Long-Term Analysis of Sea Ice Drift in the Western Ross Sea, Antarctica, at High and Low Spatial Resolution. Remote Sens. 2020, 12, 1402. [Google Scholar] [CrossRef]
  12. Rampal, P.; Bouillon, S.; Ólason, E.; Morlighem, M. neXtSIM: A new Lagrangian sea ice model. Cryosphere 2016, 10, 1055–1073. [Google Scholar] [CrossRef] [Green Version]
  13. Rampal, P.; Dansereau, V.; Olason, E.; Bouillon, S.; Williams, T.; Korosov, A.; Samaké, A. On the multi-fractal scaling properties of sea ice deformation. Cryosphere 2019, 13, 2457–2474. [Google Scholar] [CrossRef] [Green Version]
  14. Emery, W.J.; Fowler, C.W.; Hawkins, J.; Preller, R.H. Fram Strait satellite image-derived ice motions. J. Geophys. Res. 1991, 96, 4751–4768. [Google Scholar] [CrossRef]
  15. Agnew, T.; Le, H.; Hirose, T. Estimation of large-scale sea-ice motion from SSM/I 85.5 GHz imagery. Ann. Glaciol. 1997, 25, 305–311. [Google Scholar] [CrossRef] [Green Version]
  16. Haarpaintner, J. Arctic-wide operational sea ice drift from enhanced-resolution QuikSCAT/SeaWinds scatterometry and its validation. IEEE Trans. Geosci. Remote Sens. 2006, 44, 102–107. [Google Scholar] [CrossRef]
  17. Kwok, R.; Curlander, J.C.; McConnell, R.; Pang, S. An Ice Motion Tracking System at the Alaska SAR Facility. IEEE J. Ocean. Eng. 1990, 15, 44–54. [Google Scholar] [CrossRef]
  18. Thomas, M.; Geiger, C.A.; Kambhamettu, C. High resolution (400 m) motion characterization of sea ice using ERS-1 SAR imagery. Cold Reg. Sci. Technol. 2008, 52, 207–223. [Google Scholar] [CrossRef]
  19. Hollands, T.; Dierking, W. Performance of a multiscale correlation algorithm for the estimation of sea-ice drift from SAR images: Initial results. Ann. Glaciol. 2011, 52, 311–317. [Google Scholar] [CrossRef] [Green Version]
  20. Komarov, A.S.; Barber, D.G. Sea Ice Motion Tracking from Sequential Dual-Polarization RADARSAT-2 Images. IEEE Trans. Geosci. Remote Sens. 2014, 52, 121–136. [Google Scholar] [CrossRef]
  21. Korosov, A.A.; Rampal, P. A Combination of Feature Tracking and Pattern Matching with Optimal Parametrization for Sea Ice Drift Retrieval from SAR Data. Remote Sens. 2017, 9, 258. [Google Scholar] [CrossRef] [Green Version]
  22. Demchev, D.; Volkov, V.; Kazakov, E.; Alcantarilla, P.F.; Sandven, S.; Khmeleva, V. Sea Ice Drift Tracking from Sequential SAR Images Using Accelerated-KAZE Features. IEEE Trans. Geosci. Remote Sens. 2017, 55, 5174–5184. [Google Scholar] [CrossRef]
  23. Copernicus Marine Service. SEAICE_GLO_SEAICE_L4_NRT_OBSERVATIONS_011_006. Available online: https://resources.marine.copernicus.eu/?option=com_csw&view=details&product_id=SEAICE_GLO_SEAICE_L4_NRT_OBSERVATIONS_011_006 (accessed on 15 July 2021).
  24. Ignatenko, V.; Laurila, P.; Radius, A.; Lamentowski, L.; Antropov, O.; Muff, D. ICEYE Microsatellite SAR Constellation Status Update: Evaluation of First Commercial Imaging Modes. In Proceedings of the IGARSS 2020—IEEE International Geoscience and Remote Sensing Symposium, Virtual Symposium, Waikoloa, HI, USA , 26 September–2 October 2020; pp. 3581–3584. [Google Scholar] [CrossRef]
  25. Frost, A.; Jacobsen, S.; Singha, S. High resolution sea ice drift estimation using combined TerraSAR-X and RADARSAT-2 data: First tests. Proceedings of IGARSS 2017—IEEE International Geoscience and Remote Sensing Symposium, Fort Worth, TX, USA, 23–28 July 2017; pp. 342–345. [Google Scholar] [CrossRef] [Green Version]
  26. Krumpen, T.; Birrien, F.; Kauker, F.; Rackow, T.; von Albedyll, L.; Angelopoulos, M.; Belter, H.J.; Bessonov, V.; Damm, E.; Dethloff, K.; et al. The MOSAiC ice floe: Sediment-laden survivor from the Siberian shelf. Cryosphere 2020, 14, 2173–2187. [Google Scholar] [CrossRef]
  27. Korea Aerospace Research Institute (KARI). SI Imaging Services. KOMPSAT-5 Product Specifications. Available online: http://www.si-imaging.com/wp-content/uploads/2016/12/KOMPSAT-5_Standard_Products_Specifications_v1.2.pdf (accessed on 15 July 2021).
  28. Agenzia Spaziale Italiana (ASI). COSMO-SkyMed Mission and Products Description. Available online: https://www.asi.it/wp-content/uploads/2019/08/COSMO-SkyMed-Mission-and-Products-Description_rev3-2.pdf (accessed on 15 July 2021).
  29. Rabe, B.; Team MOSAiC Distributed Network. Autonomously observing coupled Arctic processes year-round: The Distributed Network of ice-tethered buoys during MOSAiC. In Proceedings of the EGU General Assembly 2021, Online, 19–30 April 2021; p. EGU21-9496. [Google Scholar] [CrossRef]
  30. Krumpen, T.; von Albedyll, L.; Goessling, H.F.; Hendricks, S.; Juhls, B.; Spreen, G.; Willmes, S.; Belter, H.J.; Dethloff, K.; Haas, C.; et al. The MOSAiC Drift: Ice conditions from space and comparison with previous years. Cryosphere 2021, 15, 3897–3920. [Google Scholar] [CrossRef]
  31. SI Imaging Services. KOMPSAT-5 Imagery Quality Report (September & October 2019). Available online: https://www.si-imaging.com/resources/?pageid=2&mod=document&keyword=KOMPSAT&uid=363 (accessed on 15 July 2021).
  32. SI Imaging Services. KOMPSAT-5 Imagery Quality Report (November & December 2019). Available online: https://www.si-imaging.com/resources/?pageid=2&mod=document&keyword=KOMPSAT&uid=368 (accessed on 15 July 2021).
  33. SI Imaging Services. KOMPSAT-5 Imagery Quality Report (January & February 2020). Available online: https://www.si-imaging.com/resources/?pageid=2&mod=document&keyword=KOMPSAT&uid=377 (accessed on 15 July 2021).
  34. SI Imaging Services. KOMPSAT-5 Imagery Quality Report (March & April 2020). Available online: https://www.si-imaging.com/resources/?pageid=1&mod=document&keyword=KOMPSAT&uid=385 (accessed on 15 July 2021).
  35. Hall, R.T.; Rothrock, D.A. Sea ice displacement from Seasat synthetic aperture radar. J. Geophys. Res. 1981, 86, 11078–11082. [Google Scholar] [CrossRef] [Green Version]
  36. Fily, M.; Rothrock, D.A. Sea Ice Tracking by Nested Correlations. IEEE Trans. Geosci. Remote Sens. 1987, GE-25, 570–580. [Google Scholar] [CrossRef]
  37. Korosov, A.A.; Hansen, M.W.; Dagestad, K.-F.; Yamakawa, A.; Vines, A.; Riechert, M. Nansat: A Scientist-Orientated Python Package for Geospatial Data Processing. J. Open Res. Softw. 2016, 4. [Google Scholar] [CrossRef] [Green Version]
  38. Crosby, D.S.; Breaker, L.C.; Gemmill, W.H. A Proposed Definition for Vector Correlation in Geophysics: Theory and Application. J. Atmos. Ocean. Technol. 1993, 10, 355–367. [Google Scholar] [CrossRef]
  39. Dierking, W. Sea ice monitoring by synthetic aperture radar. Oceanography 2013, 26, 100–111. [Google Scholar] [CrossRef]
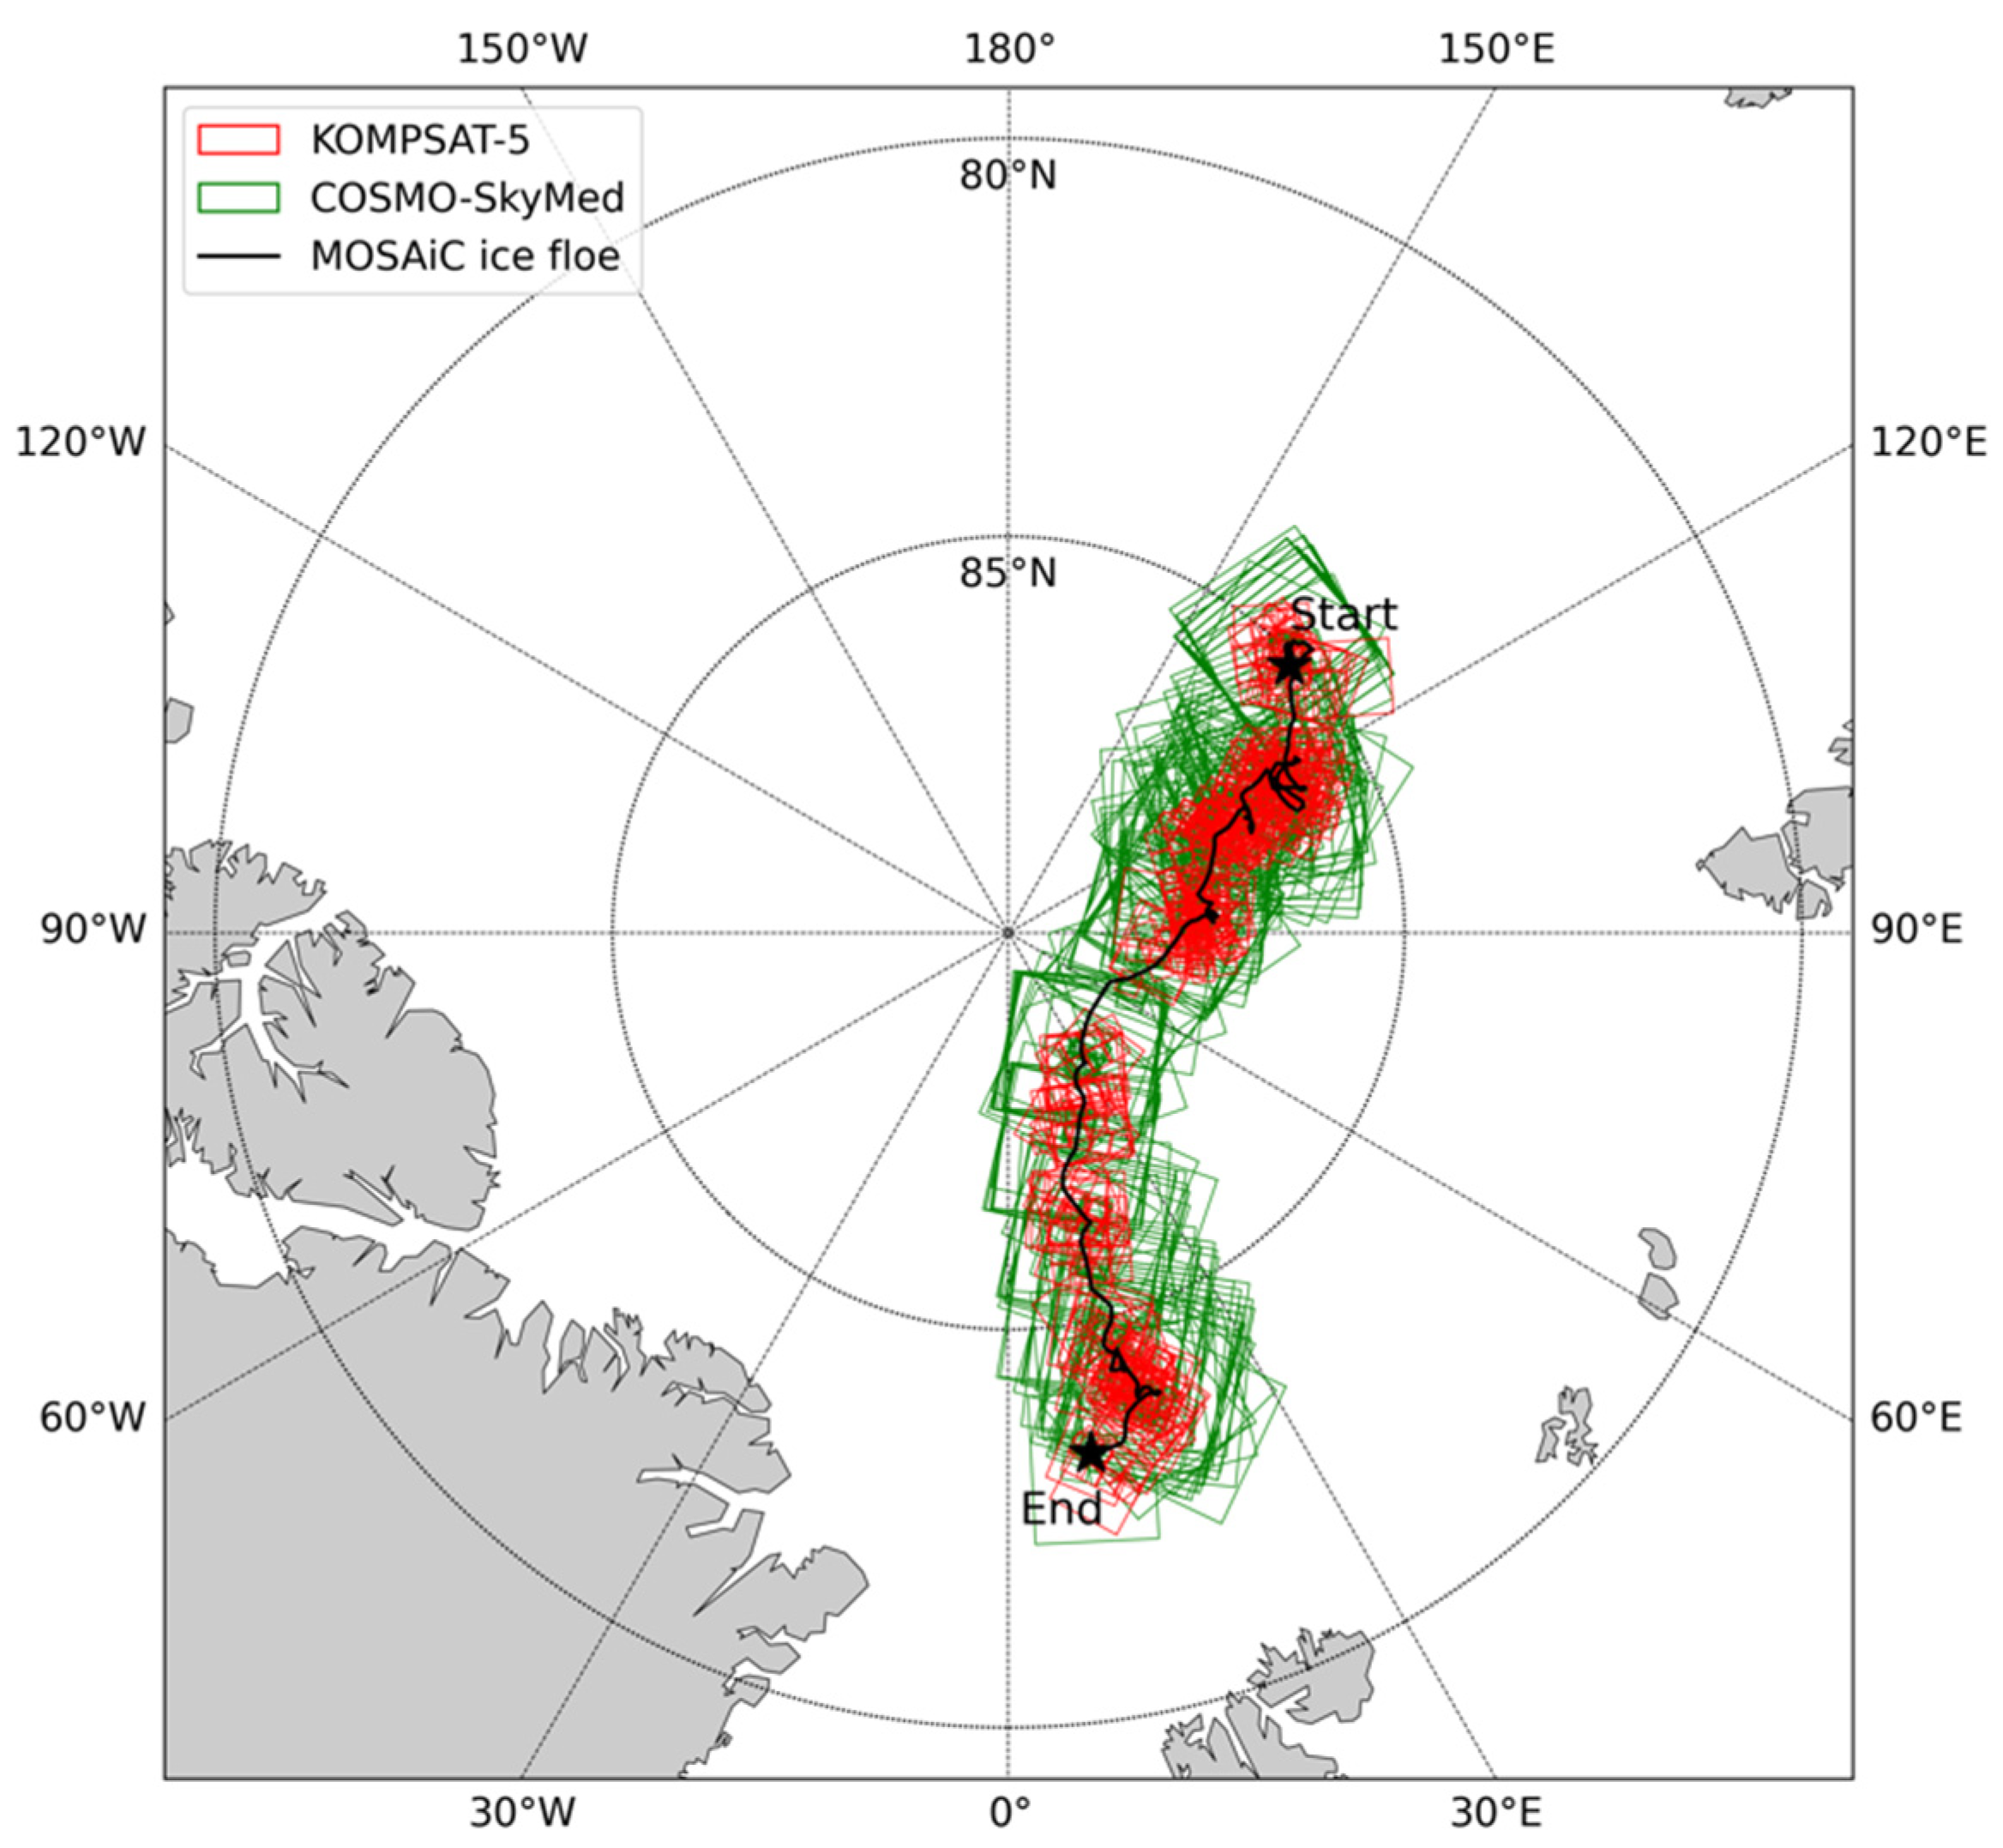
Figure 1. Image acquisitions of KOMPSAT-5 (red) and COSMO-SkyMed (green) along the trajectory of the MOSAiC ice floe (black) from 4 October 2019 to 16 May 2020.
Remotesensing 13 04038 g001
Figure 2. Number of the surface velocity profiler (SVP) buoys around the RV Polarstern.
Remotesensing 13 04038 g002
Figure 3. Drift vectors overlaid on the primary (top panels) and secondary (bottom panels) images of KOMPSAT-5: (a) Stripmap–Stripmap mode, (b) ScanSAR–ScanSAR mode, and (c) Stripmap–ScanSAR mode. Yellow and red arrows represent the results from pattern matching and SVP buoy record, respectively. Black dotted line indicates the footprint of paired image. Note that the pattern matching result vectors are not fully shown (1.5 km and 3 km spacing in (a,c) and (b) for display). The naming convention of K5 product is K5_<YYYYMMDDhhmmss>_<tttttt>_<nnnnn>_<o>_<MM><SS>_<PP>_<LLL>, which represent the sensing start time, processing offset, number of orbit, orbit direction, imaging mode, swath identifier, polarization, and processing level, respectively.
Remotesensing 13 04038 g003
Figure 4. Drift vectors overlaid on the primary (top panels) and secondary (bottom panels) images of COSMO-SkyMed: (a) Stripmap–Stripmap mode, (b) ScanSAR–ScanSAR mode, and (c) Stripmap–ScanSAR mode. Yellow and red arrows represent the results from pattern matching and SVP buoy record, respectively. Black dotted line indicates the footprint of paired image. Note that the pattern matching result vectors are not fully shown (2 km and 5 km spacing in (a,c) and (b) for display). The naming convention of CSK product is CSKS<i>_<YYY_Z>_<MM>_<SS>_<PP>_<s><o>_<D><G>_<YYYYMMDDhhmmss>_<YYYYMMDDhhmmss>, which represent the satellite identifier, product type, imaging mode, swath identifier, polarization, look side, orbit direction, delivery mode, state of selective availability, sensing start time, and sensing stop time, respectively.
Remotesensing 13 04038 g004
Figure 5. Comparison of the drift vectors derived from KOMPSAT-5 and SVP buoys. (a) Scatter plot of the drift speed. Black line is the identity and regression line, and the color represents maximum cross correlation of the pattern matching result. (b) Histogram of the difference in drift direction. The y-axis is in log scale.
Remotesensing 13 04038 g005
Figure 6. Comparison of the drift vectors derived from COSMO-SkyMed and SVP buoys. (a) Scatter plot of the drift speed. Black line is the identity and regression line, and the color represents maximum cross correlation of the pattern matching result. (b) Histogram of the difference in drift direction. The y-axis is in log scale.
Remotesensing 13 04038 g006
Figure 7. Comparison of the drift vectors derived from the cross-sensor (KOMPSAT-5 and COSMO-SkyMed) and SVP buoys. (a) Scatter plot of the drift speed. Black line is the identity and regression line, and the color represents maximum cross correlation of the pattern matching result. (b) Histogram of the difference in drift direction. The y-axis is in log scale.
Remotesensing 13 04038 g007
Figure 8. Bar plot of bias in estimated drift displacement, speed and the time interval of pair images, sampled in every 12-h bins. Blue dotted lines are the best fit models.
Remotesensing 13 04038 g008
Figure 9. Bar plot of bias in estimated drift speed and the image acquisition date, sampled in every 30-day bins.
Remotesensing 13 04038 g009
Table 1. Image and sensor parameters of the SAR satellites used.
ParameterKOMPSAT-5COSMO-SkyMed
Carrier frequency9.66 GHz (X-band)9.6 GHz (X-band)
PolarizationHHVV
Imaging modeStripmap (1 ES), ScanSAR (2 EW)Stripmap (3 HI), ScanSAR (4 HR)
Swath width30 km (ES), 100 km (EW)40 km (HI), 200 km (HR)
5 GEC Pixel spacing1.11 m (ES), 6.25 m (EW)2.5 m (HI), 50 m (HR)
Number of image strips215 (ES), 101 (EW)374 (HI), 342 (HR)
1 Enhanced standard; 2 enhanced wide swath; 3 HImage; 4 huge region; 5 geocoded ellipsoid corrected.
Table 2. Accuracy evaluation results of the KOMPSAT-5-derived sea ice drift vectors.
1 MCC
Threshold
Number of VectorsDrift SpeedDrift Direction
Bias
(cm/s)
2 NRMSE
(%)
3ρBias
(Degree)
NRMSE
(%)
4ρ2
0.01069−0.052 ± 0.4341.4020.9980.141 ± 3.7202.0681.994
0.21061−0.053 ± 0.4181.3520.9980.266 ± 2.1801.2201.994
0.31042−0.043 ± 0.1420.4760.9990.275 ± 1.4990.8461.999
0.41032−0.042 ± 0.1300.4400.9990.267 ± 1.4760.8331.999
0.51000−0.042 ± 0.1280.4330.9990.276 ± 1.4950.8451.999
1 Maximum cross correlation; 2 normalized root mean square error; 3 Pearson Correlation coefficient; 4 vector correlation (maximum = 2) [38].
Table 3. Accuracy evaluation results of the COSMO-SkyMed-derived sea ice drift vectors.
1 MCC
Threshold
Number of VectorsDrift SpeedDrift Direction
Bias
(cm/s)
2 NRMSE(%) 3 ρ Bias
(Degree)
NRMSE
(%)
4 ρ 2
0.05339−0.009 ± 0.4441.2570.9980.305 ± 3.1271.7451.996
0.25335−0.009 ± 0.4431.2540.9980.302 ± 3.1201.7411.996
0.35305−0.012 ± 0.3290.9320.9990.335 ± 1.6300.9241.998
0.45214−0.012 ± 0.3170.8980.9990.333 ± 1.4910.8491.998
0.54878−0.011 ± 0.3040.8620.9990.339 ± 1.4580.8321.998
1 Maximum cross correlation; 2 normalized root mean square error; 3 Pearson correlation coefficient; 4 vector correlation (maximum = 2) [38].
Table 4. Accuracy evaluation results of the cross-sensor-derived sea ice drift vectors.
1 MCC
Threshold
Number of VectorsDrift SpeedDrift Direction
Bias
(cm/s)
2 NRMSE
(%)
3 ρ Bias
(cm/s)
NRMSE
(%)
4 ρ 2
0.01651−0.076 ± 0.5051.4890.9970.257 ± 4.4552.4791.995
0.21651−0.076 ± 0.5051.4890.9970.257 ± 4.4552.4791.995
0.31629−0.077 ± 0.4351.2890.9980.297 ± 4.3012.3951.996
0.41595−0.071 ± 0.4031.1950.9980.305 ± 4.3202.4061.997
0.51455−0.068 ± 0.3561.0590.9980.457 ± 1.5220.8831.998
1 Maximum cross correlation; 2 normalized root mean square error; 3 Pearson correlation coefficient; 4 vector correlation (maximum = 2) [38].
Table 5. Performance comparison to the previous studies.
ParametersKOMPSAT-5
(This Study)
COSMO-SkyMed
(This Study)
Cross-Sensor
(This Study)
RADARSAT-2
([20])
Sentinel-1
([21])
2 ENVISAT ASAR
([11])
Pre-processed
source image
pixel spacing
(meter)
50505010080150
RMSE in
displacement
(meter)
211.53210.43164.114282861020
RMSE in
direction
(degree)
1.531.671.591 Unavailable1 Unavailable3.17
1 Tracking results were given in horizontal and vertical components rather than in net displacement and direction. 2 Validation was determined against the manually drawn vectors.
Publisher’s Note: MDPI stays neutral with regard to jurisdictional claims in published maps and institutional affiliations.