Abstract
The four wide-field-of-view (WFV) cameras aboard the GaoFen-1 (GF-1) satellite launched by China in April 2013 have been applied to the studies of the atmospheric environment. To highlight the advantages of GF-1 data in the atmospheric environment monitoring, an improved deep blue (DB) algorithm using only four bands (visible–near infrared) of GF-1/WFV was adopted to retrieve the aerosol optical depth (AOD) at ~500 m resolution in this paper. An optimal reflectivity technique (ORT) method was proposed to construct monthly land surface reflectance (LSR) dataset through converting from MODIS LSR product according to the WFV and MODIS spectral response functions to make the relationship more suitable for GF-1/WFV. There is a good spatial coincidence between our retrieved GF-1/WFV AOD results and MODIS/Terra or Himawari-8/AHI AOD products at 550 nm, but GF-1/WFV AOD with higher resolution can better characterized the details of regional pollution. Additionally, our retrieved GF-1/WFV AOD (2016–2019) results showed a good agreement with AERONET ground-based AOD measurements, especially, at low levels of AOD. Based on the same LSR dataset transmitted from 2016–2018 MODIS LSR products, RORT of 2016–2018 and 2019 GF-1/WFV AOD retrievals can reach up to 0.88 and 0.94, respectively, while both of RMSEORT are smaller than 0.13. It is indicated that using the ORT method to deal with LSR information can make GF-1/WFV AOD retrieval algorithm more suitable and flexible.
1. Introduction
A significant portion of aerosols in the atmosphere sources from anthropogenic activities, including industrial processes, fossil fuel combustion, agricultural operation, construction and mining. In recent years, China suffered from frequently severe pollution events, especially in winter, which had strong impact on the air environment, climate change, and public health [1,2,3,4]. However, due to the heterogeneous distribution of sources, short lifetime, and episodic features of emission events, aerosols exhibit high spatiotemporal variability which can hardly be characterized by the sparsely ground-based measurements. Therefore, aerosol optical depth (AOD) retrieved from satellite data has been increasingly used to estimate the surface-level particle concentrations or the air pollution level [5].
Although there are some uncertainties (e.g., differences in the sensor, calibration/characterization, retrieval algorithm, pixel selection, cloud and other masking) in satellite AOD retrievals, many relevant studies still been continually developed [6,7,8,9,10]. Dark target (DT) and deep blue (DB) algorithms have been successfully applied to the Moderate Resolution Imaging Spectroradiometer (MODIS), Visible Infrared Imaging Radiometer Suite (VIIRS), and Medium Resolution Spectral Imager (MERSI) onboard the Chinese FengYun (FY) satellite series (i.e., FY-3A, FY-3B, FY-3C and FY-3D) and other sensors with medium-low resolution [5,11,12,13]. MODIS AOD products (MOD/MYD04) provide daily global AOD distributions at 10 and 3 km spatial resolutions since 2000, and they are currently most suitable for studies of global aerosol spatial distribution [14,15]. Due to their relative low spatial resolution, MOD/MYD04 AOD products have limited applications in the air quality monitoring on a city or smaller scale [14,15,16]. Although MODIS AOD products have been available for 1 km, the observation data itself is characterized by moderate resolution, and the AOD results with higher resolution cannot be obtained.
Resulting from economic development, agricultural and industrial activities, urban sprawl, etc. China has been experiencing serious air pollution situation, especially atmospheric particulate pollution [15]. Therefore, it is in urgent need of AOD retrieval with higher resolution for capturing the characteristics of urban-scale particulate pollution [14,15,16]. With the development of satellite technology, the precision of AOD inversion from high-resolution satellite is required to be higher, which promotes the further research of algorithm. Many researchers have studied aerosols and atmospheric particles at small scales, and developed many high-resolution aerosol retrieval algorithms for Terra [17,18,19,20], NPP [21], Landsat [15,22,23,24,25], and Chinese resources and environment satellite series [16,19,26,27,28], and other satellites [29,30].
China has launched a major project to build a high-resolution Earth observation system, and plans to build its own maritime, land and atmospheric observation systems around 2020. As the first satellite of the observation system, GaoFen-1 (GF-1) has a great potential in aerosol detection. The four wide-field-of-view (WFV) cameras aboard GF-1 satellite, launched by the Chinese government in April 2013, can provide multi-spectral images from visible to near-infrared (NIR) channels, with a high spatial resolution of 16 m and a re-visiting period of 4 days [16]. Developing or improving the GF-1 aerosol retrieval ability can not only enhance the application of space infrastructure efficiency, enrich the AOD inversion data source effectively, and promote the domestic high series of satellite application in the atmospheric environment monitoring ability.
For regions covered by dense vegetation, the land surface reflectance (LSR) information is relatively weak, so the LSR relationship between visible and infrared channels in the low reflection region (dark targets) can be used to carry out AOD inversion, which is the idea of DT algorithm [5,31]. Although the absence of SWIR band on GF-1/WFV makes it difficult to retrieve AOD using the DT method, the blue band of GF-1/WFV can be used for AOD inversion by DB algorithm. DB algorithm removes the surface contribution by using the feature that the reflection of blue light in the atmosphere is strong and the reflection of the surface is weak [12,13,32]. The determination of LSR is the precondition of the DB algorithm.
AOD retrieval is influenced by different factors including calibration accuracy, the presence of clouds, the reflectance of the underlying surface and aerosol properties [33]. The Beijing–Tianjin–Hebei (BTH) urban agglomeration (Figure 1) is one of regions in China with most severe air pollution. Due to the integration process progresses and the close connection between Beijing, Tianjin, and Hebei, frequent pollution events are always caused by the coal burning of industrial activities. Moreover, the complex underlying surface composition and the influence of monsoonal climate in this area make it difficult for the AOD retrieval over BTH region [21,34]. In this paper, our algorithm is based on the DB algorithm, with a focus on solving the problems of cloud screening and LSR determination of GF-1 satellite. To construct GF-1/WFV blue LSR, an optimal reflectance technique (ORT) method was applied in MODIS surface information to transform to the GF-1/WFV LSR using a channel transformation method. Based on the GF-1/WFV reflectance in blue channel, the DB algorithm was employed to retrieve AOD over BTH region in China. Then, the new WFV AOD from 2016 to 2019 was evaluated based on comparisons with AOD values from different sources.
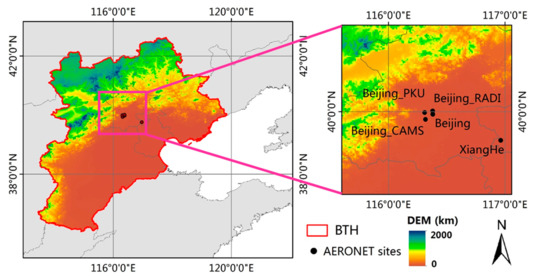
Figure 1.
Locations of AERONET ground-based sites over Beijing–Tianjin–Hebei (BTH) region. Elevation data obtained from the Advanced Spaceborne Thermal Emission and Reflection Radiometer Global Digital Elevation Model (GDEM) at 30 m spatial resolution.
The main purpose of this paper is to verify that the AOD inversion based on a new cloud screening method and LSR database can be more suitable for BTH region. In this paper, Section 2 introduces relevant satellite data and the AOD product, and Section 3 introduces the main methodology. The validation of GF-1/WFV AODs against different satellite measurements and ground-based AErosol RObotic NETwork (AERONET) observations are described in Section 4. Finally, we discuss the deficiencies of our AOD product and conclude the paper in Section 5.
2. Data
2.1. GF-1/WFV
Table 1 shows the specific configuration parameters of GF-1/WFV. The data of each GF-1/WFV image includes four files: (1) The GeoTIFF file is used to store image data in a 32-bit integer format; (2) JPG file is used to display thumbnails of images; (3) XML files include data description files, which mainly provide angle (Solar Zenith Angles, Satellite Zenith Angles, Solar Azimuth Angles and Satellite Azimuth Angles) information of image center point, transit time, etc.; (4) The RPB file mainly provides the geometric positioning information of the image, which is used for geometric correction of image.

Table 1.
Parameter configuration of GF-1/WFV.
2.2. Other Satellite Products
The DT (AOD_MODT) and DB (AOD_MODB) AOD datasets from Terra/MODIS aerosol products (MOD04), Himawari-8/AHI aerosol product (AOD_AHI) [35], and ground-based AOD observations from AERONET (AOD_AERO) [36,37] were used for the validation of retrieved GF-1/WFV AOD (AOD_WORT) results at 550 nm. Here, the Ångström exponent (AE) relationship was applied for the calculation of AOD_AHI and AOD_AERO at 550 nm. Terra/MODIS surface reflectance product (MOD09A1) [12,14,34], denoted as MODIS LSR. Detailed product information is listed in Table 2.
Table 2.
MODIS, AHI, and AERONET products used in this work.
Retrieved GF-1/WFV AOD data was matched with the AERONET observations from 2016 to 2019 over BTH region. Within a sampling window of 25 km × 25 km centered in an AERONET site, more than 25% of the total valid pixels are required to calculate a mean value of GF-1/WFV AOD for the accuracy evaluation. And no less than 4 AERONET AODs at 550 nm with a time interval of 1 h centered at Terra overpass time were averaged as the corresponding ground-based measurements for our validation.
3. AOD Retrieval Algorithm
3.1. Deep Blue (DB) Algorithm
In the case of an infinite uniform Lambertian and homogeneous target of surface reflectance , the reflectance of the top of the atmosphere at a particular wavelength can be written as follows [31,38,39]:
where is the atmospheric path reflectance, is the cosine of the solar zenith angle (), is the cosine of the view zenith angle (), is the relative azimuth angle (the difference between the solar azimuth angle and the satellite azimuth angle), is the total upward transmission in the direction of the satellite field of view, is the total downward atmospheric transmission, and is the spherical albedo of the atmosphere for illumination from below (atmospheric backscattering ratio). On the left-hand side of Equation (1), can be obtained from satellite observation data. Except for the surface reflectance , each term on the right-hand side of Equation (1) is a function of the aerosol type and loading optical thickness τ.
Using the radiative transport model Second Simulation of Satellite Signal in the Solar Spectrum (6S) [39,40], the relationship between aerosol optical depth and parameters (i.e., , ) was calculated under different atmospheric aerosol modes and observation conditions. A set of sun-satellite geometries, atmospheric parameters, and aerosol information listed in Table 3 was applied to build a look-up table (LUT), which would be used in the AOD retrieval to speed up the calculation processes.
Table 3.
Input variables for the calculation of the look-up table.
The Rayleigh scattering has significant impacts on the visible channels, especially for the blue band with short wavelength [15]. In this study, the method proposed by Levy et al. was used to correct the altitude of atmospheric molecule scattering [5]:
where is the Rayleigh optical depth (ROD), λ is the wavelength (μm), Z is the elevation of the surface target obtained from GDEM, and 8.5 km is the exponential scale height of the atmosphere.
An overview of the retrieval algorithm is shown in the dataflow diagram in Figure 2. The original GF-1/WFV data was sampled with 32 × 32 pixels to obtain a new image with a resolution of 512 m (~500 m, regarded as 500 m). Then, angle calculation (including view zenith angle, solar zenith angle and relative azimuth angle) and pixel selection were pre-processed before the AOD retrieval. GF-1/WFV surface reflectance converted from the MODIS LSR data and seven standard aerosol models were used to identify the land surface information and aerosol type in the GF-1/WFV AOD calculation, respectively. Here, the above seven aerosol models involved two standard aerosol models (urban and continental models) in 6S [39,40] and five models (dust, smoke-high absorption, smoke-low absorption, urban-clean and urban-polluted models) in the VIIRS over-land aerosol retrieval [41]. Once the calculated spectral reflectance makes the best match with those that are measured, the aerosol model is determined and the AOD value will be reported.
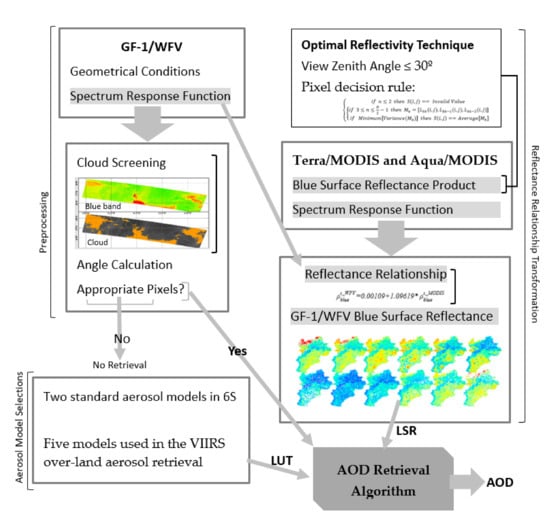
Figure 2.
Flowchart for GF-1/WFV aerosol optical depth retrieval over land.
3.2. Data Preprocessing
3.2.1. Angle Calculation
For the original GF-1/WFV data, only the angle information in the center of the satellite image is provided. The difference in the observation angle between the image edge pixel and the central pixel can cause a large error to the quantitative application. The variations of apparent reflectance changed with the observation geometry and AOD were simulated by the 6S model, and the results are shown in Figure 3. Figure 3c,d indicate that the change of relative azimuth angle has little influence on the apparent reflectance for a fixed AOD, so that the entire image can utilize the uniform value of relative azimuth angle provided by the XML file. However, based on the simulations shown in Figure 3a,b, the satellite zenith angles of the satellite image need to be calculated by interpolation of camera field angles due to the strong effect of satellite zenith angle on the apparent reflectance. According to Jacobson (2005) [42], the solar zenith angle can be calculated by using the satellite transit time, longitude and latitude of the corresponding satellite image pixel, as follows:
where δ is the declination of the sun, t is the solar hour angle, and lat is the latitude of the pixel. The longitude and latitude of the image elements can be bilinearly interpolated by the longitude and latitude values of four image corners.
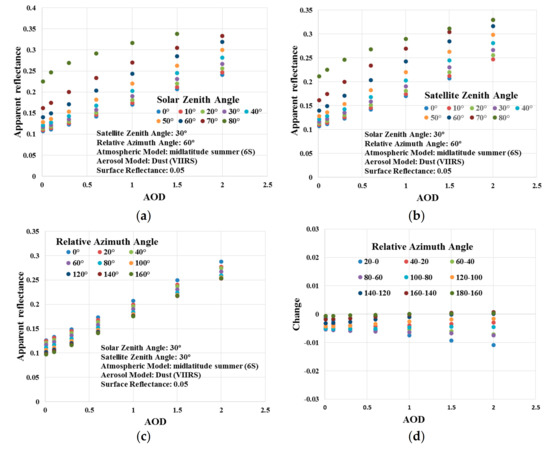
Figure 3.
The change of simulated apparent reflectance in GF-1/WFV blue band with solar zenith angle (a), satellite zenith angle (b), relative azimuth angle (c) for different AODs. The change of apparent reflectance with different relative azimuth angle (d). In the simulation, the view geometry, atmospheric model, and aerosol model are set as shown in figure by 6S.
3.2.2. Appropriate Pixel Selection
In this paper, some obstructions such as cloud, water, and snow/ice pixels need to be identified before AOD retrieval. The premise of AOD retrieval is the accurate isolation of cloud and clear regions. Due to the limitation of GF-1/WFV band, it is difficult to effectively remove cloud pixels but maintain heavy aerosol ones. Figure 4 shows the GF-1/WFV cloud recognition flow, which is described in detail below.
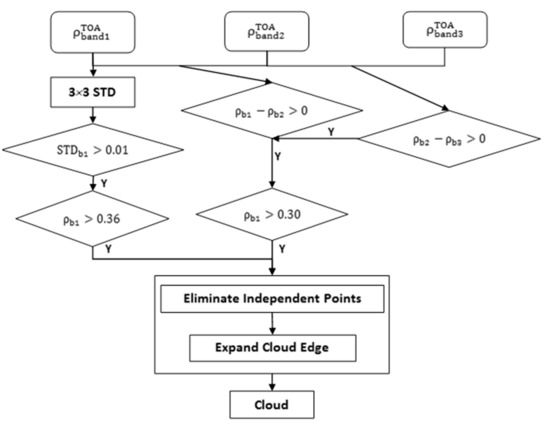
Figure 4.
GF-1/WFV cloud recognition flow.
The multi-band threshold approach of cloud removing, which is combined with visible bands and infrared bands and commonly applied to the MODIS or Landsat data, is not suitable for the GF-1/WFV with only four bands. Bright clouds characterized by high reflectivity in green and red channels, can lead to the signal oversaturation and even an upward trend of reflectance spectrum. Therefore, a combination approach of multi-band threshold method and reflectance variation characteristics with the increasing wavelength can be used for the cloud identification of GF-1/WFV.
Due to differences in the microphysical and chemical properties between cloud and aerosol, cloud exhibit a more complex spatial behavior than aerosol [43]. In our study, interesting regions, including thick cloud, thin cirrus cloud and clear sky, were extracted by a supervised classification method [44]. Due to the difference in the apparent reflectance of the image under different backgrounds, histogram statistics were conducted for exploring the pixel distribution to determine the threshold for dividing clouds and non-clouds. The spatial variation of the apparent reflectance at visible wavelength is relatively uniform for clear sky pixels, while that of cloud pixels is extremely mutational. And with the comparison of clear-sky condition, the amplitude of spatial variation of apparent reflectance can be further deduced for heavy aerosol-loaded pixels due to the stronger scattering and absorption led by aerosol particles. Therefore, the standard deviation of band 1 (0.484 μm) TOA reflectance within a window of 3 × 3 pixels (3 × 3-STD) is higher for cloud pixels than that for non-cloud pixels [34]. To eliminate the misclassification of cloud pixels, isolated cloud pixels were regrouped into cloud-free type if the proportion of cloud pixel number within a window of 3 × 3 pixels is less than 25%. A buffer zone with a distance of 3-pixel size was used for expanding the initially recognized cloud regions to guarantee that the cloud pixels in the satellite image can be removed completely.
Because the algorithm is sensitive to snow/ice and water, the normalized difference vegetation index (NDVI) is a simple graphical indicator that can be further used to remove those non-inversion pixels. Cloud, water, and snow/ice pixels can be also identified based on a rule of NDVI < 0.
3.3. Reflectance Relationship Transformation
In this paper, a new aerosol retrieval algorithm was proposed to retrieve GF-1/WFV AOD based on the MODIS LSR data. As a key process, the transformational relationship between the surface reflectance of GF-1/WFV and MODIS was implemented through two main steps: the building of monthly MODIS LSR dataset and the establishment of LSR transfer coefficients.
MODIS LSR data were obtained from eight-day synthesized MODIS 500 m surface reflectance product after atmospheric corrections for gaseous scattering and absorption, aerosol scattering and absorption, cirrus contamination, BRDF coupling, and the adjacency effect [40]. In the first step, the dataset of 500 m monthly MODIS LSR in blue wavelength was constructed by using the traditional minimum reflectivity technique (MRT) and the optimal reflectivity technique (ORT) method. The MRT method considers a certain number of images at different times, and seeks the minimum value in the same position pixel as the target value [25,45]. Although the monthly LSR data constructed by the MRT method is the LSR minimum of each pixel in one month, the actual land surface reflectance may be underestimated. By comparison, although the ORT method cannot guarantee the existence of every pixel, the generated LSR data is more rigorous to ensure the accuracy of AOD inversion. The determination rules of ORT method are as follows:
MOD09A1 data from 2016 to 2018 were selected, and pixels with view zenith angle greater than 30 degree were removed. Each pixel is sorted from low to high values, then set the rules:
where (i,j) is the position of a single pixel, L(i,j) is the unsorted LSR value, and I(i,j) is the sorted LSR value. N is the number of primitive values per month for the same location, n is the number of values processed (view zenith angle ≤ 30°) per month at the same location. S(i,j) is the final MODIS LSR which can be determined as follows:
where is an array containing three elements .
According to the significant difference between MODIS and GF-1/WFV bands in the wavelength range and spectral response function (SRF) shown in Figure 5, the surface reflectance of GF-1/WFV can be inherited from MODIS LSR, but cannot be replaced directly. Theoretically, the Earth observation of the four WFV sensors aboard on GF-1 satellite is simultaneous, meaning that the observation geometries of four WFVs are not the same. However, our simulated results in Figure 5b indicate that for the blue band, the impact of four different WFV cameras on the apparent reflectance can be ignored for a single observation of GF-1/WFV. Therefore, the spectral differences among the four cameras were not considered into the transformation method of surface reflectance, and a single linear relationship between MODIS and GF-1/WFV surface reflectance was assumed in the second step.
where A and B are two coefficients of the linear formula, and and are surface reflectance values observed by MODIS and WFV, respectively, which can be derived by:
where is the SRF. and are the upper and lower limits of integration, respectively, which define the band width, and is the spectral curve corresponding to central wavelength .
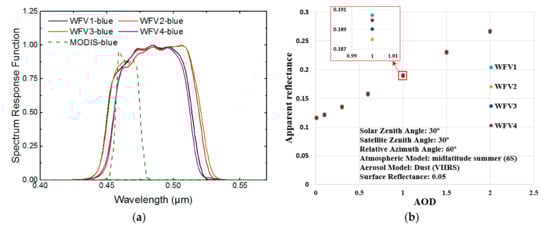
Figure 5.
(a) The spectrum response function (SRF) of WFV and MODIS blue bands. The dash line is the SRF of MODIS bands 3 (0.466 µm), and the solid lines are for WFV1-WFV4 band 1 (0.484 µm). All the spectrum response functions use the same wavelength interval (0.0001 µm) by interpolation. (b) The change of simulated apparent reflectance in blue band with different AOD and WFVs.
After differentiation, Equation (6) can be rewritten as:
where = 0.0001.
In this study, the spectral library established in this paper is obtained by using the remote sensing software ENVI. The spectral data of 50 typical features (construction: 15 types, soils: 20 types, and vegetation: 15 types) in the ENVI spectrum database (ENVI standard spectral library (SLI) files, THOR Metadata Rich Spectral Library (MRSL) output, and Analytical Spectral Devices (ASD) spectrometers output) [34] was selected to calculate the reflectance of ground objects in blue band for both GF-1/WFV and MODIS sensors. As shown in Figure 6 and Table 4, the surface reflectance of GF-1/WFV is higher than that of MODIS, and there is little difference in the transformation parameters of the four WFV cameras. Then, by fitting all the scattered points in Figure 6, the GF-1/WFV blue surface reflectance relationship can be available from Equation (9).
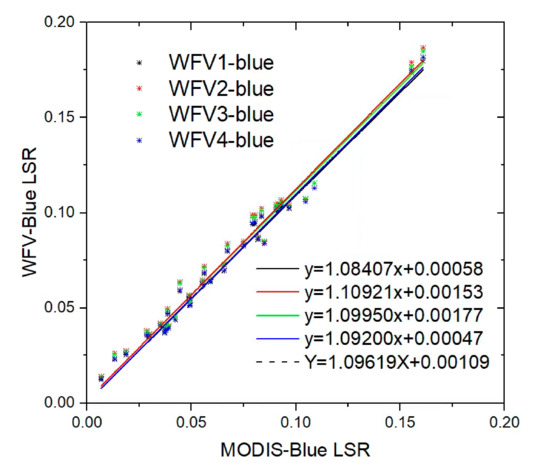
Figure 6.
Linear relationships of blue band LSR between MODIS and different WFV cameras of GF-1.
Table 4.
Statistical information of blue band LSR between MODIS and different WFV cameras of GF-1.
4. Results and Analysis
Here, ORT LSR results were firstly compared with the MRT LSR data. Then, GF-1/WFV AODs over BTH from 2016 to 2019 were retrieved based on the new algorithm mentioned in Section 3. To assess the accuracy of our retrieved AOD_WORT, 550 nm AODs obtained from AERONET ground-based measurements and different satellite observations were used for the validation.
4.1. Land Surface Reflectance
In order to verify the role of LSR data in the GF-1/WFV AOD retrieval, a sensitive analysis was carried out by simulating the apparent reflectance in GF-1/WFV blue band under different AOD and LSR conditions. As shown in Figure 7, the apparent reflectance of GF-1/WFV in blue band is very sensitive to the LSR when the AOD is less than 3. However, with the increase of AOD, the apparent reflectance grows slowly for all LSR conditions. Therefore, an inaccurate LSR data can introduce a large uncertainty into the GF-1/WFV AOD retrieval, and the proper estimation of LSR which can better capture the characteristics of actual surface condition is very important for the real-time observation of GF-1/WFV AOD.
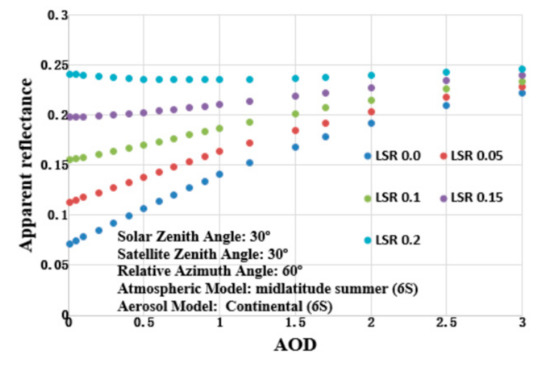
Figure 7.
The change of simulated apparent reflectance in GF-1/WFV blue band with AOD and LSR.
According to the ORT method, it is not difficult to understand that ORT LSR is always higher than MRT LSR. By comparing the monthly ORT LSR results over BHT region with the corresponding MRT ones, as shown in Figure 8, the difference of monthly LSR between MRT and ORT methods is in a range of −0.031 ± 0.014.
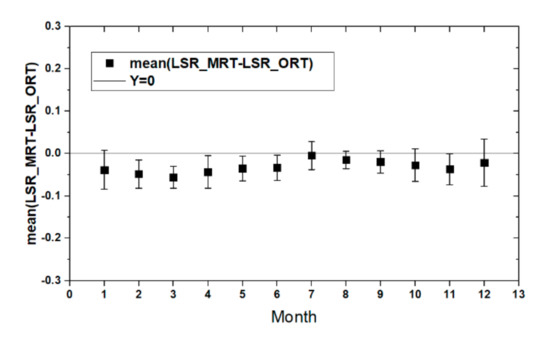
Figure 8.
The monthly averaged difference in LSR between MRT and ORT.
BTH vegetation with obvious zonation was predominated with deciduous broad-leaved forest, and the vegetation cover changes significantly with the seasons. Due to the growth change of land surface vegetation, the land surface changes obviously in spring and autumn. Additionally, the land surface covered by snow and ice differs significantly from that covered by bare soil or wheat in winter. Therefore, the minimum reflectance may not be a reasonable representation of the actual surface reflectance. Although there are random errors in AOD retrieval by using ORT LSR, these errors can be reduced by taking the average. In summer, the difference between MRT and ORT LSRs is minimal due to the small change of underlying surface (Figure 8).
4.2. Spatial Distributions of AODs
To illustrate the reliability of our retrieved GF-1/WFV AOD_WORT in terms of spatial distribution, an inter-comparison was performed based on GF-1/WFV, Terra/MODIS, Himawari-8/AHI AODs derived from different retrieval algorithms. Figure 9 and Figure 10 depict the spatial distributions of AOD_WMRT (500 m), AOD_WORT (500 m), AOD_MODT (10 km), AOD_MODB (10 km), and AOD_AHI (0.05 deg) on 12 July 2017 and 1 January 2018, respectively. The heavily polluted areas were mainly concentrated on the southeast part of BTH region, which were obviously different from the northwest mountainous areas. The spatial distribution of our AOD_WORT retrievals is generally consistent with those of other four satellite AODs. The high values of AOD (>0.8) are mainly distributed in the southeast of BTH region, and zones with the low AODs are located in the northwest parts. In the northwestern BTH region with lower AOD values area, AOD_WORT, and AOD_MODB are much smoother than other three AOD results. It is notable that the invalid value ratio of GF-1/WFV AODs is much lower than those of Terra/MODIS, Himawari-8/AHI ones, especially for AOD_MODT and AOD_AHI, which may be caused by the difference in spatial resolution, overpassing time, and retrieval algorithm. Such a situation of a high invalid value ratio was particularly serious for the AOD_MODT over the southeastern BHT region with air pollution, which made the status over this region cannot be captured for the analysis. And some pixels covered with snow and ice in Figure 9b,c and Figure 10b,c were also set as invalid values the northwest mountains. However, for the retrieved GF-1/WFV AOD with a spatial resolution of 500 m, both AOD_WORT and AOD_WMRT can provides more abundant details than MODIS and AHI in the spatial distribution, and can more accurately reflect the AOD spatial variation over the polluted region.

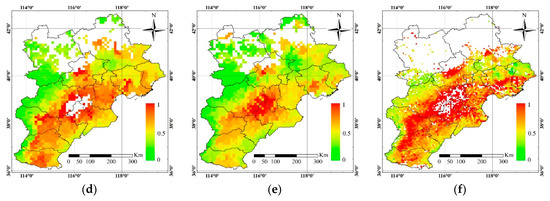
Figure 9.
AOD spatial distribution on 12 July 2017. (a) Terra/MODIS true color image, (b) GF-1/WFV AOD_WORT, (c) GF-1/WFV AOD_WMRT, (d) Terra/MODIS AOD_MODT, (e) Terra/MODIS AOD_MODB, and (f) Himawari-8/AHI AOD_AHI.
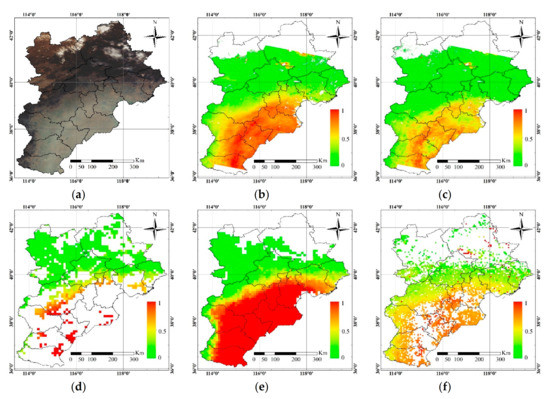
Figure 10.
AOD spatial distribution on 1 January 2018. (a) Terra/MODIS true color image, (b) GF-1/WFV AOD_WORT, (c) GF-1/WFV AOD_WMRT, (d) Terra/MODIS AOD_MODT, (e) Terra/MODIS AOD_MODB, and (f) Himawari-8/AHI AOD_AHI.
The reflectance in bright areas (mainly include urban, desert, bare land, and arid/semi-arid areas with sparse or little vegetation coverage) is more difficult to estimate accurately [14,15]. Central Beijing is a typically bright urban area with a dense population and extensive industrial activity. As shown in Figure 9 and Figure 10, the AOD distribution in Beijing is weakly affected by the bright surface. The bright surface of urban area does not cause high value distribution of retrieval results. The spatial distribution of AOD in urban and non-urban areas is relatively smooth, and the removal of surface information is more accurate. So, it is indicated that the high AODs were not caused by the bright surface of urban area in our retrieval algorithm.
Because the LSR of the current month cannot be obtained for the near-real-time AOD retrieval in the operational application, in our study, the land surface reflectance constructed by the ORT method was a monthly dataset transformed from the MODIS LSR data during the period from 2016 to 2018. In practice, the monthly LSR based on the MODIS LSRs of last three-year will be used to retrieve the near-real-time GF-1/WFV AOD of the current year, where the month of GF-1/WFV data is the same as that of monthly MODIS LSR. And the LSRs of the current month will be continuously updated into our monthly LSR dataset. According to the true color image on 28 September 2019 (Figure 11a), there was a serious pollution event in the southeast of the BTH region, which can be directly and significantly reflected in our retrieved GF-1/WFV AOD_ WORT result (Figure 11b). The GF-1/WFV AOD_WORT can also be used to strictly distinguish the heavy polluted regions on an urban-scale, which is more useful for the regional control and governance.
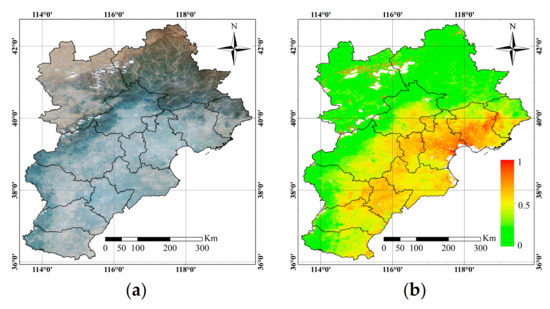
Figure 11.
(a) Terra/MODIS true color image and (b) GF-1/WFV AOD_WORT AOD spatial distribution on 28 September 2019.
4.3. AOD Validation Using AERONET Data
Ground-based AOD measurements of five AERONET sites (i.e., Beijing, XiangHe, Beijing-CAMS, Beijing-PKU, and Beijing-RADI sites) were extracted for the AOD validation. The error statistics, including the root mean square error (RMSE) and the mean absolute error (MAE), were verified by comparing the satellite-retrieved AODs (AOD_WORT and AOD_WMRT) with the AERONET measurements (AOD_AERO). RMSE was selected to measure the differences between AOD retrievals and ground-based measurements, which was sensitive to both systematic and random errors. MAE could better reflect the actual situation of AOD retrievals error. RMSE and MAE can be written as follows, respectively:
Both of AOD_WMRT and AOD_WORT retrievals were matched with AERONET AOD measurements following the rule mentioned in Section 2.2. The validation results of AOD_WMRT and AOD_WORT from 2016 to 2018 were shown in Figure 12. Compared with AOD_WMRT (R = 0.79), AOD_WORT with a higher correlation coefficient (R = 0.88) showed a better relationship with ground measurements. AOD_WMRT was significantly overestimated for low AOD values, which might be due to the undervaluation of LSR. However, our AOD_ WORT retrieval algorithm significantly modified such overestimation of AOD_WMRT. Especially, when the AOD is smaller than 0.2, a better agreement between satellite AOD retrievals and AERONET observations for AOD_ WORT than that for AOD_WMRT. Separately, the AOD_WORT retrievals on Beijing, Beijing-CAMS, and XiangHe sites were much better agreement with AERONET observations.
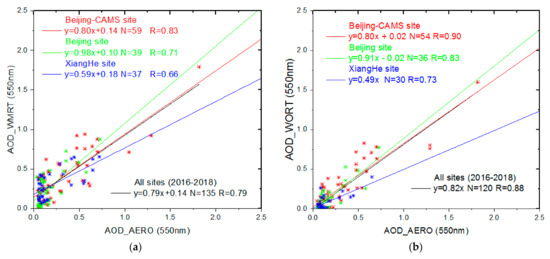
Figure 12.
A comparison between ground-measured AOD_AERO and GF-1/WFV retrieved 550 nm AODs from 2016 to 2018. (a) AOD_WMRT and (b) AOD_WORT (red, green, blue, and black symbols represent Beijing-CAMS, Beijing, XiangHe, and all sites, respectively).
To testify whether the LSR dataset based on 2016–2018 MODIS LSR data is proper for retrieving the GF-1/WFV AOD of 2019, the same validation work for 2019 AOD_WORT (Figure 13) was done as for 2016–2018 AOD_WORT (Figure 12). Figure 13 and Figure 14 indicate a better performance for our proposed algorithm in this paper. R of 2019 AOD_WORT reaches up to 0.94, especially R of the XiangHe site is the largest one among that of all sites, as high as 0.98. Both of RMSE and MAE for AOD_WORT are much lower than those for AOD_WMRT. For R, the largest one is 2019 AOD_WORT, and following is 2016–2018 AOD_WORT, and the smallest one is 2016–2018 AOD_WMRT. On the contrary, both of RMSE and MAE for 2019 AOD_WORT are smaller than those of 2016–2018 AOD_WORT and AOD_WMRT. Overall, for all 5 AERONET sites over BTH region, a relatively high R (R > 0.88) and low RMSE and MAE (RMSE < 0.13, MAE < 0.11) appear between AOD_ WORT and AOD_AERO.
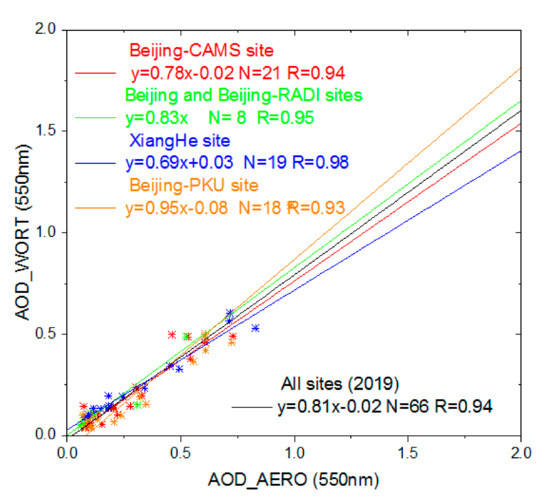
Figure 13.
A comparison between ground-measured AOD_AERO and GF-1/WFV retrieved AOD_WORT in 2019. (Red, green, blue, orange and black symbols represent Beijing-CAMS, Beijing (&Beijing-RADI), XiangHe, Beijing-PKU, and all sites, respectively).
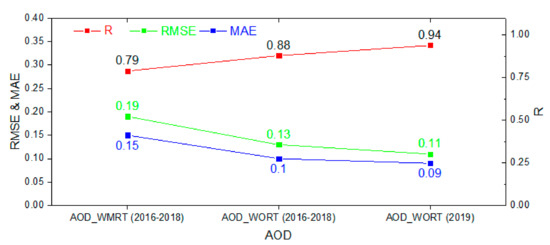
Figure 14.
Error statistics (RMSE and MAE) and correlation coefficient (R) for AOD_WMRT (2016–2018), AOD_WORT (2016–2018), and AOD_WORT (2019), respectively.
Overall, although there were random uncertainties in the dataset building of GF-1/WFV surface reflectance led by the MODIS LSR errors, the proposed ORT method could reduce such uncertainties by dealing strictly with MODIS surface reflectance and taking the averaged LSR values. Our GF-1/WFV AOD retrieval algorithm performed well in the improvement of the retrieval results, and the AOD inversions showed a good correlation and accuracy by comparing with multi-source AOD products. Especially, the AOD_WORT is superior to AOD_WMRT for low AOD values. Whether the LSR dataset built by 2016–2018 MODIS LSR data was used to retrieve the GF-1/WFV AOD of 2016–2018 or 2019, both the AOD retrievals of the two periods were shown with high accuracy.
5. Conclusions
In this study, a new DB AOD retrieval algorithm was developed for GF-1/WFV, involving a cloud screening method based on the only four bands of GF-1/WFV and an optimal reflectivity technique method for building a monthly LSR dataset transmitted from MODIS LSR. GF-1/WFV AOD_WORT from 2016 to 2019 was retrieved and validated by multi-source satellite AOD products and AERONET ground-based measurements. Detailed validation and comparison results were shown as follows:
- In terms of spatial distribution, our AOD_WORT results were roughly consistent with Terra/MODIS and Himawari-8/AHI AOD retrievals based on different AOD retrieval algorithms. GF-1/WFV AOD with a higher spatial resolution of 500 m can provide more abundant details of spatial variation than Terra/MODIS and Himawari-8/AHI.
- The validation results showed that the AOD_WORT had a good correlation and accuracy with AOD_AERO. Especially, our AOD_WORT retrieval algorithm could effectively reduce the overvaluation of AOD_WMRT at low levels of AOD. Generally, RORT (0.88) > RMRT (0.79), RMSEORT (0.13) < RMSEMRT (0.19), and MAEORT (0.1) < MAEMRT (0.15).
- The near-real-time inversion of AOD based on the LSR dataset of last three years also performed excellently both in terms of the spatial distribution and the quantitative comparison with AERONET observations. The high correlation with AERONET AOD (RORT = 0.94), the low RMSE (RMSEORT = 0.11) and the low MAE (MAEORT = 0.09) could certificate the reliability of our AOD_WORT retrieval algorithm.
- Although there was no detailed comparison of inversion effects between rural and urban backgrounds, the smoothing effect on the spatial distribution could confirm that the presence of urban bright surfaces would not cause high values or noises.
Our GF-1/WFV AOD inversion study can lay a foundation for other similar sensors aboard Gaofen satellite series (such as GF-1B, GF-1C, GF-2, and GF-6), in terms of the solution of the inversion problem, the optimization of the inversion algorithm, and the processing and comparison of the inversion verification.
Author Contributions
This work was conducted in collaboration by all authors. Data curation, F.Y.; Funding acquisition, M.F.; Methodology, F.Y., M.F. and J.T.; Validation, F.Y.; Writing—original draft, F.Y.; Writing—review & editing, M.F. and J.T. All authors have read and agreed to the published version of the manuscript.
Funding
This research was funded by the National Natural Science Foundation of China (Grant No. 41830109, 41871254, 91644216) and the Strategic Priority Research Program of the Chinese Academy of Sciences (Grant No. XDA19010403 and XDA19040201).
Institutional Review Board Statement
Not applicable.
Informed Consent Statement
Not applicable.
Data Availability Statement
The authors gratefully acknowledge the Japan Aerospace Exploration Agency (JAXA) for the AHI data (http://www.eorc.jaxa.jp/ptree/terms.html). The authors would like to thank the National Aeronautics and Space Administration (NASA) for the MODIS data (https://ladsweb.modaps.eosdis.nasa.gov). Restrictions apply to the availability of GF-1 data, and it is available from the funders by request. The authors would like to thank the principal investigators of the AERONET sites used in this work for maintaining their sites (https://aeronet.gsfc.nasa.gov).
Conflicts of Interest
The authors declare no conflict of interest.
References
- IPCC. Climate Change 2007—The Physical Science Basis; Cambridge University Press: Cambridge, UK, 2007. [Google Scholar]
- Kaufman, Y.J.; Tanre, D.; Boucher, O. A satellite view of aerosols in the climate system. Nature 2002, 419, 215–223. [Google Scholar] [CrossRef] [PubMed]
- Koren, I.; Feingold, G. Aerosol-cloud-precipitation system as a predator-prey problem. Proc. Natl. Acad. Sci. USA 2011, 108, 12227–12232. [Google Scholar] [CrossRef] [PubMed]
- Pope Iii, C.A.; Burnett, R.T.; Thun, M.J.; Calle, E.E.; Krewski, D.; Ito, K.; Thurston, G.D. Lung cancer, cardiopulmonary mortality, and long-term exposure to fine particulate air pollution. JAMA J. Am. Med. Assoc. 2002, 287, 1132–1141. [Google Scholar] [CrossRef] [PubMed]
- Levy, R.C.; Remer, L.A.; Mattoo, S.; Vermote, E.F.; Kaufman, Y.J. Second-generation operational algorithm: Retrieval of aerosol properties over land from inversion of Moderate Resolution Imaging Spectroradiometer spectral reflectance. J. Geophys. Res. Space Phys. 2007, 112. [Google Scholar] [CrossRef]
- Georgoulias, A.K.; Alexandri, G.; Kourtidis, K.; Lelieveld, J.; Zanis, P.; Amiridis, V. Differences between the MODIS Collection 6 and 5.1 aerosol datasets over the greater Mediterranean region. Atmos. Environ. 2016, 147, 310–319. [Google Scholar] [CrossRef]
- Levy, R.C.; Munchak, L.A.; Mattoo, S.K.; Patadia, F.; Remer, L.A.; Holz, R.E. Towards a long-term global aerosol optical depth record: Applying a consistent aerosol retrieval algorithm to MODIS and VIIRS-observed reflectance. Atmos. Meas. Tech. 2015, 8, 4083–4110. [Google Scholar] [CrossRef]
- Sayer, A.M.; Hsu, N.C.; Bettenhausen, C.; Jeong, M.J. Validation and uncertainty estimates for MODIS Collection 6 “Deep Blue” aerosol data. J. Geophys. Res. Atmos. 2013, 118, 7864–7872. [Google Scholar] [CrossRef]
- Tao, M.; Chen, L.; Wang, Z.; Tao, J.; Che, H.; Wang, X.; Wang, Y. Comparison and evaluation of the MODIS Collection 6 aerosol data in China. J. Geophys. Res. Atmos. 2015, 120, 6992–7005. [Google Scholar] [CrossRef]
- Wang, Q.; Sun, L.; Wei, J.; Yang, Y.; Li, R.; Liu, Q.; Chen, L. Validation and Accuracy Analysis of Global MODIS Aerosol Products over Land. Atmosphere 2017, 8, 155. [Google Scholar] [CrossRef]
- Remer, L.A.; Kaufman, Y.J.; Tanré, D.; Mattoo, S.; Chu, D.A.; Martins, J.V.; Li, R.R.; Ichoku, C.; Levy, R.C.; Kleidman, R.G.; et al. The MODIS aerosol algorithm, products, and validation. J. Atmos. Sci. 2005, 62, 947–973. [Google Scholar] [CrossRef]
- Hsu, N.C.; Tsay, S.-C.; King, M.D.; Herman, J.R. Deep Blue Retrievals of Asian Aerosol Properties During ACE-Asia. IEEE Trans. Geosci. Remote Sens. 2006, 44, 3180–3195. [Google Scholar] [CrossRef]
- Hsu, N.C.; Tsay, S.-C.; King, M.D.; Herman, J.R. Aerosol Properties Over Bright-Reflecting Source Regions. IEEE Trans. Geosci. Remote Sens. 2004, 42, 557–569. [Google Scholar] [CrossRef]
- Nichol, J.; Bilal, M. Validation of a Simplified Aerosol Retrieval Algorithm (SARA) over Beijing. Remote Sens. Environ. 2014, 153, 50–60. [Google Scholar]
- Wei, J.; Huang, B.; Sun, L.; Zhang, Z.; Wang, L.; Bilal, M. A Simple and Universal Aerosol Retrieval Algorithm for Landsat Series Images Over Complex Surfaces. J. Geophys. Res. Atmos. 2017, 122, 13–338. [Google Scholar] [CrossRef]
- Sun, K.; Chen, X.; Zhu, Z.; Zhang, T. High Resolution Aerosol Optical Depth Retrieval Using Gaofen-1 WFV Camera Data. Remote Sens. 2017, 9, 89. [Google Scholar] [CrossRef]
- Arvani, B.; Pierce, R.B.; Lyapustin, A.I.; Wang, Y.; Teggi, S.; Ghermandi, G. Application of MAIAC High Spatial Resolution Aerosol Retrievals over Po Valley (Italy). In Remote Sensing of Clouds and the Atmosphere XVIII and Optics in Atmospheric Propagation and Adaptive Systems XVI; International Society for Optics and Photonics: Bellingham, WA, USA, 2013; Volume 8890, p. 88900. [Google Scholar]
- Li, C.; Lau, A.K.; Mao, J.; Chu, D. Retrieval, validation, and application of the 1-km aerosol optical depth from MODIS measurements over Hong Kong. IEEE Trans. Geosci. Remote Sens. 2005, 43, 2650–2658. [Google Scholar] [CrossRef]
- Li, Y.; Xue, Y.; He, X.; Guang, J. High-resolution aerosol remote sensing retrieval over urban areas by synergetic use of HJ-1 CCD and MODIS data. Atmos. Environ. 2011, 46, 173–180. [Google Scholar] [CrossRef]
- Man, S.; Nichol, J.; Lee, K. Retrieval of Aerosol Optical Thickness Using MODIS 500 × 500 m(2), a Study in Hong Kong and the Pearl River Delta Region. IEEE Trans. Geosci. Remote Sens. 2010, 48, 3318–3327. [Google Scholar]
- Wang, Y.; Chen, L.; Chen, L.; Wang, X.; Yu, C.; Si, Y.; Zhang, Z. Interference of Heavy Aerosol Loading on the VIIRS Aerosol Optical Depth (AOD) Retrieval Algorithm. Remote Sens. 2017, 9, 397. [Google Scholar] [CrossRef]
- Tian, X.; Liu, Q.; Song, Z.; Dou, B.; Li, X. Aerosol Optical Depth Retrieval from Landsat 8 OLI Images Over Urban Areas Supported by MODIS BRDF/Albedo Data. IEEE Geosci. Remote Sens. Lett. 2018, 15, 976–980. [Google Scholar] [CrossRef]
- Sun, L.; Wei, J.; Bilal, M.; Tian, X.; Jia, C.; Guo, Y.; Mi, X. Aerosol Optical Depth Retrieval over Bright Areas Using Landsat 8 OLI Images. Remote Sens. 2015, 8, 23. [Google Scholar] [CrossRef]
- Picon, A.; Madhavan, B.; Gross, B.; Moshary, F.; Ahmed, S. Quantification and Assessment of Urban Surface Reflection Ratios and their Effect on Aerosol Retrieval using High Spatial Resolution LANDSAT Retrievals. In Remote Sensing for Agriculture, Ecosystems, and Hydrology XII; International Society for Optics and Photonics: Bellingham, WA, USA, 2010; Volume 7824, p. 782402. [Google Scholar]
- Bilal, M.; Qiu, Z. Aerosol Retrievals Over Bright Urban Surfaces Using Landsat 8 Images. In Proceedings of the IGARSS 2018—2018 IEEE International Geoscience and Remote Sensing Symposium, Valencia, Spain, 22–27 July 2018; pp. 7560–7563. [Google Scholar]
- Zhang, L.; Xu, S.; Wang, L.; Cai, K.; Ge, Q. Retrieval and Validation of Aerosol Optical Depth by using the GF-1 Remote Sensing Data. In Proceedings of the IOP Conference Series: Earth and Environmental Science, Zvenigorod, Russia, 4–7 September 2017; Volume 68, p. 12001. [Google Scholar]
- Zhang, T.; Zhu, Z.; Gong, W.; Zhu, Z.; Sun, K.; Wang, L.; Huang, Y.; Mao, F.; Shen, H.; Li, Z.; et al. Estimation of ultrahigh resolution PM2.5 concentrations in urban areas using 160 m Gaofen-1 AOD retrievals. Remote Sens. Environ. 2018, 216, 91–104. [Google Scholar] [CrossRef]
- Zhu, W.; Zheng, T.; Zhang, L.; Wang, L.; Cai, K. The Retrieval of Aerosol over Land Surface from GF-1 16m Camera with Deep Blue Algorithm. In Proceedings of the IOP Conference Series: Earth and Environmental Science, Zvenigorod, Russia, 4–7 September 2017; Volume 100, p. 12093. [Google Scholar]
- Martins, V.S.; Barbosa, C.C.F.; De Carvalho, L.S.; Jorge, D.S.F.; Lobo, F.D.L.; Novo, E.M.L.D.M. Assessment of Atmospheric Correction Methods for Sentinel-2 MSI Images Applied to Amazon Floodplain Lakes. Remote Sens. 2017, 9, 322. [Google Scholar] [CrossRef]
- Zhang, Z.; Wu, W.; Fan, M.; Tao, M.; Wei, J.; Jin, J.; Wang, Q. Validation of Himawari-8 aerosol optical depth retrievals over China. J. Atmos. Environ. 2019, 199, 32–44. [Google Scholar] [CrossRef]
- Kaufman, Y.J.; Tanré, D.; Remer, L.A.; Vermote, E.F.; Chu, A.; Holben, B.N. Operational remote sensing of tropospheric aerosol over land from EOS moderate resolution imaging spectroradiometer. J. Geophys. Res. Space Phys. 1997, 102, 17051–17067. [Google Scholar] [CrossRef]
- Li, Y.; Zhang, Y.; Tao, C.; Zhu, H. Content-based high-resolution remote sensing image retrieval via unsupervised feature learning and collaborative affinity metric fusion. Remote Sens. Technol. Appl. 2016, 31, 709. [Google Scholar] [CrossRef]
- King, M.D.; Kaufman, Y.J.; Tanré, D.; Nakajima, T. Remote Sensing of Tropospheric Aerosols from Space: Past, Present, and Future. Bull. Am. Meteorol. Soc. 1999, 80, 2229–2259. [Google Scholar] [CrossRef]
- Yang, F.; Wang, Y.; Tao, J.; Wang, Z.; Fan, M.; De Leeuw, G.; Chen, L. Preliminary Investigation of a New AHI Aerosol Optical Depth (AOD) Retrieval Algorithm and Evaluation with Multiple Source AOD Measurements in China. Remote Sens. 2018, 10, 748. [Google Scholar] [CrossRef]
- Yoshida, M.; Kikuchi, M.; Nagao, T.M.; Murakami, H.; Nomaki, T.; Higurashi, A. Common Retrieval of Aerosol Properties for Imaging Satellite Sensors. J. Meteorol. Soc. Jpn. 2018. [Google Scholar] [CrossRef]
- Holben, B.; Eck, T.; Slutsker, I.; Tanré, D.; Buis, J.; Setzer, A.; Vermote, E.; Reagan, J.; Kaufman, Y.; Nakajima, T.; et al. AERONET—A Federated Instrument Network and Data Archive for Aerosol Characterization. Remote Sens. Environ. 1998, 66, 1–16. [Google Scholar] [CrossRef]
- Holben, B.N.; Tanré, D.; Smirnov, A.; Eck, T.F.; Slutsker, I.; Abuhassan, N.; Newcomb, W.W.; Schafer, J.S.; Chatenet, B.; Lavenu, F.; et al. An emerging ground-based aerosol climatology: Aerosol optical depth from AERONET. J. Geophys. Res. Space Phys. 2001, 106, 12067–12097. [Google Scholar] [CrossRef]
- Vermote, E.F.; El Saleous, N.; Justice, C.; Kaufman, Y.J.; Privette, J.L.; Remer, L.; Roger, J.C.; Tanré, D. Atmospheric correction of visible to middle-infrared EOS-MODIS data over land surfaces: Background, operational algorithm and validation. J. Geophys. Res. Space Phys. 1997, 102, 17131–17141. [Google Scholar] [CrossRef]
- Vermote, E.F.; Tanre, D.; Deuze, J.L.; Herman, M.; Morcette, J.-J. Second Simulation of the Satellite Signal in the Solar Spectrum, 6S: An overview. IEEE Trans. Geosci. Remote Sens. 1997, 35, 675–686. [Google Scholar] [CrossRef]
- Kotchenova, S.Y.; Vermote, E.F.; Matarrese, R.; Klemm, J.F.J. Validation of a vector version of the 6S radiative transfer code for atmospheric correction of satellite data Part I: Path radiance. Appl. Opt. 2006, 45, 6762–6774. [Google Scholar] [CrossRef]
- Dubovik, O.; Holben, B.; Eck, T.F.; Smirnov, A.; Kaufman, Y.J.; King, M.D.; Tanré, D.; Slutsker, I. Variability of Absorption and Optical Properties of Key Aerosol Types Observed in Worldwide Locations. J. Atmos. Sci. 2002, 59, 590–608. [Google Scholar] [CrossRef]
- Jacobson, M.Z. Fundamentals of Atmospheric Modeling, 2nd ed.; Cambridge University Press: Cambridge, UK, 2005; Volume 317. [Google Scholar]
- Martins, J.V.; Tanre, D.; Remer, L.; Kaufman, Y.; Mattoo, S.; Levy, R. MODIS Cloud screening for remote sensing of aerosols over oceans using spatial variability. Geophys. Res. Lett. 2002, 29. [Google Scholar] [CrossRef]
- Yun, Y.; Xia, Y.; Zhang, J.; Pan, Y. Cloud and Cloud Shadow Detection in GF-1 Imagery Using Single-data Method. Remote Sens. Inf. 2017, 32, 35–40. [Google Scholar]
- Shams, S.B.; Mohammadzadeh, A. A Novel Aerosol Load Index Using MODIS Visible Bands: Applied to South-West Part of Iran. IEEE J. Sel. Top. Appl. Earth Obs. Remote Sens. 2015, 8, 1167–1175. [Google Scholar] [CrossRef]


Publisher’s Note: MDPI stays neutral with regard to jurisdictional claims in published maps and institutional affiliations. |
© 2021 by the authors. Licensee MDPI, Basel, Switzerland. This article is an open access article distributed under the terms and conditions of the Creative Commons Attribution (CC BY) license (http://creativecommons.org/licenses/by/4.0/).