Real-Time Detection and Spatial Localization of Insulators for UAV Inspection Based on Binocular Stereo Vision


Abstract

1. Introduction
- An automatic transmission line inspection system integrated with UAV remote sensing and binocular stereo vision technology is developed to accurately detect and locate power equipment in real time. This system would be beneficial for transmission line inspection and similar applications in other fields;
- We propose an insulator detection algorithm based on RGB-D saliency detection and skeleton structure characteristics, which can detect insulators in real time for aerial images with complex backgrounds;
- We propose a real-time object spatial localization method that combines binocular stereo vision and a GPS device. The latitude, longitude and height of insulators are accurately obtained through coordinate conversion during the UAV inspection.
2. Materials
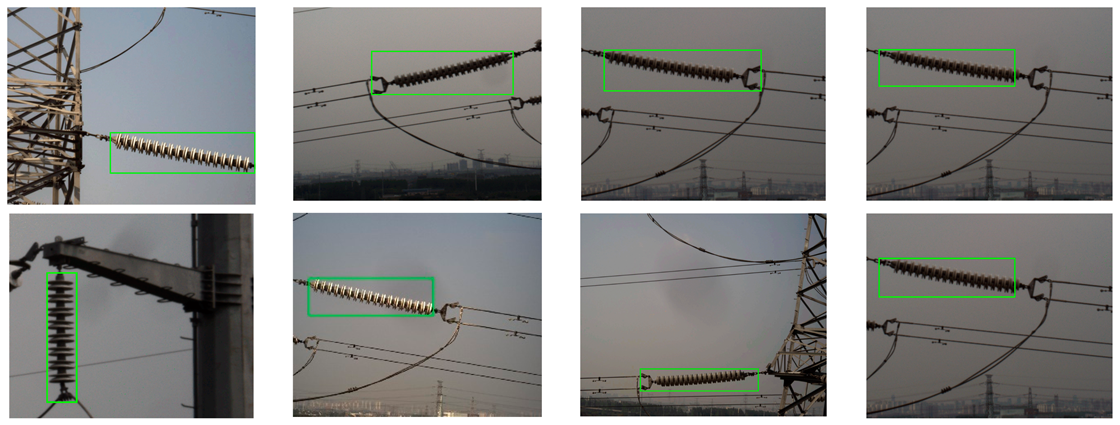
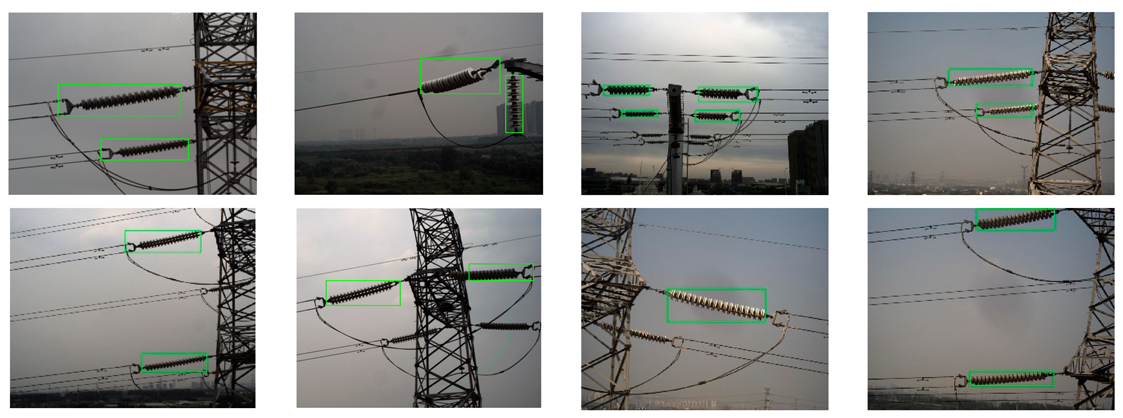
2.1. Dataset
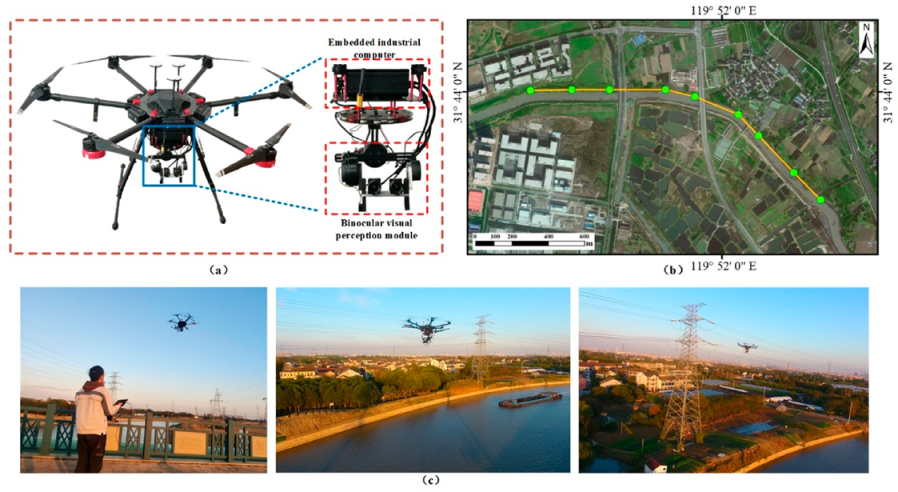
2.2. Automatic Insulator Inspection System
- (1)
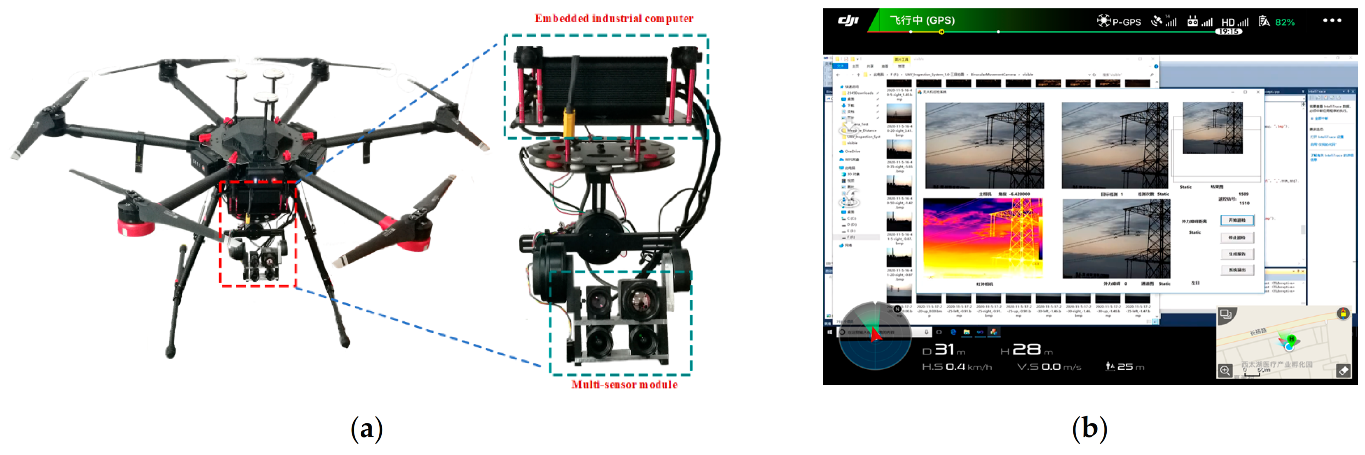
- We use binocular cameras instead of a monocular camera in the conventional system, which can obtain the depth of the scene and provide more supplementary information for the detection of the transmission line equipment;
- (2)
- We innovatively integrate an embedded industrial computer, which is installed on the UAV and powered directly by the UAV’s power supply. It mainly includes the following functions:
- Storing the images acquired by the binocular visual perception system. The traditional UAV storage module can only store the information obtained by a single visual sensor at a time and save the information to a memory card. When recalling the collected information, it is necessary to read the memory card first and then process the data, which is inflexible. In our system, images obtained by the binocular visual perception system are directly stored in the embedded industrial computer synchronously, which is convenient for the subsequent real-time invocation and processing of data information;
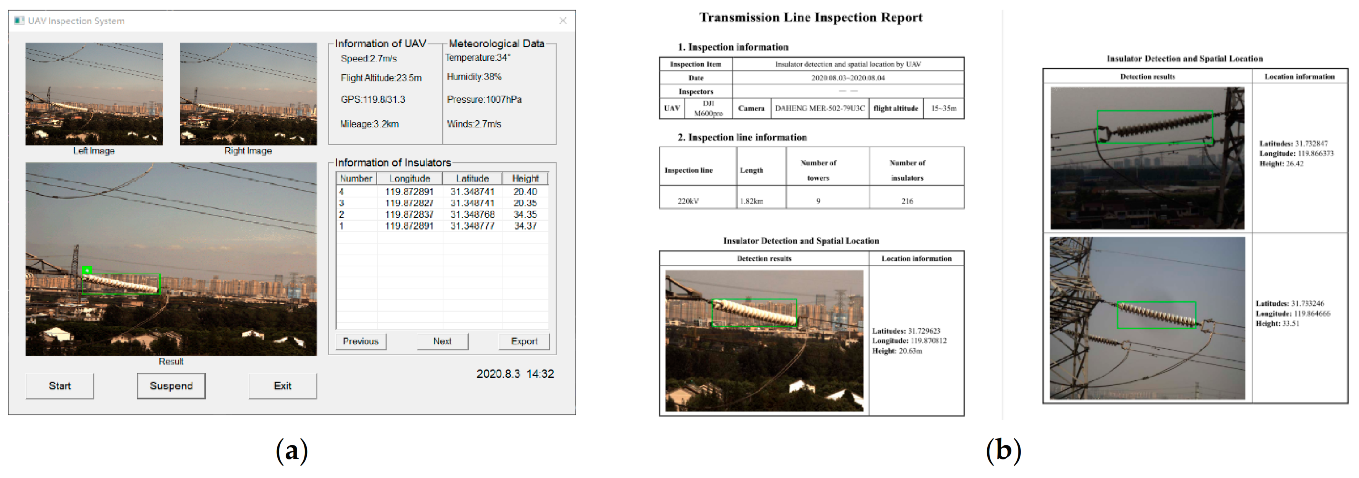
- Processing the image information collected by the binocular vision system in real time. In traditional transmission line inspections, data processing and analysis still need to rely on manual labor. The main workflow includes data information copying, manual inspection and analysis, manual writing of inspection reports, etc. It is very labor-intensive and time-consuming. In this paper, the images collected by cameras are processed in real time using the embedded industrial computer with the implanted algorithm. Moreover, the inspection report can be generated automatically;
- Integrating the multichannel image signal into a single-channel signal. In the traditional UAV system, only a single image transmission module is equipped. The pilot’s observation screen only displays the image information acquired by a single camera. The embedded industrial computer can integrate multichannel image signals into single-channel image signals and then send them to the observation screen through the UAV’s image transmission module. Moreover, combined with a real-time information processing function, the current inspection area detection results can also be transmitted to the observation screen.
3. Methods
3.1. Depth Information Acquisition
3.1.1. Image Segmentation
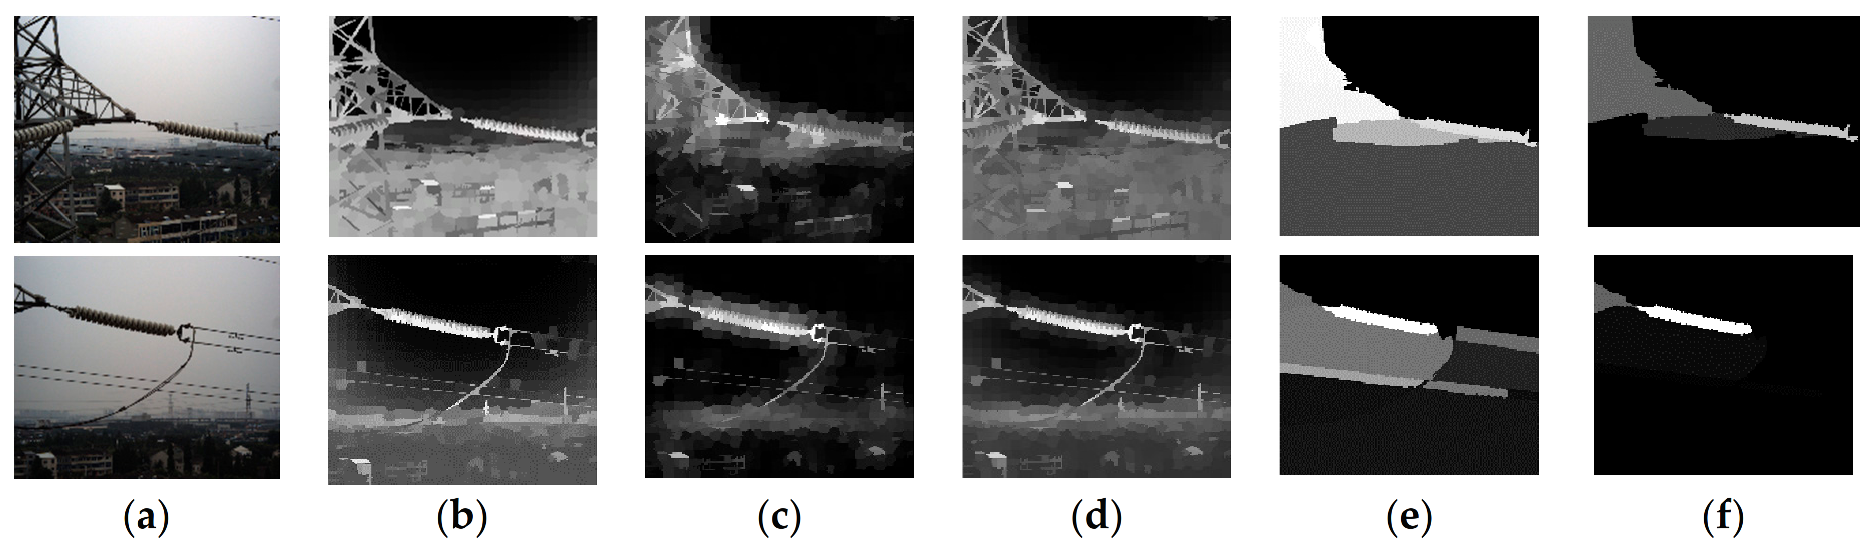
3.1.2. Construction of Depth Map
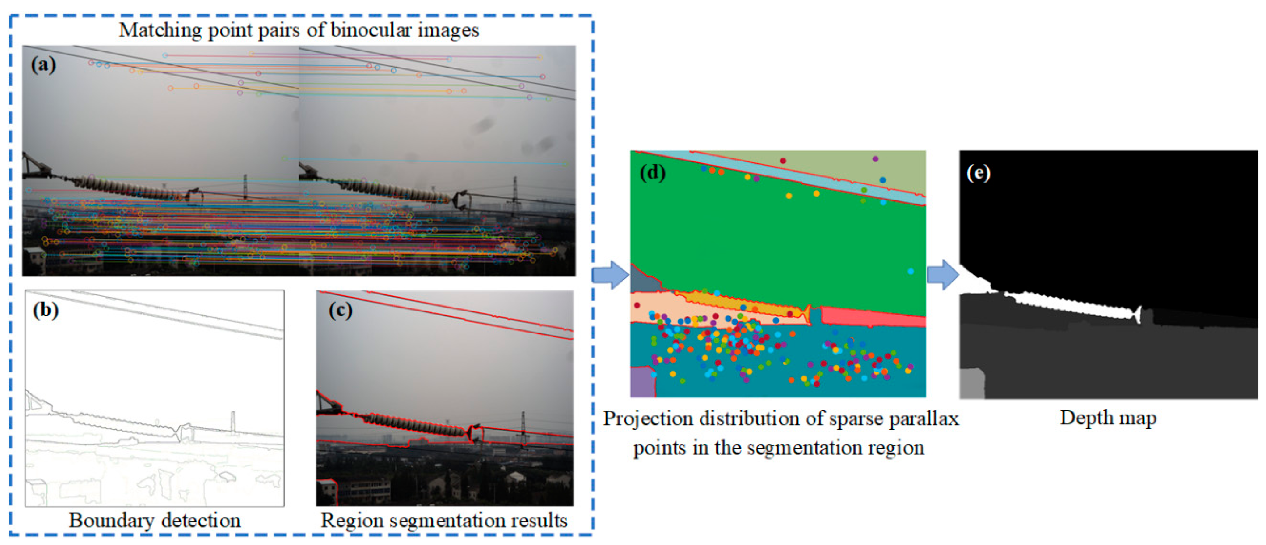
- Speeded-up robust features (SURF) [34] is a fast and stable algorithm to detect feature points. In our method, SURF is used to extract feature points of binocular images and calculate their 64-dimension descriptors;
- According to the Euclidean distance between the feature points in the left image and the right image, the original matching point pair is selected;
- There are some mismatched feature point pairs in the initial matching results obtained in the above steps; we use slope consistency to eliminate mismatches. First, we connect the original matching point pairs with lines and calculate their slope in the image coordinate system. Then the frequency of slope ratio is calculated, and the slope with the highest frequency is taken as the principal slope. The matching point pairs that have the same slope values as the principal slope are retained and defined as sparse parallax point pairs. Finally, the depth values of the sparse parallax point pairs are calculated;
- We count the projection distribution of sparse parallax points in the segmentation region and take the mean parallax of matching points in each region as the parallax value of this region. Then the depth map is constructed based on the sparse parallax map.
3.2. Insulator Detection
3.2.1. Construction of RGB-D Saliency Map
- Color contrast
- 2.
- Texture contrast
- 3.
- Feature contrast map fusion
- 4.
- Saliency Optimization Using Depth Information
3.2.2. Skeleton Structure
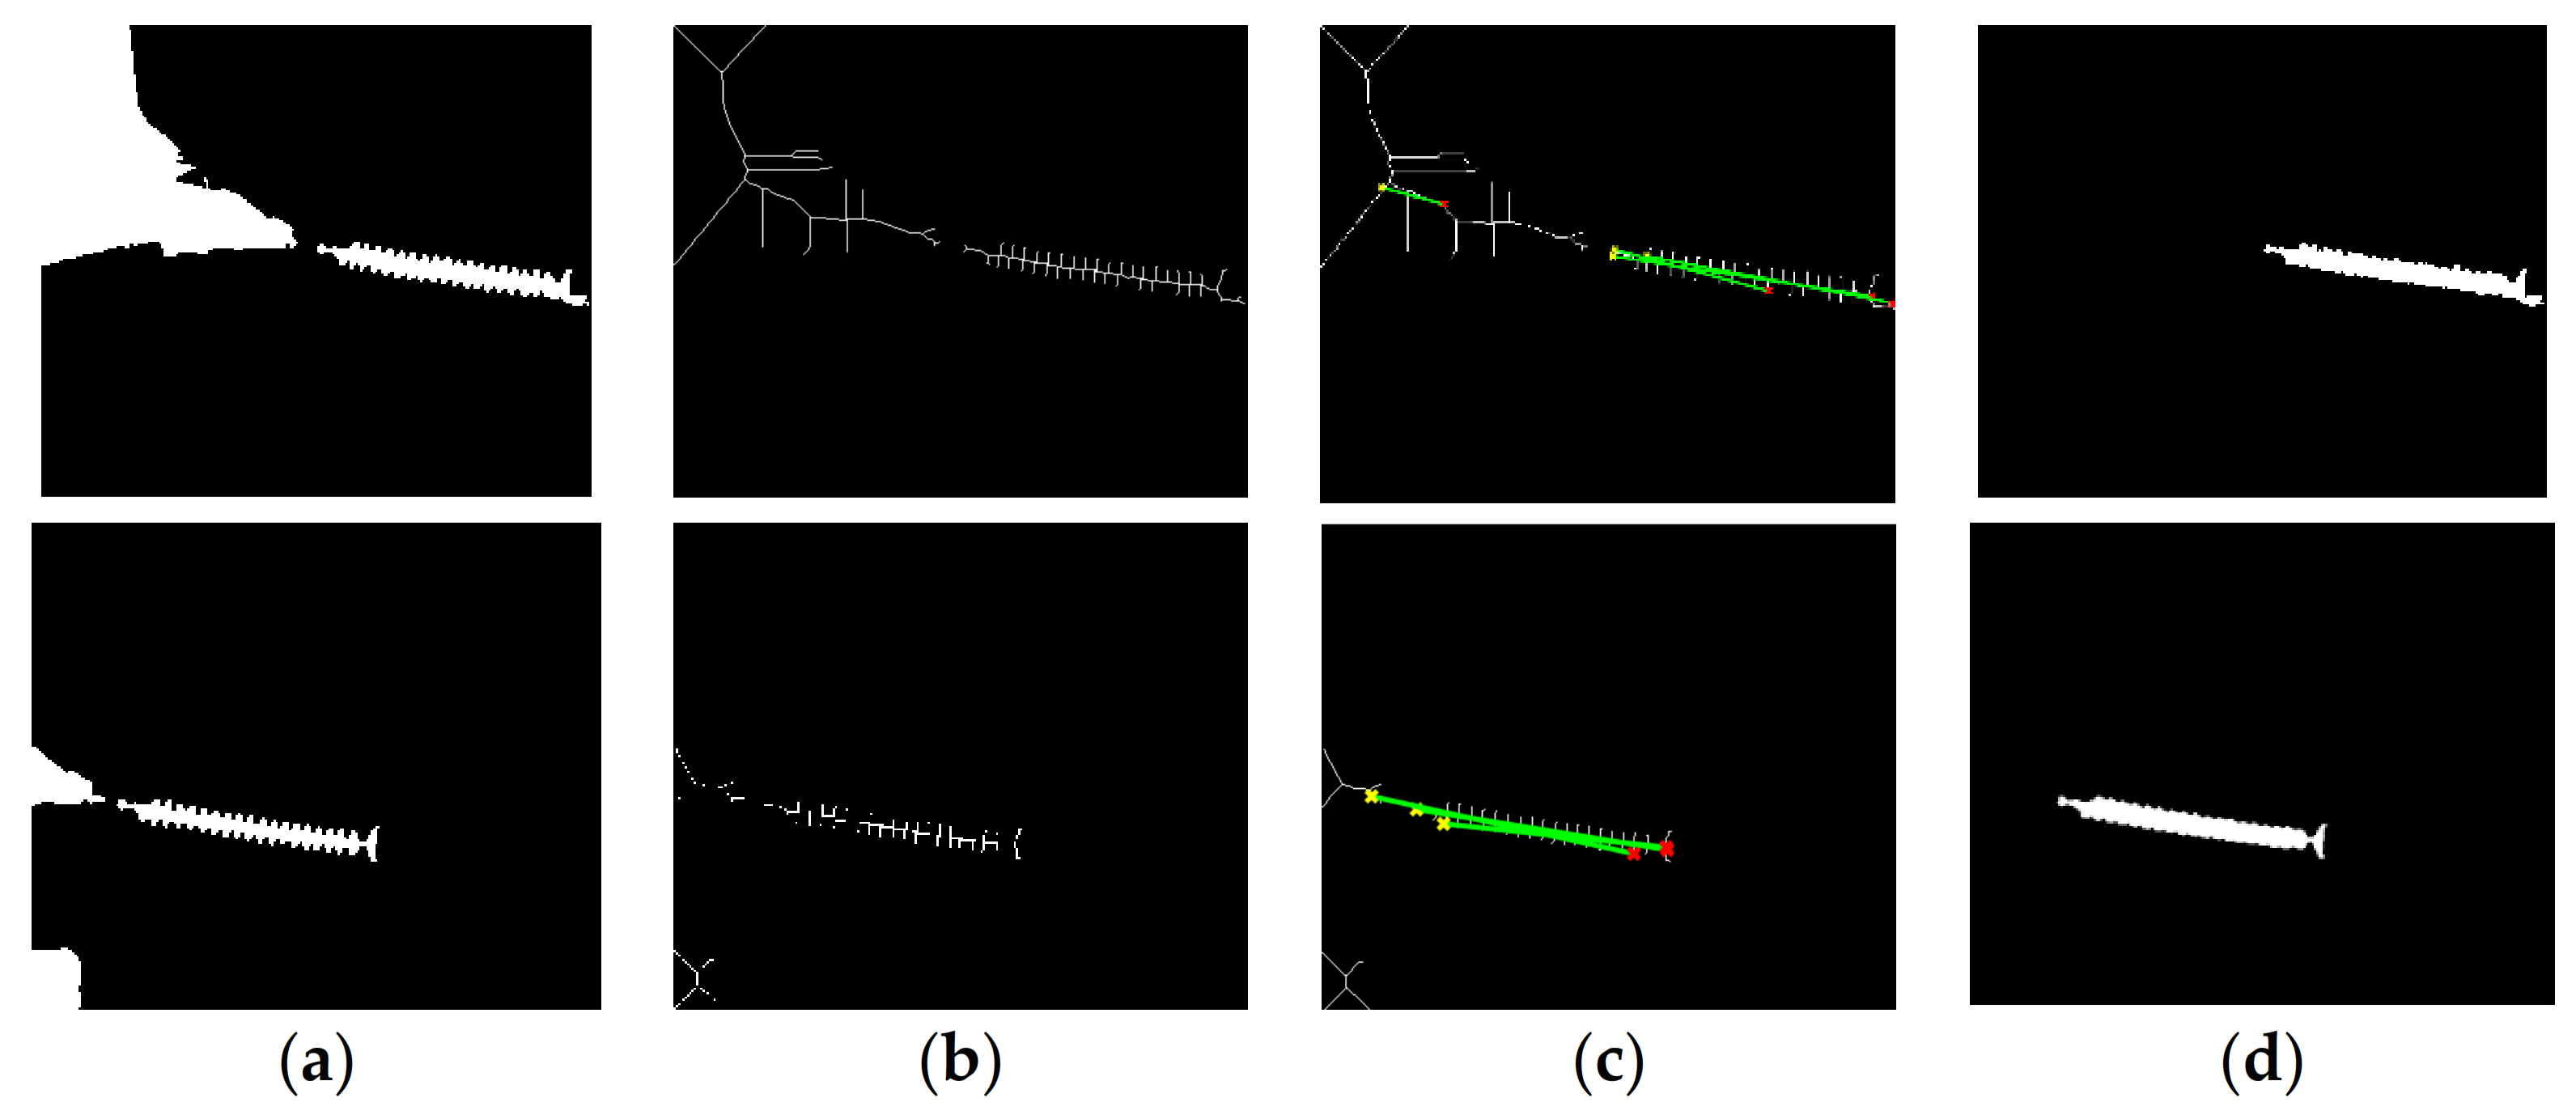
- In the skeleton structure diagram, the central axis of the insulator strings corresponds to a long straight line, and the insulator caps correspond to several short straight lines;
- All short straight lines are traversed by long straight lines;
- The short straight lines are of approximately equal length and are arranged in parallel in the long straight lines at equal intervals.
- Center axis searching. We use the Hough algorithm [38] to detect straight lines in skeleton images. According to Equation (8), a straight line whose length is greater than 1/3 of the longer side length of the circumscribed rectangle of the connected domain is regarded as the suspected insulator central axis. The detection results are shown in Figure 6c.
- Insulator caps searching. We search for lines that are vertically bisected by the candidate central axis and record their length and position. Then, the number of lines is counted. We set a threshold , if , the candidate target is retained for the third step of filtering. is set to 6 in our experiment.
- Uniform arrangement judgment. The length variance of the short line is calculated to represent the length consistency of the short line. The distance variance of the short line is calculated to represent the distance consistency of the short line. If the two parameters satisfy Equation (9), these short straight lines are determined to be the skeleton of insulator caps and are retained. Otherwise, they will be judged as false targets and eliminated so as to achieve precise detection of insulators.where the threshold value is empirically set to 5.
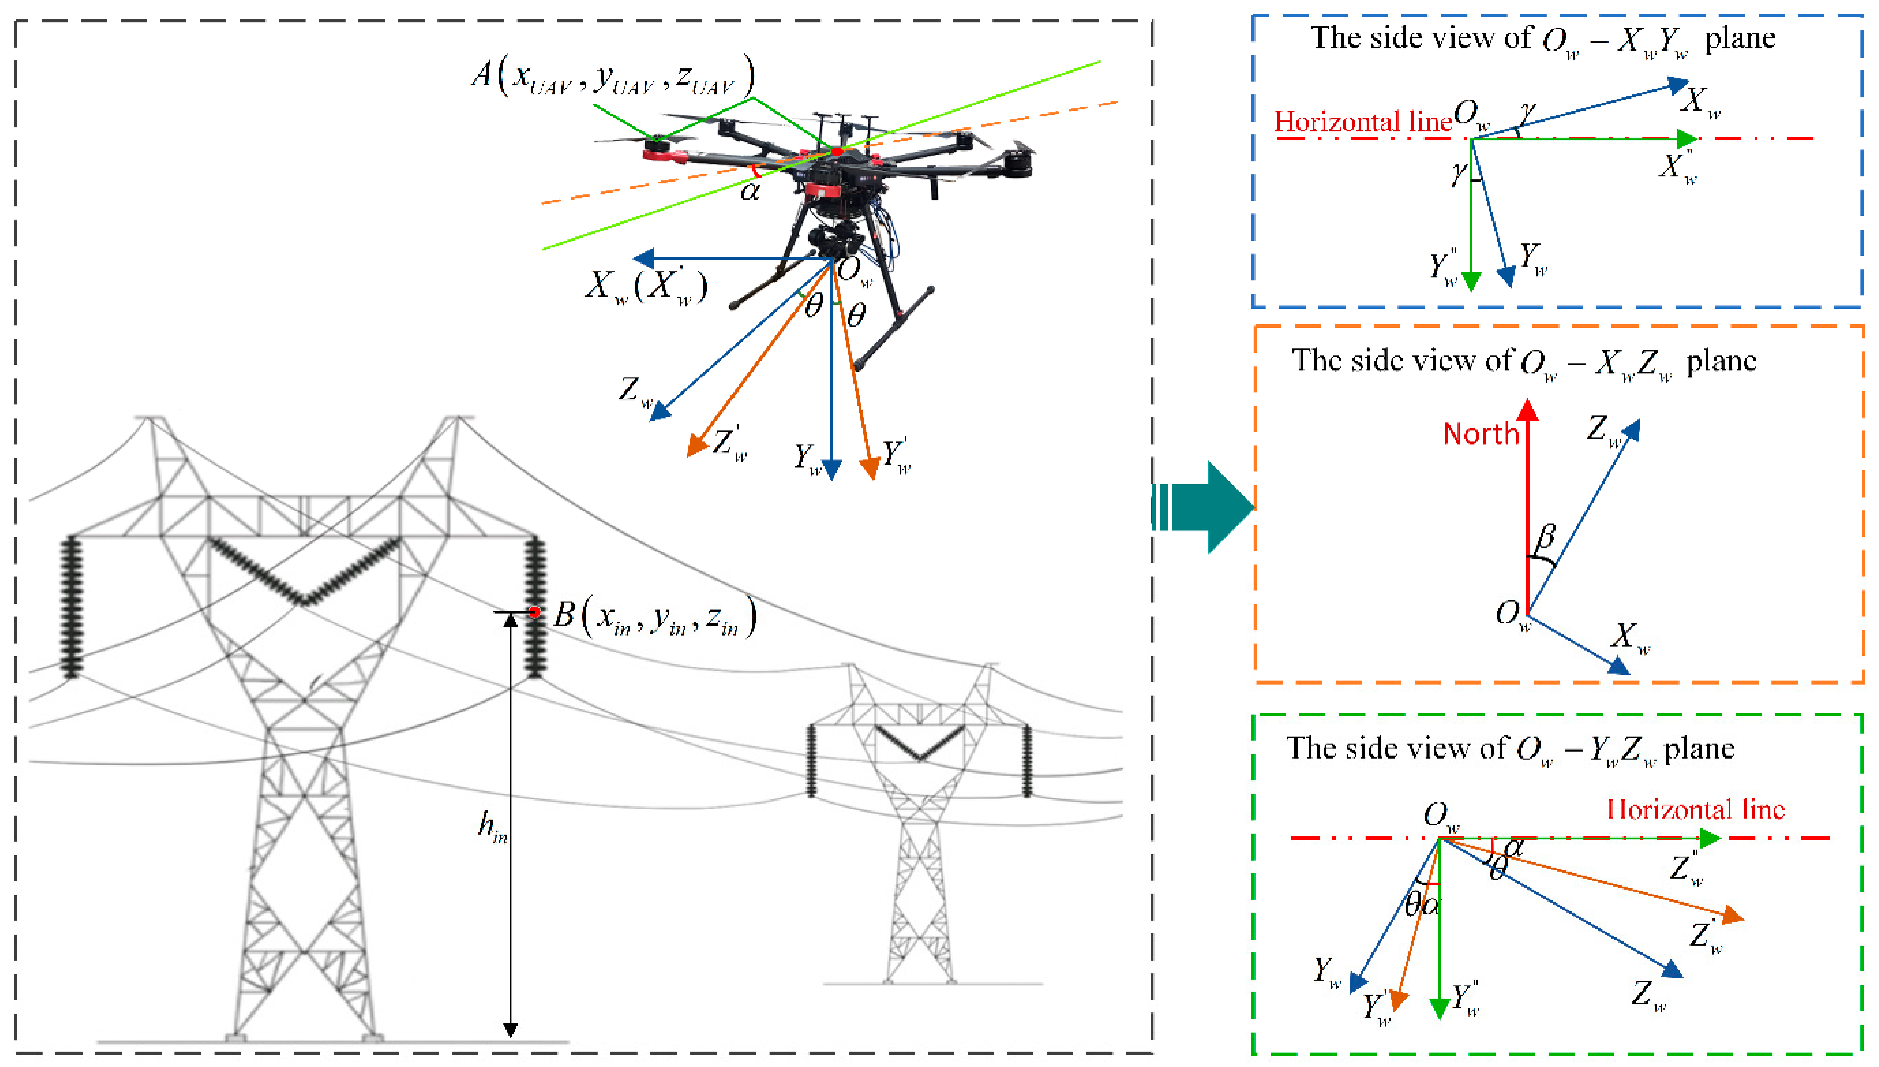
3.3. Insulator Localization
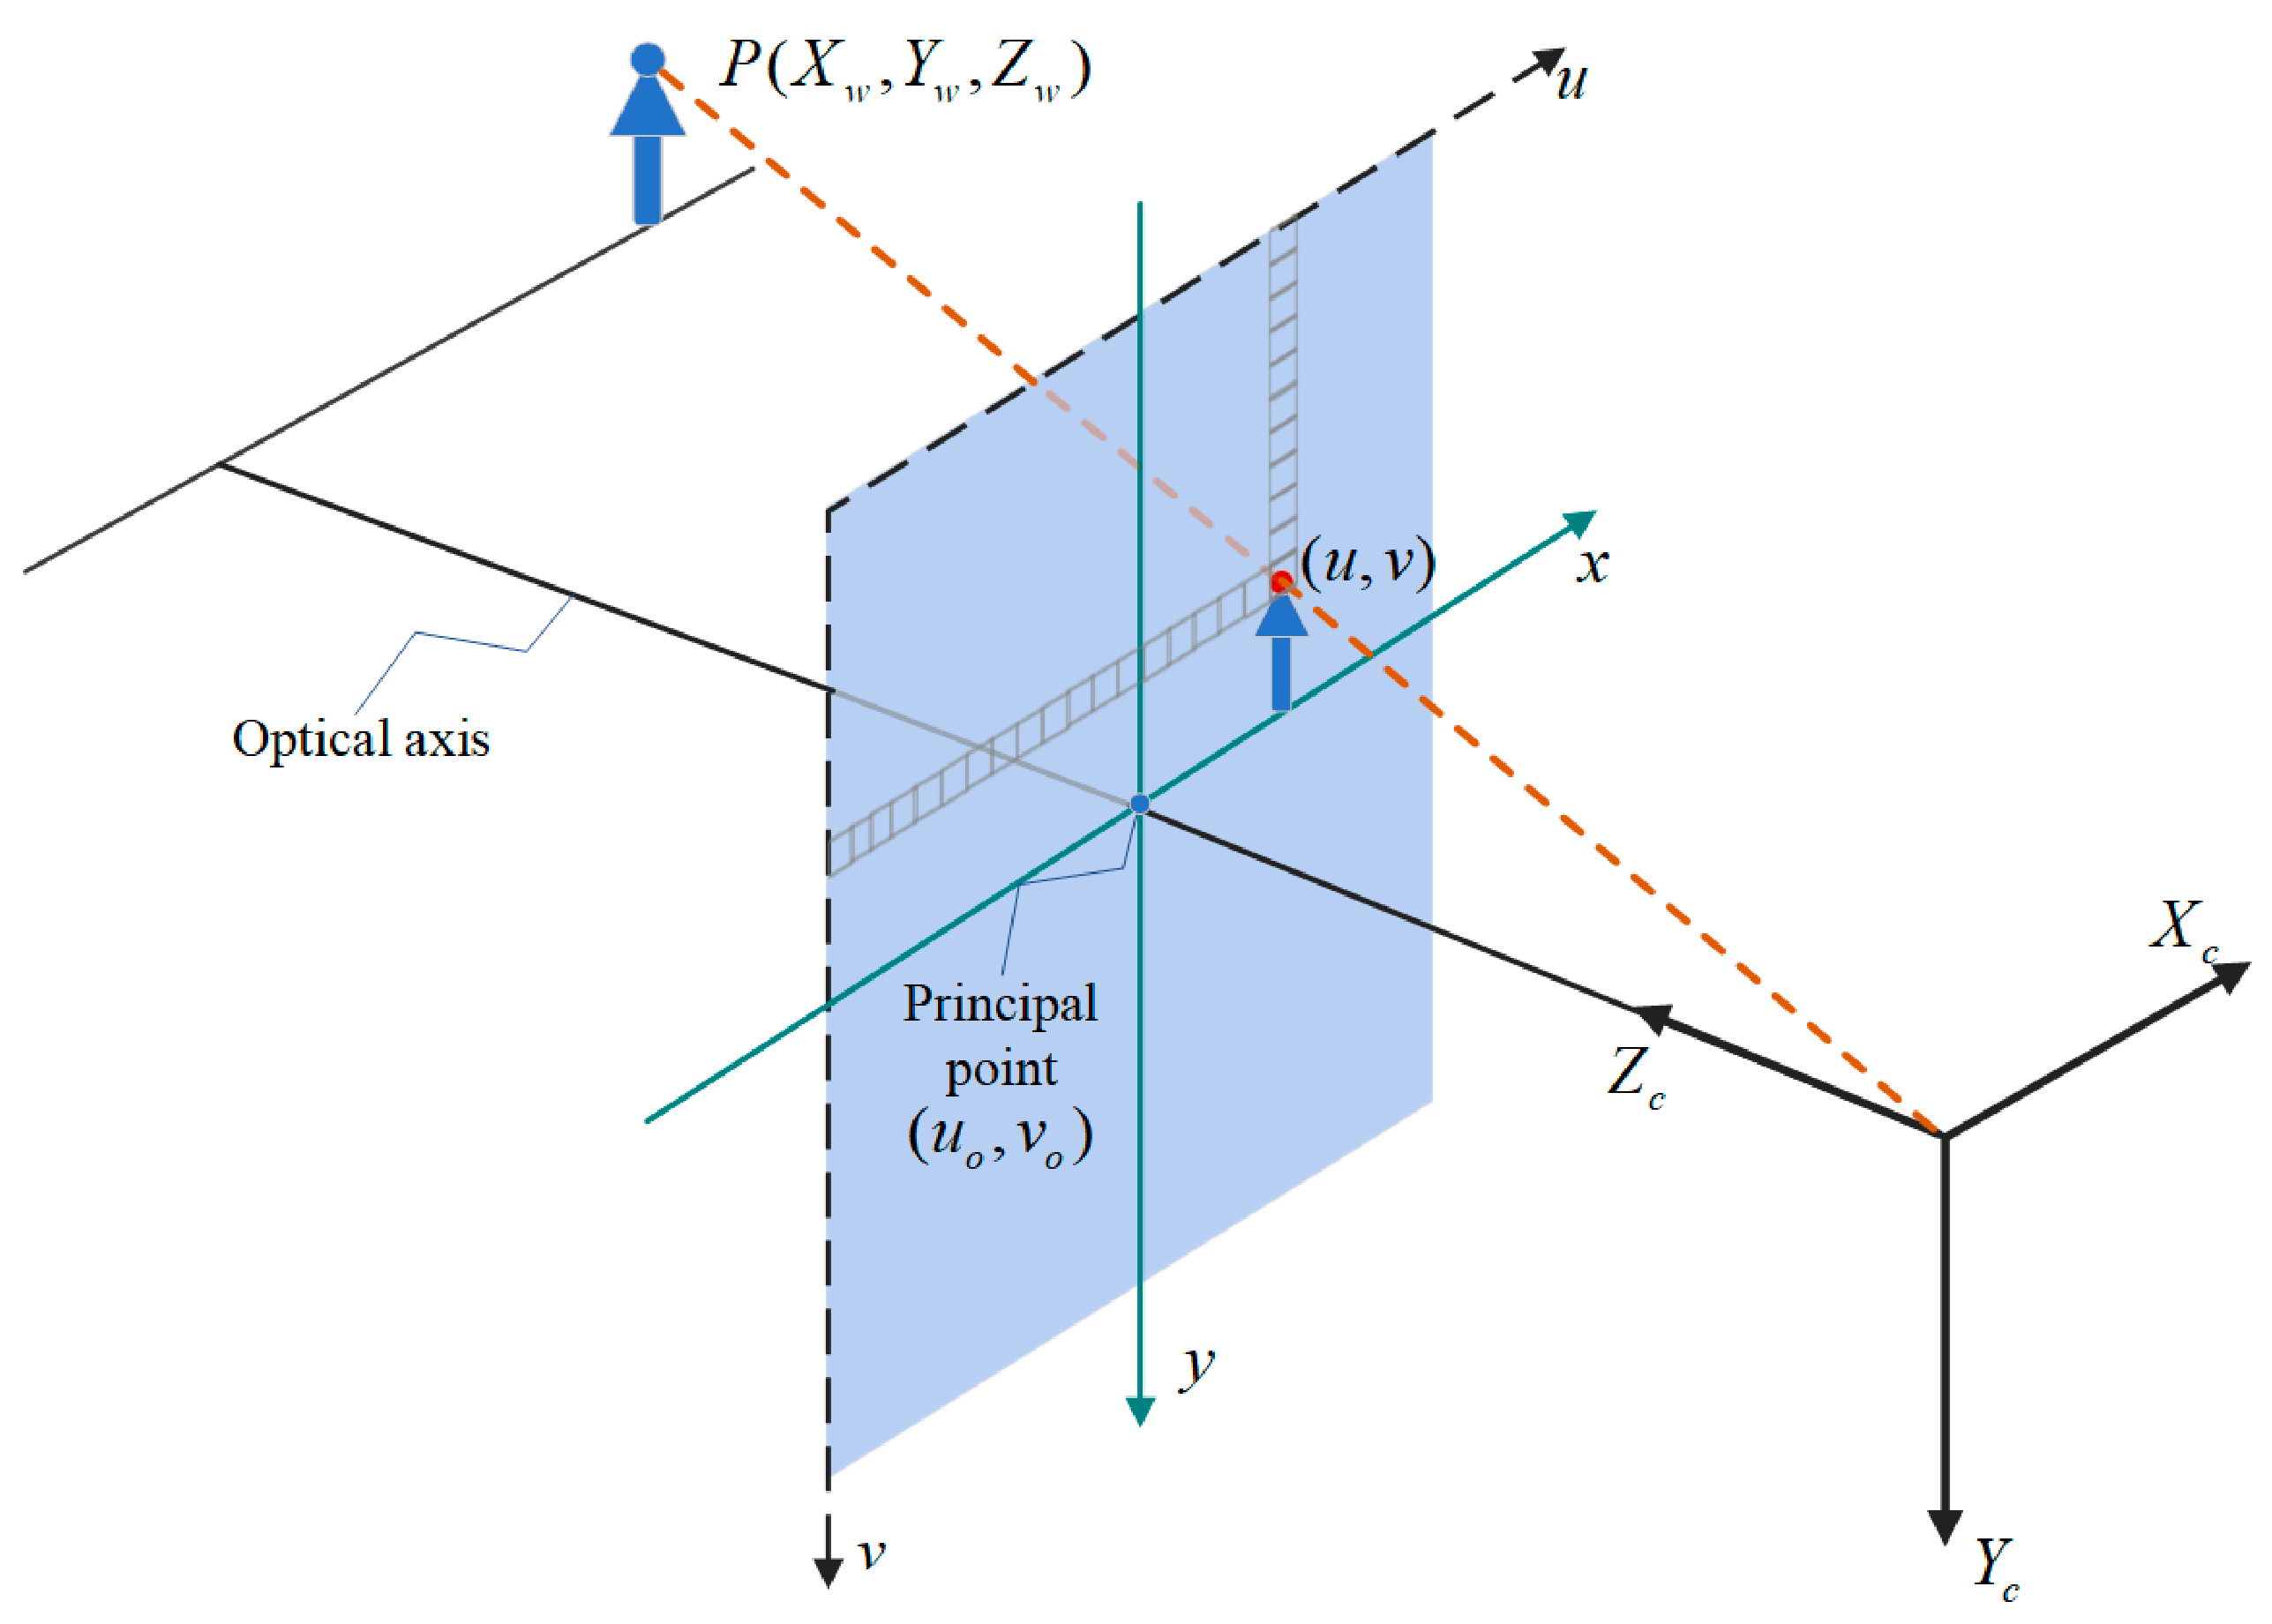
3.3.1. Binocular Visual–Spatial Location
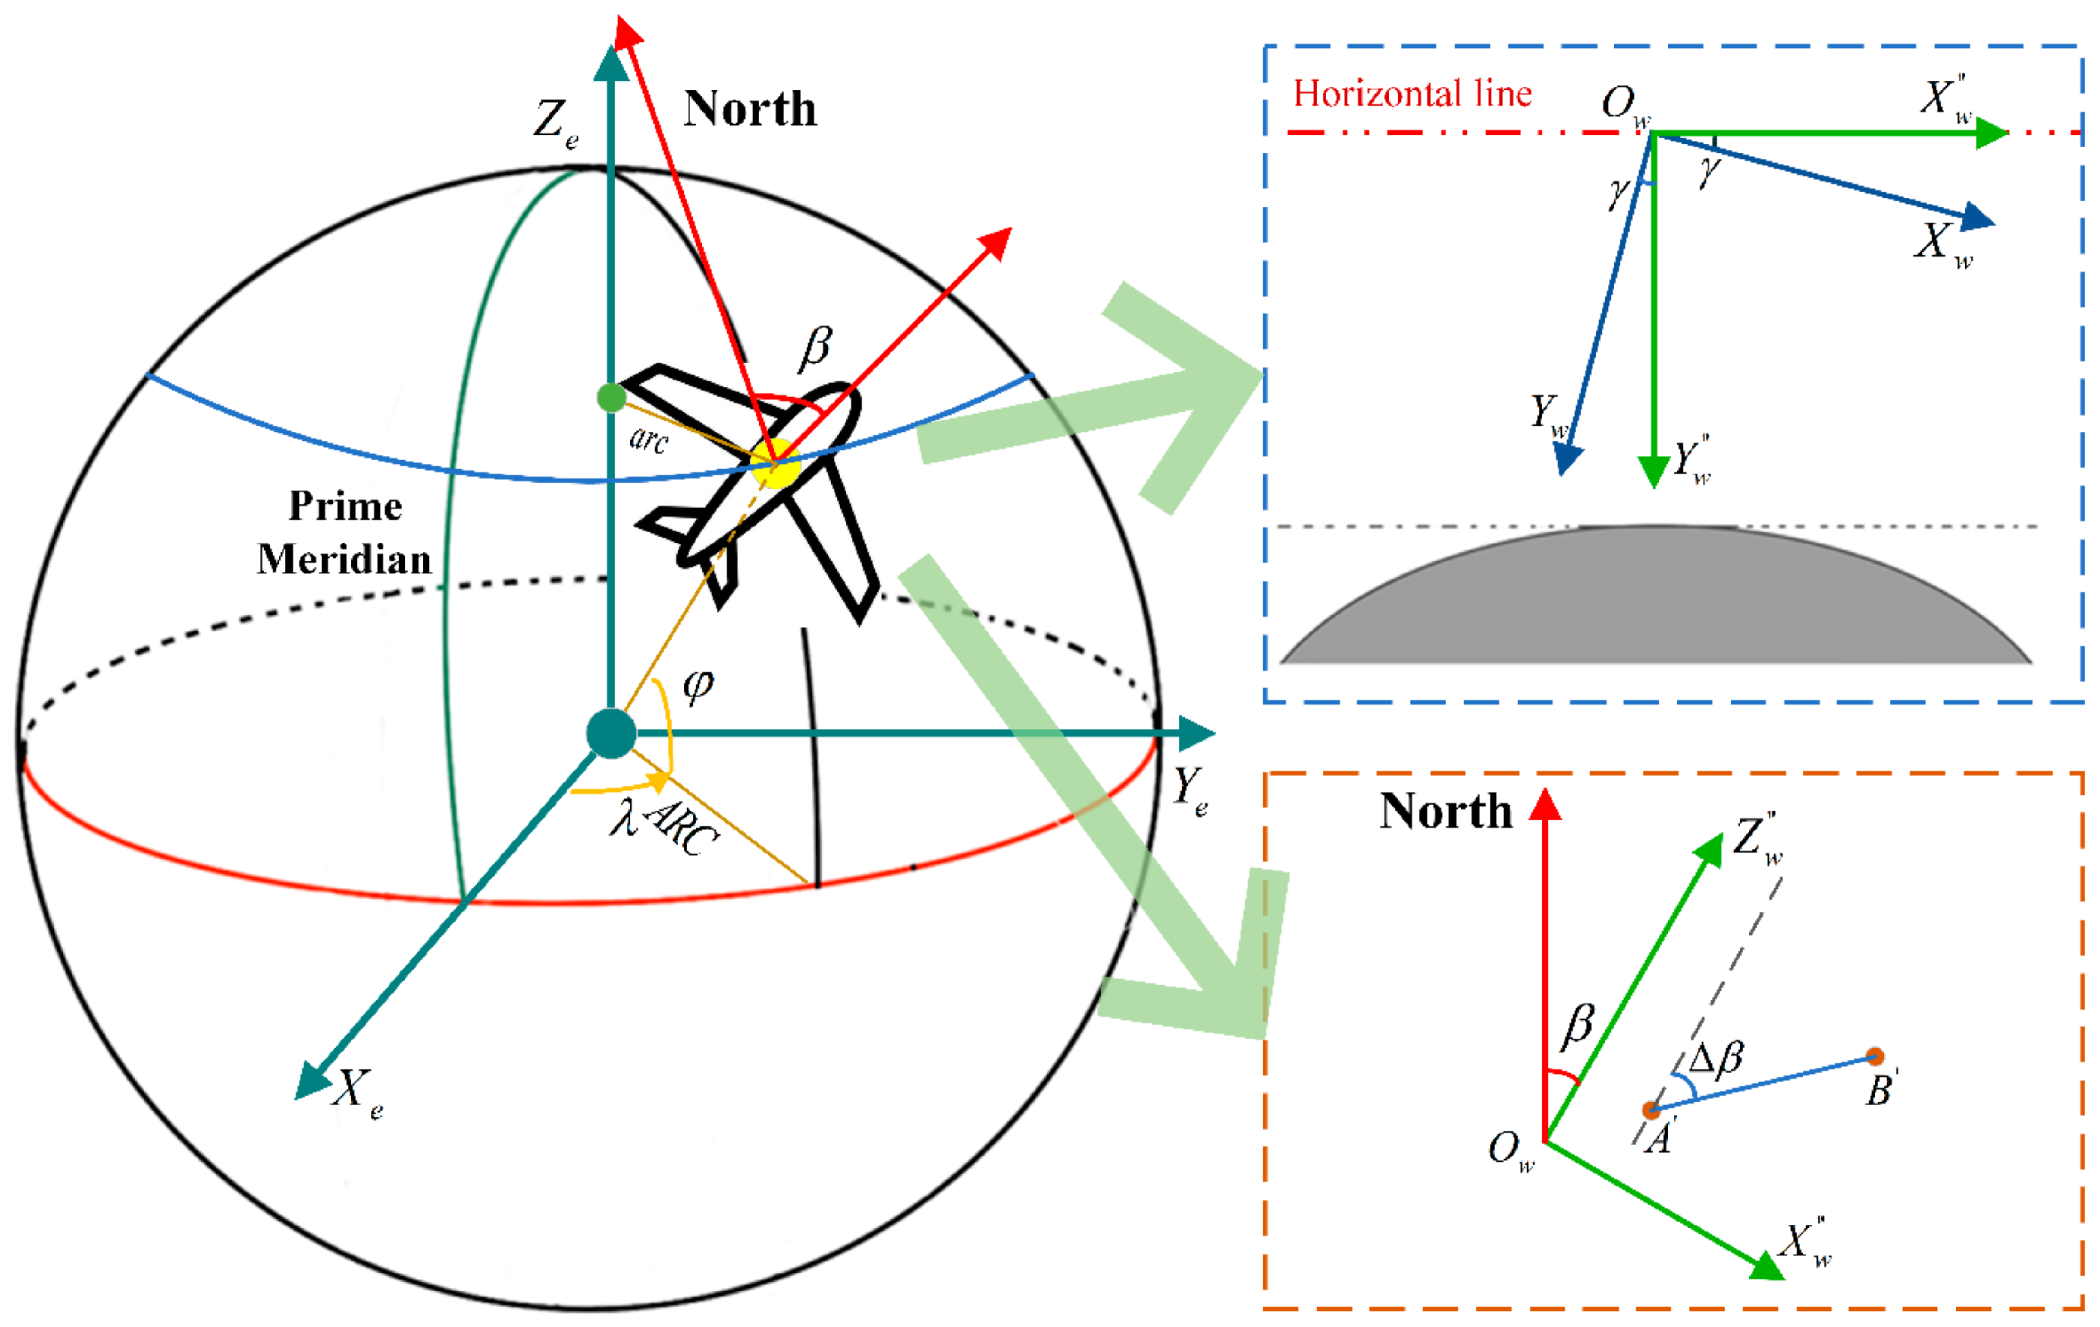
3.3.2. Geographic Coordinates of Insulators
4. Results
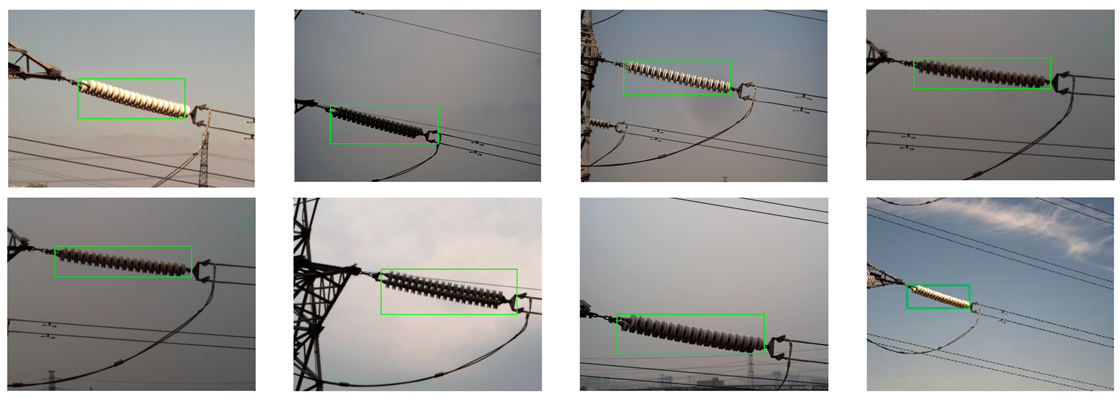
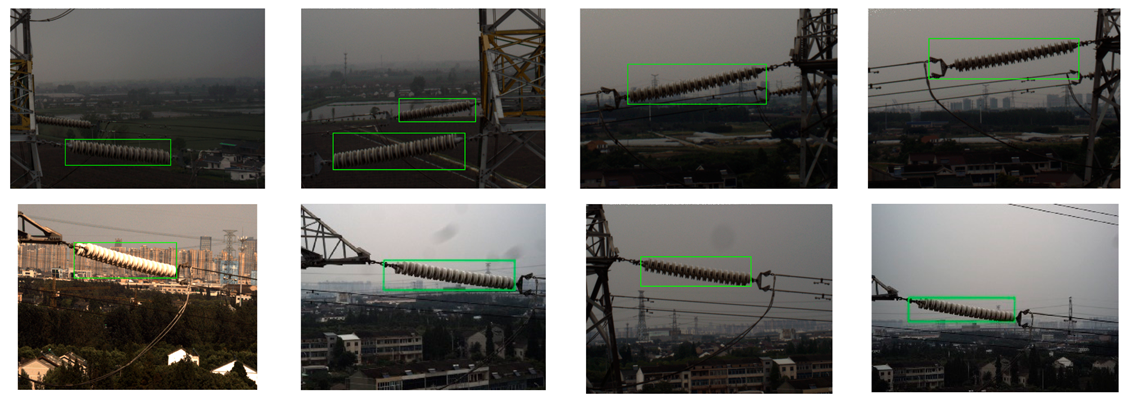
4.1. Performance of the Insulator Detection Algorithm
4.2. Performance of the UAV Automatic Inspection System
5. Discussion
6. Conclusions
Author Contributions
Funding
Data Availability Statement
Acknowledgments
Conflicts of Interest
References
- Wu, Y.; Zhao, G.; Hu, J.; Ouyang, Y.; Wang, S.X.; He, J.L.; Gao, F.; Wang, S. Overhead Transmission Line Parameter Reconstruction for UAV Inspection Based on Tunneling Magnetoresistive Sensors and Inverse Models. IEEE Trans. Power Deliv. 2019, 34, 819–827. [Google Scholar] [CrossRef]
- Zhang, R.; Yang, B.; Xiao, W.; Liang, F.; Liu, Y.; Wang, Z. Automatic Extraction of High-Voltage Power Transmission Objects from UAV Lidar Point Clouds. Remote Sens. 2019, 11, 2600. [Google Scholar] [CrossRef]
- Park, K.; Motai, Y.; Yoon, J.R. Acoustic Fault Detection Technique for High-Power Insulators. IEEE Trans. Ind. Electron. 2017, 64, 9699–9708. [Google Scholar] [CrossRef]
- Jiang, H.; Qiu, X.; Chen, J.; Liu, X.; Miao, X.; Zhuang, S. Insulator Fault Detection in Aerial Images Based on Ensemble Learning with Multi-Level Perception. IEEE Access 2019, 7, 61797–61810. [Google Scholar] [CrossRef]
- Kim, T.; Jeon, S.; Lee, Y.J.; Yi, J.; Choi, I.H.; Son, J.A.; Choi, C.W. Three-dimensional computed tomography and composition analysis of porcelain insulators for 154 kV power transmission lines. IEEE Trans. Dielectr. Electr. Insul. 2019, 26, 115–119. [Google Scholar] [CrossRef]
- Liu, Z.; Wang, X.; Liu, Y. Application of Unmanned Aerial Vehicle Hangar in Transmission Tower Inspection Considering the Risk Probabilities of Steel Towers. IEEE Access 2019, 7, 159048–159057. [Google Scholar] [CrossRef]
- Munir, N.; Awrangjeb, M.; Stantic, B. Automatic Extraction of High-Voltage Bundle Subconductors Using Airborne LiDAR Data. Remote Sens. 2020, 12, 3078. [Google Scholar] [CrossRef]
- Zeng, H.; Zuo, P.; Deng, F.; Zhang, P. Monitoring System of Transmission Line in Mountainous Area Based on LPWAN. Energies 2020, 13, 4898. [Google Scholar] [CrossRef]
- Jiang, S.; Jiang, W.; Huang, W.; Yang, L. UAV-Based Oblique Photogrammetry for Outdoor Data Acquisition and Offsite Visual Inspection of Transmission Line. Remote Sens. 2017, 9, 278. [Google Scholar] [CrossRef]
- Meng, L.; Peng, Z.; Zhou, J.; Zhang, J.; Lu, Z.; Baumann, A.; Du, Y. Real-Time Detection of Ground Objects Based on Unmanned Aerial Vehicle Remote Sensing with Deep Learning: Application in Excavator Detection for Pipeline Safety. Remote Sens. 2020, 12, 182. [Google Scholar] [CrossRef]
- Liang, H.; Zuo, C.; Wei, W. Detection and Evaluation Method of Transmission Line Defects Based on Deep Learning. IEEE Access 2020, 8, 38448–38458. [Google Scholar] [CrossRef]
- Zhang, X.; An, J.; Chen, F. A Simple Method of Tempered Glass Insulator Recognition from Airborne Image. In Proceedings of the 2010 International Conference on Optoelectronics and Image Processing (ICOIP), Haikou, China, 11–12 November 2010; Volume 1, pp. 127–130. [Google Scholar]
- Wu, Q.; An, J. An active contour model based on texture distribution for extracting inhomogeneous insulators from aerial images. IEEE Trans. Geosci. Remote Sens. 2014, 52, 3613–3626. [Google Scholar] [CrossRef]
- Zhao, Z.; Liu, N.; Wang, L. Localization of multiple insulators by orientation angle detection and binary shape prior knowledge. IEEE Trans. Dielectr. Electr. Insul. 2015, 22, 3421–3428. [Google Scholar] [CrossRef]
- Li, H.; Qiao, Q. Localisation of insulator strings’ images based on colour filtering and texture matching. J. Eng. 2019, 2019, 2790–2793. [Google Scholar] [CrossRef]
- Zhai, Y.; Chen, R.; Yang, Q.; Li, X.; Zhao, Z. Insulator Fault Detection Based on Spatial Morphological Features of Aerial Images. IEEE Access 2018, 6, 35316–35326. [Google Scholar] [CrossRef]
- Liao, S.; An, J. A Robust Insulator Detection Algorithm Based on Local Features and Spatial Orders for Aerial Images. IEEE Geosci. Remote Sens. Lett. 2015, 12, 963–967. [Google Scholar] [CrossRef]
- Zhao, J.; Liu, X.; Sun, J.; Lei, L. Detecting insulators in the image of overhead transmission lines. In Intelligent Computing Technology, ICIC 2012, Lecture Notes in Computer Science; Huang, D.S., Jiang, C., Bevilacqua, V., Figueroa, J.C., Eds.; Springer: Berlin/Heidelberg, Germany, 2012; Volume 7389. [Google Scholar]
- Wang, X.; Zhang, Y. Insulator identification from aerial images using Support Vector Machine with background suppression. In Proceedings of the 2016 International Conference on Unmanned Aircraft Systems (ICUAS), Arlington, VA, USA, 1 June 2016; pp. 892–897. [Google Scholar] [CrossRef]
- Sadykova, D.; Pernebayeva, D.; Bagheri, M.; James, A. IN-YOLO: Real-Time Detection of Outdoor High Voltage Insulators Using UAV Imaging. IEEE Trans. Power Deliv. 2020, 35, 1599–1601. [Google Scholar] [CrossRef]
- Mao, T.; Huang, K.; Zeng, X.; Ren, L.; Wang, C.; Li, S.; Zhang, M.; Chen, Y. Development of Power Transmission Line Defects Diagnosis System for UAV Inspection based on Binocular Depth Imaging Technology. In Proceedings of the 2nd International Conference on Electrical Materials and Power Equipment (ICEMPE), Guangzhou, China, 7–10 April 2019; pp. 478–481. [Google Scholar] [CrossRef]
- Chen, C.; Wei, J.; Peng, C.; Zhang, W.; Qin, H. Improved Saliency Detection in RGB-D Images Using Two-Phase Depth Estimation and Selective Deep Fusion. IEEE Trans. Image Process. 2020, 29, 4296–4307. [Google Scholar] [CrossRef]
- Zhou, X.; Liu, X.; Jiang, A.; Yan, B.; Yang, C. Improving Video Segmentation by Fusing Depth Cues and the Visual Background Extractor (ViBe) Algorithm. Sensors 2017, 17, 1177. [Google Scholar] [CrossRef]
- Junfeng, L.; Min, L.; Qinruo, W. A Novel Insulator Detection Method for Aerial Images. In Proceedings of the 9th International Conference on Automation Engineering (ICCAE), Sydney, Australia, 18–21 February 2017. [Google Scholar]
- Zhai, Y.; Cheng, H.; Chen, R.; Yang, Q.; Li, X. Multi-Saliency Aggregation-Based Approach for Insulator Flashover Fault Detection Using Aerial Images. Energies 2018, 11, 340. [Google Scholar] [CrossRef]
- Hu, J.; Zhi, X.; Zhang, W.; Ren, L.; Bruzzone, L. Salient Ship Detection via Background Prior and Foreground Constraint in Remote Sensing Images. Remote Sens. 2020, 12, 3370. [Google Scholar] [CrossRef]
- Di, L.; Long, H.; Liang, J. Fabric Defect Detection Based on Illumination Correction and Visual Salient Features. Sensors 2020, 20, 5147. [Google Scholar] [CrossRef] [PubMed]
- Nie, T.; Han, X.; He, B.; Li, X.; Liu, H.; Bi, G. Ship Detection in Panchromatic Optical Remote Sensing Images Based on Visual Saliency and Multi-Dimensional Feature Description. Remote Sens. 2020, 12, 152. [Google Scholar] [CrossRef]
- Gong, D.; He, Z.; Ye, X.; Fang, Z. Visual Saliency Detection for Over-Temperature Regions in 3D Space via Dual-Source Images. Sensors 2020, 20, 3414. [Google Scholar] [CrossRef]
- Github. LabelImg. Available online: https://github.com/tzutalin/labelImg (accessed on 10 December 2019).
- Tao, X.; Zhang, D.; Wang, Z.; Liu, X.; Zhang, H.; Xu, D. Detection of Power Line Insulator Defects Using Aerial Images Analyzed with Convolutional Neural Networks. IEEE Trans. Syst. Man. Cybern. Syst. 2020, 50, 1486–1498. [Google Scholar] [CrossRef]
- Chen, Y.; Zhou, W. Hybrid-Attention Network for RGB-D Salient Object Detection. Appl. Sci. 2020, 10, 5806. [Google Scholar] [CrossRef]
- Arbeláez, P.; Maire, M.; Fowlkes, C.; Malik, J. Contour Detection and Hierarchical Image Segmentation. IEEE Trans. Pattern Anal. Mach. Intell. 2011, 33, 898–916. [Google Scholar] [CrossRef]
- Bay, H.; Ess, A.; Tuytelaars, T.; Van Gool, L. Speeded-up robust features (SURF). Comput. Vis. Image Underst. 2008, 110, 346–359. [Google Scholar] [CrossRef]
- Achanta, R.; Shaji, A.; Smith, K.; Lucchi, A.; Fua, P.; Süsstrunk, S. Slic superpixels compared to state-of-the-art superpixel methods. IEEE Trans. Pattern Anal. Mach. Intell. 2012, 34, 2274–2282. [Google Scholar] [CrossRef]
- Chen, J.; Shan, S.; He, C.; Zhao, G.; Pietikäinen, M.; Chen, X.; Gao, W. WLD: A Robust Local Image Descriptor. IEEE Trans. Pattern Anal. Mach. Intell. 2010, 32, 1705–1720. [Google Scholar] [CrossRef]
- Rubner, Y.; Tomasi, C.; Guibas, L.J. The Earth Mover’s Distance as a Metric for Image Retrieval. Int. J. Comput. Vis. 2000, 40, 99–121. [Google Scholar] [CrossRef]
- Duda, R.O.; Hart, P.E. Use of the Hough transformation to detect lines and curves in pictures. Commun. ACM 1972, 15, 11–15. [Google Scholar] [CrossRef]
- Zhang, Z. A flexible new technique for camera calibration. IEEE Trans. Pattern Anal. Mach. Intell. 2000, 22, 1330–1334. [Google Scholar] [CrossRef]
- Zhai, Y.; Wang, D.; Zhang, M.; Wang, J.; Guo, F. Fault detection of insulator based on saliency and adaptive morphology. Multimedia Tools Appl. 2017, 76, 12051–12064. [Google Scholar] [CrossRef]
- Zhao, Z.; Zhen, Z.; Zhang, L.; Qi, Y.; Kong, Y.; Zhang, K. Insulator Detection Method in Inspection Image Based on Improved Faster R-CNN. Energies 2019, 12, 1204. [Google Scholar] [CrossRef]
- Wang, L.; Chen, Z.; Hua, D.; Zheng, Z. Semantic Segmentation of Transmission Lines and Their Accessories Based on UAV-Taken Images. IEEE Access 2019, 7, 80829–80839. [Google Scholar] [CrossRef]
- Zhao, Z.; Qi, H.; Qi, Y.; Zhang, K.; Zhai, Y.; Zhao, W. Detection Method Based on Automatic Visual Shape Clustering for Pin-Missing Defect in Transmission Lines. IEEE Trans. Instrum. Meas. 2020, 69, 6080–6091. [Google Scholar] [CrossRef]


| Inspection Routes | Length | Typical Background | Number of Towers | Number of Images |
|---|---|---|---|---|
| Route 1 | 1.2 km | Vegetation | 5 | 120 pairs |
| Route 2 | 1 km | Rivers/lakes | 3 | 80 pairs |
| Route 3 | 1.8 km | Buildings | 8 | 200 pairs |
| Hardware Device | Model | Specification |
|---|---|---|
| Unmanned aerial vehicle (UAV) | DJI M600pro | Flight time: 60 min with no-load Maximum horizontal velocity: 18 m/s Maximum altitude of flight: 2500 m maximum Load capacity: 6 kg |
| Visual sensor | DAHENG MER-502-79U3C | Resolution: 2448 × 2048 pixels Frame rate: 79 FPS Focal length: 25 mm Weight: 57 g |
| Embedded industrial computer | AICSHTER ARK-1100 | Weight: 2.0 kg Operating system: Windows 10 |
| Processor | Intel Celeron J1900 | Processor base frequency: 2.00 GHz Max memory size: 8 GB Thermal design power: 10 W |
| Portable display screen | Asus MB16AP | Resolution: 1920 × 1080 pixels Panel: ISP HD panel |
| Algorithm | Image Background | Average Time Consumption/s | Detection Success Rate |
|---|---|---|---|
| Algorithm in [14] | Simple background | 2.821 | 84.7% |
| Complex background | 2.944 | 63.5% | |
| Algorithm in [40] | Simple background | 0.455 | 87.2% |
| Complex background | 0.457 | 82.2% | |
| Algorithm in [16] | Simple background | 0.531 | 90.4% |
| Complex background | 0.531 | 71.6% | |
| Our algorithm | Simple background | 0.615 | 92.8% |
| Complex background | 0.615 | 91.9% |
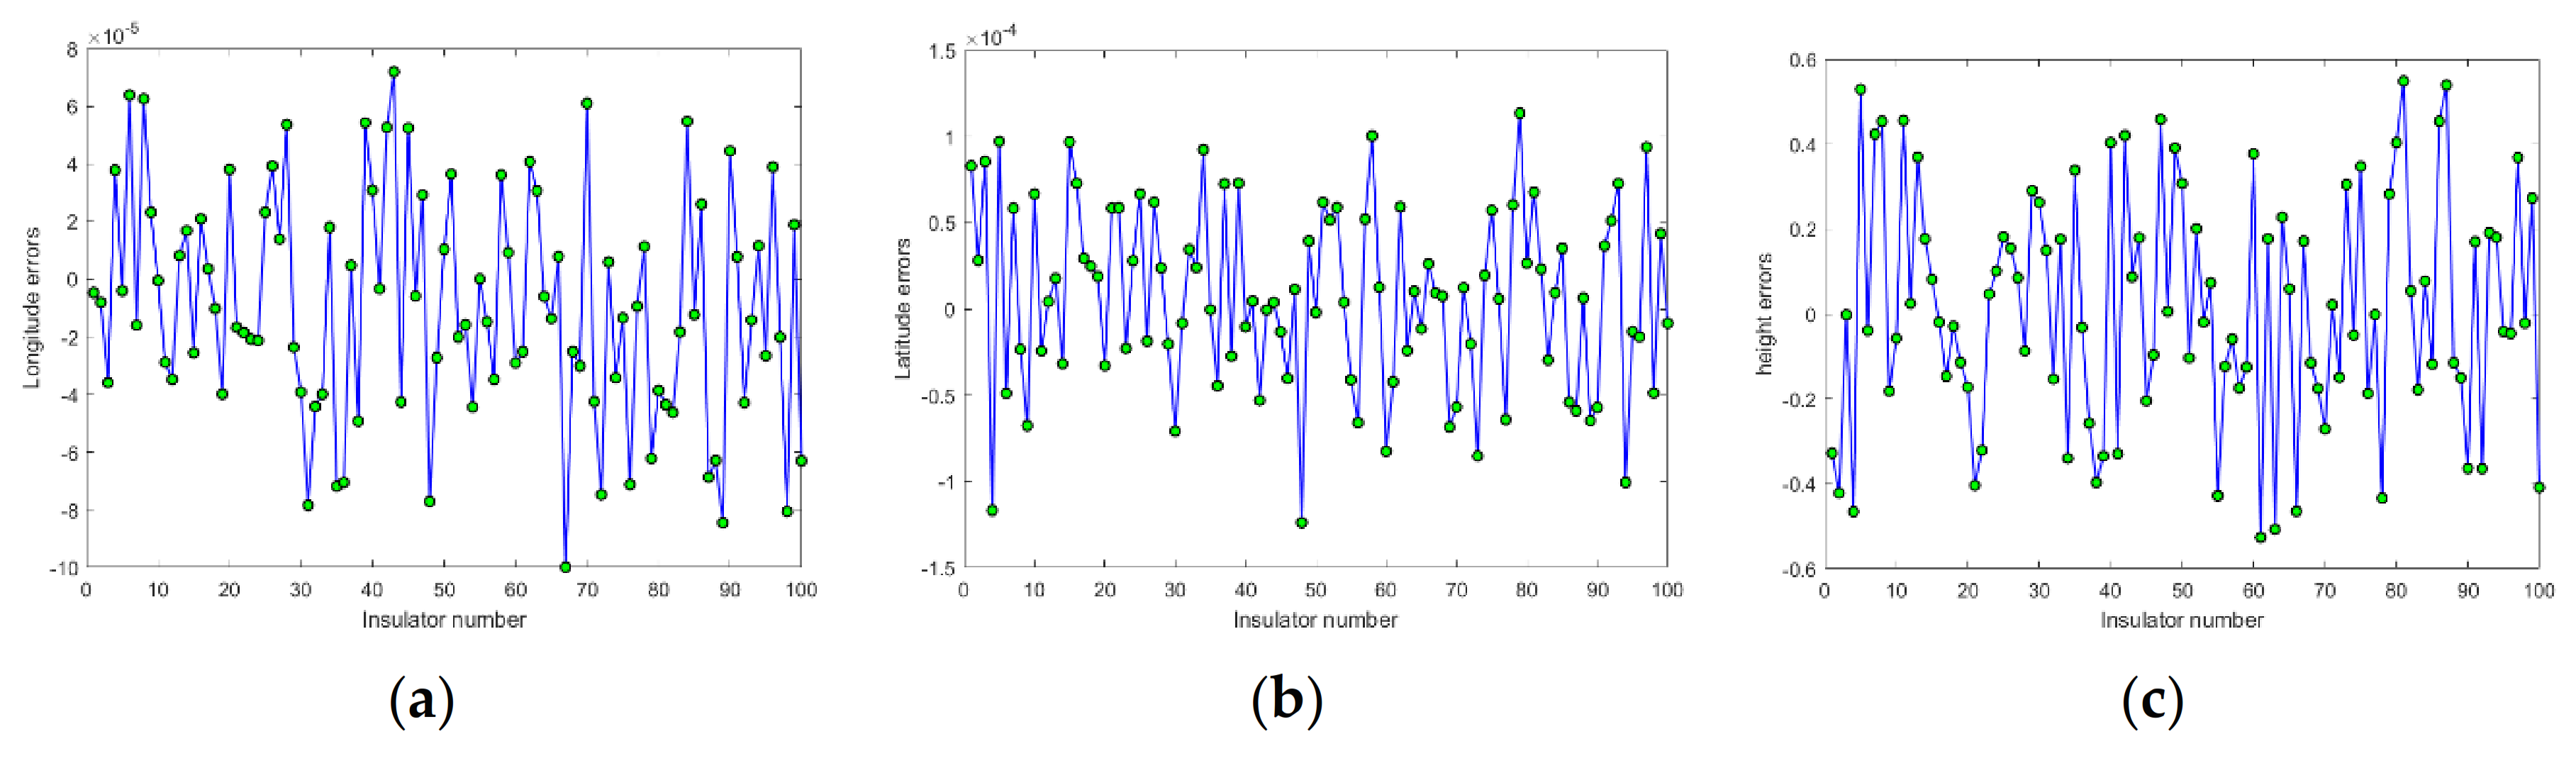
| Error Types | Mean | Standard Deviation |
|---|---|---|
| Longitude error | ||
| Latitude error | ||
| Altitude error | 0.025 | 0.2919 |
Publisher’s Note: MDPI stays neutral with regard to jurisdictional claims in published maps and institutional affiliations. |
© 2021 by the authors. Licensee MDPI, Basel, Switzerland. This article is an open access article distributed under the terms and conditions of the Creative Commons Attribution (CC BY) license (http://creativecommons.org/licenses/by/4.0/).
Share and Cite
Ma, Y.; Li, Q.; Chu, L.; Zhou, Y.; Xu, C. Real-Time Detection and Spatial Localization of Insulators for UAV Inspection Based on Binocular Stereo Vision. Remote Sens. 2021, 13, 230. https://doi.org/10.3390/rs13020230
Ma Y, Li Q, Chu L, Zhou Y, Xu C. Real-Time Detection and Spatial Localization of Insulators for UAV Inspection Based on Binocular Stereo Vision. Remote Sensing. 2021; 13(2):230. https://doi.org/10.3390/rs13020230
Chicago/Turabian StyleMa, Yunpeng, Qingwu Li, Lulu Chu, Yaqin Zhou, and Chang Xu. 2021. "Real-Time Detection and Spatial Localization of Insulators for UAV Inspection Based on Binocular Stereo Vision" Remote Sensing 13, no. 2: 230. https://doi.org/10.3390/rs13020230
APA StyleMa, Y., Li, Q., Chu, L., Zhou, Y., & Xu, C. (2021). Real-Time Detection and Spatial Localization of Insulators for UAV Inspection Based on Binocular Stereo Vision. Remote Sensing, 13(2), 230. https://doi.org/10.3390/rs13020230