Geomorphological and Climatic Drivers of Thermokarst Lake Area Increase Trend (1999–2018) in the Kolyma Lowland Yedoma Region, North-Eastern Siberia

 , , , and
Abstract
1. Introduction
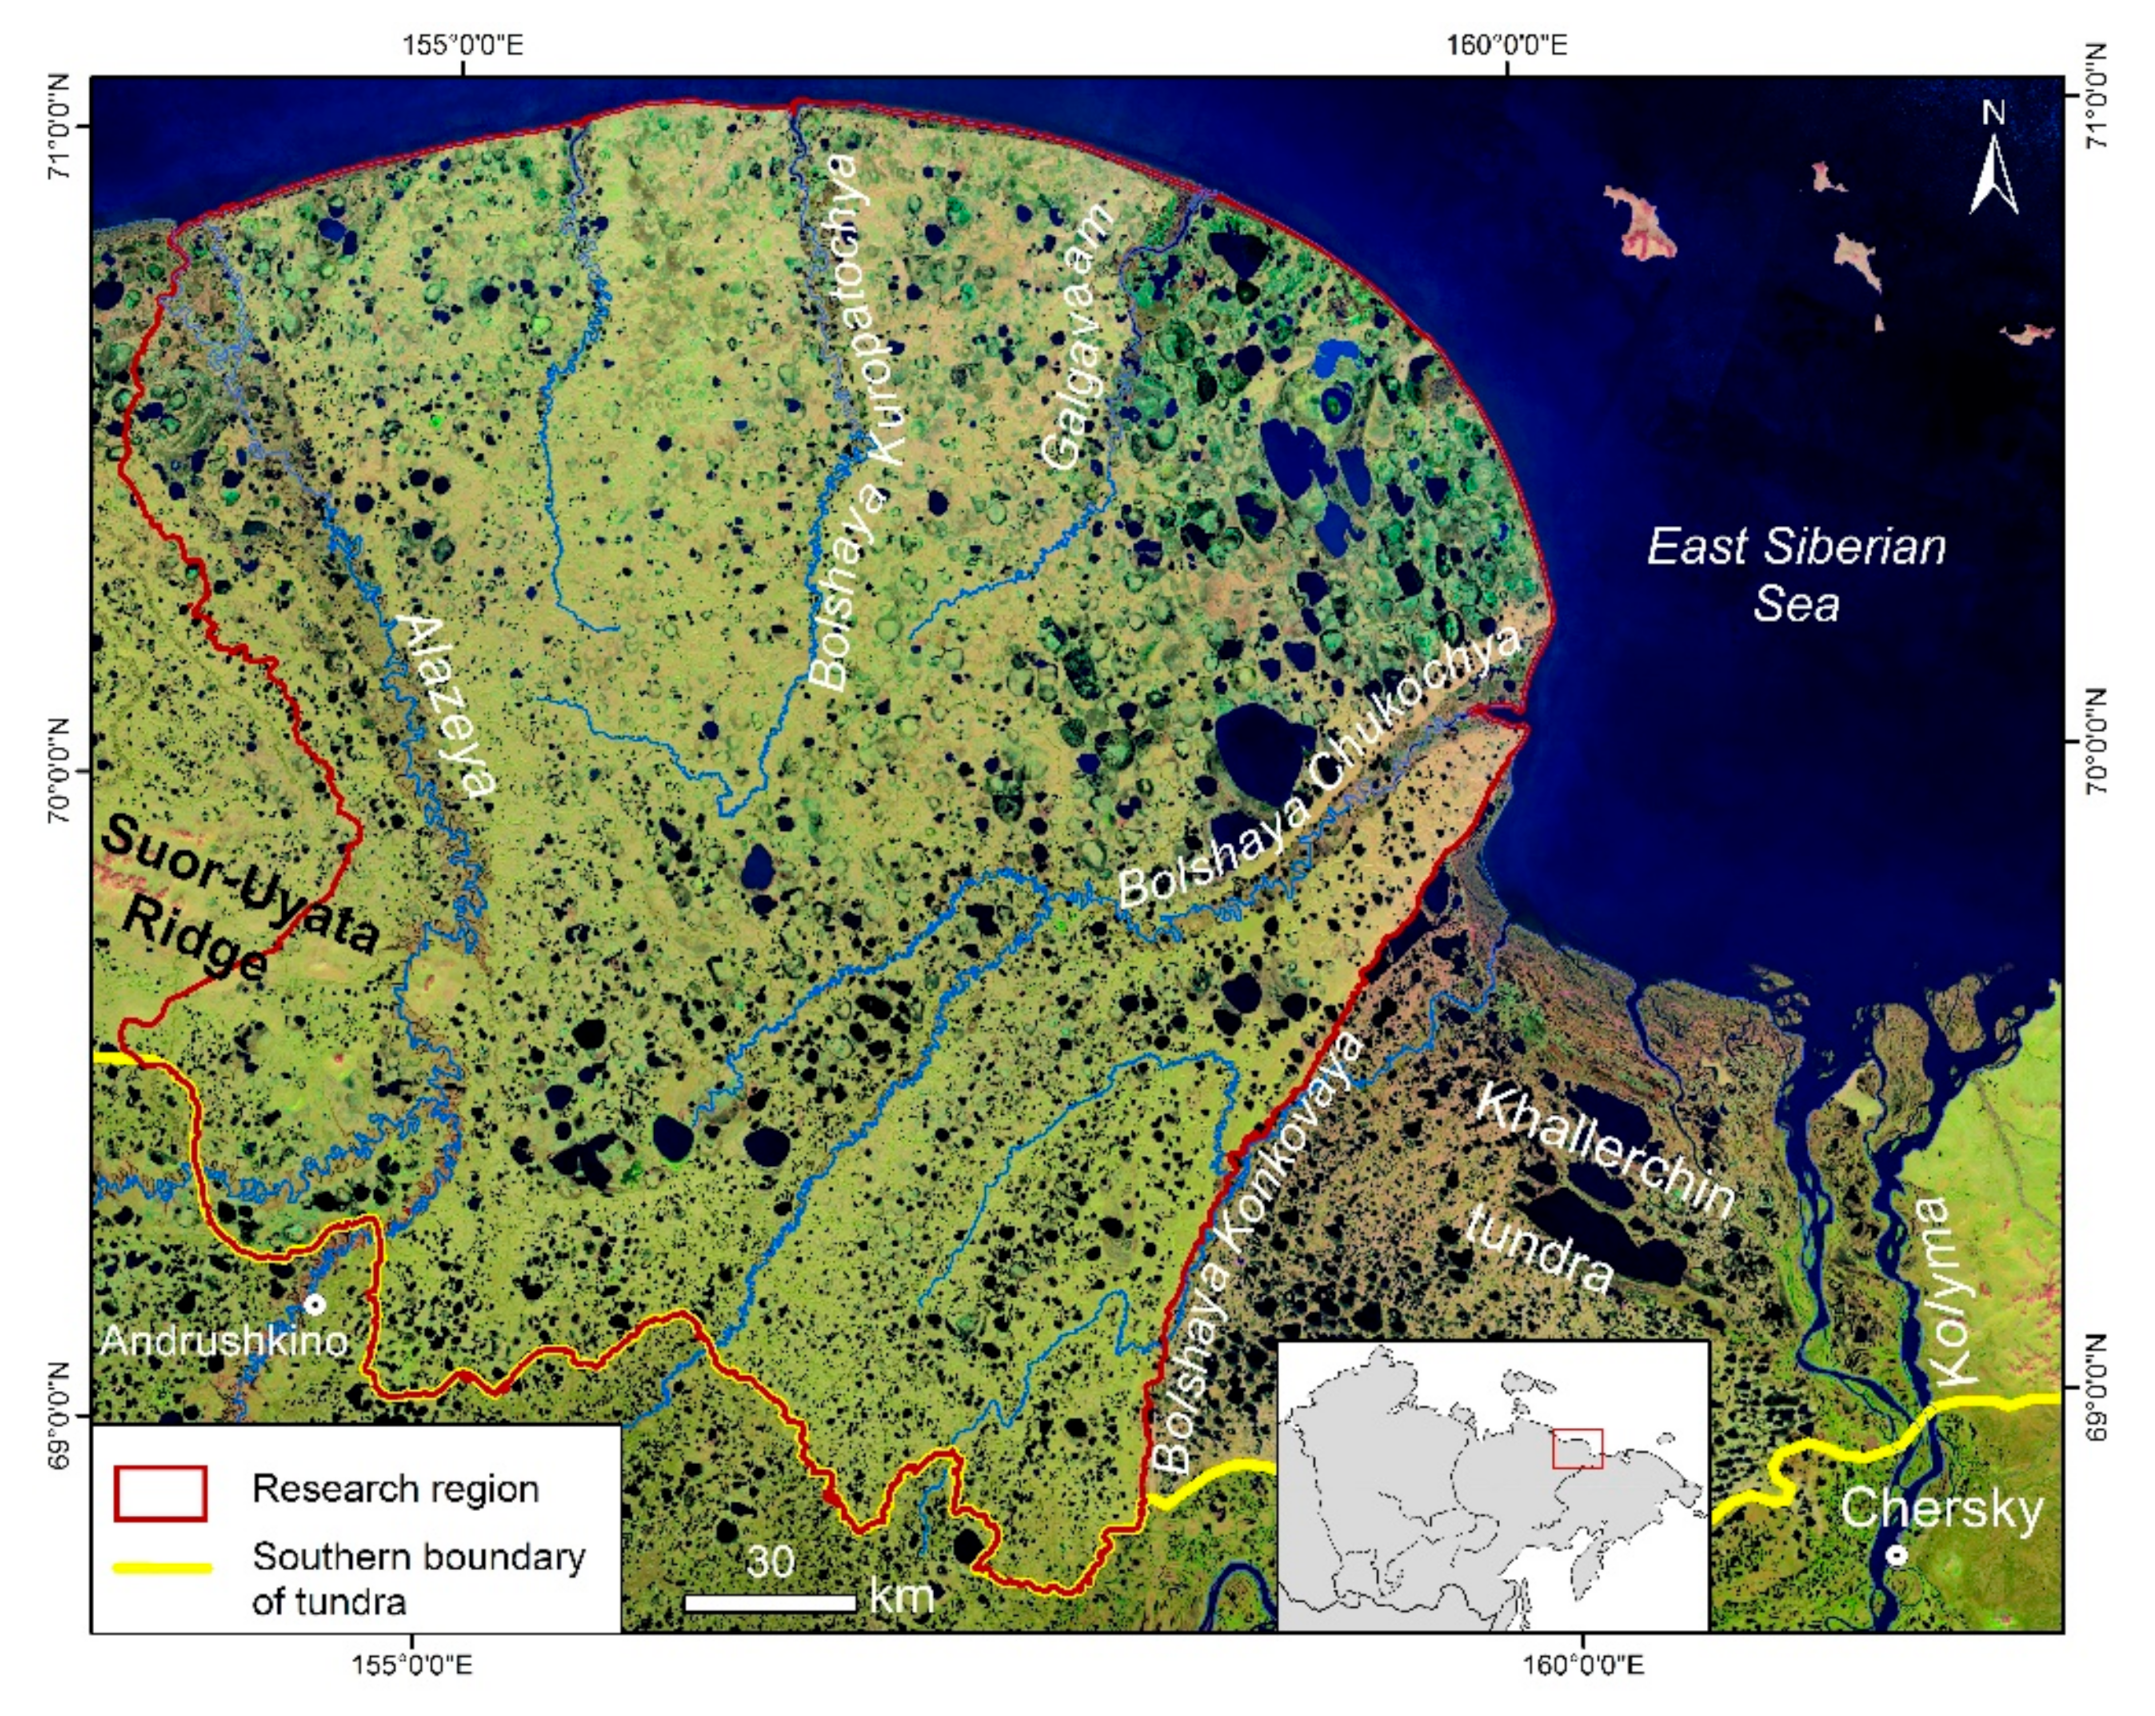
2. Study Region
3. Materials and Methods
3.1. Geomorphological Analysis
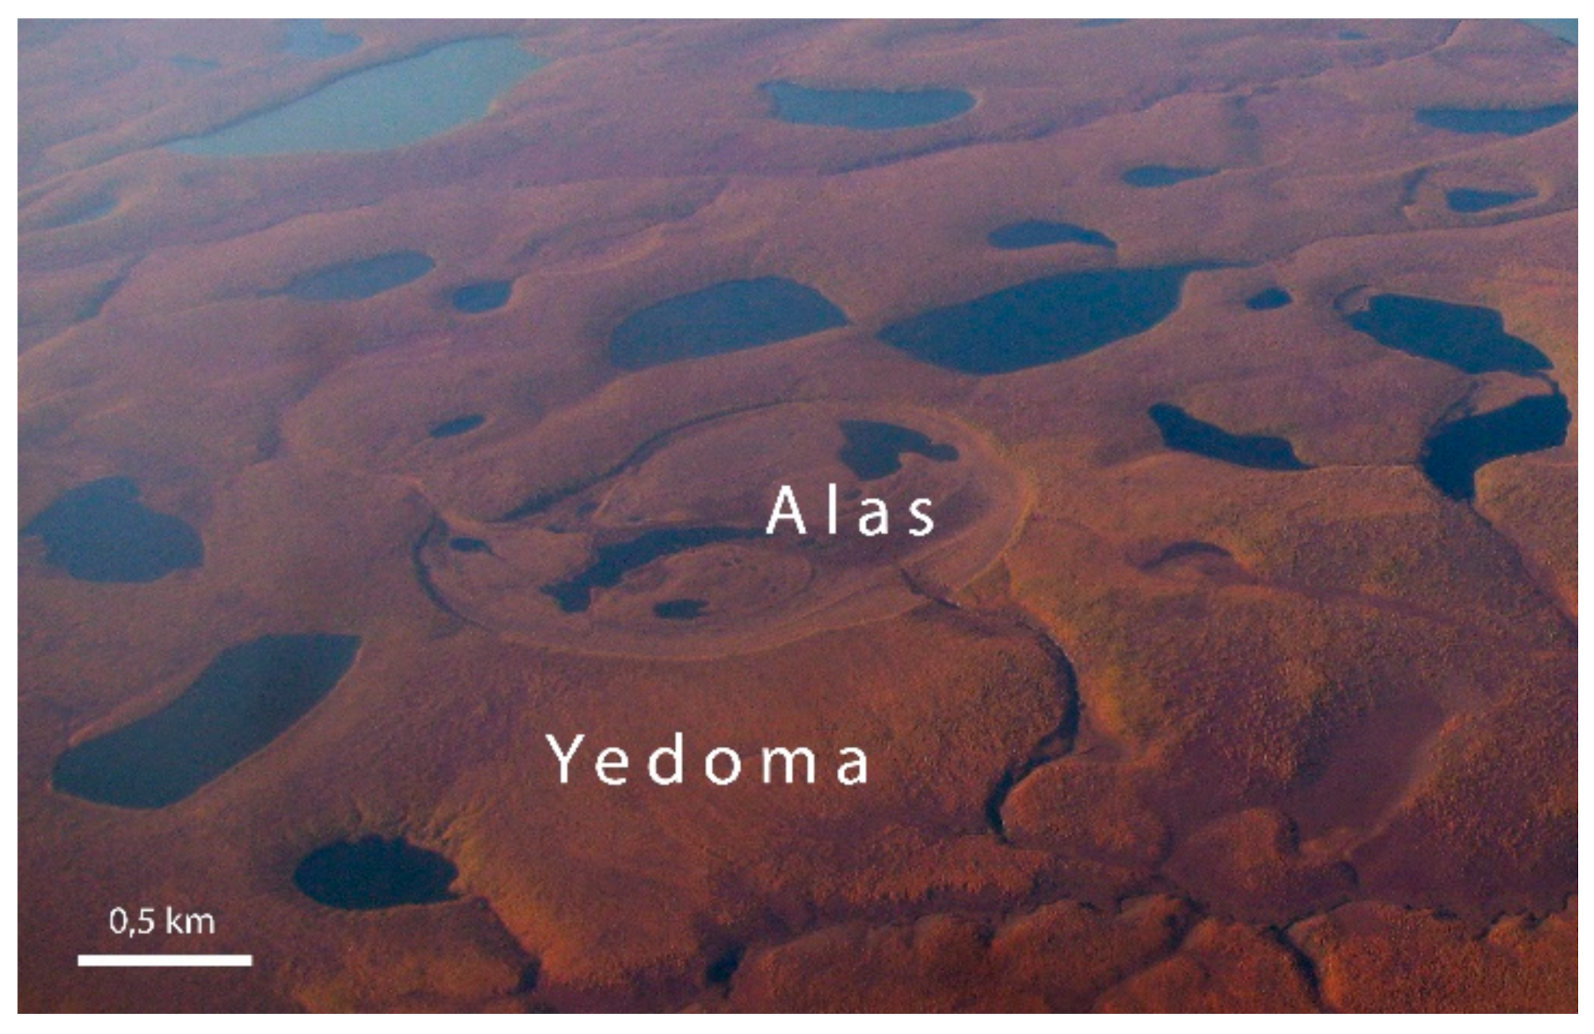
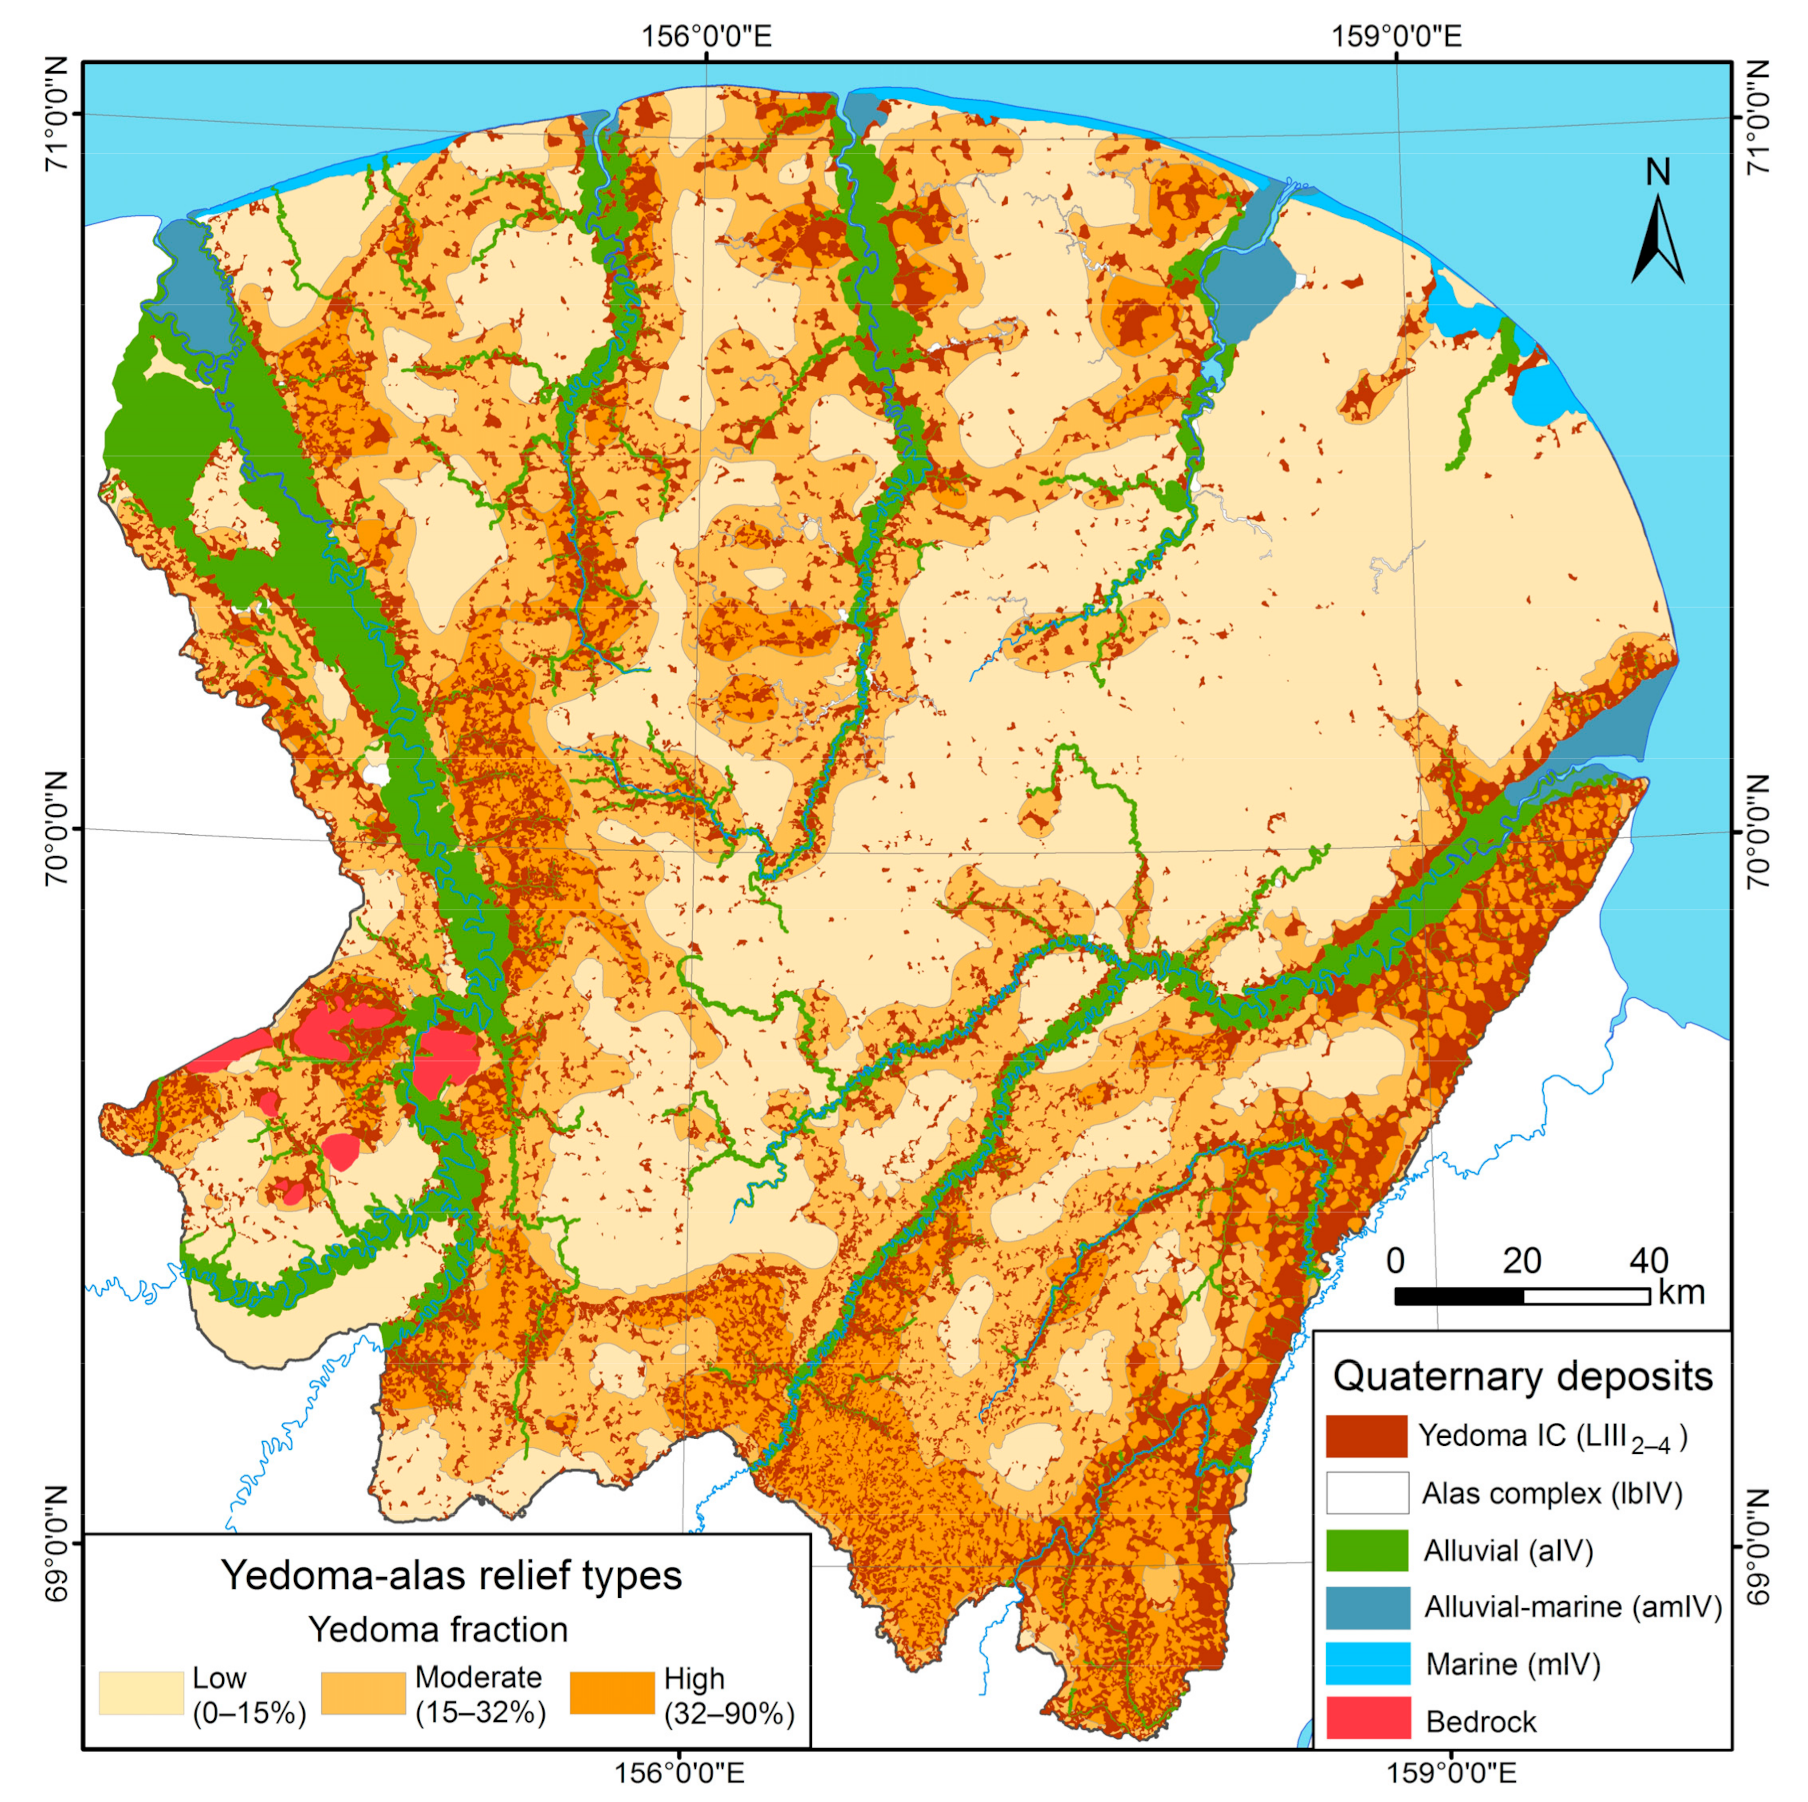
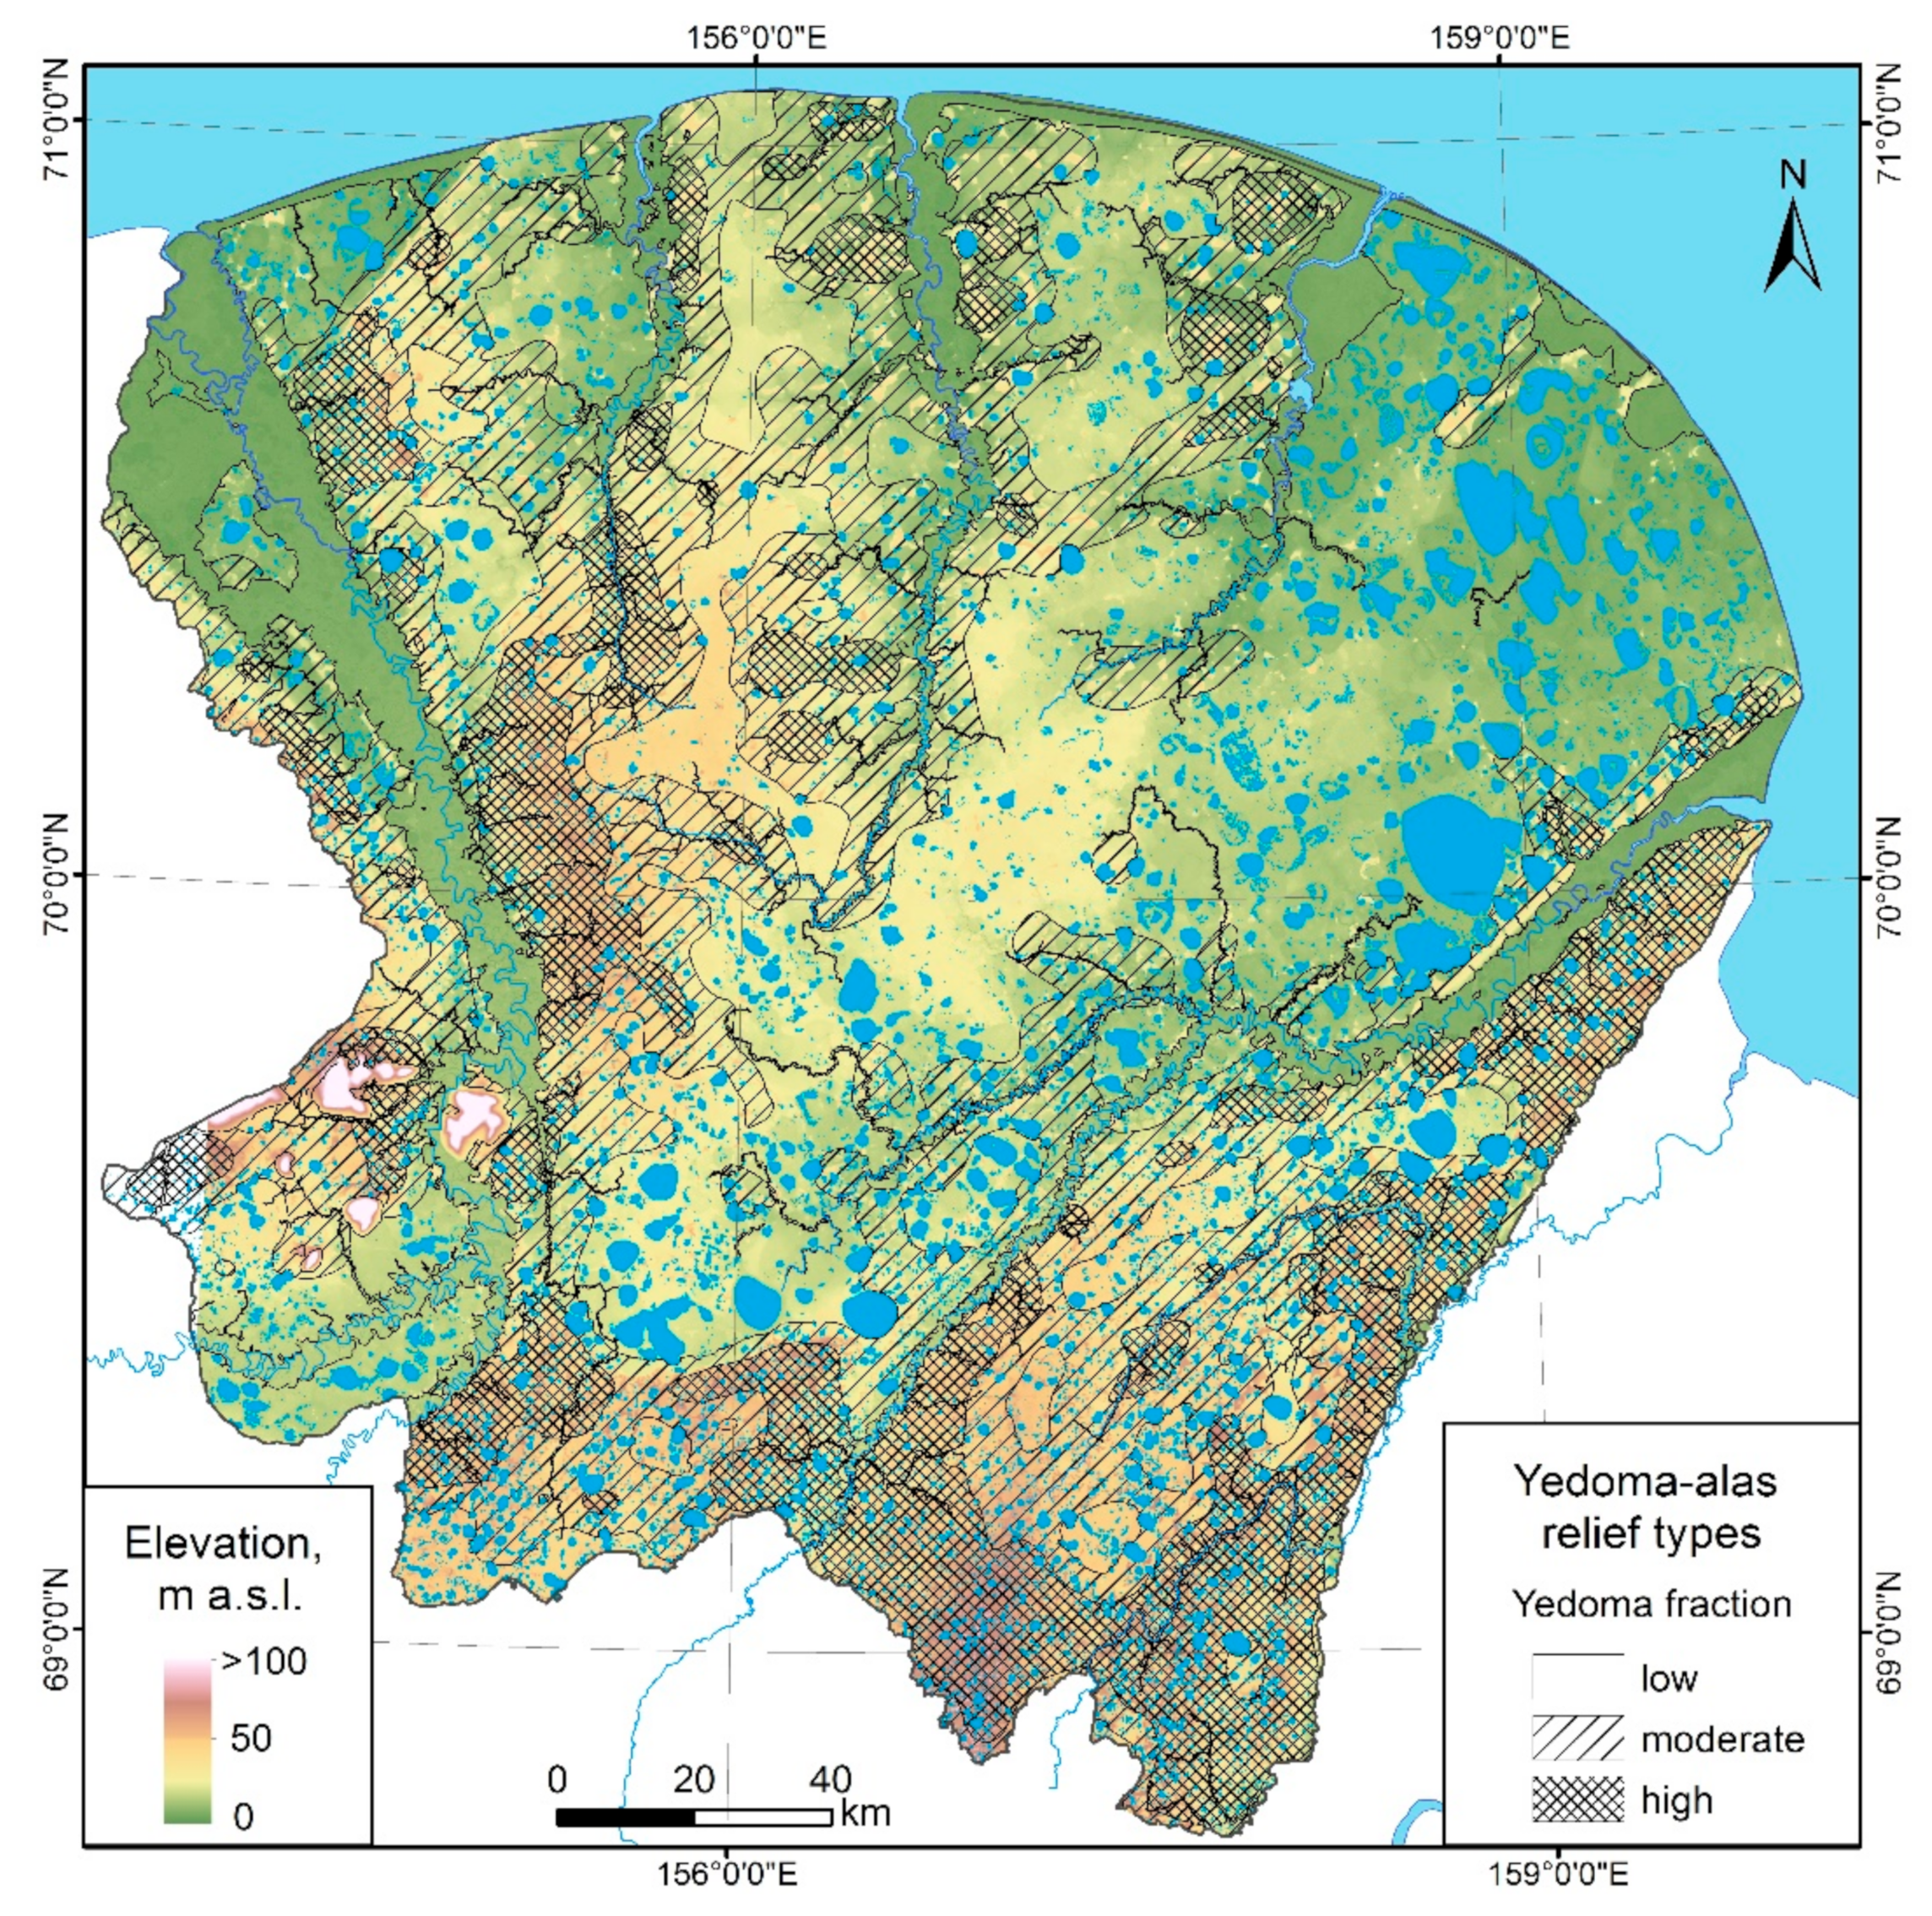
3.1.1. Yedoma–Alas Relief Types
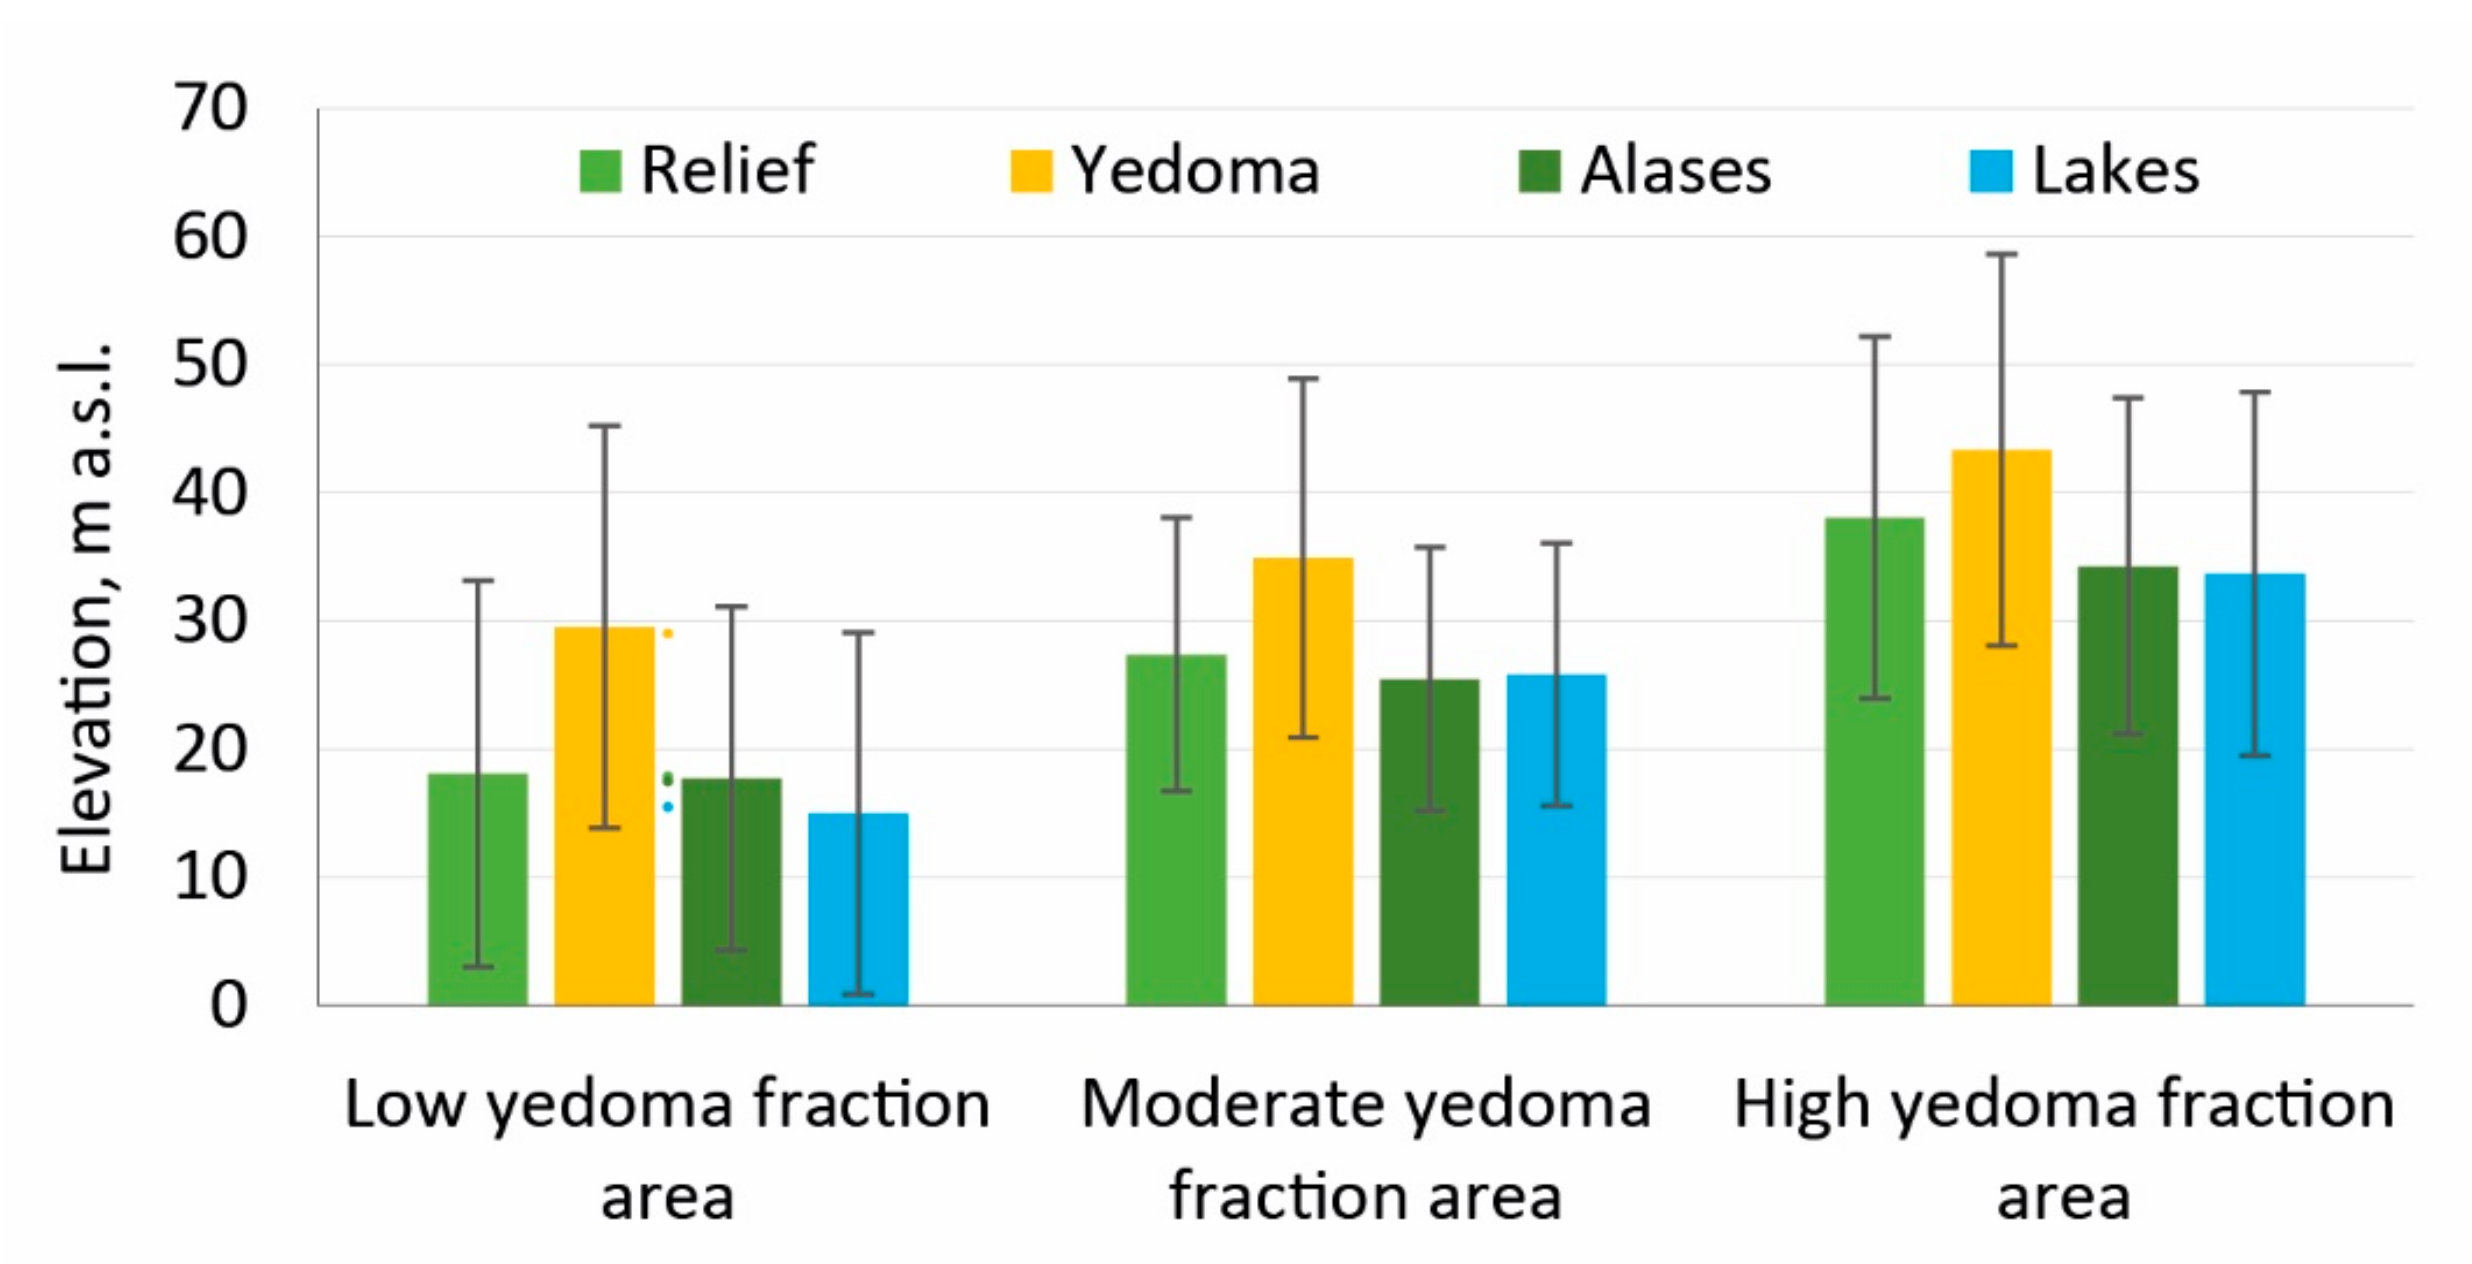
3.1.2. Elevation Analysis Using TanDEM-X DEM Data
3.1.3. Thermokarst Lake Distribution
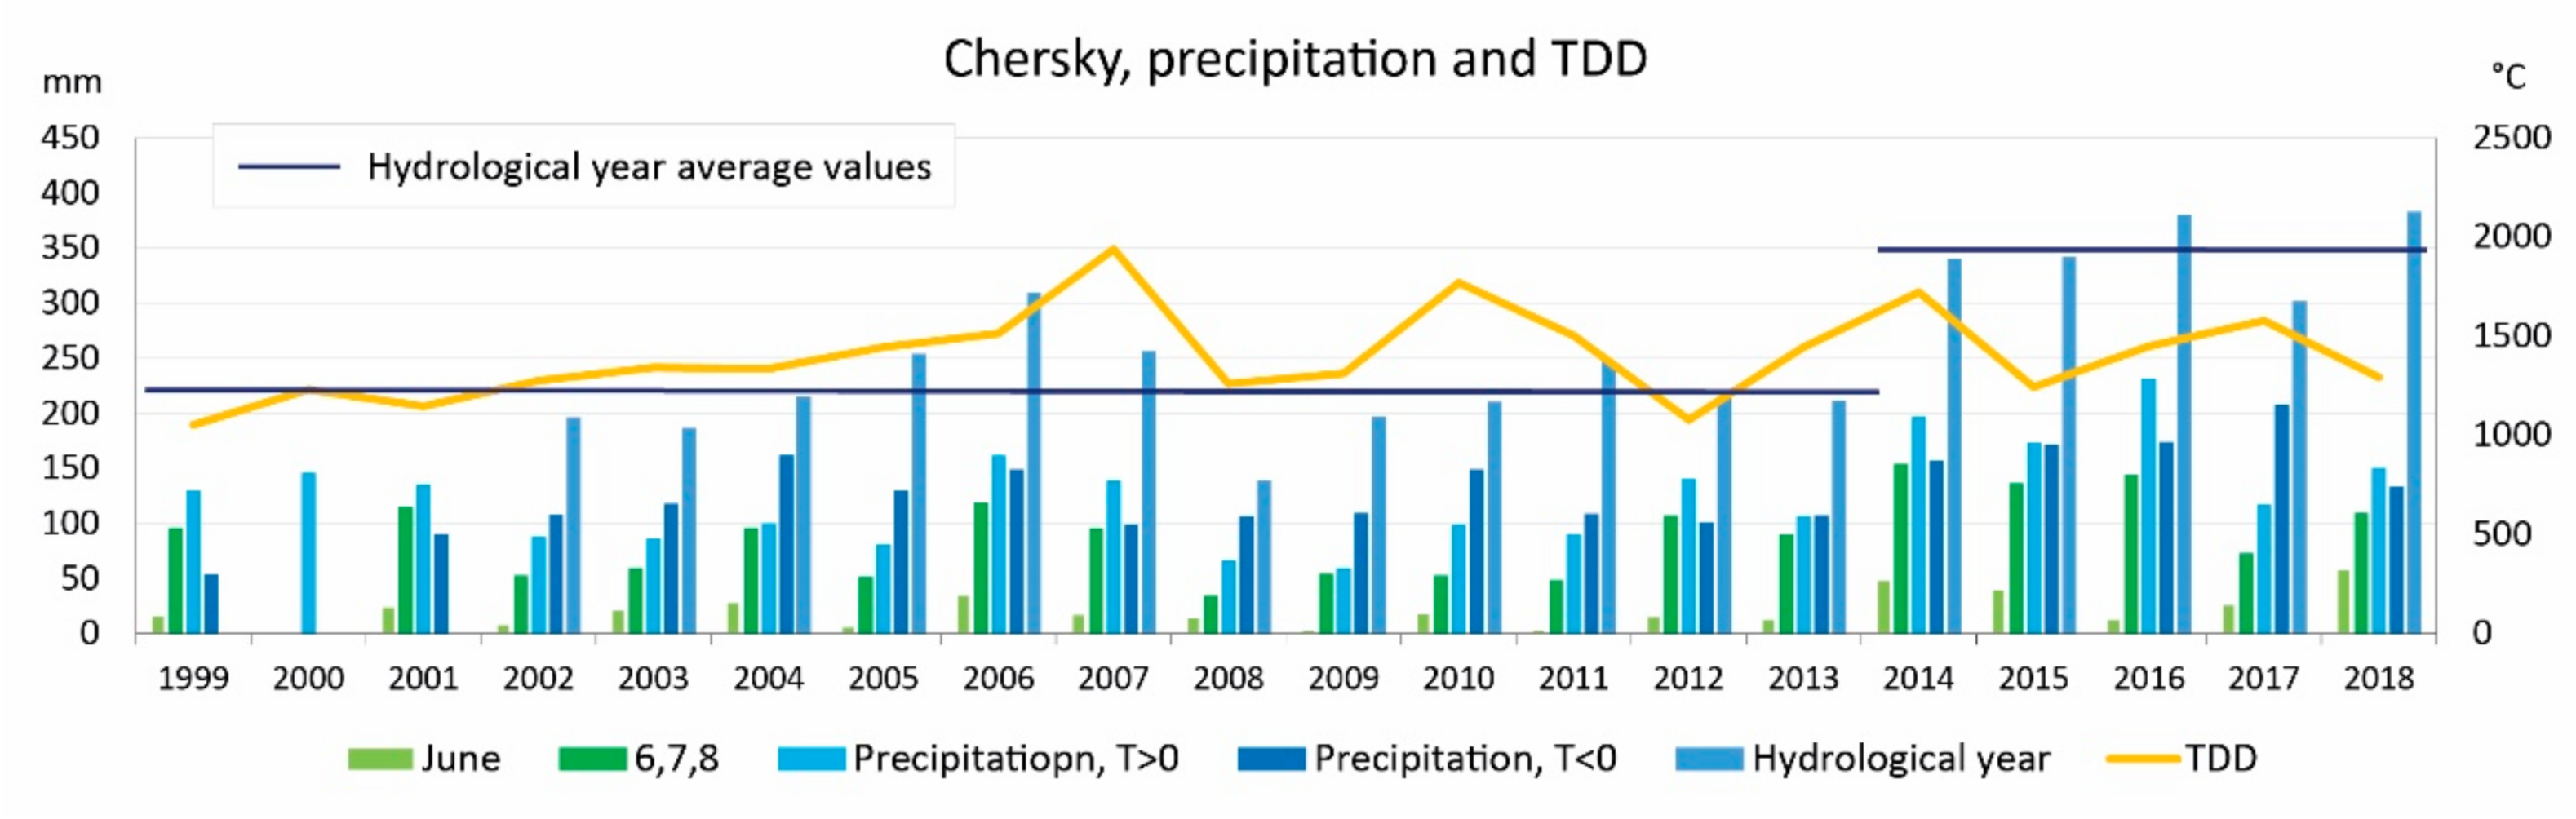
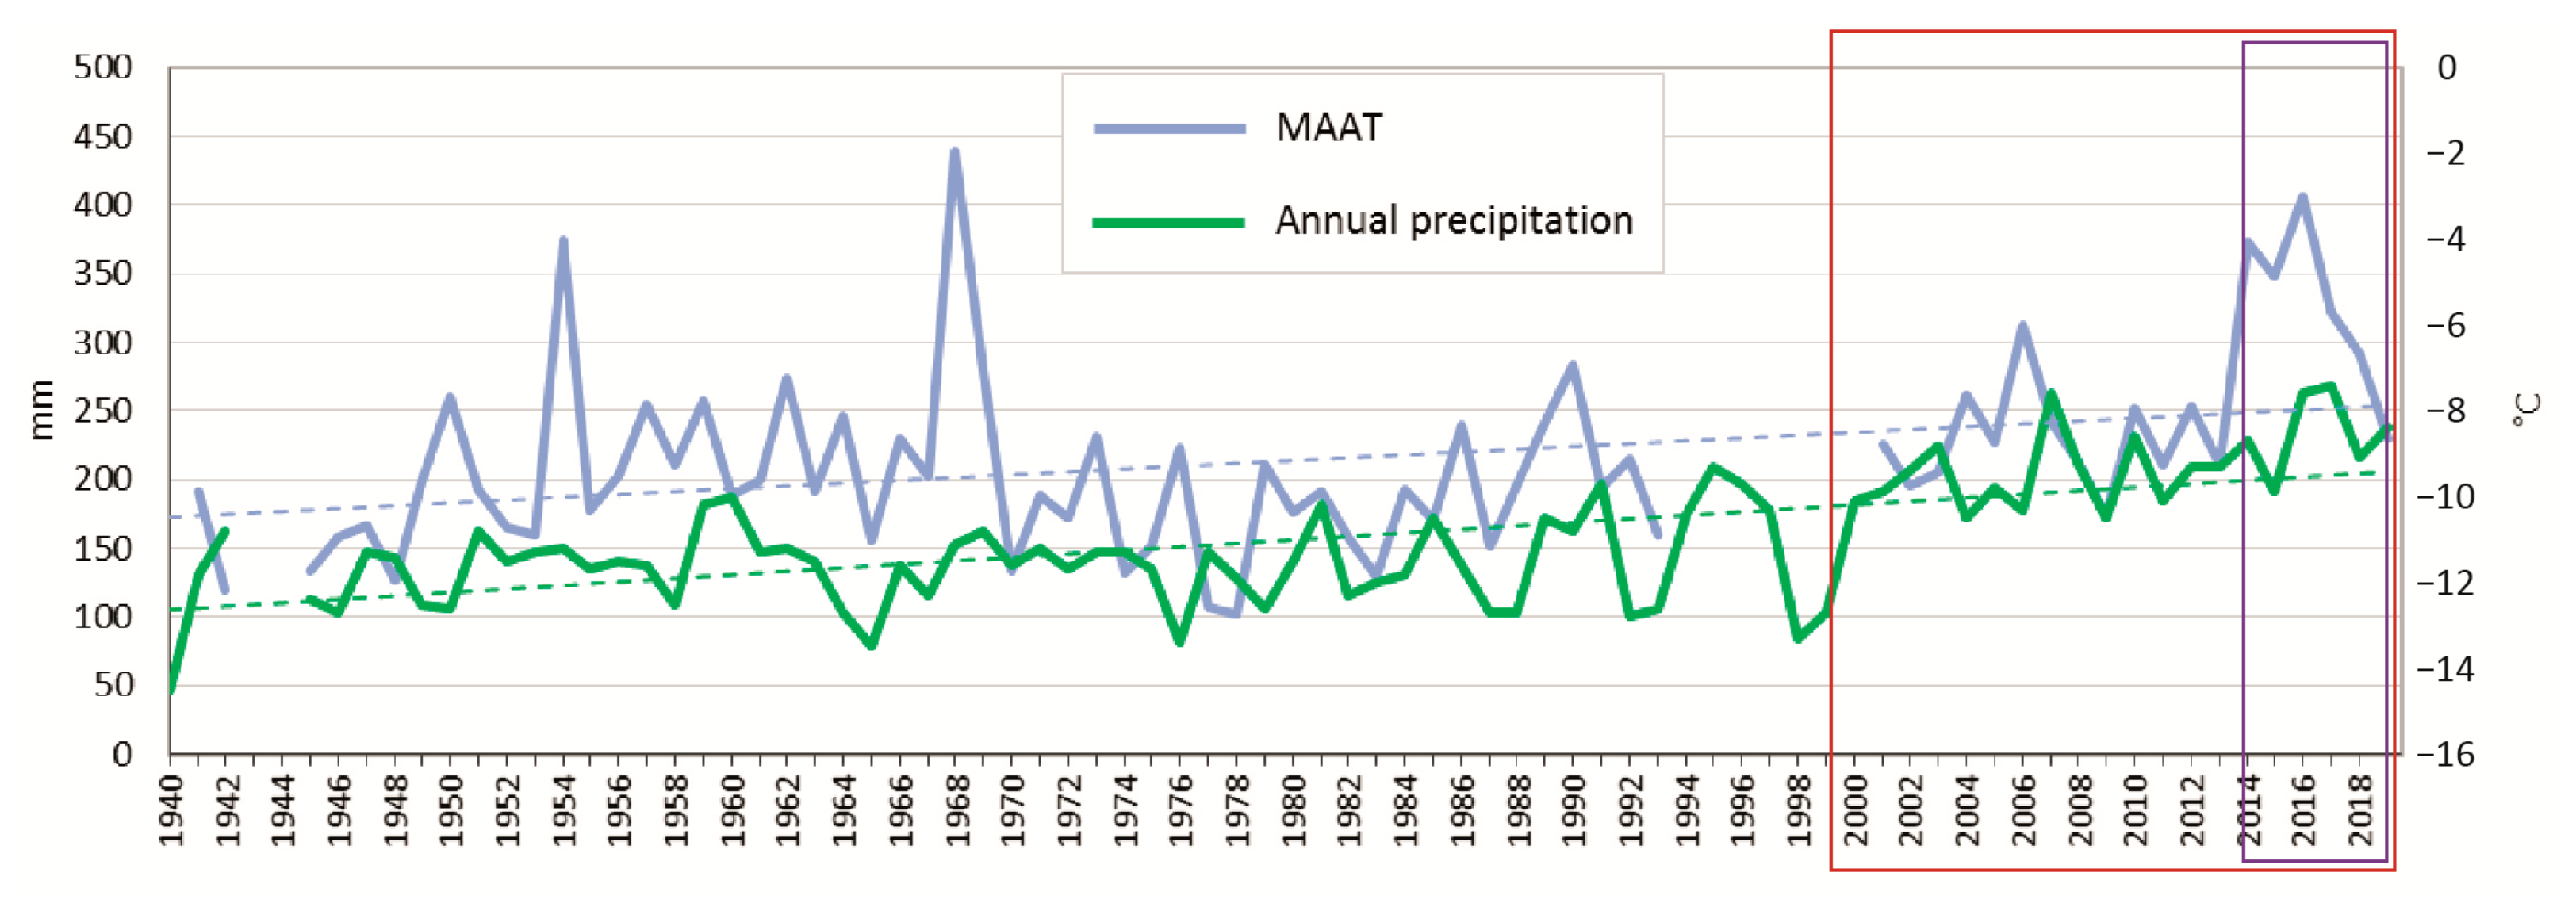
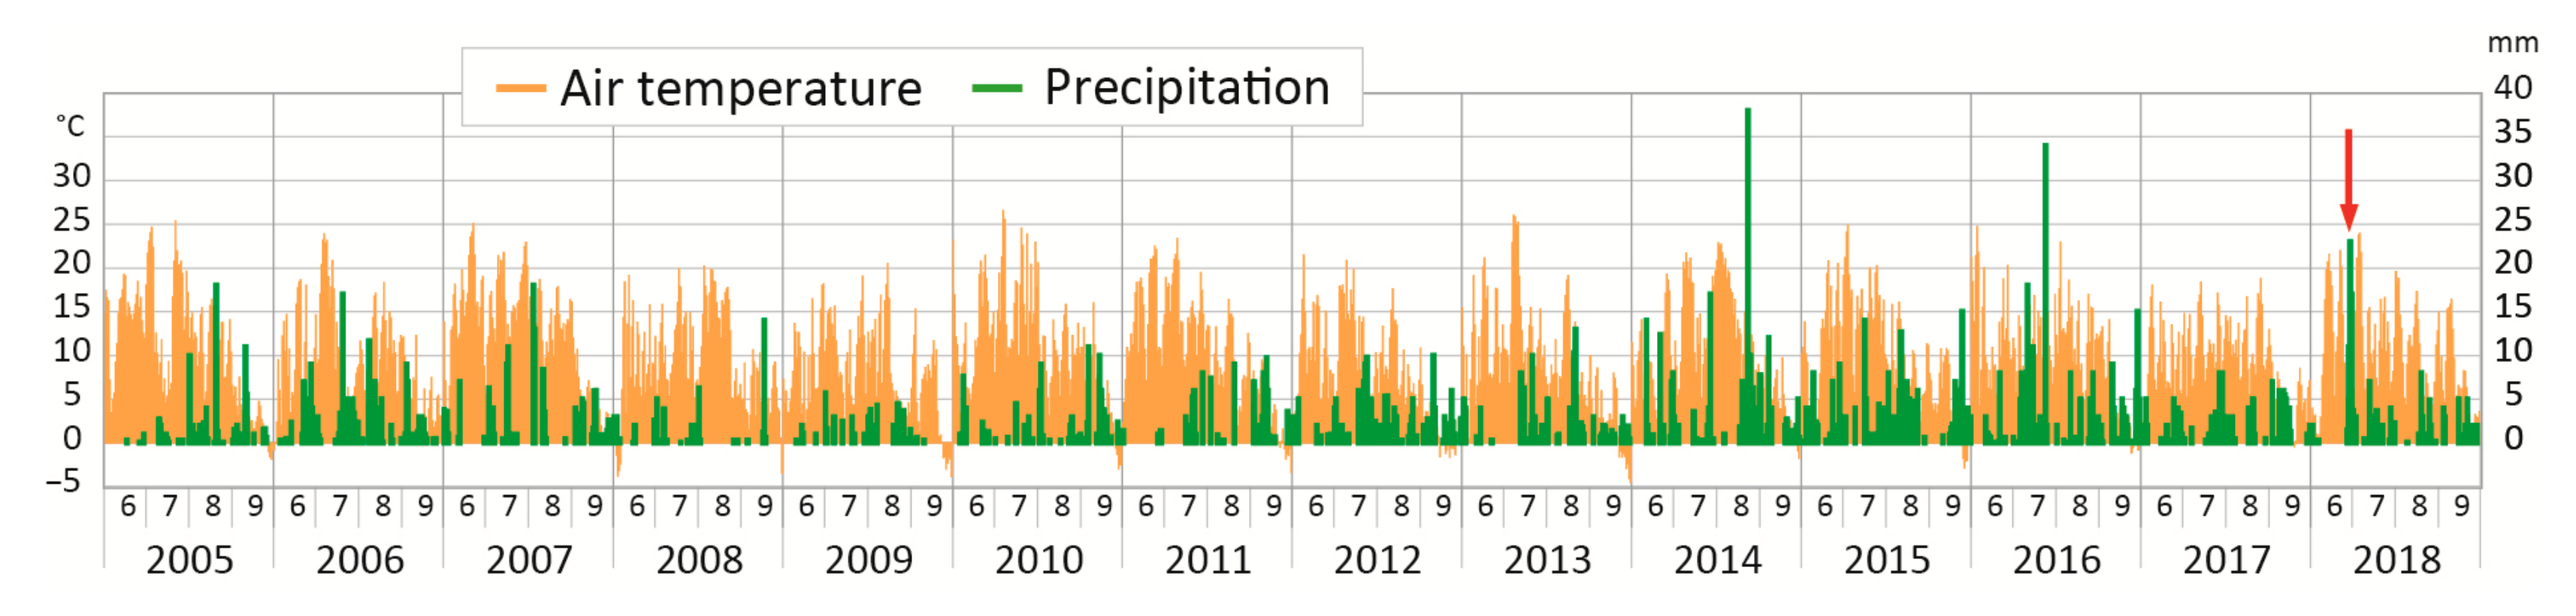
3.2. Defining Time Frames Based on Hydrometeorological Data
3.3. Thermokarst Lake Area Changes for the 1999–2013 and 1999–2018 Periods
3.3.1. Data and Change Detection Analysis
3.3.2. Thermokarst Lake Trend Analysis and Area Change Calculation
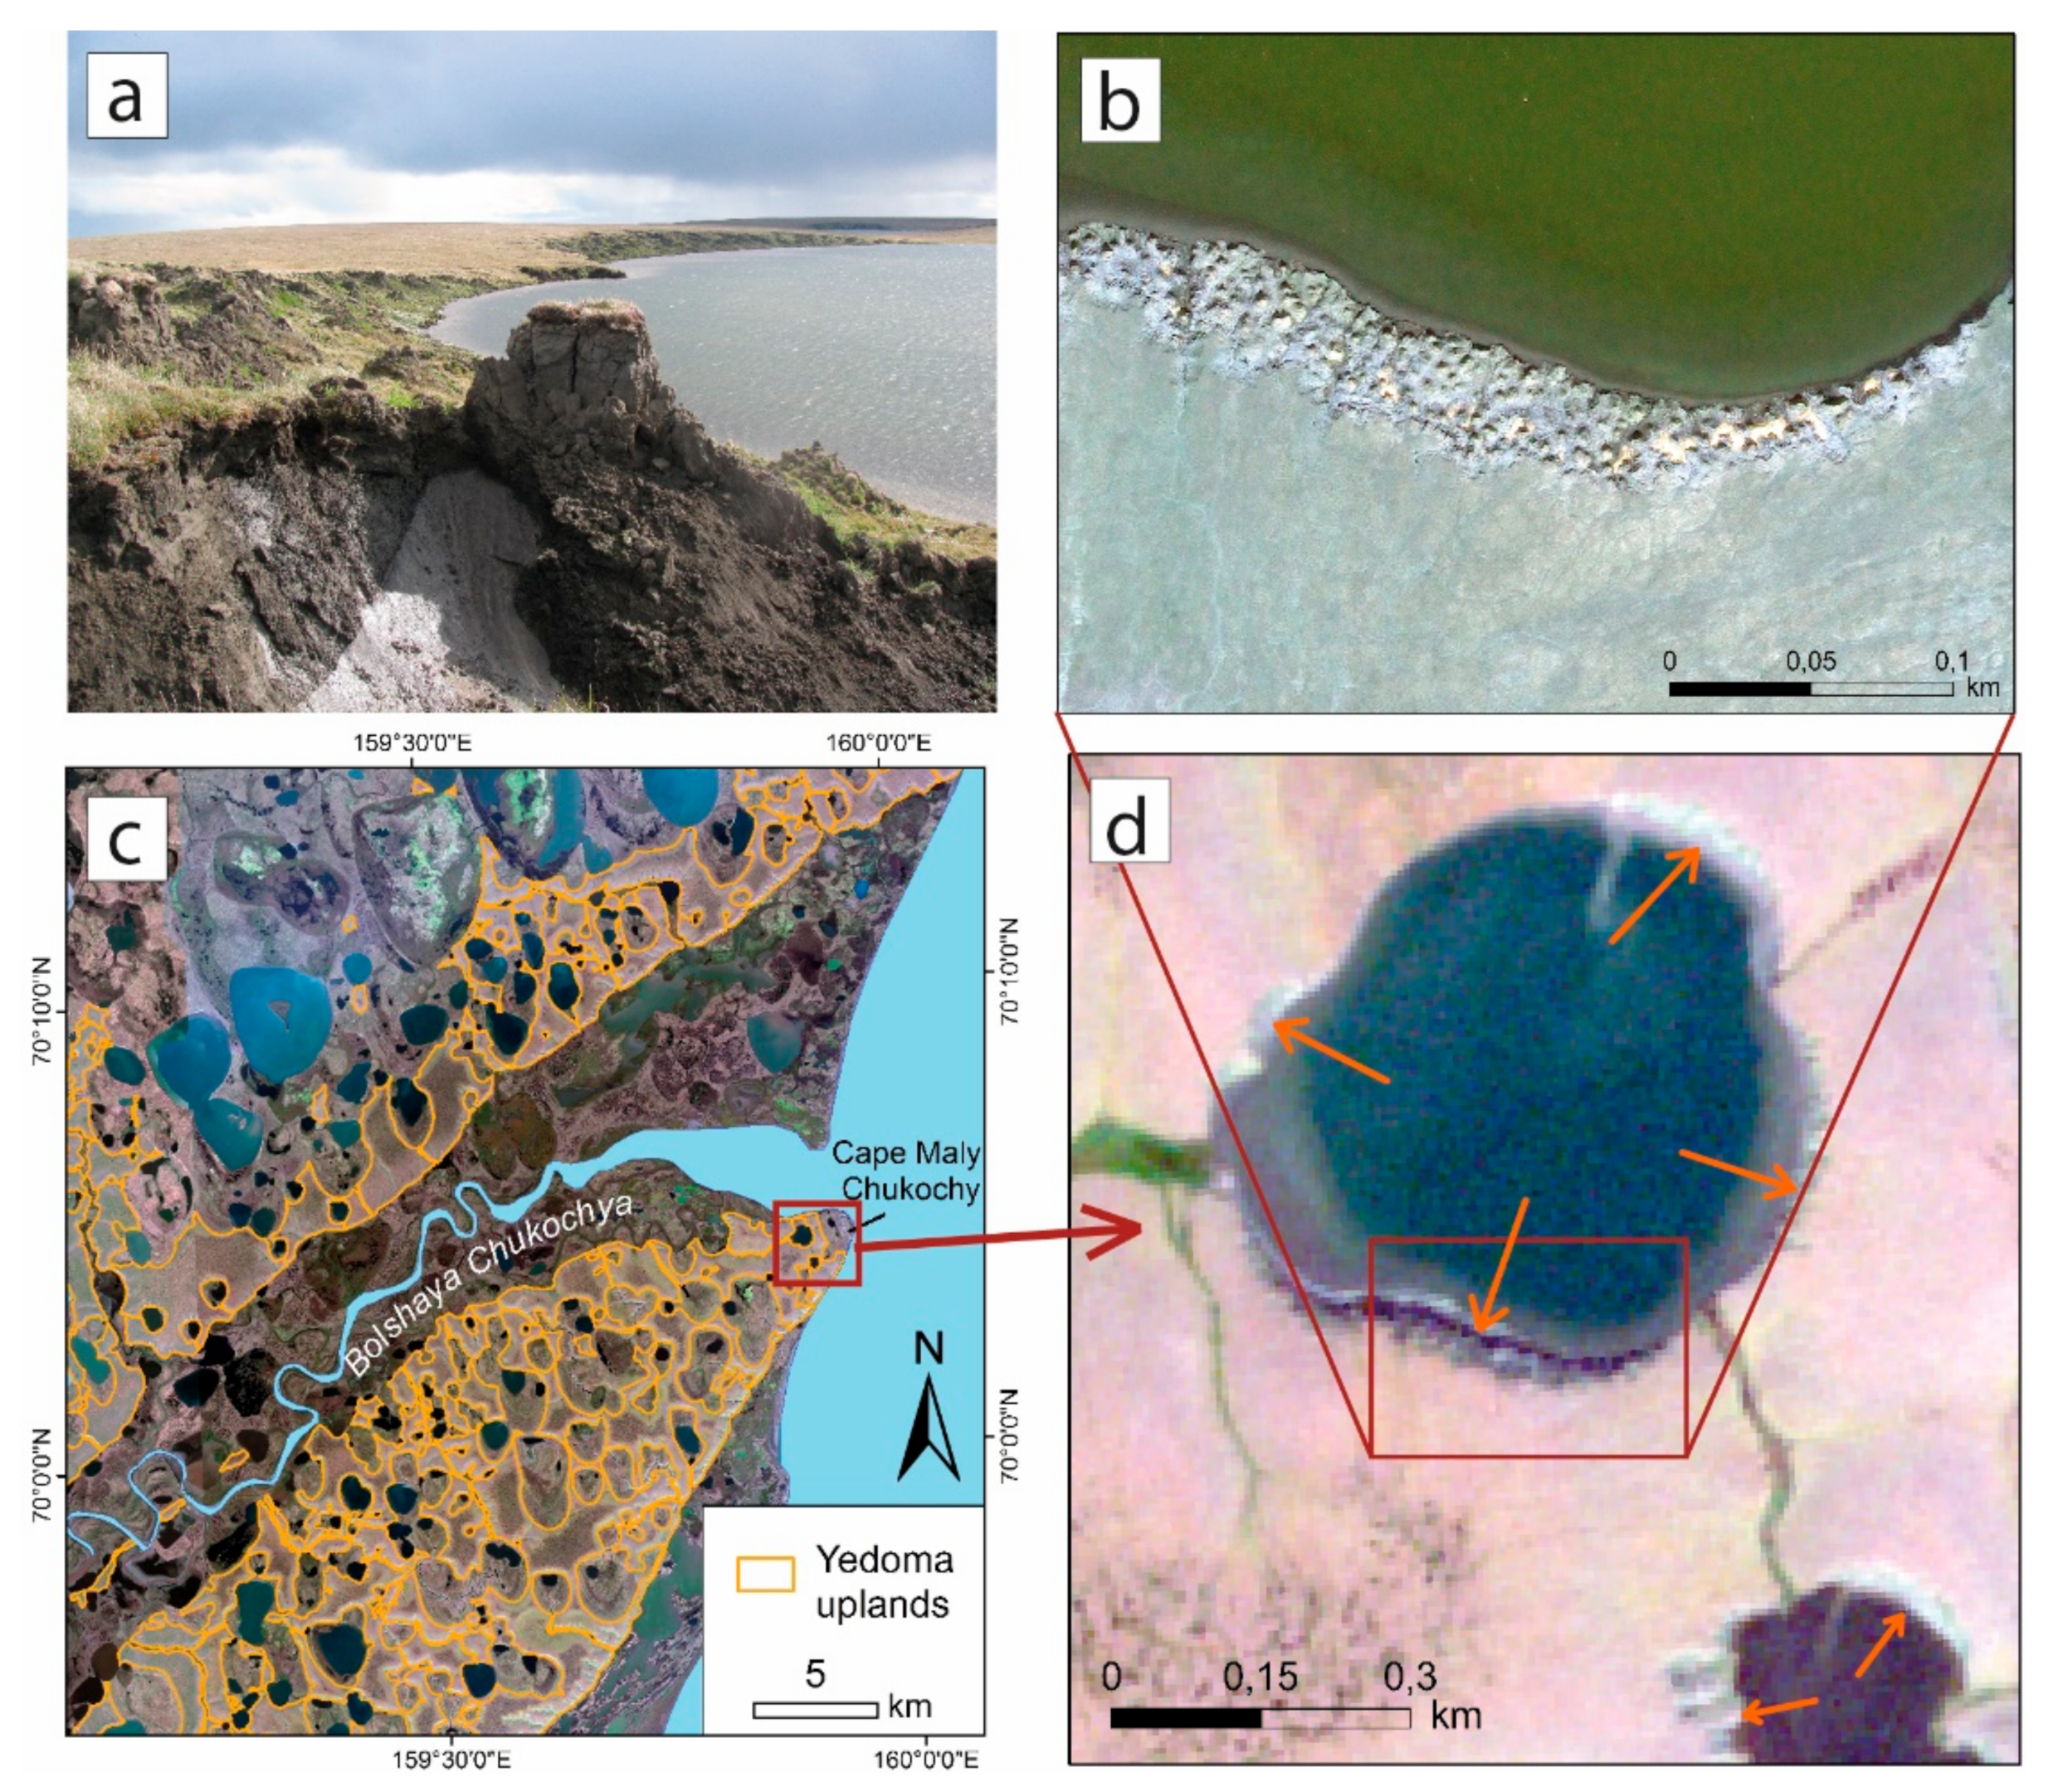
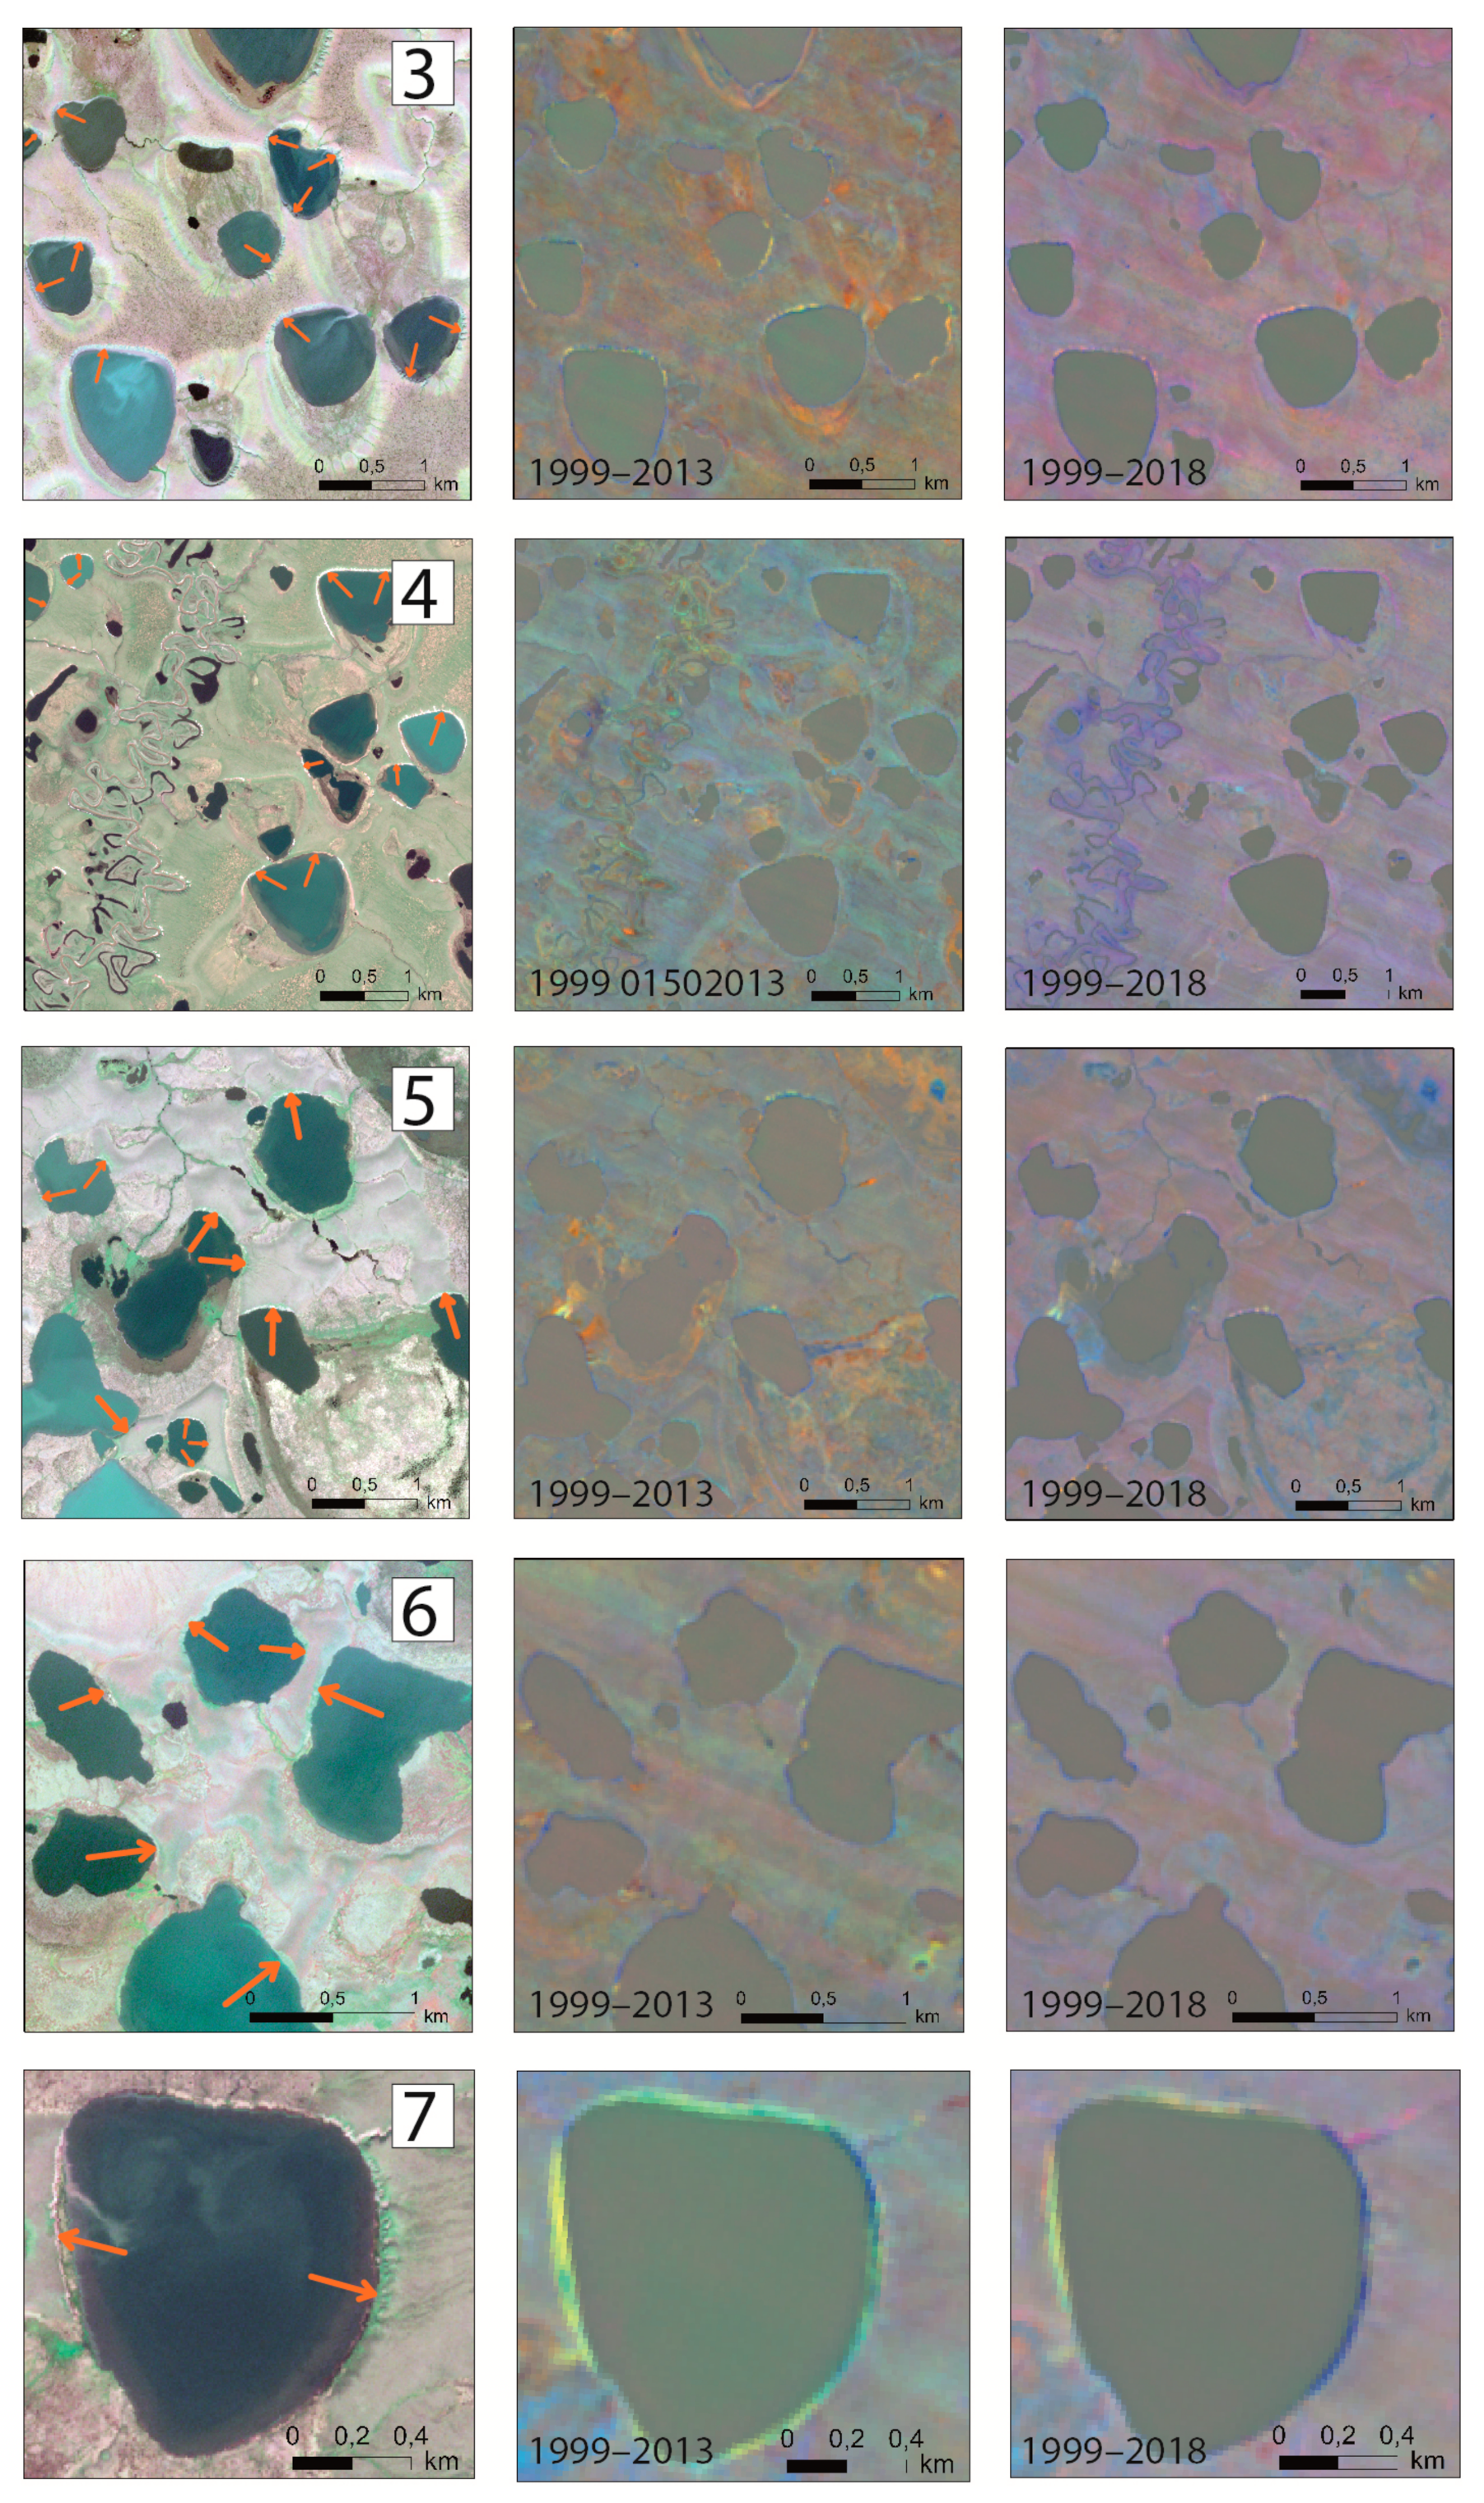
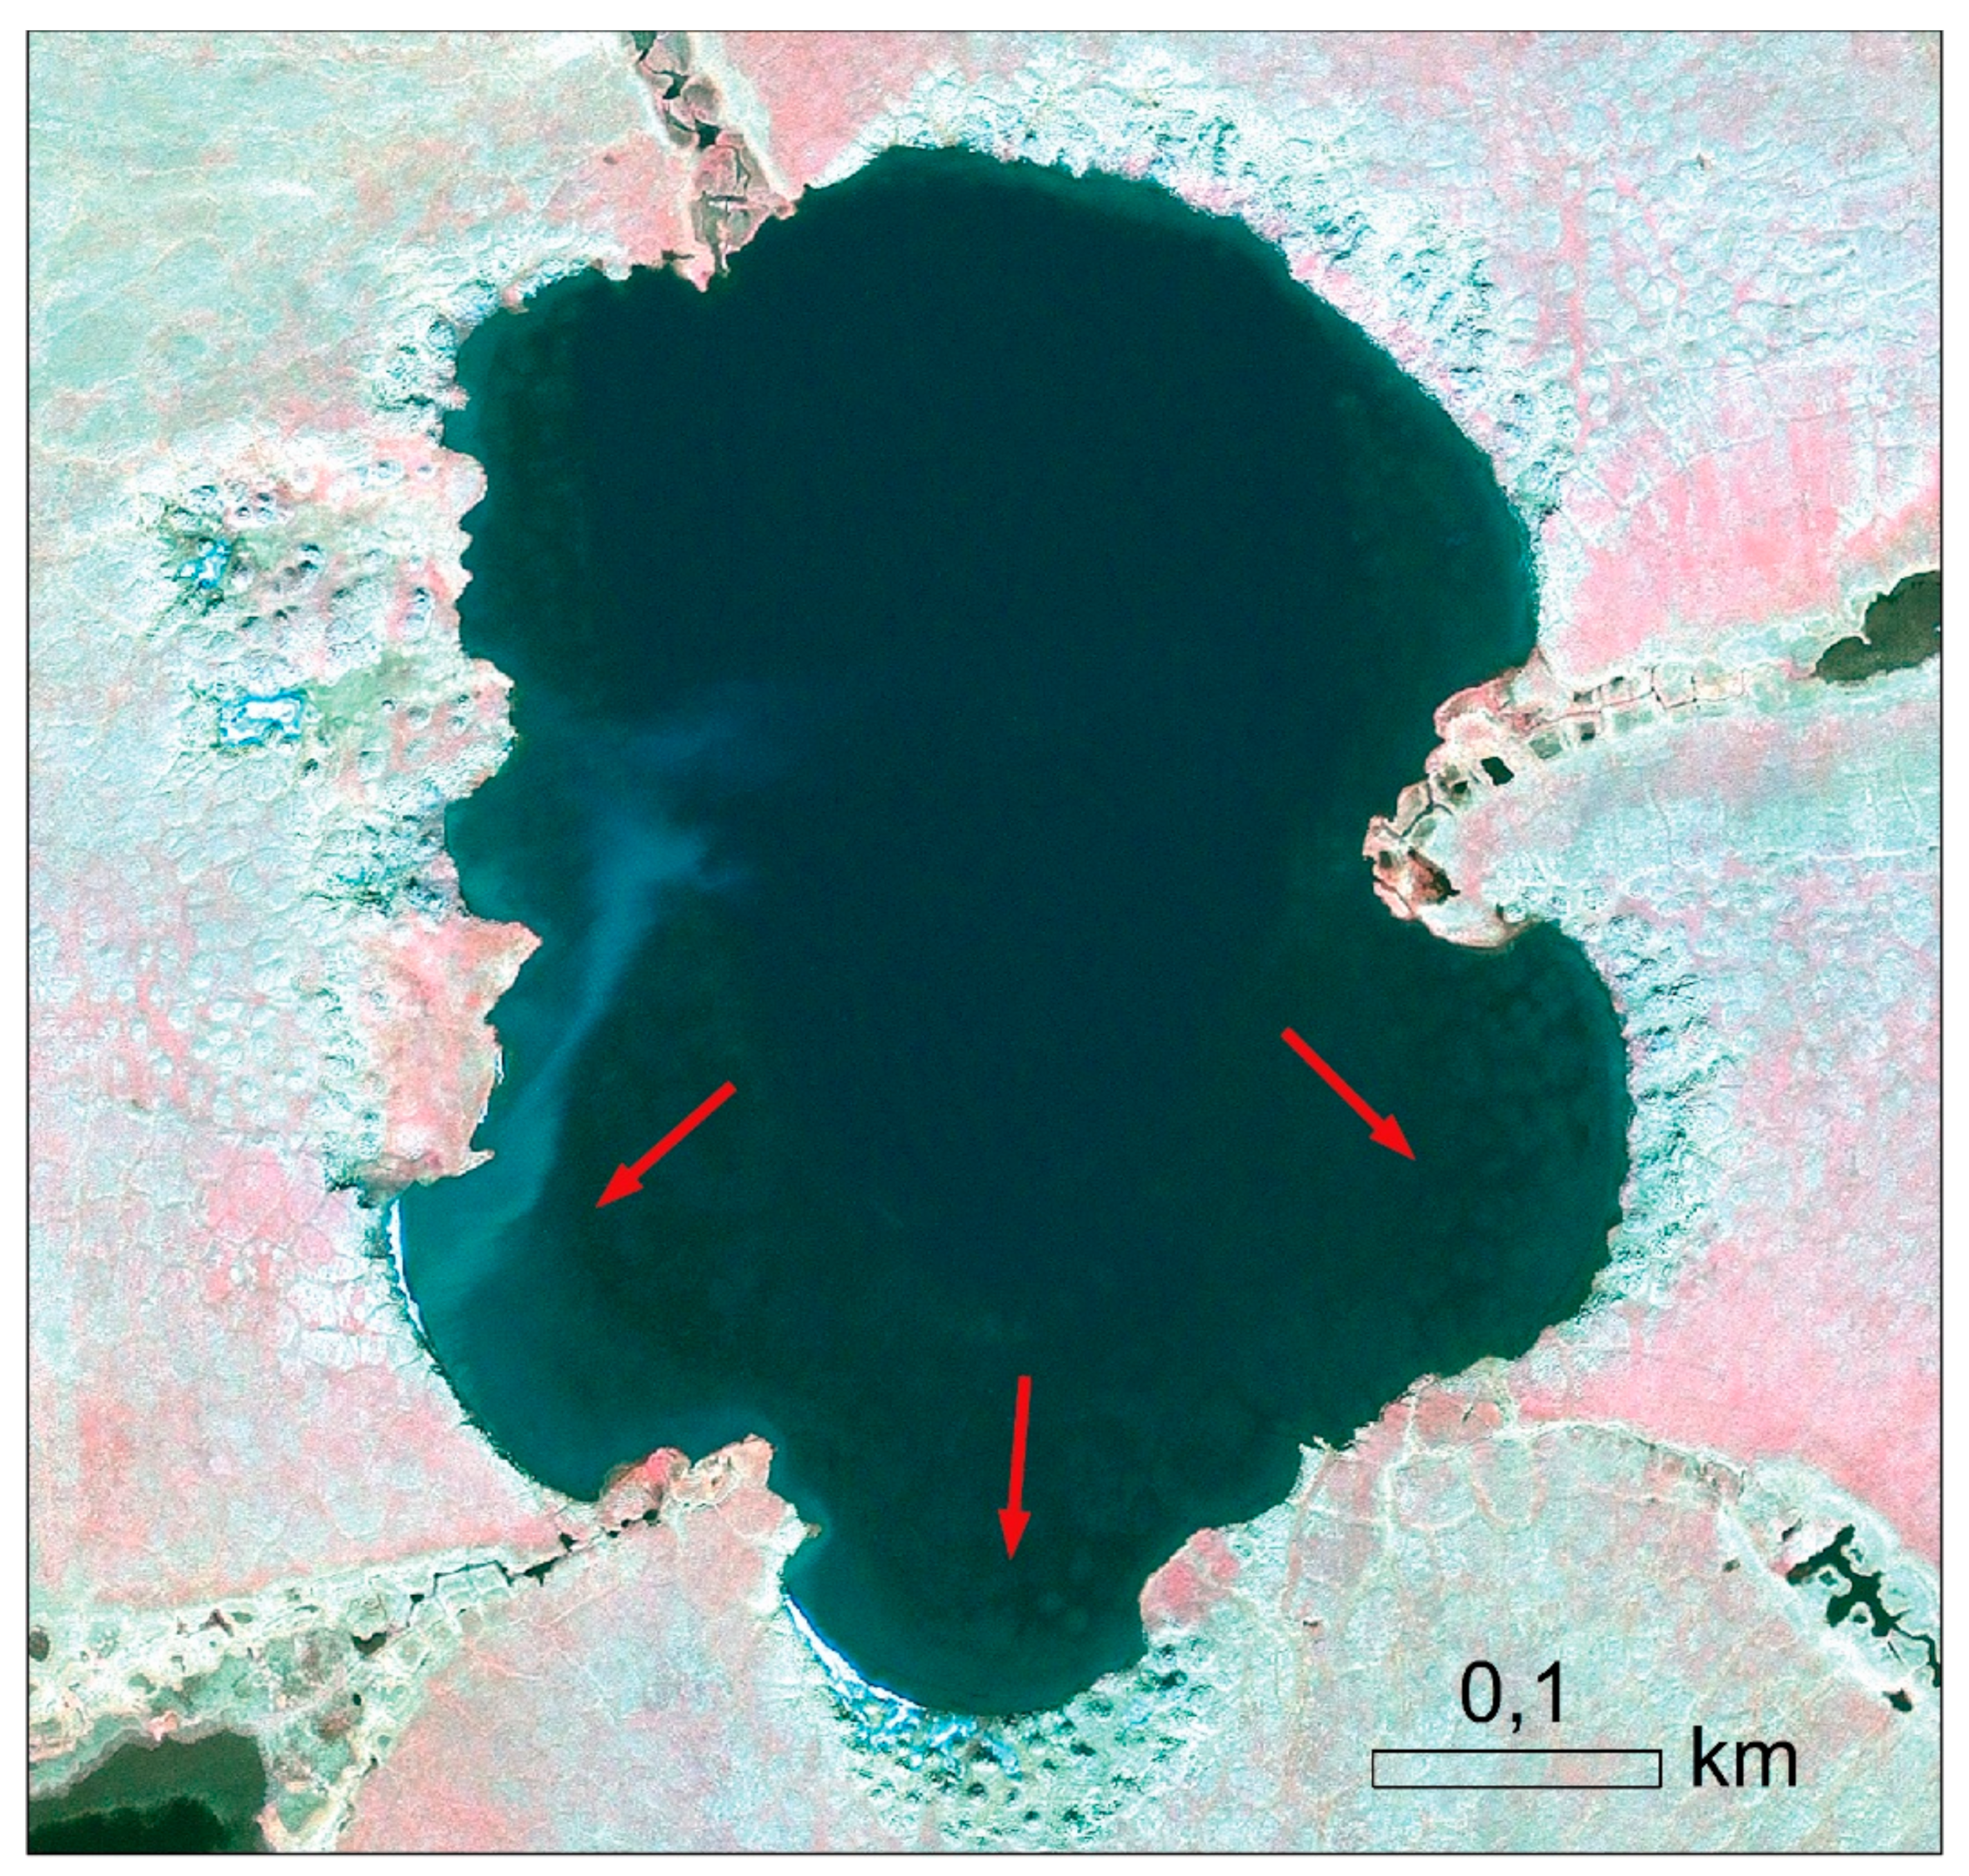
3.3.3. Detection of Lake Expansion Along Shores Composed of Yedoma IC
3.4. Database of Thermokarst Lake Changes
4. Results
4.1. Yedoma–Alas Relief Type Characteristic
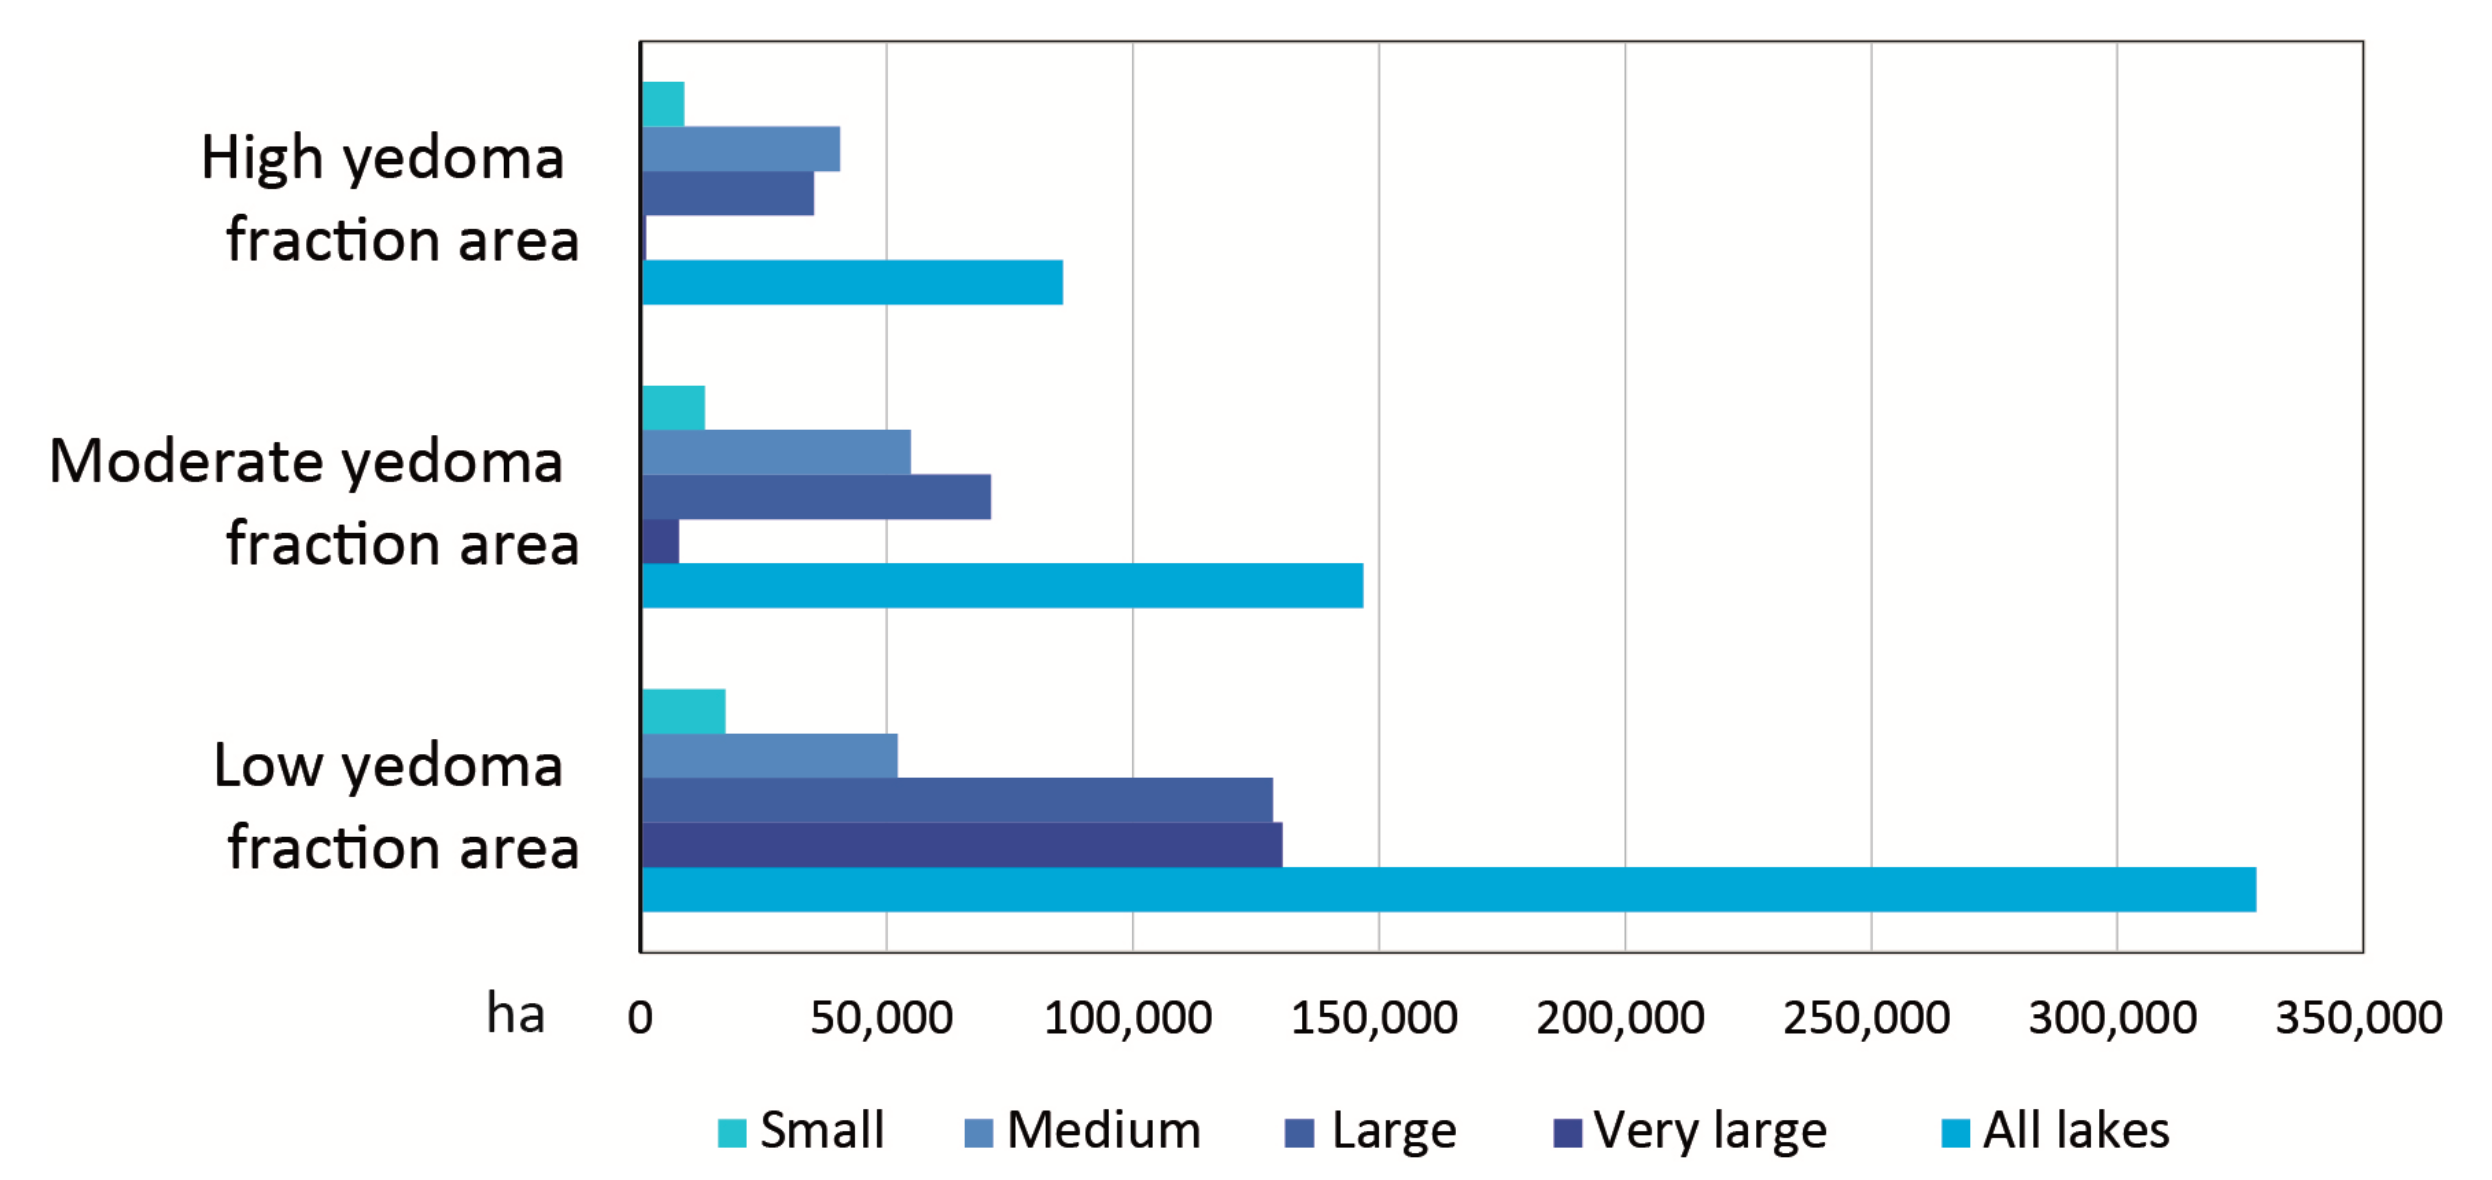
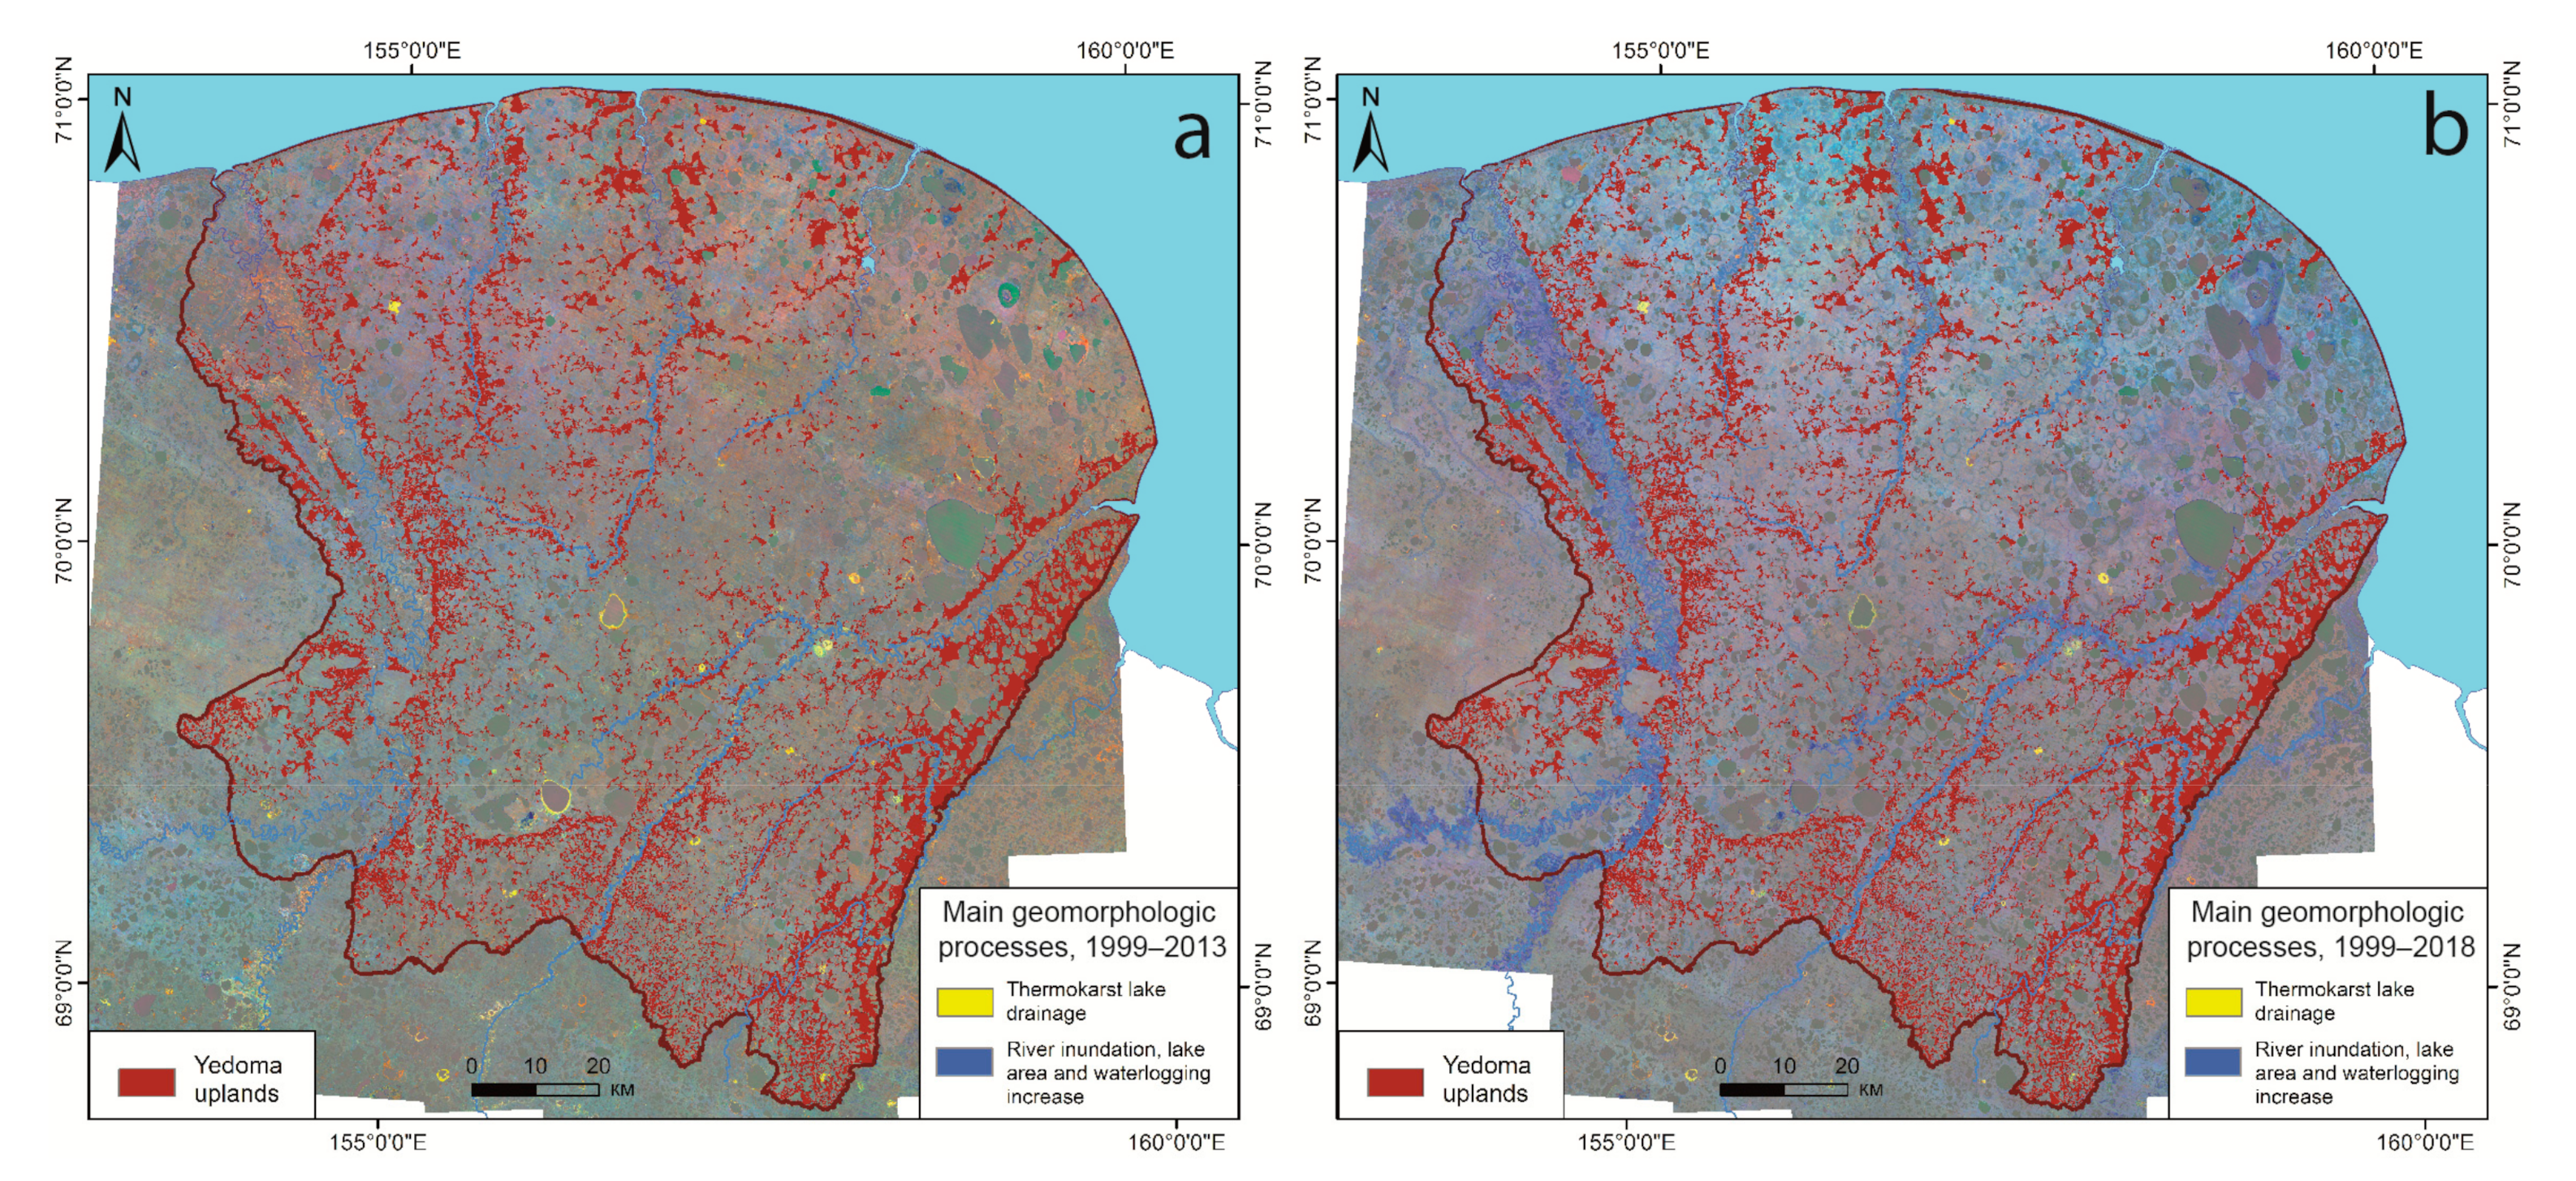
4.2. Geomorphological Analysis of Thermokarst Lake Distribution
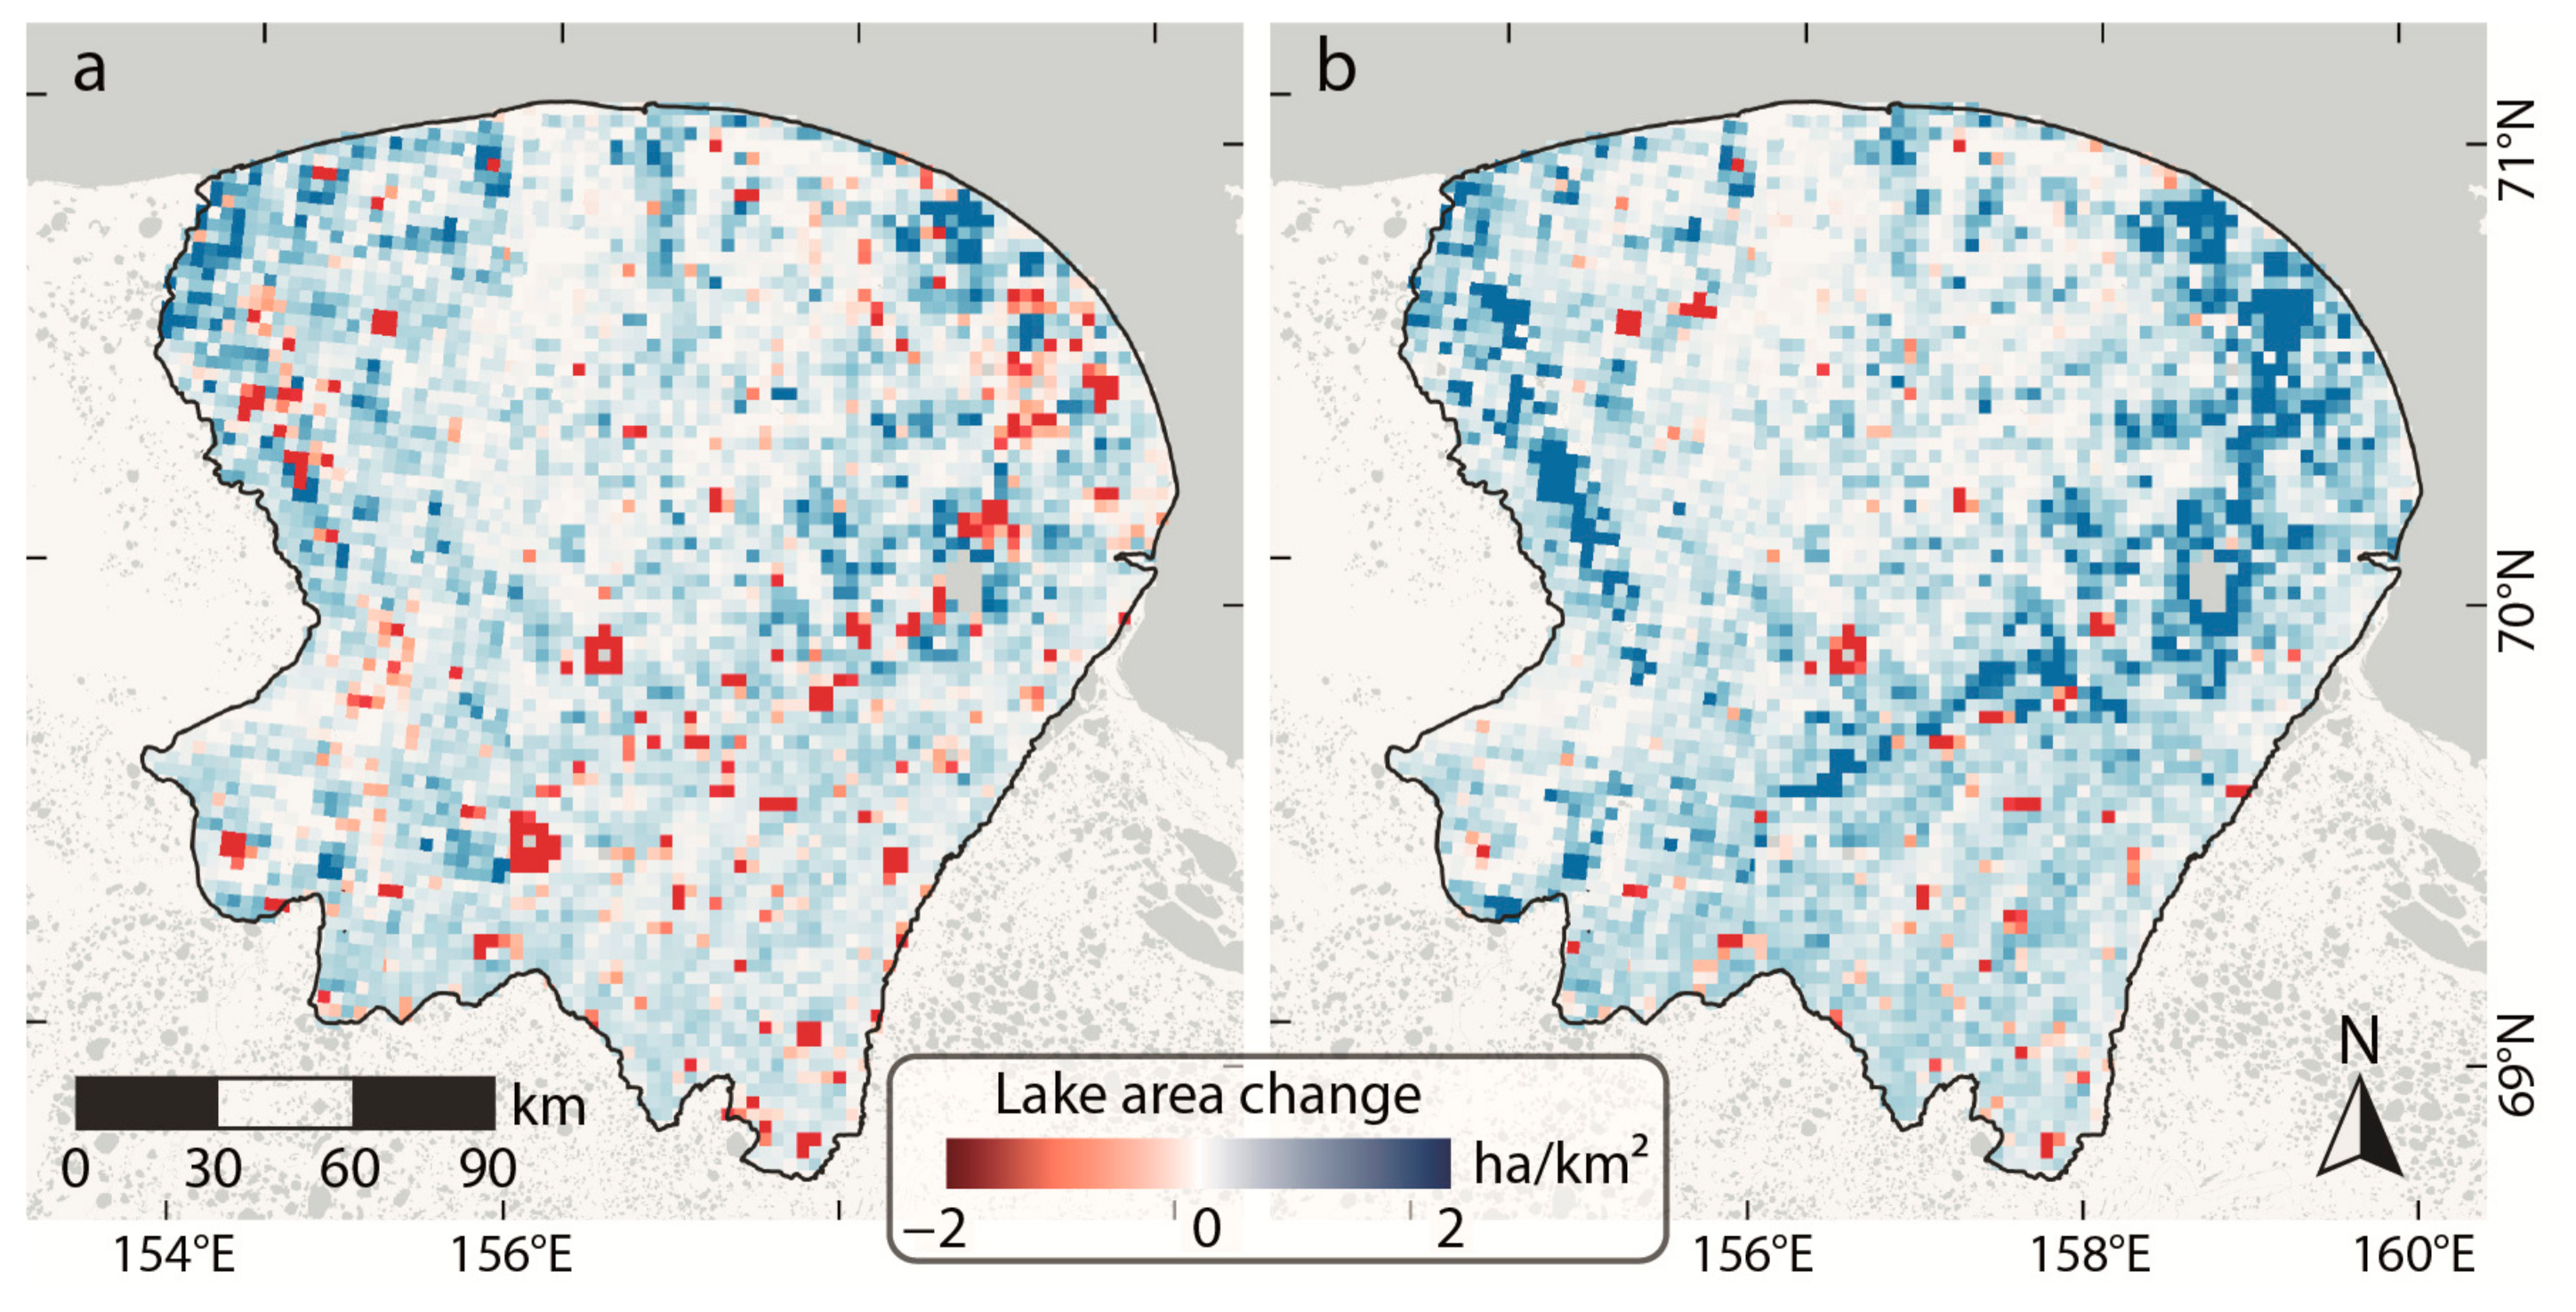
4.3. Lake Area Changes of 1999–2013 and 1999–2018 and Their Dependence on Geomorphological Conditions
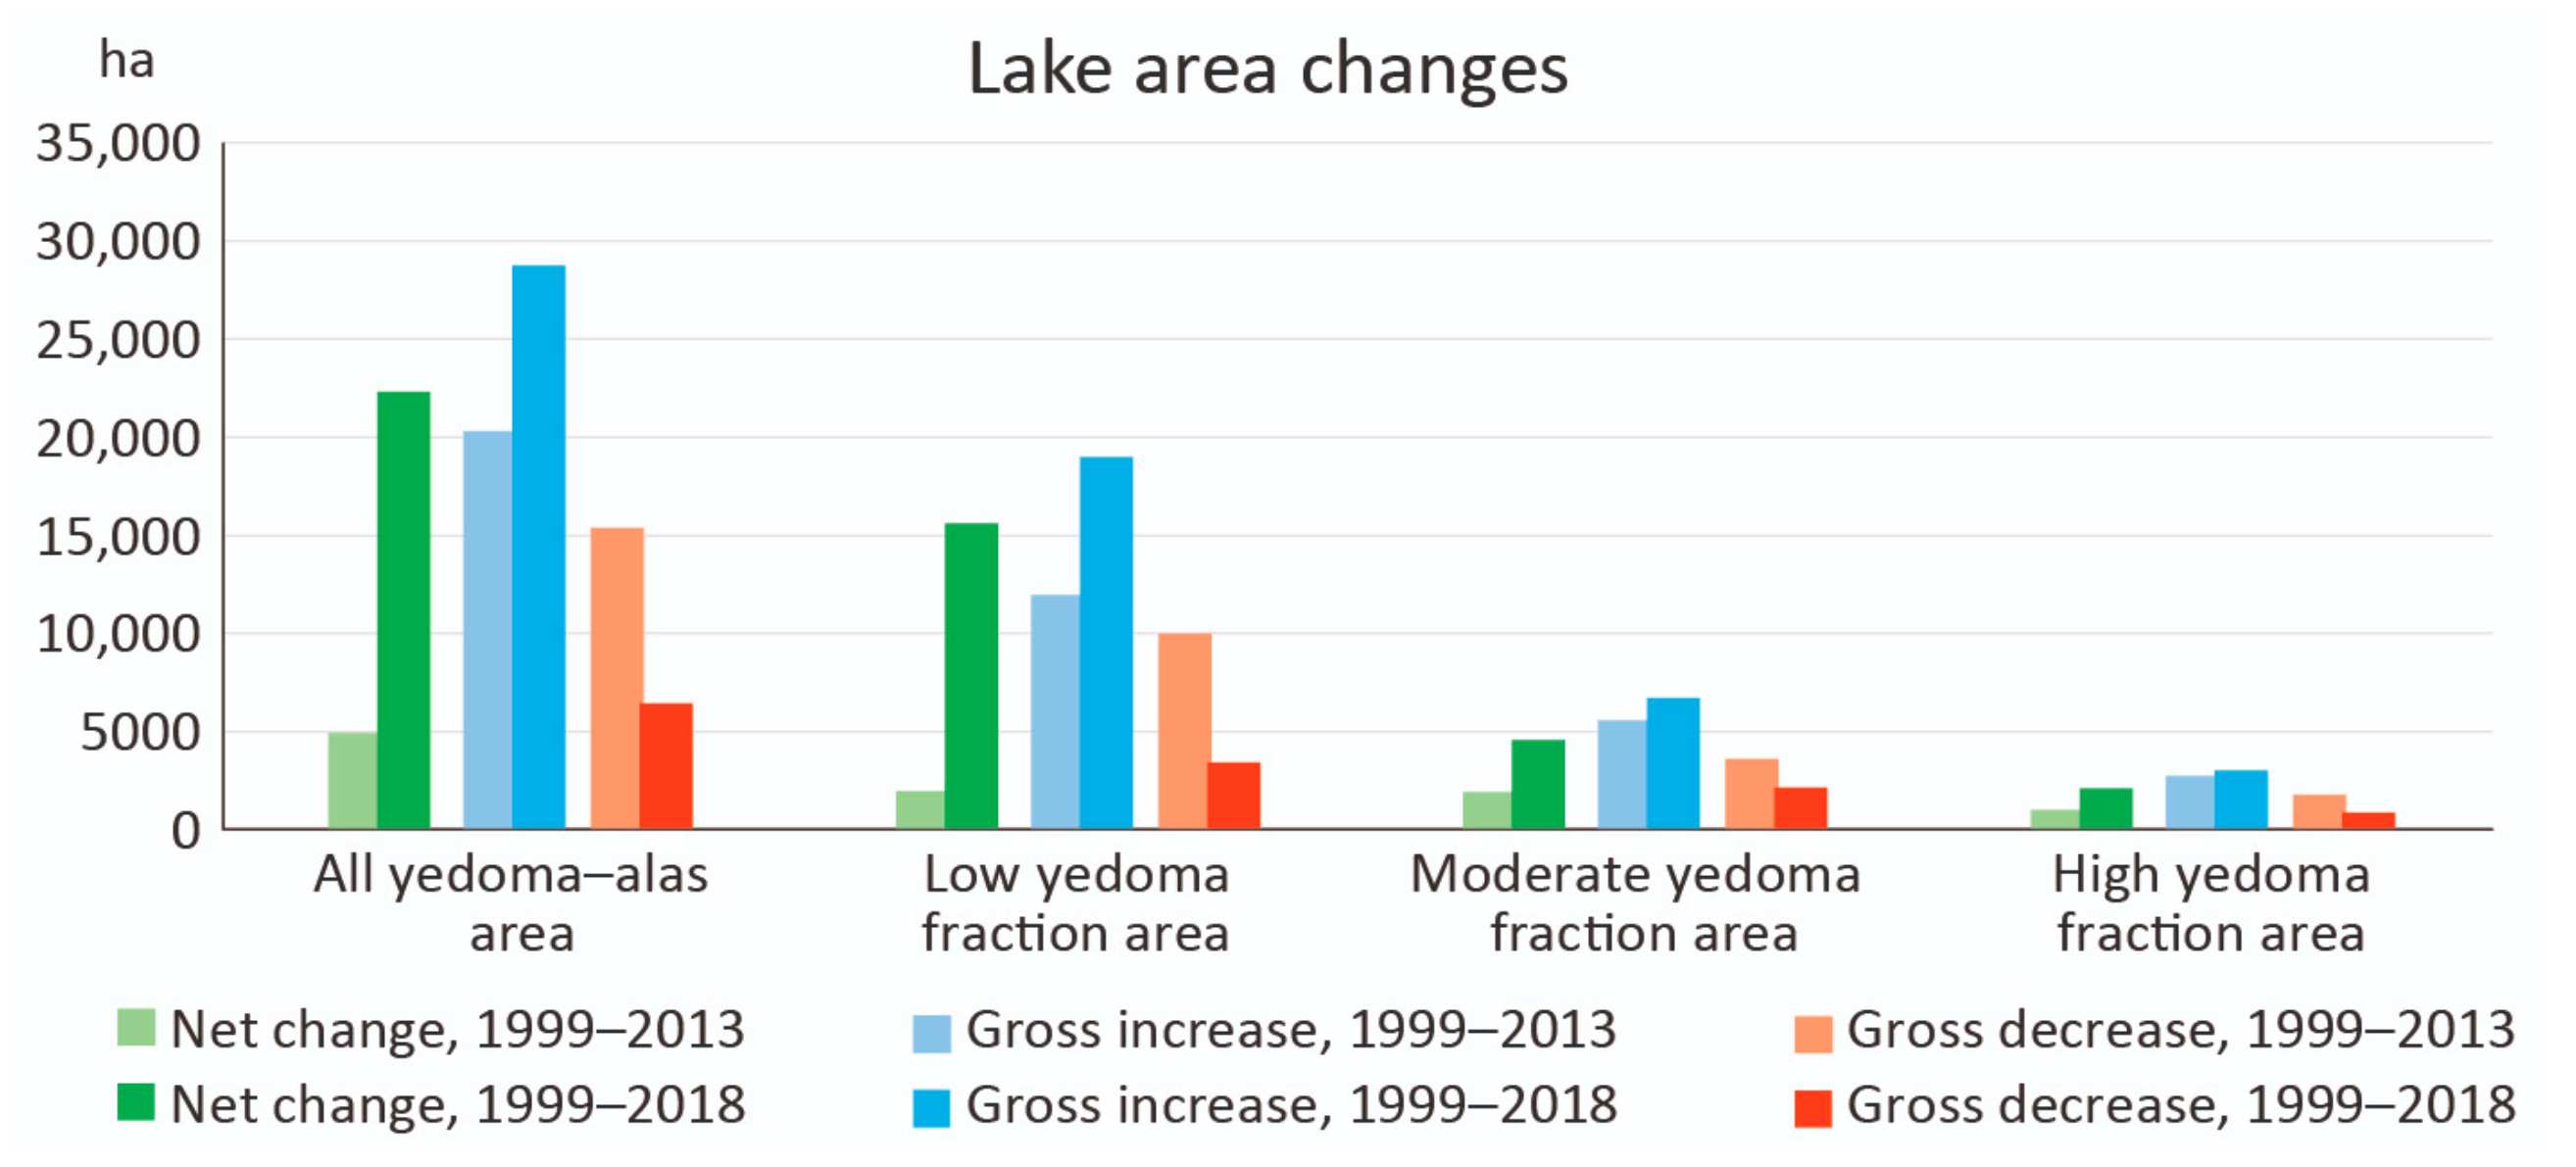
4.3.1. Lake Area Changes within Yedoma–Alas Relief Types
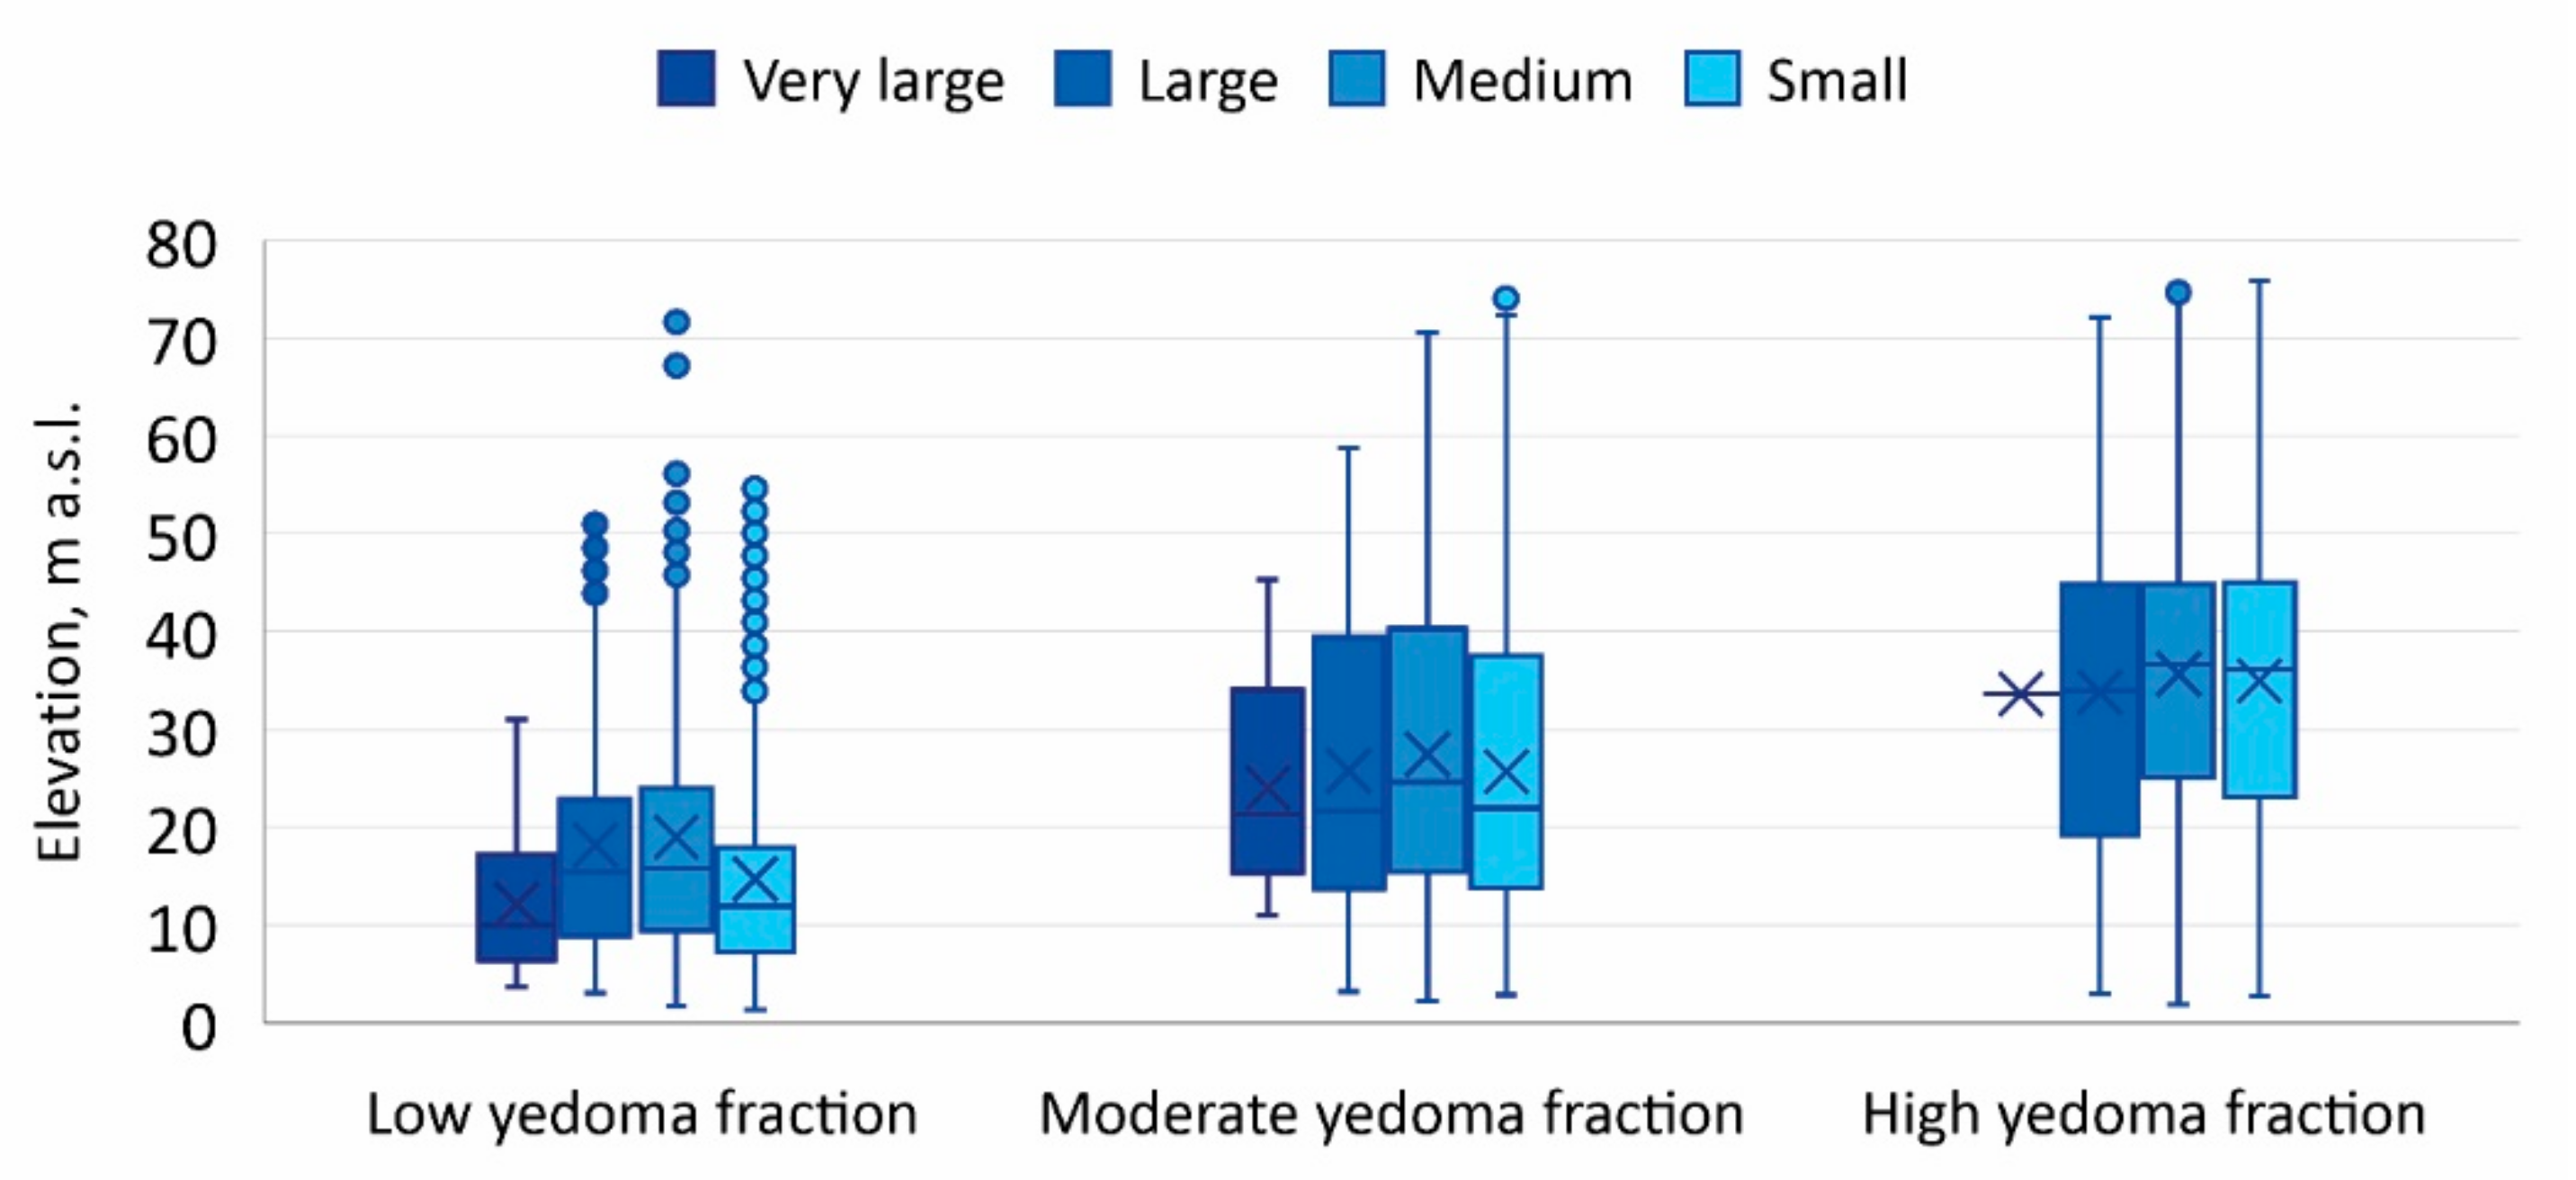
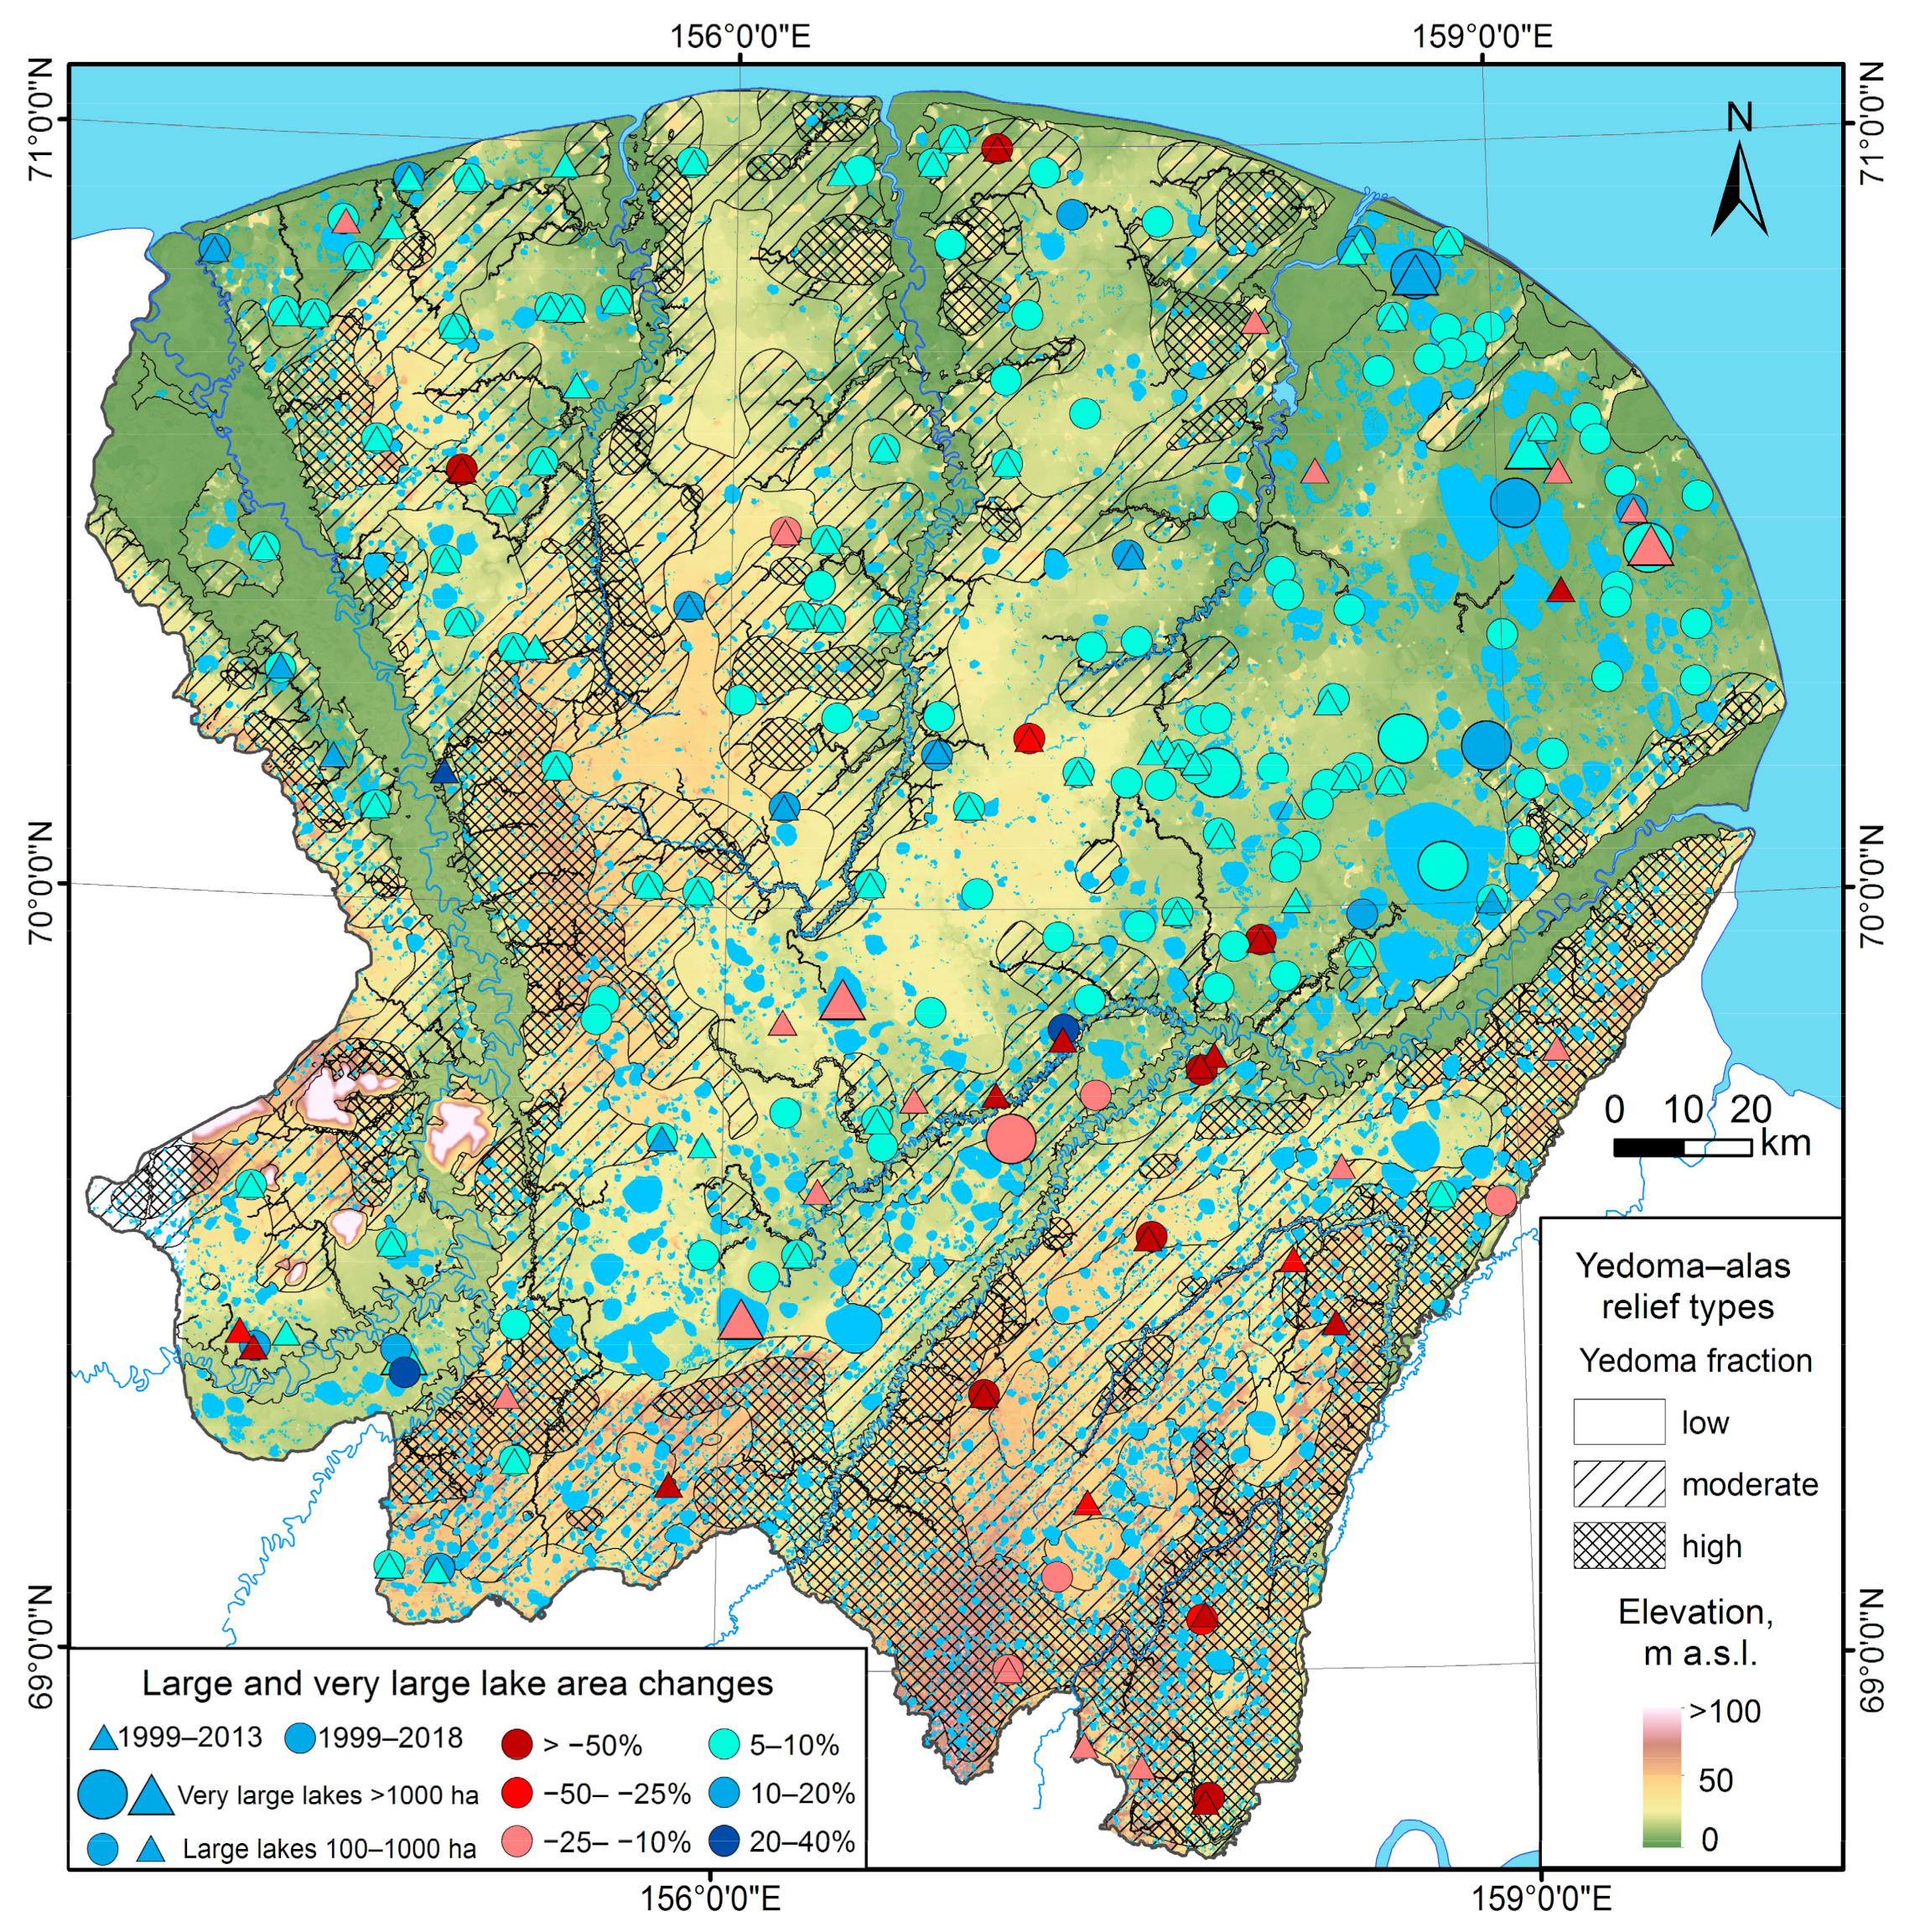
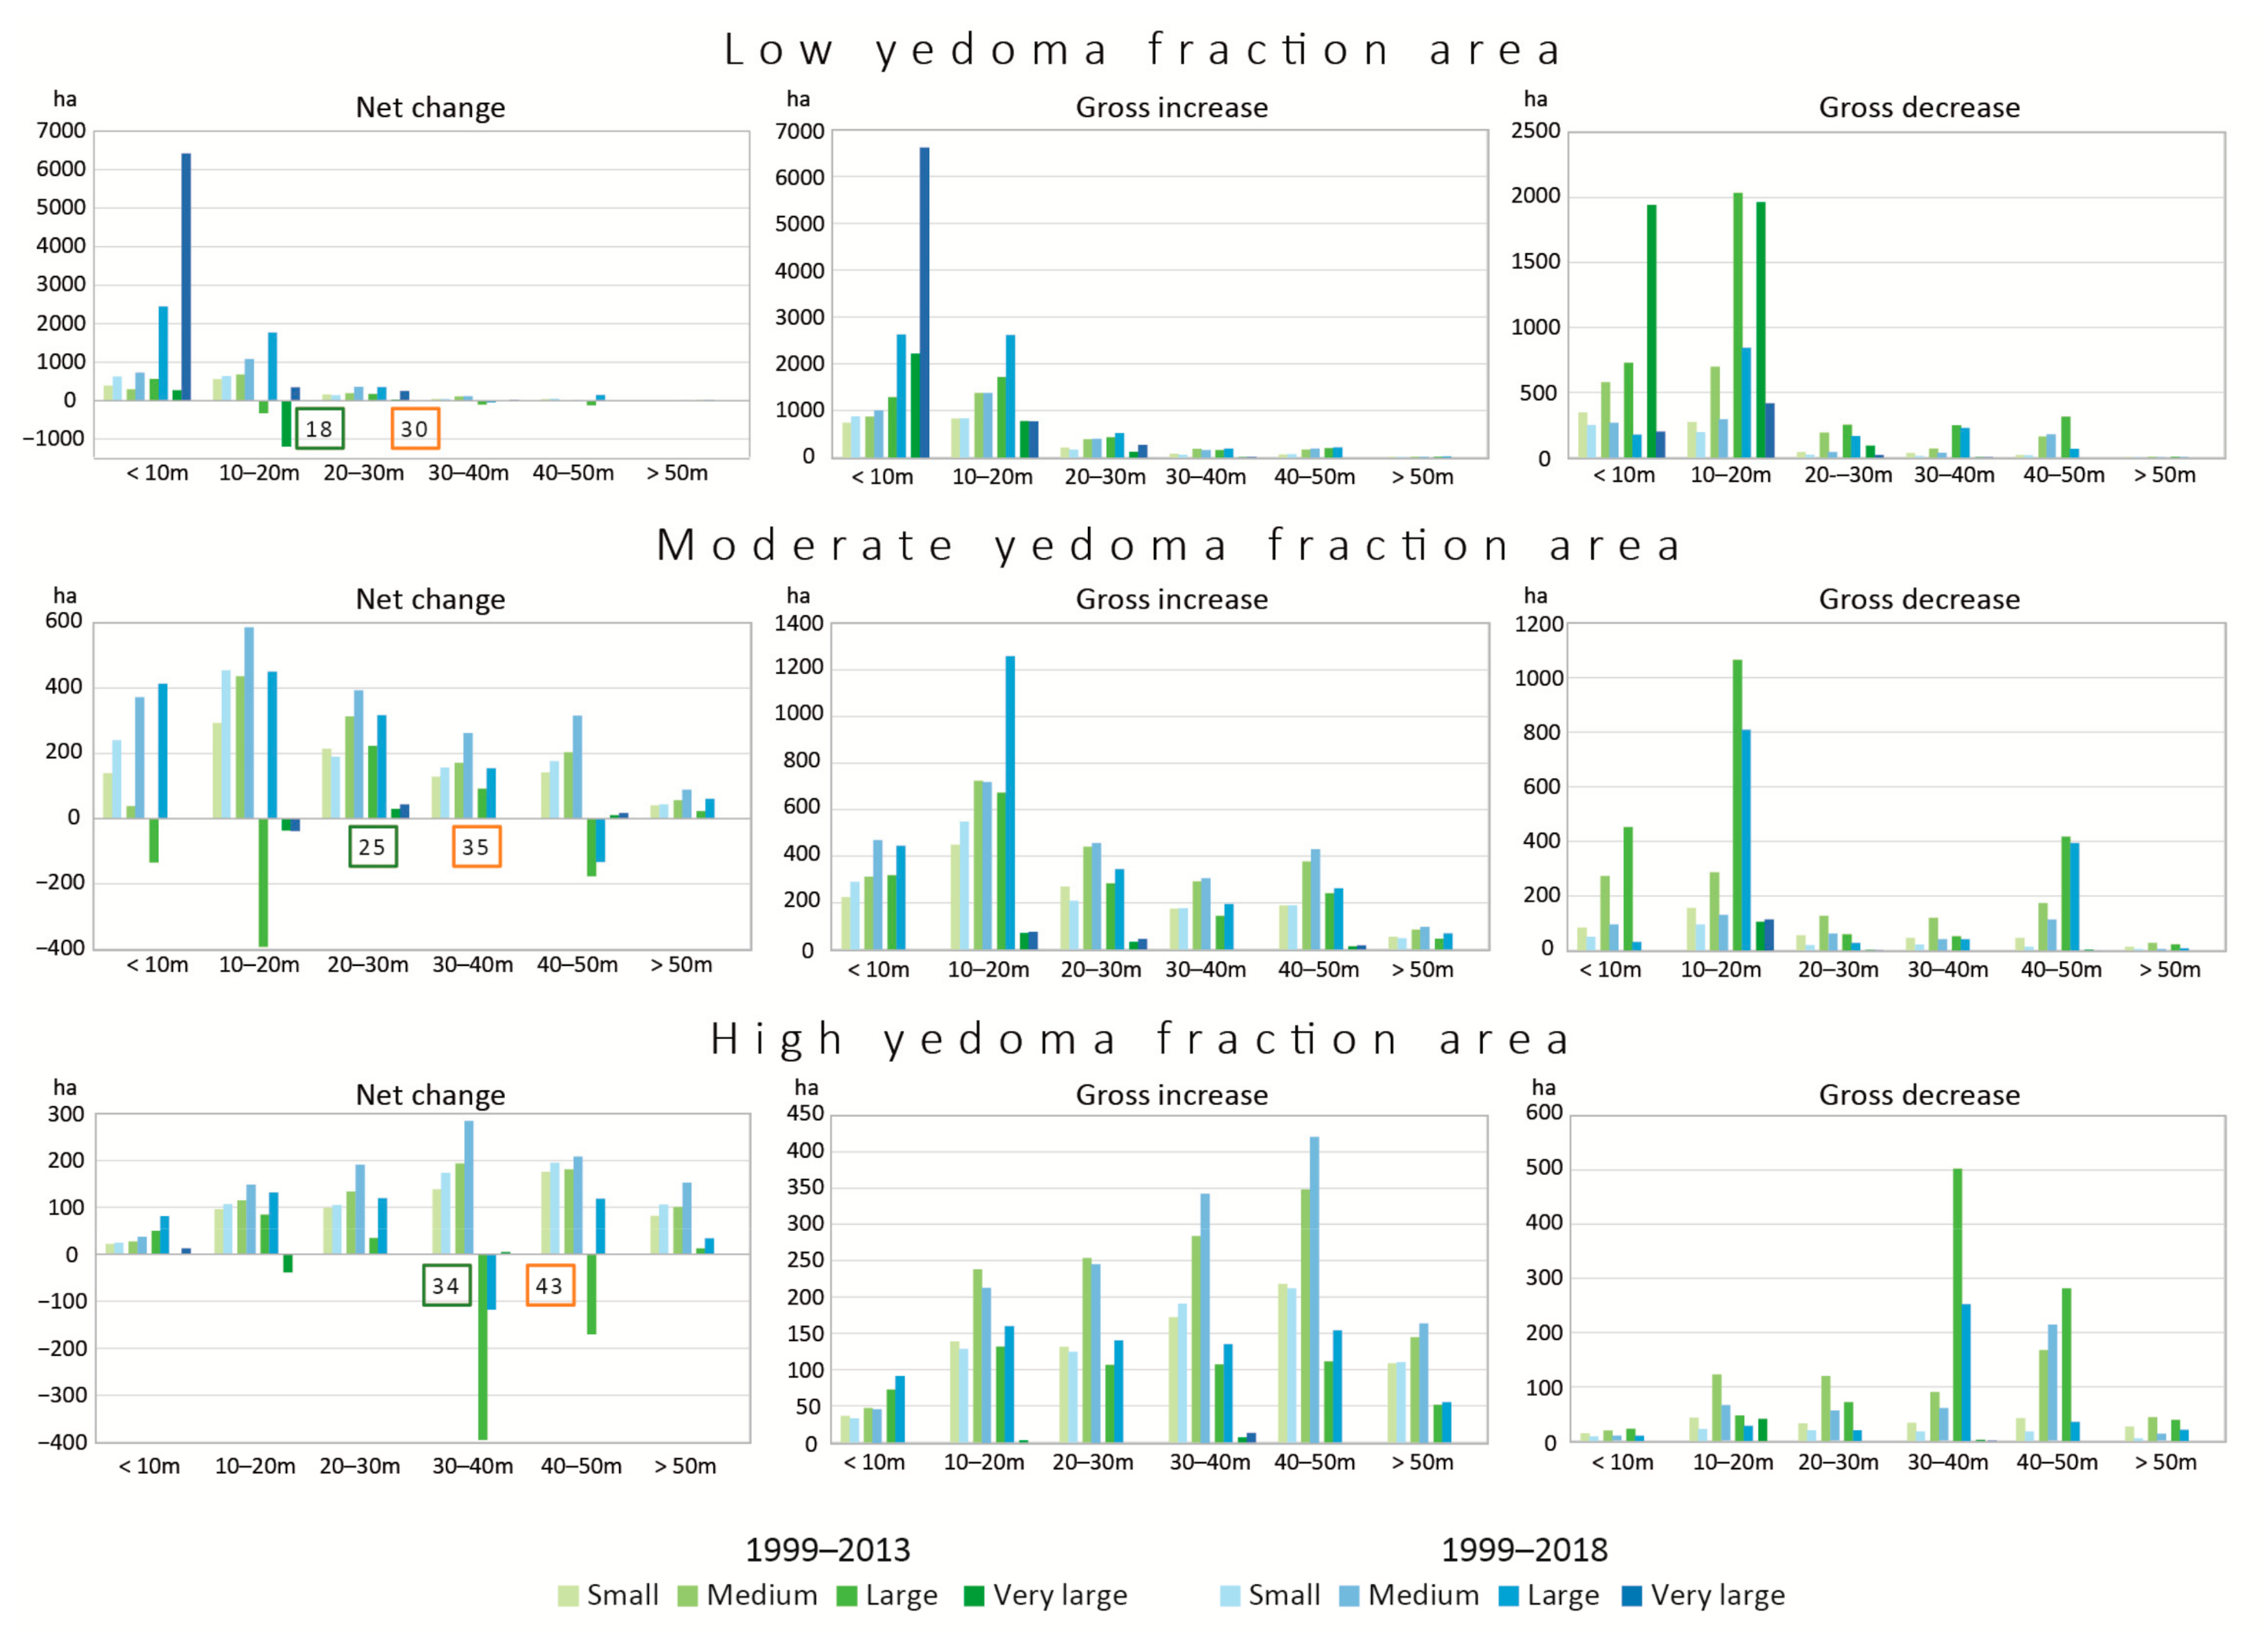
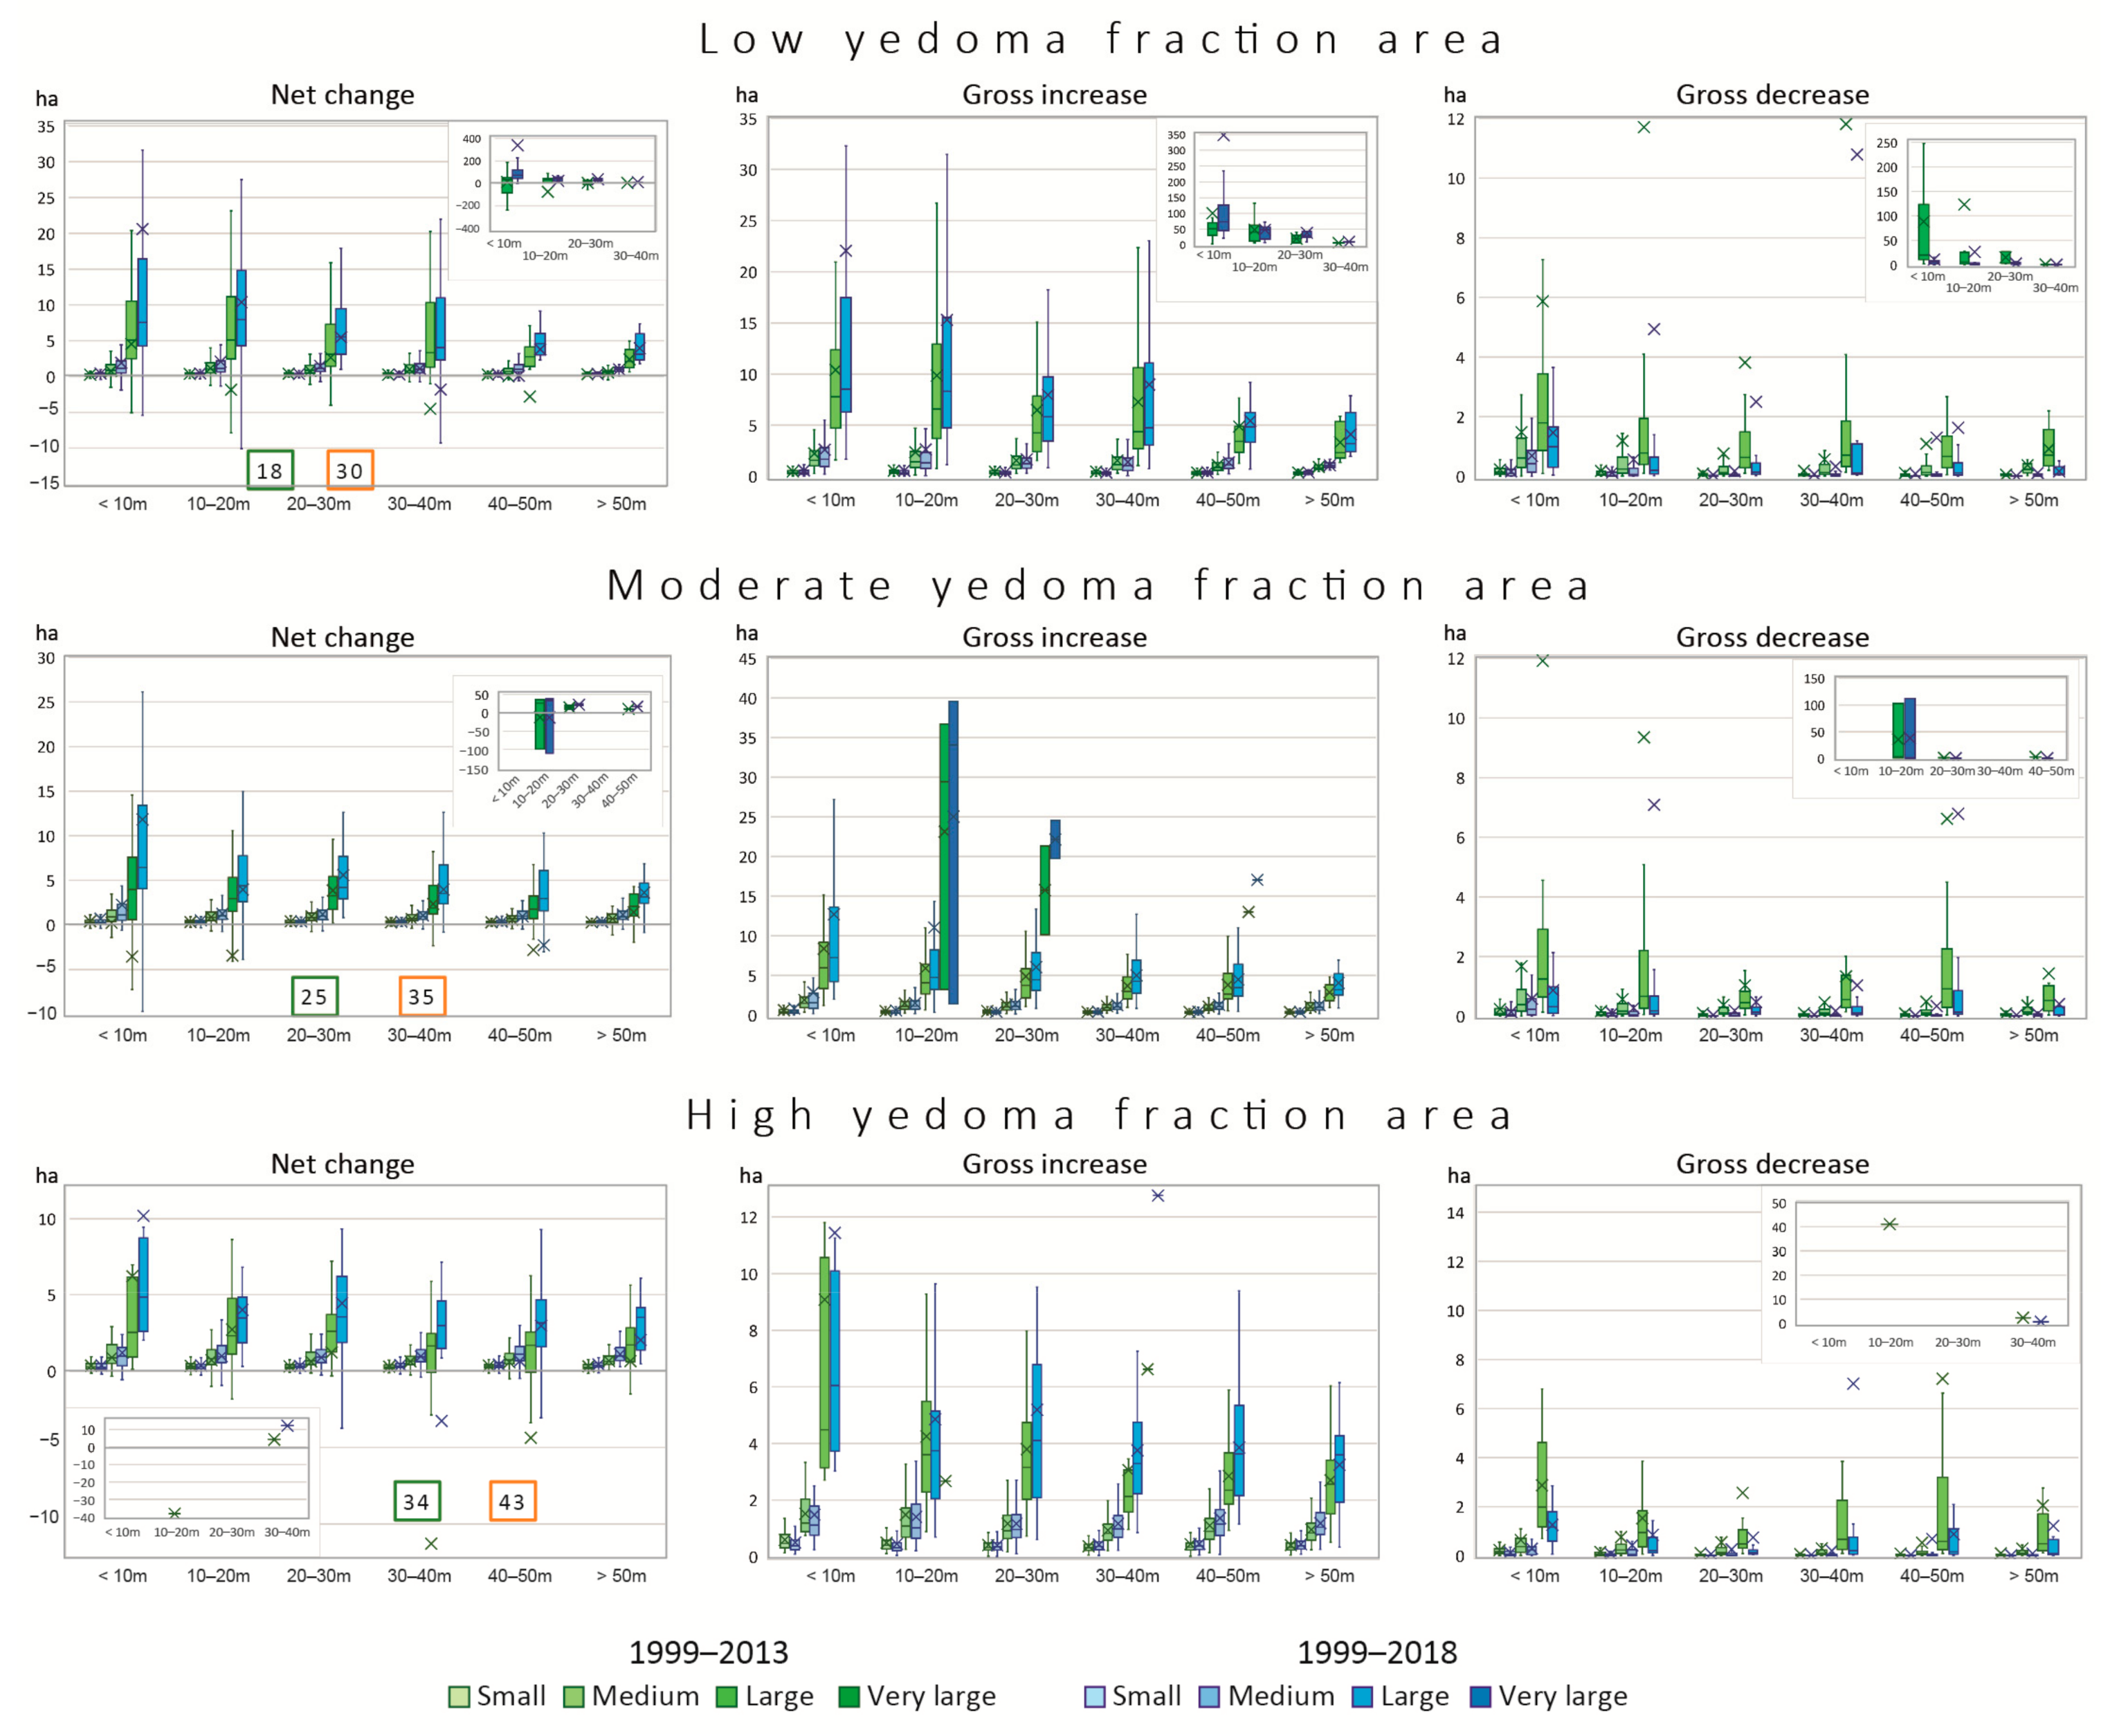
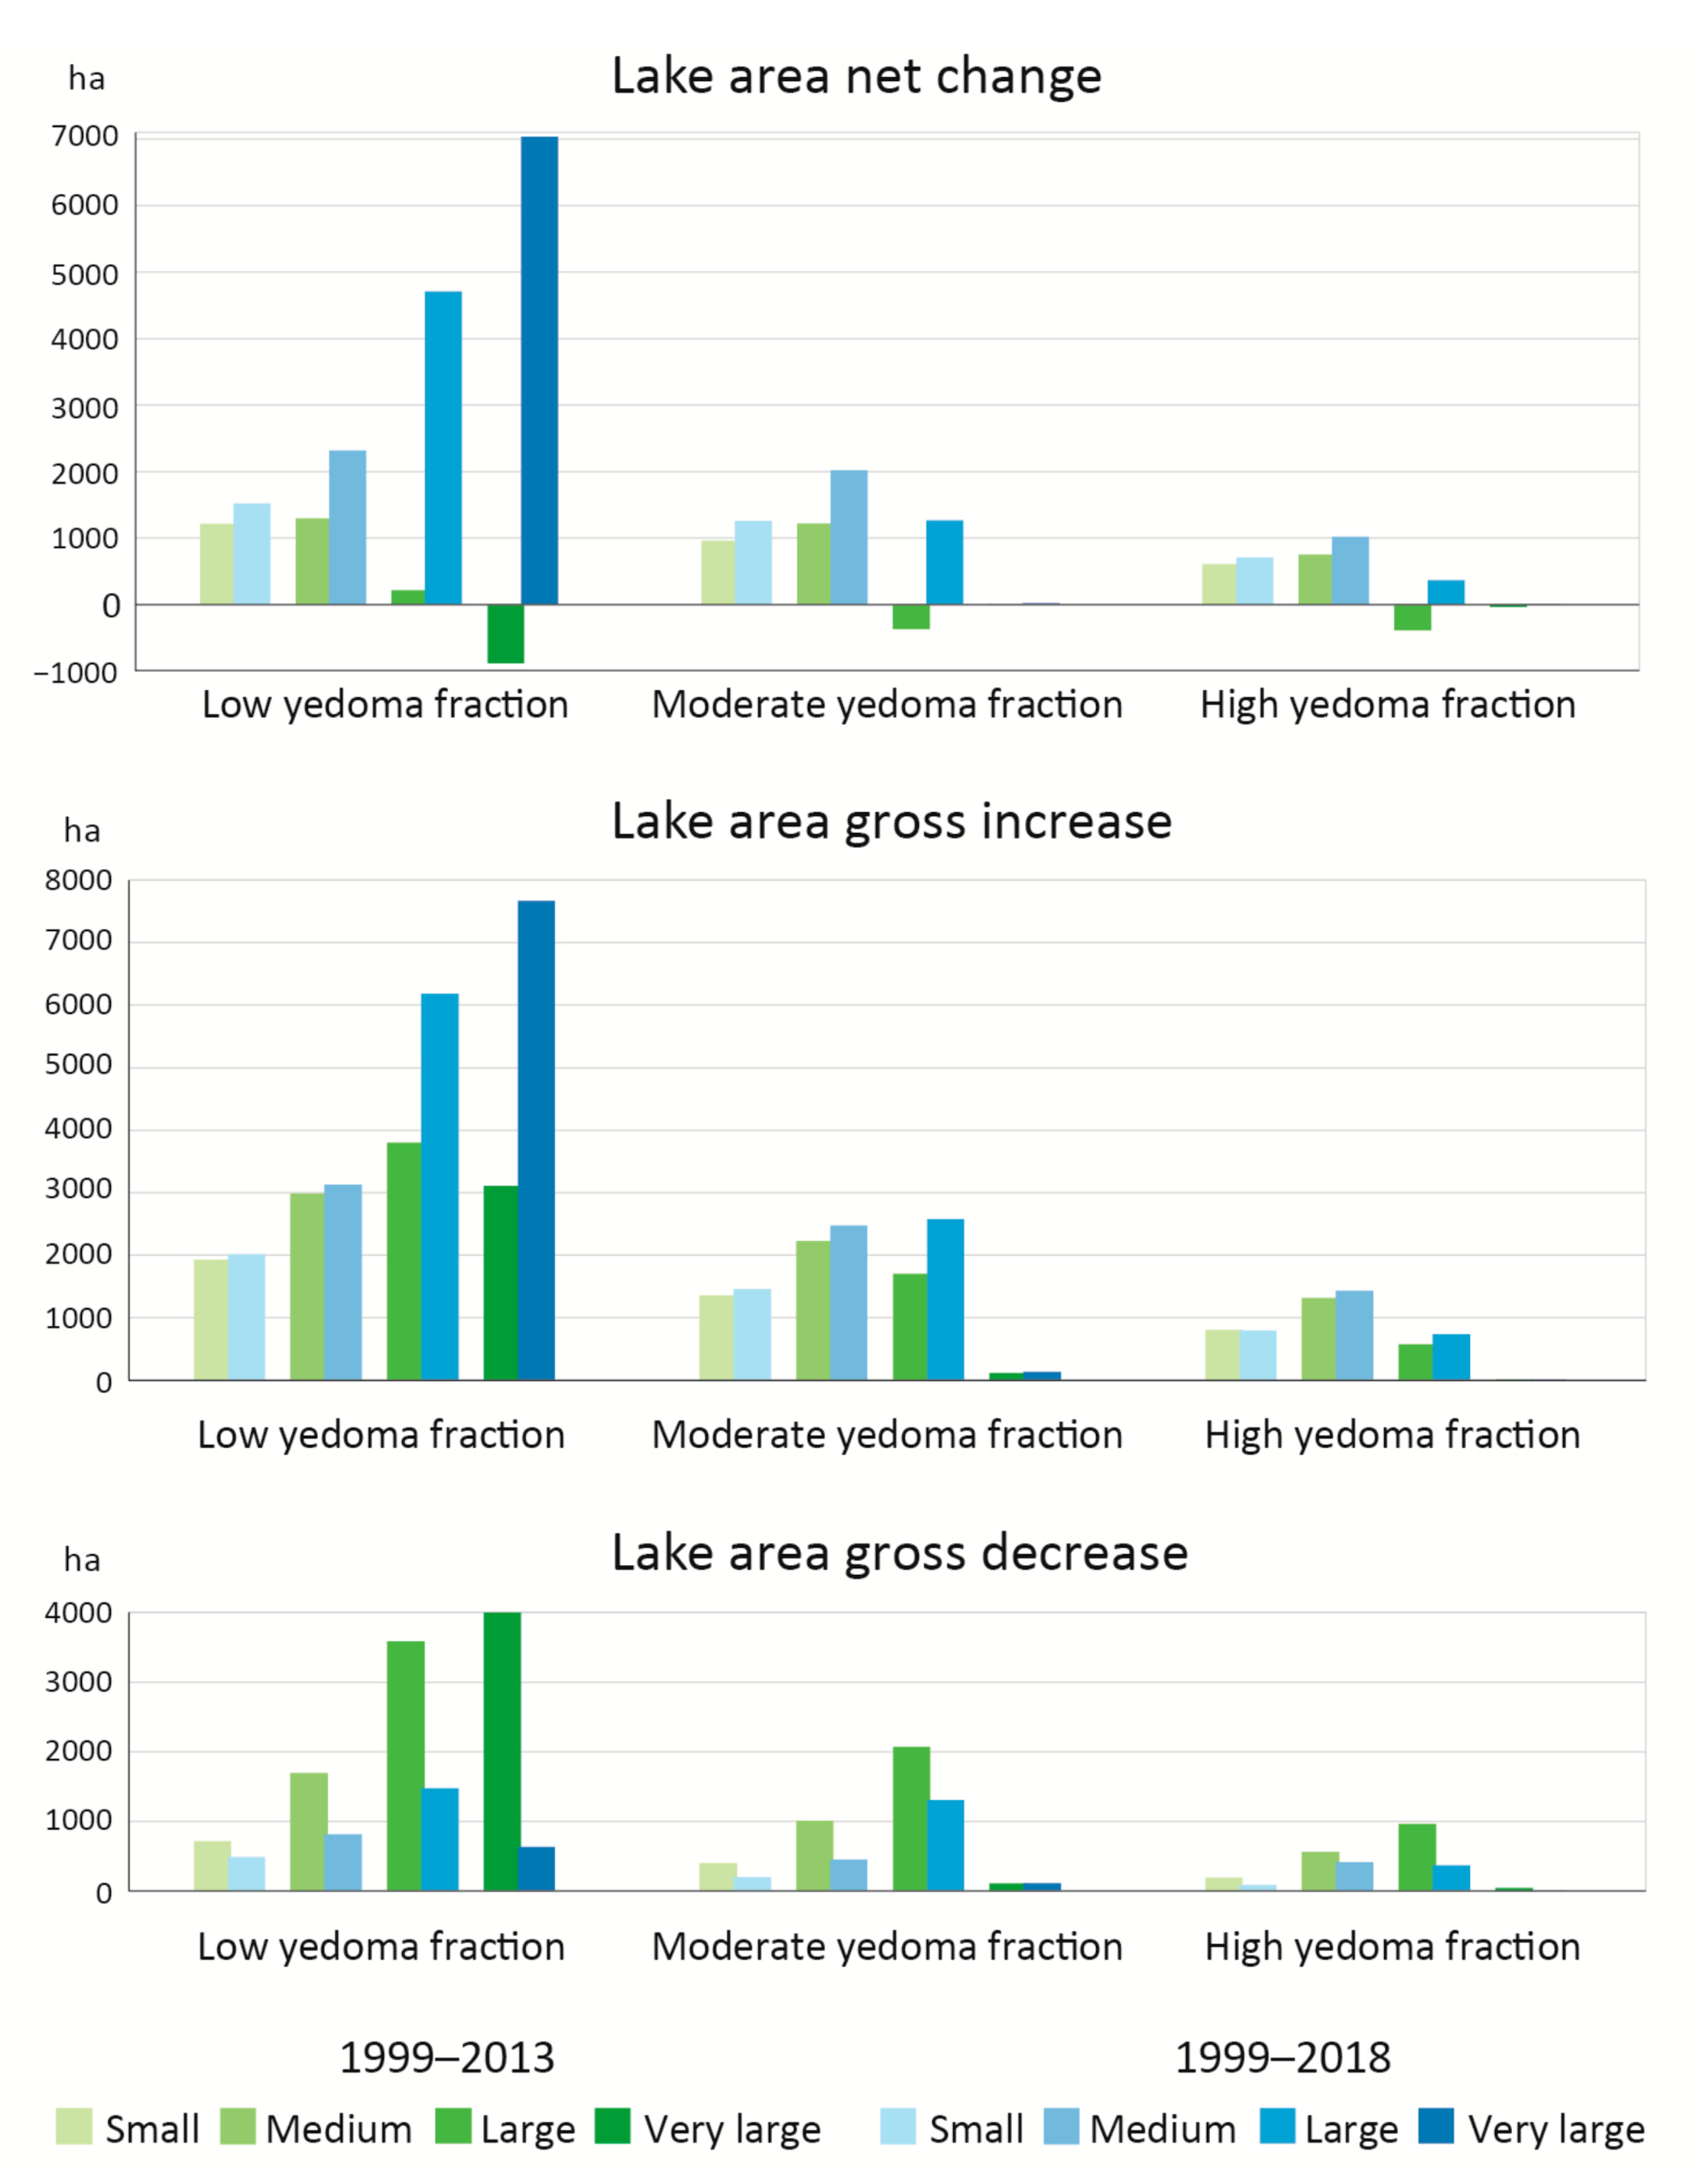
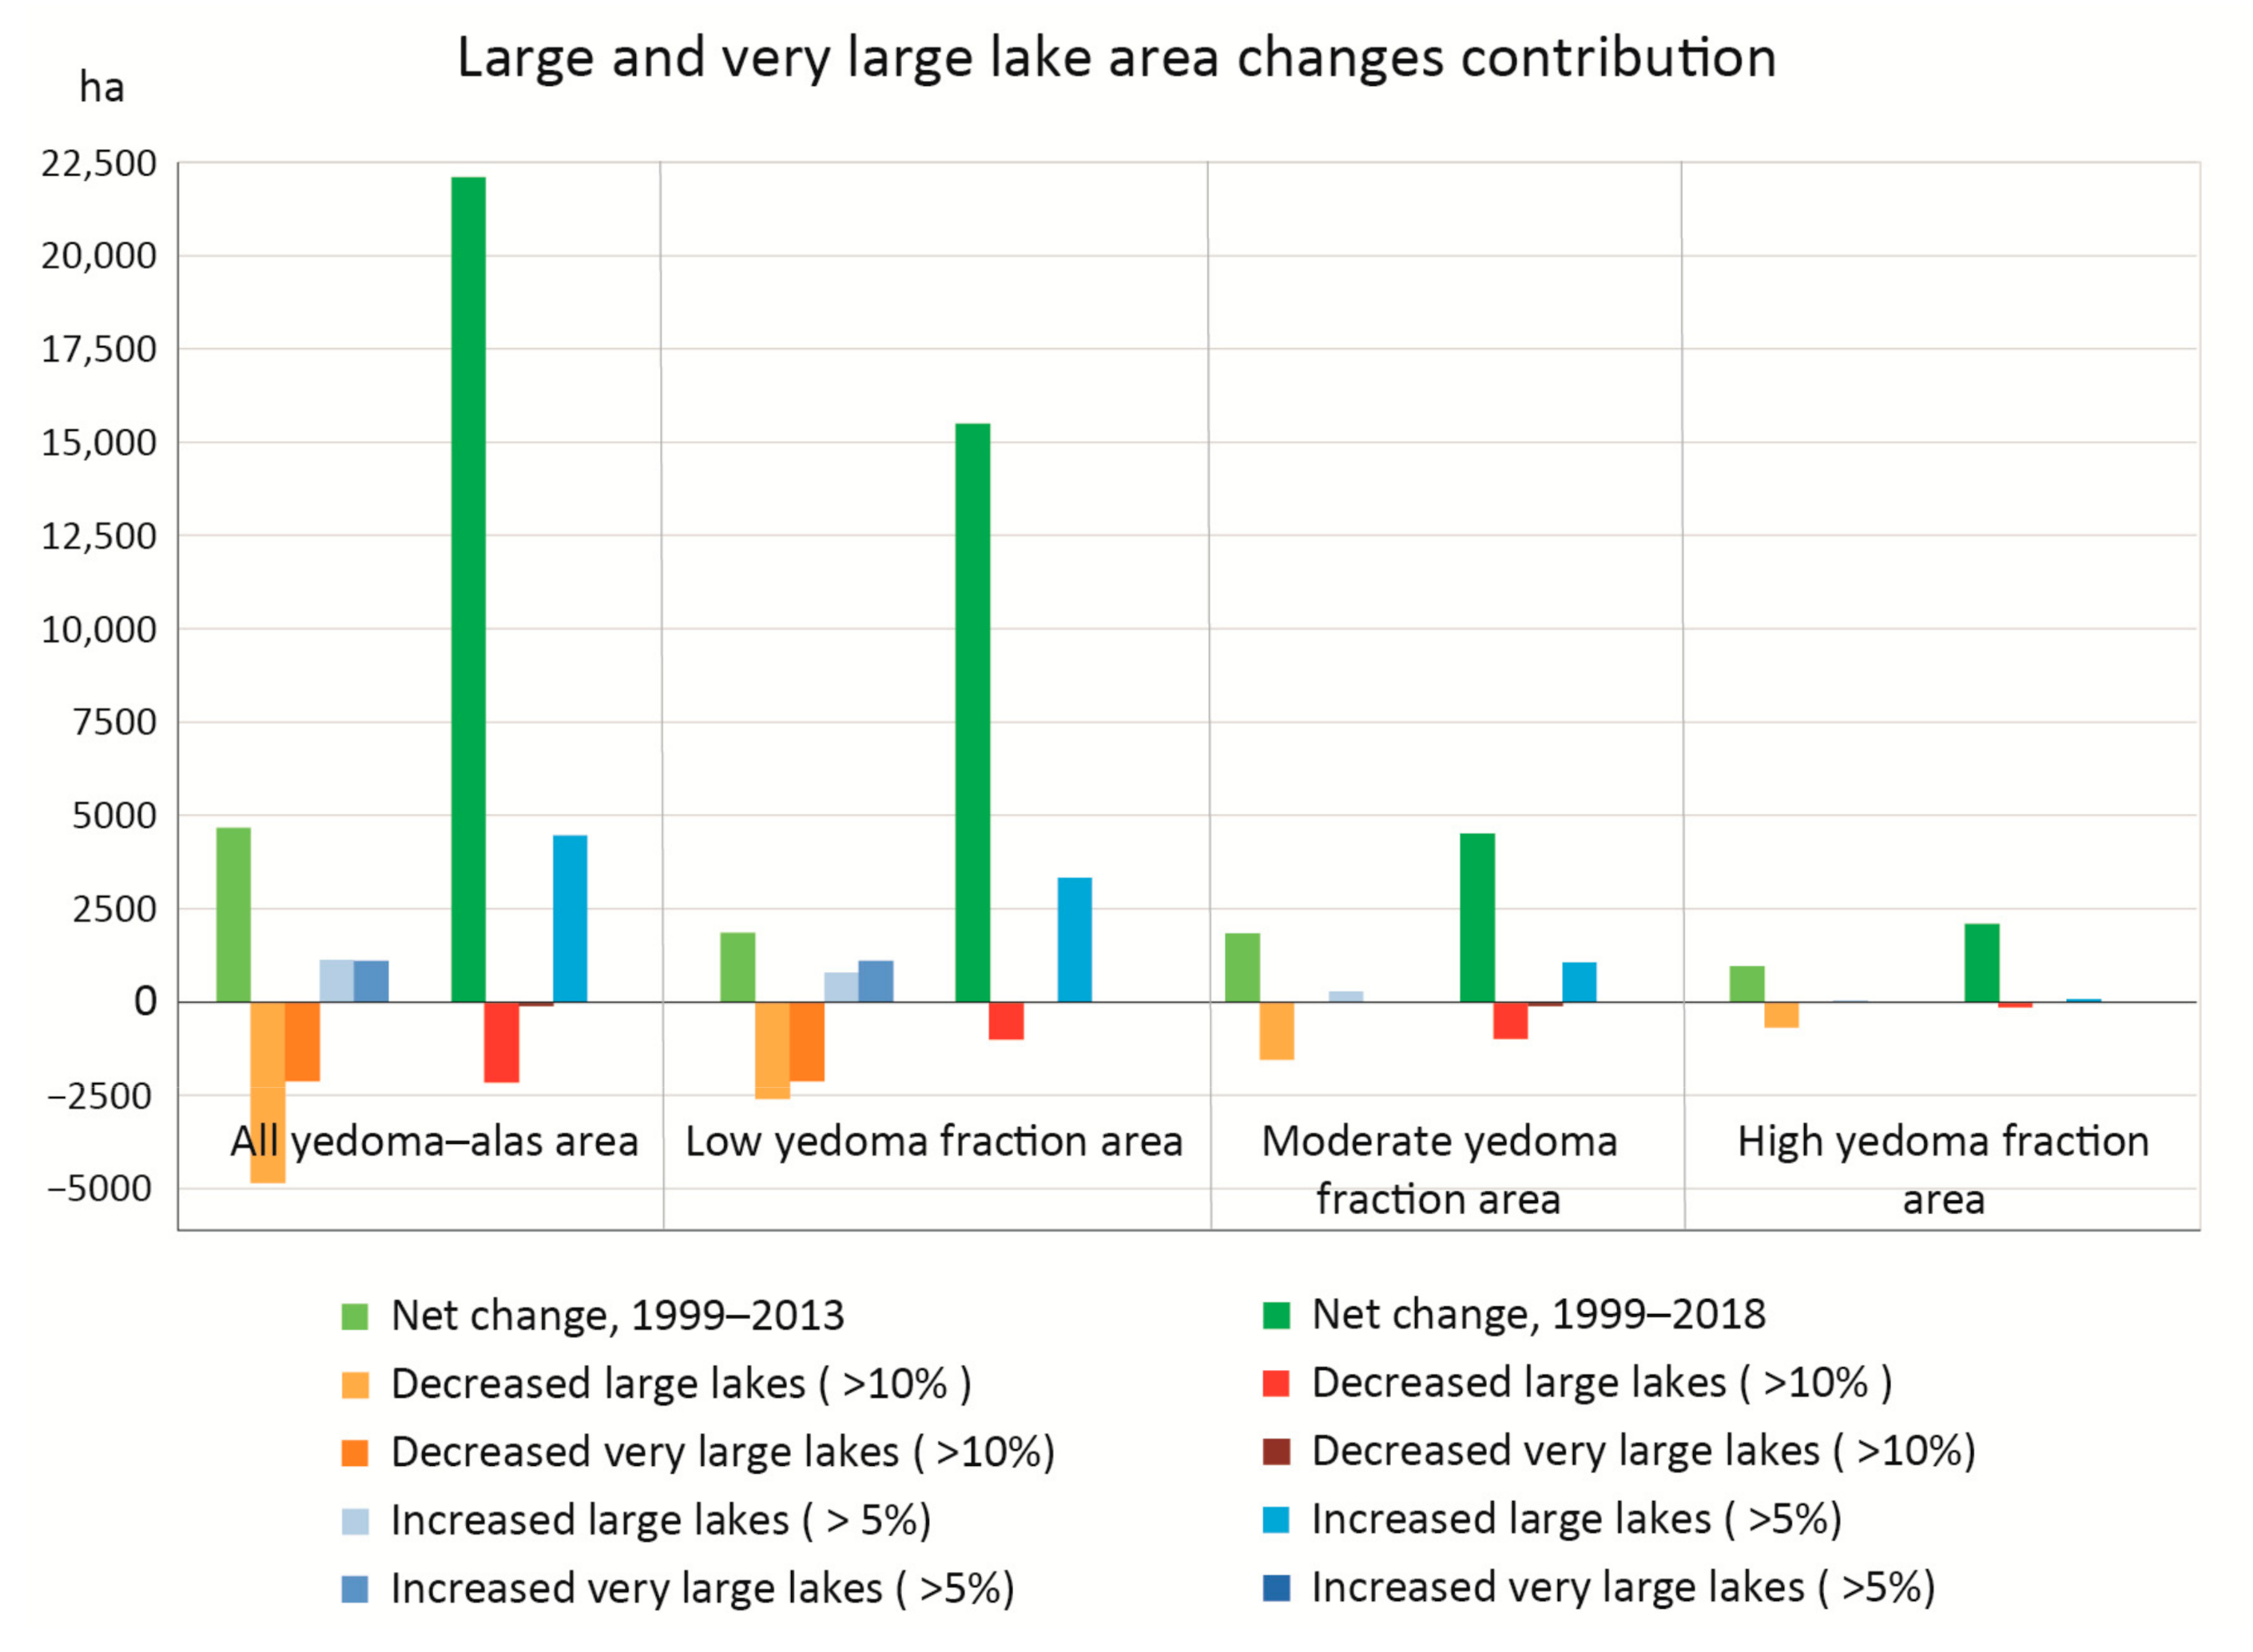
4.3.2. Lake Area Changes for 1999–2013 and 1999–2018 Analysis with Respect to Lake Size and Elevation Levels within the Yedoma–Alas Relief Types
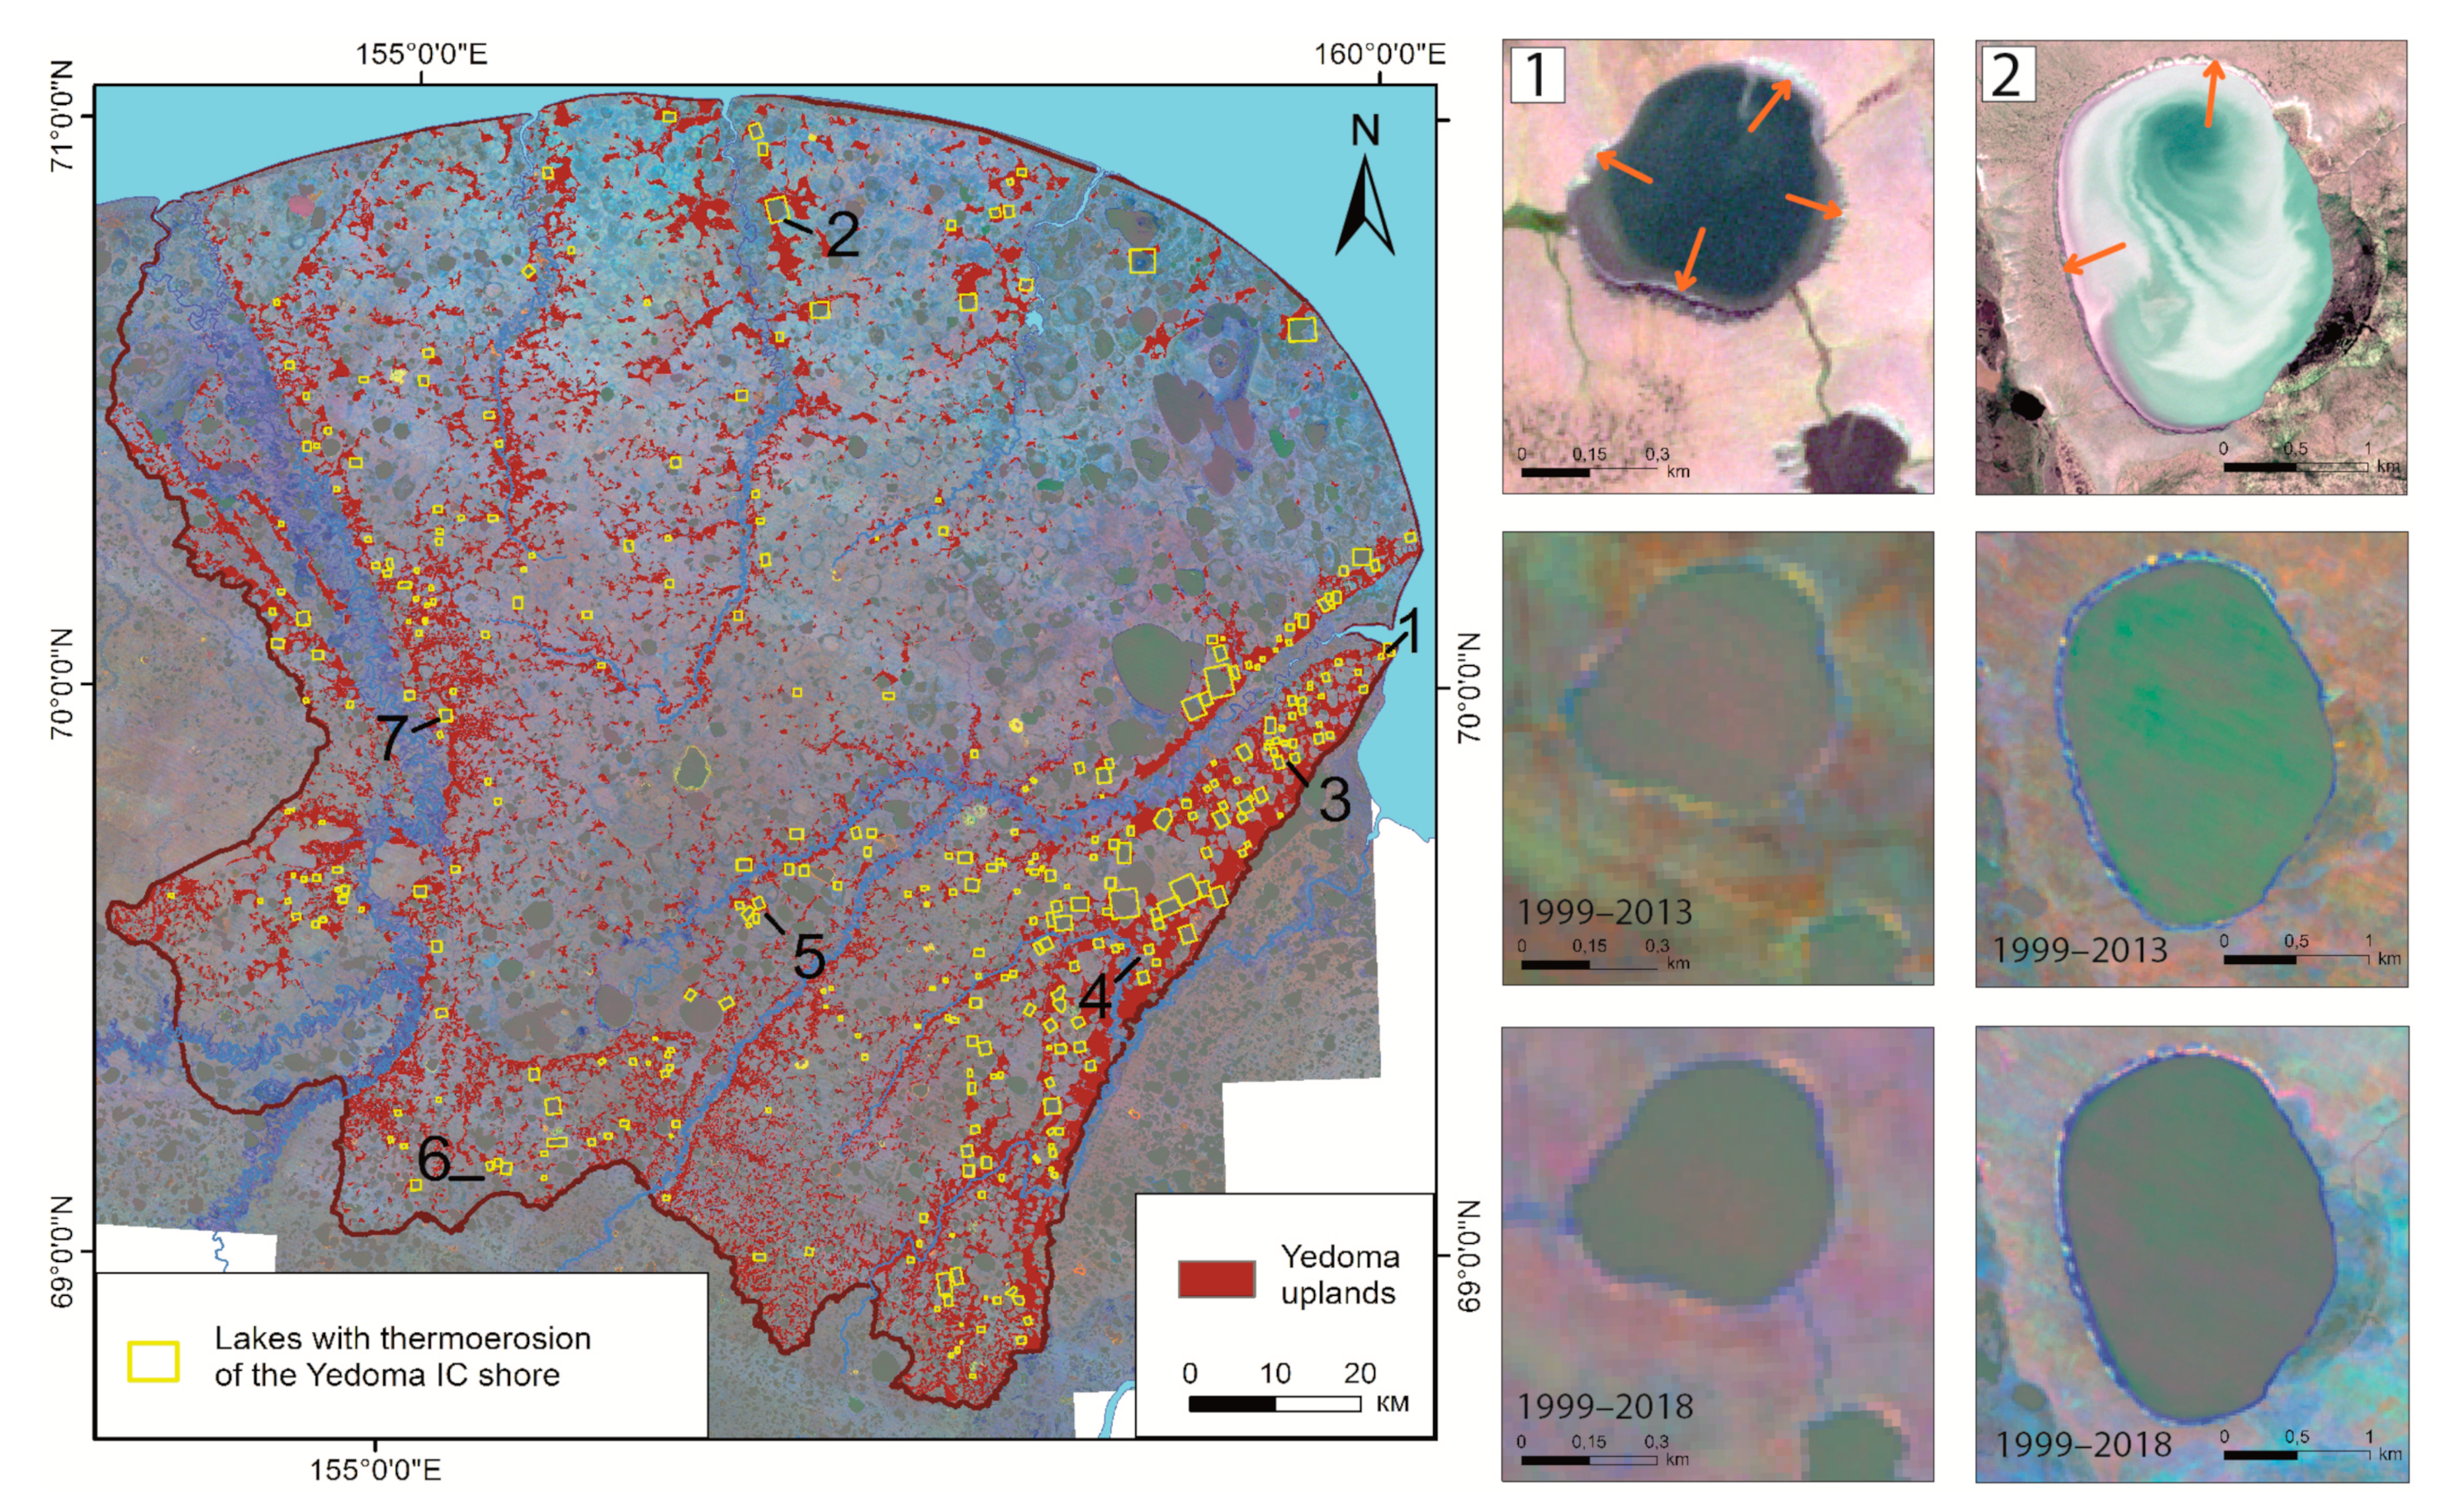
4.3.3. Detection of Thermal Erosion of Lake Shores Formed by Yedoma IC
5. Discussion
5.1. Yedoma–Alas Relief Types Formation
5.2. Comparison with Previous Data from Yedoma Regions
5.3. Factors of Modern Thermokarst Lake Dynamics and Potential for Future Thermokarst Development
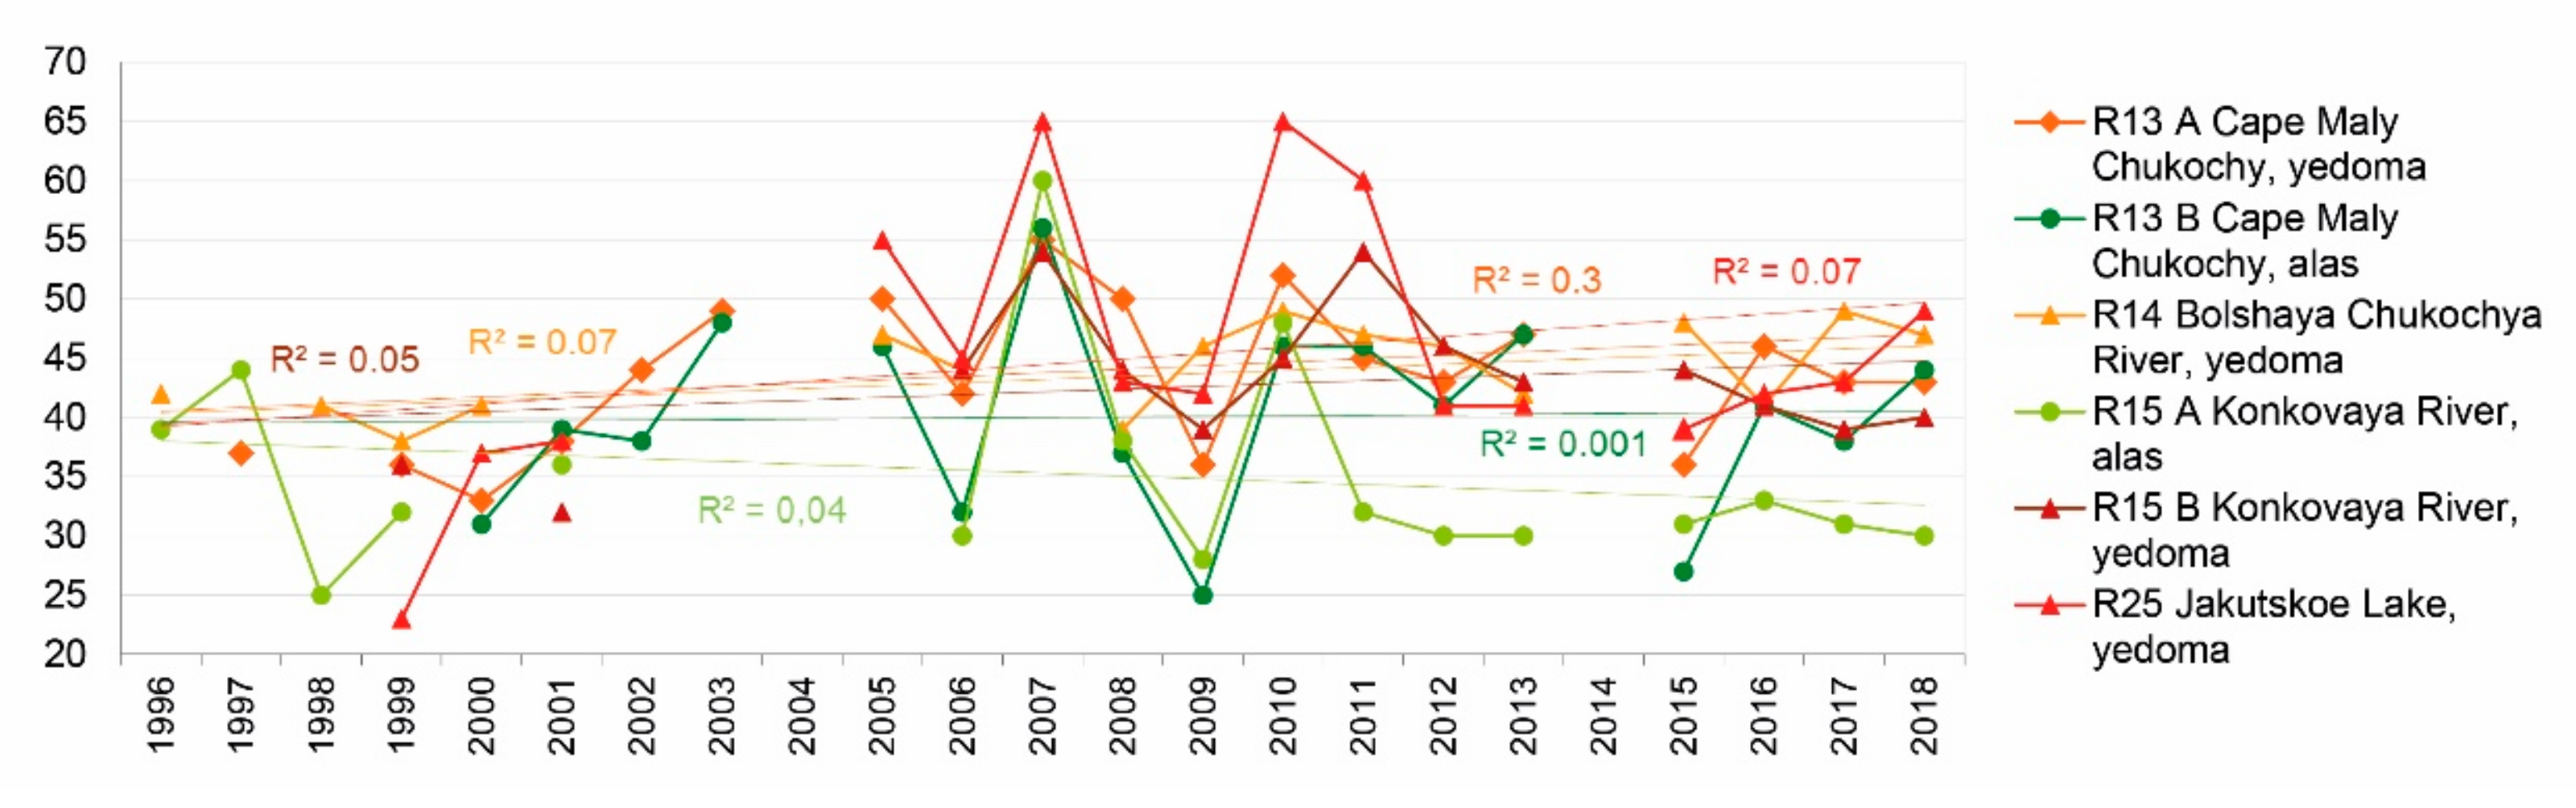
5.3.1. Climate Factors
5.3.2. Geomorphologic Factors of the Lake Area Changes
5.4. Potential for GHG Emissions Assessment
6. Conclusions
Author Contributions
Funding
Data Availability Statement
Acknowledgments
Conflicts of Interest
Appendix A


| Lake Area Decrease Group | Relief Types, Yedoma Fraction | Area Changes, ha (Decreased Lake Number) | |
|---|---|---|---|
| 1999–2013 | 1999–2018 | ||
| Large lakes (area decrease 10–100%) | All Low Moderate High | −4844.3 (34) −2603.3 (16) −1548.4 (11) −692.7 (7) | −2153.8 (14) −1013.8 (6) −988.8 (5) −151.2 (3) |
| Large lakes (area decrease 50–100%) | All Low Moderate High | −3972.4 (15) −2090.1 (7) −1345.3 (5) −537.0 (3) | −1810.4 (7) −792.7 (3) −917.2 (3) −100.6 (1) |
| Large lakes (area decrease 25–50%) | All Low Moderate High | −356.4 (5) −237.0 (2) −119.4 (3) - | −133.9 −96.2 - 37.6 (1) |
| Large lakes (area decrease 10–25%) | All Low Moderate High | −515.5 (14) −276.1 (7) −83.7 (3) −155.6 (4) | −209.5 (5) −124.8 (2) −71.6 (2) −13.0 (1) |
| Very large lakes (area decrease 10–25%) | All Low Moderate High | −2124.0 (3) −2124.0 (3) - - | −110.3 (1) - −110.3 (1) - |
| Lake Area Increase Group | Relief Types, Yedoma Fraction | Area Changes, ha (Decreased Lake Number) | |
|---|---|---|---|
| 1999–2013 | 1999–2018 | ||
| Large lakes (area increase > 5%) | All Low Moderate High | 1120.4 (74) 790.8 (50) 287.8 (20) 41.8 (4) | 4466.8 (136) 3332.4 (98) 1050.6 (33) 83.8 (5) |
| Large lakes (area increase >20 %) | All Low Moderate High | 35.6 (1) - 35.6 (1) - | 2166.4 (6) 1576.7 (4) 589.7 (2) - |
| Large lakes (area increase 10–20%) | All Low Moderate High | 200.5 (9) 122.8 (6) 77.6 (3) - | 368.9 (14) 355.4 (13) 13.4 (1) - |
| Large lakes (area increase 5–10%) | All Low Moderate High | 884.4 (64) 667.9 (44) 174.6 (16) 41.8 (4) | 1931.6 (116) 1400.2 (81) 447.5 (30) 83.8 (5) |
| Very large lakes (area increase >5%) | All Low Moderate High | 1087.9 (3) 1087.9 (3) - - | 5749.3 (7) 5749.3 (7) - - |
| Very large lakes (area increase >10–20%) | All Low Moderate High | 812.5 (1) 812.5 (1) | 4361.9 (3) 4361.9 (3) |
| Very large lakes (area increase >5–10%) | All Low Moderate High | 275.5 (2) 275.5 (2) | 1387.4 (4) 1387.4 (4) |
References
- Grosse, G.; Jones, B.M.; Arp, C.D. Thermokarst lakes, drainage, and drained basins. Treatise Geomorphol. 2013, 8, 325–353. [Google Scholar] [CrossRef]
- Olefeldt, D.; Goswami, S.; Grosse, G.; Hayes, D.; Hugelius, G.; Kuhry, P.; McGuire, A.D.; Romanovsky, V.E.; Sannel, A.B.; Schuur, E.A.; et al. Circumpolar distribution and carbon storage of thermokarst landscapes. Nat. Commun. 2016, 7, 13043. [Google Scholar] [CrossRef] [PubMed]
- Lehner, B.; Döll, P. Development and validation of a global database of lakes, reservoirs and wetlands. J. Hydrol. 2004, 296, 1–22. [Google Scholar] [CrossRef]
- Muster, S.; Roth, K.; Langer, M.; Lange, S.; Aleina, F.C.; Bartsch, A.; Morgenstern, A.; Grosse, G.; Jones, B.; Sannel, A.B.K.; et al. PeRL: A Circum-Arctic Permafrost Region Pond and Lake Database. Earth Syst. Sci. Data 2017, 9, 317–348. [Google Scholar] [CrossRef]
- Arp, C.D.; Jones, B.M.; Schmutz, J.A.; Urban, F.E.; Jorgenson, M.T. Two mechanisms of aquatic and terrestrial habitat change along an Alaskan Arctic coastline. Polar Biol. 2010, 33, 1629–1640. [Google Scholar] [CrossRef]
- Rautio, M.; Dufresne, F.; Laurion, I.; Bonilla, S.; Vincent, W.F.; Christoffersen, K.S. Shallow freshwater ecosystems of the circumpolar Arctic. Écoscience 2011, 18, 204–222. [Google Scholar] [CrossRef]
- Beaver, J.R.; Arp, C.D.; Tausz, C.E.; Jones, B.M.; Whitman, M.S.; Renicker, T.R.; Samples, E.E.; Ordosch, D.M.; Scotese, K.C. Potential shifts in zooplankton community structure in response to changing ice regimes and hydrologic connectivity. Arct. Antarct. Alp. Res. 2019, 51, 327–345. [Google Scholar] [CrossRef]
- Anthony, K.W.; Daanen, R.; Anthony, P.; von Deimling, T.S.; Ping, C.-L.; Chanton, J.P.; Grosse, G. Methane emissions proportional to permafrost carbon thawed in Arctic lakes since the 1950s. Nat. Geosci. 2016, 9, 679–682. [Google Scholar] [CrossRef]
- Anthony, K.W.; von Deimling, T.S.; Nitze, I.; Frolking, S.; Emond, A.; Daanen, R.; Anthony, P.; Lindgren, P.; Jones, B.; Grosse, G. 21st-century modeled permafrost carbon emissions accelerated by abrupt thaw beneath lakes. Nat. Commun. 2018, 9, 3262. [Google Scholar] [CrossRef]
- Heslop, J.K.; Anthony, K.M.W.; Winkel, M.; Sepulveda-Jauregui, A.; Martinez-Cruz, K.; Bondurant, A.; Grosse, G.; Liebner, S. A synthesis of methane dynamics in thermokarst lake environments. Earth Sci. Rev. 2020, 210, 103365. [Google Scholar] [CrossRef]
- Jorgenson, M.T.; Racine, C.H.; Walters, J.C.; Osterkamp, T.E. Permafrost Degradation and Ecological Changes Associated with a WarmingClimate in Central Alaska. Clim. Change 2001, 48, 551–579. [Google Scholar] [CrossRef]
- Grigoriev, M.N.; Kunitsky, V.V.; Chzhan, R.V.; Shepelev, V.V. On the variation in geocryological, landscape and hydrological conditions in the Arctic zone of East Siberia in connection with climate warming. Geogr. Nat. Resour. 2009, 30, 101–106. [Google Scholar] [CrossRef]
- Beck, I.; Ludwig, R.; Bernier, M.; Lévesque, E.; Boike, J. Assessing Permafrost Degradation and Land Cover Changes (1986–2009) using Remote Sensing Data over Umiujaq, Sub-Arctic Québec. Permafr. Periglac. Process. 2015, 26, 129–141. [Google Scholar] [CrossRef]
- Liljedahl, A.K.; Boike, J.; Daanen, R.P.; Fedorov, A.N.; Frost, G.V.; Grosse, G.; Hinzman, L.D.; Iijma, Y.; Jorgenson, J.C.; Matveyeva, N.; et al. Pan-Arctic ice-wedge degradation in warming permafrost and its influence on tundra hydrology. Nat. Geosci. 2016, 9, 312–318. [Google Scholar] [CrossRef]
- Jones, B.M.; Baughman, C.A.; Romanovsky, V.E.; Parsekian, A.D.; Babcock, E.L.; Stephani, E.; Jones, M.C.; Grosse, G.; Berg, E.E. Presence of rapidly degrading permafrost plateaus in south-central Alaska. Cryosphere 2016, 10, 2673–2692. [Google Scholar] [CrossRef]
- Farquharson, L.M.; Romanovsky, V.E.; Cable, W.L.; Walker, D.A.; Kokelj, S.V.; Nicolsky, D. Climate Change Drives Widespread and Rapid Thermokarst Development in Very Cold Permafrost in the Canadian High Arctic. Geophys. Res. Lett. 2019, 46, 6681–6689. [Google Scholar] [CrossRef]
- Plug, L.J.; Walls, C.; Scott, B.M. Tundra lake changes from 1978 to 2001 on the Tuktoyaktuk Peninsula, western Canadian Arctic. Geophys. Res. Lett. 2008, 35. [Google Scholar] [CrossRef]
- Jones, B.M.; Grosse, G.; Arp, C.D.; Jones, M.C.; Anthony, K.M.W.; Romanovsky, V.E. Modern thermokarst lake dynamics in the continuous permafrost zone, northern Seward Peninsula, Alaska. J. Geophys. Res. Biogeosciences 2011, 116. [Google Scholar] [CrossRef]
- Karlsson, J.M.; Lyon, S.W.; Destouni, G. Thermokarst lake, hydrological flow and water balance indicators of permafrost change in Western Siberia. J. Hydrol. 2012, 464–465, 459–466. [Google Scholar] [CrossRef]
- Lantz, T.C.; Turner, K.W. Changes in lake area in response to thermokarst processes and climate in Old Crow Flats, Yukon. J. Geophys. Res. Biogeosciences 2015, 120, 513–524. [Google Scholar] [CrossRef]
- Kravtsova, V.I.; Rodionova, T.V. Variations in size and number of thermokarst lakes in different permafrost regions: Spaceborne evidence. Earths Cryosphere 2016, 20, 75–81. [Google Scholar]
- Nitze, I.; Grosse, G.; Jones, B.M.; Arp, C.D.; Ulrich, M.; Fedorov, A.; Veremeeva, A. Landsat-Based Trend Analysis of Lake Dynamics across Northern Permafrost Regions. Remote Sens. 2017, 9, 640. [Google Scholar] [CrossRef]
- Nitze, I.; Grosse, G.; Jones, B.M.; Romanovsky, V.E.; Boike, J. Remote sensing quantifies widespread abundance of permafrost region disturbances across the Arctic and Subarctic. Nat. Commun. 2018, 9, 5423. [Google Scholar] [CrossRef] [PubMed]
- Hinkel, K.M.; Sheng, Y.; Lenters, J.D.; Lyons, E.A.; Beck, R.A.; Eisner, W.R.; Wang, J. Thermokarst Lakes on the Arctic Coastal Plain of Alaska: Geomorphic Controls on Bathymetry. Permafr. Periglac. Process. 2012, 23, 218–230. [Google Scholar] [CrossRef]
- Arp, C.D.; Whitman, M.S.; Jones, B.M.; Kemnitz, R.; Grosse, G.; Urban, F.E. Drainage Network Structure and Hydrologic Behavior of Three Lake-Rich Watersheds on the Arctic Coastal Plain, Alaska. Arct. Antarct. Alp. Res. 2012, 44, 385–398. [Google Scholar] [CrossRef]
- Jones, B.M.; Arp, C.D. Observing a Catastrophic Thermokarst Lake Drainage in Northern Alaska. Permafr. Periglac. Process. 2015, 26, 119–128. [Google Scholar] [CrossRef]
- Günther, F.; Overduin, P.P.; Yakshina, I.A.; Opel, T.; Baranskaya, A.V.; Grigoriev, M.N. Observing Muostakh disappear: Permafrost thaw subsidence and erosion of a ground-ice-rich island in response to arctic summer warming and sea ice reduction. Cryosphere 2015, 9, 151–178. [Google Scholar] [CrossRef]
- Yoshikawa, K.; Hinzman, L.D. Shrinking thermokarst ponds and groundwater dynamics in discontinuous permafrost near council, Alaska. Permafr. Periglac. Process. 2003, 14, 151–160. [Google Scholar] [CrossRef]
- Jones, B.M.; Arp, C.D.; Hinkel, K.M.; Beck, R.A.; Schmutz, J.A.; Winston, B. Arctic Lake Physical Processes and Regimes with Implications for Winter Water Availability and Management in the National Petroleum Reserve Alaska. Environ. Manag. 2009, 43, 1071–1084. [Google Scholar] [CrossRef]
- Donchyts, G.; Baart, F.; Winsemius, H.; Gorelick, N.; Kwadijk, J.; van de Giesen, N. Earth’s surface water change over the past 30 years. Nat. Clim. Change 2016, 6, 810–813. [Google Scholar] [CrossRef]
- Pekel, J.-F.; Cottam, A.; Gorelick, N.; Belward, A.S. High-resolution mapping of global surface water and its long-term changes. Nature 2016, 540, 418–422. [Google Scholar] [CrossRef] [PubMed]
- Riordan, B.; Verbyla, D.; McGuire, A.D. Shrinking ponds in subarctic Alaska based on 1950–2002 remotely sensed images. J. Geophys. Res. Biogeosciences 2006, 111. [Google Scholar] [CrossRef]
- Nitze, I.; Cooley, S.; Duguay, C.; Jones, B.M.; Grosse, G. The catastrophic thermokarst lake drainage events of 2018 in northwestern Alaska: Fast-forward into the future. Cryosphere Discuss. 2020, 1–33. [Google Scholar] [CrossRef]
- Elsakov, V.V.; Maruchshak, I.O. Interannual changes of thermokarst lakes in the north-east part of European Russia. Earth Obs. Remote Sens. 2011, 4, 1–13. [Google Scholar]
- Rodionova, T.V. Study of Thermokarst Lake Dynamics in Various Regions of the Russian Permafrost Zone Using Satellite Images. Ph.D. Thesis, Lomonosov Moscow State University, Moscow, Russia, 2013. [Google Scholar]
- Tarasenko, T.V. Interannual variations in the areas of thermokarst lakes in Central Yakutia. Water Resour. 2013, 40, 111–119. [Google Scholar] [CrossRef]
- Boike, J.; Grau, T.; Heim, B.; Günther, F.; Langer, M.; Muster, S.; Gouttevin, I.; Lange, S. Satellite-derived changes in the permafrost landscape of central Yakutia, 2000–2011: Wetting, drying, and fires. Glob. Planet. Change 2016, 139, 116–127. [Google Scholar] [CrossRef]
- Ulrich, M.; Matthes, H.; Schirrmeister, L.; Schütze, J.; Park, H.; Iijima, Y.; Fedorov, A.N. Differences in behavior and distribution of permafrost-related lakes in Central Yakutia and their response to climatic drivers. Water Resour. Res. 2017, 53, 1167–1188. [Google Scholar] [CrossRef]
- Luo, J.; Niu, F.; Lin, Z.; Liu, M.; Yin, G. Thermokarst lake changes between 1969 and 2010 in the Beilu River Basin, Qinghai–Tibet Plateau, China. Sci. Bull. 2015, 60, 556–564. [Google Scholar] [CrossRef]
- Tarasenko, T.V.; Kravtsova, V.I.; Pizhankova, E.I. Study of thermokarst lakes dynamics in the coastal part of the Yana-Indigirka Lowland using remote data. In Proceedings of the Conference Geocryological Mapping: Problems and Prospects, Moscow, Russia, 5–6 June 2013; pp. 135–138. [Google Scholar]
- Veremeeva, A.A. The Formation and Modern Dynamic of the Thermokarst Relief Using RS Data on the Kolyma Lowland Tundra. Ph.D. Thesis, Institute of Geography, Russian Academy of Sciences, Moscow, Russia, 2017. [Google Scholar]
- Strauss, J.; Schirrmeister, L.; Grosse, G.; Fortier, D.; Hugelius, G.; Knoblauch, C.; Romanovsky, V.; Schädel, C.; von Deimling, T.S.; Schuur, E.A.G.; et al. Deep Yedoma permafrost: A synthesis of depositional characteristics and carbon vulnerability. Earth Sci. Rev. 2017, 172, 75–86. [Google Scholar] [CrossRef]
- Strauss, J.; Schirrmeister, L.; Grosse, G.; Wetterich, S.; Ulrich, M.; Herzschuh, U.; Hubberten, H.-W. The deep permafrost carbon pool of the Yedoma region in Siberia and Alaska. Geophys. Res. Lett. 2013, 40, 6165–6170. [Google Scholar] [CrossRef]
- Shmelev, D.; Veremeeva, A.; Kraev, G.; Kholodov, A.; Spencer, R.G.M.; Walker, W.S.; Rivkina, E. Estimation and Sensitivity of Carbon Storage in Permafrost of North-Eastern Yakutia. Permafr. Periglac. Process. 2017, 28, 379–390. [Google Scholar] [CrossRef]
- Wik, M.; Varner, R.K.; Anthony, K.W.; MacIntyre, S.; Bastviken, D. Climate-sensitive northern lakes and ponds are critical components of methane release. Nat. Geosci. 2016, 9, 99–105. [Google Scholar] [CrossRef]
- Weiss, N.; Blok, D.; Elberling, B.; Hugelius, G.; Jørgensen, C.J.; Siewert, M.B.; Kuhry, P. Thermokarst dynamics and soil organic matter characteristics controlling initial carbon release from permafrost soils in the Siberian Yedoma region. Sediment. Geol. 2016, 340, 38–48. [Google Scholar] [CrossRef]
- Stapel, J.G.; Schwamborn, G.; Schirrmeister, L.; Horsfield, B.; Mangelsdorf, K. Substrate potential of last interglacial to Holocene permafrost organic matter for future microbial greenhouse gas production. Biogeosciences 2018, 15, 1969–1985. [Google Scholar] [CrossRef]
- Dean, J.F.; Meisel, O.H.; Rosco, M.M.; Marchesini, L.B.; Garnett, M.H.; Lenderink, H.; van Logtestijn, R.; Borges, A.V.; Bouillon, S.; Lambert, T.; et al. East Siberian Arctic inland waters emit mostly contemporary carbon. Nat. Commun. 2020, 11, 1627. [Google Scholar] [CrossRef] [PubMed]
- Trush, N.I.; Kondratyeva, K.A. Composition and properties of the upper Pleistocene deposits, Yana-Indigirka coastal Lowland. MSU Bull. 1975, 5, 72–86. [Google Scholar]
- Romanovsky, N.N. Formation of the Polygonal-Wedge Structures; Nauka: Novosibirsk, Russia, 1977; 215p. [Google Scholar]
- Ulrich, M.; Grosse, G.; Strauss, J.; Schirrmeister, L. Quantifying Wedge-Ice Volumes in Yedoma and Thermokarst Basin Deposits. Permafr. Periglac. Process. 2014, 25, 151–161. [Google Scholar] [CrossRef]
- Kaplina, T.N. Alas complexes of northern Yakutia. Kriosfera Zemli 2009, 13, 3–17. [Google Scholar]
- Veremeeva, A.A.; Glushkova, N.V. Relief formation in the regions of the Ice Complex deposit occurrence: Remote sensing and GIS-studies in the Kolyma Lowland tundra. Earths Cryosphere 2016, 20, 14–24. [Google Scholar]
- Morgenstern, A.; Overduin, P.P.; Günther, F.; Stettner, S.; Ramage, J.; Schirrmeister, L.; Grigoriev, M.N.; Grosse, G. Thermo-erosional valleys in Siberian ice-rich permafrost. Permafr. Periglac. Process. 2020, 1–17. [Google Scholar] [CrossRef]
- Bosikov, N.P. Alas Evolution in Central Yakutia; Melnikov Permafrost Institute, Siberian Branch, Russian Academy of Sciences: Yakutsk, Russia, 1991; p. 128. [Google Scholar]
- Hinkel, K.M.; Frohn, R.C.; Nelson, F.E.; Eisner, W.R.; Beck, R.A. Morphometric and spatial analysis of thaw lakes and drained thaw lake basins in the western Arctic Coastal Plain, Alaska. Permafr. Periglac. Process. 2005, 16, 327–341. [Google Scholar] [CrossRef]
- Jorgenson, M.T.; Shur, Y. Evolution of lakes and basins in northern Alaska and discussion of the thaw lake cycle. J. Geophys. Res. Earth Surf. 2007, 112. [Google Scholar] [CrossRef]
- West, J.J.; Plug, L.J. Time-dependent morphology of thaw lakes and taliks in deep and shallow ground ice. J. Geophys. Res. Earth Surf. 2008, 113. [Google Scholar] [CrossRef]
- Marsh, P.; Russell, M.; Pohl, S.; Haywood, H.; Onclin, C. Changes in thaw lake drainage in the Western Canadian Arctic from 1950 to 2000. Hydrol. Process. 2009, 23, 145–158. [Google Scholar] [CrossRef]
- Chen, M.; Rowland, J.C.; Wilson, C.J.; Altmann, G.L.; Brumby, S.P. Temporal and spatial pattern of thermokarst lake area changes at Yukon Flats, Alaska. Hydrol. Process. 2012, 28, 837–852. [Google Scholar] [CrossRef]
- Fedorov, A.N.; Gavriliev, P.P.; Konstantinov, P.Y.; Hiyama, T.; Iijima, Y.; Iwahana, G. Estimating the water balance of a thermokarst lake in the middle of the Lena River basin, eastern Siberia. Ecohydrology 2014, 7, 188–196. [Google Scholar] [CrossRef]
- Jepsen, S.M.; Voss, C.I.; Walvoord, M.A.; Minsley, B.J.; Rover, J. Linkages between lake shrinkage/expansion and sublacustrine permafrost distribution determined from remote sensing of interior Alaska, USA. Geophys. Res. Lett. 2013, 40, 882–887. [Google Scholar] [CrossRef]
- Fuchs, M.; Grosse, G.; Strauss, J.; Günther, F.; Grigoriev, M.; Maximov, G.M.; Hugelius, G. Carbon and nitrogen pools in thermokarst-affected permafrost landscapes in Arctic Siberia. Biogeosciences 2018, 15, 953–971. [Google Scholar] [CrossRef]
- Kravtsova, V.I.; Tarasenko, T.V. The Dynamics of thermokarst lakes under climate change since 1950 in the Central Yakutia. Kriosfera Zemli 2011, 15, 31–42. [Google Scholar]
- Labrecque, S.; Lacelle, D.; Duguay, C.R.; Lauriol, B.; Hawkings, J. Contemporary (1951–2001) Evolution of Lakes in the Old Crow Basin, Northern Yukon, Canada: Remote Sensing, Numerical Modeling, and Stable Isotope Analysis. Arctic 2009, 62, 225–238. [Google Scholar] [CrossRef]
- Andresen, C.G.; Lougheed, V.L. Disappearing Arctic tundra ponds: Fine-scale analysis of surface hydrology in drained thaw lake basins over a 65 year period (1948–2013). J. Geophys. Res. Biogeosciences 2015, 120, 466–479. [Google Scholar] [CrossRef]
- Spector, V.B. Quaternary deposits of the coastal lowland (Khallerchin tundra). In The Cenozoic of East Yakutia; Yakut. fi l. SO AN SSSR: Yakutsk, Russia, 1980; pp. 87–97. [Google Scholar]
- Kaplina, T.N.; Lakhtina, O.V.; Rybakova, N.O. History of the Landscape Evolution of the Kolyma Lowland Deposits Based on Radiocarbon and Palinological Data (Stanchikovsky Yar Outcrop, Anuy River); Nauka: Moscow, Russia, 1980. [Google Scholar]
- Balandin, V.A. A comprehensive study of neotectonics of the closed areas (by the example of the Yana-Kolyma Lowland). In Cenozoic of Eastern Yakutia; Yakut. Fil. AN SO SSSR: Yakutsk, Russia, 1980; pp. 131–137. [Google Scholar]
- State Geological Map of the Russian Federation. Map of Quaternary Formations. Sheet R-(55)-57 (Niznekolymsk); VSEGEI: Saint Petersburg, Russia, 2000.
- Sher, A.V. Pleistocene Mammals and Stratigraphy of the Far Northeast of the USSR and North America; Nauka: Moscow, Russia, 1971. [Google Scholar]
- Sher, A.V.; Kaplina, T.N.; Ovander, M.G. Regional stratigraphic scheme of Quaternary deposits of the Yana-Kolyma Lowland and surrounding mountains. In Explanatory Note to the Regional Schemes for Quaternary Deposits in the East of the USSR. Decisions of the Interdepartmental Stratigraphic Conference for Quaternary System in the East of the USSR; Shilo, N.A., Ed.; SVKNII DVO AN SSSR: Magadan, Russia, 1987; pp. 29–69. [Google Scholar]
- Arkhangelov, A.A. Subsurface glaciation of the northern Kolyma Lowland. Probl. Cryolithology 1977, 6, 26–58. [Google Scholar]
- Arkhangelov, A.A.; Kuznetsova, T.P.; Kartashova, G.G.; Konyakhin, M.A. Genesis and depositional environment during the accumulation of Upper Pleistocene ice-rich silts in the Kolyma Lowland (a case study of the Chukochy Yar). Probl. Cryolithology 1979, 8, 110–135. [Google Scholar]
- Sher, A.V.; Kaplina, T.N.; Giterman, R.E.; Lozhkin, A.V.; Arkhangelov, A.A.; Kiselyov, S.V.; Kuznetsov, Y.V.; Viriba, E.I.; Zazhigin, V.S. Late Cenozoic of the Kolyma Lowland: XIV Pacific Science Congress, Tour Guide XI. In Proceedings of the 14th Pacific Science Congress, Khabarovsk, Russia, 24 August–1 September 1979; pp. 1–116. [Google Scholar]
- Kaplina, T.N. History of permafrost in Northern Yakutia during the late Cenozoic. In History of the Development of Perennial Frozen Deposits in Eurasia; Nauka: Moscow, Russia, 1981; pp. 153–181. [Google Scholar]
- Kaplina, T.N.; Lakhtina, O.V.; Rybakova, N.O. Cenozoic deposits in the middle reaches of the Alazeya River (Kolyma Lowland). Izvestiya Akademik Nauk SSSR Seriya Geologicheskaya 1981, 8, 51–63. [Google Scholar]
- Rivkina, E.M.; Kraev, G.N.; Krivushin, K.V.; Laurinavichus, K.S.; Fyodorov’Davydov, D.G.; Kholodov, A.V.; Shcherbakova, V.A.; Gilichinsky, D.A. Methane in the perennially frozen deposits of the Arctic NE sector. Kriosfera Zemli 2006, 10, 23–41. [Google Scholar]
- Soloviev, P.A. The Cryolithozone in the Northern Part of the Lena-Amga-Interfluve; Academy of Science of the USSR: Moscow, Russia, 1959. [Google Scholar]
- Tomirdiaro, S.V. Loess-Ice Formation of Eastern Siberia in the Late Pleistocene and Holocene; Nauka: Moscow, Russia, 1980. [Google Scholar]
- Tumskoy, V.E. Peculiarities of cryolithogenesis in northern Yakutia from the Middle Neopleistocene to the Holocene. Kriosphera Zemli 2012, 16, 12–21. [Google Scholar]
- Schirrmeister, L.; Froese, D.; Tumskoy, V.; Grosse, G.; Wetterich, S. Yedoma: Late Pleistocene Ice-Rich Syngenetic Permafrost of Beringia. In Encyclopedia of Quaternary Science, 2nd ed.; Elias, S.A., Mock, C.J., Eds.; Elsevier: Amsterdam, The Netherlands, 2013; pp. 542–552. [Google Scholar] [CrossRef]
- Wetterich, S.; Rudaya, N.; Kuznetsov, V.; Maksimov, F.; Opel, T.; Meyer, H.; Günther, F.; Bobrov, A.; Raschke, E.; Zimmermann, H.H.; et al. Ice Complex formation on Bol’shoy Lyakhovsky Island (New Siberian Archipelago, East Siberian Arctic) since about 200 ka. Quat. Res. 2019, 92, 530–548. [Google Scholar] [CrossRef]
- Schirrmeister, L.; Siegert, C.; Kunitzky, V.V.; Grootes, P.M.; Erlenkeuser, H. Late Quaternary ice-rich permafrost sequences as a paleoenvironmental archive for the Laptev Sea Region in northern Siberia. Int. J. Earth Sci. 2002, 91, 154–167. [Google Scholar] [CrossRef]
- Romanovsky, N.N. Erosion-thermokarst basins in the northern coastal plains of Yakutia and New Siberian islands. Merzlotnuye Issledovaniya 1961, 1, 124–144. [Google Scholar]
- Plakht, I.R. Conditions for the Development of Thermokarst and Stages of the Formation of Alas Relief of the NE Eurasian Plains in the Late Pleistocene and Holocene; Nauka: Moscow, Russia, 1985. [Google Scholar]
- Kaplina, T.N.; Kostalyndina, N.K.; Leibman, M.О. Analysis of the Kolyma river lower stream relief in order to cryolythological mapping. In Forming of the Permafrost Deposits and Forecast of the Cryogenic Processes; Nauka: Moscow, Russia, 1986; pp. 51–60. [Google Scholar]
- Kaplina, T.N.; Lozhkin, A.V. Age of alas deposits of the coastal plain of Yakutia (radiocarbon substantiation). Izvestiya Akademik Nauk SSSR Seriya Geologicheskaya 1979, 2, 69–76. [Google Scholar]
- Baranova, Y.P. An essay on geomorphology of eastern part of the Kolyma Lowland. In Materials on Geology and Mineral Resources of the NE of the USSR; Knizhnoye izdatelstvo (Magadan Publishing House): Magadan, Russia, 1957; Volume 11, pp. 208–222. [Google Scholar]
- Lakhtina, O.V.; Koreysha, M.M. Levels of accumulation and cryogenic reliefs of the Kolyma Lowland. Tr. PNIIIS 1978, 54, 3–10. [Google Scholar]
- Patyk-Kara, N.G.; Gapon, O.I.; Grinenko, O.V. Geological and geomorphologic structure of the Kolyma Lowland. In Geology of the Cenozoic of Yakutia; Yakut. fil. SO AN SSSR: Yakutsk, Russia, 1982; pp. 70–77. [Google Scholar]
- Arkhangelov, A.A.; Konishchev, V.N.; Rozenbaum, G.E. Primorsko-Novosibirsky Region. In Regional Cryolithology; Popov, A.I., Ed.; Moscow State University: Moscow, Russia, 1989; pp. 128–151. [Google Scholar]
- Obu, J.; Westermann, S.; Barboux, C.; Bartsch, A.; Delaloye, R.; Grosse, G.; Heim, B.; Hugelius, G.; Irrgang, A.; Kääb, A.M.; et al. ESA Permafrost Climate Change Initiative (Permafrost_cci): Permafrost Ground Temperature for the Northern Hemisphere, v2.0; Centre for Environmental Data Analysis: Harwell Oxford, UK, 2020. [Google Scholar] [CrossRef]
- Kholodov, A.V.; Gilichinsky, D.A.; Ostroumov, V.E.; Sorokovikov, V.A.; Abramov, A.A.; Davydov, S.; Romanovsky, V.E. Regional and Local Variability of Modern Natural Changes in Permafrost Temperature in the Yakutia Coastal Lowlands, Northeastern Siberia. In Proceedings of the 10th International Conference on Permafrost, Salekhard, Russia, 25–29 June 2012; pp. 203–208. [Google Scholar]
- Fedorov-Davydov, D.G.; Davydov, S.P.; Davydova, A.I.; Ostroymov, V.E.; Kholodov, A.L.; Sorokovikov, V.A.; Shmelev, D.G. The temperature regime of soils in Northern Yakutia. Earths Cryosphere 2018, 22, 15–24. [Google Scholar] [CrossRef]
- Abramov, A.; Davydov, S.; Ivashchenko, A.; Karelin, D.; Kholodov, A.; Kraev, G.; Lupachev, A.; Maslakov, A.; Ostroumov, V.; Rivkina, E.; et al. Two decades of active layer thickness monitoring in northeastern Asia. Polar Geogr. 2019, 1–17. [Google Scholar] [CrossRef]
- Russian Arctic in XXI Century: Natural Conditions and Development Risks; Alekseevsky, N.I., Dobrolyubov, S.A., Eds.; Feoriya: Moscow, Russia, 2013. [Google Scholar]
- Sakai, T.; Matsunaga, T.; Maksyutov, S.; Gotovtsev, S.; Gagarin, L.; Hiyama, T.; Yamaguchi, Y. Climate-Induced Extreme Hydrologic Events in the Arctic. Remote Sens. 2016, 8, 971. [Google Scholar] [CrossRef]
- Matveeva, N.V. Zonation in Plant Cover of the Arctic; Russian Academy of Sciences: Saint Petersburg, Russia, 1998; Volume 21. [Google Scholar]
- Walker, D.A.; Raynolds, M.K.; Daniëls, F.J.A.; Einarsson, E.; Elvebakk, A.; Gould, W.A.; Katenin, A.E.; Kholod, S.S.; Markon, C.J.; Melnikov, E.S.; et al. The Circumpolar Arctic vegetation map. J. Veg. Sci. 2005, 16, 267–282. [Google Scholar] [CrossRef]
- Wessel, B.; Huber, M.; Wohlfart, C.; Marschalk, U.; Kosmann, D.; Roth, A. Accuracy assessment of the global TanDEM-X Digital Elevation Model with GPS data. ISPRS J. Photogramm. Remote Sens. 2018, 139, 171–182. [Google Scholar] [CrossRef]
- Zandt, M.H.I.; Liebner, S.; Welte, C.U. Roles of Thermokarst Lakes in a Warming World. Trends Microbiol. 2020, 28, 769–779. [Google Scholar] [CrossRef]
- Kienast, F.; Wetterich, S.; Kuzmina, S.; Schirrmeister, L.; Andreev, A.A.; Tarasov, P.; Nazarova, L.; Kossler, A.; Frolova, L.; Kunitsky, V.V. Paleontological records indicate the occurrence of open woodlands in a dry inland climate at the present-day Arctic coast in western Beringia during the Last Interglacial. Quat. Sci. Rev. 2011, 30, 2134–2159. [Google Scholar] [CrossRef]
- Murton, J.B.; Goslar, T.; Edwards, M.E.; Bateman, M.D.; Danilov, P.P.; Savvinov, G.N.; Gubin, S.V.; Ghaleb, B.; Haile, J.; Kanevskiy, M.; et al. Palaeoenvironmental Interpretation of Yedoma Silt (Ice Complex) Deposition as Cold-Climate Loess, Duvanny Yar, Northeast Siberia. Permafr. Periglac. Process. 2015, 26, 208–288. [Google Scholar] [CrossRef]
- Rivkina, E.; Petrovskaya, L.; Vishnivetskaya, T.; Krivushin, K.; Shmakova, L.; Tutukina, M.; Meyers, A.; Kondrashov, F. Metagenomic analyses of the late Pleistocene permafrost—Additional tools for reconstruction of environmental conditions. Biogeosciences 2016, 13, 2207–2219. [Google Scholar] [CrossRef]
- Schirrmeister, L.; Dietze, E.; Matthes, H.; Grosse, G.; Strauss, J.; Laboor, S.; Ulrich, M.; Kienast, F.; Wetterich, S. The genesis of Yedoma Ice Complex permafrost—Grain-size endmember modeling analysis from Siberia and Alaska. E&G Quat. Sci. J. 2020, 69, 33–53. [Google Scholar] [CrossRef]
- Lupachev, A.V.; Gubin, S.V.; Veremeeva, A.A.; Kaverin, D.A.; Pastukhov, A.V.; Yakimov, A.S. Microrelief of the permafrost table: Structure and ecological functions. Earths Cryosphere 2016, 20, 3–13. [Google Scholar]
- Chen, J.; Günther, F.; Grosse, G.; Liu, L.; Lin, H. Sentinel-1 InSAR Measurements of Elevation Changes over Yedoma Uplands on Sobo-Sise Island, Lena Delta. Remote Sens. 2018, 10, 1152. [Google Scholar] [CrossRef]
- Gilichinsky, D.A. Late Cenozoic Cryobiosphere: Permafrost as an Environment for the Conservation of Viable Microorganisms. Ph.D. Thesis, Tyumen Scientific Center, Siberian Branch, Russian Academy of Sciences, Tyumen, Russia, 2002. [Google Scholar]
- Voskresensky, K.S.; Plakht, I.R. The age of alas depressions of the coastal plains on the Russian Far North and geomorphological method of its detection. Cryolithology Probl. 1982, 10, 150–156. [Google Scholar]
- Grosse, G. Thermokarst pond initiation in Arctic permafrost regions. In Proceedings of the 4th European Conference on Permafrost, Evora, Portugal, 18–24 June 2014. [Google Scholar]
- Grosse, G.; Schirrmeister, L.; Kunitsky, V.V.; Hubberten, H.-W. The use of CORONA images in remote sensing of periglacial geomorphology: An illustration from the NE Siberian coast. Permafr. Periglac. Process. 2005, 16, 163–172. [Google Scholar] [CrossRef]
- Romanenko, F.A. Lake Depression Formation in the Siberian Arctic Lowlands. Ph.D. Thesis, Lomonosov Moscow State University, Moscow, Russia, 1997. [Google Scholar]
- Grosse, G.; Schirrmeister, L.; Malthus, T.J. Application of Landsat-7 satellite data and a DEM for the quantification of thermokarst-affected terrain types in the periglacial Lena–Anabar coastal lowland. Polar Res. 2006, 25, 51–67. [Google Scholar] [CrossRef][Green Version]
- Morgenstern, A.; Grosse, G.; Günther, F.; Fedorova, I.; Schirrmeister, L. Spatial analyses of thermokarst lakes and basins in Yedoma landscapes of the Lena Delta. Cryosphere 2011, 5, 849–867. [Google Scholar] [CrossRef]
- Günther, F.; Ulrich, M.; Morgenstern, A.; Schirrmeister, L. Planimetric and volumetric thermokarst change detection on ice rich permafrost, using remote sensing and field data. In Proceedings of the 3rd European Conference on Permafrost: Thermal State of Frozen Ground in a Changing Climate during the IPY, Longyearbyen, Svalbard, 14–18 June 2010. [Google Scholar]
- Walter, K.M.; Zimov, S.A.; Chanton, J.P.; Verbyla, D.; Chapin, F.S. Methane bubbling from Siberian thaw lakes as a positive feedback to climate warming. Nature 2006, 443, 71–75. [Google Scholar] [CrossRef]
- AMAP. Snow, Water, Ice and Permafrost in the Arctic (SWIPA); Arctic Monitoring and Assessment Programme (AMAP): Oslo, Norway, 2017. [Google Scholar]
- Bekryaev, R.V.; Polyakov, I.V.; Alexeev, V.A. Role of Polar Amplification in Long-Term Surface Air Temperature Variations and Modern Arctic Warming. J. Clim. 2010, 23, 3888–3906. [Google Scholar] [CrossRef]
- Heslop, J.K.; Anthony, K.M.W.; Sepulveda-Jauregui, A.; Martinez-Cruz, K.; Bondurant, A.; Grosse, G.; Jones, M.C. Thermokarst lake methanogenesis along a complete talik profile. Biogeosciences 2015, 12, 4317–4331. [Google Scholar] [CrossRef]
- Brosius, L.S.; Anthony, K.M.W.; Grosse, G.; Chanton, J.P.; Farquharson, L.M.; Overduin, P.P.; Meyer, H. Using the deuterium isotope composition of permafrost meltwater to constrain thermokarst lake contributions to atmospheric CH4 during the last deglaciation. J. Geophys. Res. Biogeosciences 2012, 117. [Google Scholar] [CrossRef]


| Yedoma Fraction | Yedoma–Alas Area, km2/% from All Yedoma–Alas Area, km2 | Yedoma Area, km2/% from Class Area | Alas Area, km2/% from Class Area | Thermokarst Lake Area (2013–2014) | ||
|---|---|---|---|---|---|---|
| km2 | % from Class Area | % from Alas Area | ||||
| Low | 17,242/45 | 627/3.6 | 16,614/96.4 | 3283 | 18.5 | 19.8 |
| Moderate | 13,736/35 | 2804/20.4 | 10,932/79.6 | 1468 | 10.7 | 13.4 |
| High | 7798/20 | 3283/42.1 | 4515/57.9 | 5609 | 11 | 19 |
| All yedoma–alas areas | 38,776/100 | 6714/17.3 | 32,588/83 | 4221 | 14.5 | 17.2 |
| Yedoma Fraction | Limnicity Changes in Relation to 1999 | Increased Lake Area in Relation to 1999 | Decreased Lake Area in Relation to 1999 | |||
|---|---|---|---|---|---|---|
| km2 | % | km2 | % | km2 | % | |
| 1999–2013 | ||||||
| Low | 19.75 | +0.62 | 119.72 | +3.73 | 99.97 | −3.12 |
| Moderate | 19.51 | +1.29 | 55.68 | +3.69 | 36.18 | −2.4 |
| High | 9.95 | +1.24 | 27.7 | +3.45 | 17.76 | −2.21 |
| All yedoma–alas areas | 49.2 | + 0.89 | 203.11 | +3.68 | 153.91 | −2.79 |
| 1999–2018 | ||||||
| Low | 155.97 | +4.98 | 190.14 | +6.07 | 34.18 | −1.09 |
| Moderate | 45.87 | +3.12 | 67.27 | +4.58 | 21.4 | −1.46 |
| High | 21.3 | +2.76 | 30.04 | +3.9 | 8.74 | −1.13 |
| All yedoma–alas areas | 223.13 | +4.15 | 287.45 | +5.35 | 64.32 | −1.2 |
Publisher’s Note: MDPI stays neutral with regard to jurisdictional claims in published maps and institutional affiliations. |
© 2021 by the authors. Licensee MDPI, Basel, Switzerland. This article is an open access article distributed under the terms and conditions of the Creative Commons Attribution (CC BY) license (http://creativecommons.org/licenses/by/4.0/).
Share and Cite
Veremeeva, A.; Nitze, I.; Günther, F.; Grosse, G.; Rivkina, E. Geomorphological and Climatic Drivers of Thermokarst Lake Area Increase Trend (1999–2018) in the Kolyma Lowland Yedoma Region, North-Eastern Siberia. Remote Sens. 2021, 13, 178. https://doi.org/10.3390/rs13020178
Veremeeva A, Nitze I, Günther F, Grosse G, Rivkina E. Geomorphological and Climatic Drivers of Thermokarst Lake Area Increase Trend (1999–2018) in the Kolyma Lowland Yedoma Region, North-Eastern Siberia. Remote Sensing. 2021; 13(2):178. https://doi.org/10.3390/rs13020178
Chicago/Turabian StyleVeremeeva, Alexandra, Ingmar Nitze, Frank Günther, Guido Grosse, and Elizaveta Rivkina. 2021. "Geomorphological and Climatic Drivers of Thermokarst Lake Area Increase Trend (1999–2018) in the Kolyma Lowland Yedoma Region, North-Eastern Siberia" Remote Sensing 13, no. 2: 178. https://doi.org/10.3390/rs13020178
APA StyleVeremeeva, A., Nitze, I., Günther, F., Grosse, G., & Rivkina, E. (2021). Geomorphological and Climatic Drivers of Thermokarst Lake Area Increase Trend (1999–2018) in the Kolyma Lowland Yedoma Region, North-Eastern Siberia. Remote Sensing, 13(2), 178. https://doi.org/10.3390/rs13020178