Article

Towards Robust Calculation of Interannual CO2 Growth Signal from TCCON (Total Carbon Column Observing Network)

1
R&D Satellite and Observations Group, Royal Netherlands Meteorological Institute (KNMI), 3731GA De Bilt, The Netherlands
2
Innovative Meteorological Research Department, National Institute of Meteorological Sciences (NIMS), 33, Seohobuk-ro, Seogwipo-si 63568, Korea
3
Finnish Meteorological Institute, 00560 Helsinki, Finland
4
Convergence Meteorological Research Department, National Institute of Meteorological Sciences (NIMS), Seogwipo-si 63568, Korea
*
Author to whom correspondence should be addressed.
Remote Sens. 2021, 13(19), 3868; https://doi.org/10.3390/rs13193868
Submission received: 11 August 2021 / Revised: 13 September 2021 / Accepted: 21 September 2021 / Published: 27 September 2021
(This article belongs to the Section Atmospheric Remote Sensing)

Abstract

:
The CO2 growth rate is one of the key geophysical quantities reflecting the dynamics of climate change as atmospheric CO2 growth is the primary driver of global warming. As recent studies have shown that TCCON (Total Carbon Column Observing Network) measurement footprints embrace quasi-global coverage, we examined the sensitivity of TCCON to the global CO2 growth. To this end, we used the aggregated TCCON observations (2006-2019) to retrieve Annual Growth Rate of CO2 (AGR) at global scales. The global AGR estimates from TCCON (AGRTCCON) are robust and independent, from (a) the station-wise seasonality, from (b) the differences in time series across the TCCON stations, and from (c) the type of TCCON stations used in the calculation (“background” or “contaminated” by neighboring CO2 sources). The AGRTCCON potential error, due to the irregular data sampling is relatively low (2.4–17.9%). In 2006–2019, global AGRTCCON ranged from the minimum of 1.59 ± 2.27 ppm (2009) to the maximum of 3.27 ± 0.82 ppm (2016), whereas the uncertainties express sub-annual variability and the data gap effects. The global AGRTCCON magnitude is similar to the reference AGR from satellite data (AGRSAT = 1.57–2.94 ppm) and the surface-based estimates of Global Carbon Budget (AGRGCB = 1.57–2.85). The highest global CO2 growth rate (2015/2016), caused by the record El Niño, was nearly perfectly reproduced by the TCCON (AGRTCCON = 3.27 ± 0.82 ppm vs. AGRSAT = 3.23 ± 0.50 ppm). The overall agreement between global AGRTCCON with the AGR references was yet weakened (r = 0.37 for TCCON vs. SAT; r = 0.50 for TCCON vs. GCB) due to two years (2008, 2015). We identified the drivers of this disagreement; in 2008, when only few stations were available worldwide, the AGRTCCON uncertainties were excessively high (AGRTCCON = 2.64 ppm with 3.92 ppm or 148% uncertainty). Moreover, in 2008 and 2015, the ENSO-driven bias between global AGRTCCON and the AGR references were detected. TCCON-to-reference agreement is dramatically increased if the years with ENSO-related biases (2008, 2015) are forfeited (r = 0.67 for TCCON vs. SAT, r = 0.82 for TCCON vs. GCB). To conclude, this is the first study that showed promising ability of aggregated TCCON signal to capture global CO2 growth. As the TCCON coverage is expanding, and new versions of TCCON data are being published, multiple data sampling strategies, dynamically changing TCCON global measurement footprint, and the irregular sensitivity of AGRTCCON to strong ENSO events; all should be analyzed to transform the current efforts into a first operational algorithm for retrieving global CO2 growth from TCCON data.

1. Introduction

For more than 60 years, the world has been witnessing a persistent growth in the atmospheric CO2 concentration [1], a principal driver of global warming [2]. Global atmospheric CO2 Growth Rate (GR) is, therefore, one of the key geophysical quantities reflecting the dynamics of global warming and carbon cycle changes. Globally, GR is steadily sustained in the modern times, given constantly increasing fossil fuel CO2 emissions (FFCO2) [3], weakening of carbon sinks (reservoir that uptakes more carbon that releases) under rising temperatures [4], and the offsetting the effects of carbon sinks by rising CO2 emissions [5]. Annual Growth Rate of atmospheric CO2 (AGR) at global scales exhibits natural variabilities, which are fundamentally controlled by El Niño Southern Oscillation (ENSO), FFCO2 and the dynamics of the terrestrial carbon sink [6,7,8]. The role of FFCO2 in AGR variations is fairly simple, as the emissions load extra carbon to the atmosphere, thus increasing the atmospheric CO2 [9]. However, ENSO is a more intricate driver since it indirectly affects AGR by altering the temperature-water regime of ecosystems [10,11], by wildfires, and/or vegetation disturbances [12,13] that affect the terrestrial carbon sources and sinks. At global scales, year-to-year variability of AGR is ~1.0–2.0 ppm yr−1, whereas the major anomalies beyond this rate (in temporal dimension) are either caused by outstanding El Niño events, such as in 2015/2016 [14], or by powerful volcanic eruptions such as the Pinatubo eruption of 1992 [15]. From a spatial perspective, the large-scale spatial variations of AGR (~0.5 ppm yr−1) can emerge at latitude bands comparable to the geographically extensive climate zones [8]. While the spatial variations of AGR are not necessarily significant, they mostly emerge due to the anomalies of temperatures [4,16], precipitation [17], and/or atmospheric mixing conditions at shorter time scales. Furthermore, the meteorological anomalies can trigger significant changes in terrestrial water storage, another strong driver of spatial AGR changes [18].
The estimates of global-scale AGR are fairly robust (accuracy > 0.20 ppm) since they are derived from the stable surface atmospheric measurements of the CO2 mole fraction, taken at the multiple stations worldwide [19]. The latest estimates of the global-scale AGR estimates are reported in the Global Carbon Budget (GCB) on a regular basis [20]. Thus, on one hand, AGR is considered to be a very well-known quantity. On the other hand, only surface measurements of CO2 concentration have been traditionally used to provide baseline estimates for global AGR [19]. Notably, the scholars have recently shown that passive spaceborne observations can be utilized for calculating accurate AGR as well [7,8,21]. Moreover, it has been recently demonstrated that different models can disagree in reproducing global CO2 growth, and this disagreement limits accurate partitioning between various carbon fluxes (terrestrial and ocean) in the models [22]. The latter fact hints that our knowledge about global AGR can still be limited, and the expansion of the methods suitable for capturing global AGR is beneficial. In an ideal position, a global observational network could provide regular CO2 observations suitable to capture the complex range of climate, meteorological, biospheric, and anthropogenic drivers of global AGR (being included by the measurement footprint of a certain station). However, the carbon research infrastructure is technically far from the inception of all-encompassing CO2 observations. On the ground, both in-situ and remote sensing atmospheric observations of CO2 are substantially limited in the majority of developing countries [23]. The modern satellites provide CO2 measurements that are, yet, plagued by low signal-to-noise ratios in the cloudy and hazy regions [24]. The weakness in attributing the physical drivers of anomalous AGR by both land carbon [18] and earth system models [25] limit complete understanding of regional drivers of CO2 growth by modelling as well.
While there is no ideal global network for capturing all drivers and factors of global AGR, the Total Carbon Column Observing Network (TCCON) is seemingly the last global carbon-oriented observational framework, whose capabilities for measuring global AGR remain unclear. On one hand, this gap opens a window for evaluating another global observational method for AGR calculation. On the other hand, the evaluation of the AGR retrieval efficiency, based on TCCON, is beneficial for the network itself as it can give insights about the globality of its measurement footprint. We also think that TCCON capability for retrieving global AGR should be evaluated because the network has been providing quality assured, and regularly validated, total columnar observations of CO2, based on near-infrared sun spectra observations, since 2004 [Wunch et al., 2014]. Moreover, the observational coverage of TCCON has been intensively increasing in the recent years as the number of TCCON sites was expanded, from a single site in 2004, to 23 sites (plus seven former sites) in 2019. Most importantly, Belikov et al. [26] showed that TCCON global footprint is expanding, whereas most of the northern hemisphere, and a considerable part of the southern hemisphere, are covered by the TCCON measurement footprints. Thus, the TCCON stations can be assumed as a quasi-global observatory for carbon cycle research. The aggregated global TCCON observations have been successfully implemented for inferring global CO2 fluxes [27], quantifying seasonal characteristics of CO2 dynamics [28], estimating atmosphere-biosphere exchange [29], and validating global satellite CO2 observations [30]. TCCON observations exhibited good agreement (within 0.1–0.2 ppm) with the referenced CO2 growth in the study where TCCON observations were assimilated into an inverse model [27]. Moreover, some TCCON-based studies showed promising results at local and regional scale estimates of AGR. Most prominently, Sussmann et al. [31] used four mid-latitude TCCON sites to provide AGR, which was sensitive to the strongest El Niño event of the 2010s (in 2015/2016). Our study continues these efforts, and brings the research question about the suitability of TCCON data for capturing AGR to the global scales.
The main research question of this study is “are global TCCON aggregated observations (2006–2019) sensitive enough to global CO2 growth rate for providing robust annual CO2 growth estimates given the current quasi-global coverage of the network?” To answer this question, we pursue three objectives by (a) estimating the robustness of AGRTCCON due to seasonal effects, sub-annual variability, the differences in time series across the sites and to the data sampling, and (b) examining the AGRTCCON agreement with the existing CO2 growth references. As an additional objective, we also (c) compare AGRTCCON projected on monthly scales with the simulations by CO2 inverse models, including CarbonTracker (or simply “CT”) [32] and Copernicus Atmospheric Measurements System (or simply “CAMS”) [33]. The ‘c’ comparison is based on the assumption that models can express the background CO2 conditions at a location given coarse resolution of the CO2 models (~2° × 3°), while TCCON can express both background condition and localized sources, depending on the vicinity of a measurement site to a strong CO2 source and on the meteorological conditions. Note that the objective ‘c’ can additionally shed light on the regions where the knowledge about local-scale AGR is limited.
This manuscript is organized as follows. Section 2 and Section 3 present data and methodology, respectively. Section 4 contains results. Note that the sub-sections of Section 4 are organized to correspond to the main objectives of this study (objective ‘a’—Section 4.1, objective ‘b’—Section 4.2, objective ‘c’—Section 4.3). Section 5 and Section 6 provide discussion and conclusions, respectively.

2. Data

This section describes the main data sources used for retrieving CO2 atmospheric concentration, and it also explains the additional datasets that support our analysis. Our study does not generate any new CO2 data and relies on the referenced CO2 observations or simulations from the existing sources.

2.1. TCCON Observations

TCCON provides quasi-continuous measurements (given the dependence on the weather conditions) of column-averaged dry-air mole fractions of CO2 (XCO2) at numerous locations worldwide. The XCO2 estimates are retrieved using the ratio of column abundance of CO2 to column abundance of O2. Column-averaged dry-air mole fractions are insensitive to variations in surface pressure and atmospheric water vapor, as compared to surface network measurements. The column-averaged dry-air mole fractions are thus less impacted by the effects of atmospheric mixing from the surface exchange [34]. The TCCON observation principle is based on ground-based Fourier Transform Spectrometry (FTS) that offers high spectral (0.02 cm−1) and temporal resolution (~90 s) for spectra in the near-infrared region from direct solar radiation [34]. The use of TCCON observations of XCO2 is advantageous as ground-based FTS is highly robust and allows for calculating XCO2 parameters at ~0.8 ppm (~0.25%) uncertainty after calibration [34]. Notably, XCO2 products from TCCON had been compared with the collocated aircraft observations deployed, with the reference instrumentation, from traceable to the World Meteorological Organization scale [35]. Moreover, TCCON provides quality-assured XCO2 data [34], as the observations are acquired and processed using the same set of standardized tools and methods (including instrumentation, data acquisition routines, processing software and calibration procedures). Today, there are 27 operational sites of TCCON worldwide. Our work uses the TCCON (GGG2014) retrievals data from June 2004 to April 2019, and we utilize the data from both operational sites and the sites where the measurement activity has been halted. The entire study period for AGR examination is chosen to be consistent with the previous prominent study about AGR [8]. The TCCON data were obtained from the online depository (http://tccondata.org) with the latest access on 20 August 2020. We are aware that the TCCON data are updated every month, but the referenced datasets for CO2 growth rate are limited until 2017 (satellite data) and 2018 (GCB).
We provide a short description of the TCCON sites below, whereas the exact locations of the TCCON sites are shown in Figure 1. Ascension (ASC) is a station located on a small tropical island (10 × 12 km) in the South Atlantic Ocean. ASC is one of the few tropical TCCON sites located in the southern trade wind zone, in the downwind direction, from Africa. ASC has sparse vegetation and is influenced by ocean carbon fluxes [36]. Bialystok (BLY) is the easternmost TCCON station in Europe (Poland). It is located in a relatively remote area to strong sources of the greenhouse gases (the region is covered by forests, agricultural lands and wetlands). The climate of the region around BLY is continental [37]. Bremen (BRE) is a site in Western Europe located in a moderately continental climate and on flat terrain [38]. Darwin (DRW) is located in Northern Australia, a region with a distinct monsoonal climate, where the dry season occurs from May to September and the wet season occurs from December to April, respectively. DRW can be considered a “near-ocean” site [39]. Edwards (EDW) [40] is a site in North America, situated in semi-arid climate conditions. Eureka (ERK) [41] is a high-latitude TCCON site located in the northern Canadian Archipelago. ERK stands out, with the complex topography and typical Canadian Arctic climate, with frequent temperature inversions during winters. These inversions constrain vertical mixing of air between the troposphere and the ground. Garmisch (GAR) site is located in the alpine region of Southern Germany, exposed by continental climate with some ocean climate features [42]. Izana (IZA) is a subtropical TCCON station located in the region with high mountains (2,360 m.a.s.l). Since IZA can be considered a marine station, its measurements can express the background CO2 conditions in a realistic way [43]. Karlsruhe (KAR) is a near-urban site in central Europe located on flat terrain. The climate around KAR is continental with some ocean influence [44]. Lamont (LAM) is a site in the U.S. Southern Great Plains with a humid continental climate, agricultural environment, and relatively flat landscape [45]. Lauder (LDR) is a site in New Zealand that is located in the midst of rolling hills. There are no large anthropogenic sources near LDR (except minor and occasional wood burning sources) as the environment is mostly rural. As LDR is mostly exposed to strong westerly flows, the station is substantially exposed to marine climate, and its observations can be considered to be background-like [46,47]. Ny-Ålesund (NYA) is a polar measurement site, located at the archipelago Spitsbergen, in a polar climate. NYA is a station on a steep ridge surrounded by rocks and glaciers. Notably, one can perform solar absorption measurements in the night at NYA, given the phenomenon of the polar day [48]. Orleans (ORL) is a site in Western Europe located in the environment composed of mixed forest and agricultural fields. Climate conditions of ORL are temperate with the distinct features of Atlantic Ocean influence [49]. Paris (PAR) is another site in France where the first regular TCCON observations are organized in a European megacity. The measurement footprint of PAR encompasses urban CO2 sources [50]. Park Falls (PKF) was the first operational TCCON site located in North America, situated in a heavily forested area with relatively flat topography [51]. Pasadena (PSD) is located in Western U.S. between the Pacific Ocean and the mountains, in relative vicinity to the EDW station. PSD observations [52] are considered urban, given the station location and the strength of surrounding anthropogenic emissions. The climate of the region around PSD is Mediterranean. Réunion (REU) is an oceanic site, located at an island in the Indian Ocean, in a relative vicinity to Mauritius (175 km). REU exhibits low CO2 variability given considerable exposure to ocean influence [53]. Rikubetsu (RIK), Saga (SAG) [54], and Tsukuba (TSU) are the TCCON sites in Japan located at the islands of Hokkaido, Kyushu, and Honshu, respectively. Among them, TSU is the most heavily influenced by the urban sources (50 km from Tokyo), which also features complex topography [55,56]. Sodankyla (SOD) is the only station in the Northern continental Europe. SOD is located in the area of continental climate, far from any strong emission sources. One of the advantages of SOD location is the vicinity to boreal region, which is crucial for atmosphere-biosphere exchange [57,58]. Wollongong (WOL) is a TCCON site in the South-Eastern Australia, situated in an urban environment with exposure to anthropogenic biomass burning, biosphere, and marine flux influences. WOL is located in oceanic climate with subtropical influences [59]. Zugspitze (ZUG) is a TCCON site located at a high altitude (2964 m.a.s.l.) with very close vicinity to GAR measurement site [60].
The coordinates of all stations used in this work, along with the respective acronyms from Figure 1, are shown in the Supplementary Materials (the full list of stations and the respective acronyms are shown in the Supplementary Materials ; see Table S1.1). Note that not all TCCON stations are used in this work, and the sites we did not use in this study are not described in this section. In particular, there were not enough measurements to calculate a single CO2 annual growth estimate at monthly scales (see the definition of MGR in the methodology) from MAN and IND stations, regardless of the daily threshold (see Figure S1.2 in the Supplementary Materials). At several other stations (AMY, BUR, JPL) there was an insufficient number of MGRs (<8) during the entire study period to calculate a single AGRTCCON. Due to this, six stations (FCO, MAN, IND, AMY, BUR, and JPL) are excluded from this study (the details about the reasons of the lack of data at some stations are given in the Supplementary Materials; Section S1.1). All the rest required references for TCCON including those for the stations forfeited from this analysis are provided in the reference list [61,62,63,64,65,66].

2.2. Copernicus Atmospheric Monitoring Service

The Copernicus Atmospheric Monitoring Service (CAMS) is based on data assimilation of CO2 observations and is being developed by the Laboratoire des Sciences du Climat et de l’Environnement (LSCE). For CAMS, atmospheric observations of CO2 are compiled via several networks of near-surface observations, including the NOAA Earth System Research Laboratory archive, the World Data Centre for Greenhouse Gases, the Integrated Carbon Observation System-Atmospheric Thematic, the Global Environmental Database, the World Data Centre for Greenhouse Gases Archive, and the Réseau Atmosphérique de Mesure des Composés à Effet de Serre database. CAMS (v18.2) only assimilated surface in-situ measurements of CO2 dry air mole fractions, made at 135 sites across the globe, from January 1979 to May 2019. For simulating the atmospheric transport of CO2, CAMS utilizes the LMDz (Laboratoire de Meteorologie Dynamique) transport model [67]. The mass fluxes are determined from a full General Circulation Model controlled by the ECMWF (European Centre for Medium-Range Weather Forecasts) winds [33,68,69]. The data assimilation system of CAMS is based on 4D-Var. Prior values of the fluxes are provided to the climatological land-atmosphere fluxes at a 3-h resolution from the ORCHIDEE model (ORganizing Carbon and Hydrology In Dynamic EcosystEms), version 1.9.5.2. For fossil fuel priors, gridded annual anthropogenic emissions are used (combined by Carbon Dioxide Information Analysis Center, or CDIAC, and Emission Database for Global Atmospheric Research; i.e., EDGAR 4.2). Ocean fluxes, and the biomass burning module, are defined based on the sea-air fluxes and GFED 4.1s (Global Fire Emission Database), respectively (before 2014, in 2015 the fire module uses Global Fire Assimilation System; GFAS). We used CAMS v18.2 version of PYVAR atmospheric inversion, with an initial spatial resolution of 3.75° × 1.8947° (longitude-latitude), for the entire atmospheric column (integrated over 39 vertical levels). We regridded CAMS results to 3° × 2° longitude-latitude grid (to be compatible with CarbonTracker), and this process did not cause serious error propagation to the estimates due to similarities in the models’ spatial resolutions. We downloaded CAMS XCO2 results from the online depository of ECMWF based on data request from 1 November 2019 (https://apps.ecmwf.int/datasets/data/cams-ghg-inversions).

2.3. CarbonTracker

CarbonTracker 2017 (simply CT hereafter) global version [32] is based on the Ensemble Kalman Filter Method (EnKF) assimilation of CO2 observations. CT was originally developed by the National Oceanic and Atmospheric Administration (NOAA) for better understanding the processes governing CO2 uptake and release, at the Earth’s surface, in high temporal and spatial resolution. CT exploits the TM5 (Transport Model 5) offline atmospheric transport model [70], forced by the ERA-Interim meteorological fields from the ECMWF (the European Centre for Medium-Range Weather Forecasts). CT offers CO2 simulations with global cover of 3° × 2°-degree (longitude-latitude) resolution. As with other CO2 inverse models, CT uses various fluxes (oceanic and land) to optimize existing CO2 observations. To define the a priori CO2 fluxes from various carbon sources, CT utilizes modules including the land-atmosphere carbon exchange (from Carnegie-Ames Stanford Approach model), wildfires (Global Fire Emissions Database; i.e., GFED), fossil fuel emissions (from “Miller” dataset and Open-Data Inventory for Anthropogenic Carbon Dioxide 2016, i.e., ODIAC 2016 [71]), and oceans. Ocean inversion fluxes are based on Jacobson et al. [72] and Takahashi et al. [73]. CASA includes GFED 4.1s (hourly resolution) and GFED_CMS (daily resolution). CT assimilates hourly averaged CO2 concentration from 254 observations sites worldwide. We emphasize that CT offers CO2 concentration at 25 height levels. We use pressure-weighted integrated columnar concentration of CO2 (to be consistent with CAMS integrated estimates of CO2) that was derived according to methodology shown in [74]. The CT datasets are downloaded from NOAA website being accessed on 1 November 2019 (ftp://aftp.cmdl.noaa.gov/products/carbontracker/co2/molefractions/), while all other relevant descriptions are documented at: http://carbontracker.noaa.gov, accessed on 11 August 2021.
To compare the model data versus TCCON, we have interpolated the original simulated CO2 profile data with respect to the TCCON vertical layers, and then, we smoothed out the sensitivity differences through applying TCCON averaging kernel (Equation (1)) on the model data [75].
X C O 2 s m o o t h e d s i m = X C O 2 a + i Δ p i a i C O 2 s i m C O 2 a i
where ai is a profile retrieval column, averaging kernel from TCCON, X C O 2 a is column-averaged of prior CO2 profile from TCCON, C O 2 a is a prior CO2 profile from TCCON, C O 2 s i m is a simulated CO2 profile from the model. Ultimately, the simulated smoothed pressure-weighted column-averaged concentration for CO2 (XCO2) is calculated using Equation (2) below where Δp(i) calculus is explained. Equation (2) corresponds to the Equation (4) of the reference study [74], and it was initially introduced to compare the simulated smoothed concentration fields with the observations for a target gas (CO2 in our case).
Δ p i = P i P i + 1 P s P t
where Δp(i) is proportional to the difference of pressure estimates of P(i) and P(i + 1) representing the bottom and the top of the ith vertical grid cell, respectively, whereas Ps and Pt are the two pressure levels (index ‘s’ stands for the closest level to the surface and index ‘t’ stands for the top vertical level).

2.4. Datasets with Global CO2 Growth Rate

For global CO2 growth data, we exploited the two types of estimates. On one part, we use the Global Carbon Budget 2019 dataset. GCB introduces the comprehensive investigation of all four components of the carbon cycle (including FFCO2, land-use emissions, oceanic sink, land sink, and the atmospheric CO2 growth rate) and is being updated on a regular basis. We used atmospheric GR that had been taken directly from GCB-2019 [20]. The estimates of AGR, from GCB-2019, were directly provided by atmospheric CO2 concentration measurements, with the uncertainties of ~0.4 ppm, according to the data provider [19]. We used only the data from 2004 onwards, with the latest available GR estimates on the time of manuscript preparation. GCB dataset was downloaded via the website of the journal of Earth System Science Data (https://essd.copernicus.org/articles/11/1783/2019/) with the latest access on 5 October 2020. Another reference for CO2 growth rate estimates is the satellite data (SAT hereafter) analysis conducted by Buchwitz et al. [8]. They used XCO2 product from Obs4MIPs (Observations for Model Intercomparisons Project) version 3 (O4Mv3) (monthly and 5° by 5° latitude-longitude resolutions), based on an ensemble of satellite data in the 2003–2016 period. This ensemble includes datasets, based on one algorithm for SCIAMACHY-ENVISAT data (BESD v02.01.02), and four algorithms of GOSAT XCO2 data (RemoTeC v2.3.8, UoL-FP v. 7.1, ACOS v7.3.10a, NIES v02). The details about these algorithms are given in Table 1 of Buchwitz et al. [8]. The latest SAT estimates were accessed from the website of the University of Bremen (https://www.iup.uni-bremen.de/carbon_ghg/cg_data.html#XCO2_GR), where XCO2 interannual growth estimates are uploaded [21] on a regular basis (the latest access was from 4 June 2021).

2.5. Ancillary Datasets

We use ENSO indices in our analysis as well. El Niño (warm) and La Niña (cold) ENSO events were quantified using Oceanic Nino Index (ONI) obtained from the online platform (https://ggweather.com/enso/oni.htm, accessed on 11 August 2021) of Golden Gate Weather Services [76]. For comparing ENSO events with the atmospheric CO2 growth rates projected for every month, we used 3-month running mean ONI values (12 estimates per year are available: JJA, JAS, ASO, SON, OND, NDJ, DJF, JFM, FMA, MAM, AMJ, MJJ). For comparing ENSO events with AGR, we used the annual quantitative metrics labelled “ENSO event” by Golden Gate Weather Services. This annual-scale typology also originates from ONI indices and is determined based on five consecutive overlapping 3-month periods with ≥+0.5° anomaly (El Niño) or with ≤−0.5° anomaly (for La Niña). The threshold is defined separately for Weak (with a 0.5 to 0.9 sea surface temperature anomaly), Moderate (1.0 to 1.4), Strong (1.5 to 1.9), and Very Strong (≥2.0) events. An ENSO event is assigned to one of these categories if it equals, or exceeds, the corresponding threshold for at least three consecutive overlapping 3-month periods. We translated ENSO event classifications to numerical codes as following: weak, moderate, strong and, very strong (for El Niño labelled as 1, 2, 3, 4, respectively; for La Niña −1, −2, −3, −4, respectively). Note that there is also “neutral” condition in this typology (0 in numerical classification for this study).
For delineating cities (urban areas), we used the MODIS high-resolution (500 m) dataset with urban pixels [77]. Use of the MODIS urban pixels is advantageous as it allows delineating urban areas based on numerical criterion. The significant relationship between MODIS urban pixels and CO2 localized anomalies has been shown in the previous studies [78,79]. The MODIS urban pixels were downloaded from the following website (http://www.naturalearthdata.com/downloads/10m-cultural-vectors/10m-urban-area/), with the latest access on 3 October 2020.
Ground-based CO2 data, for several sites, are taken from CO2 dry air mole fraction measurements by a nondispersive infrared absorption analyzer or cavity ring down spectrometer. These measurements are, essentially, flask sample collections cooperated by NOAA Global Monitoring Laboratory [80]. Uncertainties of CO2 measurements are within ±0.02 ppm. The acronyms used for denoting surface measurement stations are listed online (https://www.esrl.noaa.gov/gmd/dv/site/, accessed on 11 August 2021). The surface datasets are obtained from the NOAA-related server (ftp://aftp.cmdl.noaa.gov/data/trace_gases/co2/flask) with the latest access on 1 October 2020.

3. Methodology for the CO2 Atmospheric Growth Rate Calculation

This section describes the methodology for global CO2 atmospheric growth calculations (Section 3.1), as well as the TCCON data sampling strategy (Section 3.2).

3.1. Calculation of CO2 Growth Rate at Monthly (MGR) and Annual (AGR) Scales

Previous studies often referred to global CO2 atmospheric growth observed at annual scales as ‘CO2 annual growth’ [3,4,8,21], ‘annual CO2 increase’ [7] or ‘CGR’ (CO2 growth rate) [22]. Instead of the single acronym ‘CGR’, this study applies two acronyms because we need to distinguish two different terms throughout the manuscript—namely, CO2 annual growth (AGR) and CO2 annual growth projected at monthly scales (MGR). Both terms are explained in detail in this section. The recent comprehensive review about interannual variations of the carbon cycle emphasized that CO2 growth rate may considerably vary depending on the methodology of calculation [35]. It implies that there is no conventional methodology for retrieving CO2 growth rate parameters. Thus, the method should be selected according to the latest findings in the research literature. In this regard, we refer to the latest outcomes from the CO2 growth-related research and use the Buchwitz et al. [8] methodology. They used satellite data to generate AGR estimates at global scales in three steps. First, they calculated XCO2 time series at monthly resolution by averaging the XCO2 in the region of interest. Second, they calculated so-called monthly-sampled XCO2 annual growth (XCO2 of m month minus XCO2 of m-12 month; the latter means the same month during a preceding year). Third, they retrieved AGR and the corresponding uncertainties from the monthly sampled AGRs. We follow a similar procedure adapted for the aggregated TCCON data to be used for global AGR calculation. First, for each station, we calculate a median of XCO2 (denoted as μ(XCO2)) for each month (m) during a year (y) and the corresponding medians of the same months (m) during a preceding year (y−12) as shown in Equation (3). Second, we derive the annual growth of CO2 sampled for each month during the year (MGR in this study) using the Equation (3). Third, we calculate median growth rates of AGR from MGRs for each station using Equation (4) below. Fourth, we ultimately aggregate all available station-wise AGRTCCON estimates and retrieve global mean from these estimates (global AGRTCCON).
M G R m , y = μ X C O 2 m , y μ X C O 2 m , y 12
A G R y = μ M G R y
Note that MGR conceptually corresponds to “annual CO2 growth rate of a specific month” [81] or “monthly sampled XCO2 annual growth rate” [8] from previous studies. MGR can be calculated if XCO2 estimates are available for a specific month in two consecutive years. For instance, MGR from January 2015 would be calculated as the difference between μXCO2 (January, 2015) and μXCO2 (January, 2014). In an ideal position, there would be 12 MGRs as an input for each TCCON station per year (so MGR is available for every month from January to December).
Besides instrumental-related errors, the corresponding uncertainties in this method would stem from the sub-annual variability of XCO2, station-wise (number of monthly observations), and global data gaps (the number of stations per year available for global AGRTCCON estimates). Uncertainties of the AGR estimates are calculated in the similar way to the analysis of the satellite global composite AGR estimates by Buchwitz et al. (2018) [8]. To this end, we calculate average standard deviation across the input data points used for both station-wise (denoted as the “third” stage of the calculus in the previous paragraph and shown in Equation (4)) and the final global AGR estimation. For instance, for every station-wise AGRTCCON (in the 2006–2019 period), we calculate the mean standard deviation (1σAGR), stemming from the sub-annual variability. The sub-annual variability of AGR is virtually the variability of MGRs during that year, as they are used as the input for AGR calculation at a site (see Equation (4)). The seasonal coverage of AGR (number of MGRs used for the calculation) may vary from one station to another. To obtain the uncertainty that takes into account both the sub-annual data variability and data gaps, we multiply σAGR on the scaling factor of n m a X   /   n . Here, nmax is the maximum available MGRs (12), and n is the actual number of available MGRs during that year. Note that, for global AGRTCCON (using the aggregated global observations), the average standard deviation should be calculated from station-wise AGRs and then multiplied on N t O t a l   /   N   factor, where N is the number of stations used during that year, and Ntotal is the total number of stations in TCCON analysis. This approach expresses the combination of data gaps and averaging effects in the final AGRTCCON estimates. Such an approach cannot take full error propagation into account, but it provides the realistic sample-weighted estimates of the uncertainties for global AGRTCCON estimation, expressed by irregularly distributed observations (from both temporal and spatial perspective). Theoretically, stations-wise AGRTCCON can also be influenced by the seasonality footprint in MGR data, by the exposure to external factors such as strong carbon sources near a site or the influence of large-scale climate phenomena such as ENSO. We discuss the role of all these factors in Section 4 of the manuscript where the results are shown.

3.2. TCCON Data Sampling Strategy

Ideally, for calculating global CO2 growth rate, all TCCON stations, with abundant observations evenly distributed across the seasons, should be available. In reality, CO2 monitoring starting times vary across TCCON stations. Moreover, the total number of observations at each TCCON station per month may vary, depending on the date and the location, due to forfeiture of FTS measurements during cloudy conditions [34]. Thus, we had to understand how many days, with the observations per month (just “observation days” hereafter), would be sufficient for calculating a robust MGR estimate for each TCCON station. This choice would, essentially, represent the data sampling strategy for providing AGRTCCON. All MGR estimates obtained, using the number of sub-monthly observations falling behind this threshold, would have to be forfeited from the analysis. For instance, if the daily threshold is “5”, then, we consider MGR estimates only from those TCCON stations where MGR was calculated using more than 5 daily XCO2 estimates during that month. Note that the daily threshold is applied, not to MGR, but to the μXCO2 terms of Equation (4) (right side). Therefore, a daily threshold can vary from 0 to 31 (depending on the month). The realistic interval of the daily thresholds ranges from ‘2′ to ‘25′ because the higher threshold values would lead to constraining the total number of TCCON stations available for AGR global analysis to 9, 8, 6, 4, and 3 estimates for the daily thresholds of 26, 27, 28, 29, and 30 observations, respectively (see Figure S2.1 in the Supplementary Materials for details). Lower interval indicates either absence (0) or just one (1) observational day per month, so they are also unused. A detailed figure, illustrating the relationship between the daily threshold and the final data abundance for AGR calculation for all the TCCON stations (except FCO station, which had evidently too few months of observations), can be found in the Supplementary Material (Figure S1.2). We emphasize that opting for the minimum threshold of ‘2′ points is not a blind choice, and we provide the sensitivity analysis of global AGRTCCON due to this choice in Section 4.1.4.

4. Results

4.1. Estimating the Robustness of AGRTCCON Due to Data Sampling, Measurement Gaps and Irregularities in Time Series

Before analyzing the TCCON data, we need to understand the robustness of AGRTCCON estimates at individual stations and the global means. In this section, we examine the robustness of the global AGRTCCON in the presence of underlying station-specific (or local-scale) AGR characteristics, irregularities in data sampling/observation abundance (varying seasonally and station-wise), and seasonality effects.

4.1.1. Selected Sites (Garmisch, Park Falls and Tsukuba) Analysis: Time Series of Station-Wise XCO2, MGR and AGR

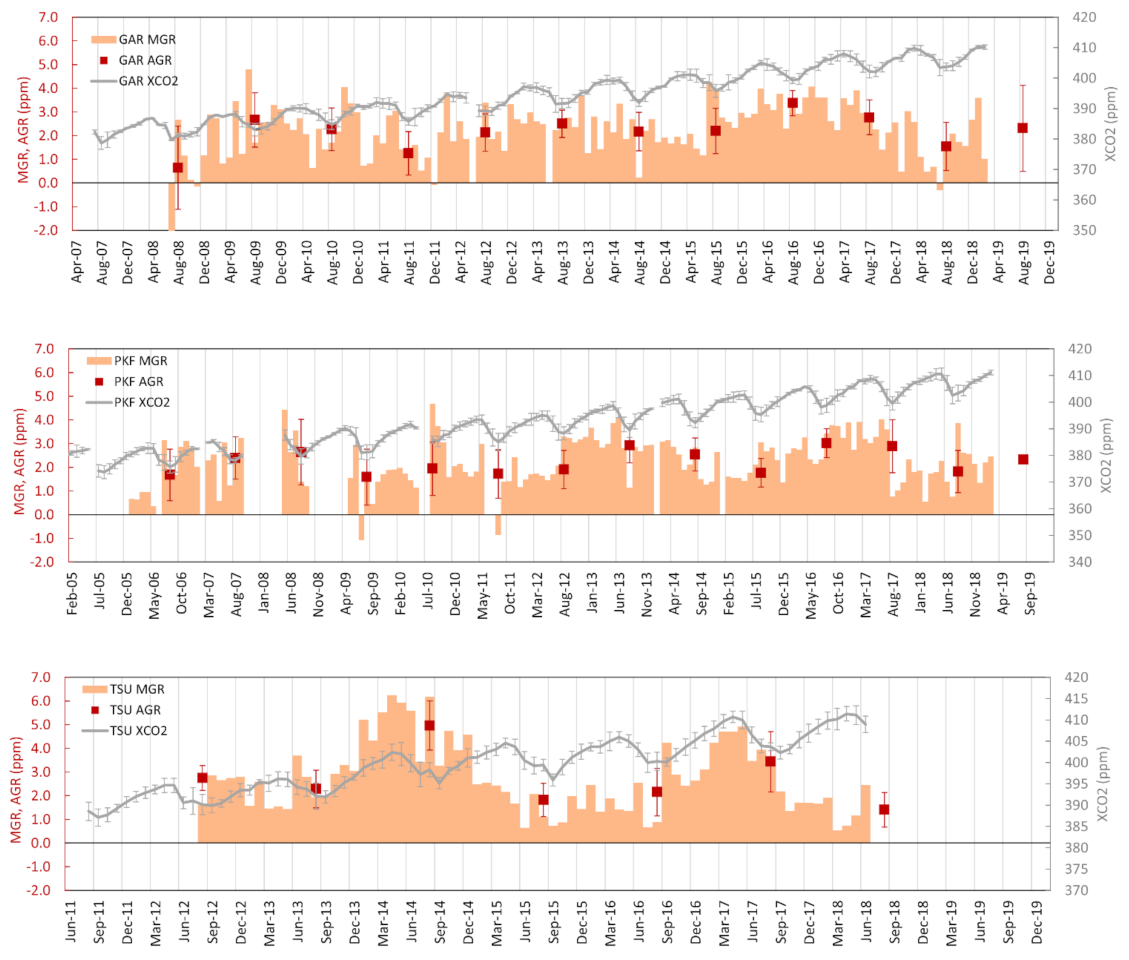
First of all, we explore the temporal dynamics of station-wise AGRTCCON, MGRTCCON, and XCO2 for few TCCON sites to provide visually explicit examples of how these parameters are changing in time and how they are related to location, seasonality, and time series length. To this end, we pick three sites (Garmisch-GAR, Park Falls-PKF, and Tsukuba-TSU) as shown in Figure 2. The gray line is a daily time series of XCO2 (the median of all XCO2 estimates during the day), whereas error bars reflect the 1σ uncertainty range of the daily data. Meanwhile, station-wise MGR and AGR estimates are calculated using all available data from these stations, using Equations (3) and (4) over the available observation periods. All three stations have different lengths of the time series and different dates when the observations have started at the site. More specifically, the observations are available for 07.2007–02.2019, 04.06.2004–02.2019, and 08.2011–06.2018 time periods for GAR, PKF, and TSU respectively. As all these stations are located in the mid-latitudes, we anticipated a relatively similar response to background CO2 growth and, therefore, comparable AGR variability.
The location does not seem to play a critical role in changing interannual CO2, as the median MGR estimates (and the corresponding 1σ uncertainties) are equal to 2.31 ± 1.11, 2.24 ± 1.01 and 2.48 ± 1.46 ppm for GAR (nMGR = 126), PKF (nMGR = 136), and TSU (nMGR = 71). At first glance, the seasonality footprint is not evidenced in MGR dynamics plotted on Figure 2 (see orange bars). However, the variability of MGRs across different seasons has to be examined, as Figure 2 shows that GAR and PKF experience similar temporal dynamics of MGR with no salient or prolonged peaks at any season, but TSU has two distinct, and relatively durable, MGR peaks. The first peak lasted from 01.2014 to 08.2014 (MGR = 3.25–6.24 ppm). The second peak occurred at the similar time interval during another year (01.2017–08.2017; MGR = 3.40 to 4.92 ppm). In both peak periods, MGR reached the highest rates in June. These peaks are unlikely related to seasonal dynamics of XCO2, as seasonal medians of MGR (at each station) show no seasonal shift of MGR magnitude at any station. This surmise can be supported by reporting the MGRs for each season in the brackets using the following order: winter, spring, summer, and autumn (TSU = 2.57, 2.02, 2.54, 2.70 ppm; GAR = 2.62, 2.19, 2.26, 2.21 ppm; PKF = 2.03, 1.80, 2.24, 2.56 ppm). As MGR estimates from GAR, PKF, and TSU are relatively robust, regardless of the seasonality, we suggest that AGRTCCON can be retrieved for each site using MGRs as input data (see AGR estimates shown as red squares on Figure 2). AGR varies from 0.65 ppm (2008) to 3.37 ppm (2016) at GAR, from 1.59 ppm (2009) to 3.02 ppm (2016) at PKF, and from 1.40 ppm (2018) to 4.96 ppm (2014) at TSU. The AGRs from these sites exhibit (1.00–4.00 ppm) considerable variations. AGRTCCON estimates for the 2004–2019 period for GAR, PKF and TSU are 2.23 ± 1.00 ppm (nMGR = 126, nAGR = 12), 2.14 ± 0.88 ppm (nMGR = 136, nAGR = 14), and 2.28 ± 0.93 ppm (nMGR = 71, nAGR = 7), respectively.
Despite there being seemingly no seasonal footprint on the MGR estimates at the analyzed sites, we emphasize that the standard deviation of seasonal MGR estimate, in spring, is distinctly higher at TSU (138% and 148% higher than at PKF and GAR, respectively). Since TSU is located near the Tokyo megacity [55], we suspect that the enhanced variability of MGR can be related to the exposure of TSU to urban CO2 sources. We assume that the anthropogenic influence on the station data is evident, and we expand the discussion about this surmised phenomenon in Section 4.3.

4.1.2. Station-Wise Analysis: Effects of Sub-Monthly XCO2 Variability on Station-Wise AGRTCCON Estimates

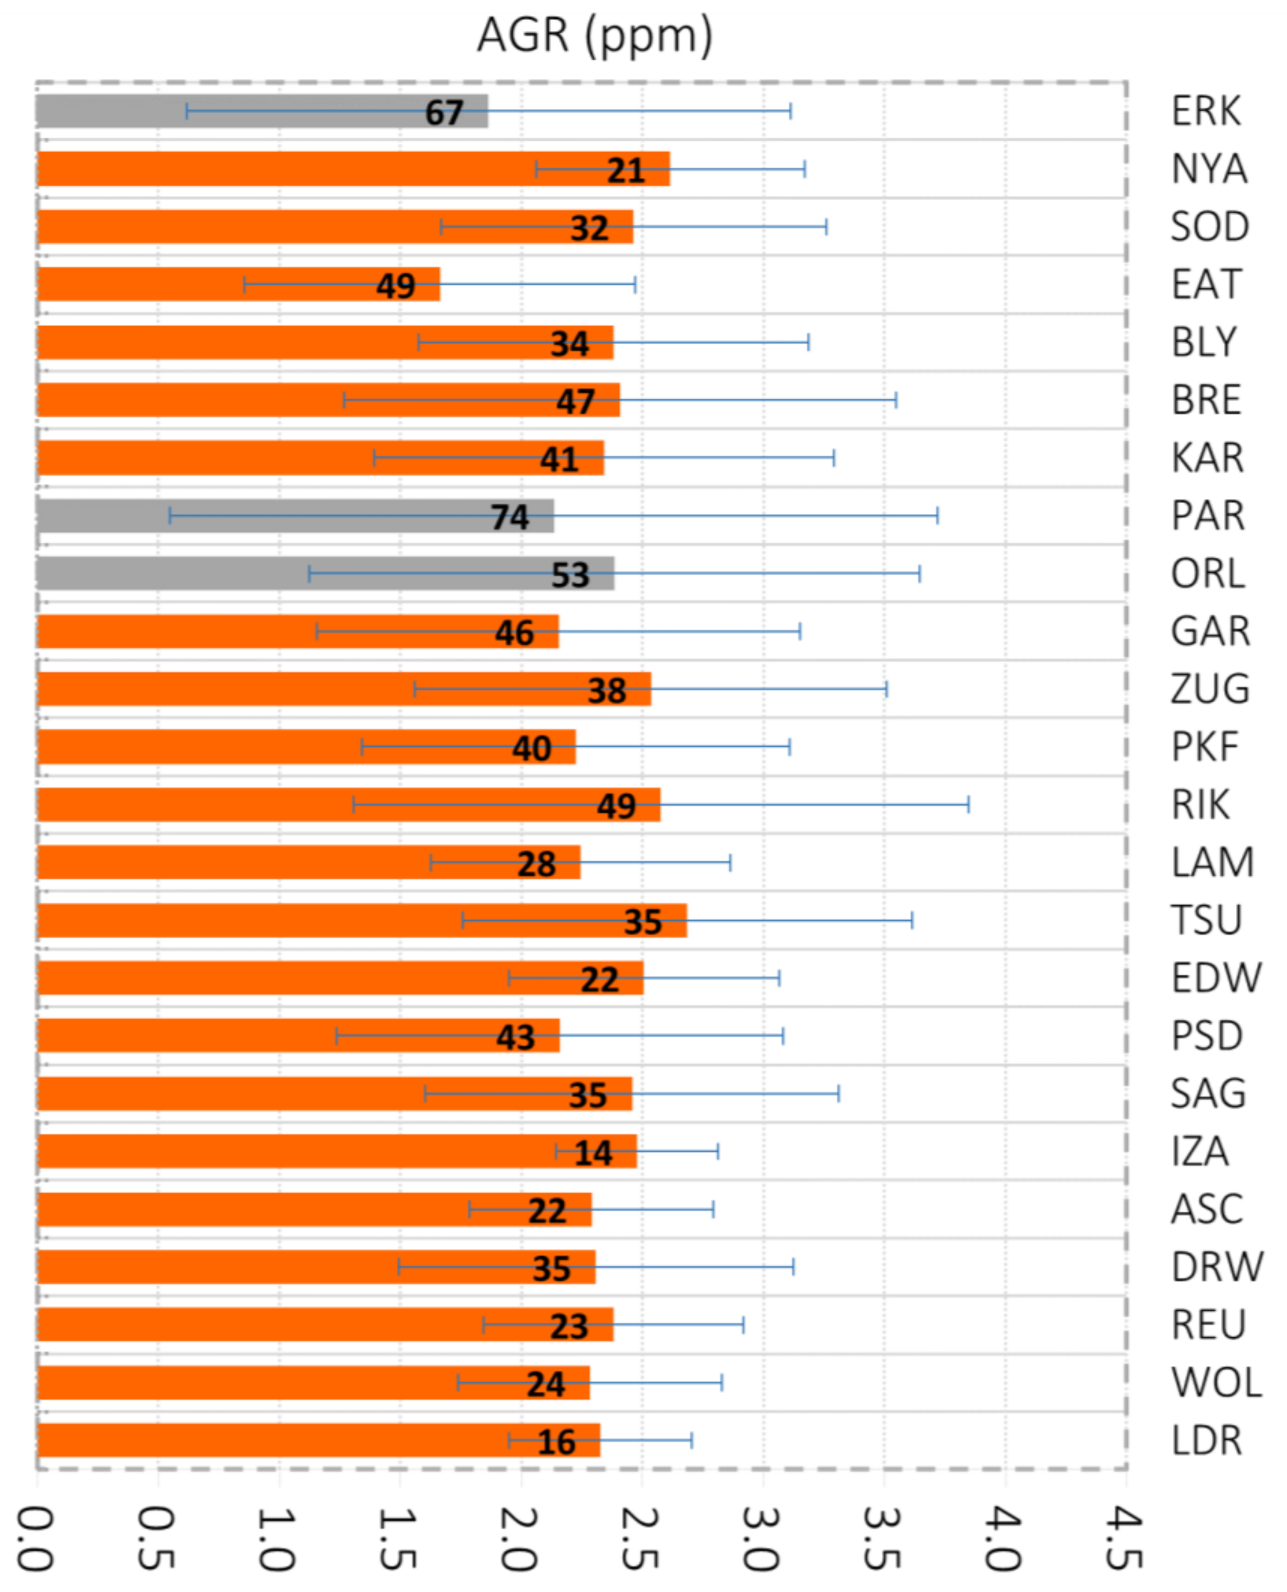
We calculate the average AGRTCCON for each TCCON station for 2006–2019, and the corresponding uncertainties of AGR (Figure 3), driven by both the sub-annual variability of XCO2 and irregular temporal sampling at each TCCON station. This analysis is not intended to report AGR from each TCCON station but to understand if any AGR estimates are affected by sub-annual variabilities (statistically noisy). In general, AGR at each TCCON site represents some combination of background CO2 conditions and the local factors (therefore, we do not expect the ideal agreement across all station-wise AGRs). AGRs reasonably vary with a minimum of 1.66 ± 0.81 ppm at EAT and a maximum of 2.69 ± 0.93 ppm at TSU. Notably, the strongest AGR is observed at the same station (TSU) where we identified anomalous peaks in MGR time series (see Figure 2). This finding, once again, indicates the potential existence of a local driver controlling this change. Moreover, some long-term station-wise AGRTCCON estimates from this study can be compared with the AGRTCCON estimates provided in the previous studies. For instance, we discerned good agreement between our GAR (2.15 ± 1.00 ppm) and ZUG (2.54 ± 0.98 ppm) estimates and the Yuan et al. [82] TCCON-based AGR estimates (GAR = 2.33 ± 0.08 ppm, ZUG = 2.48 ± 0.16 ppm), considering the uncertainties. It is to be noted that the AGRTCCON uncertainties in our study are driven by the underlying data variability and data gaps, which can indicate the statistical robustness of AGRTCCON estimates at each station. We calculated the associated uncertainties (from supra-annual variability) using the approach we mentioned in the methodology (as σAGR * n m a X   /   n ). Figure 3 shows that, for 8 stations, the uncertainties are low (<33%) and, for 13 stations, are reasonable (<50%). Excessive uncertainties which may lead to low signal-to-noise ratio AGRTCCON estimates, are found only for three sites PAR, ERK, ORL (>50%), and all these stations are located in the northern hemisphere. We underline that these stations are not forfeited from the current analysis, due to peculiarly high value of each TCCON station for global AGR analysis, with the current observational coverage of TCCON. From the geographic perspective, we also detected a cluster of low MGR variability (low uncertainties) stations. This cluster encompasses the northern hemisphere tropical, and all southern hemisphere, stations (see the bottom part of Figure 3 and stations from LDR to IZA, as the stations are sorted based on the latitude). The latter finding may indicate that the uncertainties of AGRTCCON at tropical and southern hemisphere sites can be lower due to less pronounced seasonality of land-carbon exchange during a given year (compared to the mid and high latitude stations).

4.1.3. Station-Wise Analysis: Hidden Effects of CO2 Seasonality and Variability on Station-Wise AGRTCCON Estimates

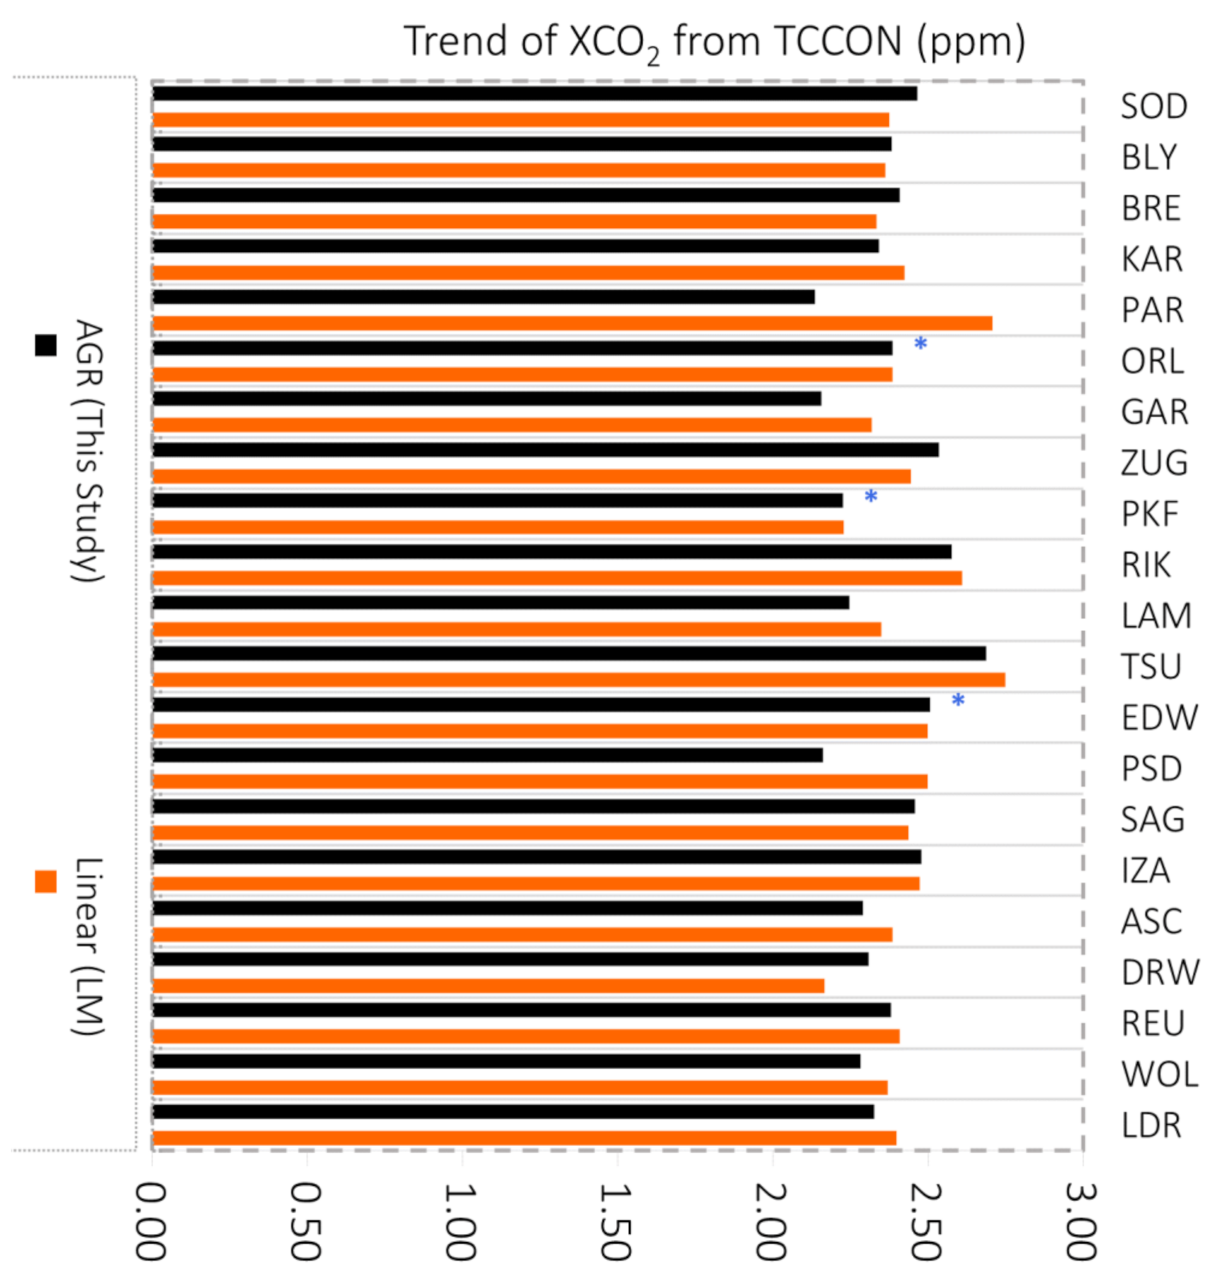
Despite the presumably weak influence of data irregularities on MGR (and AGR) calculation, we test the sensitivity of station-wise AGRTCCON estimates to the dynamic features of XCO2 observations, such as hidden effects of seasonality and time series length. This test is useful for evaluating the effectiveness of our data sampling approach (shown in Section 3.2) by comparing the station-wise AGRTCCON with independent station-wise TCCON interannual estimates. To this end, we applied the Lindqvist et al. [28] methodology (LM hereafter), where the authors used a six-parameter function to simultaneously fit a trend and an average seasonal cycle (optimized for the northern hemisphere although applicable also in the southern hemisphere) into the time series of daily XCO2 averages. This fitting implies that the time series of XCO2 can, for a period of several years, be disentangled into an average seasonal cycle, represented by a skewed sine wave and an average linear trend, describing the XCO2 growth rate. Figure 4 shows the comparison of AGRTCCON from this study (orange) against the LM-based linear trend (black). The difference between these estimates is somewhat very low (ranges from −0.15 to 0.15 ppm with a median of −0.01 ppm) across all analyzed stations. However, the statistical error bars of the LM-based linear trend are peculiarly narrow (0.01–0.10 ppm, depending on a station). Hence, despite very small differences between our estimates and the LM-based estimates, the agreement between AGRTCCON and LM-based trend is quantitatively high, but not ideal given the original LM methodology guidelines (narrow error bars). The agreement, within the stringent LM-based uncertainty range, is observed at only three sites including EDW, PKF, and ORL and these stations, therefore, provide the most seasonally-independent AGR estimates. Overall, this analysis confirms the effectiveness of our AGRTCCON estimates, given the small difference between them and LM-based estimate. However, it also highlights minor sensitivity of our estimates to the real seasonality of XCO2 observed in the measurements during the year. Note that EUR and NYA stations are not used in this analysis, due to a lack of data for evaluating the seasonal cycle according to LM.

4.1.4. Station-Wise Analysis: Effects of Irregularities in Data Sampling and Observation Abundances on Station-Wise AGRTCCON Estimates

The previous study about CO2 growth, based on TCCON observations, hinted that the global CO2 growth may be plagued by the inconsistent measurement sampling during the year [31], whereas the inconsistency can be caused by the missing observations due to prevailing cloudy conditions. Further, the inconsistency would theoretically propagate unequally distributed weights of seasonal observations into the final estimates. To this end, we explore the effects of the data abundance for each site (Table 1) to ensure that the AGRTCCON estimates do not critically depend on the irregularity of TCCON observation abundance (daily, monthly, and annual scales) across the different TCCON sites. The stations in Table 1 are sorted from the site with most observations to the site with the least observations available. The daily abundance of the data (the main driver of irregular sampling) stems from the fact that some sites perform just a few observations per day, while others may perform hundreds (see Figure S2.2 in Supplementary Materials). In theory, it should not cause any problems because sub-daily variations of CO2 (driven by variability of boundary layer height or photosynthesis-respiration relation) would be smoothed out by the prevalence of background-like CO2 observations in the same day. This assumption would be valid if a site is not influenced by the strong local anthropogenic source (or strong land carbon sinks/sources). If an anthropogenic source is located near a site, we anticipate that its influence would be evident in most XCO2 observations during that day. In such a case, the exposure would be also evident at the temporally coarser scales, such as a daily XCO2 mean. Simple correlation analysis between AGRTCCON estimates for each TCCON station, and any data abundance parameter mentioned in Table 1, confirms our surmise (|r| < 0.20 for any parameters). Although there is a considerable irregularity of the TCCON observations across the different sites, the station-wise AGRTCCON (at least its magnitude) are relatively independent from the underlying data characteristics. Moreover, we analyzed the global (or more precisely, quasi-global) range of the TCCON stations, and did not detect any seasonal footprints in station-wise AGRTCCON, as the MGRTCCON variability across different seasons is low. This is reasonable as there is no strong seasonal shift of MGRTCCON availability with most MGRs from August (145) and least MGRs from December (114), as shown in the Supplementary Materials (Table S2.1. for global analysis and Figure S2.2 for station-wise details). This variability is not marked with any prominent data availability peaks or data gaps, so the method for AGR calculation should not be affected by such variations. This finding has, however, no impact on the station-wise AGRTCCON uncertainties, driven by the sub-annual XCO2 variability and no impact on the instrumental errors that may propagate to the final estimates.

4.1.5. Global AGRTCCON Analysis: Effects of Choosing “Daily Observation Threshold”

The analysis of the irregular data sampling across TCCON stations is not enough to conclude about the independence of global AGRTCCON estimates due to data structure. As mentioned, at the fourth (last) step of AGRTCCON calculation (see Section 3.1), we retrieve global AGRTCCON, based on a median of station-wise AGRTCCON estimates for every year. To this end, we also need to show that global AGRTCCON is robust (i.e., minimally sensitive) to the “daily threshold” choice at this step. We remind that the minimum threshold is the minimum number of available days, with observations per month, at each TCCON station (it was described in Section 3.2) required to calculate MGR. This is essentially the main assumption about the TCCON data sampling we made. In the case of excessive sensitivity to this threshold, the global AGRTCCON estimates would always change depending on the threshold choice, and such estimates cannot be used.
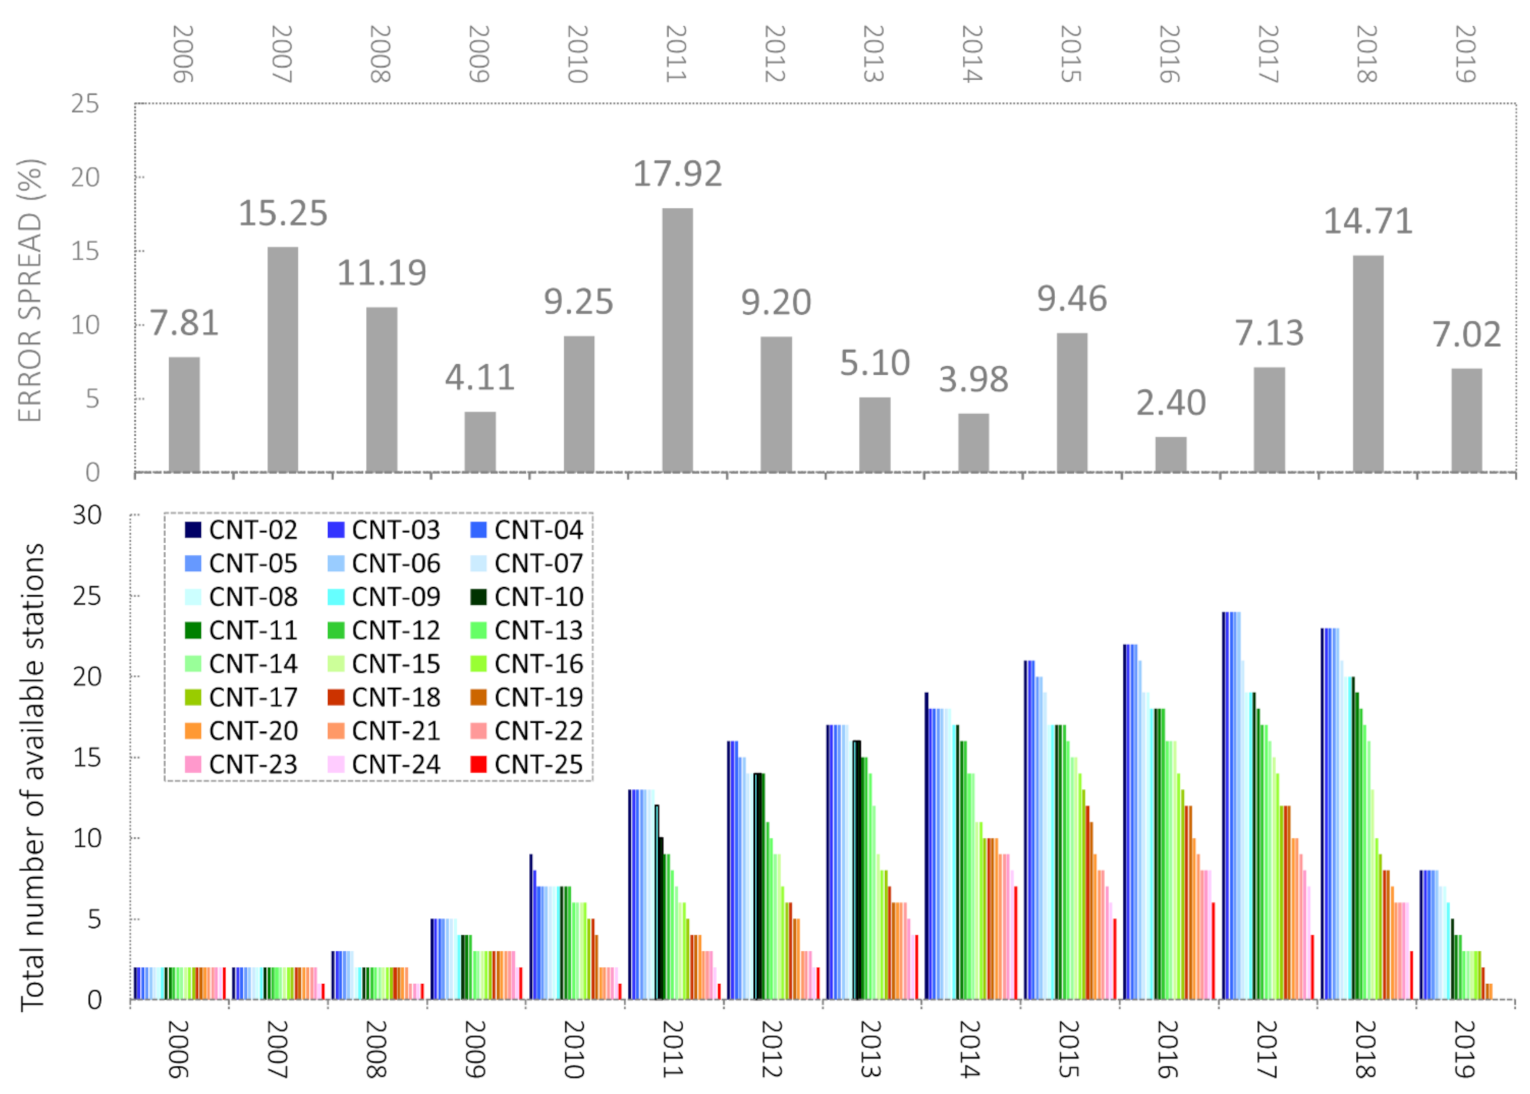
To cancel out this possibility, we evaluate the maximum sensitivity of the global AGRTCCON (final AGRTCCON estimate), due to the daily threshold we choose. This sensitivity can be understood as a potential error, spread due to sub-monthly TCCON variability (see the top panel of Figure 5), and was calculated as the standard deviation across all possible station-wise AGRTCCON estimates using all daily thresholds (2–25). The error spread is expressed in the terms of percentage of AGRTCCON estimate using the minimum threshold (2). A simple example of the threshold-driven error spread can be displayed using Figure 5. Let us consider 2007 as an example when a potential error spread of 15.25% was observed (Figure 5, top panel). It means that, in 2007, the methodological variability of AGR that purely depends on the threshold choice (between 2 and 25) is 15.25% (0.38 ppm) of the AGRTCCON global estimate (2.49 ppm). Since the number of stations can greatly vary, we also added the statistics of the total number of stations that could be used for providing the station-wise AGRTCCON (Figure 5, bottom panel) depending on the threshold. This is important because raising the threshold naturally decreases the number of stations available for global AGRTCCON calculation using the aggregated dataset. Since it is crucial to maintain a reasonable balance between the robustness of the AGRTCCON estimates and the availability of the input data, we illustrate the total number of the TCCON stations, meeting the requirements based on the daily thresholds, at the same Figure 5 (bottom panel). Maximum error spread, due to sub-monthly data filtering, is surprisingly low and ranges from 2.4% (2016) to 17.92% (2011). The error spread of 2016 is substantially lower than in 2011 due to the gradual increase in the number of sites operated by TCCON, whereas this increase is reducing the sensitivity of global AGRTCCON signal to the adjusted daily thresholds. We also calculate the absolute difference between the AGR estimates, using the lowest daily threshold of ‘2′ (AGRTCCON-02) versus all the other daily threshold-based estimates. The median bias is negligible (−0.08–0.16 ppm), while the absolute difference is very low (0.37–0.53 ppm) compared to relatively weak thresholds (3–15) but becomes considerably high (1.31–2.24 ppm) compared to stringent thresholds (16–25). This is reasonable, as the data sampling analysis suggested that the use of stringent thresholds in CO2 growth calculation method can be applied only to a limited number of data-abundant TCCON stations (Figure S2.2 in the Supplementary Materials). In most cases, the use of stringent thresholds leads to critical dearth of station-wise MGRs for AGR calculation at a TCCON site (see Figure S1.2 in the Supplementary Materials). The actual difference between the highest AGRTCCON and the lowest AGRTCCON estimates, depending on the threshold choice, are <0.50 ppm for all years except 2008 (0.79 ppm). These estimates are closer (by the magnitude) to the CO2 growth annual uncertainties, reported in the previous studies [1,8,31], and seem reasonable. It is also reasonable to suggest that the error spread could be entirely driven by the number of available TCCON stations (less stations, higher error rate). However, it is unlikely the case since the correlation between AGR error spread and number of all TCCON stations is low. We obtain |r| < 0.30 for thresholds of 1–24, r = −0.53 for the threshold of 25 when a severe lack of data is evident (see the statistics for ‘25′ in Figure S1.2. in the Supplementary Materials). These results indicate that we should opt for a lower daily threshold to save as much TCCON data as possible since the observational coverage of the network is still limited, and the value of each MGR is high for AGR calculation. We note that we only use the daily threshold of ‘2′ hereafter for calculating station-wise MGR and AGR estimates.

4.2. Retrieving Global Estimates of AGRTCCON and Comparing It with the Existing References

This section compares the final global AGRTCCON estimates with the existing AGR references (at global scales) and elaborates the potential drivers of the disagreement between these estimates for the years when it is applicable, including the most essential (the second) objective of our study.

4.2.1. Comparing AGRTCCON with the References (Global Carbon Budget and Satellite Composite Estimates)

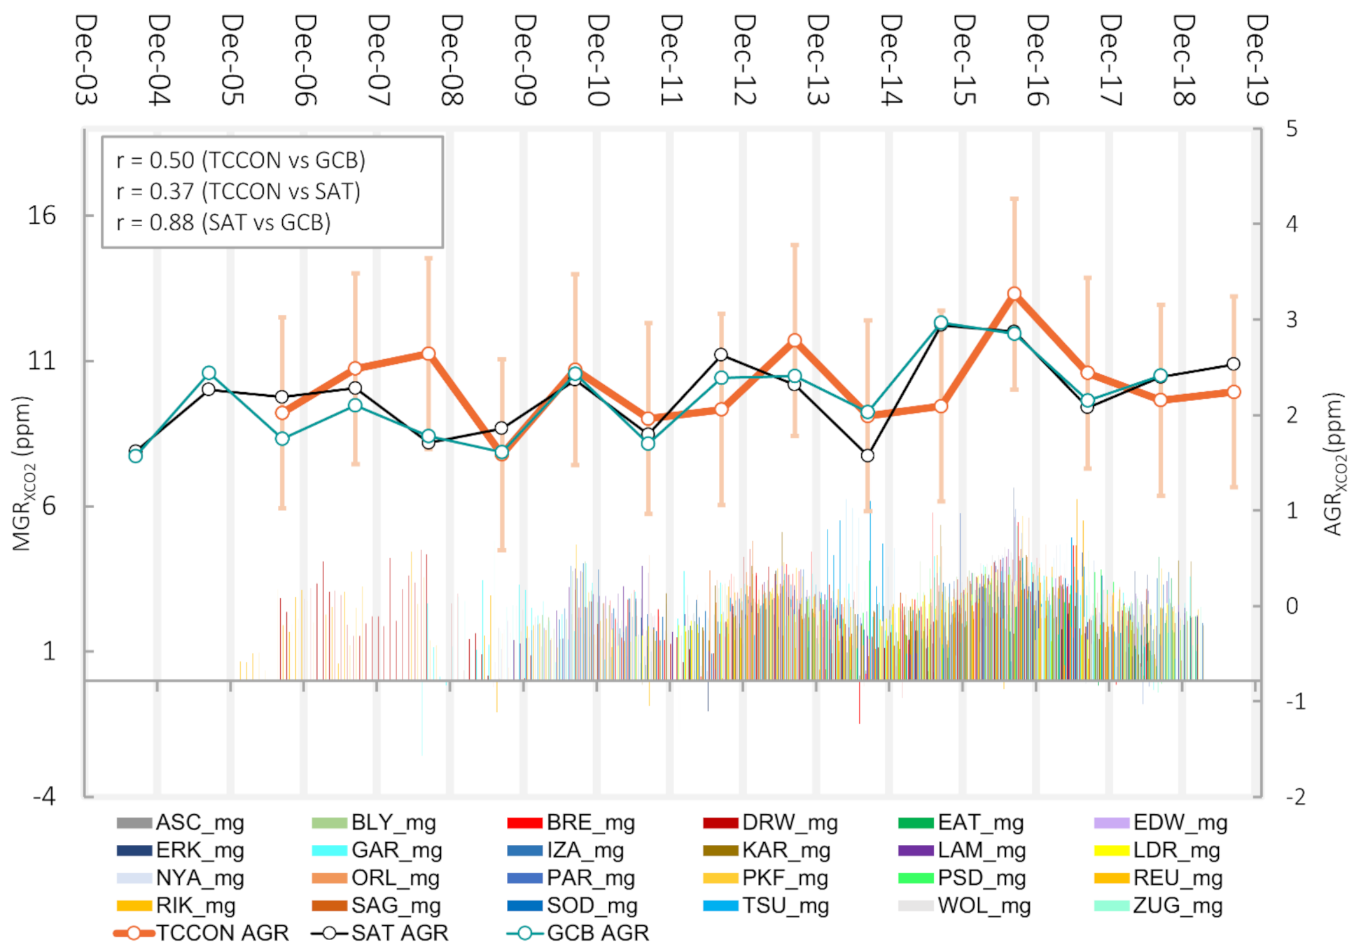
We compare global AGRTCCON estimates against the reference AGRs and report the corresponding bias (ppm), implying that the previously published SAT and GCB estimates are the references. In 2006–2019, global AGRTCCON ranged from 1.59 ppm (2009) to 3.27 ppm (2008), as shown in Figure 6. Most importantly, there is no large difference in the magnitude of global AGRTCCON variations compared with the references (AGRSAT = 1.57–2.94 ppm, AGRGCB = 1.57–2.97 ppm), whereas a slight (<0.30 ppm) overestimation of the upper margin by TCCON is identified. There is a good agreement between our global AGRTCCON estimates with the aggregated mid-latitude AGR estimates (2.00–3.27 ppm) from the TCCON-based study [31]. Regarding the comparison of AGRTCCON with the references (SAT and GCB), except 2008 and 2015, SAT-to-TCCON bias ranges from −0.36 to 0.57 ppm, and GCB-to-TCCON bias ranges from −0.37 to 0.33 ppm, respectively. The strongest disagreement is observed in 2008 (−0.93 ppm for SAT-TCCON and −0.86 ppm for SAT-GCB comparisons). This is explainable since the weighted global AGRTCCON uncertainty (the weight is low due to only three available stations) is highest in 2008 (±3.92 ppm) and the 2008 estimate is likely unreliable. We underline that the uncertainty estimate (its magnitude) helped to identify this case, indicating that our uncertainty estimates are realistic. Generally, there is an agreement between the AGRTCCON and the references (GCB and SAT) at global scales, but it is rather weak as the correlation coefficient (r) in the TCCON-to-GCB comparison is 0.50 and in the TCCON-to-SAT comparison, it is 0.37 (see the top panel of Figure 6). Meanwhile, the root-mean-square error (RMSE) is 0.29 ppm for the TCCON-SAT comparison and is 0.24 ppm for the TCCON-GCB comparison, respectively. As the agreement between GCB and SAT is higher (r = 0.88, RMSE = 0.03 ppm), one could expect a similar rate of agreement between the references and TCCON. Despite the deteriorated TCCON-to-reference agreement for the entire period, the aggregated global TCCON data provided a remarkably accurate estimation of AGR during the record El Niño [1,8,12,83]. In particular, TCCON observations yield a very high global AGRTCCON (3.27 ppm ± 0.82 ppm) similar to the highest AGRSAT (2.87 ppm ± 0.22 ppm) or AGRGCB (2.85 ppm ± 0.09 ppm) estimates during that year considering the uncertainties of the AGRTCCON data.
The availability of MGR also greatly varies from year-to-year due to the gradual strengthening of TCCON observational coverage (the number of MGRs in 2019 low since there is no perfect observational coverage by the time of manuscript preparation). However, the MGR data irregularity within the AGRTCCON global estimate has not been controlling the rate of discrepancy between TCCON and the references. We calculate SAT-to-TCCON and GCB-to-TCCON bias (as an indicator representing the discrepancy between global AGRTCCON and the references). The correlation between MGR input and the bias is rather low and positive (r < 0.50). We argue that if the MGR irregularity had plagued AGRTCCON accuracy, one could expect strong negative relationship (less MGRs, less stable AGR signal, higher TCCON-to-reference bias). Despite the large differences in the observational coverage of TCCON during these years (two stations with available AGR estimates in 2006 to 23 stations in 2018), there is also no correlation between AGR-related bias and number of AGR (r < 0.50) as well. Moreover, Figure 6 shows that MGR estimates reasonably reflect one-year growth of CO2 over a certain location. Given constantly increasing CO2 in the entire atmosphere around the globe, it is reasonable that ~98% of all MGRTCCON are positive connoting location-independent and omnipresent CO2 growth. To sum up this subsection, the weak agreement of TCCON with the references at global scales can be potentially associated with the irregular impacts of external factors on AGRTCCON during specific years, enhancing the underlying uncertainties (like in 2008), and this issue is elaborated in the following sections.

4.2.2. Evaluating the Factors Affecting AGRTCCON: ENSO

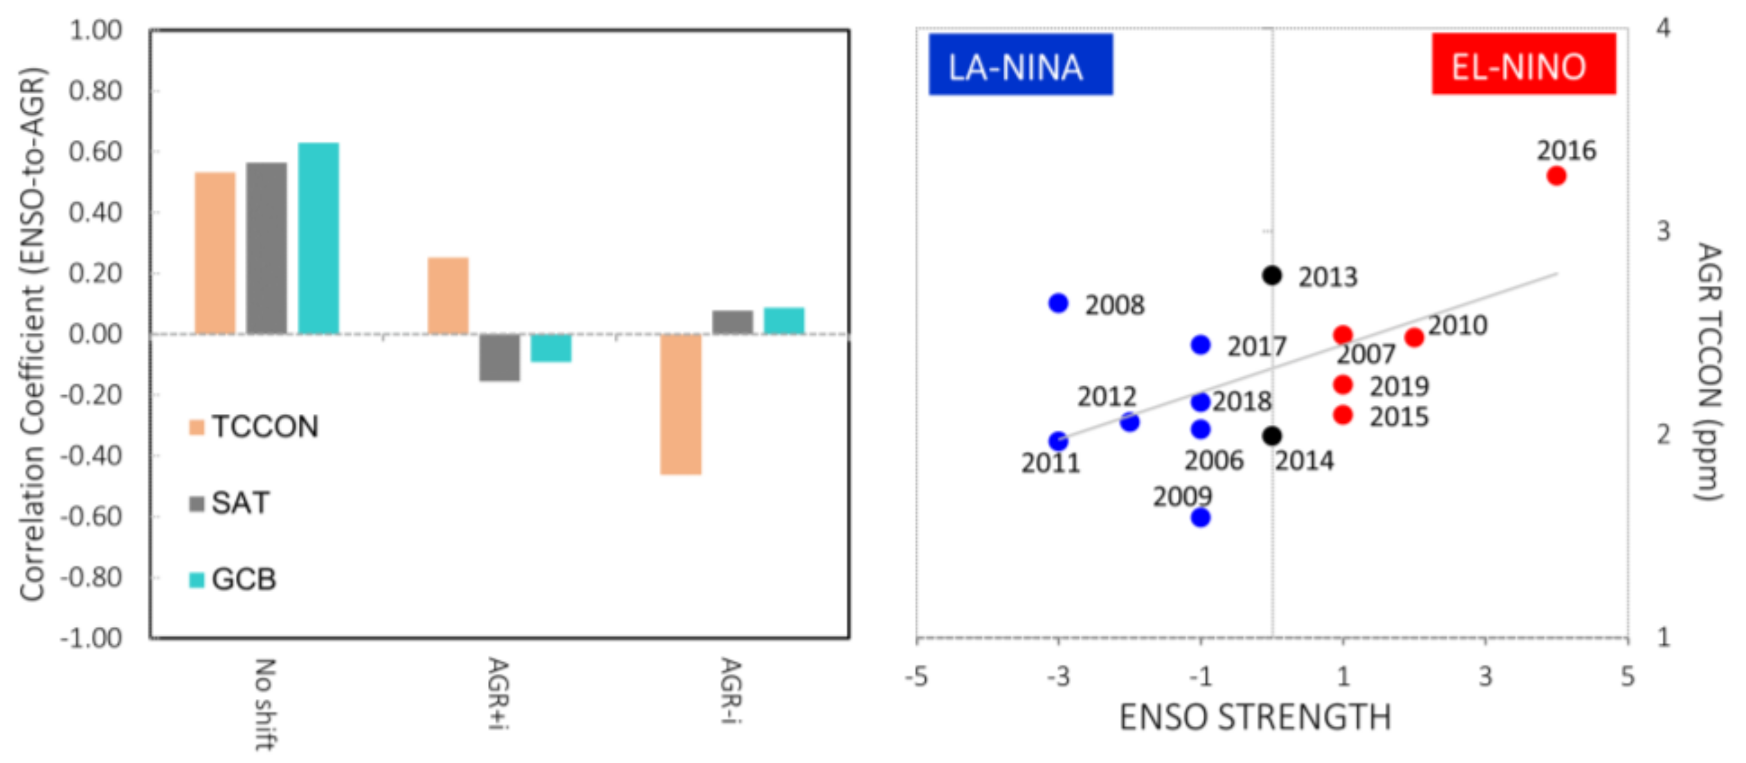
We suspected that the MGR systematic fluctuations from Figure 6 can be driven by an unknown, regionally specific shift in the overall MGR signal (like the carbon seasonality footprint from a cluster of Northern or Southern Hemisphere stations). To examine such a possibility, we replotted the same MGR temporal dynamics as shown in Figure 6 with an emphasis on regional contribution of the stations (see Figure S2.3. in the Supplementary Materials), and it is marked that these fluctuations arise from both the southern and northern hemisphere sites. As seen from the same figure, it is more likely that MGRs (and therefore AGRs as well) exhibit wave-shape fluctuations due to the role of ENSO (plotted on the top panel). This qualitative surmise can be supported by two arguments. First, others researchers have reported that the current role of ENSO (the post-2010 period when MGR estimates are abundant) in forming interannual fluctuations of GR is dominant (94%) compared to the earlier periods of time (63% in the post-2003 period) [8]. Second, we identified the weak sensitivity of AGR to ENSO events for SAT (ENSO-SAT, r = 0.53) and moderate sensitivity for GCB (ENSO-GCB, r = 0.63), as shown on Figure 7 (left panel). The weak AGRTCCON-to-ENSO sensitivity exists as well (ENSO-TCCON r = 0.53). All these sensitivities are statistically significant (p-values < 0.05 at 95% confidence level). Notably, the sensitivity between all types of AGR estimates and ENSO is enhanced (and mostly driven) in 2015/2016 when the record El Niño event was registered [1]. In particular, AGR-to-ENSO agreement is substantially deteriorated without 2016 (r = 0.51, 0.40 and 0.20 versus GCB, SAT and TCCON AGR estimates, respectively). As the ultimate agreement between CO2 growth and ENSO may depend on the chosen “lag” between ENSO event and AGR [11], we also considered time shifts with one-year difference but did not notice the enhanced sensitivity of AGR to the ENSO from “shifted” years (see AGR+i and AGR-i at left panel of Figure 7).
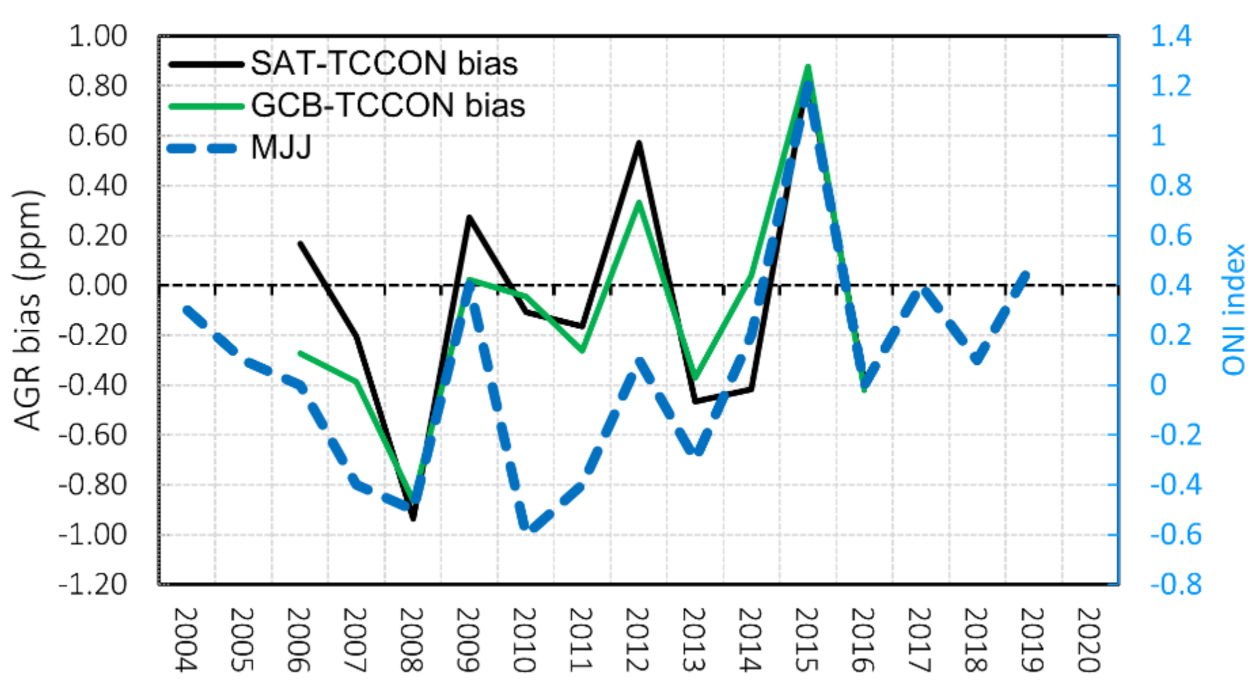
On one hand, the reasonable sensitivity of AGRTCCON estimates to ENSO is a good indicator of effectiveness of AGR because CO2 growth is fundamentally linked to ENSO. Moreover, the rate of the agreement is quantitatively similar to TCCON-to-reference agreement rate. On the other hand, there can be systematic and undetected uncertainties driven by irregular response of some TCCON stations (or aggregated TCCON signal during some years) to ENSO events. From this perspective, we analyze the disagreement rate between TCCON-to-reference bias (SAT-to-TCCON and GCB-to-TCCON) ENSO parameters to estimate the exposure of global AGRTCCON to the ENSO factor. Namely, we examine SAT-to-TCCON bias and GCB-to-TCCON bias (in reproducing AGR, ppm) against ENSO strength and against ONI (reflects 3-monthly running means of ENSO effects during the year). The ONI analysis is also helpful as it accounts for all possible month-scale shifts of ENSO events to which AGR can be peculiarly sensitive. When the biases are compared versus ENSO strength, there is no correlation (|r| < 0.35). However, the analysis of the biases against three-month running means indicates a strikingly distinct pattern. There is a linearly increasing temporal agreement between these biases and ONI starting from JJA (June-July-August) when the correlation is completely lacking (r = −0.11 for SAT, −0.08 for GCB) to MJJ (May-June-July) anomaly, when the correlation is becoming strong (r = 0.72 for SAT, 0.81 for GCB). The details about this observed pattern can be examined in the Supplementary Materials by checking Figure S2.4.
Although the exact mechanism of the relationship between the bias and ONI is unknown, we plot time series of SAT-to-TCCON (GCB-to-TCCON) bias against MJJ dynamics to visualize the details of this relationship. As seen from Figure 8, the strongest biases between global AGRTCCON and the AGR references are evidenced in 2008 and 2015. We noticed that 2008 and 2015 correspond to the years prior to the steep interannual transitions within one class of ENSO anomaly. Notably, during most of the years, the transition from one La Niña to another (or from one El Niño to another) was smooth (ENSO Strength difference was <1). Meanwhile, in 2008, there was a steep transition from strong La Niña (−3 in our classification) to weak La Niña (−1) in 2009, indicating a corresponding steep change of sea surface temperature anomaly within cold anomaly interval. Likewise, we observe the steepest change of the ENSO condition between 2015 and 2016, when weak El Niño (+1), in 2015, was shifted to very strong El Niño (+4) in 2016, which not only broke a record for the registered El Niño events but also caused unprecedented CO2 growth [1]. Figure 8 shows that when MJJ is positive (hot temperature anomaly), it is more likely that TCCON underestimates SAT and GCB, while at negative (cold temperature) anomalies, TCCON overestimates SAT and GCB estimates. As the ENSO role is overwhelming over the oceans, in the tropics and in the Southern Hemisphere, one could expect that the observed pattern could be associated with the observational coverage of TCCON or driven by non-linear feedback of some stations to varying ENSO conditions. For instance, the role of ENSO could propagate to an interannual signal at some TCCON sites via changing the precipitation patterns of the environment (thus, affecting land-carbon exchange seasonality during the year). Despite how challenging it is to support any hypothesis about this bias in this study, we can surmise that 2008 and 2015 were impacted by the excessive, or irregular, sensitivity of some TCCON stations to short-term ENSO conditions. Taken as an argument, this assumption can be used for withdrawing these years from the intercomparison, thus improving the agreement between global AGRTCCON and the references. More specifically, without 2008 and 2015, global AGRTCCON agrees well with SAT (r = 0.67) and strongly agrees with GCB (r = 0.82). We emphasize that the uncertainty of AGRTCCON is highest in 2008, during the analysis period (3.92 ppm), and it greatly exceeds the AGRTCCON estimate in 2008 (2.64 ppm) due to the combined lack of stations and enhanced variability of sub-annual data during the same year.

4.3. Additional Analyses: Examining Exposure of External Factors to TCCON CO2 Growth Data

As we detected the peaks of unknown nature in MGR estimates (see the analysis of XCO2, MGR, and AGR at three selected TCCON stations), another aspect of potential influence in the form of local source exposure should be tested. To this end, the current section aims to assess the exposure of CO2 growth estimates at each TCCON station to external factors. In addition to this aim, this section will also indirectly shed light on the regions where TCCON stations would be beneficial for alleviating poor knowledge about local-scale AGR.

4.3.1. Identifying Local Influence in TCCON Interannual Signal. TCCON Versus CO2 Inverse Models at all TCCON Sites

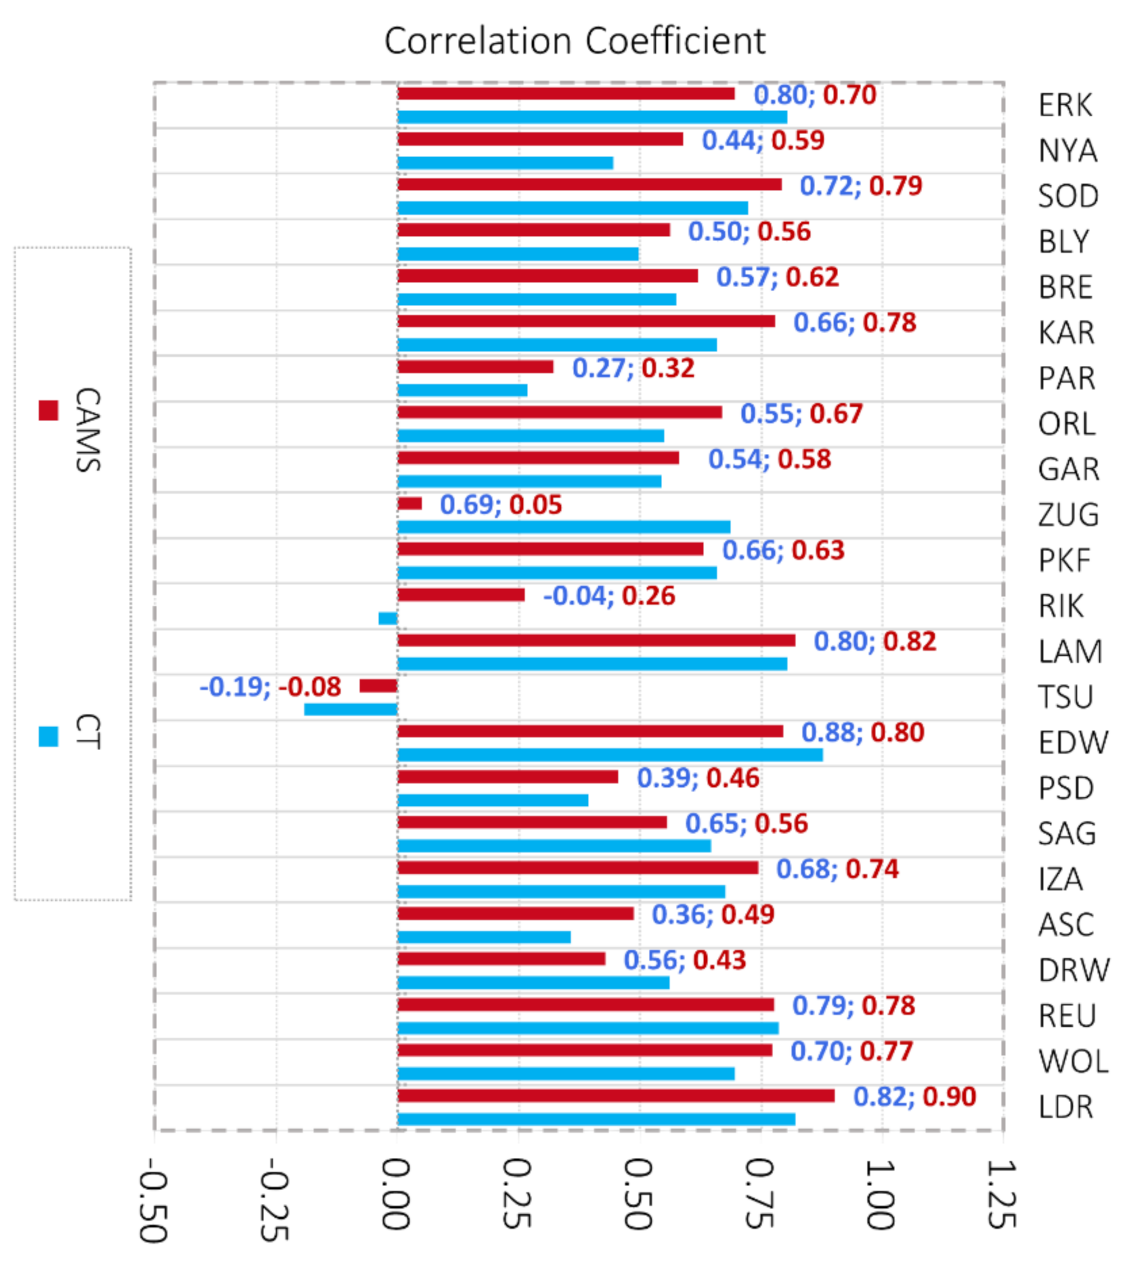
To check our premise, we make an assumption about the ability of the CO2 inverse models (CAMS, CT). To this end, we assume that, with relatively sparse horizontal resolution (scales of degrees), CT and CAMS would be relatively insensitive to strong, but localized, CO2 sources. Indeed, the CO2 inverse models are sensitive to the CO2 enhancements due to strong sources nearby, but this influence would result in a relatively stable high CO2 signal in the temporal dynamics of simulated CO2. Meanwhile, a TCCON station can be influenced by more sporadic influence of the neighboring source that may yield rather random peaks in CO2 signal at that station (thus, the agreement between these estimates would be lower). We choose monthly based resolution as a unit of the finest temporal resolution for this analysis and, due to this, MGRs are analyzed for every TCCON station considered by this study. We compare all MGRs simulated by CAMS and CT with MGRTCCON estimates. Then, by finding the closest center of the model grid cell to the TCCON station (as described in the CarbonTracker description in Section 2.3), we perform a comparison between the TCCON estimates (MGR) and the simulations projected at the grid cell within. The result is shown in Figure 9, that presents the correlation analysis using TCCON-CT (blue) and TCCON-CAMS (red) for the 23 TCCON stations with sufficient number of concurrent observations are given (model data are available until 2016). The modeled MGRs agree well with the MGRTCCON references. For CT, correlation coefficient ranges from –0.19 to 0.88 (median = 0.65) and for CAMS from −0.08 to 0.90 (median = 0.62). We identified very high agreement between CT and TCCON (r ≥ 0.80) at four stations, high agreement at three stations (0.70 ≤ r ≤ 0.79), reasonable agreement at five stations (0.60 ≤ r ≤ 0.69), and weak agreement at five stations (0.50 ≤ r ≤ 0.59). For CAMS, the results are similar as three, six, three, and four stations exhibited very high, high, reasonable, and weak agreements with TCCON references (with the same classification of the agreement ranges as shown above).
Therefore, at most stations (17/23 for both models) MGRTCCON estimates reasonably (or well) agree with the simulations at coarser resolution. It indicates a good ability of TCCON to capture background-like representative MGR without the strong influence of sporadic or strong sources undetected by the models. Since not all stations exhibit acceptable agreement rates in the TCCON-to-model comparison (r ≥ 0.50), it is sensible to analyze what drives the deteriorated agreement at these stations. According to CT and CAMS, the lowest agreement (in reproducing MGR) with TCCON (r < 0.50) is found for six stations including NYA, PSD, ASC, PAR, RIK, and TSU. For one case (NYA), the low agreement is most likely related to scanty monthly-based estimates as there are only 16 MGRs available for the period concurrent with the modeled results. For instance, the number of MGRs for PSD, ASC, PAR, and RIK are 66, 31, 22, 43, and 72, respectively. For the other five cases, it is unlikely the data issue, and it is also unlikely that the deteriorated agreement is entirely associated with regional vegetation patterns because there is no correlation between MGR and latitude in either of the models. Such vegetation proxy may seem simplistic, but the latitude of station provides a direct realistic indicator to vegetation activity when atmospheric CO2 is analyzed [84]. Since these stations are located in the different ecosystem regions (see Table S1.1. in Supplementary Materials), the low agreement is also unlikely related to the ecosystem flux prescription of the CO2 models.

4.3.2. Influence of the Urban CO2 Sites to TCCON Interannual Signal

We noticed that most stations with the deteriorated model-to-TCCON agreement, in reproducing MGR, are located inside or in a close vicinity to a megacity. Except the self-explanatory vicinity of PAR station to the eponymous megacity (Paris), TSU and RIK (to much less extent that TSU) are located in the vicinity to the Tokyo-Yokohama urban agglomeration, and PSD is located in the LA Basin and is therefore being affected by the neighboring Los Angeles Metropolitan area. To test the main hypothesis about the exposure of these sites to strong megacity sources, we addressed the urban pixels data from MODIS, as mentioned in the methodology. We calculated the area of all urban areas worldwide, and we measured the distance between each TCCON site and a neighboring urban area. As cities greatly vary, by size and their spatial structures, and since XCO2 often has quasi-linear agreement with city size [78], we classified all cities in three conditional categories: all cities (any urban area detected by MODIS), large cities (urban area > 500 km2), and megacities (urban area > 1,500 km2). Then, we calculated correlation coefficients between model-to-TCCON agreement rates (rCT-TCCON and rCAMS-TCCON that were shown on Figure 9) and the area of the closest city to TCCON station (‘d’ estimates in Table 2). As expected, there is a negative correlation between the size of neighboring cities and model-to-TCCON agreement rate (r = −0.61 for CT, −0.56 for CAMS with any city analysis, r = −0.52 with large city for CT, −0.48 for CAMS), where the highest agreement is found when we only take into account the megacities (r = −0.73 for CT, −0.61 for CAMS).
Based on these findings, we can treat the size of a closest megacity as the potentially influencing factor on the station-wise AGRTCCON and consider the distance to the closest megacity as a simple indicator of TCCON site exposure to a strong source. To test the effect of urban influence, we outline the category of “the most urbanized” TCCON sites, based on <40 km distance to the closest megacity (PAR, TSU, PSD, KAR, SAG). Let us note that, for two of these sites, we have already identified the largest discrepancy between station-wise AGRTCCON and [28] LM-based trends (absolute difference = 0.34 ppm for PSD and 0.57 for PAR) while, for other sites, the discrepancy is significantly lower (<0.16 ppm). Alongside the main AGRTCCON estimate (presumably contaminated by the presence of urban CO2 sources), we calculated another AGRTCCON, with no urban influence, as a test (the most urbanized sites are forfeited). The difference between these estimates only matters starting from 2011, when the first station from the most urbanized list started providing observations. In this period (2011–2016), there is no big difference between our actual AGRTCCON estimate and urban-free AGR (without these stations). The difference ranges from negligible ~0.00 ppm (2013, 2014) to 0.29 ppm (2017) despite, during some years, the most urbanized sites represented > 20% of the TCCON observational coverage (for details, see Figure S2.5 from the Supplementary Materials). This finding unambiguously hints on the independence of AGRTCCON estimates from the propagation of the localized signal to the global CO2 growth estimates. Theoretically, there should be good correlation between both megacity size and distance to megacity when TCCON-to-model disagreement is analyzed, but it is not the case. The correlation coefficient between TCCON-to-model agreement and distance is low (|r| < 0.30), and there are no signs of the significant relationship between TCCON-to-model agreement and both variables if the regression model is made (Figure is omitted). The lack of regression-like dependence is reasonably explained by the existence of three different groups of TCCON sites based on their vicinity to the megacities. These groups have their own distinct patterns of agreement between TCCON-to-model discrepancies and urban parameters. For details, a reader can refer to the Supplementary Materials (Figure S2.6 and the related section). We underline that the urban influence is a hypothetical explanation for the observed agreement, while the disagreement at some TCCON sites can also be potentially related to failing to capture topographical features around the site in the relatively coarse resolution models. For RIK, the alternative explanation can be related to the occasional exposure of RIK station by biomass burning from Siberia or Alaska [85].

4.3.3. Ascension Station: Data Gaps, Localized Influence of Atmospheric Mixing

While we can explain the model-to-TCCON discrepancies in reproducing MGR by the role of cities (and for NYA by short time series), for ASC, such explanation cannot be applied. The time series of MGR is relatively short (30) for ASC but is not critical as, for instance, there are only 29 MGRs for EDW where good TCCON-to-model agreements are found. MGR varies from 1.11 to 3.51 ppm (median = 2.30 ppm) and AGR varies from 1.63 to 2.78 (median = 2.38 ppm) according to the time series analysis. As seen, there were no anomalous peaks or drawdowns of CO2 (see Supplementary Figure S2.7). The lack of anomalous features in AGR points to the lack of exposure to occasional data gaps in measurements from ASC. As mentioned, we assumed that the CO2 inverse models are suitable for determining true “background” CO2 conditions for a particular grid cell, but these models do not always agree with each other in reproducing CO2 growth rates [22]. As for CT and CAMS, there is no need for cross-validation of global-scale MGR (or AGR) because their agreement is ideal at global scales (r = 1.00). However, at local scales, the CO2 growth variability may vary from model to model. The evidences of AGR spatial variability, at various scales, are occasionally reported by using ground-based observations [86], spaceborne measurements [4,8], and CO2 inverse models [87,88]. To check these differences and their link to the model-to-TCCON agreement at some stations, including ASC, the intercomparison between the CT and the CAMS CO2 growth rates is made.
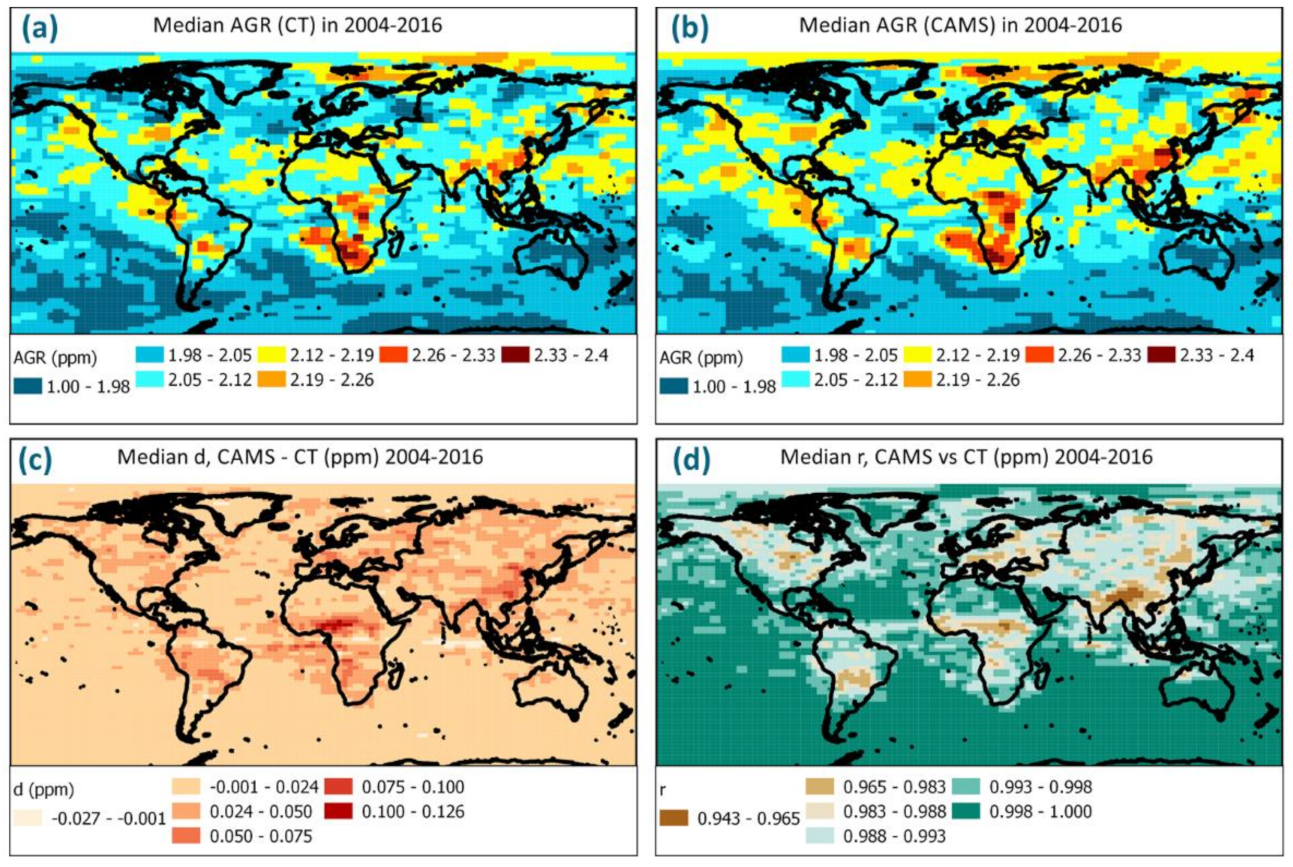
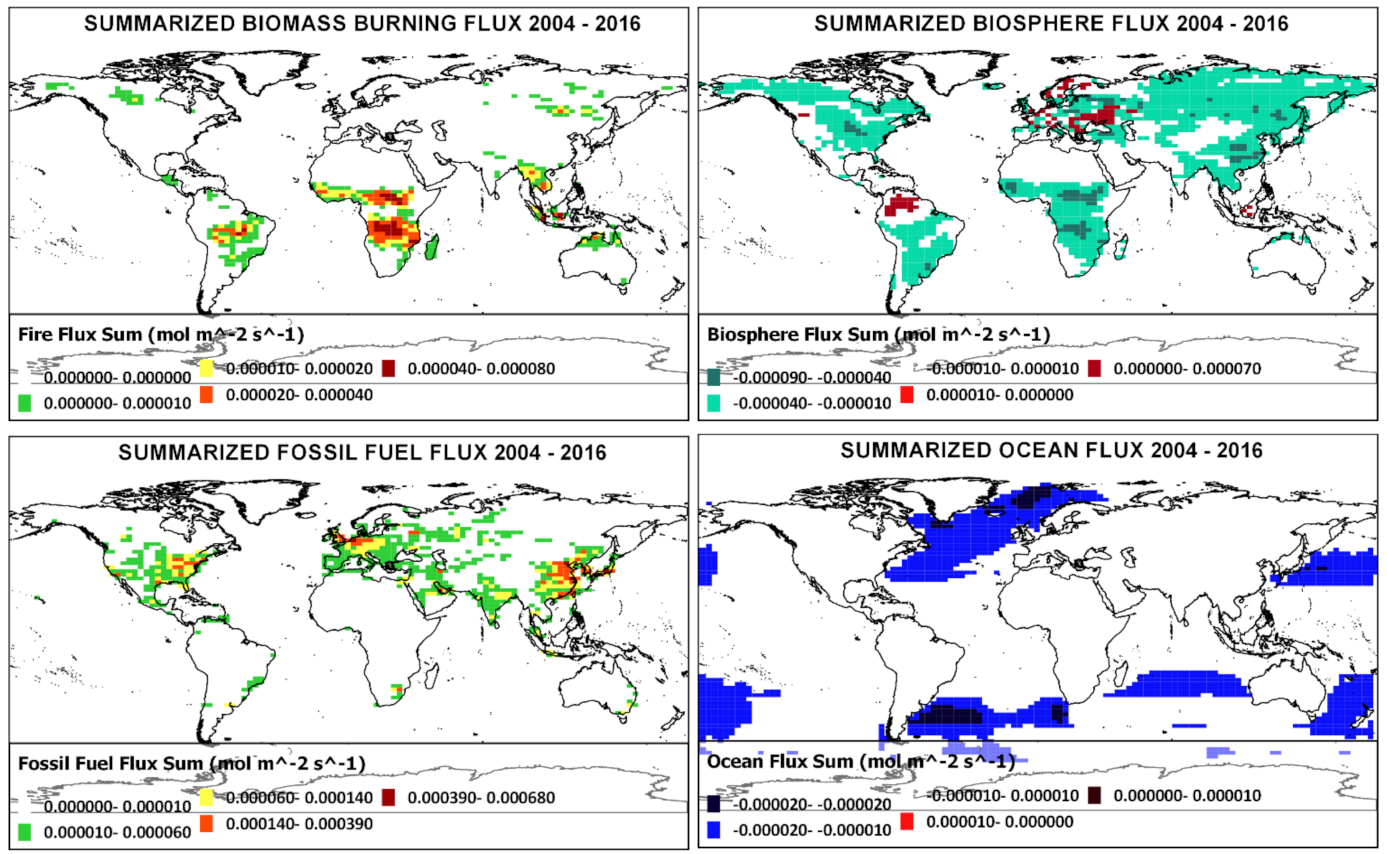
To this end, we analyze the finest spatial scales of the model agreement for simulating AGR by testing grid cell correlation (Figure 10). Grid cell correlation was applied to every single grid cell that represents the minimum spatial domain of the model (3° × 2°) for the entire modelling period (2004–2016). The models almost perfectly agree with each other. The left-bottom panel of Figure 10 shows that the mean difference (d) between AGRCT and AGRCAMS estimates (in 2004–2016 period) spatially varies from −0.06 to 0.16 ppm range (median d = 0.01 ppm ± 0.02). Likewise, the correlation between CT and CAMS (right-bottom panel of Figure 10) in reproducing the spatial variability of AGR is very high and ranges from 0.88 to 1.00 (r = 0.99 in median indicating excellent agreement). Despite this, some differences are notable, and the largest model differences in simulating AGR are reported over East Asia (d = 0.20 ppm), which is the strongest FFCO2 source region in the world [89], and over the Middle-Western Africa (d = 0.14 ppm), where the strongest biomass burning events are frequently reported using MODIS data by GFED [90]. The difference between AGR estimates, provided by two different models, can be associated with the transport model errors, so these transport model-driven discrepancies are better seen in the region of strong biomass burning. The latter is an interesting finding given the vicinity of ASC to the Middle-Western Africa. Note that all CT-CAMS differences in reproducing AGR at spatial scales are reported in the Supplementary Materials (Table S2.2).
Unsurprisingly, the model-to-TCCON agreement was plagued in ASC because the models also do not perfectly agree in reproducing growth-rate quantities of CO2 over this region, as we have shown in the previous paragraph. It is hard to check the surmise on the exposure of ASC to the biomass burning areas just by qualitative analysis of Figure 10 because ASC is located at a relatively remote island in the Atlantic Ocean. However, the measurement footprint of ASC (starting from 6 days before the measurements) embraces the Middle-Western Africa, thus making ASC sensitive to the zone of strong and regular biomass burning [91]. We suggest that, ASC model-to-TCCON comparison is complicated precisely due to the influence of this biomass burning region. To check this suggestion, we calculated the sum of all available optimized fluxes from CT (including FFCO2, biomass burning, biosphere and ocean fluxes, separately) for the entire modelling period of 2004–2016 (Figure 11). There is no direct evidence about the link between the CAMS-CT grid cell correlation with the summarized biomass burning flux distributed across the same cells (for the entire period, the strongest correlation is only r = 0.40 between the biosphere summarized flux and the CAMS-CT AGR spatial correlation). The correlation is likely weakened due to role of atmospheric transport, as there is no perfect match between the grid where fluxes were observed and where CO2 is quickly transported. Despite this, one can recognize three regions with the highest AGR estimates from Figure 11, according to CT and CAMS (Middle-Western Africa, the Amazon, and East Asia). More specifically, the disagreement observed over the Amazon is spatially overlapped with the second strongest source of biomass burning CO2 (Figure 11, the top-left panel). Meanwhile, the discrepancy between the models over East Asia is seemingly related to the strongest FFCO2 cumulative emissions in the world (Figure 11, the bottom-left panel).
From this point, Middle-Western Africa is included in measurement footprint of ASC, and it is the strongest source of biomass burning in the world. The same region broadly corresponds to the strongest region of CAMS-CT discrepancies that are likely driven by these biomass burning effects. The conclusion about the link between the strongest biomass burning region in the world with the strongest CT-CAMS discrepancies is based on qualitative evidences. However, these evidences are clearly manifested at the spatial scales, and one can expect similar regional statistics (to what we have reported above) if CT-to-CAMS MGR discrepancies are compared against summarized biomass burning fluxes on arbitrary defined regions such as Middle-Western Africa, East Asia, or Amazon. It should be pointed out that these minor discrepancies between the models (and between the model and TCCON at ASC) could even be underestimated because current pan-tropical sources of carbon can be easily underestimated by CO2 models [92]. The only suggestion about biomass burning-driven disagreement between the models in ASC is also reasonable because we can refute the role of the atmospheric vertical exchange in this disagreement. Theoretically, the atmospheric CO2 columnar concentration is controlled by the surface, but the models do not always capture this surface-governed variation due to variable atmospheric mixing conditions from site to site. If the atmosphere is well mixed, we would observe the correlation between these data in the interannual growth form (model and surface). The model differences in column-averaged CO2 estimates are largely driven by the modelling deficiencies in capturing temporally and spatially varying surface fluxes [93]. We used land and the island-based surface CO2 observation sites (see Figure S2.8 in the Supplementary Materials) to calculate correlation between the surface observation-based MGR estimates (at the surface level) and the modeled MGR estimates (CT, CAMS). Both modeled MGR types (CAMS and CT) generally disagree with the surface observations at the inland measurement stations within a mid-latitude belt of the Northern Hemisphere. However, at most coastal sites, the island sites and southern hemisphere sites, the agreement between the surface and the MGR simulations is high (including ASC as well; r = 0.82 for and 0.85 for CT and CAMS, respectively, n = 168). The strong positive correlation clearly indicates that the atmospheric mixing, governed by surface processes, is captured well by the CO2 models (r > 0.75 for most other sites, not only ASC as shown in the Supplementary Table S2.3), further suggesting that the atmospheric mixing is not the main driver of ASC disagreement between the models. Thus, the ASC case is explainable and representative for the tropics, where most of the instruments provide sub-sampled CO2 observations [23], either due to the infrastructure-driven difficulties or being constrained by the current limitations of environmental monitoring instrumentation.

5. Discussion

This study examined the sensitivity of the TCCON aggregated signal in 2006–2019, to the global CO2 Annual Growth Rate (AGR), and estimated the robustness of the global AGRTCCON estimates, given the existing spatio-temporal gaps in the network.
First, we observed that the global AGRTCCON estimates, retrieved using the current methodology and data sampling, are robust in a given period, as they are not sensitive to sub-annual variability, the differences in time series across the sites, or to the data sampling and are weakly sensitive to seasonality. The very minor association of AGRTCCON calculus with seasonality was confirmed by analyzing Tsukuba, Park Falls, and Garmisch. Despite different geographic locations, average MGRs (annual or 12-month long CO2 growth estimates projected at each month) agree well by magnitude across these sites. If three average MGRs from these sites are expressed as the ranges, one obtains 2.31–2.48 ppm range (for all seasons), 2.03–2.67 ppm (winter), 1.80–2.19 ppm (spring), 2.24–2.54 ppm (summer), and 2.21–2.70 ppm (autumn). Sub-annual variability was not driven by the station-wise AGR estimates. For eight stations, the uncertainties, taking into account that both the variability and data gaps, were low (<33% from station-wise AGR for 2006–2019 in average), for 13 stations were reasonable (<50%), and only for three stations (Paris, Eureka, Orleans) these uncertainties were high (>50%). Despite these uncertainties, the station-wise AGRTCCON expressed reasonable variability, without strong sensitivity to seasonality, as they exhibited low discrepancies with the seasonality-sensitive CO2 trends from Lindqvist et al. [28] methodology (absolute differences < 0.56 ppm for all sites, <0.16 ppm for non-urban sites, median difference = 0.03 ppm). Yet, the perfect agreement in the terms of Lindqvist et al. [28] uncertainties (<0.10 ppm difference) was confirmed only for Edwards, Park Falls, and Orleans, thus, local AGRTCCON estimates from the other sites were slightly affected by the true seasonality of TCCON XCO2 observations. Given strong variability of CO2 across the TCCON stations, it is highly remarkable that we confirmed the lack of sensitivity of station-wise AGRTCCON (at any station) to the daily (number of observations per day), monthly (MGR), or annual (AGR) data abundance statistics. Most importantly, our data sampling of TCCON observations has not affected ultimate global AGRTCCON estimates (that represent the main subject of this study), as changing the ‘daily threshold’ (the minimum number of days with observations per month allowing to calculate MGR) from 2 to 25 leads to relatively low annual error spread across various potential global AGR estimates (2.4–17.9%). In other words, even 2 days of observations per month allows calculating statistically robust AGRTCCON estimates from a single TCCON station to be used for global CO2 growth calculation using the TCCON data. We underline that a highly uneven number of the operative TCCON stations (2 stations in 2006–2007; 24 stations in 2017) is a stronger, but inevitable, constraint for AGRTCCON calculation (than seasonality or data sampling at each station), which is weakening as the number of the TCCON stations is increased. Theoretically, more stations could be used after 2011, but due to scanty long-term observations, we forfeited some stations from the analysis. This forfeiture has not affected global AGRTCCON because, if we include all three available MGRs from the excluded Anmyeondo site [94] to the calculation of global AGRTCCON, the difference between the final global AGRTCCON estimate and an experimental global AGRTCCON (with Anmyeondo) would be negligible (~0.1 ppm for 2016 and 2017).
Second, we confirmed the quantitative sensitivity of TCCON aggregated signal to global CO2 growth of the global AGRTCCON estimates by reporting satisfactory agreement between AGRTCCON and the existing AGR references. TCCON yields global AGR temporal dynamics (AGRTCCON = 1.59–3.27 ppm) of similar magnitude to the references from the composite satellite data (AGRSAT = 1.57–2.94 ppm) and to the global carbon budget (AGRGCB = 1.57–2.85). The highest global atmospheric CO2 growth rate (2015/2016), caused by the record El Niño event, was well reproduced by the TCCON given the uncertainty range (AGRTCCON = 3.27 ± 0.82 ppm; AGRSAT = 2.87 ± 0.22 ppm). However, the agreement between global AGRTCCON and the AGR references was rather weak in the intercomparison period of 2006–2017 (r = 0.37 for TCCON vs. SAT; r = 0.50 for TCCON vs. GCB). The deterioration of the agreement is evidenced for 2008 and 2015. In 2008, global AGRTCCON estimate (2.64 ppm) was plagued by the excessive uncertainty during this year (3.92 ppm or 148% from the AGR estimate), driven by the excessive sub-annual variability of the station-wise AGR and the lack of stations worldwide. We also identified the potential drivers of the 2008 and 2015 TCCON-to-reference global AGR disagreements linked to the steep interannual transitions between the ENSO phases. There are substantial ENSO-driven biases between global AGRTCCON and the references in 2008 and 2015 (years prior to the steepest El Niño/La Niña interannual transitions during the study period). Namely, these biases emerged during the shift from strong (−3) to weak La Niña (−1), in 2008/2009, and the shift from weak (+1) to very strong El Niño (+4) in 2015/2016. The agreement between global AGRTCCON with the AGR references is substantially improved if the estimates affected by steep ENSO transitions (2008, 2015) are forfeited (r = 0.83 for TCCON vs. SAT, r = 0.67 for TCCON vs. GCB). Such rate of agreement exceeds the agreements between global AGRTCCON and AGR from the surface CO2 observations (r = 0.61) discerned earlier [95]. Notably, we showed that global AGRTCCON is peculiarly sensitive to ENSO in May-June-July (MJJ) season. The role of MJJ ENSO anomalies in forming AGRTCCON can be complex, as strong El Niño events can become a large-scale triggering factor for cascading emergence of regionally-specific (and sometimes contrasting) effects in local carbon cycle [12] at some TCCON sites. Due to complexity, the exact physical mechanism of MJJ ENSO exposure is not explained in the scopes of our study, and a separate effort should be dedicated to AGRTCCON-ENSO relationship analysis.
In addition, we estimated the potential role of local CO2 influences for TCCON sites that could affect global AGRTCCON. We analyzed the agreement between MGRTCCON and the CO2 inverse models (CT and CAMS). At most stations (17/23), the agreement between MGRTCCON and the MGR simulations was reasonably high (r > 0.60). We identified that the TCCON-to-model disagreement was driven by the shortness of time series (for Ny-Ålesund) and potential exposure of TCCON sites to the neighboring megacities, and likely their CO2 sources (Paris, Rikubetsu, Pasadena, Tsukuba). The surmise about urban sources was supported by the analysis of MODIS urban pixels, as we discerned the agreement of TCCON-to-model discrepancy against urban spatial characteristics from MODIS. We disclosed a link between this disagreement and the size of the closest megacity (urban area of >1500 km2) located around a certain TCCON station. In this way, the potential footprint of urban sources on global AGRTCCON estimates was evaluated by outlining “the most urbanized” TCCON sites (Paris, Tsukuba, Saga, Pasadena, and Karlsruhe) by their vicinity to megacities (based on <40 km distance criterion). We reported a low sensitivity of the global AGRTCCON to the presence of strong source-driven noise in the interannual signal as the difference between the original AGRTCCON and AGRTCCON (globally) without “the most urbanized sites” ranged from negligibly low ~0.00 ppm to 0.29 ppm (2017). This is a remarkable finding because “most urbanized sites” composed >20% of the TCCON observational coverage in 2017. Future studies should, however, consider that strong CO2 sources are not always attributed to built-up zones with clear spatial extent and structure like megacities. They can be attributed to power plant emissions [96] and power plants outside urban areas, which are not visible by the MODIS urban pixels. Therefore, it might be useful to use a power plant location dataset to complement our hypothesis. Ascension was the last TCCON site where we identified TCCON-to-model MGR disagreement. Both models exhibited good agreement with MGR estimates from the surface data in Ascension, therefore refuting the surmise about the role of vertical mixing in this disagreement. This disagreement may be due to the inability to reproduce CO2 growth by CAMS and CT, as Ascension is closely located to the Mid-Western Africa that stands out with the strongest CO2 outflux in the world in 2006–2016 (according to biomass burning optimized fluxes from CO2 inverse models). The TCCON-to-model disagreement at Ascension may indicate that TCCON is apparently providing more accurate MGR (and AGR) than simulated MGR (and AGR) by CO2 inverse models. The comparison of modeled spatial variations of AGR also emphasized the potential gaps in our knowledge about carbon fluxes in the Middle-Western Africa, which potentially affected the accuracy of modeled AGR in the region. This is the indirect, but insightful, indication about where more TCCON stations are needed to capture pivotal tropical carbon exchange processes. We preliminarily suggest that the drivers, of peculiar sensitivity to strong ENSO events (we identified above), can be hidden there, but this hypothesis should be checked in future studies.

6. Conclusions

A baseline algorithm, for retrieving global CO2 growth rate using TCCON, can complement the existing set of observational tools that register global CO2 increase. Our study paves the way towards such algorithm in two ways. First, we showed promising results by proving that the TCCON aggregated observations are currently sensitive to global CO2 growth and can provide global CO2 growth estimates, which are insensitive to data sampling and reasonably agree with the published references. These are promising findings given the quasi-global coverage of the network and irregular data sampling. Hence, the current spatio-temporal gaps of the network are important, but not critical constraints for quantifying CO2 growth on global scales. Second, we used the limitations, which hamper the introduction of the baseline algorithm for CO2 growth calculation using TCCON, to provide tailored guidelines for future studies which will work on this topic. The disagreement between CO2 global growth from TCCON and the references in 2008 (driven by high CO2 growth uncertainties due to lack of TCCON stations) hints that the expansion of TCCON would be beneficial especially in the strong biomass burning or combustion regions such as Middle-Western Africa (and tropics in general) where we identified salient disagreement between the CO2 models in reproducing CO2 growth rate. Since not only the increase in number of sites, but their locations and the timing of observations, would be crucial, the measurement footprints of the TCCON sites [26] should be included in the analysis of the network sensitivity to CO2 global increase. As we identified some ENSO-related biases between global CO2 growth from TCCON with the references during the years of strong ENSO transitions (2008, 2015), future studies can thoroughly investigate this dependence. One can quantify the sensitivity of regional clusters made up of TCCON stations (such as temperate Northern Hemisphere stations, tropical Northern Hemisphere stations, etc.) to strong sea surface temperature anomalies driven by ENSO. Such analysis can unravel non-linear responses to strong ENSO events by some stations, which could potentially distort the global signal towards under/overestimation of CO2 growth compared to the references during the years of strong ENSO transitions. These analyses can be performed alongside comparing different data sampling strategies and CO2 growth calculation approaches when the next version of TCCON data will be published. Only in this way, the operational version of the CO2 growth retrieval algorithm, using global TCCON data, can be established.

Supplementary Materials

The following are available online at https://www.mdpi.com/article/10.3390/rs13193868/s1. Table S.1.1: Description of all TCCON sites; Figure S.1.1: Detailed map of locations of TCCON sites in Europe; Figure S.1.2: Analysis of the total number of MGRs available for the study period; Figure S.2.1: The relationship between minimum threshold of daily observations for MGR and total numbers of NGR in 2003 – 2016 period and also number of TCCON sites; Table S.2.1: Summarized amount of MGRs for each month for all TCCON stations used in this study; Table S.2.2. AGR estimates from satellite data (SAT AGR), Global Carbon Budget (GCB AGR) that originates from surface atmospheric CO2 measurements and TCCON (TCCON AGR). Figure S.2.3: MGR versus ONI indices; Figure S.2.4: Correlation coefficient between TCCON-SAT bias and TCCON-GCB and ONI for different combinations of months; Figure S.2.5 Difference between AGRTCCON estimates provided by all TCCON stations and TCCON stations without urban signal. Figure S.2.6: Relationship between ‘distance to megacity” and ‘model-to-TCCON disagreement’. Figure S.2.7: XCO2, MGR and AGR time series for ASC (Ascension) TCCON site. Table S.2.2: Calculating median differences (CAMS–CT) and correlation coefficients (CAMS vs CT) of AGR for various regions worldwide. Table S.2.3 Correlation between surface data-based MGR and modeled MGR for CT and CAMS.

Author Contributions

Original draft preparation, original idea and data analysis, writing, L.D.L.; manuscript review, editing and methodology development, S.T.K.; providing AGR fitting analysis and manuscript review and editing, H.L.; manuscript review and editing, J.K. and S.L.; data support and assisting with editing, Y.-H.B. and T.-Y.G. All authors have read and agreed to the published version of the manuscript.

Funding

This research was funded by the Korea Meteorological Administration Research and Development Program, “Development of application technology on atmospheric research aircraft”, under grant (KMA2018-00222). Funding institute: National Institute of Meteorological Sciences.

Institutional Review Board Statement

Not applicable.

Informed Consent Statement

Not applicable.

Data Availability Statement

All the datasets used for this manuscript are available in the open access. All the required links for the data used in this study are provided in the methodology alongside with the date of the last access.

Acknowledgments

We appreciate the efforts of all researchers who have been studying the atmospheric growth of CO2 and interannual variations of carbon and also acknowledge technicians who have been involved in collecting field data for these purposes. We acknowledge the entire TCCON community for hard work in collecting and processing all these observations around the globe. TCCON data were obtained from TCCON Data Archive, hosted by CaltechDATA (https://tccondata.org). All respective data identifiers for the TCCON data are provided in the references. CarbonTracker CT2017 results provided by NOAA ESRL, Boulder, Colorado, USA from the website at http://carbontracker.noaa.gov. We thank the Copernicus Atmosphere Monitoring Service (CAMS) for CAMS data; CAMS is operated by the European Centre for Medium Range Weather Forecasts on behalf of the European Commission as part of the Copernicus Programme We also thank the teams responsible for production of MODIS urban pixels and ONI datasets. We acknowledge the significant contribution of N. Deutscher (TCCON co-chair—Asia/Oceania) to the results of this manuscript as he provided valuable suggestions to our research and coordinated our collaboration with the TCCON community. We also appreciate the useful comments from the TCCON community that helped improving the quality of the scientific analysis in this study. The main author (L.D.L.) thanks A. Reznikova, M. De Lange and E. Hekman for providing required facilities for efficient continuation of this research at the peak of the COVID-19 period. H.L. acknowledges support from the Academy of Finland (project 331829).

Conflicts of Interest

The authors declare that they have no conflict of interest.

References

  1. Betts, R.A.; Jones, C.D.; Knight, J.R.; Keeling, R.F.; Kennedy, J.J. El Niño and a record CO2 rise. Nat. Clim. Chang. 2016, 6, 806–810. [Google Scholar] [CrossRef]
  2. Stips, A.; Macias, D.; Coughlan, C.; Garcia-Gorriz, E.; Liang, X.S. On the causal structure between CO2 and global temperature. Sci. Rep. 2016, 6, 21691. [Google Scholar] [CrossRef] [PubMed] [Green Version]
  3. Canadell, J.G.; Le Quere, C.; Raupach, M.R.; Field, C.B.; Buitenhuis, E.T.; Ciais, P.; Conway, T.J.; Gillett, N.P.; Houghton, R.A.; Marland, G. Contributions to accelerating atmospheric CO2 growth from economic activity, carbon intensity, and efficiency of natural sinks. Proc. Natl. Acad. Sci. USA 2007, 104, 18866–18870. [Google Scholar] [CrossRef] [PubMed] [Green Version]
  4. Schneising, O.; Reuter, M.; Buchwitz, M.; Heymann, J.; Bovensmann, H.; Burrows, J.P. Terrestrial carbon sink observed from space: Variation of growth rates and seasonal cycle amplitudes in response to interannual surface temperature variability. Atmos. Chem. Phys. 2014, 14, 133–141. [Google Scholar] [CrossRef] [Green Version]
  5. Friedlingstein, P. Carbon cycle feedbacks and future climate change. Philos. Trans. R. Soc. A 2015, 373, 20140421. [Google Scholar] [CrossRef] [PubMed] [Green Version]
  6. Keenan, T.F.; Prentice, I.C.; Canadell, J.G.; Williams, C.A.; Wang, H.; Raupach, M.; Collatz, G.J. Recent pause in the growth rate of atmospheric CO2 due to enhanced terrestrial carbon uptake. Nat. Commun. 2016, 7, 13428. [Google Scholar] [CrossRef] [PubMed] [Green Version]
  7. Buchwitz, M.; Schneising, O.; Burrows, J.P.; Bovensmann, H.; Reuter, M.; Notholt, J. First direct observation of the atmospheric CO2 year-to-year increase from space. Atmos. Chem. Phys. 2007, 7, 4249–4256. [Google Scholar] [CrossRef] [Green Version]
  8. Buchwitz, M.; Reuter, M.; Schneising, O.; Noël, S.; Gier, B.; Bovensmann, H.; Burrows, J.P.; Boesch, H.; Anand, J.; Parker, R.J.; et al. Computation and analysis of atmospheric carbon dioxide annual mean growth rates from satellite observations during 2003–2016. Atmos. Chem. Phys. 2018, 18, 17355–17370. [Google Scholar] [CrossRef] [Green Version]
  9. Ekwurzel, B.; Boneham, J.; Dalton, M.W.; Heede, R.; Mera, R.J.; Allen, M.R.; Frumhoff, P.C. The rise in global atmospheric CO2, surface temperature, and sea level from emissions traced to major carbon producers. Clim. Chang. 2017, 144, 579–590. [Google Scholar] [CrossRef] [Green Version]
  10. Wang, W.; Ciais, P.; Nemani, R.R.; Canadell, J.G.; Piao, S.; Sitch, S.; White, M.A.; Hashimoto, H.; Milesi, C.; Myneni, R.B. Variations in atmospheric CO2 growth rates coupled with tropical temperature. Proc. Natl. Acad. Sci. USA 2013, 110, 13061–13066. [Google Scholar] [CrossRef] [Green Version]
  11. Kim, J.-S.; Kug, J.-S.; Jeong, S.-J. Intensification of terrestrial carbon cycle related to El Niño–Southern Oscillation under greenhouse warming. Nat. Commun. 2017, 8, 1674. [Google Scholar] [CrossRef] [PubMed] [Green Version]
  12. Liu, J.; Bowman, K.W.; Schimel, D.S.; Parazoo, N.C.; Jiang, Z.; Lee, M.; Bloom, A.A.; Wunch, D.; Frankenberg, C.; Sun, Y.; et al. Contrasting carbon cycle responses of the tropical continents to the 2015–2016 El Niño. Science 2017, 358, eaam5690. [Google Scholar] [CrossRef] [PubMed] [Green Version]
  13. Chylek, P.; Tans, P.; Christy, J.; Dubey, M.K. The carbon cycle response to two El Nino types: An observational study. Environ. Res. Lett. 2018, 13, 024001. [Google Scholar] [CrossRef]
  14. Betts, R.A.; Jones, C.D.; Knight, J.R.; Keeling, R.F.; Kennedy, J.J.; Wiltshire, A.J.; Andrew, R.M.; Aragão, L.E.O.C. A successful prediction of the record CO2 rise associated with the 2015/2016 El Niño. Philos. Trans. R. Soc. B 2018, 373, 20170301. [Google Scholar] [CrossRef] [Green Version]
  15. Frölicher, T.L.; Joos, F.; Raible, C.C.; Sarmiento, J.L. Atmospheric CO2 response to volcanic eruptions: The role of ENSO, season, and variability: Volcanoes and the global carbon budget. Glob. Biogeochem. Cycles 2013, 27, 239–251. [Google Scholar] [CrossRef] [Green Version]
  16. Rafelski, L.E.; Piper, S.C.; Keeling, R.F. Climate effects on atmospheric carbon dioxide over the last century. Tellus B Chem. Phys. Meteorol. 2009, 61, 718–731. [Google Scholar] [CrossRef]
  17. Poulter, B.; Frank, D.; Ciais, P.; Myneni, R.B.; Andela, N.; Bi, J.; Broquet, G.; Canadell, J.G.; Chevallier, F.; Liu, Y.Y.; et al. Contribution of semi-arid ecosystems to interannual variability of the global carbon cycle. Nature 2014, 509, 600–603. [Google Scholar] [CrossRef] [Green Version]
  18. Piao, S.; Wang, X.; Wang, K.; Li, X.; Bastos, A.; Canadell, J.G.; Ciais, P.; Friedlingstein, P.; Sitch, S. Interannual variation of terrestrial carbon cycle: Issues and perspectives. Glob. Chang. Biol. 2020, 26, 300–318. [Google Scholar] [CrossRef] [Green Version]
  19. Dlugokencky, E.; Tans, P. Trends in Atmospheric Carbon Dioxide, National Oceanic & Atmospheric Administration, Earth System Research Laboratory (NOAA/ESRL). 2018. Available online: http://www.esrl.noaa.gov/gmd/ccgg/trends/global.html (accessed on 29 July 2020).
  20. Friedlingstein, P.; Jones, M.W.; O’Sullivan, M.; Andrew, R.M.; Hauck, J.; Peters, G.P.; Peters, W.; Pongratz, J.; Sitch, S.; Le Quéré, C.; et al. Global Carbon Budget 2019. Earth Syst. Sci. Data 2019, 11, 1783–1838. [Google Scholar] [CrossRef] [Green Version]
  21. Reuter, M.; Buchwitz, M.; Schneising, O.; Noël, S.; Bovensmann, H.; Burrows, J.P.; Boesch, H.; Di Noia, A.; Anand, J.; Parker, R.J.; et al. Ensemble-based satellite-derived carbon dioxide and methane column-averaged dry-air mole fraction data sets (2003–2018) for carbon and climate applications. Atmos. Meas. Tech. 2020, 13, 789–819. [Google Scholar] [CrossRef] [Green Version]
  22. Gaubert, B.; Stephens, B.B.; Basu, S.; Chevallier, F.; Deng, F.; Kor, E.A.; Patra, P.K.; Peters, W.; Rodenbeck, C.; Saeki, T.; et al. Global atmospheric CO2 inverse models converging on neutral tropical land exchange, but disagreeing on fossil fuel and atmospheric growth rate. Biogeosciences 2019, 16, 117–134. [Google Scholar] [CrossRef] [Green Version]
  23. Ciais, P.; Dolman, A.J.; Bombelli, A.; Duren, R.; Peregon, A.; Rayner, P.J.; Miller, C.; Gobron, N.; Kinderman, G.; Marland, G.; et al. Current systematic carbon-cycle observations and the need for implementing a policy-relevant carbon observing system. Biogeosciences 2014, 11, 3547–3602. [Google Scholar] [CrossRef] [Green Version]
  24. O’Dell, C.W.; Eldering, A.; Wennberg, P.O.; Crisp, D.; Gunson, M.R.; Fisher, B.; Frankenberg, C.; Kiel, M.; Lindqvist, H.; Mandrake, L.; et al. Improved retrievals of carbon dioxide from Orbiting Carbon Observatory-2 with the version 8 ACOS algorithm. Atmos. Meas. Tech. 2018, 11, 6539–6576. [Google Scholar] [CrossRef] [Green Version]
  25. Keppel-Aleks, G.; Wolf, A.S.; Mu, M.; Doney, S.C.; Morton, D.C.; Kasibhatla, P.S.; Miller, J.B.; Dlugokencky, E.J.; Randerson, J.T. Separating the influence of temperature, drought, and fire on interannual variability in atmospheric CO2. Glob. Biogeochem. Cycles 2014, 28, 1295–1310. [Google Scholar] [CrossRef] [Green Version]
  26. Belikov, D.A.; Maksyutov, S.; Ganshin, A.; Zhuravlev, R.; Deutscher, N.M.; Wunch, D.; Feist, D.G.; Morino, I.; Parker, R.J.; Strong, K.; et al. Study of the footprints of short-term variation in XCO2; observed by TCCON sites using NIES and FLEXPART atmospheric transport models. Atmos. Chem. Phys. 2017, 17, 143–157. [Google Scholar] [CrossRef] [Green Version]
  27. Chevallier, F.; Deutscher, N.M.; Conway, T.J.; Ciais, P.; Ciattaglia, L.; Dohe, S.; Fröhlich, M.; Gomez-Pelaez, A.J.; Griffith, D.; Hase, F.; et al. Global CO2 fluxes inferred from surface air-sample measurements and from TCCON retrievals of the CO2 total column: TWO CO2 FLUX INVERSIONS. Geophys. Res. Lett. 2011, 38. [Google Scholar] [CrossRef] [Green Version]
  28. Lindqvist, H.; O’Dell, C.W.; Basu, S.; Boesch, H.; Chevallier, F.; Deutscher, N.; Feng, L.; Fisher, B.; Hase, F.; Inoue, M.; et al. Does GOSAT capture the true seasonal cycle of carbon dioxide? Atmos. Chem. Phys. 2015, 15, 13023–13040. [Google Scholar] [CrossRef] [Green Version]
  29. Messerschmidt, J.; Parazoo, N.; Wunch, D.; Deutscher, N.M.; Roehl, C.; Warneke, T.; Wennberg, P.O. Evaluation of seasonal atmosphere–biosphere exchange estimations with TCCON measurements. Atmos. Chem. Phys. 2013, 13, 5103–5115. [Google Scholar] [CrossRef] [Green Version]
  30. Wunch, D.; Wennberg, P.O.; Osterman, G.; Fisher, B.; Naylor, B.; Roehl, C.M.; O’Dell, C.; Mandrake, L.; Viatte, C.; Kiel, M.; et al. Comparisons of the Orbiting Carbon Observatory-2 (OCO-2) X CO2 measurements with TCCON. Atmos. Meas. Tech. 2017, 10, 2209–2238. [Google Scholar] [CrossRef] [Green Version]
  31. Sussmann, R.; Rettinger, M. Can We Measure a COVID-19-Related Slowdown in Atmospheric CO2 Growth? Sensitivity of Total Carbon Column Observations. Remote Sens. 2020, 12, 2387. [Google Scholar] [CrossRef]
  32. Peters, G.P.; Le Quéré, C.; Andrew, R.M.; Canadell, J.G.; Friedlingstein, P.; Ilyina, T.; Jackson, R.B.; Joos, F.; Korsbakken, J.I.; McKinley, G.A.; et al. Towards real-time verification of CO2 emissions. Nat. Clim. Chang. 2017, 7, 848–850. [Google Scholar] [CrossRef] [Green Version]
  33. Chevallier, F. On the parallelization of atmospheric inversions of CO2; surface fluxes within a variational framework. Geosci. Model Dev. 2013, 6, 783–790. [Google Scholar] [CrossRef] [Green Version]
  34. Wunch, D.; Toon, G.C.; Blavier, J.-F.L.; Washenfelder, R.A.; Notholt, J.; Connor, B.J.; Griffith, D.W.T.; Sherlock, V.; Wennberg, P.O. The Total Carbon Column Observing Network. Proc. R. Soc. A 2011, 369, 2087–2112. [Google Scholar] [CrossRef] [PubMed] [Green Version]
  35. Wunch, D.; Toon, G.C.; Wennberg, P.O.; Wofsy, S.C.; Stephens, B.B.; Fischer, M.L.; Uchino, O.; Abshire, J.B.; Bernath, P.; Biraud, S.C.; et al. Calibration of the Total Carbon Column Observing Network using aircraft profile data. Atmos. Meas. Tech. 2010, 3, 1351–1362. [Google Scholar] [CrossRef] [Green Version]
  36. Feist, D.G.; Arnold, S.G.; John, N.; Geibel, M.C. TCCON data from Ascension Island, Saint Helena, Ascension and Tristan da Cunha, Release GGG2014R0. TCCON Data Archive, Hosted by CaltechDATA; California Institute of Technology: Pasadena, CA, USA, 2014. [Google Scholar] [CrossRef]
  37. Deutscher, N.; Notholt, J.; Messerschmidt, J.; Weinzierl, C.; Warneke, T.; Petri, C.; Grupe, P.; Katrynski, K. TCCON Data from Bialystok, Poland, Release GGG2014R2. TCCON Data Archive, Hosted by CaltechDATA; California Institute of Technology: Pasadena, CA, USA, 2015. [Google Scholar] [CrossRef]
  38. Notholt, J.; Petri, C.; Warneke, T.; Deutscher, N.; Buschmann, M.; Weinzierl, C.; Macatangay, R.; Grupe, P. TCCON Data from Bremen, Germany, Release ggg2014r0. TCCON Data Archive, Hosted by the Carbon Dioxide Information Analysis Center; Oak Ridge National Laboratory: Oak Ridge, TN, USA, 2014. [Google Scholar] [CrossRef]
  39. Griffith, D.W.T.; Deutscher, N.; Velazco, V.A.; Wennberg, P.O.; Yavin, Y.; Aleks, G.K.; Washenfelder, R.; Toon, G.C.; Blavier, J.F.; Murphy, C.; et al. TCCON Data from Darwin, Australia, Release ggg2014r0. TCCON Data Archive, Hosted by the Carbon Dioxide Information Analysis Center; Oak Ridge National Laboratory: Oak Ridge, TN, USA, 2014. [Google Scholar]
  40. Iraci, L.; Podolske, J.; Hillyard, P.; Roehl, C.; Wennberg, P.O.; Blavier, J.-F.; Landeros, J.; Allen, N.; Wunch, D.; Zavaleta, J.; et al. TCCON Data from Armstrong Flight Research Center, Edwards, CA, USA, Release GGG2014R1. TCCON Data Archive, Hosted by CaltechDATA; California Institute of Technology: Pasadena, CA, USA, 2016. [Google Scholar] [CrossRef]
  41. Strong, K.; Mendonca, J.; Weaver, D.; Fogal, P.; Drummond, J.R.; Batchelor, R.; Lindenmaier, R. TCCON data from Eureka, Canada, Release GGG2014R2. TCCON Data Archive, Hosted by CaltechDATA; California Institute of Technology: Pasadena, CA, USA, 2017. [Google Scholar] [CrossRef]
  42. Sussmann, R.; Rettinger, M. TCCON Data from Garmisch (DE), Release GGG2014.R2. Available online: https://data.caltech.edu/records/956 (accessed on 23 May 2021).
  43. Blumenstock, T.; Hase, F.; Schneider, M.; Garcia, O.E.; Sepulveda, E. TCCON Data from Izana, Tenerife, Spain, Release GGG2014R1. TCCON Data Archive, Hosted by CaltechDATA; California Institute of Technology: Pasadena, CA, USA, 2017. [Google Scholar] [CrossRef]
  44. Hase, F.; Blumenstock, T.; Dohe, S.; Gross, J.; Kiel, M. TCCON Data from Karlsruhe, Germany, Release GGG2014R1. TCCON Data Archive, Hosted by CaltechDATA; California Institute of Technology: Pasadena, CA, USA, 2015. [Google Scholar] [CrossRef]
  45. Wennberg, P.O.; Wunch, D.; Roehl, C.; Blavier, J.F.; Toon, G.C.; Allen, N.; Dowell, P.; Teske, K.; Martin, C.; Martin, J. TCCON Data from Lamont, Oklahoma, USA, Release ggg2014r0. TCCON Data Archive, Hosted by the Carbon Dioxide Information Analysis Center; Oak Ridge National Laboratory: Oak Ridge, TN, USA, 2014. [Google Scholar]
  46. Sherlock, V.; Connor, B.; Robinson, J.; Shiona, H.; Smale, D.; Pollard, D. TCCON Data from Lauder, New Zealand, 125HR, Release GGG2014R0. TCCON Data Archive, Hosted by CaltechDATA; California Institute of Technology: Pasadena, CA, USA, 2014. [Google Scholar] [CrossRef]
  47. Pollard, D.; Robinson, J.; Shiona, H. TCCON Data from Lauder, New Zealand, 125HR, Release GGG2014R0. TCCON Data Archive, Hosted by CaltechDATA; California Institute of Technology: Pasadena, CA, USA, 2019. [Google Scholar] [CrossRef]
  48. Notholt, J.; Schrems, O.; Warneke, T.; Deutscher, N.; Weinzierl, C.; Palm, M.; Buschmann, M. AWI-PEV Station Engineers. TCCON Data from Ny Alesund, Spitzbergen, Norway, Release GGG2014R1. TCCON Data Archive, Hosted by CaltechDATA; California Institute of Technology: Pasadena, CA, USA, 2019. [Google Scholar] [CrossRef]
  49. Warneke, T.; Messerschmidt, J.; Notholt, J.; Weinzierl, C.; Deutscher, N.; Petri, C.; Grupe, P.; Vuillemin, C.; Truong, F.; Schmidt, M.; et al. TCCON Data from Orleans, France, Release GGG2014R1. TCCON Data Archive, Hosted by CaltechDATA; California Institute of Technology: Pasadena, CA, USA, 2014. [Google Scholar] [CrossRef]
  50. Te, Y.; Jeseck, P.; Janssen, C. TCCON Data from Paris, France, Release GGG2014R0. TCCON Data Archive, Hosted by CaltechDATA; California Institute of Technology: Pasadena, CA, USA, 2014. [Google Scholar] [CrossRef]
  51. Wennberg, P.O.; Roehl, C.; Wunch, D.; Toon, G.C.; Blavier, J.-F.; Washenfelder, R.; Keppel-Aleks, G.; Allen, N.; Ayers, J. TCCON Data from Park Falls, Wisconsin, USA, Release GGG2014R1. TCCON Data Archive, Hosted by CaltechDATA; California Institute of Technology: Pasadena, CA, USA, 2017. [Google Scholar] [CrossRef]
  52. Wennberg, P.O.; Wunch, D.; Roehl, C.; Blavier, J.-F.; Toon, G.C.; Allen, N. TCCON Data from California Institute of Technology, Pasadena, California, USA, Release GGG2014R1. TCCON Data Archive, Hosted by CaltechDATA; California Institute of Technology: Pasadena, CA, USA, 2015. [Google Scholar] [CrossRef]
  53. De Maziere, M.; Sha, M.K.; Desmet, F.; Hermans, C.; Scolas, F.; Kumps, N.; Metzger, J.-M.; Duflot, V.; Cammas, J.-P. TCCON Data from Réunion Island (La Réunion), France, Release GGG2014R0. TCCON Data Archive, Hosted by CaltechDATA; California Institute of Technology: Pasadena, CA, USA, 2017. [Google Scholar] [CrossRef]
  54. Shiomi, K.; Kawakami, S.; Ohyama, H.; Arai, K.; Okumura, H.; Taura, C.; Fukamachi, T.; Sakashita, M. TCCON Data from Saga, Japan, Release GGG2014R0. TCCON Data Archive, Hosted by CaltechDATA; California Institute of Technology: Pasadena, CA, USA, 2014. [Google Scholar] [CrossRef]
  55. Morino, I.; Matsuzaki, T.; Horikawa, M. TCCON Data from Tsukuba, Ibaraki, Japan, 125HR, Release GGG2014R2. TCCON Data Archive, Hosted by CaltechDATA; California Institute of Technology: Pasadena, CA, USA, 2018. [Google Scholar] [CrossRef]
  56. Kawakami, S.; Ohyama, H.; Arai, K.; Okumura, H.; Taura, C.; Fukamachi, T.; Sakashita, P. TCCON data from Saga (JP), Release GGG2014.R0. 2014. Available online: https://data.caltech.edu/records/288 (accessed on 23 May 2021).
  57. Kivi, R.; Heikkinen, P.; Kyro, E. TCCON Data from Sodankyla, Finland, Release GGG2014R0. TCCON Data Archive, Hosted by CaltechDATA; California Institute of Technology: Pasadena, CA, USA, 2014. [Google Scholar] [CrossRef]
  58. Kivi, R.; Heikkinen, P. Fourier transform spectrometer measurements of column CO2; at Sodankylä, Finland. Geosci. Instrum. Method. Data Syst. 2016, 5, 271–279. [Google Scholar] [CrossRef] [Green Version]
  59. Griffith, D.W.T.; Velazco, V.A.; Deutscher, N.; Murphy, C.; Jones, N.; Wilson, S.; Macatangay, R.; Kettlewell, G.; Buchholz, R.R.; Riggenbach, M. TCCON Data from Wollongong, Australia, Release ggg2014r0. TCCON Data Archive, Hosted by the Carbon Dioxide Information Analysis Center, Oak Ridge National Laboratory. Remote Sens. 2017, 9, 1033. [Google Scholar]
  60. Sussmann, R.; Rettinger, M. TCCON Data from Zugspitze, Germany, Release GGG2014R1. TCCON Data Archive, Hosted by CaltechDATA; California Institute of Technology: Pasadena, CA, USA, 2018. [Google Scholar]
  61. Wunch, D.; Toon, G.C.; Sherlock, V.; Deutscher, N.M.; Liu, C.; Feist, D.G.; Wennberg, P.O. The Total Carbon Column Observing Network’s GGG2014 Data Version, 42, n.d. (TCCON Data Reference) 2015. Dataset Identifier for TCCON. Available online: https://data.caltech.edu/records/249 (accessed on 23 May 2021).
  62. Griffith, D.W.T.; Deutscher, N.; Velazco, V.A.; Wennberg, P.O.; Yavin, Y.; Keppel Aleks, G.; Washenfelder, R.; Toon, G.C.; Blavier, J.-F.; Murphy, C.; et al. TCCON Data from Darwin, Australia, Release GGG2014R0. TCCON Data Archive, Hosted by CaltechDATA; California Institute of Technology: Pasadena, CA, USA, 2014. [Google Scholar] [CrossRef]
  63. Wennberg, P.O.; Roehl, C.; Blavier, J.-F.; Wunch, D.; Landeros, J.; Allen, N. TCCON Data from Jet Propulsion Laboratory, Pasadena, California, USA, Release GGG2014R1. TCCON Data Archive, Hosted by CaltechDATA; California Institute of Technology: Pasadena, CA, USA, 2007. [Google Scholar] [CrossRef]
  64. Wennberg, P.O.; Wunch, D.; Yavin, Y.; Toon, G.C.; Blavier, J.-F.; Allen, N.; Keppel-Aleks, G. TCCON Data from Jet Propulsion Laboratory, Pasadena, California, USA, Release GGG2014R0. TCCON Data Archive, Hosted by CaltechDATA; California Institute of Technology: Pasadena, CA, USA, 2014. [Google Scholar] [CrossRef]
  65. Dubey, M.; Henderson, B.; Green, D.; Butterfield, Z.; Keppel-Aleks, G.; Allen, N.; Blavier, J.-F.; Roehl, C.; Wunch, D.; Lindenmaier, R. TCCON Data from Manaus, Brazil, Release GGG2014R0. TCCON Data Archive, Hosted by CaltechDATA; California Institute of Technology: Pasadena, CA, USA, 2014. [Google Scholar] [CrossRef]
  66. Iraci, L.; Podolske, J.; Hillyard, P.; Roehl, C.; Wennberg, P.O.; Blavier, J.-F.; Landeros, J.; Allen, N.; Wunch, D.; Zavaleta, J.; et al. TCCON Data from Indianapolis, Indiana, USA, Release GGG2014R1. TCCON Data Archive, Hosted by CaltechDATA; California Institute of Technology: Pasadena, CA, USA, 2016. [Google Scholar] [CrossRef]
  67. Locatelli, R.; Bousquet, P.; Hourdin, F.; Saunois, M.; Cozic, A.; Couvreux, F.; Grandpeix, J.-Y.; Lefebvre, M.-P.; Rio, C.; Bergamaschi, P.; et al. Atmospheric transport and chemistry of trace gases in LMDz5B: Evaluation and implications for inverse modelling. Geosci. Model Dev. 2015, 8, 129–150. [Google Scholar] [CrossRef] [Green Version]
  68. Chevallier, F.; Fisher, M.; Peylin, P.; Serrar, S.; Bousquet, P.; Bréon, F.-M.; Chédin, A.; Ciais, P. Inferring CO2 sources and sinks from satellite observations: Method and application to TOVS data. J. Geophys. Res. 2005, 110, D24309. [Google Scholar] [CrossRef]
  69. Chevallier, F.; Ciais, P.; Conway, T.J.; Aalto, T.; Anderson, B.E.; Bousquet, P.; Brunke, E.G.; Ciattaglia, L.; Esaki, Y.; Fröhlich, M.; et al. CO2 surface fluxes at grid point scale estimated from a global 21 year reanalysis of atmospheric measurements. J. Geophys. Res. 2010, 115, D21307. [Google Scholar] [CrossRef] [Green Version]
  70. Krol, M.; Houweling, S.; Bregman, B.; Bergamaschi, P. The two-way nested global chemistry-transport zoom model TM5: Algorithm and applications. Atmos. Chem. Phys. 2005, 16, 417–432. [Google Scholar] [CrossRef] [Green Version]
  71. Oda, T.; Maksyutov, S.; Andres, R.J. The Open-source Data Inventory for anthropogenic CO2, version 2016 (ODIAC2016): A global monthly fossil fuel CO2 gridded emissions data product for tracer transport simulations and surface flux inversions. Earth Syst. Sci. Data 2018, 10, 87–107. [Google Scholar] [CrossRef] [PubMed] [Green Version]
  72. Jacobson, A.R.; Mikaloff Fletcher, S.E.; Gruber, N.; Sarmiento, J.L.; Gloor, M. A joint atmosphere-ocean inversion for surface fluxes of carbon dioxide: 1. Methods and global-scale fluxes: JOINT INVERSION-METHODS AND GLOBAL FLUXES. Glob. Biogeochem. Cycles 2007, 21. [Google Scholar] [CrossRef]
  73. Takahashi, T.; Sutherland, S.C.; Sweeney, C.; Feely, R.A.; Chipman, D.W.; Hales, B.; Friederich, G.; Chavez, F.; Sabine, C.; Watson, A.; et al. Climatological mean and decadal change in surface ocean pCO2, and net sea-air CO2 flux over the global oceans. Deep Sea Res. II 2009, 56, 554–577. [Google Scholar] [CrossRef]
  74. Zhao, X.; Marshall, J.; Hachinger, S.; Gerbig, C.; Frey, M.; Hase, F.; Chen, J. Analysis of total column CO2 and CH4 measurements in Berlin with WRF-GHG. Atmos. Chem. Phys. 2019, 19, 11279–11302. [Google Scholar] [CrossRef] [Green Version]
  75. Rodgers, C.D.; Connor, B.J. Intercomparison of remote sounding instruments. J. Geophys. Res 2003, 108, 4116. [Google Scholar] [CrossRef] [Green Version]
  76. Null, J. El Nino and La Niña Years and Intensities Based on Oceanic Nino Index (ONI), Golden GateWeather Services. 2013. Available online: http://ggweather.com/enso/oni.htm (accessed on 15 July 2020).
  77. Schneider, A.; Friedl, M.A.; Potere, D. A new map of global urban extent from MODIS satellite data. Environ. Res. Lett. 2009, 4, 044003. [Google Scholar] [CrossRef] [Green Version]
  78. Labzovskii, L.D.; Jeong, S.-J.; Parazoo, N.C. Working towards confident spaceborne monitoring of carbon emissions from cities using Orbiting Carbon Observatory-2. Remote Sens. Environ. 2019, 233, 111359. [Google Scholar] [CrossRef]
  79. Park, H.; Jeong, S.; Park, H.; Labzovskii, L.D.; Bowman, K.W. An assessment of emission characteristics of Northern Hemisphere cities using spaceborne observations of CO2, CO, and NO2. Remote Sens. Environ. 2021, 254, 112246. [Google Scholar] [CrossRef]
  80. Dlugokencky, E.J.; Mund, J.W.; Crotwell, A.M.; Crotwell, M.J.; Thoning, K.W. Atmospheric Carbon Dioxide Dry Air Mole Fractions from the NOAA GML Carbon Cycle Cooperative Global Air Sampling Network, 1968–2019; Version: 2020-07, 2020; Datasets Description; Available online: https://doi.org/10.15138/wkgj-f215 (accessed on 23 May 2021).
  81. Wang, X.; Piao, S.; Ciais, P.; Friedlingstein, P.; Myneni, R.B.; Cox, P.; Heimann, M.; Miller, J.; Peng, S.; Wang, T.; et al. A two-fold increase of carbon cycle sensitivity to tropical temperature variations. Nature 2014, 506, 212–215. [Google Scholar] [CrossRef]
  82. Yuan, Y.; Sussmann, R.; Rettinger, M.; Ries, L.; Petermeier, H.; Menzel, A. Comparison of Continuous In-Situ CO2 Measurements with Co-Located Column-Averaged XCO2 TCCON/Satellite Observations and CarbonTracker Model over the Zugspitze Region. Remote Sens. 2019, 11, 2981. [Google Scholar] [CrossRef] [Green Version]
  83. Paek, H.; Yu, J.-Y.; Qian, C. Why were the 2015/2016 and 1997/1998 extreme El Niños different? Contrasting 1997/1998 and 2015/2016 El Niños, Geophys. Res. Lett. 2017, 44, 1848–1856. [Google Scholar] [CrossRef]
  84. Graven, H.D.; Keeling, R.F.; Piper, S.C.; Patra, P.K.; Stephens, B.B.; Wofsy, S.C.; Welp, L.R.; Sweeney, C.; Tans, P.P.; Kelley, J.J.; et al. Enhanced Seasonal Exchange of CO2 by Northern Ecosystems Since 1960. Science 2013, 341, 1085–1089. [Google Scholar] [CrossRef] [Green Version]
  85. Uchino, O.; Sakai, T.; Nagai, T.; Izumi, T.; Shibata, T.; Morino, I.; Yoshida, Y.; Hiroshi, O.; Arai, K.; Bagtasa, G.; et al. Characteristics of Atmospheric Aerosols Observed by Lidar at Five TCCON Sites Extending from 43°N to 45°S. American Geophysical Union, Fall Meeting 2017 (December 2017)Conference Work 2017AGUFM.A21M..07U. Available online: https://ui.adsabs.harvard.edu/abs/2017AGUFM.A21M..07U/abstract (accessed on 23 May 2021).
  86. Fang, S.X.; Zhou, L.X.; Tans, P.P.; Ciais, P.; Steinbacher, M.; Xu, L.; Luan, T. In situ measurement of atmospheric CO2 at the four WMO/GAW stations in China. Atmos. Chem. Phys. 2014, 14, 2541–2554. [Google Scholar] [CrossRef] [Green Version]
  87. Cheng, Y.; Aa, X.; Yun, F.; Zhou, L.; Liu, L.; Fang, S.; Xu, L. Simulation of CO2 variations at Chinese background atmospheric monitoring stations between 2000 and 2009: Applying a CarbonTracker model. Chin. Sci. Bull. 2013, 58, 3986–3993. [Google Scholar] [CrossRef] [Green Version]
  88. Nayak, R.K.; Deepthi, E.N.; Dadhwal, V.K.; Rao, K.H.; Dutt, C.B.S. Evaluation of NOAA Carbon Tracker Global Carbon Dioxide Products. Int. Arch. Photogramm. Remote Sens. Spatial Inf. Sci. 2014, XL-8, 287–290. [Google Scholar] [CrossRef] [Green Version]
  89. Le Quéré, C.; Andrew, R.M.; Friedlingstein, P.; Sitch, S.; Hauck, J.; Pongratz, J.; Pickers, P.A.; Korsbakken, J.I.; Peters, G.P.; Canadell, J.G.; et al. Global Carbon Budget 2018. Earth Syst. Sci. Data 2018, 10, 2141–2194. [Google Scholar] [CrossRef] [Green Version]
  90. Randerson, J.T.; Chen, Y.; van der Werf, G.R.; Rogers, B.M.; Morton, D.C. Global burned area and biomass burning emissions from small fires: Burned Area from Small Fires. J. Geophys. Res. 2012, 117. [Google Scholar] [CrossRef]
  91. Feist, D.G.; Burjack, I.; Niebling, S. TCCON measurements from Ascension Island: Lessons learned from the first of operation. In Proceedings of the EGU General Assembly 2013, Vienna, Austria, 7–12 April 2013. [Google Scholar]
  92. Palmer, P.I.; Feng, L.; Baker, D.; Chevallier, F.; Bösch, H.; Somkuti, P. Net carbon emissions from African biosphere dominate pan-tropical atmospheric CO2 signal. Nat. Commun. 2019, 10, 3344. [Google Scholar] [CrossRef] [Green Version]
  93. Denning, S.A.; Randall, D.A.; Collatz, G.J.; Sellers, P.J. Simulations of terrestrial carbon metabolism and atmospheric CO2 in a general circulation model. Tellus B Chem. Phys. Meteorol. 1996, 48, 543–567. [Google Scholar] [CrossRef] [Green Version]
  94. Oh, Y.-S.; Kenea, S.T.; Goo, T.-Y.; Chung, K.-S.; Rhee, J.-S.; Ou, M.-L.; Byun, Y.-H.; Wennberg, P.O.; Kiel, M.; Di Gangi, J.P.; et al. Characteristics of greenhouse gas concentrations derived from ground-based FTS spectra at Anmyeondo, South Korea. Atmos. Meas. Tech. 2018, 11, 2361–2374. [Google Scholar] [CrossRef] [Green Version]
  95. Kulawik, S.; Wunch, D.; O’ Dell, C.; Frankenberg, C.; Reuter, M.; Oda, T.; Chevallier, F.; Sherlock, V.; Buchwitz, M.; Osterman, G.; et al. Consistent evaluation of ACOS-GOSAT, BESD-SCIAMACHY, CarbonTracker, and MACC through comparisons to TCCON. Atmos. Meas. Tech. 2016, 9, 683–709. [Google Scholar] [CrossRef] [Green Version]
  96. Lindenmaier, R.; Dubey, M.K.; Henderson, B.G.; Butterfield, Z.T.; Herman, J.R.; Rahn, T.; Lee, S.-H. Multiscale observations of CO2, 13CO2, and pollutants at Four Corners for emission verification and attribution. Proc. Natl. Acad. Sci. USA 2014, 111, 8386–8391. [Google Scholar] [CrossRef] [Green Version]
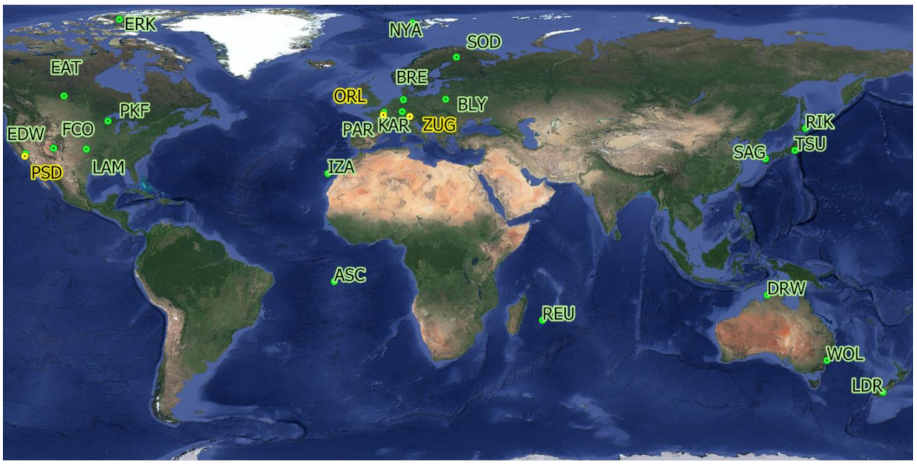
Figure 1. Geographical distribution of TCCON sites used in this study. Colors are shown for better distinguishing neighboring measurement sites. Description of acronyms, used for each measurement site and detailed maps of the regions congested with several TCCON stations, are provided in the Supplementary Materials. The satellite map provided by © Google maps is embedded using QuickMapServices plugin. The detailed map of Central Europe is shown in the Supplementary Materials (Figure S1.1).
Remotesensing 13 03868 g001
Figure 2. Time series of XCO2 with monthly intervals (gray line), MGRs (orange bars), and AGRs (red squares) from GAR-Garmisch (upper panel), PKF-Park Falls (middle panel), and TSU-Tsukuba (bottom panel) stations. X-axis is plotted according to the data abundance of each station for better illustration of MGR data. AGR points (red squares) are plotted versus August of the corresponding year projected at the x-axis (they are assumed to be representative for a given year). XCO2 error bars are calculated according to sub-monthly XCO2 variations, AGR error bars are plotted according to sub-annual variability of MGR. MGR error bars are omitted for better readability of the plot and because MGR error bars stem from monthly XCO2 standard deviations.
Remotesensing 13 03868 g002
Figure 3. Average AGRTCCON estimates for each TCCON station for 2004–2019 years (horizontal bars). Numbers inside the bars illustrate the relative error bar-related error in % (σAGR * n m a X   /   n ). Orange bars denote the stations with <50% error, and gray bars denote those with >50% error. The stations are sorted from top to bottom of the plot using the station latitude.
Remotesensing 13 03868 g003
Figure 4. This study’s AGRTCCON (black) and [28] methodology or LM (orange) estimates. Asterisk labels indicate the existence of agreement between these estimates, according to the strict criterion of statistical agreement, driven by LM-based error estimates. EUR and NYA stations are not used in this analysis due to the lack of data for a simultaneous evaluation of the seasonal cycle according to LM. The stations are sorted from top to bottom of the plot using the station latitude.
Remotesensing 13 03868 g004
Figure 5. Bottom panel: Total number of TCCON stations remained, as a result of threshold-based filtering (denoted as CNT-i format where i stands for the minimum threshold), are shown by colored bars. Top panel: potential error spread across hypothetical AGR global estimates (gray bars) stemming from the range of used threshold (for MGR calculation) shown by percent.
Remotesensing 13 03868 g005
Figure 6. Lines represent the comparison of AGRTCCON (orange line) against AGRGCB (green line) and AGRSAT (black line) plotted versus August of each year (x-axis). Vertical thin bars stand for station-wise MGRs. Error bars of AGRTCCON (orange vertical dashed line) are defined based on the station-wise variability using method similar to Buchwitz et al. [8]. Mean standard deviation across TCCON stations (AGR), multiplied on √Ntotal/N factor (N-the number of stations used, Ntotal-the total number of stations in TCCON analysis). Errorbars for AGRSAT and AGRGCB are omitted since their corresponding uncertainties are lower, and temporally less variable, than the uncertainties of AGRTCCON (0.20–0.36 ppm for SAT and 0.40 ppm for GCB). Bars represent MGR from all available TCCON sites (station name, ‘mg’ = MGR) during the study for simple visualizing the abundance of MGR data as input sources for AGR calculation.
Remotesensing 13 03868 g006
Figure 7. Analysis of AGR (TCCON, GCB and SAT) versus ENSO strength. Left panel: correlation coefficient between AGRs and ENSO for TCCON (orange), SAT (black), and GCB (green). Right panel: scatterplot between AGRTCCON and ENSO. Red color denotes El Niño conditions, blue color denotes La Niña conditions, and black denotes neutral condition. We analyzed not only ENSO vs. AGR pairs but also performed ENSO-shift analysis. More specifically, “no shift” stands for comparison between AGRi and ENSOi where i is year of analysis (AGR+i stands for a positive shift of year in relation to ENSO and AGR-i for a negative shift).
Remotesensing 13 03868 g007
Figure 8. Time series of AGR SAT-to-TCCON bias (black solid line) and GCB-to-TCCON bias (green solid line) versus MJJ ONI (blue dashed line).
Remotesensing 13 03868 g008
Figure 9. Correlation coefficients, between all available MGRs, for various TCCON stations and MGRs modeled by CAMS (red) and CT (blue). Simulations are provided for the same location and given at monthly temporal resolution. The stations are sorted from top to bottom of the plot using the station latitude.
Remotesensing 13 03868 g009
Figure 10. Median estimates of AGR from the models for CT (panel ‘a’) and for CAMS (panel ‘b’) in 2004–2016 period. Panel ‘c’ shows the difference between AGR estimates (CT and CAMS) in 2004–2016 period (median for the entire period is shown). Panel ‘d’ shows grid cell correlation (r) between two modeled AGRs (CT and CAMS). All estimates are provided with 3° × 2° resolution.
Remotesensing 13 03868 g010
Figure 11. Summarized fluxes from CT (top plots from left to right: biomass burning and biosphere flux representations; bottom plots from left to right: fossil fuel CO2 emissions, ocean) in the modeled period of 2004–2016.
Remotesensing 13 03868 g011
Table 1. Irregular measurement sampling characteristics or the data abundance for calculating global AGRTCCON. Daily(s) represents the observation days per month at a station used for calculating μXCO2(m,y-12) term in Equation 4. Daily(f) has similar meaning but for the μXCO2(m,y) term of the same Equation. Daily(t) is the sum of (s) and (f) observation days. MGR and AGR denote the total number of station-wise MGRs and AGRs, respectively.
StationDaily(s)Daily(f)Daily(t)MGRAGR
PKF23402337467713614
DRW23732417479011213
LAM25222461498311211
GAR12161257247312612
WOL1420148629069810
LDR124013072547938
SOD124312822525759
BLY104510152060789
ORL104110262067759
KAR8499211770879
PSD153714963033657
TSU8158241639717
REU104210662108557
SAG6286351263687
BRE386393779708
IZA383447830528
ASC5796101189306
EDW6827071389284
RIK213235448424
ERK202200402257
ZUG265214479314
PAR154160314214
NYA192215407154
EAT238263501153
Table 2. Analysis of the role of urban areas in TCCON-to-model disagreement in reproducing MGR. Distance to the closest urban area (d) for any urban area (subscript ‘anytown’), large urban area with >500 km2 (subscript ‘large’), and for megacity with >1500 km2 (subscript ‘megacity’). Area estimates, for the same three categories, are given under A-labeled columns.
Code.dmegacityAmegacity (km2)dlargeAlarge (km2)danytownAanytown (km2)
ASC2488.43847.3858.42170.620.61549.4
BLY1533.0436.5863.2174.2147.09.8
BRE8326.2261.1687.094.4286.24.3
DRW1540.32728.0791.82612.2100.23.2
EAT1745.61617.3525.9717.357.3136.3
EDW6602.4122.36602.4122.3253.142.1
ERK1914.83918.31914.83918.310.92740.6
FCO1745.6448.8593.4248.781.127.2
GAR5176.7243.9748.686.2127.631.5
IZA2715.91610.1624.11033.218.0312.0
KAR4799.639.34799.639.34799.639.3
LAM3647.8408.8529.1111.333.437.5
LDR1638.82023.21638.82023.220.7111.5
NYA2317.22986.9584.52595.39.91040.9
ORL3144.398.13144.398.1173.916.7
PAR3144.34.33144.34.33144.34.3
PKF1914.8257.81914.8257.817.474.8
PSD6602.432.46602.432.46602.432.4
REU4136.92866.0536.7868.345.51.3
RIK18,720.0878.21148.6631.652.837.8
SAG5477.339.95477.339.95477.339.9
SOD2088.01412.3595.3850.66.1105.2
TSU18,720.022.918,720.022.918,720.022.9
WOL1638.859.51638.859.5137.52.7
ZUG5176.7235.2748.694.8127.632.8
Publisher’s Note: MDPI stays neutral with regard to jurisdictional claims in published maps and institutional affiliations.