Article

An Improved Eutrophication Assessment Algorithm of Estuaries and Coastal Waters in Liaodong Bay

1
State Key Laboratory of Urban Environmental Processes and Digital Simulation, Capital Normal University, Beijing 100048, China
2
College of Resources Environment and Tourism, Capital Normal University, Beijing 100048, China
3
Beijing Laboratory of Water Resources Security, Beijing 100048, China
4
Key Laboratory of 3D Information Acquisition and Application, Ministry of Education, Beijing 100048, China
*
Author to whom correspondence should be addressed.
Remote Sens. 2021, 13(19), 3867; https://doi.org/10.3390/rs13193867
Submission received: 18 July 2021 / Revised: 22 September 2021 / Accepted: 22 September 2021 / Published: 27 September 2021

Abstract

:
Eutrophication is considered to be a significant threat to estuaries and coastal waters. Various localized studies on the world’s oceans have recognized and confirmed that the Forel-Ule Color Index (FUI) or optical measurements are proportional to several water quality variables based on the relatively clear Chl-a-based waters. However, the application potential of FUI in the turbid estuary with complex optics has not been explored. In this study, we selected the coastal waters in the northern Liaodong Bay as the study area, using the field hyperspectral reflectances (Rrs) collected in 2018 to correct the hue angle and verify the Sentinel-2 images algorithm of FUI by in situ FUI in 2019–2020. The results show that there is a good agreement (R2 = 0.81, RMSE = 1.32, MAPE = 1.25%). Trophic Level Index (TLI) was used to evaluate the eutrophication status. The relationship between the in situ FUI and TLI collected in 2018 was discussed based on the difference in the dominant components of waters, while a number of non-algae suspended solids in the estuaries and coastal waters led to the overestimation of eutrophication based on FUI. The R(560)–R(704) (when FUI is between 11 and 15) and R(665)/R(704) (when FUI is between 19 and 21) was employed to distinguish total suspended matter (TSM)-dominated systems in the FUI-based eutrophication assessment. Based on the analysis, a new approach to assessing the eutrophication of coastal waters in Liaodong Bay was developed, which proved to have good accuracy by the field data in 2019 and 2020 (accuracy is 79%). Finally, we used Sentinel-2 images from Google Earth from 2019 to 2020 and locally processed data from 2018 to analyze the FUI spatial distribution and spatial and temporal statistics of the trophic status in the northern Liaodong Bay. The results show that the northern Liaodong Bay always presented the distribution characteristics of high inshore and low outside, high in the southeast and low in the northwest. The nutrient status is the worst in spring and summer.

1. Introduction

In marine systems, eutrophication mainly occurs in coastal areas and semi–enclosed water bodies [1,2]. Human activities bring many nutrients and organics to estuaries and coastal waters, resulting in severe eutrophication in coastal waters, especially in estuary and bays [3]. Eutrophication destroys the ecological balance of waters and degrades the original ecosystem function, which leads to a series of ecological problems, including frequent red tides caused by the abnormal growth of marine primary producers, decreased in dissolved oxygen in the bottom water, the disappearance of underwater plants due to the decrease in light transmittance, and the acceleration of nutrient cycling and utilization efficiency [4,5,6].
Eutrophication is a process of increased production of organic matter in the water body, which is stimulated by the increased availability of inorganic nitrogen (N) and phosphorus (P) [7]. Excessive amounts of nutrients such as N, P, and organic matter—often represented by organic particular carbon (POC)—result in anoxic bottom waters, the spreading of dead bottom zones, and increased frequency and intensity of algal blooms [8,9,10]. Among the numerous eutrophication assessment indexes, chlorophyll-a (Chl-a), total phosphorus (TP), total nitrogen (TN), chemical oxygen demand (COD), and Secchi depth (SD) are widely used in the eutrophication assessment of lakes and reservoirs. These five indexes have good indicative significance for the eutrophication level and related risks and are easy to operate. In 1977, Carlson developed a widely adopted numerical Trophic State Index (TSI). The trophic state of waters is divided into three categories: oligotrophic, mesotrophic, and eutrophic [11]. Referring to the construction method of TSI, Chinese scholars established a comprehensive Trophic Level Index (TLI) based on Chl-a, TP, TN, COD, and SD with Chl-a as the core, which has widely been used in China [12]. However, this approach is somewhat misleading due to the influence of Colored Dissolved Organic Matter (CDOM) and Suspended Particulate Matter (SPM) on Secchi depth [10,13,14].
However, traditional estuarine nutrient monitoring is time-consuming and labor-intensive. Remote sensing technology has the advantages of wide range, multi-temporal, low cost, high efficiency, and comprehensiveness, which can make up for the shortcomings of traditional monitoring methods and effectively realize the comprehensive observation of the water environment [15,16,17,18,19].
The Forel-Ule index (FUI) is a traditional water optical monitoring data. Based on the Forel-Ule Scale, the realistic water color is divided into 21 color levels from dark blue to red-brown [20]. It can be derived from ocean color remote sensing products, including remote sensing reflectance (Rrs) or water leaving radiance [21,22,23]. Wernand and Novoa constructed a complete FUI index CIE chromaticity in 2012 [24]. Van der Woerd and Wernand calculated the reflectance values of different bands in the visible light of different spectrometers and then calculated the color parameters by integral. This research shows the feasibility of calculating FUI from satellite reflectance according to the band setting of different spectrometers. It obtains the FUI algorithm and the mid-resolution imaging spectrometer on the Sentinel-3 platform, the marine integrated observation system, the marine information system, the marine and terrestrial color instrument (OLCI), and the Landsat 8 OLI [25,26,27,28,29,30].
The water color is an intuitive reflection of water quality. Natural waters absorb and scatter light in the presence of color-producing agents (CPAs), determining the apparent color of surface water. Primary CPAs include colored dissolved organic matter (CDOM), inorganic suspended particulate material (SPM), and particulate organic matter (POM or phytoplankton chlorophyll-a (Chl-a), the most abundant pigment) [31,32]. Wang et al. divided the water color of Taihu Lake into FU classes and analyzed its relationship with chlorophyll-a, total suspended solids, and colored dissolved organic substances in water in 2015 [33]. In 2018, Wang et al. found that water color was positively correlated with the inherent optical properties of water and they proposed an FUI-based eutrophication assessment algorithm based on the global HydroLight simulation data set and the measured data set [34]. In 2019, Wang et al. proposed associating FUI with the Secchi disk’s depth and converting them to absorption and backscattering coefficients [35]. Pitarch et al. studied optical properties of global FUI water types based on 15 years of satellite ocean color observations [36]. Therefore, advances have been made in the internal relationship between FUI and optical components of water [37,38,39], which proves the feasibility of FUI for monitoring water quality information [40]. These studies have been successfully applied only in large and medium-sized inland lake reservoirs worldwide and regionally with limited time periods. Therefore, further verification is needed to study some regions, especially the turbid estuary with a complex optical environment.
The FUI-based eutrophication assessment algorithm is based on the theoretical relationship between these two quantities in clear waters dominated by Chl-a. Nevertheless, non-algae suspended solids in the water will also affect the FUI index, which may cause the eutrophication of waters to be overestimated. Therefore, in this study, the hue angle was corrected and verified by the in situ data obtained in Liaodong Bay in 2018–2020 and Sentinel-2 images from Google Earth or local preprocessing. The relationship between in situ FUI and TLI was analyzed considering the influence of suspended sediment in the water and the band thresholds employed to distinguish TSM-dominated systems in the FUI-based eutrophication assessment. The band thresholds were employed to obtain TSM-dominated systems in the FUI-based assessment. The evaluation accuracy is verified by the measured data in the same scene, and the optimal retrieval model suitable for estuaries and coastal waters is obtained.

2. Area and Data

2.1. Study Area

Liaodong Bay, located in the northeast Bohai Sea, is a typical semi–closed bay with weak water exchange capacity [41]. In the past 10 years, environmental pollution has become one of the critical problems restricting fishery development in Liaodong Bay. It is noteworthy that industrial, aquaculture, and domestic sewage from the northern coast of Liaodong Bay flows into the sea through rivers such as the Liao River and Shuangtai River, resulting in serious eutrophication and frequent red tides in the semi–enclosed sea area, which seriously endangers fishery resources and mariculture [42]. The study area of this paper is located in the northern Liaodong Bay, including the coastal waters and the estuary sections of the Shuangtai River and the Liao River. Liao River is one of the largest inflow rivers into the Bohai Sea. The lower reaches of the Liao River in Panjin are called Liao Estuary, located at the top of Liaodong Bay, which is a curved channel. The estuary is bell–shaped, and the two sides of the estuary are coastal reed wetlands. The terrain is flat. After the mixing of the Hun River and Taizi River, the tributary of the Liao River enters the sea in Yingkou City, which is the mouth of the Great Liao River. Located in the north of Liaodong Bay, the Liao Estuary flows through many industrial towns such as Shenyang, Fushun, Liaoyang, and Yingkou. It receives a number of pollutants from industry, agriculture, and life along the way. They provide abundant food for the growth and reproduction of organisms in Liaodong Bay and bring varying degrees of seawater pollution [43,44,45,46].

2.2. In Situ Data

2.2.1. Field Data Collection

Three synchronous water quality sampling experiments were carried out in the waterbody of Liaodong Bay in August 2018, September 2019, and October 2020. Figure 1 shows the geographical location of the study area and spatial distribution of sampling stations. The locations of the sample points are mainly distributed in the Liao River, the Shuangtai River, the northern bank of the Liao Estuary, and the southern line of Gezhou. In September 2019 and October 2020, the hyperspectral reflectance data of waters were collected at the sampling points. Three experiments collected 200 water samples and 104 hyperspectral reflectance data.

2.2.2. In Situ Reflectance Data

The Field Spec4 spectrometer of ASD company was used in the water reflectance measurement, with the wavelength range of 350–2500 nm and the spectral resolution of 3 nm. For the water spectral measurement using Tang’s spectral measurement method [47], the angle between the instrument observation plane and the solar incident plane was 135° and the angle between the instrument and the normal direction of the water surface was 40° [48]. During the measurement, three groups of sea surface optical quantities were collected at each acquisition point: whiteboard radiance, sky radiance, and total surface reflectance. To reduce uncertainty, ten spectral data were collected for each concentration and the abnormal spectral data were eliminated. According to these three optical quantities, the sea surface remote sensing reflectance is calculated. The formula is as follows:
R r s = ( L s w r L s k y ) ρ p π L p

2.3. Satellite Data

2.3.1. Sentinel-2 Images

Sentinel-2A and 2B are wide-swath, high resolution, multi-spectral imaging missions carrying MSI, launched in June 2015 and December 2017. The image contains 13 spectral bands from visible light (VNIR) and near–infrared (NIR) to short-wave infrared (SWIR). The spatial resolution of band 2 (B2, 492.10 nm), band 3 (B3, 559 nm), band 4 (B4, 665 nm) and band 8 (B8, 833 nm) is 10 × 10 m. The spatial resolutions of band 5 (B5, 703.80 nm), band 6 (B6, 739.10 nm), band 7 (B7, 779.70 nm), band 8A (B8A, 864.80 nm), and band 11 (B11, 1610 nm) are 10 × 10 m, and band 9 (B9, 943.20 nm) and band 10 (B10, 1376.90 nm) are 60 × 60 m. Sampling time and satellite transit time interval are short.
In this study, we downloaded the Sentinel-2 Level-1C (L1C) MSI data in 2018 from the Sentinels Scientific Data Hub of the European Space Agency, which is the atmospheric apparent reflectance products after orthophoto correction and subpixel geometric correction. Additionally, Sentinel-2 top of atmosphere (TOA) reflectance data from 2019 to 2020 are available in GEE.

2.3.2. Atmospheric Correction

ACOLITE was used to process the locally Level-1C (L1C) MSI data in 2018. ACOLITE was specifically developed for marine, coastal, and inland waters in the Royal Belgian Institute of Natural Sciences (RBINS), which supported free processing, specifically for aquatic applications, of both Landsat-8 and Sentinel-2 [49,50]. The software includes two atmospheric correction algorithms: Dark Spectrum Fitting (DSF) and Exponential Model (EXP) algorithm under default conditions. The DSF atmospheric correction was selected by this experiment and was recently implemented as a novel AC algorithm in ACOLITE [51]. First, the original Digital Number (DN) values are converted into radiation rate values; then, these radiation rate values are converted into toa reflectance values, and finally, atmospheric correction is carried out. The scheme assumes that the atmosphere on the scene or sub-scene is uniform. The continental or marine aerosol model can be selected according to the minimum root mean square difference between the observed dark spectrum of the two closest fitting bands and the retrieved path reflectance [52].

2.3.3. Processing Platform GEE

GEE is an open cloud platform developed by Google for geoscience data processing and analysis [53]. It supports online programming and interactive display without downloading images [54]. A seasonal median reducer was applied to all remaining Sentinel-2 scenes from 2019 to 2020, calculating seasonal mean hue angle for FUI classification and implementing the FUI-based trophic state assessment algorithm.

3. Methods

3.1. FUI Derivation from Sentinel-2

3.1.1. FUI Retrieval Method

Human visual perception is a comprehensive effect of the three primaries (X, Y, and Z), which can be obtained by integrating the remote sensing reflectance and Color Matching Function (CMF) of the CIE Color System. The wavelength range of human perception is 400 to 710 nm, so the product of the water leaving reflectance and the color matching function of the CIE color system was integrated with this wavelength region. The color matching functions X (k), Y (k), and Z (k) are a function of wavelength (λ), representing the visual dependence of the observer on red, green, and blue light. The tristimulus values are given by Formulas (2)–(4):
X = 400 710 R ( λ ) x ¯ ( λ ) d ( λ ) ;
Y = 400 710 R ( λ ) y ¯ ( λ ) d ( λ )
Z = 400 710 R ( λ ) z ¯ ( λ ) d ( λ )
Most satellite sensors only obtain part of the electromagnetic radiation in the discrete spectral range and only a few discrete bands in the visible range. Therefore, simultaneous interpreting the wavelength of different sensors in the visible range, the hue angle α is calculated. In 2018, Van der Woerd and Wernand interpolated the reflectance values of different bands in their visible light and then calculated the color parameters through integration. The formulas for estimating the X, Y, and Z tristimulus values of Sentinel-2-MSI are as follows:
X = 12.040R(490) + 53.696R(560) + 32.087R(665)
Y = 23.122R(490) + 65.702R(560) + 16.830R(665)
Z = 61.055R(490) + 1.778R(560) + 0.015R(665)
The chromaticity coordinates x, y, and z are normalized by the tristimulus values (X, Y, Z), calculated according to the equation:
x = X X + Y + Z ;   y = Y X + Y + Z ;   z = Z X + Y + Z  
The white point has the coordinates xw = yw = 1/3. In the (x, y) chromaticity plane, the coordinates are transformed into polar coordinates concerning the white point, and the hue angle is derived. The hue angle (α) lies between the vector to a point with coordinates (xxw, yyw) and the positive x-axis (at yyw = 0), giving higher angles in an anti-clockwise direction.
According to the chromaticity coordinates (x, y), the hue angle α can be calculated with arctan2, as described in the equation:
α = arctan 2 ( y 1 3 ,   x 1 3 ) 180 / π
The hue angle α represents the FUI colors in the CIE-xy chromaticity diagram, which is subdivided into 21 categories. The FU index conversion is as shown in Table 1.

3.1.2. FUI Correction

Due to the characteristics of the discrete band and position setting of remote sensing image, compared with the result of hyperspectral spectral integration, the multispectral calculation of hue angle α has systematic error. The deviation Δα can be expressed as the difference between the hue angle α of hyperspectral and that of multispectral bands:
Δ α = α h y p e r α m u l t i
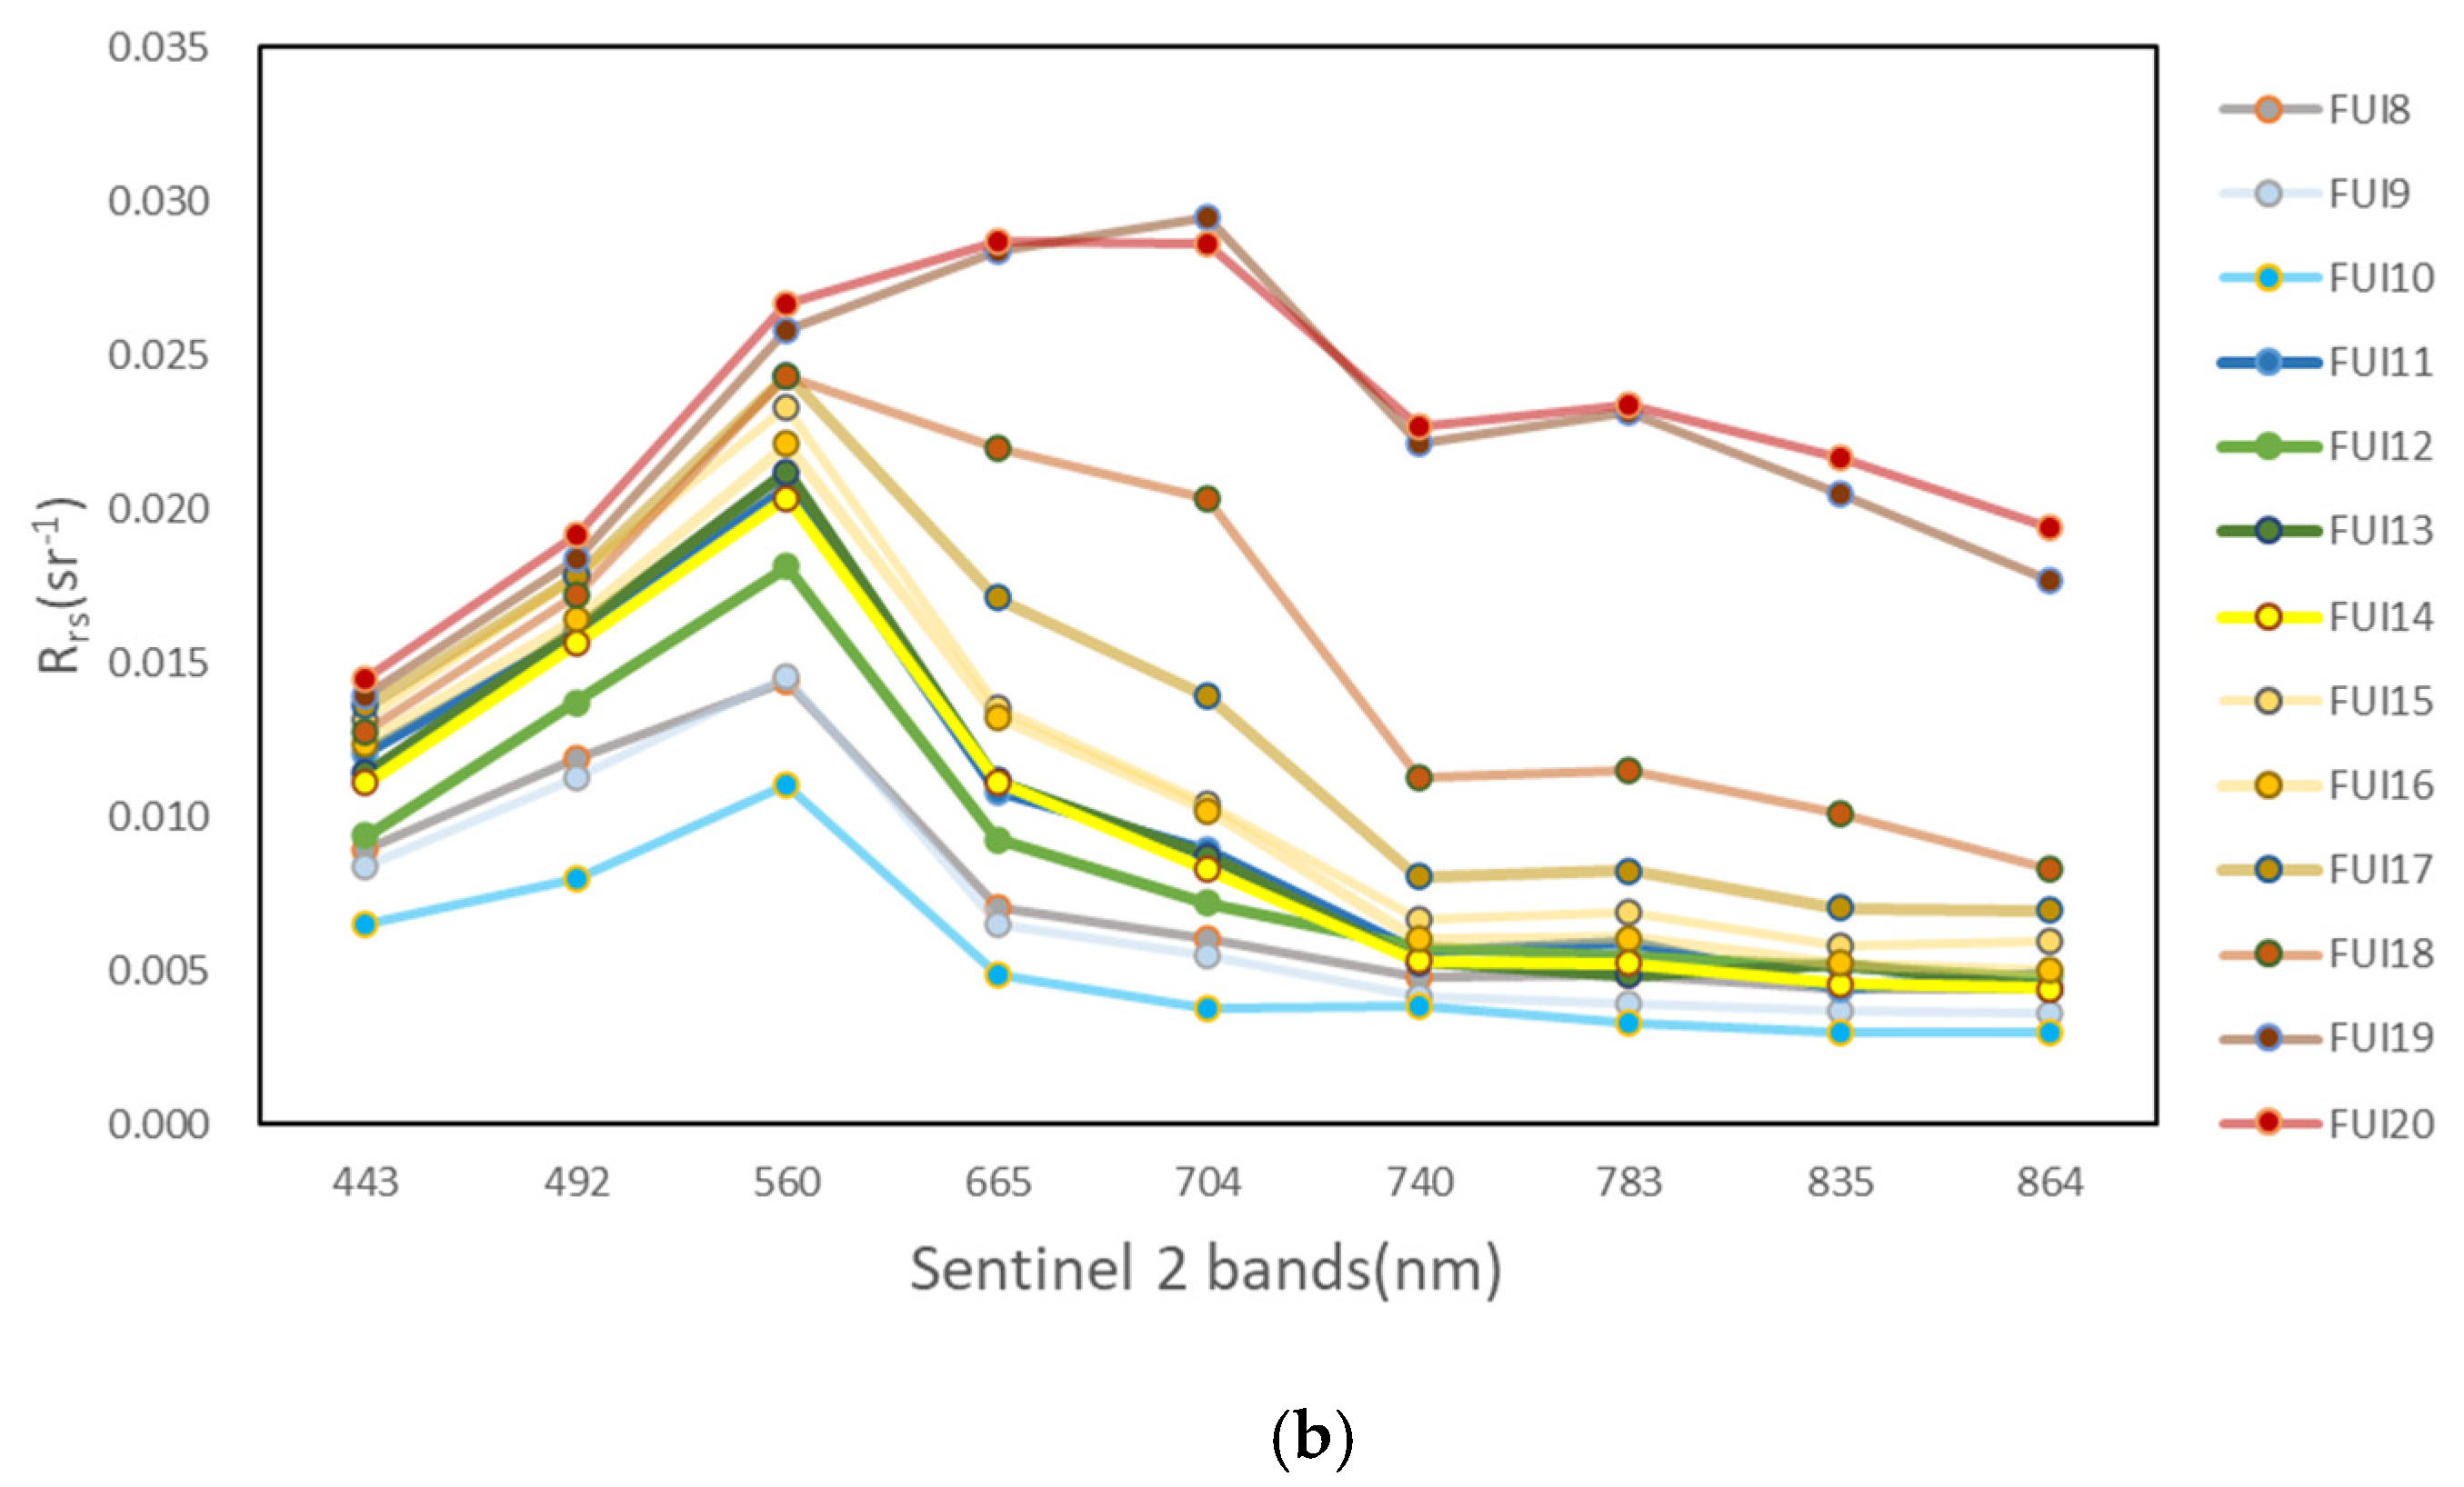
The hyperspectral remote sensing spectral (Rrs) and Sentinel-2 spectral data sets collected in the study area in 2018 were used to fit the difference Δα between the hyperspectral hue angle and the sensor hue angle using polynomial models. Based on Formulas (2)–(4), the hue angle is obtained by integrating the hyperspectral remote sensing reflectance. Based on Formulas (7)–(9), the satellite hue angle of the Sentinel-2 image under synchronous sampling time is calculated. Figure 2 shows the in situ remote sensing reflectance Rrs (λ) and the Sentinel-2 spectral reflectance.
Figure 3 shows the deviation Δα from the hyperspectral hue angle for Sentinel-2 MSI. At the horizontal axis, this sensor hue angle is plotted. At the vertical axis, Δα is provided. The variation range of α hyper is between 40° and 80°, and the independent variable x is defined as the hue angle α hyper of Sentinel-2 sensor divided by 100. The offset Δα reached the lowest value near α hyper = 65°, and then gradually increased with the increase in hue angle α hyper. The curve shape is approximate to the U–shaped curve, which can be expressed by the fifth-order polynomial.

3.2. TLI Retrieval Method

The Trophic Level Index (TLI) was used to evaluate the trophic status of the water body in the study area, which is represented by the China Environmental Monitoring Station. Four water quality parameters were selected as indicators for comprehensive evaluation of trophic status, namely, chlorophyll-a, total nitrogen (TN), total phosphorus (TP), and transparency (SD). The trophic level status index of each index is calculated as follows:
TLI(Chla) = 25 + 10.86 ln ( Chla )
TLI(SD) = 51.18 19.4 ln ( SD )
TLI(TP) = 94.36 + 16.24 ln ( TP )
TLI(TN) = 54.53 + 16.94 ln ( TN )
The formula of the comprehensive trophic status index is as follows:
TLI ( ) = j = 1 m W j TLI ( j )
In the formula, TLI( ) is the comprehensive trophic status index. TLI(j) is the trophic status index of parameter j. Wj is the relevant weight value of the single trophic index for the parameter j. The evaluation method is based on chlorophyll-a, and other factors are assigned weights by the correlation with chlorophyll-a. The calculation method is as follows:
W j = r ij 2 j = 1 m r ij 2
The trophic state of the waters was divided into five levels: oligotrophic (TLI < 30), mesotrophic (30 ≤ TLI ≤ 50), light eutrophic (50 < TLI ≤ 60), middle eutrophic (60 < TLI ≤ 70), and hypereutrophic (TLI > 70). The nutrition level was calculated based on the water body parameter index, which was considered as a specific value in the calculation. This created uncertainty in the assessment of regional nutrition status, which could not be solved by TLI.

3.3. Model Validation

Three indicators were used to evaluate algorithm performance by the coefficient of determination (R2), root mean squared error (RMSE), and mean absolute percentage error (MAPE). The basic statistical indicators and their formulae are shown in Table 2.

4. Results and Discussion

4.1. FUI Result

4.1.1. Evaluation of Sentinel-2-Derived FUI with In Situ Data

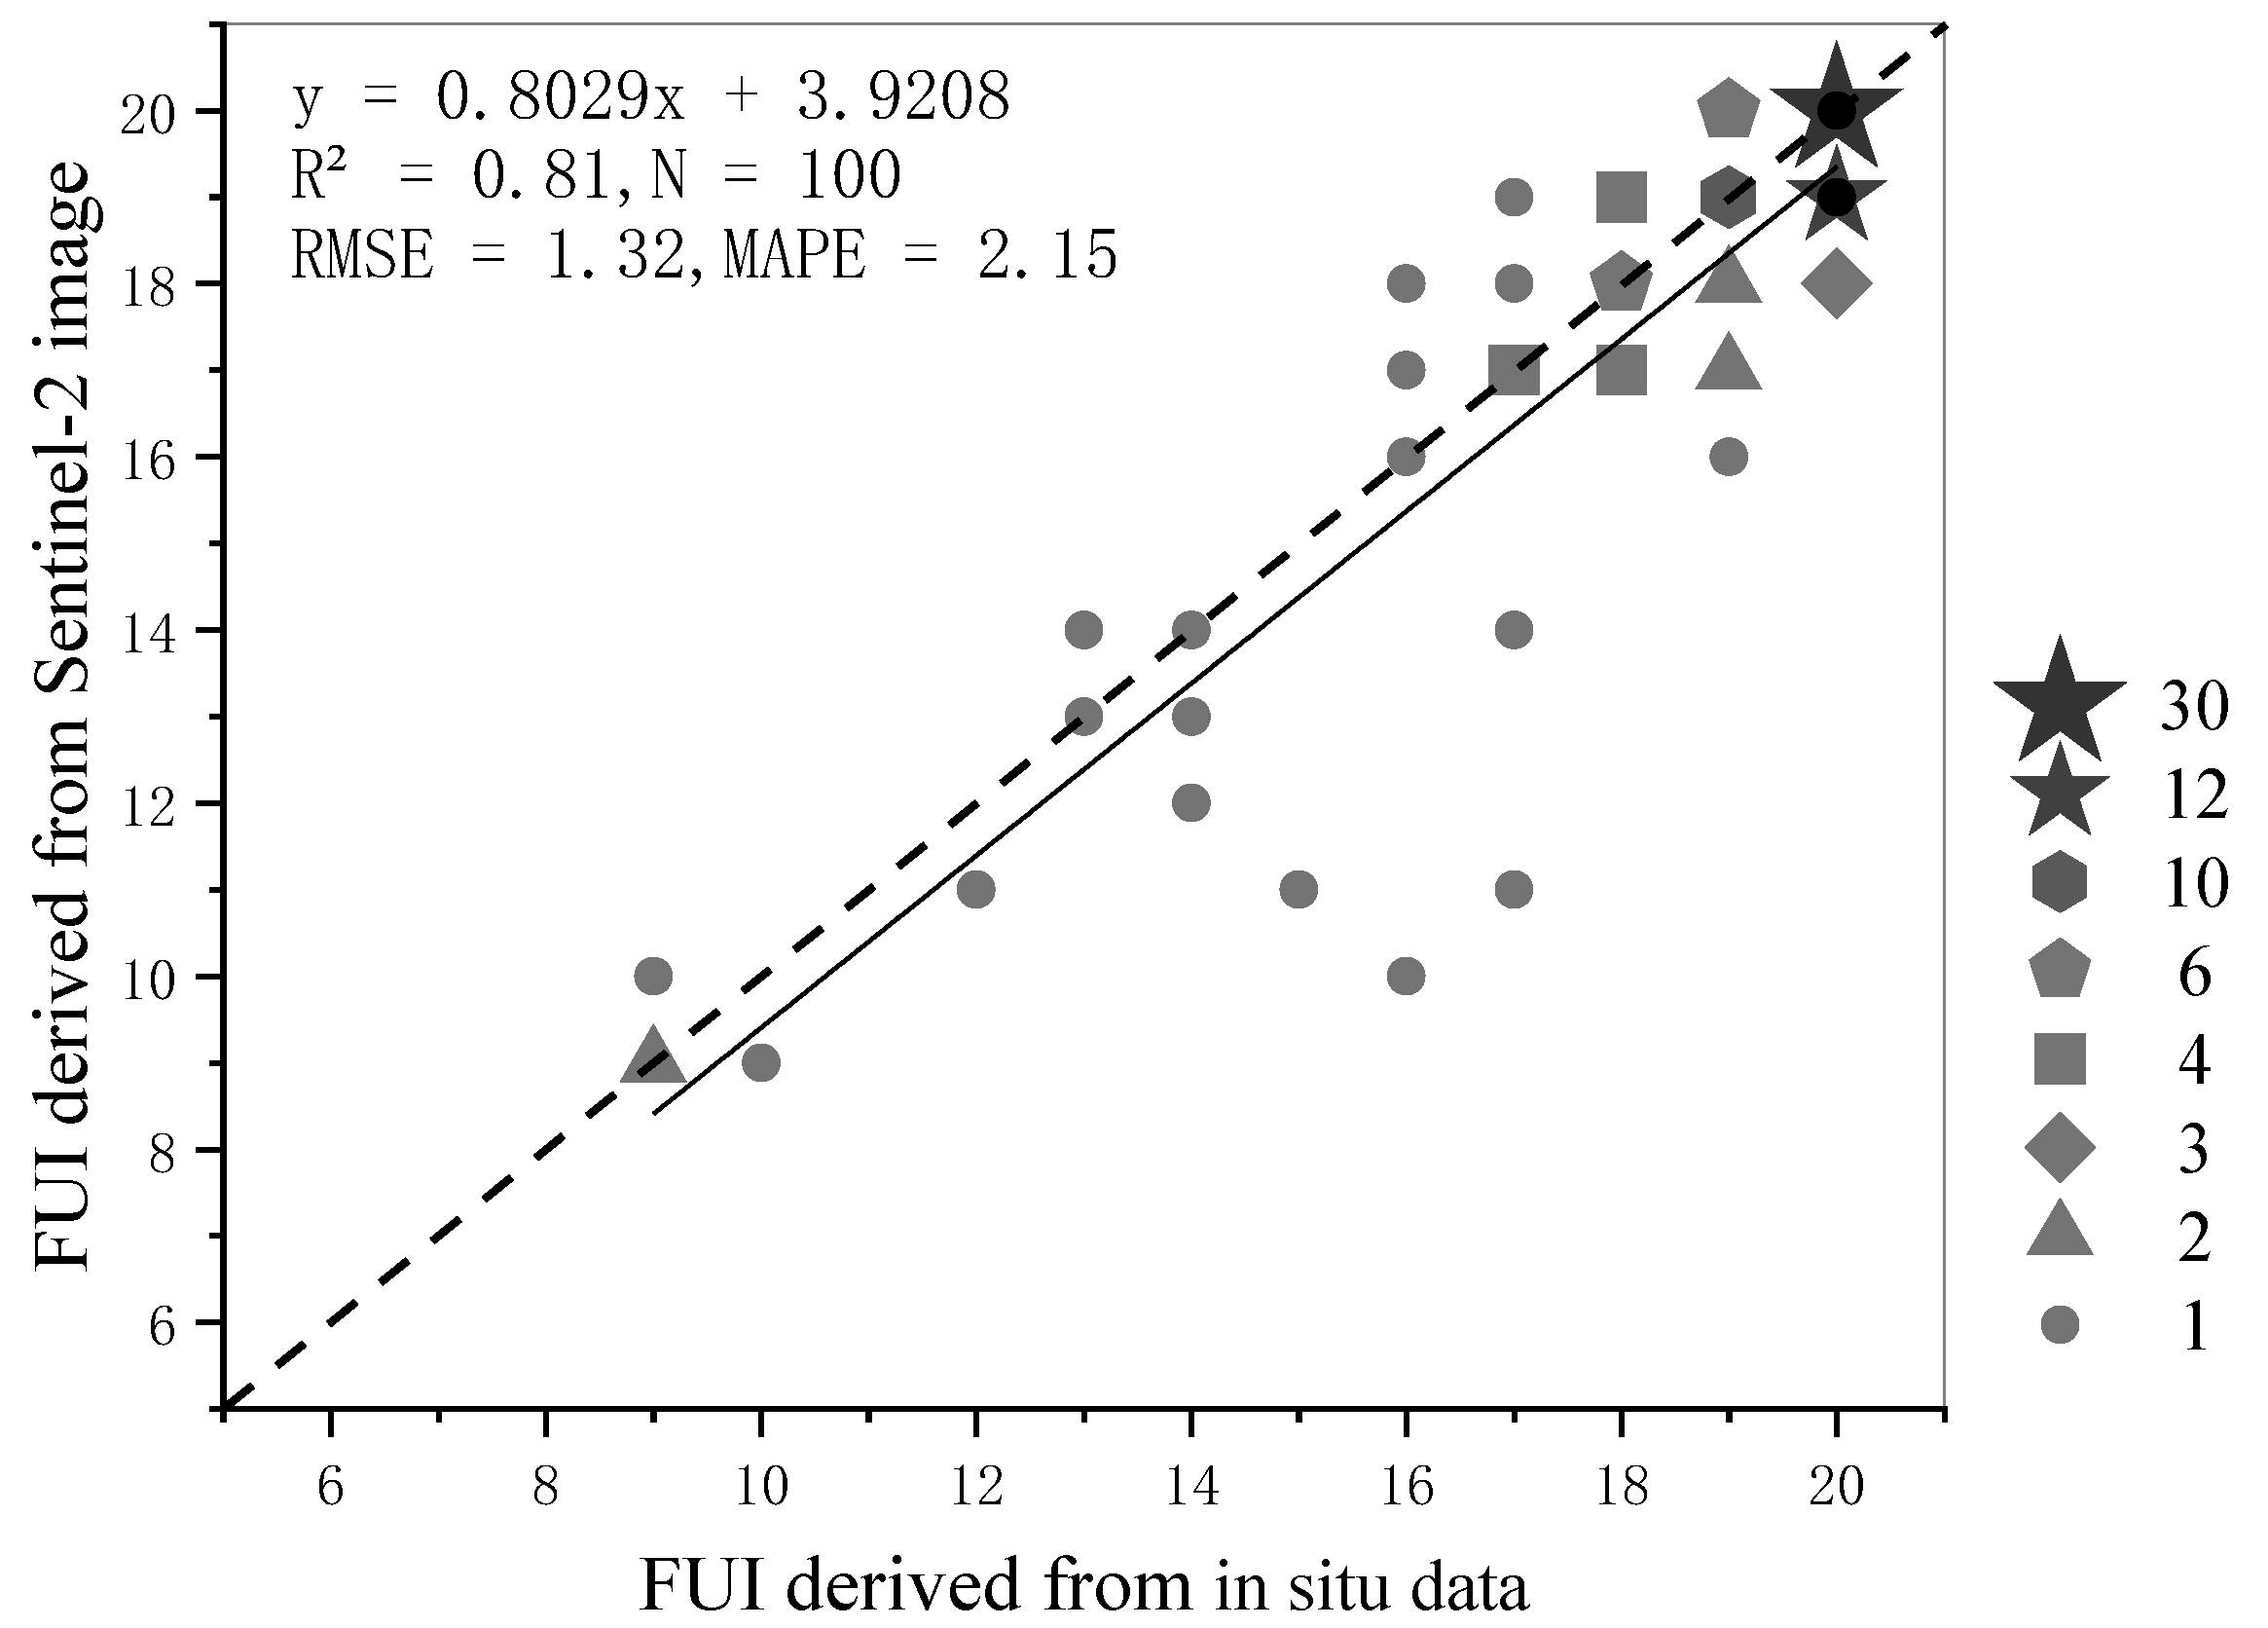
In order to verify the applicability of the Sentinel-2 Based FUI retrieval algorithm method in coastal waters, the FUI obtained from Sentinel-2 images was compared with that obtained from field hyperspectral data. First, Formulas (2)–(4) and Δα correction Formula (11) were applied to Sentinel-2 images from 26 September 2019 and 18 October 2020 to obtain Sentinel-2-derived FUI results, and FUI was calculated using in situ hyperspectral data. Then, a correlation analysis was carried out. Figure 4 shows that the Sentinel-2-derived FUI is consistent with the measured FUI, with R2 = 0.81, RMSE = 1.32, and MAPE = 2.15.

4.1.2. Spatial Distribution of FUI

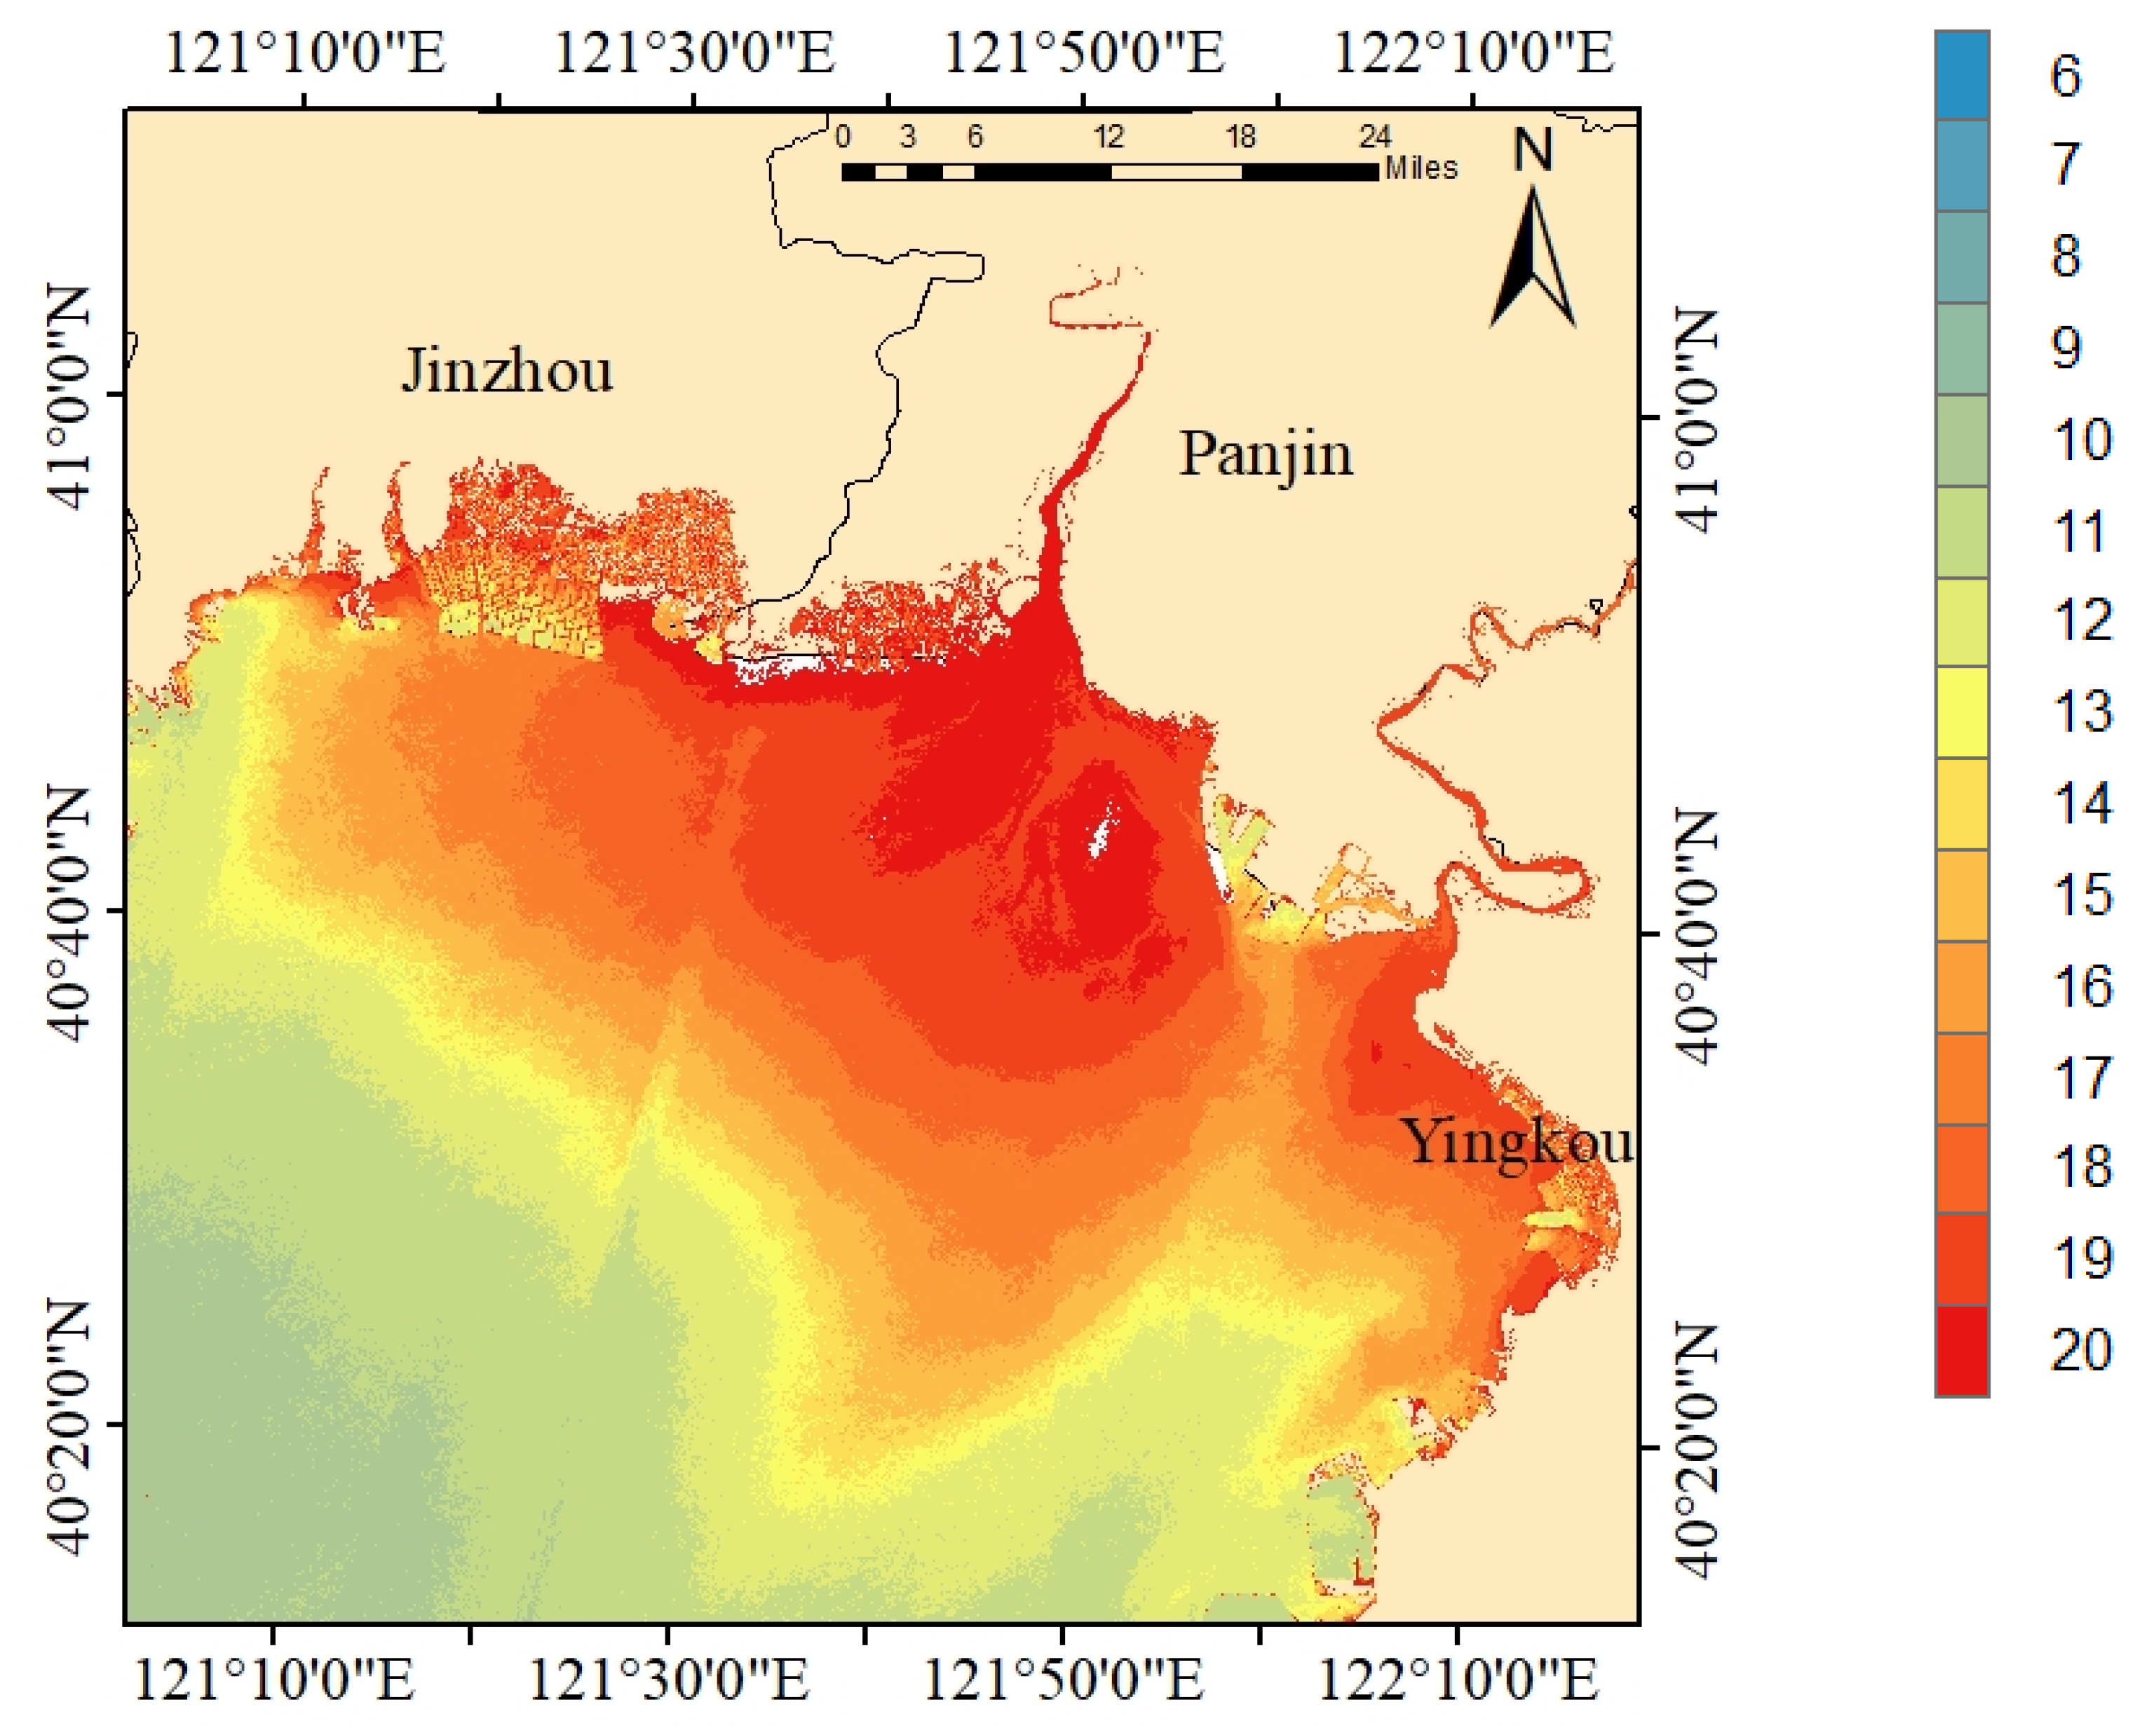
To further prove the FUI calculation method’s universality and stability, we applied the algorithm to all the Sentinel-2 images in 2018–2020, the mean FUI value is calculated. Figure 5 illustrates the spatial distribution of FUI in northern Liaodong Bay. It can be seen from Figure 5 that the FUI in Liaodong Bay’s estuaries and coastal waters vary from 6 to 20. In terms of spatial characteristics, the mean FUI value decreases gradually from the coastal area to the sea. The closer the water is to the coast, the higher the FUI value is, which may be due to surface runoff and sediment content causing the turbidity of waters.

4.2. FUI-Based Trophic State Assessment Algorithm

4.2.1. Relationship between FUI and TLI

In this study, we analyzed the correlation between Sentinel-2-derived FUI and six water quality variables (total suspended solids concentration (TSM), chlorophyll-a (Chl-a), chromophoric dissolvable organic matter (CDOM), total nitrogen (TN), total phosphorus (TP), Secchi depth (SD), and Trophic Level Index (TLI)), which were all measured synchronously throughout sampling experiments in the study area. Figure 6 shows the correlation coefficient between FUI and these parameters. The results indicate that FUI had a good correlation with TN, TP (r > 0.50) in water and had the best correlation with transparency (r = −0.70). There is a strong positive correlation between TLI and FUI used to evaluate the trophic status of the water in the study area (r = 0.72), proving that it is feasible to use the FUI index to evaluate the trophic status of the estuaries and coastal waters in Liaodong Bay.
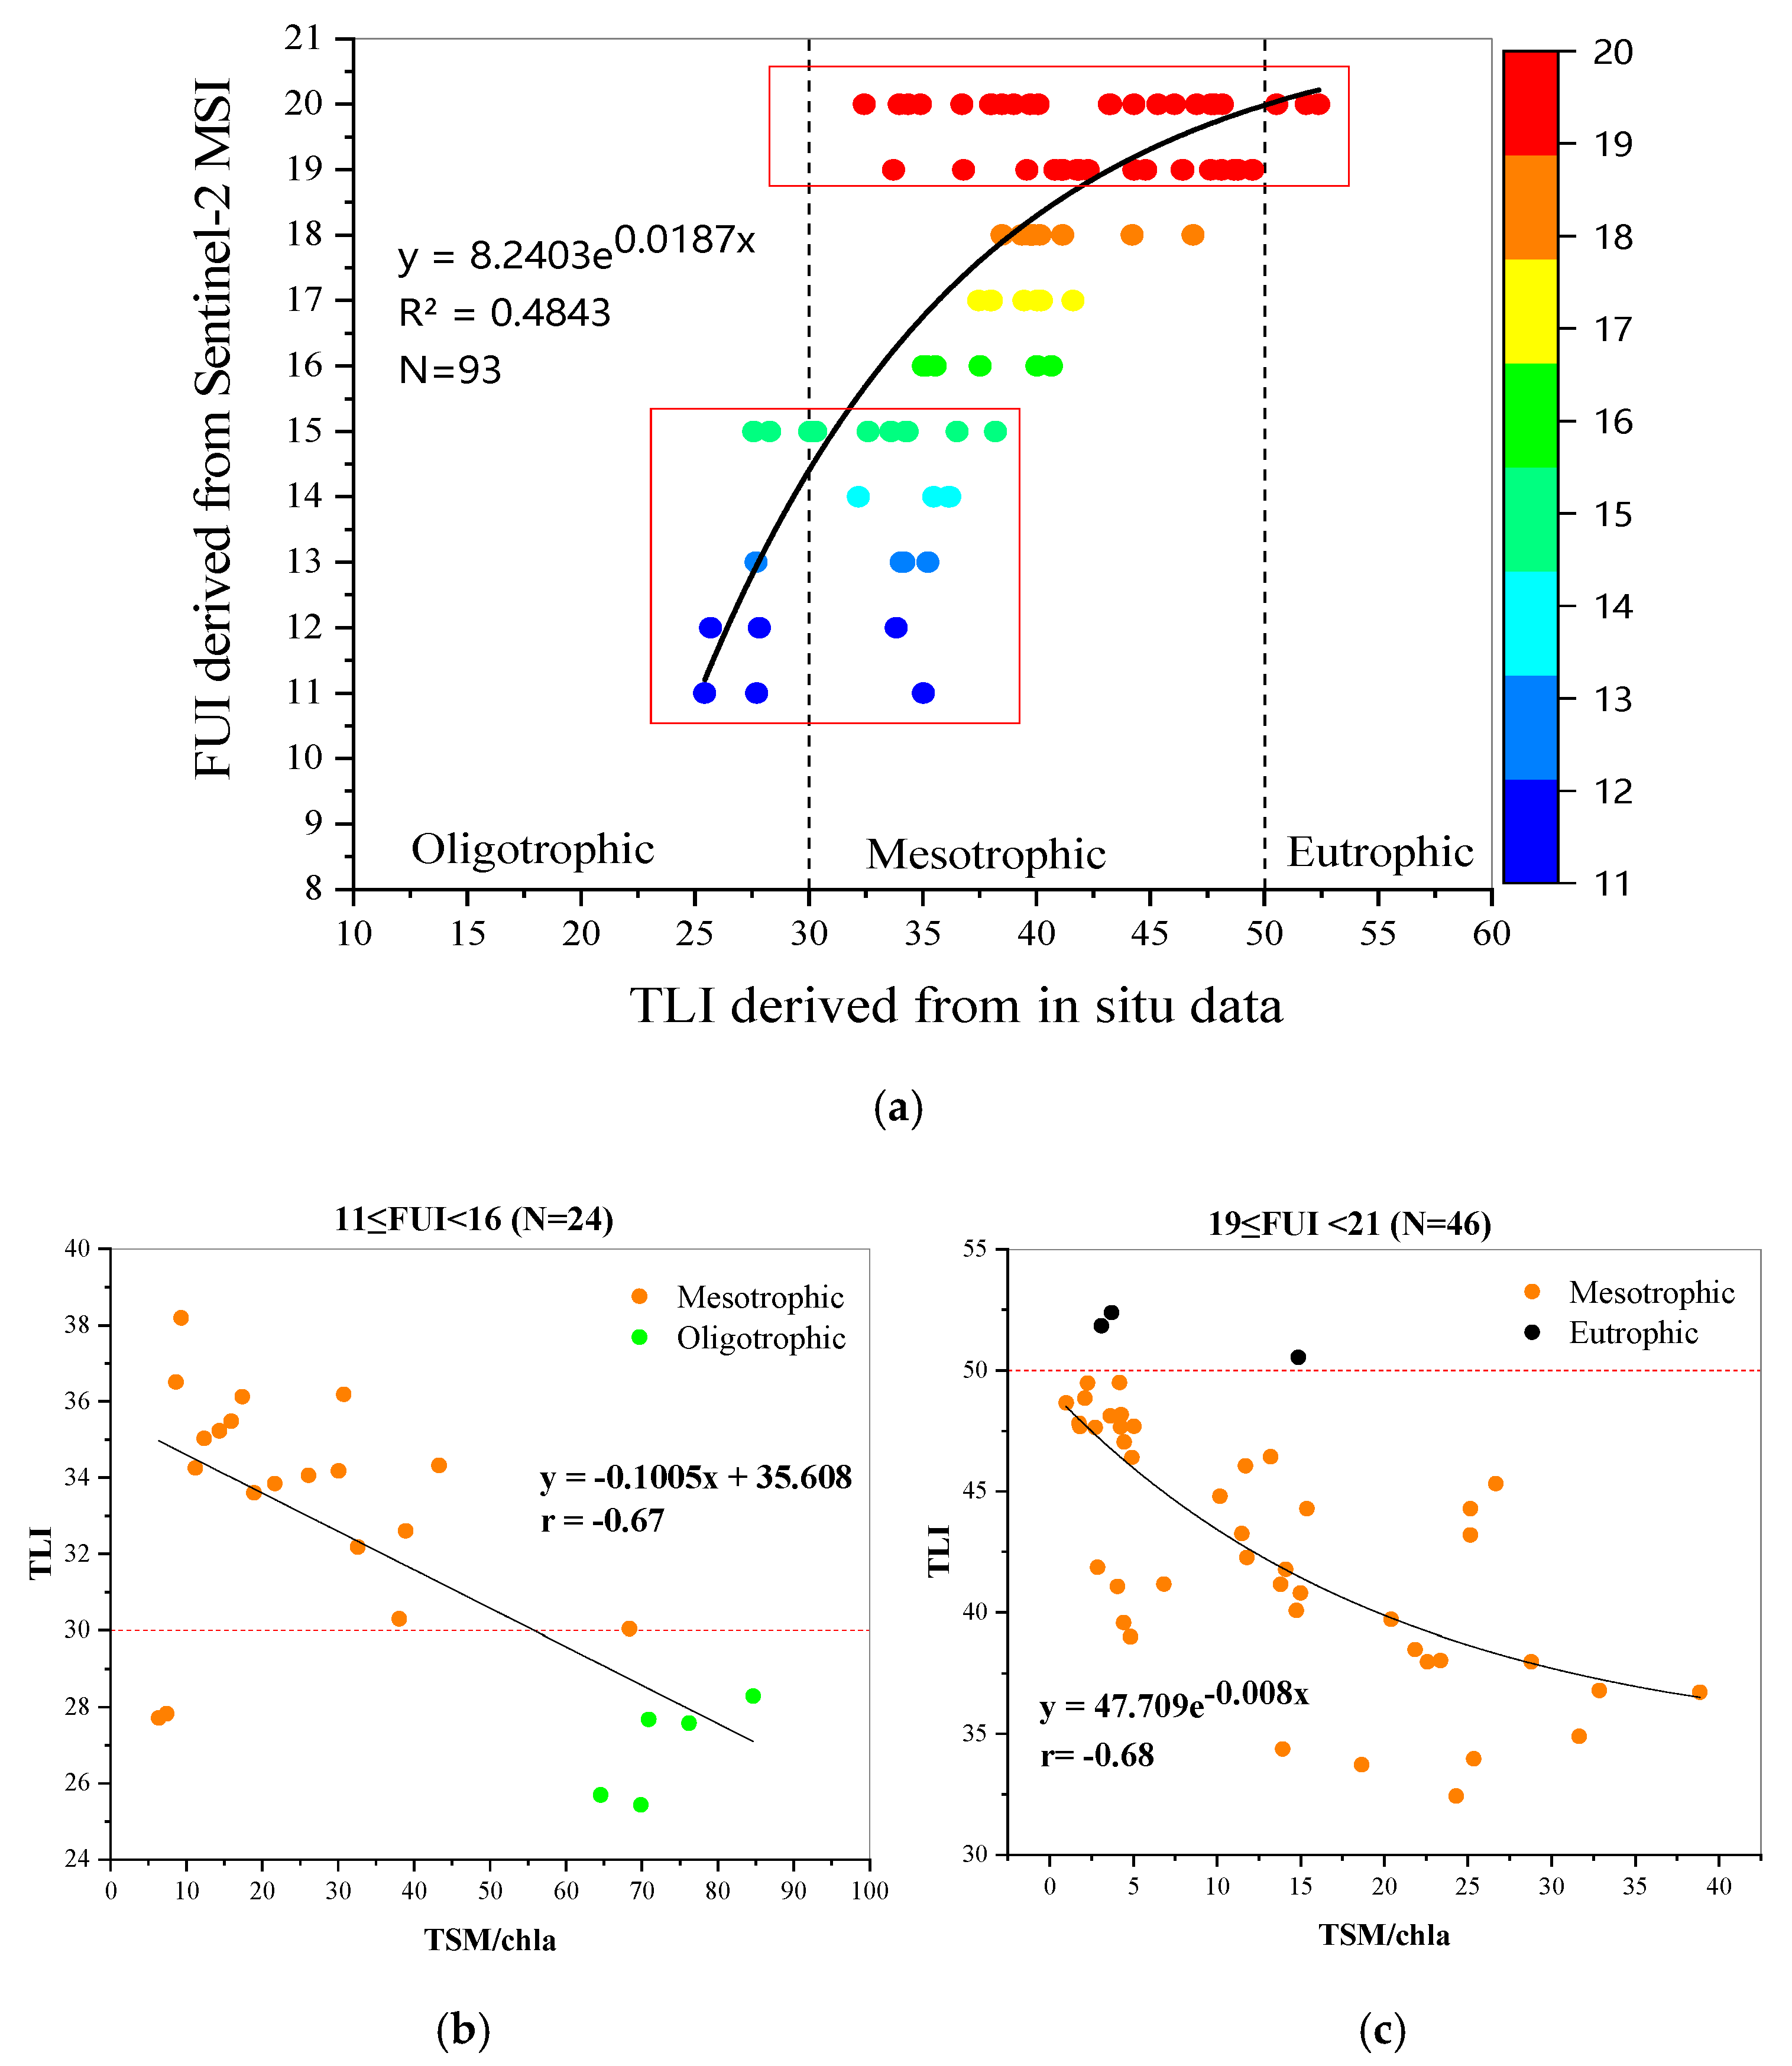
Formulas (12)–(17) were used to calculate the TLI value of the water body at the sampling point in August 2018 (N = 93). The FUI algorithm of 4.1 was applied to Sentinel-2 images with synchronous sampling time, and the relationship between Sentinel-2-derived FUI and TLI was established (Figure 7a). During this period, the FUI value of the water in the study area was between 11 and 20, and the water was yellow-green to yellow-brown. The TLI value was between 25 and 52, which was in a medium trophic status. It can be seen that the FUI value reached a high level when the estuary water with high sediment content was in an oligotrophic state. However, on the whole, the measured TLI value is strongly correlated with Sentinel-2-derived FUI, and the FUI index increases with the increase in TLI value. When the water is in an oligotrophic state, the water is green. When the water changes from poor nutrition to medium nutrition, it becomes yellow. The color index of eutrophic water is the highest (FUI ≥ 20). When the FUI range is between 11 and 15, one-third of the water body is in a state of poor nutrition and two–thirds of the water body is in a state of medium nutrition. When FUI = 19, the TLI value is between 33 and 50, but the distribution is relatively dispersed. When FUI = 20, there is a eutrophic water body, but the whole is still in the middle trophic state. This is because the content of non-algae suspended solids in estuarine water is the greatest, and the water composition is complex. It is easy to evaluate the degree of eutrophication based on FUI because of different water components.

4.2.2. Sentinel-2 Band Analysis of Chl-a and TSM

In order to explore the changes in TLI in different water bodies with different dominant components under the same water color, the ratio of total suspended solids concentration to chlorophyll concentration was used to represent the difference of water components. The relationship between the ratio of total suspended solids concentration to chlorophyll concentration (TSM/Chl-a) and the Trophic Level Index (TLI) was established, where the concentration unit of TSM was mg/L and the concentration unit of Chl-a was μg/L (Figure 7). The reason for choosing these two FUI ranges is that the relationship between TLI and water eutrophication is relatively dispersed. TLI was negatively correlated with TSM/Chl-a (r = −0.67) in the water with FUI in the range of 11–15, and when TSM/Chl-a < 50, the water was in an oligotrophic state, and TSM/Chl-a was greater than 60 in moderately eutrophic water. When FUI is between 19 and 20, TLI is also negatively correlated with TSM/Chl-a (r = −0.68), and the TSM/Chl-a value of eutrophic water is less than 15. This indicated that the larger the proportion of suspended matter in water relative to chlorophyll was, the more likely FUI was to overestimate the trophic status of water.
We analyzed the sensitivity of each band or band combination of Sentinel-2 and the in situ TSM/Chl-a. The results show that when FUI is between 11 and 15, the band combined with the highest sensitivity to TSM/Chl-a is B4–B5 (r = 0.68) and B3–B5 (r = 0.68), respectively. When FUI is between 19 and 20, the most sensitive band combinations of TSM/chl–a were B2/B3 (r = 0.65), B4/B5 (r = 0.62), B4–B2 (r = 0.61), and B5–B3 (r = 0.61).
The receiver operator characteristic curve was used to verify the identification ability of band combination for the misclassification of water nutrient status by FUI [32]. The receiver operator characteristic curve is a curve drawn with sensitivity (true positive rate) as the ordinate and 1—specificity (false positive rate) as the abscissa. The area under the curve (AUC) was calculated, and the effect was good when the AUC was 0.85–0.95. When the AUC was 0.70–0.85, the effect was general. When the AUC was 0.50–0.70, the effect was low. There was no predictive effect when the AUC was below 0.50. Since there were both oligotrophic and mesotrophic states in the water body when FUI was between 11 and 15, and there were both mesotrophic and eutrophic states in the water body when FUI was 20, the ROC curves of TSM/Chl-a sensitive band combinations for nutrient state identification in these two FUI intervals were plotted. The highest AUC area is B3–B5 when FUI is between 11–15 (AUC = 1). The highest AUC area was B4/B5 when FUI is 20 (AUC = 0.884) (Figure 8).

4.2.3. Trophic State Assessment Based on the Sentinel-2-Derived FUI

The best cut-off value is determined using Youden’s index method, Youden’s index = sensitivity + specificity − 1, where the maximum value is the best cut–off value. Figure 8c,d show that the optimal boundary value B3 − B5 = 0.013 when FUI is between 11 and 15 and the optimal boundary value B4/B5 = 0.913 when FUI is 20. Because there is no FUI = 18 in the measured data when R(665)/R(704) < 0.913, it is rich nutrition or medium nutrition (Figure 9).
The water samples measured in September 2019 and August 2020 were used to verify this FUI-based trophic state assessment algorithm (N = 100). The in situ TLI value was calculated by Formulas (12)–(16), and then the FUI algorithm for evaluating the eutrophication status of water was applied to the Sentinel-2 image to assess the trophic state in the sampling area. Figure 10 shows that all three FUI-based trophic states have error results. The misjudged rate of mesotrophication was the highest and the evaluation accuracy was 79%.

4.3. Spatial and Temporal Statistics

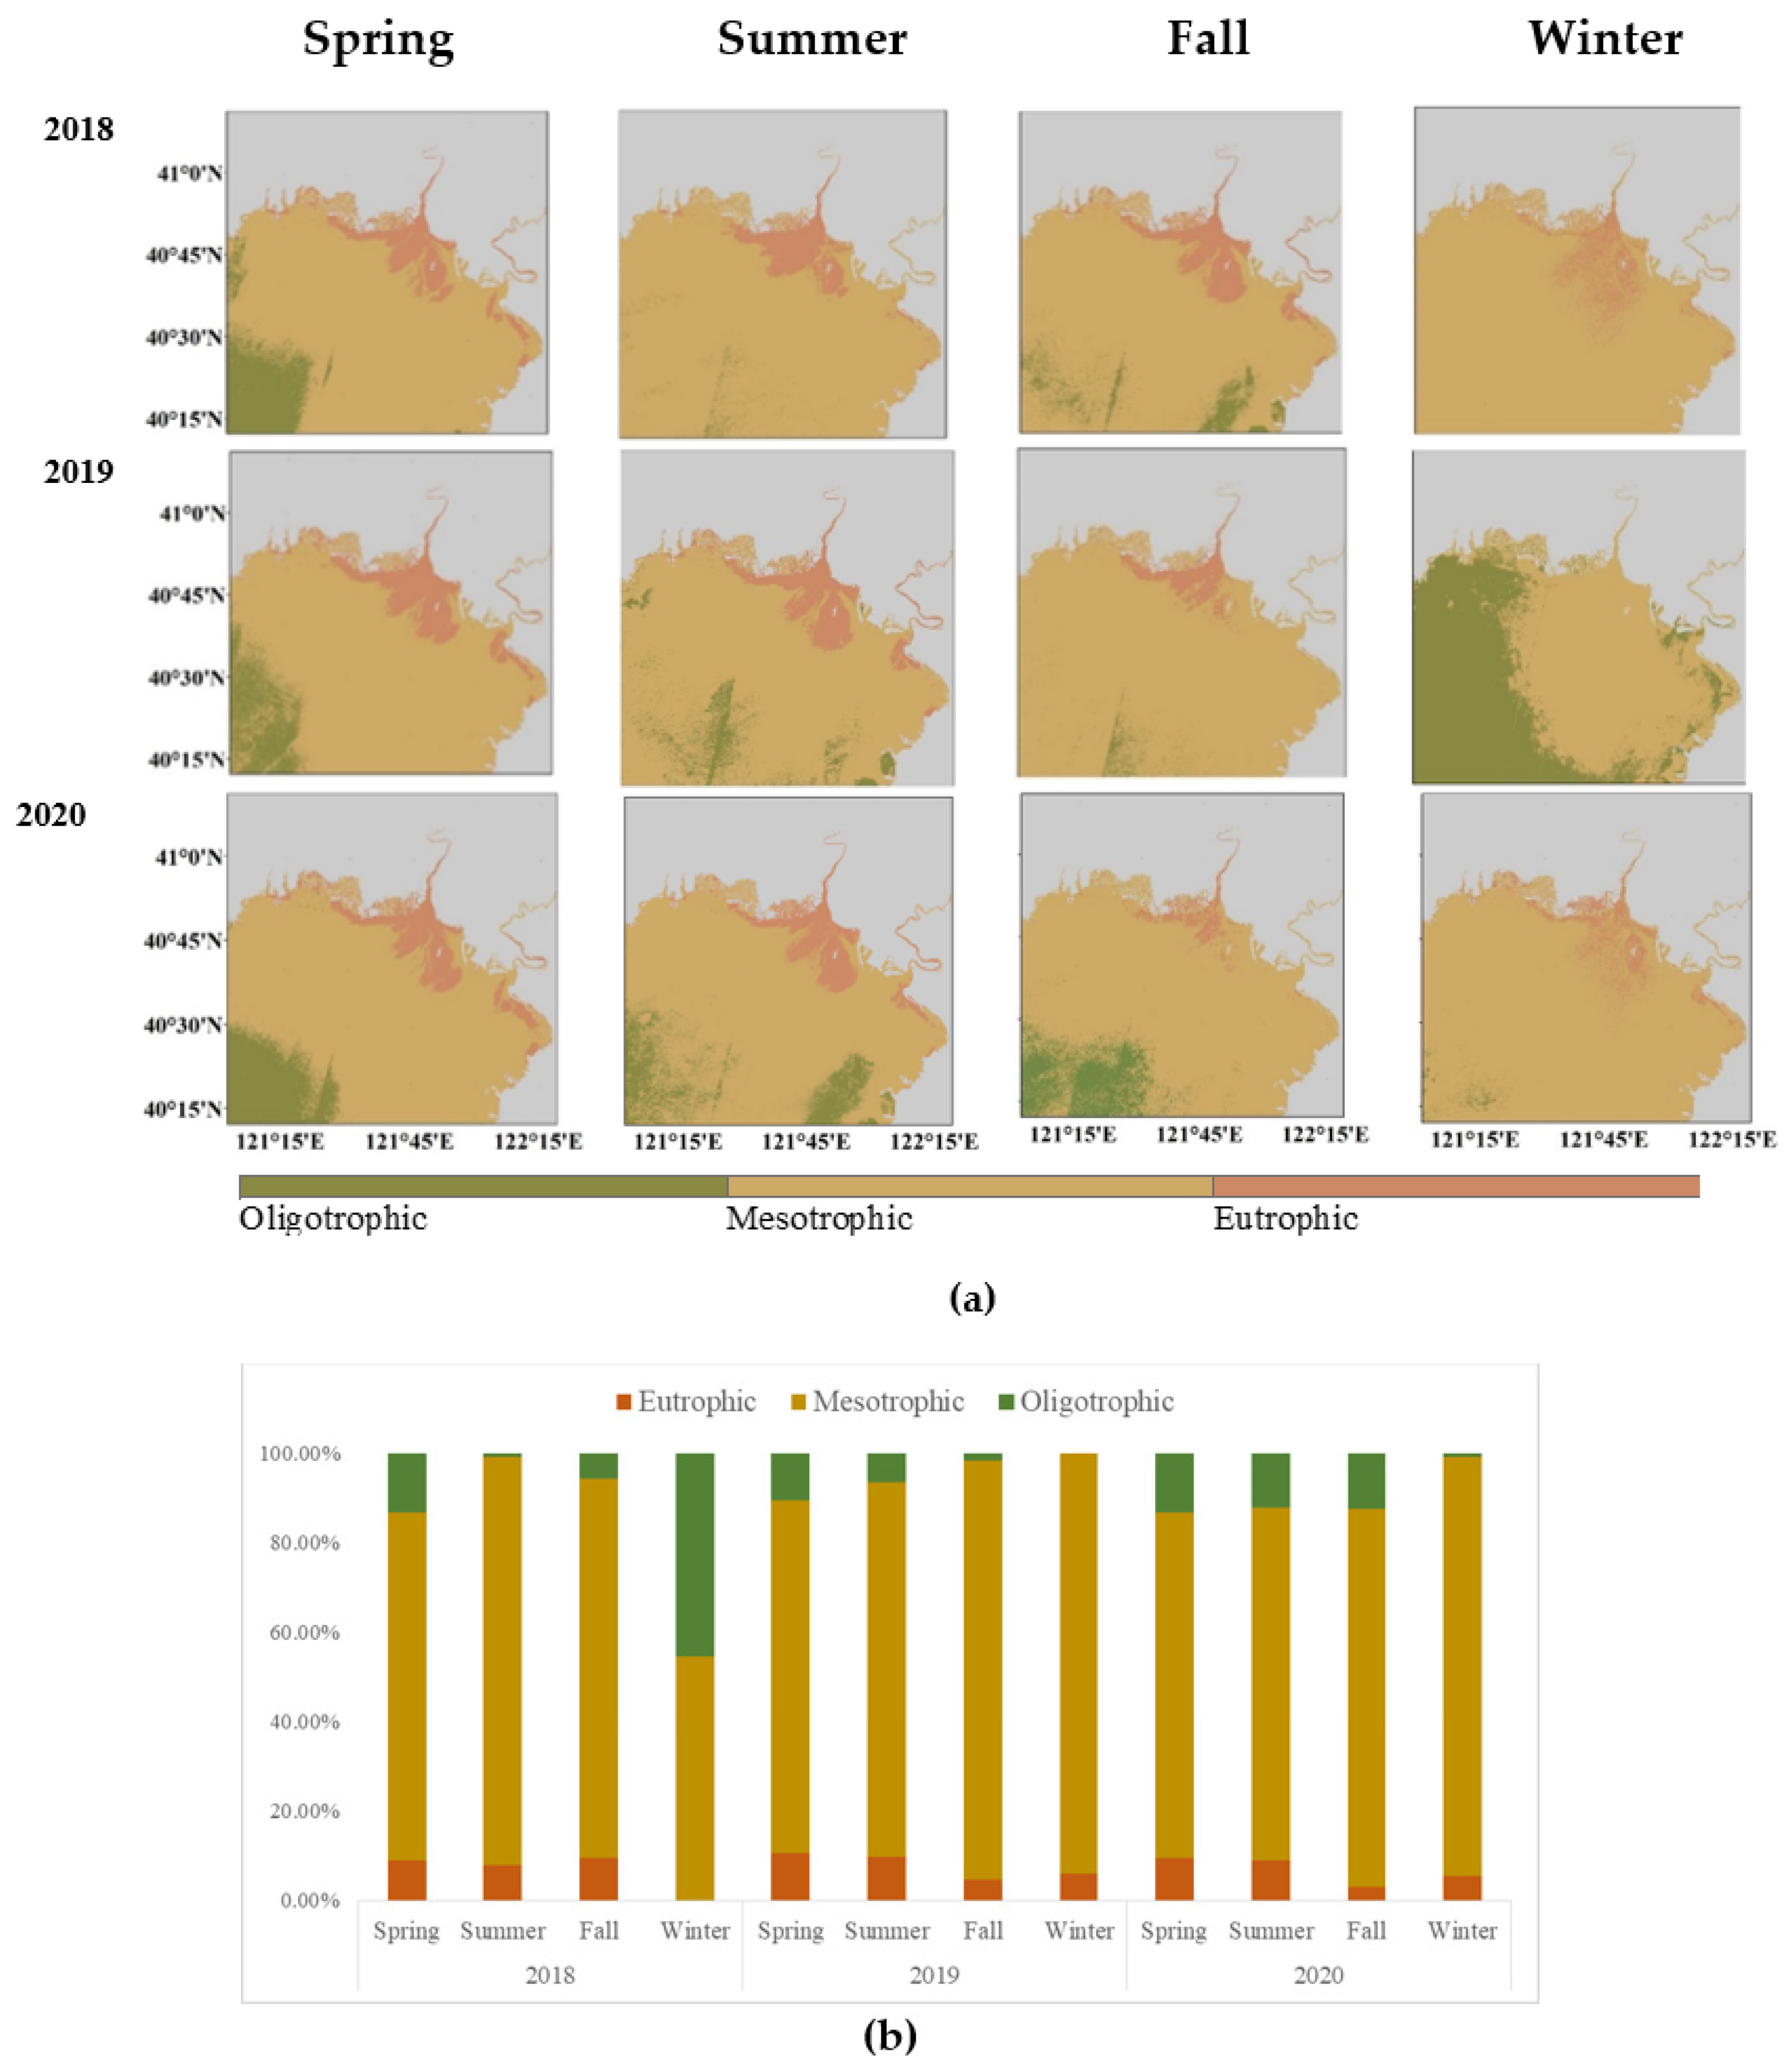
Spatial distribution and seasonal variations in the trophic status were obtained by FUI for all Sentinel-2 pixels in each season divided by the number of images. Generally, the 12 months of one year are divided into four seasons, where March–May is spring, June–August is summer, September–November is autumn, and December–February is winter. Figure 11 shows the seasonal trophic status of offshore waters in northern Liaodong Bay during 2018–2020. Eutrophic water was always distributed in the estuary of liao river, Panjin aquaculture area and the port aquaculture area, which has been consistent over the past years with no seasonal or inter-annual variability. The spatial distribution pattern high inshore and low outside, high in the southeast and low in the northwest. This is mainly because Panjin and Yingkou are seriously affected by rivers carrying a number of nutrients into the sea.
The seasonal variations of the area of oligotrophication, mesotrophication, and eutrophication from 2018 to 2020 were obtained. Figure 11 shows that the significant differences were detected between the seasons in northern Liaodong Bay. The maximum eutrophication area appeared in the spring of 2019, while the annual eutrophication average area reached the maximum in 2018 and gradually decreased from 2019 to 2020. The average percentages of eutrophication areas in the spring, summer, fall, winter were 26.5%, 29.15%, 17.10%, 11.62%. Therefore, the nutrient status of the northern Liaodong Bay is at its worst in spring and summer. As precipitation increases in spring and summer, a number of land–based pollutants flow into the ocean through estuaries, leading to increased eutrophication.

5. Conclusions

Taking the coastal waters in the northern Liaodong Bay as an example, the FUI calculation method for estuary and coastal waters based on Sentinel-2 band was corrected and verified by in situ data, which confirmed the applicability of the satellite algorithm of FUI in China’s offshore waters. The correlation between FUI and the Trophic Level Index (TLI) of the estuary waters was analyzed. Based on the analysis, a new approach to assessing the eutrophication status of coastal waters in Liaodong Bay was proposed. Finally, the FUI-based trophic state assessment algorithm was applied to the Sentinel-2 images in 2018–2020 and analyzed the spatial distribution and seasonal variations in the northern Liaodong Bay. The main conclusions are as follows:
(1) Compared with the hyperspectral FUI, the FUI calculated at the Sentinel-2 band has systematic errors. We use the in situ hyperspectral reflectances (Rrs) collected in 2018 to calculate the deviation from the hyperspectral hue angle for Sentinel-2 and verify the algorithm of FUI by in situ FUI in 2019–2020. The results show that there is a good agreement (R2 = 0.81, RMSE = 1.32, MAPE = 1.25%).
(2) There is a strong correlation between FUI and TLI. The FUI increases with the increase in TLI value, proving the feasibility of using FUI to evaluate the degree of eutrophication. However, due to the abundance of non-algae suspended matter in estuarine water and the complex composition of water, the eutrophication of water was overestimated. When FUI was between 11 and 15, the poor and medium-trophic water could not be distinguished by FUI value. When FUI was between 19 and 20, TLI was evenly distributed and dispersed between 32–52. There was a negative correlation between TSM/Chl-a and TLI in the two FUI regions; that is, the smaller the proportion of inorganic suspended solids in the same water color, the higher the trophic status of the water. The area of the ROC curve showed that R(560)–R(704) had the best effect on identifying the oligotrophic and mesotrophic status when FUI was between 11 and 15, and R(665)/R(704) had the best effect on identifying the oligotrophic and mesotrophic status when FUI was between 19 and 20. The best threshold values were R(560) − R(704) = 0.013 and R(665)/R(704) = 0.913. We established the eutrophication assessment method based on the Sentinel-2-retrieved FUI. When FUI < 18, it is oligotrophic. When FUI is between 11 and 15, if R(665)/R(704) < 0.913, it is mesotrophic, otherwise oligotrophic. When FUI is between 11 and 15, it is mesotrophic. When FUI > 18, if R(665)/R(704) < 0.913, it is eutrophic, otherwise mesotrophic. In the future, if more in situ FUI and water quality variables data from the estuaries and coastal waters in Liaodong Bay are obtained, we will compare the models assessing the eutrophication of the waters with different dominant color–producing agents.
(3) From 2018 to 2020, the northern Liaodong Bay always presented the distribution characteristics of high inshore and low outside, high in the southeast and low in the northwest, which has been consistent over the past three years with no seasonal or inter-annual variability. Eutrophic water is predominantly distributed in the estuary of liao river, Panjin aquaculture area and the port aquaculture area. This is mainly because Panjin and Yingkou are seriously affected by rivers carrying a number of nutrients into the sea. As precipitation increases in spring and summer, a number of land-based pollutants flow into the ocean through estuaries, leading to increased eutrophication area.

Author Contributions

All authors contributed significantly to the preparation of this manuscript. Conceptualization, Y.S., X.L. and M.L.; methodology, Y.S. and M.L.; software, M.L. and C.H.; validation, M.L.; formal analysis, M.L.; investigation, M.L.; resources, M.L.; data curation, M.L., M.C. and C.H.; writing—original draft preparation, M.L.; writing—review and editing, M.L., M.C. and C.H.; visualization, M.L. and M.C.; supervision, Y.S. All authors have read and agreed to the published version of the manuscript.

Funding

This research received no external funding.

Data Availability Statement

The raw/processed data required to reproduce these findings cannot be shared at this time as the data also forms part of an ongoing study.

Acknowledgments

This work was supported in part by the National Key Research and Development Project of the 13th Five-Year Plan—Songliao River Lake Reservoir Water Resources Joint Regulation Platform and Demonstration (2017YFC0406006); The 13th Five-Year National Key Research and Development Program Project—River and Estuary Pollution Tracing and Control Planning (2017YFC0406004); Beijing Outstanding Young Scientists Program (BJJWZYJH01201910028032); and Remote Sensing Interpretation of Nanchang City in 2019.

Conflicts of Interest

The authors declare no conflict of interest.

References

  1. Saaltink, R.; van der Velde, Y.; Dekker, S.C.; Lyon, S.W.; Dahlke, H.E. Societal, land cover and climatic controls on river nutrient flows into the Baltic Sea. J. Hydrol. Reg. Stud. 2014, 1, 44–56. [Google Scholar] [CrossRef] [Green Version]
  2. Tett, P.; Gilpin, L.; Svendsen, H. Eutrophication and some European waters of restricte exchange. Cont. Shelf Res. 2003, 23, 1635–1671. [Google Scholar] [CrossRef] [Green Version]
  3. Li, J.L.; Zheng, B.H.; Zhang, L.S. Eutrophication characteristics and variation analysis of estuaries in China. China Environ. Sci. 2016, 36, 506–516. [Google Scholar]
  4. Sun, T.; Yang, Z.F. Studies on the evaluating index system for estuarine ecosystem restoration and its application. China Environ. Sci. 2004, 24, 381–384. [Google Scholar]
  5. Capriulo, G.M.; Smith, G.; Troy, R. The planktonic food web structure of a temperate zone estuary, and its alteration due to eutrophication. Nutr. Eutrophication Estuaries Coast. Waters 2002, 475, 263–333. [Google Scholar]
  6. Duarte, C.M. Submerged aquatic vegetation in relation to different nutrient regimes. Ophelia 1995, 41, 87–112. [Google Scholar] [CrossRef]
  7. Harvey, E.T.; Walve, J.; Andersson, A.; Karlson, B.; Kratzer, S. The Effect of Optical Properties on Secchi Depth and Implications for Eutrophication Management. Front. Mar. Sci. 2019, 5, 1–19. [Google Scholar] [CrossRef] [Green Version]
  8. Vahtera, E.; Conley, D.J.; Gustafsson, B.G.; Kuosa, H.; Pitkänen, H.; Savchuk, O.P.; Tamminen, T.; Viitasalo, M.; Voss, M.; Wasmund, N.; et al. Internal Ecosystem Feedbacks Enhance Nitrogen-fixing Cyanobacteria Blooms and Complicate Management in the Baltic Sea. Ambio A J. Hum. Environ. 2007, 36, 186–194. [Google Scholar] [CrossRef]
  9. Voss, M.; Dippner, J.W.; Humborg, C.; Hürdler, J.; Korth, F.; Neumann, T.; Schernewski, G.; Venohr, M. History and scenarios of future development of Baltic Sea eutrophication. Estuar. Coast. Shelf Sci. 2011, 92, 307–322. [Google Scholar] [CrossRef]
  10. Kratzer, S.; Kyryliuk, D.; Edman, M.; Philipson, P.; Lyon, S.W. Synergy of Satellite, In Situ and Modelled Data for Addressing the Scarcity of Water Quality Information for Eutrophication Assessment and Monitoring of Swedish Coastal Waters. Remote Sens. 2019, 11, 2051. [Google Scholar] [CrossRef] [Green Version]
  11. Carlson, R.E. A trophic state index for lakes 1. Limnol. Oceanogr. 1977, 22, 361–369. [Google Scholar] [CrossRef] [Green Version]
  12. Wang, M.C.; Liu, X.Q.; Zhang, J.H. Evaluate method and classification standard on lake eutrophication. Environ. Monit. China 2002, 18, 47–49. [Google Scholar]
  13. Kratzer, S.; Håkansson, B.; Sahlin, C. Assessing Secchi and photic zone depth in the Baltic Sea from satellite data. Ambio 2003, 32, 577–585. [Google Scholar] [CrossRef] [PubMed]
  14. Kratzer, S.; Tett, P. Using bio-optics to investigate the extent of coastal waters: A Swedish case study. Hydrobiologia 2009, 629, 169–186. [Google Scholar] [CrossRef]
  15. O’Reilly, J.E.; Maritorena, S.; Mitchell, B.G. Ocean color chlorophyll algorithms for SeaWiFS. J. Geophys. Res. Ocean. 1998, 103, 24937–24953. [Google Scholar] [CrossRef] [Green Version]
  16. Kutser, T.; Pierson, D.C.; Kallio, K.Y. Mapping lake CDOM by satellite remote sensing. Remote Sens. Environ. 2005, 94, 535–540. [Google Scholar] [CrossRef]
  17. Xue, K.; Zhang, Y.; Duan, H. A remote sensing approach to estimate vertical profile classes of phytoplankton in a eutrophic lake. Remote Sens. 2015, 7, 14403–14427. [Google Scholar] [CrossRef] [Green Version]
  18. Duan, H.; Ma, R.; Hu, C. Evaluation of remote sensing algorithms for cyanobacterial pigment retrievals during spring bloom formation in several lakes of East China. Remote Sens. Environ. 2012, 126, 126–135. [Google Scholar] [CrossRef]
  19. Long, C.M.; Pavelsky, T.M. Remote sensing of suspended sediment concentration and hydrologic connectivity in a complex wetland environment. Remote Sens. Environ. 2013, 129, 197–209. [Google Scholar] [CrossRef] [Green Version]
  20. Garaba, S.P.; Badewien, T.H.; Braun, A. Using ocean colour remote sensing products to estimate turbidity at the Wadden Sea time series station Spiekeroog. J. Eur. Opt. Soc. Rapid Publ. 2014, 9. [Google Scholar] [CrossRef]
  21. Wernand, M.R. Poseidon’s Paintbox: Historical Archives of Ocean Colour in Global-Change Perspective. Ph.D. Thesis, Utrecht University, Utrecht, The Netherlands, 2011. [Google Scholar]
  22. Garaba, S.P.; Voß, D.; Zielinski, O. Physical, bio-optical state and correlations in north-western European shelf seas. Remote Sens. 2014, 6, 5042–5066. [Google Scholar] [CrossRef] [Green Version]
  23. Wernand, M.R.; Van der Woerd, H.J. Ocean colour changes in the North Pacific since 1930. J. Eur. Opt. Soc. Rapid Publ. 2010, 5, 10015s. [Google Scholar] [CrossRef]
  24. Novoa, S.; Wernand, M.R.; Van der Woerd, H.J. The Forel-Ule scale revisited spectrally: Preparation protocol, transmission measurements and chromaticity. J. Eur. Opt. Soc. Rapid Publ. 2013, 8, 13057. [Google Scholar] [CrossRef] [Green Version]
  25. Lehmann, M.K.; Nguyen, U.; Allan, M. Colour classification of 1486 lakes across a wide range of optical water types. Remote Sens. 2018, 10, 1273. [Google Scholar] [CrossRef] [Green Version]
  26. Woerd, H.J.; Wernand, M.R. True colour classification of natural waters with medium-spectral resolution satellites: SeaWiFS, MODIS, MERIS and OLCI. Sensors 2015, 15, 25663–25680. [Google Scholar] [CrossRef] [Green Version]
  27. Van der Woerd, H.J.; Wernand, M.R. Hue-angle product for low to medium spatial resolution optical satellite sensors. Remote Sens. 2018, 10, 180. [Google Scholar] [CrossRef] [Green Version]
  28. Garaba, S.P.; Friedrichs, A.; Voß, D. Classifying natural waters with the Forel-Ule Colour index system: Results, applications, correlations and crowdsourcing. Int. J. Environ. Res. Public Health 2015, 12, 16096–16109. [Google Scholar] [CrossRef] [PubMed] [Green Version]
  29. Wernand, M.R.; Hommersom, A.; van der Woerd, H.J. MERIS-based ocean colour classification with the discrete Forel-Ule scale. Ocean. Sci. 2013, 9, 477–487. [Google Scholar] [CrossRef] [Green Version]
  30. Jafar–Sidik, M.; Bowers, D.G.; Griffiths, J.W. Remote sensing observations of ocean colour using the traditional Forel-Ule scale. Estuar. Coast. Shelf Sci. 2018, 215, 52–58. [Google Scholar] [CrossRef]
  31. Graham, J.J. Secchi disc observations and extinction coefficients in the central and eastern North Pacific Ocean. Limnol. Oceanogr 1966, 11, 184–190. [Google Scholar]
  32. Wang, S.; Li, J.; Shen, Q. MODIS-based radiometric color extraction and classification of inland water with the Forel-Ule scale: A case study of Lake Taihu. IEEE J. Sel. Top. Appl. Earth Obs. Remote Sens. 2014, 8, 907–918. [Google Scholar] [CrossRef]
  33. Wernand, M.R.; van der Woerd, H.J.; Gieskes, W.W.C. Trends in ocean colour and chlorophyll concentration from 1889 to 2000, worldwide. PLoS ONE 2013, 8, e63766. [Google Scholar]
  34. Wang, S.; Li, J.; Zhang, B. Trophic state assessment of global inland waters using a MODIS-derived Forel-Ule index. Remote Sens. Environ. 2018, 217, 444–460. [Google Scholar] [CrossRef] [Green Version]
  35. Wang, S.; Lee, Z.; Shang, S. Deriving inherent optical properties from classical water color measurements: Forel-Ule index and Secchi disk depth. Opt. Express 2019, 27, 7642–7655. [Google Scholar] [CrossRef]
  36. Garaba, S.P.; Zielinski, O. An assessment of water quality monitoring tools in an estuarine system. Remote Sens. Appl. Soc. Environ. 2015, 2, 1–10. [Google Scholar] [CrossRef]
  37. Koenings, J.P.; Edmundson, J.A. Secchi disk and photometer estimates of light regimes in Alaskan lakes: Effects of yellow color and turbidity. Limnol. Oceanogr. 1991, 36, 91–105. [Google Scholar] [CrossRef]
  38. Visser, M.P. Secchi disch and sea colour observations in the North Atlantic Ocean during the navado III cruise, 1964–1965, Aboard H. Neth. M.S. “Snellius” (Royal Netherlands navy). Neth. J. Sea Res. 1967, 3, 553–563. [Google Scholar] [CrossRef]
  39. Pitarch, J.; van der Woerd, H.J.; Brewin, R.J.W. Optical properties of Forel-Ule water types deduced from 15 years of global satellite ocean color observations. Remote Sens. Environ. 2019, 231, 111249. [Google Scholar] [CrossRef]
  40. Qu, L.M.; Yao, D.; Cong, P.F. Inorganic nitrogen and phosphate and potential eutrophication assessment in Liaodong Bay. Huan Jing Ke Xue 2006, 27, 263–267. [Google Scholar] [PubMed]
  41. Tian, J.; Song, L.; Wang, N. Nutrient status and trend assessment in the north sea area of the Liaodong Bay. Mar. Sci. Bull. 2007, 26, 113. [Google Scholar]
  42. Li, L.F.; Hui, S.R.; Song, H.L. Evaluation of the services provided by the Shuangtai estuary wetland in Panjin based on emergy theory. China Environ. Sci. 2013, 33, 1454–1458. [Google Scholar]
  43. Song, H.; Liu, X. Effect of reclamation activities on wetlands in estuarine delta in China. Wetl. Sci. 2013, 11, 297–304. [Google Scholar]
  44. Chen, Y.; Fang, G.; Ni, J. Research on century’s changes of coastlines of Liaohe Estuary. J. Mar. Sci. 2010, 28, 14–21. [Google Scholar]
  45. Chen, S.; Ma, A.-Q.; Li, Z.-Y. Landscape Pattern Changes of Wetland in Liaohe on RS and GIS. Environ. Monit. China 2011, 27, 4–8. [Google Scholar]
  46. Tang, J.W.; Tian, G.L.; Wang, X.Y. The methods of water spectra measurement and analysis I: Above-water method. J. Remote Sens. 2004, 8, 37–44. [Google Scholar]
  47. Mobley, C.D. Estimation of the remote-sensing reflectance from above-surface measurements. Appl. Opt. 1999, 38, 7442–7455. [Google Scholar] [CrossRef] [PubMed]
  48. Vanhellemont, Q.; Ruddick, K. Acolite for Sentinel-2: Aquatic applications of MSI imagery. In Proceedings of the 2016 ESA Living Planet Symposium, Prague, Czech Republic, 9–13 May 2016. [Google Scholar]
  49. Vanhellemont, Q.; Ruddick, K. Turbid wakes associated with offshore wind turbines observed with Landsat 8. Remote Sens. Environ. 2014, 145, 105–115. [Google Scholar] [CrossRef] [Green Version]
  50. Vanhellemont, Q.; Ruddick, K. Atmospheric correction of metre-scale optical satellite data for inland and coastal water applications. Remote Sens. Environ. 2018, 216, 586–597. [Google Scholar] [CrossRef]
  51. Vanhellemont, Q. Adaptation of the dark spectrum fitting atmospheric correction for aquatic applications of the Landsat and Sentinel-2 archives. Remote Sens. Environ. 2019, 225, 175–192. [Google Scholar] [CrossRef]
  52. Gorelick, N.; Hancher, M.; Dixon, M. Google Earth Engine: Planetary–scale geospatial analysis for everyone. Remote Sens. Environ. 2017, 202, 18–27. [Google Scholar] [CrossRef]
  53. Pekel, J.F.; Cottam, A.; Gorelick, N. High-resolution mapping of global surface water and its long-term changes. Nature 2016, 540, 418–422. [Google Scholar] [CrossRef]
  54. Ding, Y.; Zhao, J.; Peng, W. Stochastic trophic level index model: A new method for evaluating eutrophication state. J. Environ. Manag. 2021, 280, 111826. [Google Scholar] [CrossRef]
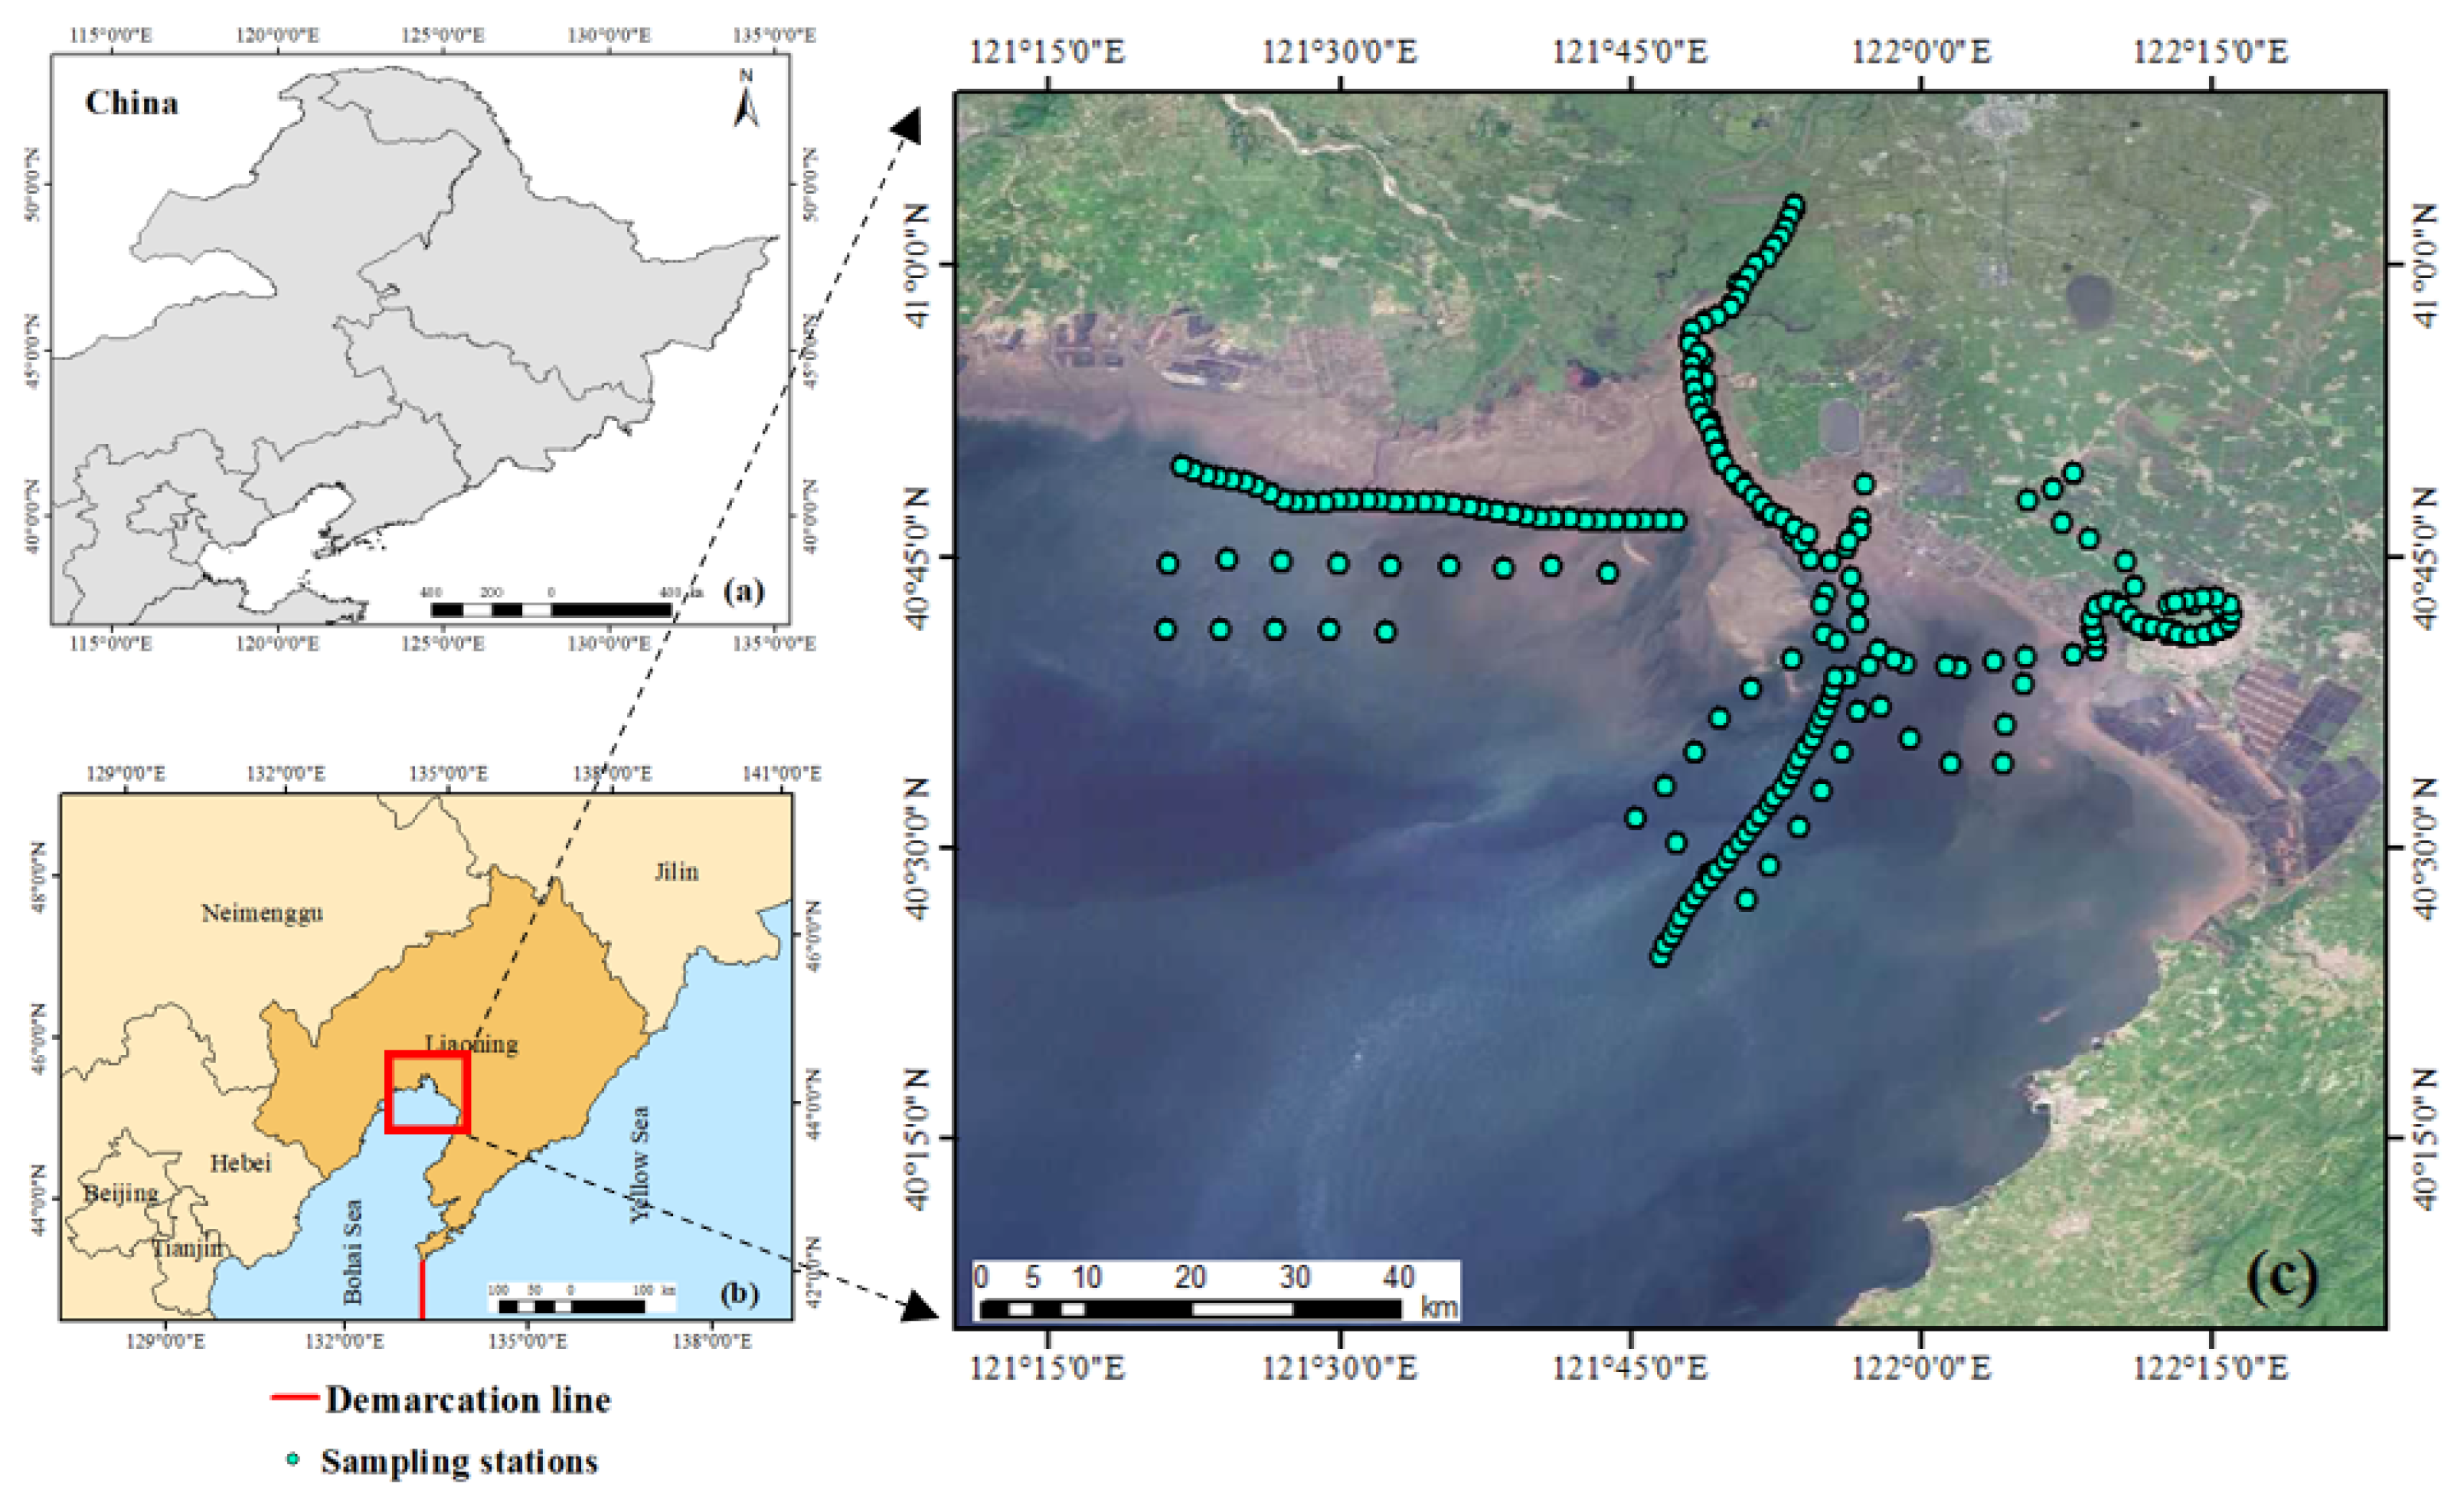
Figure 1. (ac) Location of the study area and spatial distribution of sampling stations.
Remotesensing 13 03867 g001
Figure 2. (a) In situ remote sensing reflectance Rrs(λ) in 2018–2020. (b) The spectral reflectance of simultaneous Sentinel-2.
Remotesensing 13 03867 g002aRemotesensing 13 03867 g002b
Figure 3. Deviation in degrees from the hyperspectral hue angle for Sentinel-2 MSI.
Remotesensing 13 03867 g003
Figure 4. Scatter plots of Sentinel-2-derived FUI and in situ FUI.
Remotesensing 13 03867 g004
Figure 5. Spatial distribution of FUI in 2018–2020.
Remotesensing 13 03867 g005
Figure 6. The correlation coefficient between FUI and water quality parameters.
Remotesensing 13 03867 g006
Figure 7. (a) Relationships between FUI and TLI from the in situ experiment data set. (b,c) Relationships between TSM/Chl-a and trophic level index (TLI) when FUI is between 11 and 15 and between 19 and 20.
Remotesensing 13 03867 g007
Figure 8. The receiver operator characteristic curve of band combination and Youden’s index when FUI is between 11 and 15 (a,c) and when FUI is between 19 and 20 (b,d).
Remotesensing 13 03867 g008
Figure 9. FUI-based water eutrophication assessment decision tree.
Remotesensing 13 03867 g009
Figure 10. In situ TLI in each FUI-based trophic state waters.
Remotesensing 13 03867 g010
Figure 11. (a) Spatial distribution and variation of the eutrophication status in Liaodong Bay in 2018–2020; (b) the percentage of each trophic state in terms of surface area.
Remotesensing 13 03867 g011
Table 1. FUI lookup table.
FUIαFUIαFUIα
1(227.23,235)9(83.46,95.14)17(52.11,56.68)
2(219.24,227.23)10(74.66,83.46)18(46.61,52.11)
3(205.13,219.24)11(69.67,74.66)19(41.72,46.61)
4(189.33,205.13)12(67.97,69.97)20(37.04,41.72)
5(165.99,189.33)13(65.96,67.97)21(31,37.04)
6(134.23,165.99)14(63.32,65.96)
7(109.92,134.23)15(60.33,63.32)
8(95.14,109.92)16(56.68,60.33)
Table 2. Basic statistical indicators.
NameFormula
Determination coefficient (R2) R 2 = i = 1 n ( y i y ^ i ) 2 i = 1 n ( y i y ¯ i ) 2
Root mean square error (RMSE)RMSE = 1 n i = 1 n ( y i y ^ i ) 2
Mean absolute percent error (MAPE)MAPE =   1 n i = 1 n | y i y ^ i y i | ×   100 %
Note: y i is the predicted turbidity value,   y ^ i is the observed turbidity value,   y ¯ i is the mean of the observed turbidity value.
Publisher’s Note: MDPI stays neutral with regard to jurisdictional claims in published maps and institutional affiliations.