Abstract
Spaceborne synthetic aperture radar (SAR) can provide ground area monitoring with large coverage. However, achieving a wide observation scope comes at the cost of resolution reduction owing to the trade-off between these parameters in conventional SAR. In low-resolution imaging, the moving target appears unresolved, weakly scattered, and slow moving in the image sequence, which can be generated by the subaperture technique. This article proposes a novel moving target detection method. First, interferometric phase statistics are combined with the generalized likelihood ratio test detector. A pixel tracking strategy is further exploited to determine whether a motion signal is present. These methods rely on the approximation of both clutter and noise statistics using Gaussian distributions in a low-resolution scenario. In addition, the motion signals are imaged with a subpixel offset. The proposed method is primarily validated using four real image sequences from TerraSAR-X data, which represent two types of homogeneous areas. The results reveal that moving targets can be detected in nearby areas using this strategy. The method is compared with the stack averaged coherence change detection and particle-filter-based tracking strategies.
1. Introduction
Spaceborne synthetic aperture radar (SAR) satellites can achieve wide-area surveillance capacities owing to their large orbital altitude. The detection of moving targets with wide coverage is of considerable interest, and it is especially operable when the majority of the landscape is homogeneous. The applications of such detection systems include traffic monitoring in both the farmland and calm-sea scenarios from the civilian or military fields [1].
Conventionally, for the single, steerable phased antenna of the SAR system, there is a trade-off between its spatial resolution and imaging width [2]. This feature can be commonly seen in scanSAR or terrain observation with progressive scans, which is exploited for maritime domain awareness and other remote sensing applications [3,4]. Over the past decade, high-resolution and wide-swath (HRWS) imaging modes have been investigated and developed for future SAR spacecraft [5]. Although HRWS can significantly improve SAR system performance with separate transmitting and receiving antennas on different platforms, conventional low-resolution and wide-area detection may still be utilized considering system complexity.
Relatively simple clutter and noise statistics can be derived from this type of low-resolution and wide-area image sequence. Hence, the target features in homogeneous areas have several corresponding characteristics and advantages. In low-resolution images, the azimuth position shift and slant range offset are easily tolerated in the imaging area. Moreover, the pixels give rise to a slight defocusing effect. In contrast, several disadvantages are encountered as the size of the target is below the pixel level. Then, the potential motion can be regarded as an unresolved or point-like signal. The geometric shape of the target is difficult to distinguish in this case, and its scattering is submerged in clutter and noise. In addition, the time interval between adjacent images is short such that the target displaces within the pixel range and appears to be slow moving. However, these features primarily lie in the amplitude and geometric domains. The main concept discussed in this study is the use of potential phase information to avoid these disadvantages.
To the best of the authors’ knowledge, several strategies exist to overcome similar problems. Since the image sequences can be regarded as video frames, the most straightforward method is coherence change detection (CCD). This estimation procedure is originally used for airborne videoSAR imagery. Hoshino et al. use CCD combined with the amplitude contrast to detect a slightly moving truck in a pair of satellite SAR images to determine whether it appeared or disappeared [6]. Stack-averaged coherence has been proposed to extend the application of an image pair to a sequence, where distinct coherence magnitudes are averaged to detect scattering changes within a pixel [7].
The second proposed method is the generalized likelihood ratio test (GLRT) introduced by Budillon et al., which is originally adopted for multibaseline along-track interferometric (ATI) interferometry [8]. In this method, a given pixel across a sequence can be modeled as a time series. The GLRT assumes that this sequence can be regarded as a complex Gaussian distribution. Therefore, the indication of ground moving targets is well-modeled as a hypothesis testing problem to determine whether the target is present. This method is practical and has been successfully implemented using both simulated and real data [9]. Although the adjacent pairs in image sequences are obtained within a very short time interval, they are taken from the same viewing angle. This situation differs from the case examined in this study. The GLRT method benefits from the likelihood ratio definition, which is suitable for target features that only influence the local neighborhood region in an image and is consistent with our proposal. The GLRT detector is originally applied in optical systems, wherein the likelihood ratio function is maximized to determine the presence of moving targets [10].
Recently, pixel tracking is proposed by Biondi et al. as a powerful analysis tool for indicating target micro-motions [11,12,13]. This method uses normalized cross-correlation to estimate the translational shifts between two interpolated images. Using the interpolation technique, the estimation accuracy can be at the subpixel level. It should be noted that the GLRT method has also been employed to detect the target micro-motions [14]. In this study, the rotation of a target is considered. The likelihood ratio function for the GLRT is utilized in the complex form, wherein both the magnitude and phase quantities are included.
Other types of likelihood ratio detection tests using tracking strategies have been introduced in [15]. The Bayesian-based approach has been exploited in SAR applications [16,17,18], where the target state is initially estimated and then updated using incoming observations. This state is most frequently numerically approached using a particle filter (PF). Shi et al. implemented a particle filter for slow-velocity and floating target detection in the context of land-based radar [19,20]. In their study, a single-frame detection process could not necessarily call the target presence, and therefore, the track-before-detect (TBD) strategy is adopted. This strategy uses Bayesian recursive inference techniques and regards the target detection problem as a target location inference problem. It is applied to low signal-to-noise ratio or signal-to-clutter ratio images and after integrating information from multiple individual scans. The TBD problem has also been widely used in SAR applications [21,22,23]. The original method can be implemented using a particle filter and a magnitude-based technique combined with the phase information. It is worth noting that previous research has incorporated phase information into the detection procedure to improve the results of the system [24]. This practice highlights the importance of phase information.
This study focuses on wide-area monitoring and relatively homogeneous terrain or landscapes, such as farmlands and seas under calm conditions. By splitting a single antenna into multiple subapertures and properly defining the imaging parameters, a sequence of multi-squint and low-resolution images can be acquired. This sequence could be a long time series of low-resolution and squinted SAR images. Through Doppler frequency overlapping, a high temporal resolution is achieved rather than a high spatial resolution, and the image series are produced with quite a small time baseline. Moreover, these series do not have the same observation geometry. Owing to the large distance between the platform and ground, the additive noise in the obtained images is more significant than the airborne condition. Therefore, it is essential that the additive interference be jointly considered with the clutter terms.
The contributions and novelty of this study are as follows. This study is the first to explore the direct use of phase information as detection priors. For the detection of motion signals, the interferometric phase information is combined with the subpixel tracking strategy to determine the presence or absence of a given translational displacement from the amplitude information. The results reveal that the proposed method is promising in terms of sensitivity toward various potential moving targets.
The remainder of this article is organized as follows. Section 2 provides the mathematical formulation for the observation geometry and the corresponding phase model. Section 3 presents the proposed method. Section 4 outlines the implementation of the proposed method using four real image sequences from TerraSAR-X data and presents comparative results. A discussion and conclusions are provided in Section 5 and Section 6, respectively.
2. Problem Formulation
In this section, the acquisition mechanism of low-resolution SAR image sequences is briefly introduced. These images are complex-valued and are generated using the subaperture technique with a single steering antenna. First, the SAR satellite observation geometry is introduced. Then, the interferometric phase statistics from the image sequences are analyzed in detail.
2.1. Observation Geometry
The acquisition geometry of the proposed system is depicted in Figure 1: the geometry is adopted from previous literature [25]. The satellite platform operates along the flight direction at a constant velocity . The acquired low-resolution images are denoted as
. Taking the two adjacent acquired images as an example, the moving target position has subpixel-wise displacements of from the azimuth and ground range directions, respectively. The two images are obtained with different geometries and with a slight time delay: are their azimuth squint angles and elevation angles, respectively. These qualities lead to a temporal and spatial decorrelation between the adjacent images. Thus, an overlap of consecutive subapertures is needed.
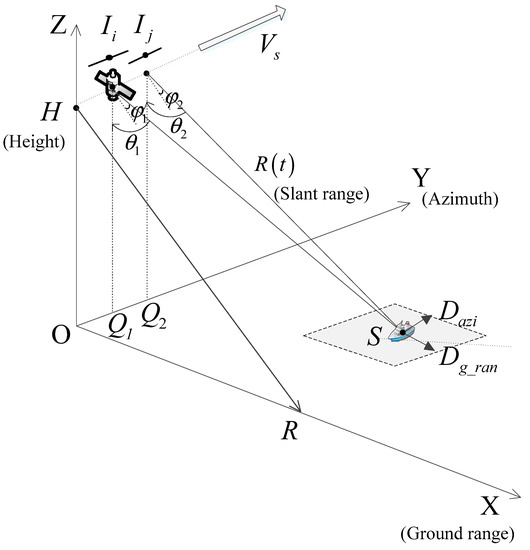
Figure 1.
Acquisition geometry of low-resolution SAR images. (In the Cartesian coordinate system, the positions of the satellite during two image acquisitions are represented by , and forms the two-dimensional range coordinate system, which places the subpixel target in the image sequences).
Similar to the airborne videoSAR, the staring spotlight is chosen as the observation mode because it can enlarge possible azimuth squint angles. In addition, a certain degree of overlap in the Doppler frequency band is adopted, which enables an increase in the number of sequential images. The chirp bandwidth is consistently reduced to obtain a low-range resolution. As a result, more than several dozen or one hundred images are generated, which is clarified in the experimental validation Section 4. Note that this separated baseline could be either purely along-track or partly cross-track to generate the interferometry configuration.
As the images are generated with significantly short time delays and the overall synthetic time is relatively short as well, it can be assumed that a moving point has a constant velocity from both directions in each acquisition. Therefore, the displacement of a moving point is also assumed to be constant between adjacent image pairs.
In the conventional SAR imaging of a given region of interest (ROI), a low spatial resolution in the azimuth direction can be achieved by segmenting multiple subapertures from the complete acquisition process. The obtained resolution is determined using a portion of the full effective Doppler length. In the range direction, a reduced resolution can be controlled by the chirp signal bandwidth. These relationships are described as follows:
where are the resulting resolutions of the azimuth and ground range directions, respectively; is the original azimuth resolution; is the subaperture frequency band; is the effective full Doppler frequency; is the speed of light; is the radar incident angle; and is the bandwidth of the chirp signal.
This type of geometry aims to image the same areas with different look angles, which can be easily achieved using a simple configuration. The system differs from ATI-SAR systems, which display identical observation geometries. An overlapping of subapertures is provided to ensure a sufficient coherence magnitude. Consequently, a certain degree of this magnitude may be observed. This mechanism is similar to persistent scatter pairs, wherein the dominant ground scatters are considered to have the same contribution as moving targets. Therefore, they may be sensitive to interferometric phases. The phenomenon is discussed further in the following Section 2.2.
2.2. Interferometric Phase Statistics
As stated in the previous Section 2.1, man-made motion signals cannot be considered as extended targets. Their sizes, including the defocusing effect, may be equal to or smaller than the resolution of the system. Therefore, these motion signals can be regarded as subpixel or small targets that occupy only a few pixels or as subpixels. Within a certain pixel, the scatters may be regarded as an ensemble point. Therefore, the statistics relating to these scatters can be represented by their mean velocities, which can be equivalent to a single point observed from the radar look direction.
Considering a small squint angle as an example, this process can be further simplified. The moving target signal is regarded as an additive contribution to the background and noise, which may both be assumed to exhibit Gaussian distributions in the low-resolution scenario (according to the central limit theorem). Then, the phase statistics can be used as a pre-detection procedure.
This process is similar to registration with subpixel accuracy, wherein the phase information within a pixel is sensitive to distance or range variations. The computations of the interferometric phase of the two images are related to the coherence of the two images. For each pixel, classical multi-look sum techniques are used [26]:
where is the number of neighborhood windows utilized to average the interferogram image, including those from the azimuth and range directions.
The first expression in Equation (2) denotes the coherence magnitude, whereas the second term refers to the interferometric phase. Multi-look processing is conducted on the interferogram image. Note that the statistics of the phase are invariant to the multiplicative modulation of the arbitrary image. In the local area, this scaling factor tends to have no influence on the phase results, unlike the coherence magnitude. Therefore, the phase information is more suitable for determining the change in viewing angle as the scaling factor, which may relate to different viewing angles. The echo signal response can be modulated by the two-way antenna pattern function. Moreover, the viewing angles can vary in both the azimuth and range directions. Between the adjacent images, most of the moving targets move in both the azimuth and range directions within a resolution cell, which results in an additional phase shift. This mechanism is similar to that of persistent scatter interferometry [27].
Considering a low-resolution scenario, a resolution cell consists of numerous scatters. Therefore, their sums utilize the central limit theorem. The distributions can be regarded as zero-mean and complex Gaussian distributions. Moreover, the Doppler frequencies of the two images partially overlap and are considered partially coherent. Between the adjacent images, the closed-form distributions of the interferometric phases are determined as follows, which can also be approximated using a simple Gaussian distribution with a zero mean and a specified variance. These qualities are previously described in [28,29] and are further demonstrated in the experimental Section 4 of this article:
where represents the gamma function, is the Gauss hypergeometric function (GHF), , represents the coherence magnitude, and is the inherent phase angle, which could be estimated by averaging the interferometric phases within the neighborhood of each pixel, and denotes the number of looks. For a given pixel across the image sequence, the approximated Gaussian distribution has a nearly closed variance because the squint angle is small and the overlap ratio between adjacent images is the same.
Gaussian distributions can be used to simplify the likelihood ratio expressions and calculations, wherein both the clutter and noise terms can be easily included in the results. As stated in Section 1, in the context of a large coverage of the resolution cell, the moving target can be regarded as the dominant scatter point in this pixel. We first consider a single scatter point and its relative position within the resolution cell. Between adjacent images, the scatter has moved a certain distance and contributed to changes in the slant range. The phase of the returned signal is assumed to be independently contributed by the point-like dominant moving scatter and clutter/noise. Owing to the motion features, an additional phase shift can be generated in the aforementioned phase distributions. Note that for the ensembles of clutter points, this phase shift may be equivalent to a point group or a portion of the pixel having a certain velocity.
According to the above analysis, the aforementioned Gaussian distributions can also be adapted to low-resolution urban areas, wherein numerous man-made objects exist. However, from [8], homogeneous areas are more appropriate for this system. Therefore, this article focuses on an ocean under calm conditions and agricultural areas.
3. Proposed Method
The proposed method consists of two major processes: the first process utilizes the GLRT mechanism, which is specific for interferometric phase time series. The second utilizes the pixel tracking strategy to compute subpixel offsets. A flowchart of the proposed method is shown in Figure 2.
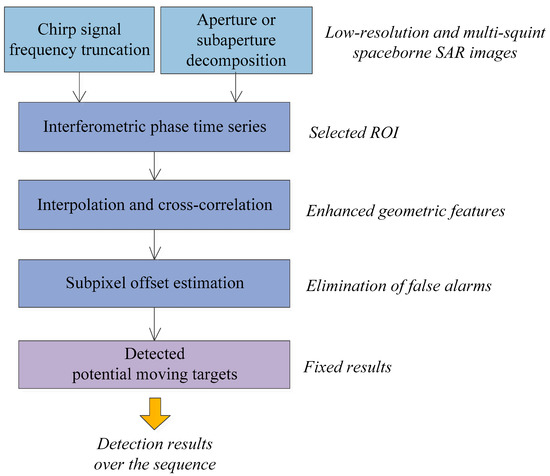
Figure 2.
Flowchart of the proposed method.
3.1. Application of the GLRT to the Phase Domain
The ground motion in the persistent scattering interferometry may also be applied to a moving target. The target has a point-wise offset within a pixel regardless of the dynamic or textual ground. During a short time delay between adjacent acquisitions, the ground may be assumed to be nearly static. The motion signals are supposed to act as additive contributions to the results, which is preliminarily proven in the following experiments.
The interferometric phase time series is regarded as the input to this system. Based on the statistical models shown in Section 2, the GLRT problem is established using two hypotheses: hypothesis H0 is the absence of the target, whereas hypothesis H1 is the presence of a moving target, which can be regarded as an additional signal on the target clutter and noise distributions. The simple formulas for these hypotheses are as follows [30]:
Here, we consider the simplest case in which this additional shift is modeled as a constant signal. Under the assumption of small antenna looking angles, the phase shift can be proportional to the angle variations and target subpixel positions, in either the azimuth or ground-range direction. Assuming that the target possesses a uniform velocity with respect to the acquisition time, the signal could be considered as constant because both the observation angle and subpixel location of the target point vary linearly. Moreover, because this shift is equivalent to modulation by , the accumulation of phase changes may be self-restricted, and numerous target movements do not cause a significant phase shift. The linear method is based on the theoretical effects described in Section 2. The GLRT framework is first directly applied to the phase domain.
Using the overlapped subapertures, the image sequences are densely generated along the timeline. With a constant overlap ratio, a slight angle difference exists between the two adjacent images. Compared with the ATI-SAR system, the very short baselines of these methods may be identical. However, as the proposed method assigns multiple antennas or sub-antennas only along the platform moving direction with various viewing angles, the observation geometry differs.
Considering the subaperture configuration, two adjacent images are acquired, which are equivalent to the two antennas. Interferometry uses the phase difference information contained in these images as a very sensitive means of determining distance variations. Then, complex multi-look images are obtained. Next, the image representation is spatially averaged to obtain the inherent phase. The coherence magnitude is defined using the module of the derived results , which represents the estimated empirical coherence degree. The empirical phase difference is also calculated.
Owing to the large-scale coverage of the resolution cells, the pixels in the interferometry image are assumed to be independent and identically distributed (i.i.d). Therefore, the histogram of the pixel phase distributions reveals identical distributions. The average filter among a single image can be used to estimate the inherent phase information, which consists of the height variation information within the pixel. Therefore, the Gaussian distributions can be regarded as the approximate formulation for the interferometric phases with the presence of only clutter and noise. These conclusions are drawn from previous literature because these distributions are zero-mean distributed and partially coherent. Moreover, precise estimation of the variance is not necessary for this scenario, as it can be estimated by the Maximum Likelihood Estimate (MLE) in the GLRT method. The test statistics are determined as follows:
where is the variance of the pixel sequences to be examined and is the estimated variance under H1.
3.2. Pixel-Based Tracking Strategy
Although the phase difference contains information regarding the variations of the distance between the target and radar, few studies have considered these properties in the multi-squint case. Based on the aforementioned specific properties of moving targets, a method that utilizes the interferometric phase information and pixel tracking is proposed in this study. The main contributions of this study are as follows. First, the pure phase quantity is applied as the measurement likelihood ratio. Then, the GLRT is used to determine the target presence coarsely. Pixel tracking with an interpolation strategy is employed to differentiate between the static false alarms and true motion scatters.
Pixel-based tracking is a correlation-based strategy. This correlation is usually linked to pixel shifts and consists of two components. The component interpolates the candidate selected via the phase computation from the previous section. The second component subtracts the most frequently estimated shift and then performs statistical computations using the obtained results. The basic 2D correlation computational method is often used in the subpixel registration results [13] or as the velocity measurement system. Since the motion signals have a certain velocity, this strategy may be applied to eliminate the occurrence of subsequent false alarms.
After utilizing the interferometry phase information, low-resolution magnitude images are used to enhance the detection performance of this system. The primary detected results define a dedicated ROI. Then, the magnitude correlation is used to determine whether the examined areas contain potential moving scatters. Next, high-resolution image formation is achieved to indicate the ground movement of the target. Therefore, the detection method presented in this study is a coarse process.
In the proposed method, the subpixel shift is not estimated by the adjacent pixels. However, it is estimated from the first image to successive images in the sequence. Each image selected by the phase statistics is enlarged or oversampled. A mechanism called the “search for common shift” is used to estimate the results. Subpixel offset technology is not directly employed to determine the micro-motion target. This interpolation method can be utilized to enhance the line or contour structure of the target, and the subpixel offset estimation is transformed into the motion of these geometric properties. In this article, the “Canny” operator for extracting linear features is adopted, and the image resizing ratio is 16. Consequently, the common movement obtained after the interpolation and the inherent movement that occurs the most frequently are selected.
where are the initially estimated shift and reduced shift, respectively. The shift that appears to be the most frequent across the sequence is subtracted from the estimated shift. The operator denotes the total number for each quantity of shifts.
As stated in previous literature, the subpixel offset is largely independent of the estimated phase information. A similar technique is used in the registration of a pair of images to determine whether the strong revealed pixels exhibit shifts. In the original image pairs, the unresolved moving scatters are surrounded by static strong scatters. Therefore, these methods cannot be directly applied. The estimated subpixel displacements and shifts are also calculated. This latter criterion can also be referred to as the amplitude change. From the experimental Section 4, the results of these calculations reveal that the potential detected pixel appears as an ensemble, and a neighborhood area is chosen to obtain strong moving scatter results. Using this method, false alarms can be suppressed. Therefore, the proposed method is at least sensitive toward potential moving scatters.
The Gaussian assumption is biased when utilized in conjunction with urban areas or dynamic ocean conditions. When urban areas that consist of man-made objects occupy the majority of an image, false alarms may be produced. Dedicated high-resolution image detection can be used to avoid this phenomenon. This phenomenon can be distinct in high-resolution scenarios. Conversely, the corresponding homogeneous areas can be pre-detected or pre-indicated utilizing the segmentation strategy proposed in this study.
It should be noted that the GLRT is suitable for a long time series, and its performance can be estimated asymptotically with an increasing number of images. Using normalized cross-correlation and feature matching, translational shifts may be inferred. By clipping from the other images, this method can be regarded as a type of tracking strategy.
The techniques proposed in this study are related to SAR image registration with the subpixel accuracy. The pixel tracking strategy can be considered as a type of two-dimensional cross-correlation method, which aims to achieve a fine subpixel shift via local co-registration between adjacent images. We can obtain a fine-shift estimation following the interpolation process. These estimations are related to the coarse estimations and subpixel resolution by oversampling the original image sequences.
4. Experimental Results
Since it is difficult to achieve accurate simulation results for dynamic ocean currents and agricultural textures, real TerraSAR-X Single-Look Complex (SLC) data are directly used to generate equivalent low-resolution images in this study. The real images are obtained from the observations of Lvshungang, Dingxin, Sasebo, and Jinmen. Calm sea and suburban areas are segmented, wherein the majority of the ground in the latter images is covered with crops. These types of land cover can be considered homogeneous. Screenshots of the four sub-regions are shown as grayscale images in Figure 3.
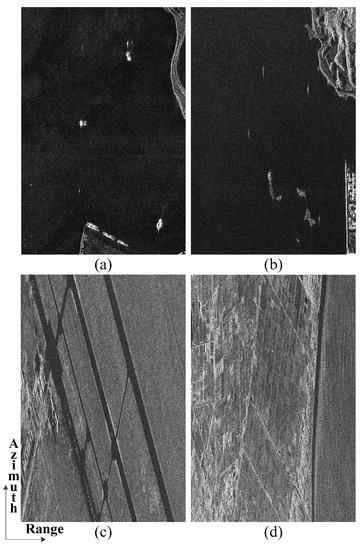
Figure 3.
Segmentations of TerraSAR-X SLC data: (a) Lvshungang. (b) Sasebo. (c) Dingxin. (d) Jinmen. Their appearances are stretched and compressed in terms of the shapes and quantized amplitude for appropriate depiction.
4.1. Calm Sea and Farmland Scenarios
The obtained images are segmented into sequences in the range-Doppler domain and downsampled using the Fourier transform in the range direction. First, we illustrate the resolution reduction considering the four real SLC image data. Then, the frequency allocation configurations and detailed subaperture decomposition process are introduced. Based on the fundamental satellite configuration, several parameters of the satellite platform/antenna and resolution variation are listed in Table 1 [25].

Table 1.
Satellite platform/antenna and resolution variation parameters.
Image generation is achieved based on subaperture techniques using slightly different viewing angles and the estimated antenna pattern curves. Furthermore, frequency band segmentation is employed to achieve a low resolution in both the azimuth and range directions, as depicted in Figure 4. In the azimuth direction, the pairs of neighboring subapertures are not perfectly adjacent but rather are interlaced with a constant overlap ratio. Meanwhile, in the range direction, a common subband is truncated among different images, according to the reduced resolution ratios. Correspondingly, the frequency allocation configurations are listed in Table 2, wherein the number of Doppler subapertures is the same as the low image number for each SLC datum, and the subband frequency occupations are exactly or nearly equal to the low-resolution image sizes. In the experiment, only two mean filters are used to perform the multi-look processing/CCD and inherent phase estimation. Subareas from Figure 3 are selected from SLC data with distinct rectangular windows. These configurations and parameter settings are also provided in Table 2. Since the geometric correction is performed during the whole aperture time, the registration procedure is not required for equivalent low-resolution images. For the low-resolution images, the statistical characteristics of each pixel are i.i.d. Therefore, the statistical information of the entire interferometric phase images may be used to represent the single-pixel statistics.
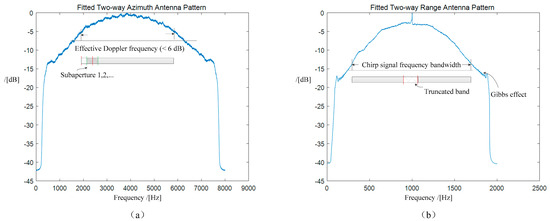
Figure 4.
Frequency band segmentation used to achieve a low resolution. (a) Effective Doppler band in the azimuth direction and subaperture decompositions. (b) Corresponding chirp signal frequency bandwidth and truncated band. The results of Fourier transforms of Lvshungang image sequences are taken as examples.

Table 2.
Frequency allocation configurations and filter parameter settings.
The overall acquisition time is less than several seconds, which corresponds to the spaceborne conditions. Therefore, the aperture time of the corresponding area is quite limited and results in a wide resolution in the azimuth and range directions on the order of hundreds of meters. As depicted in Figure 5a, the interferometric phase histogram between the first and second images from the temporal sequence is obtained. It can be seen that this histogram is similar to a zero-mean Gaussian distribution. Moreover, the peak of the envelope, which corresponds to the variances of distributions, does not vary significantly, which ensures the basic assumption of the GLRT method, as shown in Figure 5.
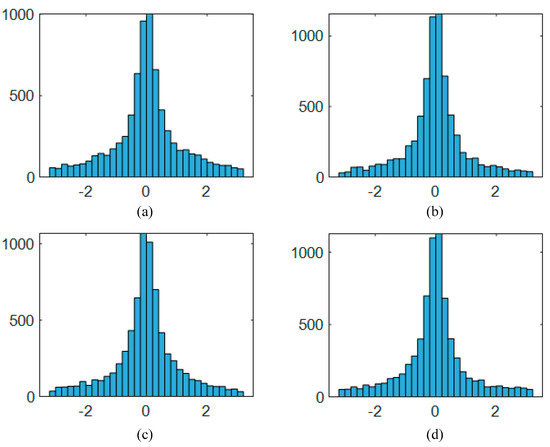
Figure 5.
Interferometric image statistics demonstrating the i.i.d assumption within the image and the close variance across the sequence. The (a) 1st, (b) 5th, (c) 20th, and (d) 30th interferometric image histograms are shown, wherein the case of Lvshungang observation is taken as an example.
The proposed method is compared with two alternative techniques used to achieve such detection: the stack-averaged CCD and particle-filter-based tracking methods. The latter method is employed in conjunction with the coarse initial location of the given target, which can be specified in advance. Since the target to be detected is non-cooperative, targets such as the vehicles and marine vessels, which can be visually confirmed, have been considered in previous studies. Considering the resolution reduction, the given pixel coordinate relationships in the processed images and the original images are explicitly considered, i.e., the geometric mappings among the generated low-resolution image sequences, SLC data, segmented areas, and new subaperture decompositions of original high-resolution SLC images (only in this way, the motion within the short aperture time might be visually confirmed) are examined by calculating their image size ratios. Each image is considered as the finite sampling result of a random process. The values are divided into several intervals, and the total number of values for each quantity are counted. This sampling ensemble is used to estimate the probabilistic distribution densities.
In the particle-filter-based tracking method, the particles are exploited to represent the locations of moving target centroids. These particles are randomly generated from the first image and can evolve with the successive images based on the weight values. These quantities are determined based on the amplitude similarity between the motion area specified in the first image and those represented by these particles. We adopt the Bhattacharyya distance, combined with the standard normal distribution, to calculate the weights. Note that the concept of similarity in this method could be analogous to the ratio of the probability likelihood, but it concerns only magnitude information.
The phase-selected area still contains residual clutter at this point. Subpixel offset tracking is utilized to suppress these possible false alarms. The minimum bounding rectangle algorithm is exploited to collect potential moving candidates after GLRT thresholding. Considering such a rectangular section of an image as an example, the phase-selected area could consist of a set of structures, such as lines and contours. These kinds of features could be found in ships and buildings and could be extracted and enhanced after the interpolation of this subarea. Therefore, the next problem is to determine whether these structures have a certain shift or could be locally aligned in order to judge the presence of moving targets.
Taking the sixth square in the Lvshungang experiment as an example, its estimated shift across the sequence is as shown in Figure 6. The most common shift has been subtracted from all the estimated relative offsets, according to Equation (6). The basic idea is to count whether zero offsets, including the small quantities around them, exceeded half of the interframe image numbers. The large number of zero shifts indicate that the relevant subarea is more likely to be static, and the depictions in the figure suggest a true motion signal. To determine the cross-correlation, a template is chosen from the first image as reference (primary rectangle), and the corresponding areas from the rest of the images to be compared are enlarged by three pixels in each direction. The new rectangles with exceeded boundaries are no longer taken into account to avoid the potential boundary effect. In these four study cases, the phase GLRT threshold for the Lvshungang and Sasebo experiments is 20 and 25 for the Dingxin and Jinmen experiments. The bias to zero shift is set to 0.05. Finally, a penalty ratio is adopted to quantize the generated low-resolution images to avoid extremely large magnitudes for all image pixels. This ratio is considered to be 5 for the Lvshungang and Sasebo study cases and 2 for the Dingxin and Jinmen cases.
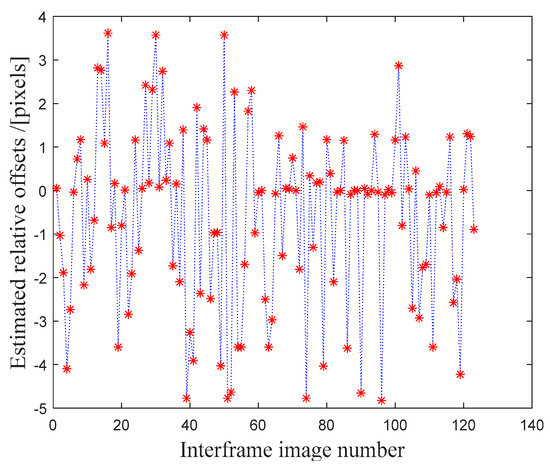
Figure 6.
Subpixel “common” shift estimation and subtraction for a red square to obtain a relative shift. The sixth motion candidates across interframe images (between the first image and the others) from Lvshungang observation are taken as examples.
The presence of unresolved moving targets is inferred, as shown in Figure 7. After eliminating the false alarms by pixel tracking, the remaining red squares represent the potential motion signals. Note that a couple of rectangles could indicate the same target. Among the three large vessels detected in Figure 7a, the vertical motion could be visually confirmed only for the rightmost vessels, as revealed by the subapertured high-resolution SLC images. The other two vessels are assumed to have local vibrations, as stated and studied in [12]. Several indications are present on land in Figure 7b, where a moving vehicle can be distinguished. After calculating the explicit pixel mappings between the low- and high-resolution images, streak-like vehicle signals could be visually inspected in the high-resolution images. They could appear from the nearby areas, owing to the Doppler frequency mismatch. This mechanism leads to an imaging position shift in the azimuth and range directions for moving targets.
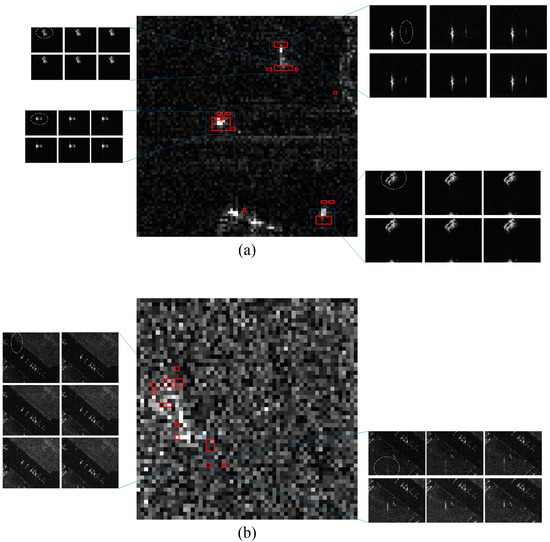
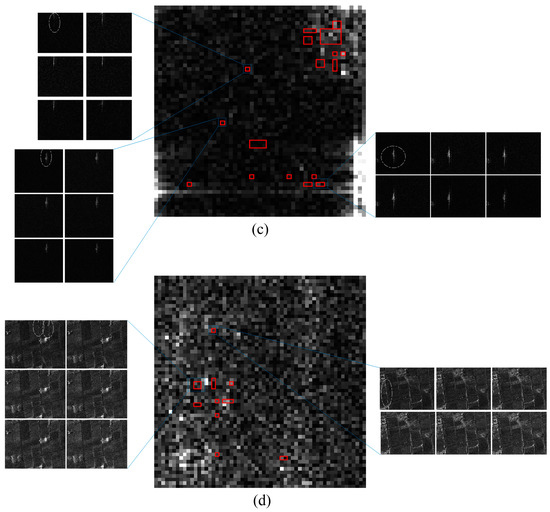
Figure 7.
Detection results across four temporal sequences: the images in the middle are abstracted from the first low-resolution images that are obtained. (a) Ocean landscaped in Lvshungang. (b) Agricultural areas in Dingxin. (c) Ocean landscaped in Sasebo. (d) Agricultural areas in Jinmen. The red squares represent the areas wherein moving targets may exist. By calculating the geometric mappings and searching the high resolution, six subaperture decomposed Scheme 100. pixels in each direction, due to possible Doppler centroid mismatch), have been visually found and are indicated by the blue squares. The potential moving targets are encircled in white with these 11 groups of high-resolution sequential images on both sides, and the temporal lines are from left to right and top to bottom.
Figure 7c and d provide two similar case studies of Sasebo and Jinmen, respectively. Three high-speed and defocused signals are evident in Figure 7c, as also presented in Figure 7a. In Figure 7d, multiple proximal vehicle signals are observed along farm ridges. In addition to the moving targets detected and areas difficult to visually perceive and confirm, there are false alarms indicated from sea–land junction areas (including small islands) and around the suburban buildings or infrastructure. Empirically, it is evident that a large number of these man-made features could generally degrade the phase-related Gaussian approximations. Hence, for the red squares whose coverage is larger than the number of looks, they should be eliminated. However, in practice, these results may have no meaning for homogenous-area surveillance tasks because a land-avoidance strategy can also be used.
4.2. Comparison with Related Methods
The obtained results indicate that the proposed mechanism could be potentially promising when considering the alternative methods, including the stack-averaged CCD and particle-based tracking methods, as compared in Figure 8. The real point-wise signal tends to become sheltered after undergoing processing. After comparison with the aforementioned methods, the noise and clutter responses cannot be excluded from the thresholding operation, as dark, low coherent areas may also be caused by the motion of the current or agriculture texture, and not by the moving scatters. Figure 8a–d illustrate the stack-averaged coherence level for Lvshungang, Dingxin, Sasebo, and Jinmen, respectively. The dark areas are also revealed as having low coherence, and motion signals could not be directly inferred by using the threshold operation.
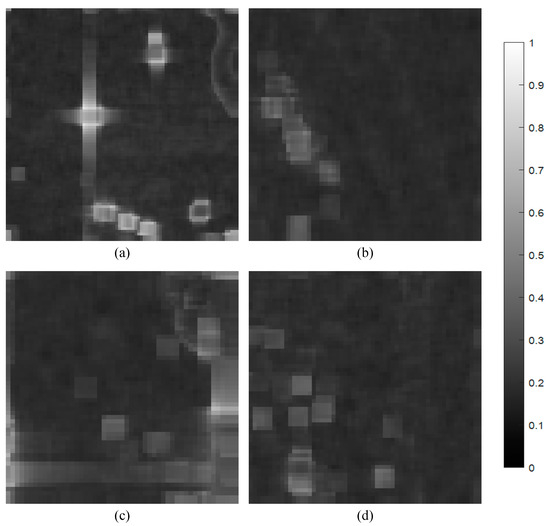
Figure 8.
Stack-averaged coherence changes in magnitude for (a) Lvshungang, (b) Dingxin, (c) Sasebo, and (d) Jinmen. The dark areas indicate low coherence and cover the majority of the observation areas, owing to the multi-angle scattering sensibility. It is difficult to separate them from the motion signals, which could also appear as low coherence in normal resolution cases.
In addition, even though the accurate initial location of the moving target is manually provided, the classical PF-based tracking strategy still cannot accurately indicate the target centroid, as shown in Figure 9a–e. This shortcoming is due to the multi-angular observation scheme: the scattering of ground signals usually fluctuates across image sequences. Hence, the amplitude-based similarity assessment is no longer robust. Considering the rightmost vessel in the Lvshungang experiment as an example, we use the three red squares around it to obtain a barycenter according to their areas. In addition to the position bias in Figure 9c,d, a benchmark is also presented in Figure 9e: across the image sequence, the potential moving target is assumed to be nearly static with a subpixel offset (black line), and the GLRT-based method could denote a static estimation from the beginning to end (blue line). However, PF-based tracking could not achieve coverage (red line). Moreover, the GLRT method involves the direct application of the MLE to the entire image sequence, whereas the tracking strategy recursively calculates position approximations. It should be noted that the latter method is less computationally efficient. Therefore, particle-filter numerical approximations are not recommended in this scenario.
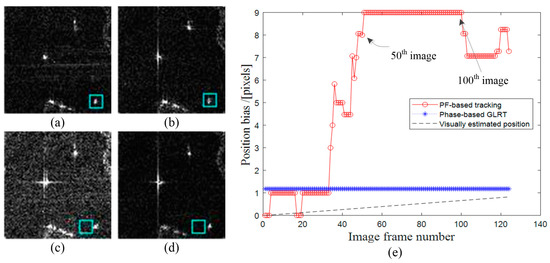
Figure 9.
Results of applying the PF-based tracker to the Lvshungang image sequences. In (a), the first image, the cyan square is specified to indicate the centroid of the moving vessel accurately. In (b), the 10th image, the target can still be tracked. In (c), the 50th image, a location variation can be visually observed. In (d), the 100th image, the cyan square cannot indicate the moving target centroid, with larger position bias. (e) Benchmark position estimation accuracy of the PF-based tracking and phased-based GLRT method proposed in this article, wherein the visually estimated position is approximately set as 0 during the position bias computation.
5. Discussion
The likelihood ratio detection and tracking method, which utilizes the particle-filter technique, suffers from issues such as dimensionality. In addition, only the magnitude of the image is considered, i.e., the envelope information of the moving target distributions. Therefore, considering the viewing angle variations, the magnitude properties may be determined, as the background appears to be dynamic, but the GLRT method exhibits asymptotic behavior in terms of the characteristics of the problem considered in this study. Since these images are obtained from different squinted angles, the scatter properties vary. This issue degrades the performance as the likelihood ratio functions are difficult to define in terms of magnitude information. A similar problem occurs with the PF-based tracking techniques, as mentioned in the previous sections. However, the overlap frequency ratio between adjacent images should be constant and sufficiently large. This requirement is related to the continuous angle variations in the staring spotlight mode. Therefore, the similarity or correlation between neighboring images and the physical significance of their interferometric phases could be fundamentally ensured.
Satellites are used to extend observation areas and ensure adequate monitoring capacity. The phase-based traditional GLRT introduced in this study are applied to complex images. Moreover, the clutter and noise are regarded as interference, which can be considered using a Gaussian approximation to determine whether a signal is present or whether noise exists. The utilization of the phase domain instead of classical amplitude information is the main innovative aspect of this study. Classical methods mainly consider amplitude and intensity information for information retrieval. In contrast, the method proposed in this article begins with the identification of phase difference information, which is important in the proposed method and is used to create long time-series data. It should be noted that the GLRT is the MLE of the likelihood ratio, and a direct computational model is relatively simple compared to numerical recursion. The proposed method is relatively simple, and the phase information is quite useful. However, it has not yet been utilized in the multi-squint case, which accounts for the variation of the antenna pattern.
Finally, all components of the proposed method are programmed in a MATLAB environment with 32 GB of memory and an i9-type CPU. The execution time is dozens of seconds for each scenario. During the very short acquisition time, the other complex parameters are assumed to be insignificant, and therefore, only the measured distance variation is related to the scatter motion. Since the time interval is short and relative motion is characterized by selecting nearby high-energy and stable geometric features, the shift contribution is mainly generated by the target displacement as the magnitude varies between pixels.
6. Conclusions
This article explores the use of interferometric phase information for applications involving wide-area SAR temporal sequence monitoring. To the best of the authors’ knowledge, this study is the first to introduce a likelihood ratio framework into the phase domain. Additional phase contributions are considered to exist with subpixel motions. Therefore, a faint target in terms of the magnitude domain is not necessarily weak in terms of phase variations. The proposed method is directly applied using real TerraSAR-X data for two types of scenarios primarily consisting of calm sea and agricultural areas.
The method presented in this article cannot determine whether multiple interactive or proximal red squares represent a single target or not. The number of potential targets of interest, even in the case study of group targets, could be inferred using this method [31]. Other scenarios involving land-avoidance strategies, wherein static man-made objects or infrastructure exist, may also be examined. These two problems will be considered in our future studies.
Author Contributions
Y.L. and W.Y. conceived the study, developed the methods, and performed the experiments; C.L., X.P., S.L. and H.Z. supervised the research or related issues; Y.L. wrote the paper. All authors have read and agreed to the published version of the manuscript.
Funding
This research was funded by the National Natural Science Foundation of China (NSFC), grant number 61861136008.
Institutional Review Board Statement
Not applicable.
Informed Consent Statement
Not applicable.
Data Availability Statement
The data presented in this study are available upon request from the corresponding author.
Acknowledgments
The authors would like to express sincere gratitude to the four anonymous reviewers and all the editors for their valuable comments and suggestions. We would also like to thank Yihan Li from Beihang University for her implementation of the particle-filter-based tracking techniques on the simulated data in the very early phase of this study.
Conflicts of Interest
The authors declare no conflict of interest.
References
- Suchandt, S.; Runge, H.; Breit, H.; Steinbrecher, U.; Kotenkov, A.; Balss, U. Automatic extraction of traffic flows using TerraSAR-X along-track interferometry. IEEE Trans. Geosci. Remote Sens. 2010, 48, 807–819. [Google Scholar] [CrossRef]
- Klemm, R.; Nickel, U.; Gierull, C.H.; Lombardo, P. (Eds.) Novel Radar Techniques and Application; IET: London, UK, 2017; pp. 223–225. [Google Scholar]
- Budillon, A.; Gierull, C.H.; Pascazio, V.; Schirinzi, G. Along-track interferometric SAR systems for ground-moving target indication: Achievements, potentials, and outlook. IEEE Geosci. Remote Sens. Mag. 2020, 8, 46–63. [Google Scholar] [CrossRef]
- Moreira, A.; Prats-Iraola, P.; Younis, M.; Krieger, G.; Hajnsek, I.; Papathanassiou, K.P. A tutorial on synthetic aperture radar. IEEE Geosci. Remote Sens. Mag. 2013, 1, 6–43. [Google Scholar] [CrossRef] [Green Version]
- Krieger, G.; Gebert, N.; Moreira, A. Multidimensional waveform encoding: A new digital beamforming technique for synthetic aperture radar remote sensing. IEEE Trans. Geosci. Remote Sens. 2008, 46, 31–46. [Google Scholar] [CrossRef] [Green Version]
- Hoshino, T.; Suwa, K.S.; Oishi, N.; Wakayama, T. Slightly moved vehicle detection with coherent change detection on X-band high resolution SAR imagery. In Proceedings of the IEEE Asia-Pacific Conference on Synthetic Aperture Radar, Tsukuba, Japan, 23–27 September 2013; pp. 585–588. [Google Scholar]
- Damini, A.; Mantle, V.; Davidson, G. A new approach to coherent change detection in VideoSAR imagery using stack averaged coherence. In Proceedings of the IEEE Radar Conference, Ottawa, ON, Canada, 29 April–3 May 2013; pp. 1–5. [Google Scholar]
- Budillon, A.; Evangelista, A.; Schirinzi, G. GLRT detection of moving targets via multibaseline along-track interferometric SAR systems. IEEE Geosci. Remote Sens. Lett. 2012, 9, 348–352. [Google Scholar] [CrossRef]
- Budillon, A.; Schirinzi, G. Performance evaluation of a GLRT moving target detector for TerraSAR-X along-track interferometric data. IEEE Trans. Geosci. Remote Sens. 2015, 53, 3350–3360. [Google Scholar] [CrossRef]
- Sanders-Reed, J.N. Maximum likelihood detection of unresolved moving targets. IEEE Trans. Aerosp. Electron. Syst. 1998, 34, 844–859. [Google Scholar] [CrossRef]
- Biondi, F.; Tarpanelli, A.; Addabbo, P.; Clemente, C.; Orlando, D. Pixel tracking to estimate rivers water flow elevation using Cosmo-SkyMed synthetic aperture radar data. Remote Sens. 2019, 11, 2574. [Google Scholar] [CrossRef] [Green Version]
- Biondi, F.; Addabbo, P.; Orlando, D.; Clemente, C. Micro-motion estimation of maritime targets using pixel tracking in cosmo-skymed synthetic aperture radar data: An operative assessment. Remote Sens. 2019, 11, 1637. [Google Scholar] [CrossRef] [Green Version]
- Pallotta, L.; Giunta, G.; Clemente, C. Subpixel SAR image registration through parabolic interpolation of the 2D cross-correlation. IEEE Trans. Geosci. Remote Sens. 2020, 58, 4132–4144. [Google Scholar] [CrossRef] [Green Version]
- Zhang, W.; Fu, Y. GLRT detection of micromotion targets for the multichannel SAR-GMTI system. IEEE Geosci. Remote Sens. Lett. 2018, 16, 60–64. [Google Scholar] [CrossRef]
- Stone, L.; Streit, R.; Corwin, T.; Bell, K.; Daum, F. Bayesian Multiple Target Tracking; Artech House: London, UK, 2013; pp. 65–106. [Google Scholar]
- Newstadt, G.; Zelnio, E.; Hero, A. Moving target inference with Bayesian models in SAR imagery. IEEE Trans. Aerosp. Electron. Syst. 2014, 50, 2004–2018. [Google Scholar] [CrossRef]
- Song, S.; Xu, B.; Li, Z.; Yang, J. Ship detection in SAR imagery via variational Bayesian inference. IEEE Geosci. Remote Sens. Lett. 2016, 13, 319–323. [Google Scholar] [CrossRef]
- Song, S.; Xu, B.; Yang, J. Ship detection in polarimetric SAR images via variational Bayesian inference. IEEE J. Sel. Top. Appl. Earth Obs. Remote Sens. 2017, 99, 2819–2829. [Google Scholar] [CrossRef]
- Shi, S.N.; Shui, P.L. Detection of low-velocity and floating small targets in sea clutter via income-reference particle filters. Signal Process. 2018, 148, 78–90. [Google Scholar] [CrossRef]
- Shi, S.N.; Liang, X.; Shui, P.L.; Zhang, J.; Zhang, S. Low-velocity small target detection with doppler-guided retrospective filter in high-resolution radar at fast scan mode. IEEE Trans. Geosci. Remote Sens. 2019, 57, 8937–8953. [Google Scholar] [CrossRef]
- Gao, H.; Li, J. Detection and tracking of a moving target using SAR images with the particle filter-based track-before-detect algorithm. Sensors 2014, 14, 10829–10845. [Google Scholar] [CrossRef] [Green Version]
- Tian, X.; Liu, J.; Tan, S. A novel DP-TBD algorithm for tracking slowly maneuvering targets using ViSAR image sequences. In Proceedings of the 22nd International Conference on Information Fusion, Ottawa, ON, Canada, 2–5 July 2019; IEEE: New York, NY, USA, 2019; pp. 1–7. [Google Scholar]
- Huo, W.; Pei, J.; Huang, Y.; Zhang, Q.; Yang, J. A new maritime moving target detection and tracking method for airborne forward-looking scanning radar. Sensors 2019, 19, 1586. [Google Scholar] [CrossRef] [PubMed] [Green Version]
- Davey, S.J.; Rutten, M.G.; Cheung, B. Using phase to improve track-before-detect. IEEE Trans. Aerosp. Electron. Syst 2012, 48, 832–849. [Google Scholar] [CrossRef]
- Yang, W.; Chen, J.; Liu, W.; Wang, P. Moving target azimuth velocity estimation for the MASA mode based on sequential SAR images. IEEE J. Sel. Top. Appl. Earth Obs. Remote Sens. 2017, 6, 2780–2790. [Google Scholar] [CrossRef] [Green Version]
- Maître, H. Synthetic Aperture Radar Images; John Wiley & Sons: Hoboken, NJ, USA, 2013; pp. 284–285. [Google Scholar]
- Yang, M.; Dheenathayalan, P.; López-Dekker, P.; van Leijen, F.; Liao, M.; Hanssen, R.F. On the influence of sub-pixel position correction for PS localization accuracy and time series quality. ISPRS J. Photogramm. Remote Sens. 2020, 165, 98–107. [Google Scholar] [CrossRef]
- Gierull, C.H. Closed-form expressions for InSAR sample statistics and its application to non-Gaussian data. IEEE Trans. Geosci. Remote Sens. 2020, 99, 3967–3980. [Google Scholar] [CrossRef]
- Sintes, C.; Courmontagne, C.; Llort-Pujol, G.; Caillec, J.L. Gaussian approximation of interferometric PDF for MLE derivation. In Proceedings of the IEEE Oceans, Hampton Roads, VA, USA, 14–19 October 2012; pp. 1–5. [Google Scholar]
- Kay, S.; Hall, P. Fundamentals of statistical signal processing, Volume II: Detection theory. Technometrics 1993, 37, 465–466. [Google Scholar]
- Khan, Z.; Balch, T.; Dellaert, F. MCMC-based particle filtering for tracking a variable number of interacting targets. IEEE Trans. Pattern Anal. Mach. Intell. 2005, 27, 1805–1819. [Google Scholar] [CrossRef] [PubMed] [Green Version]
Publisher’s Note: MDPI stays neutral with regard to jurisdictional claims in published maps and institutional affiliations. |
© 2021 by the authors. Licensee MDPI, Basel, Switzerland. This article is an open access article distributed under the terms and conditions of the Creative Commons Attribution (CC BY) license (https://creativecommons.org/licenses/by/4.0/).