Article

Full Lifecycle Monitoring on Drought-Converted Catastrophic Flood Using Sentinel-1 SAR: A Case Study of Poyang Lake Region during Summer 2020

1
School of Remote Sensing and Information Engineering, Wuhan University, Wuhan 430079, China
2
State Key Laboratory of Information Engineering in Surveying, Mapping and Remote Sensing, Wuhan University, Wuhan 430079, China
3
School of Geodesy and Geomatics, Wuhan University, Wuhan 430079, China
4
School of Water Resources and Hydropower Engineering, Wuhan University, Wuhan 430072, China
*
Author to whom correspondence should be addressed.
Remote Sens. 2021, 13(17), 3485; https://doi.org/10.3390/rs13173485
Submission received: 23 July 2021 / Revised: 25 August 2021 / Accepted: 30 August 2021 / Published: 2 September 2021

Abstract

:
During summer 2020, the most catastrophic flood in the 21st century attacked the Poyang Lake region, one of the flood-prone areas in China. To explore the occurrence mechanism and evolution patterns of this drought-converted flood better, a full lifecycle model is developed in this article. Employing Sentinel-1 Synthetic Aperture Radar (SAR) images, with the advantages of high spatial–temporal resolution and all-day and all-weather working capacity, a bimodal threshold was applied to efficiently extract flood inundation mapping. Thus, 61 Sentinel-1 SAR images in 2020 were used to establish inundation sequences for full lifecycle monitoring. This flood presented an abrupt transformation from drought, a long duration, and the slow receding of water, and its area exceeded 3000 km2 from July to early October. In addition, inundation models that reflect the lake area and water level relationship were introduced to assist near-real-time monitoring. Through hydrological and meteorological analysis, compared with results of previous years (from 2010 to 2019), this study found that the water level from July to October in 2020 was at least 17% higher than the mean level at the same period in history and water volume had increased about 44.13 billion m3 during the flooding period. Similarly, the average precipitation from June to September was significantly higher than the same period of previous years. It was the abnormal sustained heavy precipitation and sharp rising of the water level that caused this catastrophic flood. In particular, the Standardized Precipitation Index (SPI) increased from −1.02 in April to 1.31 in July, indicating that the flood was abruptly converted from drought. The inundated areas of several land types during different periods of the full lifecycle were calculated for damage assessment. It was found that cropland was the most heavily impaired with a maximum inundated area of 1375.67 km2, while other land types including forest, grassland, wetland, and impervious surface were relatively less damaged. The study results demonstrate that flood full lifecycle monitoring based on SAR data is helpful to explore the patterns of flood evolution, analyze causes, and assess damage. Simultaneously, focusing on drought-converted floods contributes to the understanding of flood patterns, which provides relevant management departments with decision support for disaster prevention and mitigation.

1. Introduction

Flooding is usually widespread, highly destructive, and irresistible [1,2], and has always been one of the most catastrophic natural hazards limiting human development. It not only directly causes human casualties and property losses, but also brings a series of post-disaster secondary problems such as urban reconstruction, ecological restoration, and intensification of the global water cycle [3,4]. According to incomplete statistics [5], there had been approximately 12,000 flood events all over the world from 1970 to 2015, causing more than 3.53 million deaths and more than USD 2.6 trillion economic losses. As a matter of fact, numerous flood events with huge destruction are reported globally every year, requiring hazard prevention and mitigation as a great necessity. With the advantages of fast speed, strong timeliness, and diverse dimensions [6,7,8], remote sensing has been utilized in multiple studies [1,5,9,10,11,12] to analyze the evolution patterns, potential causes, and damages incurred by floods by surveying flood characteristics during different periods. However, it is a pity that the current studies almost only focus on the peak period of floods, and rarely monitor their full lifecycle, which makes it difficult to explore the evolutionary patterns and causes of floods. Hence, this article presents a systematic study on the full lifecycle of floods, providing more feasible reference materials for cause analysis and damage assessment.
It is in the full lifecycle monitoring of floods that high spatial–temporal resolution remote sensing data are demanding. Actually, two main categories of remote sensing sensors, optical sensors and Synthetic Aperture Radar (SAR), both play important roles in flood monitoring [13]. Out of significant advantages in long historical data and easy access with low cost, numerous typical optical sensors have been applied to flood monitoring, such as Terra Moderate Resolution Imaging Spectroradiometer (MODIS) [14,15,16], Landsat-8 OLI [17,18], GF-1 WFV [19,20], HJ-1 A/B CCD [21,22], etc. However, flood events are usually accompanied by rainy weather and heavy clouds. Due to poor cloud penetration ability, all the optical sensors mentioned above have great difficulty in obtaining available image data. By contrast, SAR is more dominant than optical sensors in the field of flood inundation mapping and monitoring [23,24]. On the one hand, SAR has a powerful cloud penetration capacity, which could work well in all-day and all-weather conditions. Even in the thick-cloud weather during the flood period, it can still obtain high-quality images, ignoring clouds. On the other hand, the high temporal resolution and high spatial resolution imaging capabilities of SAR satellites have been greatly improved [25,26,27,28]. For instance, the predominant SAR satellite Sentinel-1 has a 12-day revisit cycle and 5 m maximal spatial resolution, which has become an important instrument of flood monitoring. At the same time, optical data are used to measure the geochemical characteristics of the ground surface, while SAR data are for detecting the geophysical characteristics [29,30]. These geophysical properties that SAR detects are helpful to identify different flooding states. Based on SAR data, the results of water classification are beneficial to extract some features that cannot be clearly shown by optical data [13,31]. Thus, according to the significant advantages of SAR mentioned above, this study selected Sentinel-1 SAR images as the main data sources for the full lifecycle monitoring of floods.
In most studies about floods, hydro-meteorological analysis of the causes and disaster damage assessment based on Geographic Information System (GIS) techniques are common research contents. Actually, previous studies [32,33] mostly only focused on pure flood events caused by abnormal precipitation, but rarely paid attention to floods converted from drought events. From references [34,35], drought-to-flood abrupt alternation is a more extreme disaster, which means the sudden transformation from drought to flood, and causes more serious harm than the superposition of a single disaster. Thus, research on the rapid transition of regional drought-to-flood events has attracted wide attention from many scholars in the scientific field. In this article, the full lifecycle monitoring method is used to study a drought-converted flood in order to explore its evolutionary patterns and mechanisms.
In China, flooding has been one of the most frequent and damaging natural disasters historically. Particularly, in 2020, the flooding season suffered several sustained heavy rainfalls in southern China, leading to floods in most areas to be the worst in the recent 20 years [36]. What is more, the flood during summer 2020 was announced by the Chinese Ministry of Emergency Management as one of the National Top 10 Natural Disasters in 2020. Especially, Poyang Lake, a typical floodplain where five major branches flowed into the lake’s wetlands and were flooded in large areas, had expanded to its largest size in the past 20 years, resulting in heavy losses. In addition, this flood event was abruptly transformed from a relatively dry state with a great deal of intensity. Since 2011, the number and intensity of summer drought–flood abrupt alternation events in this region have been increasing year by year [37]. Therefore, the catastrophic flood hazard converted from a drought of the Poyang Lake region in 2020 was selected as a typical case for this study.
In this article, through the study of a drought-converted flood event, a set of methods for monitoring the full lifecycle of floods based on SAR data is proposed and used to beneficially support disaster prevention and mitigation. In detail, the objectives of this study are: taking the catastrophic flood converted from drought in the Poyang Lake region during summer 2020 as an exemplary case (1) to monitor the full lifecycle of the flood based on Sentinel-1 SAR images, which reveal the evolution patterns of floods; establishing flood inundation models to reflect the relationship between water level and lake area change, which are used to near-real-time monitor floods according to hydrological observation; (2) from the perspective of hydrology and meteorology, analyzing potential causes for this flood event; (3) using GIS-based techniques to assess disaster damage incurred by the flood; and (4) discussing the full lifecycle of floods and its benefit from monitoring based on SAR data. Furthermore, we discuss the characteristics and causes of the abrupt drought-converted flood event to explore countermeasures.

2. Materials and Methods
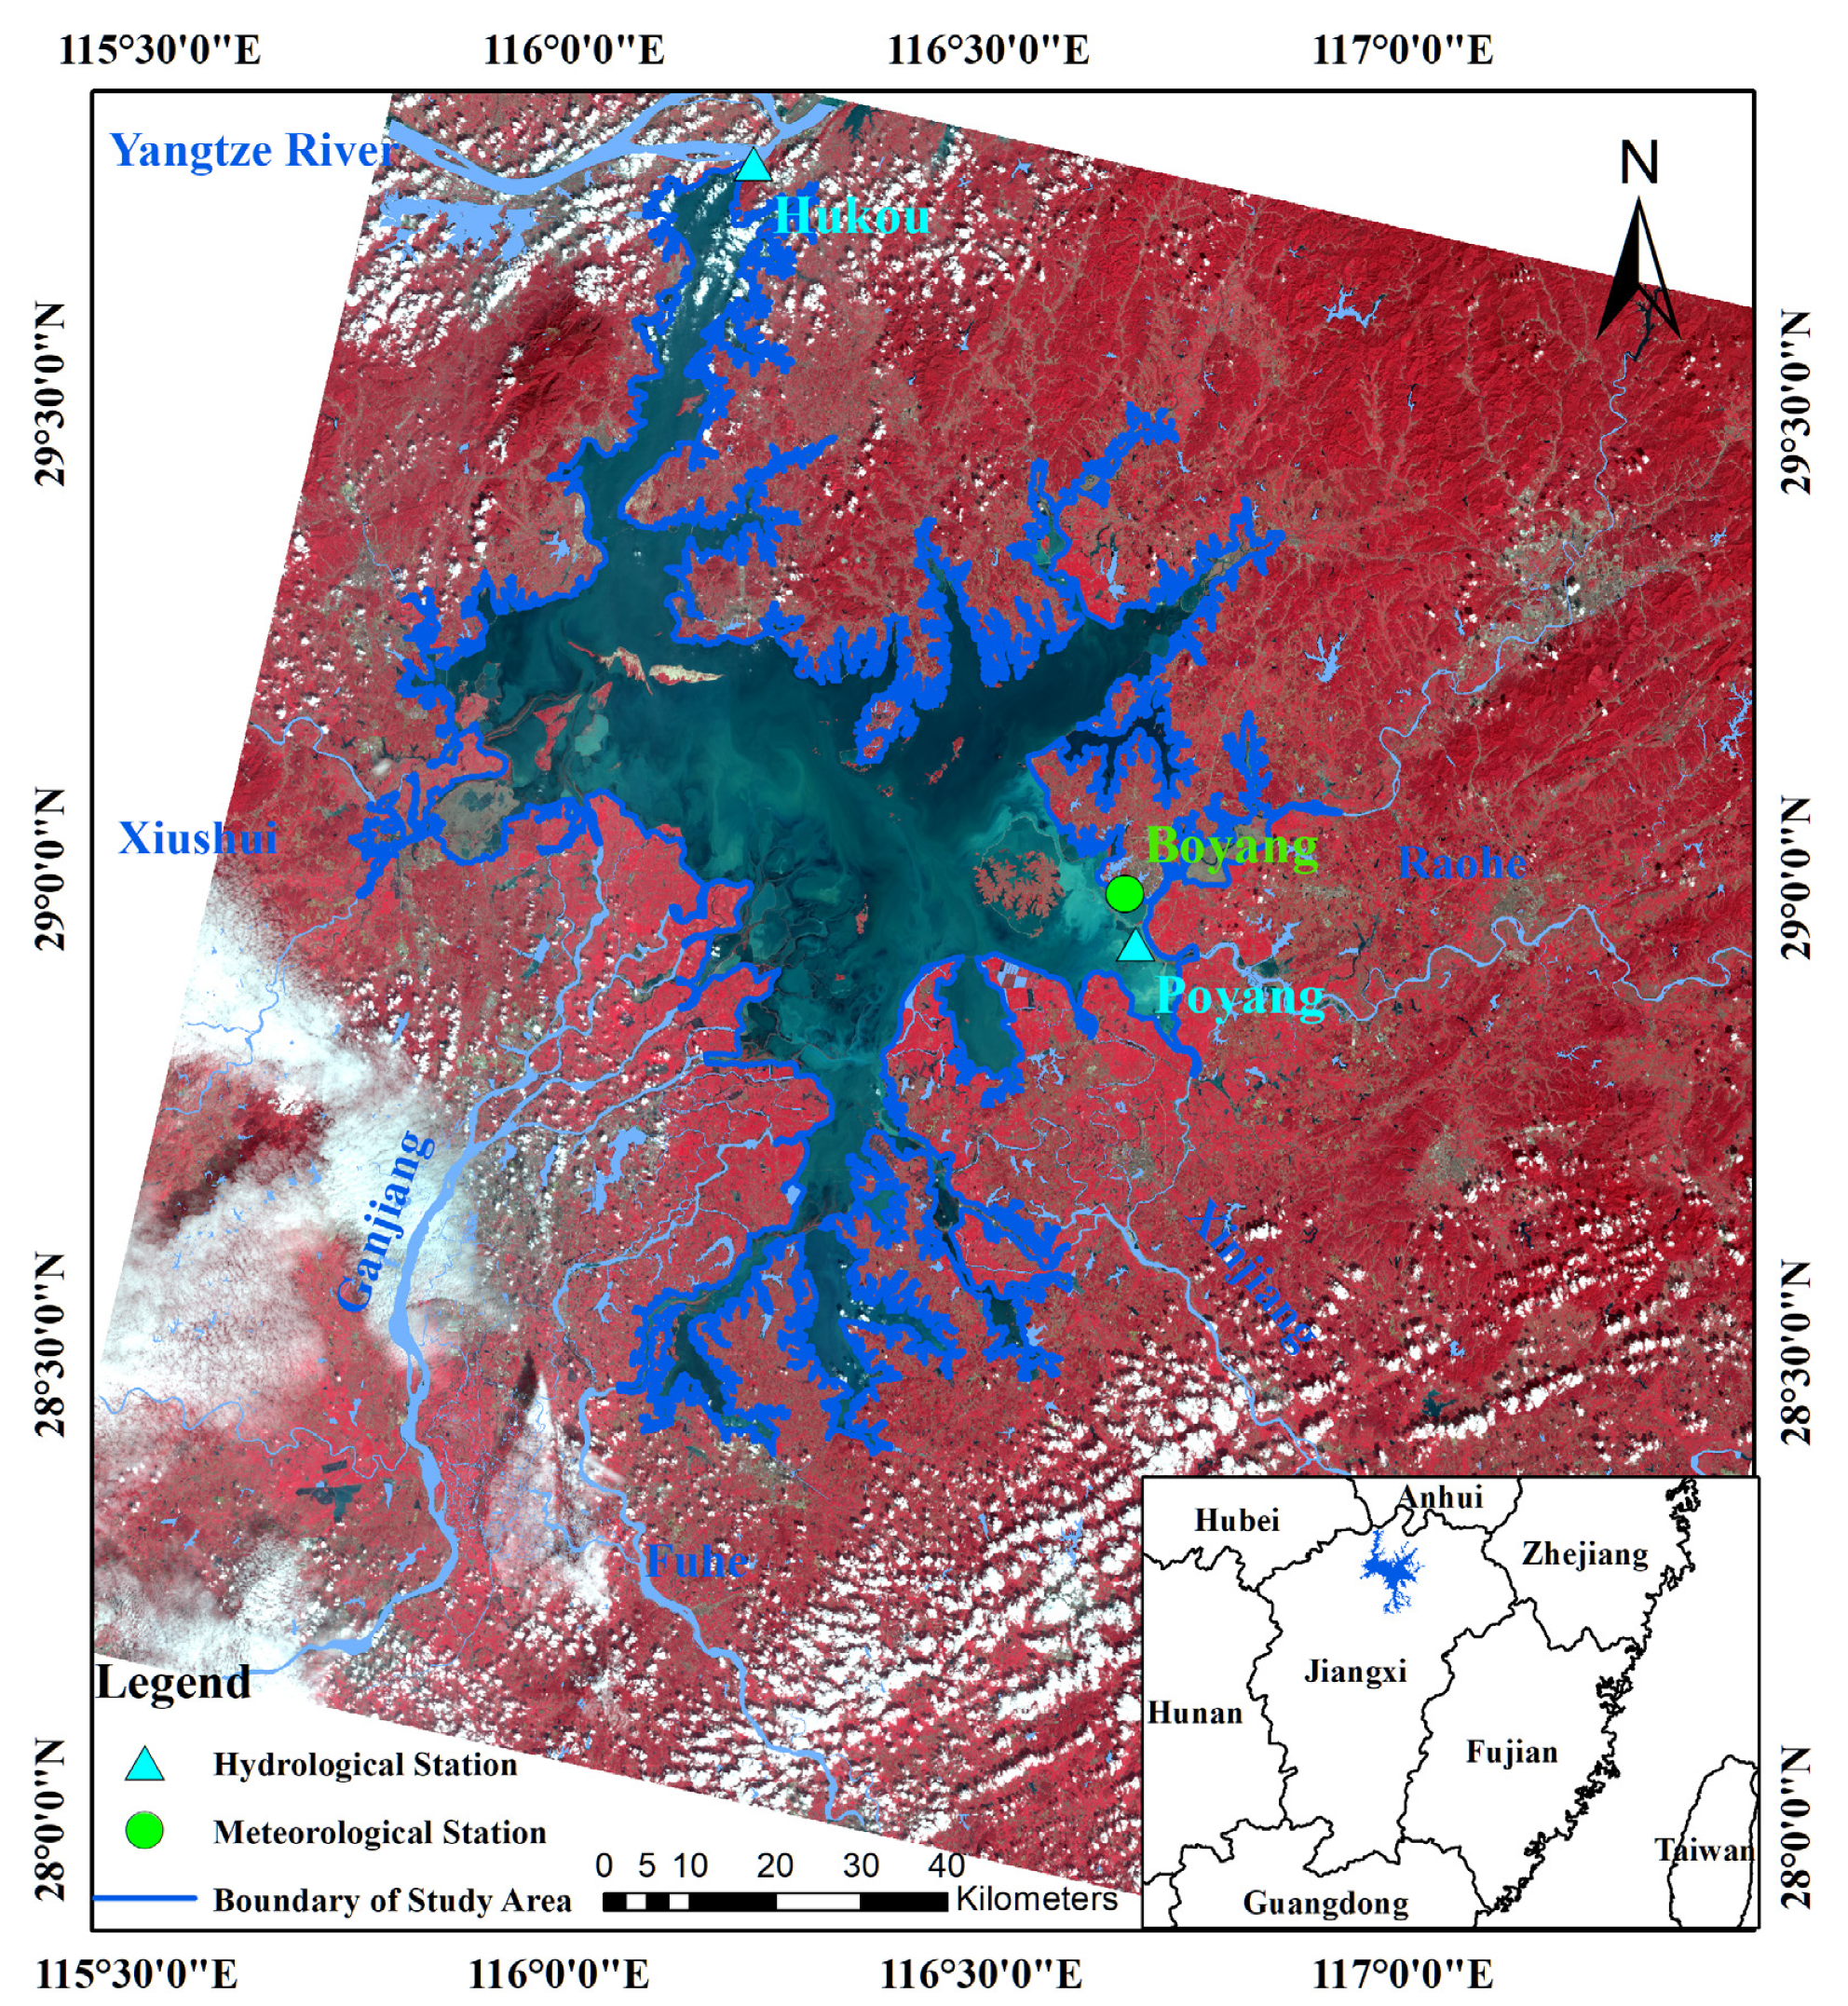
2.1. Study Area

Located in the northern part of Jiangxi Province, People’s Republic of China, and the middle and lower reaches of the Yangtze River, Poyang Lake ranges from 28°22′ N to 29°45′ N in latitude and from 115°47′ E to 116°45′ E in longitude, as clearly shown in Figure 1. As the largest freshwater lake in China, its basin area accounts for 162,225 km² [38]. From the view of full lifecycle, the overall area of Poyang Lake fluctuates conspicuously every year. During the flooding season, the lake area, which is the largest gathering region of many rivers in Jiangxi Province, may expand to more than 3000 km², while it shrinks to even less than 1000 km² during the dry season [39]. In terms of water system connection, the five major rivers, Xiushui River, Ganjiang River, Fuhe River, Xinjiang River, and Raohe River, flow into the lake from south to north, and then into the main stream of the Yangtze River through Hukou. Poyang Lake serves as both a water communication channel and storage carrier [26] with seasonal landscape changes, making itself a typical seasonal lake with abundant wetland landscape [40,41]. In the flooding season, abundant rainfalls widen the water surface of the lake, and lake water is prone to backflow after being blocked because of the flood of the upper reaches of the Yangtze River [42,43]. By contrast, most of the ground surface is exposed due to the lack of water in the dry season. Moreover, Poyang Lake is one of the most severe floodplains in China, having suffered catastrophic floods in 1954, 1973, 1977, 1983, 1992, 1995, 1998, 2010, and 2016 [39,43]. The number of severe floods in the Poyang Lake region has increased sharply in recent years amid the intensification of global extreme weather events [44]. In particular, the catastrophic flood converted from drought in the summer of 2020 attacked Poyang Lake, causing the heaviest damage over nearly 20 years, where all of the hazard events demand faster and more accurate flood lifecycle monitoring.

2.2. Materials

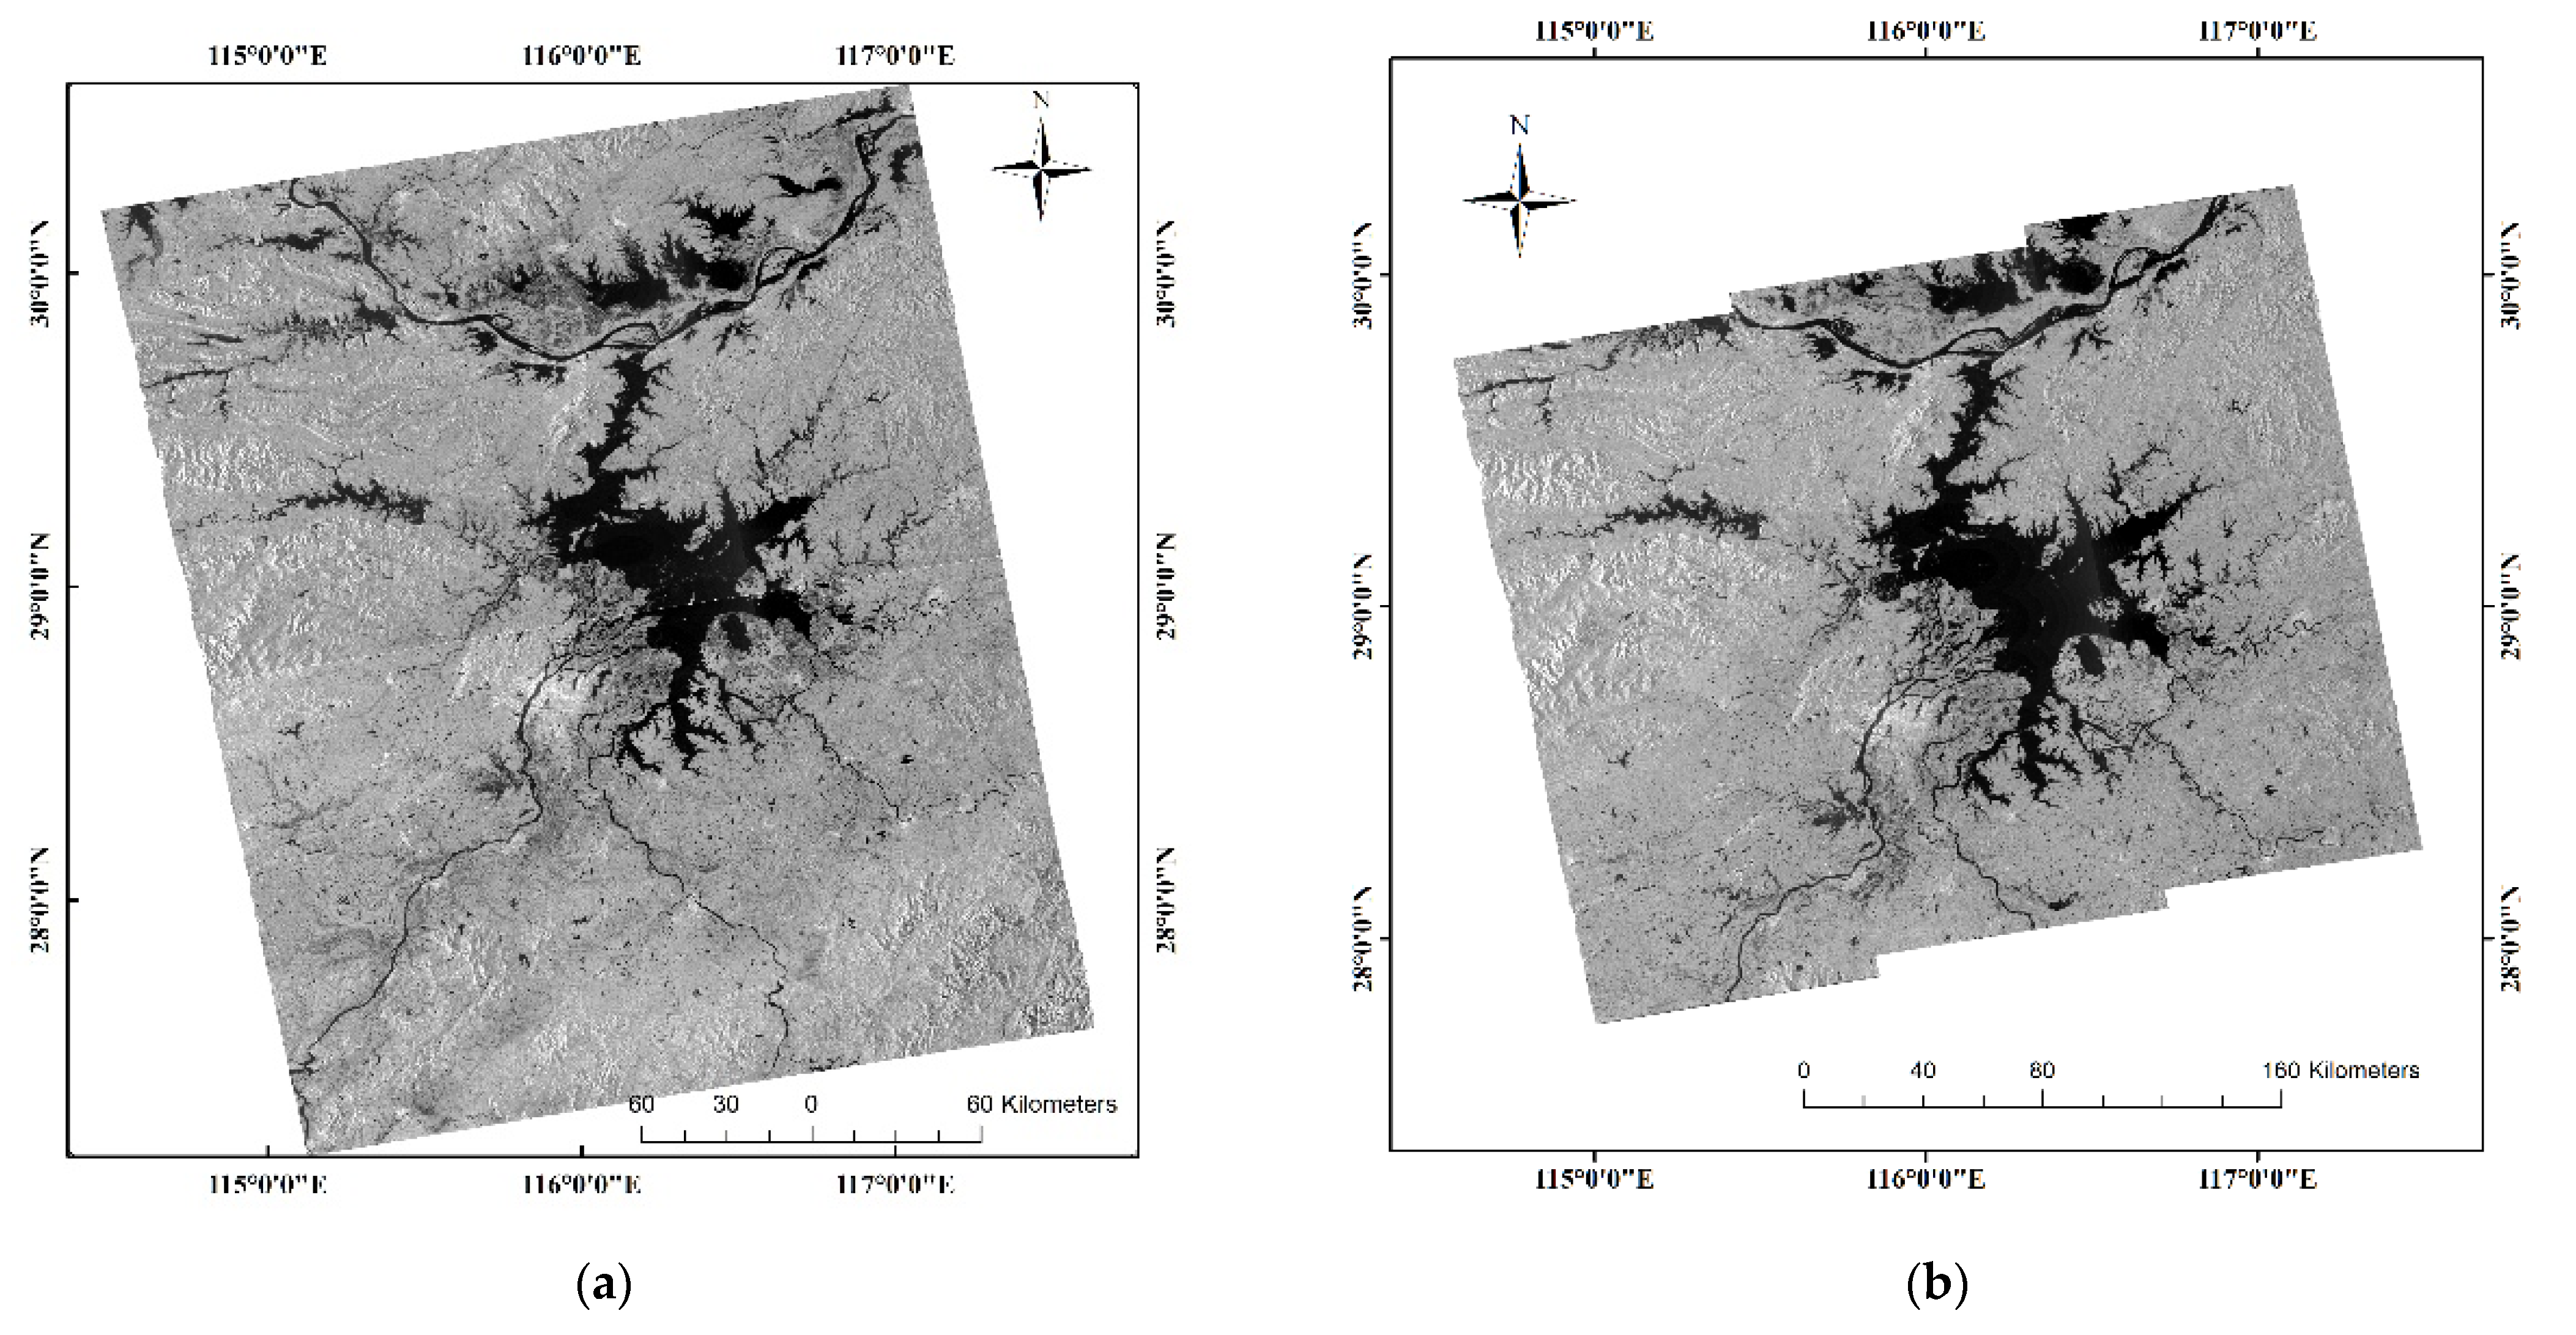
2.2.1. Sentinel-1 SAR Images

In this study, the primary remote sensing images employed are the satellite data of Sentinel-1, acquired from the Sentinels Scientific Data Hub (https://scihub.copernicus.eu accessed on 1 June 2021), which provides available images since April 2014 free of charge. Sentinel-1 is an earth observation satellite serving in the European Space Agency (ESA)’s Copernicus Project, and consists of two polar orbiting satellites A and B, carrying C-band SARs. Its revisit cycle is 12 days in a single pass, whereas the two-satellite constellation offers a 6-day exact repeat cycle, and the spatial resolution can reach up to 5 m at most [45,46,47]. This study employed Level-1 Ground Range Detected (GRD) products. In detail, the imaging type is Interferometric Wide (IW) swath, and 20 m × 22 m high-resolution sensors are used to obtain images with a width of 250 km, offering two polarization patterns: VH and VV. More specific information is listed in Table 1. However, the imaging extents of Sentinel-1 A and Sentinel-1 B in the study area are distinctly different. As shown in Figure 2, Sentinel-1 A requires two images to be stitched together to observe the entire study area, while Sentinel-1 B needs only one complete image.
During flooding seasons, the weather conditions are extremely adverse, usually accompanied by long periods of heavy rain and thick cloud cover. However, this does not interfere with the all-weather ability of Sentinel-1 SAR [28], which can still provide long-term sequence images with high spatial–temporal resolution. The appropriate selection and application of Sentinel-1 SAR provide high-quality images to support lifecycle monitoring. In 2020, Sentinel-1 captured a total of 61 images of the Poyang Lake region. Based on these images, this study extracted water body information for the whole year. Moreover, all images are used in the VH polarization pattern based on the bimodal threshold method to extract floods. Compared with VV polarization, in VH polarization, the overlapping area of the histogram of the water body and the non-water body is smaller, making it easier to separate water body and non-water body through the bimodal threshold. That is because, as a kind of cross-polarization, VH is less sensitive to specular reflection on the smooth surface of the water body, causing lower echo intensity than that of the co-polarization like VV, so VH will produce less noise. In addition, VV polarization is rather susceptible to vertical structures and easily affected by uneven and rough terrain, which may be hindered when extracting water body information [48].

2.2.2. Auxiliary Data

In addition to Sentinel-1 SAR images, hydrological data, meteorological data, Digital Elevation Model (DEM), and land cover use data were mainly employed to assist the study. The hydrological data include the water level and warning water level from the two major hydrological stations of Hukou and Poyang (Figure 1) in the study area from 2010 to 2020. Specifically, lake water level changes are the primary expression of flooding. The meteorological data applied are the daily precipitation observation data from 2010 to 2020 in the Boyang meteorological station (Figure 1). All hydrological and meteorological data were obtained from the official website of the Department of Water Resources of Jiangxi Province, People’s Republic of China (http://slt.jiangxi.gov.cn accessed on 1 June 2021). They were used to assist Sentinel-1 SAR images in exploring the potential causes of flood hazards from the perspectives of hydrology and meteorology. In addition, acquired from China National Earth System Science Data Center (http://www.geodata.cn accessed on 1 June 2021), the land cover use data and DEM of the study area were also employed, whose resolutions are up to 10 m and 12.5 m, respectively. According to the classification system of raw land cover use data, we divided the land types into cropland, forest, grassland, wetland, water, impervious surface, and unused land. In this study, they were combined with the extent of water bodies extracted by Sentinel-1 SAR to conduct disaster damage assessment and calculate the inundated area of various land types. DEM data were used to calculate water volume in combination with water level and flood inundation extent.

2.3. Methods

The outline of the study method is presented in Figure 3. First, in the software ESA Sentinel Application Platform (SNAP) 8.0, we performed some necessary pre-processes, including orbit correction, thermal noise removal, radiation calibration, Refined Lee-based coherent speckle filtering, terrain correction, and decibelization, on the raw images of Sentinel-1 in sequence. Second, the pre-processed Sentinel-1 SAR images were applied to extract the water body information by the histogram-based bimodal threshold segmentation algorithm. Nevertheless, the water body information is easily impacted by noise in the process of extraction, incurring some wrong extractions. To obtain precise flood inundation mapping, median filtering, masking, and other post-extraction methods were implemented to denoise the results. Then, based on the extracted images, the areas of Poyang Lake were calculated according to the number of water body pixels, which provide reliable materials for follow-up study including full lifecycle monitoring, flood cause analysis, and damage assessment. More details about them are as follows.

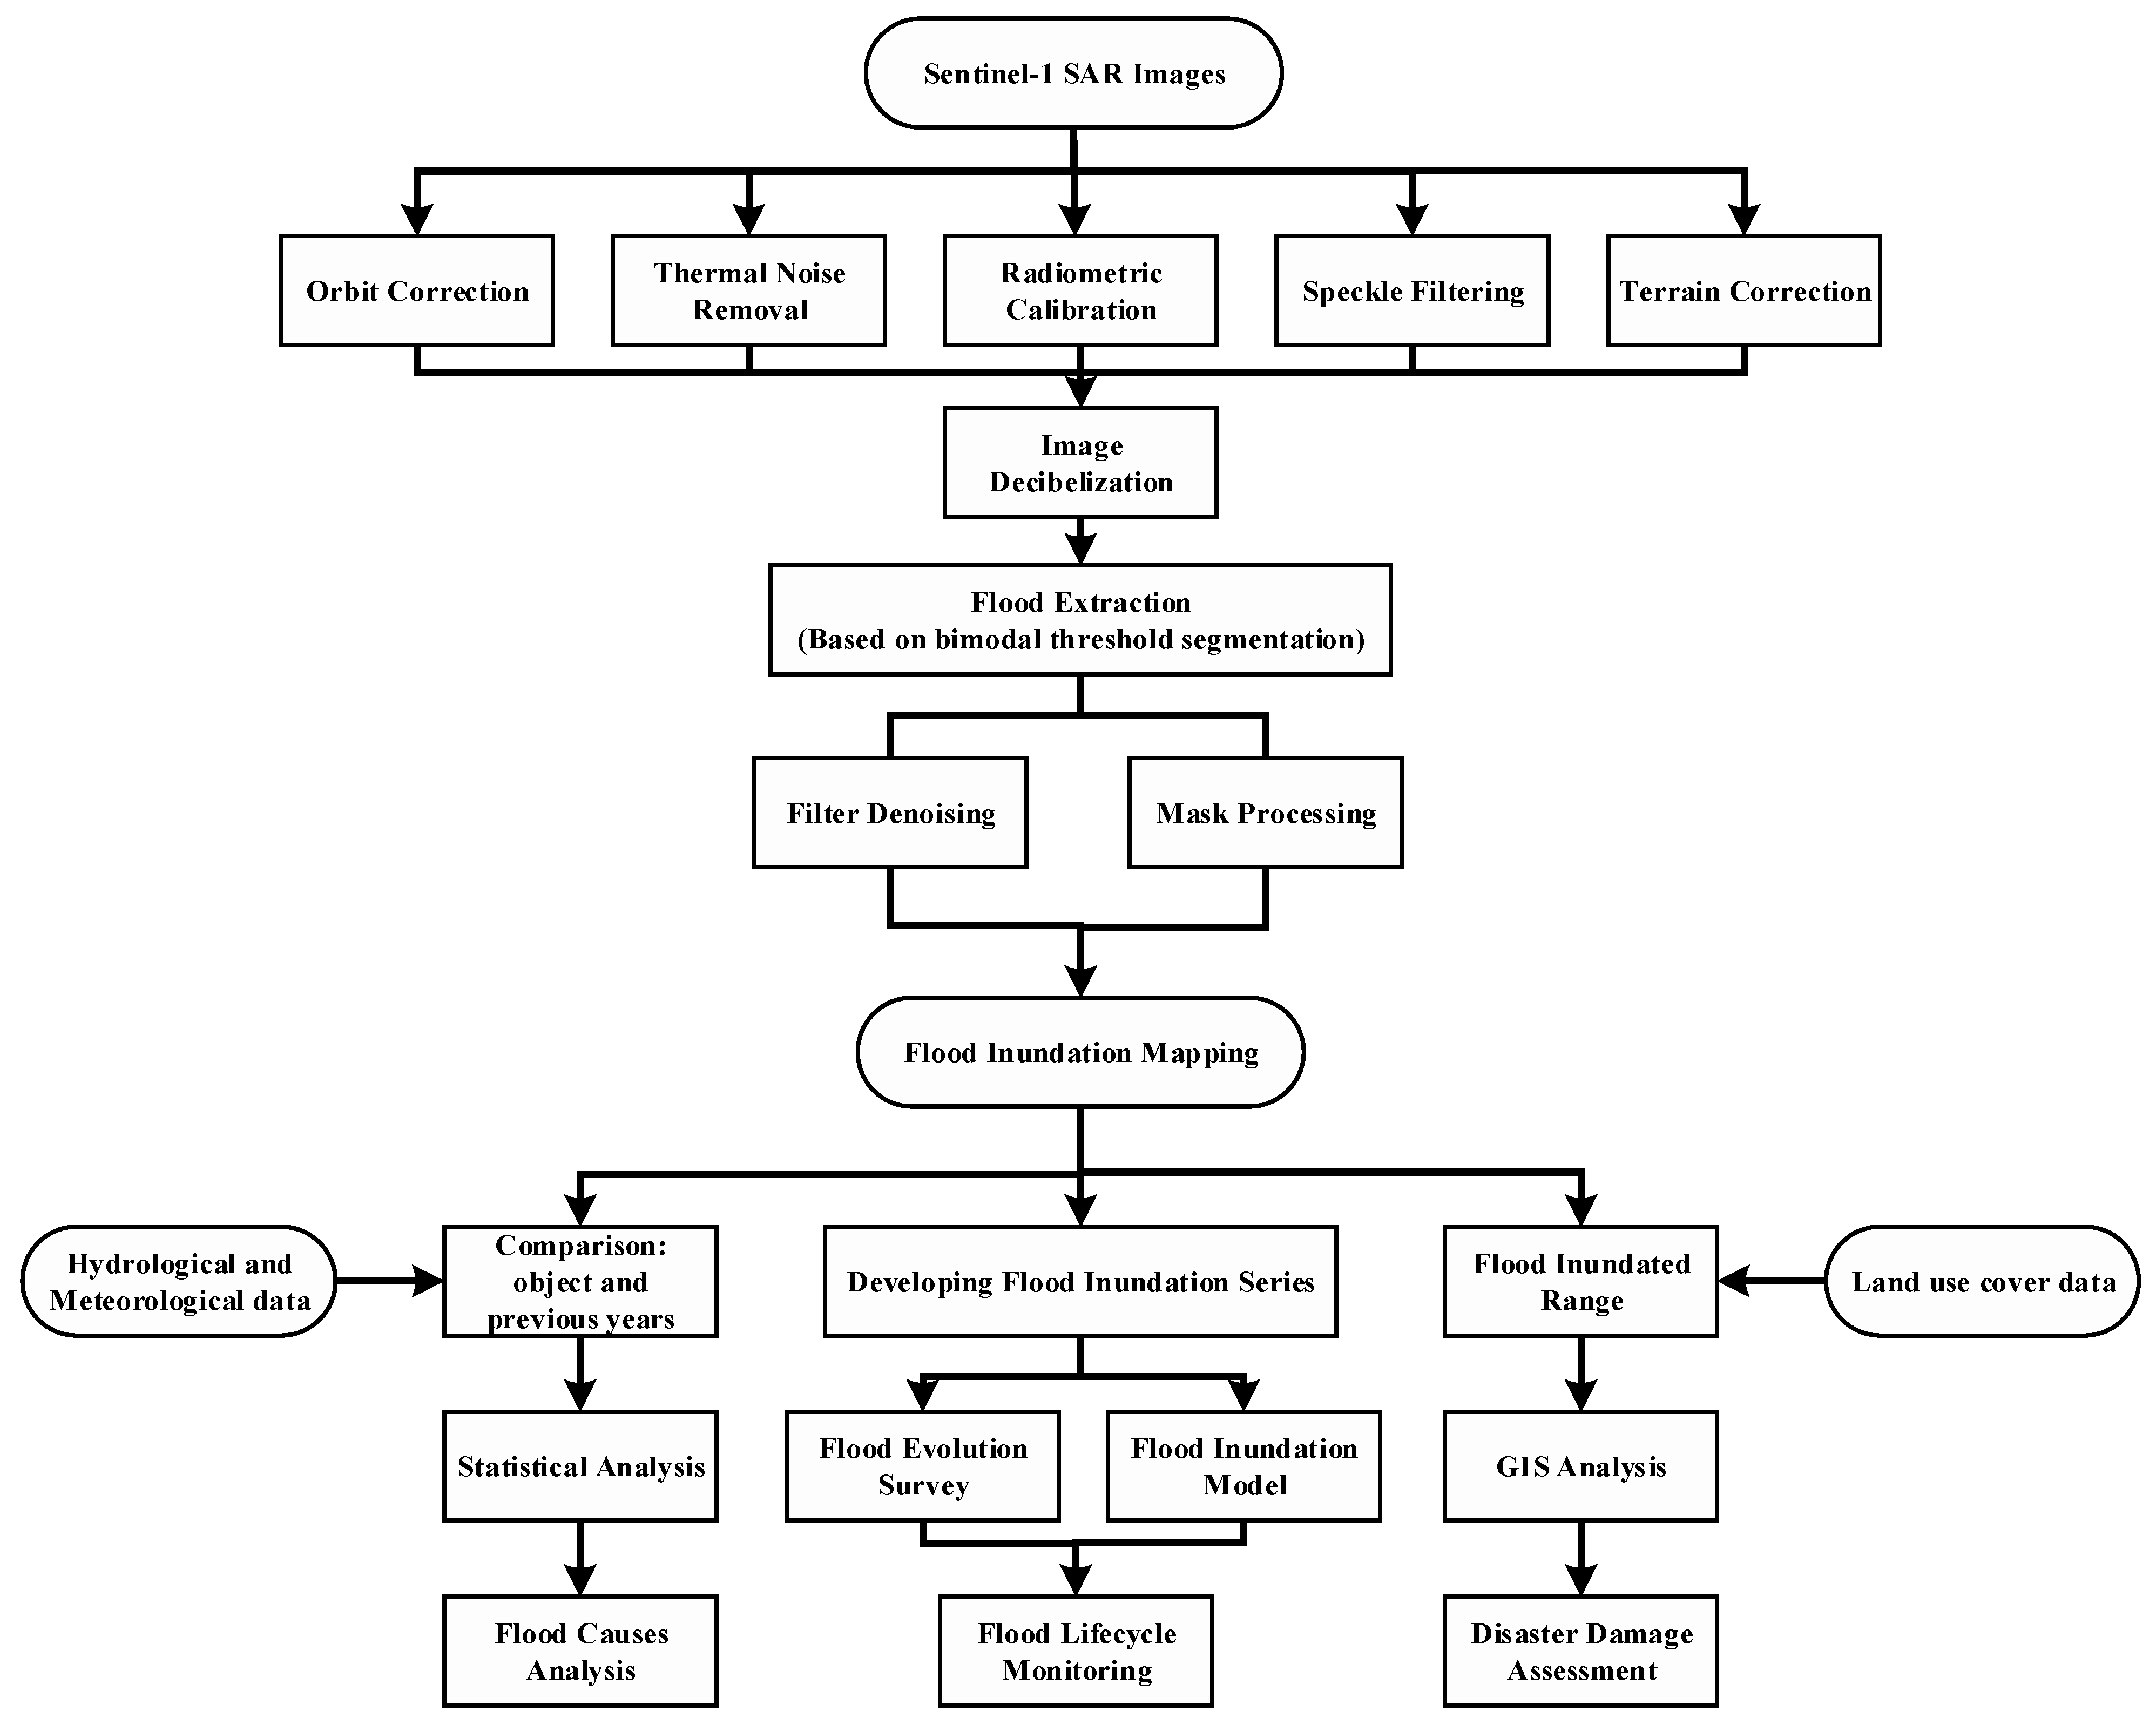
2.3.1. Flood Extraction and Monitoring Using Sentinel-1 SAR Images

The principle of flood extraction based on SAR data is to use the characteristics of low radar echo intensity of the water body. Specifically, a smooth water body surface will cause specular reflections, leading to lower backscattering values. In contrast, higher values correspond to diffuse reflections, judged into non-water body [25]. Up to now, many algorithms for extracting water body information from SAR data have been proposed: bimodal threshold-based algorithm [30,49,50,51], Otsu’s algorithm [52], Object-Oriented algorithm [53], deep learning algorithm [28,54], and so on. Among them, the bimodal algorithm was used in this study to efficiently and effectively determine the threshold of water body extraction. For one thing, the bimodal threshold is a mature algorithm, which is widely applied in flood extraction with relatively low complexity and high accuracy. Compared with other methods such as the deep learning algorithm, it is time-saving and requires no sample training, bringing great efficiency to SAR data processing for the full lifecycle of 61 scenes in this study. For another, clipped Sentinel-1 SAR images of Poyang Lake region have perfect bimodal distributions in the histogram (Figure 4) and are very suitable for the bimodal algorithm. According to the literature [5], the bimodal algorithm will perform well if an image owns a bimodal distribution and the water body accounts for more than 30% of the entire image. In the images of the study area, the water body occupies almost half, making it easy to determine the threshold by this method. In addition, we validated the Sentinel-1 SAR images’ extraction results by using Landsat-8 OLI data, and verification results show that the accuracy of water extraction based on the bimodal threshold method is reliable.
Therefore, in the histogram of bimodal distribution, the lowest point between the two peaks is selected as the threshold T, as is shown in Figure 4. When the pixel data value is less than the threshold T, it is regarded as the water body, otherwise it is regarded as non-water body. However, there is still much noise after the water body is extracted, causing errors when calculating the lake area. Therefore, we masked the extraction results based on the image template of the Poyang Lake region and removed a large number of small water bodies outside the lake. Meanwhile, median filtering was implemented to further denoise to calculate the lake area, realizing higher accuracy and better performance. Hence, in order to monitor the full lifecycle of the flood, we applied the above methods on 61 Sentinel-1 SAR images to create spatial–temporal inundation sequence diagrams, which reflect the entire evolution process of the flood for further analysis.

2.3.2. Hydro-Meteorological Analysis of Flood Causes

It can be known from the references [13,55] that hydrological and meteorological conditions are the most significant factors leading to the occurrence of flood events. Thus, water level and precipitation indicators were explored in the analysis of the potential causes. We took the average of the observational data from 2010 to 2019 as the data of previous years and compared them with the data of 2020 to discover the difference. Using statistical methods, such as average value analysis, extreme value analysis, trend analysis, and so on, we quantitatively analyzed the development and change patterns of precipitation and water level. Summarizing comprehensive analysis results, hazard-incurred factors’ relationship with the occurrence of the flood was systematically concluded.

2.3.3. Damage Assessment Using GIS Techniques

Employing the flood inundation mapping extracted by Sentinel-1 SAR images and the 10 m resolution land cover use data, this study used GIS spatial analysis techniques to assess the damage brought by the flood. In the pre-process, Region of Interest (ROI) data were used to cut out the land cover use data of the study area. Next, by means of overlay analysis, the extracted flood water body range was overlaid on the clipped land cover use data to obtain a new feature layer: different land types inundated by flood. Meanwhile, the intersection calculation was performed to obtain the various land ranges inundated by flood. Furthermore, the areas of each land type in different periods of flood full lifecycle were subsequently computed according to corresponding pixels as the damage assessment.

3. Results

3.1. Flood Full Lifecycle Monitoring Using Sentinel-1 SAR and Inundation Models

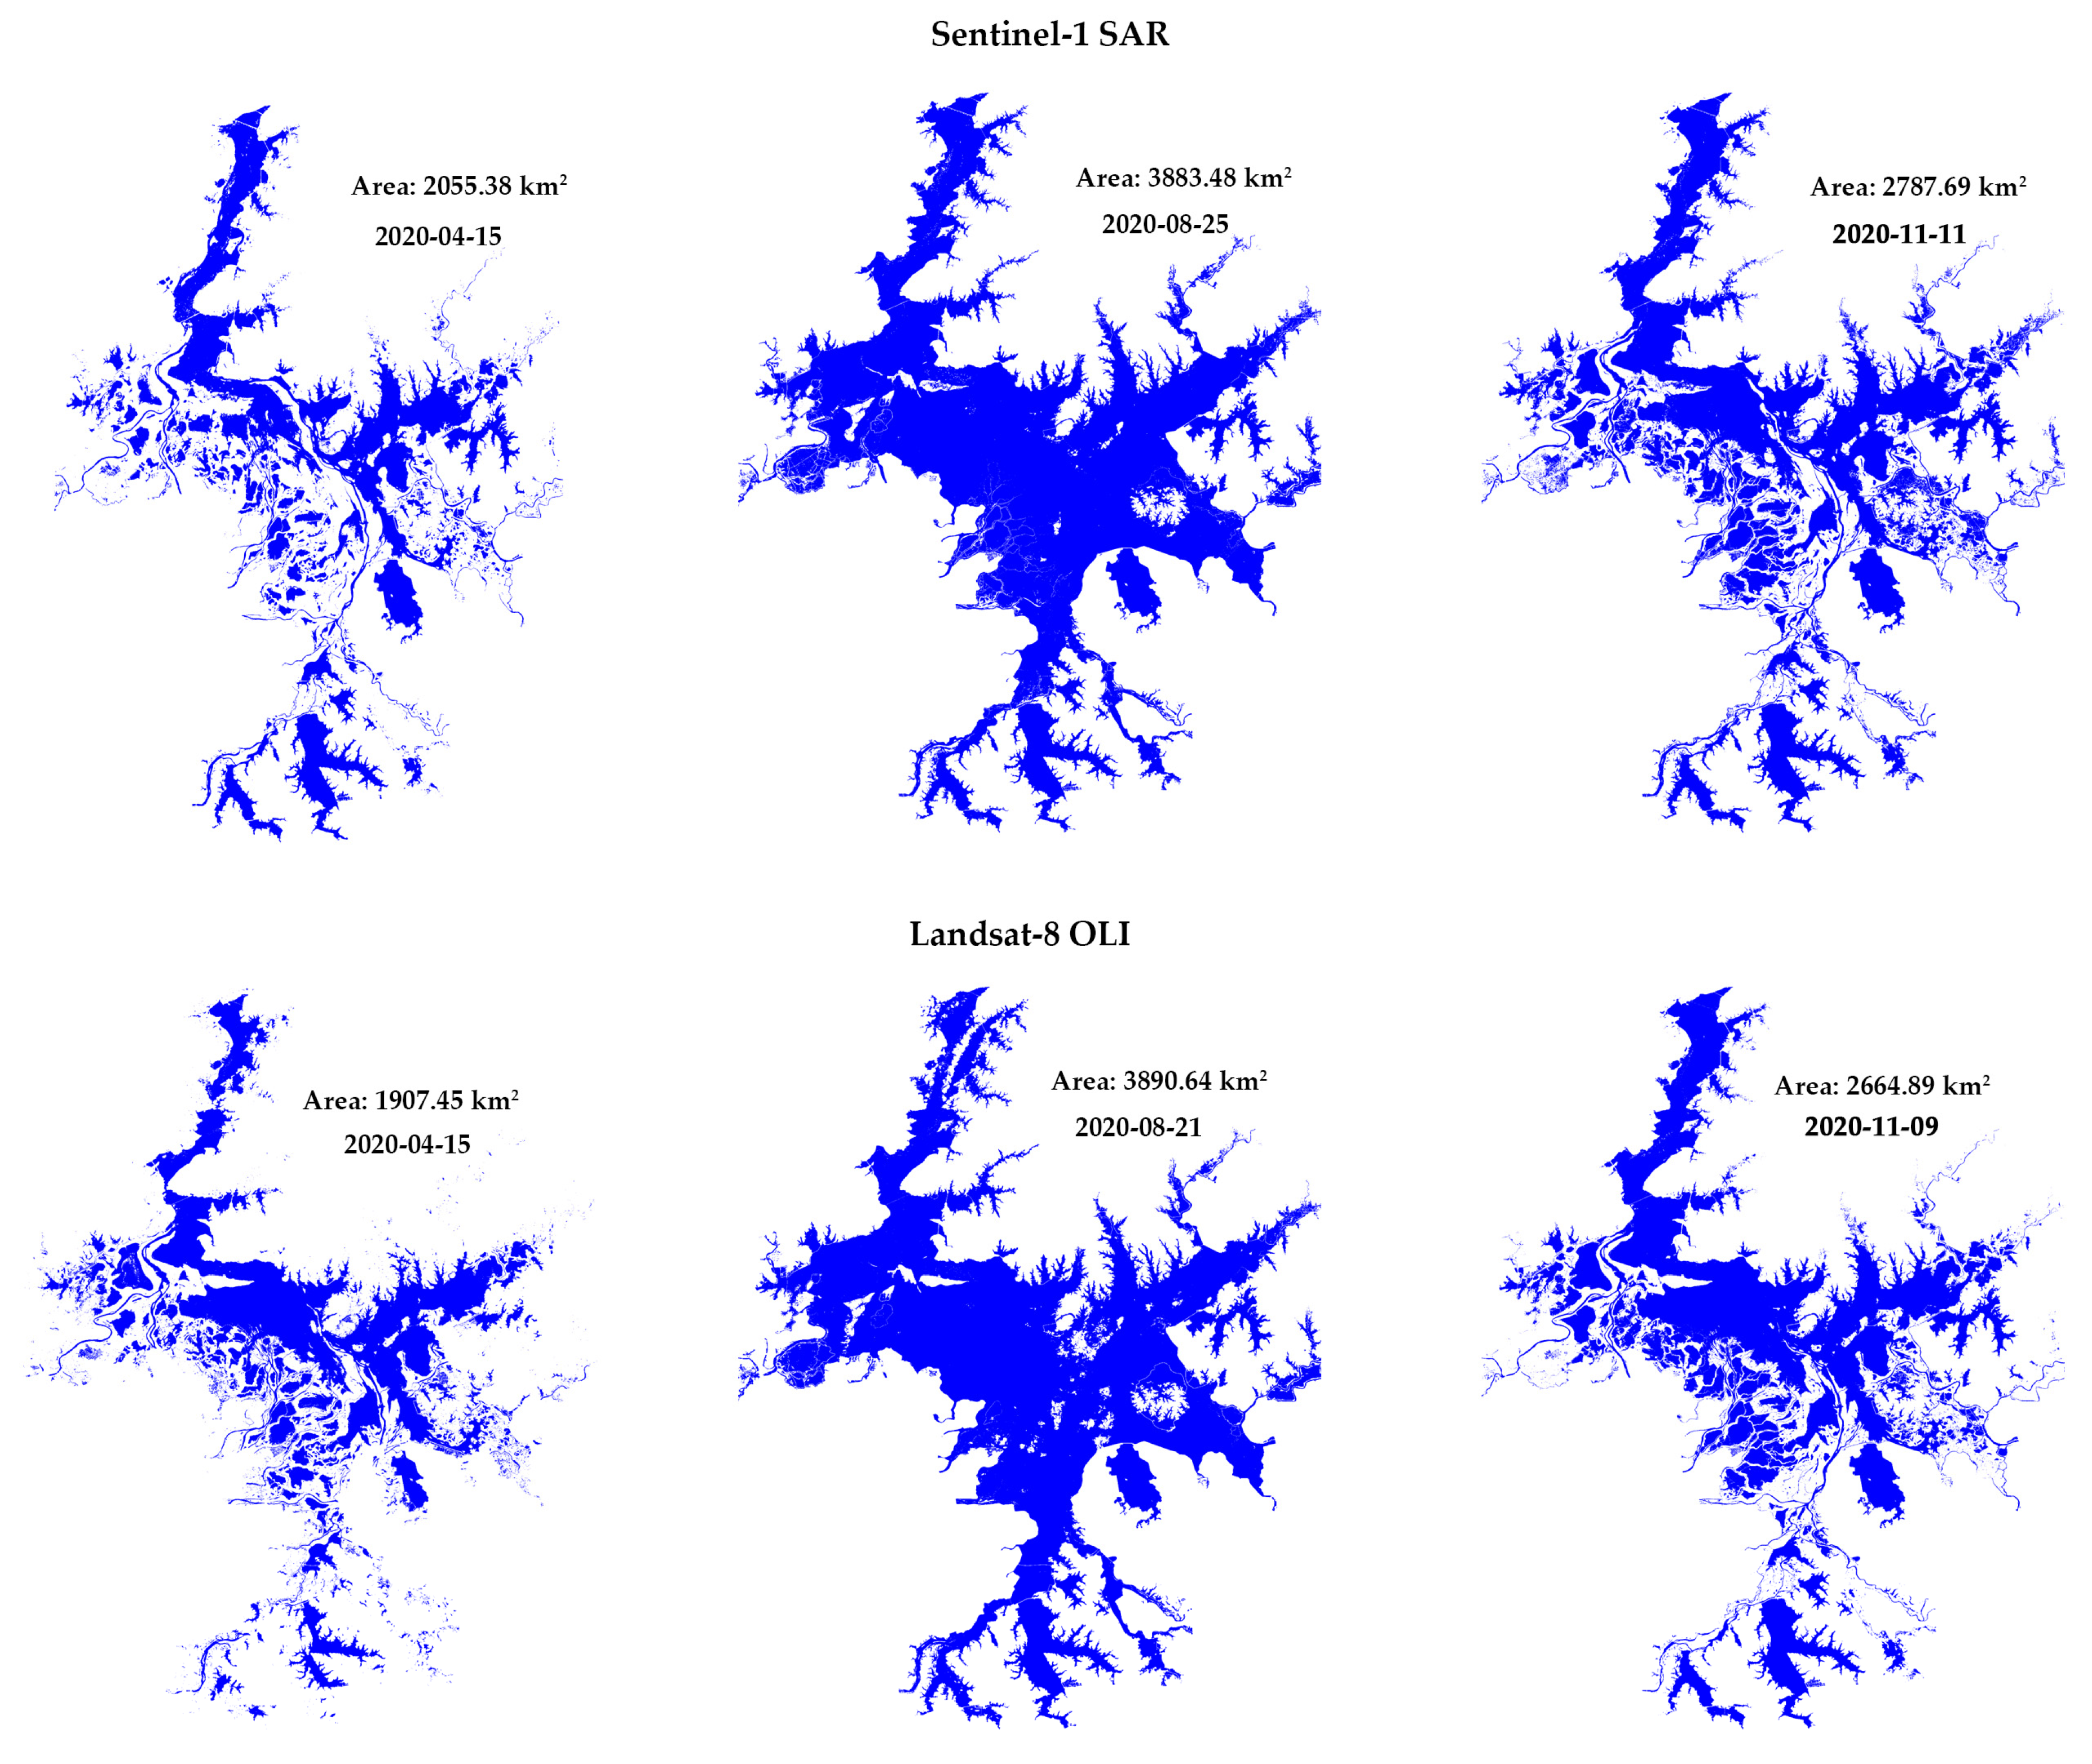
3.1.1. Validation of Flood Area Extraction

For the purpose of quantitatively verifying the extracted flood areas, 30 m spatial resolution optical data, Landsat-8 OLI, were applied as reference materials in the study. According to experimental demands, three Landsat-8 OLI images in 2020 were selected, where cloud coverage is less than 5% and their imaging time interval with Sentinel-1 SAR is within 5 days. In the quantitative experiment, the extracted flood areas of Sentinel-1 SAR based on the bimodal threshold and Landsat-8 OLI based on the Modified Normalized Difference Water Index (MNDWI) posed a comparison. We, respectively, took the areas that were extracted based on them as truth values and calculated the relative errors for cross-validation.
From Figure 5, the comparative difference of extracted flood areas between Sentinel-1 SAR and Landsat-8 OLI is clearly present. Under short imaging time intervals, the extraction results of the three scene images above are a little different. Judging from the shape and boundary of the water, the flood inundation mapping they extracted is highly similar. Due to interference from cloud cover, the extraction results based on Landsat-8 OLI are less accurate. In terms of calculation, the maximum relative error reaches 7.20%, while the minimum error is only 0.18%. In general, the satisfactory validation results demonstrate that extracted flood areas from Sentinel-1 SAR images based on the bimodal threshold method are reliable and precise.

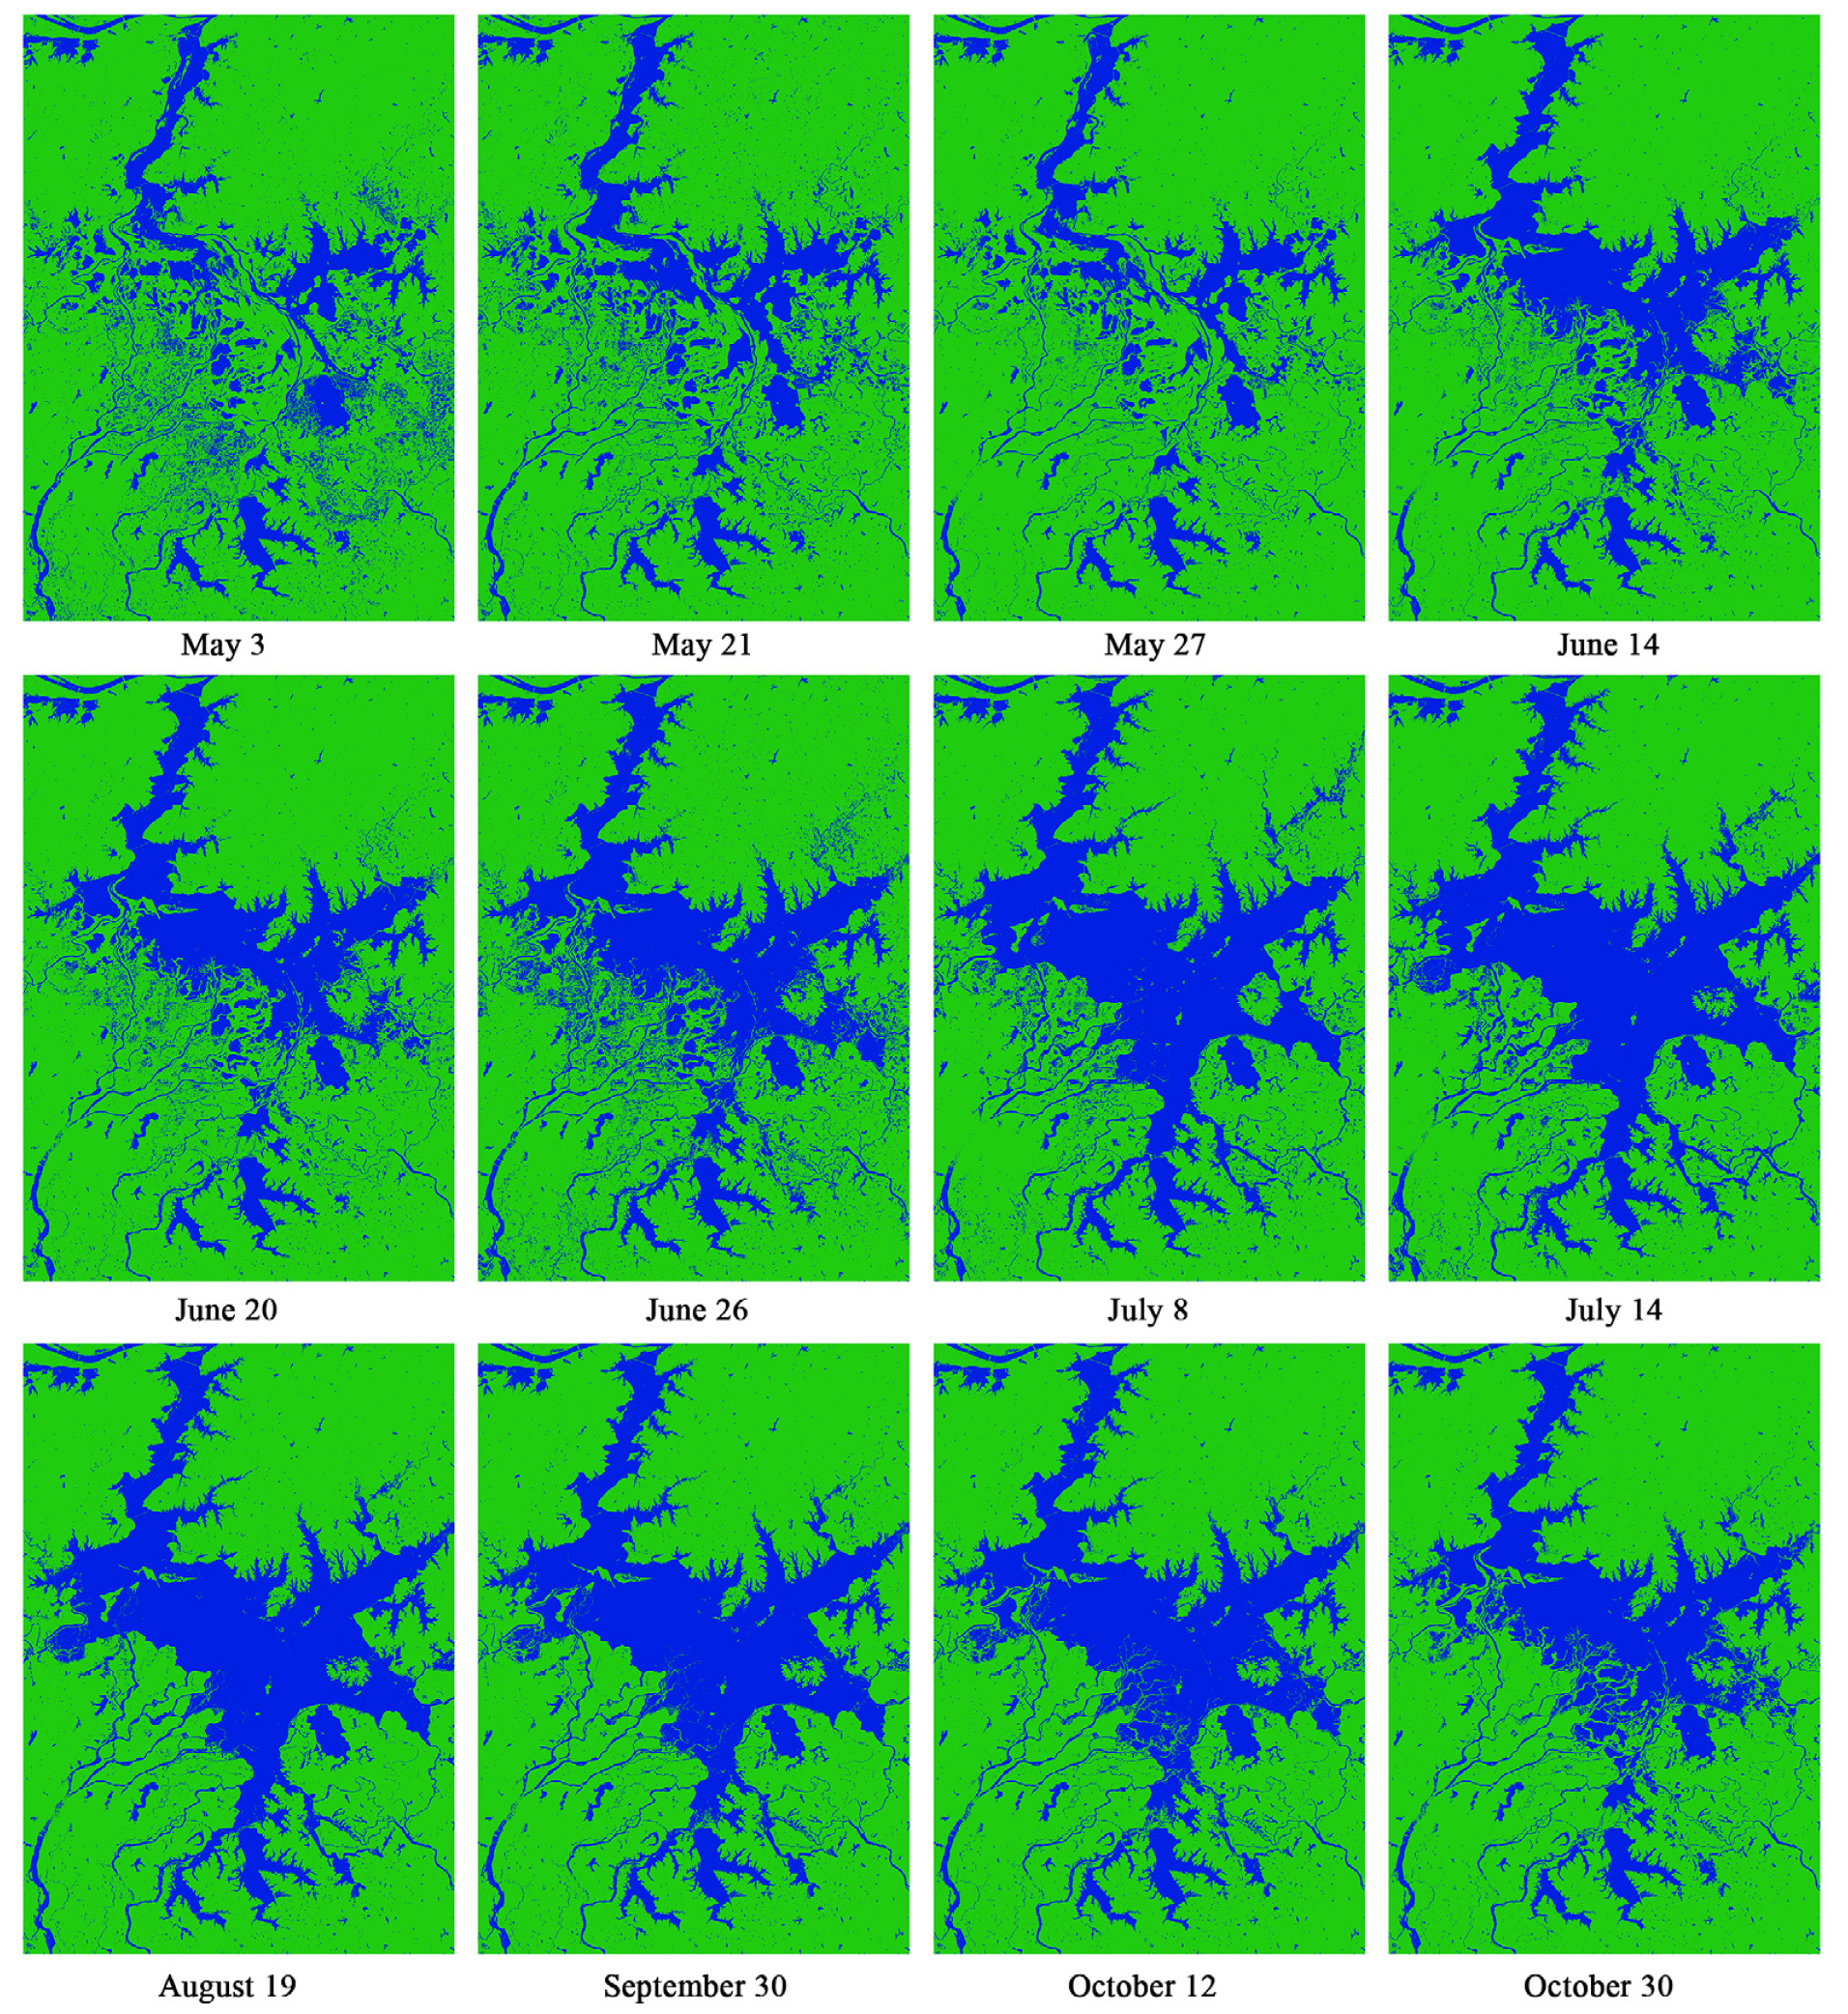
3.1.2. Full Lifecycle Monitoring of Flood Using Sentinel-1 SAR

Full lifecycle monitoring based on 61 Sentinel-1 SAR images in 2020 revealed a conspicuous variation in the area of Poyang Lake, whose minimum area was 1368.77 km² and maximum area was 4077.12 km² with a variation of nearly 2.98 times. During the dry season from January to May, the lake area was relatively small. The lake began to expand in early June, increasing dramatically to reach the peak of more than 4000 km² in mid-July, which was followed by a high and stable plateau before it started to gradually retreat in early October. Therefore, according to the monitoring results, the full lifecycle of the flood in 2020 is divided into three stages: Pre-Flood (from January to the end of June), Peak-Flood (from the end of June to early October), and Post-Flood (from early October to December).
In order to focus on monitoring the most conspicuous variations in the area of Poyang Lake during the climax of the flood hazard, in Figure 6, we chose 12 Sentinel-1 SAR images to draw a spatial and temporal variation sequence diagram of the lake water body from 3 May to 30 October in 2020, with selected images that can demonstrate the obvious changes in lake area during three stages.
In general, according to Figure 6, in the Pre-Flood stage, the area of Poyang Lake was only 1368.77 km² on 3 May, which was also the minimum area of the whole year. After that, from 3 May to 20 June, Poyang Lake experienced two small-scale floods and recession before the main flood. In the Peak-Flood stage, the lake area expanded fiercely until mid-July, when it expanded from about 2500 km² on 20 June to 4077.12 km² on 14 July, with a significant increase of more than 1500 km². After hitting its peak on July 14, the scale of the lake leveled off until 12 October. The lake area then began to gradually retreat in the Post-Flood stage. In detail, the water level of the lake was low in the Pre-Flood stage, especially between 3 May and 21 May, when the most water lay on the north and south due to the lake’s bottom topography, and the southwest and southeast of the lake’s water were divided into scattered bodies by sandbars. At this moment, the lake was in a relatively dry state. There are two non-negligible characteristics in the lake’s abrupt expansion process from Pre-Flood to Peak-Flood, as shown in Figure 6. On the one hand, the region filled with water rapidly from northwest to southeast in June. On the other hand, the lake remained plump from July to October. On 8 June, Poyang Lake expanded obviously from a drought state, and the lake water began to become a whole so that the large area of water appeared in the center, covering an area more than 2000 km², although there were still some discrete water bodies on the southwest. Lasting until 26 June, the main body of the lake continued to expand quickly and significantly, causing the outbreak of this drought-converted flood. During the Peak-Flood period, Poyang Lake reached its maximum area on July 14, when the surface of lake was continuous and the boundaries were clear. Moreover, the lake area basically maintained a stable continuous water state during the Peak-Flood period until 12 October. Since then, the flood entered the Post-Flood period. Poyang Lake showed signs of retreat when the water on the west and south began to decrease. Simultaneously, the lake area shrank.

3.1.3. Using Inundation Models to Near-Real-Time Monitor

There are many hydrological stations in the Poyang Lake region. Considering the spatial and temporal difference of Poyang Lake water, two representative hydrological stations, Poyang Station and Hukou Station (Figure 1), were selected to observe water levels reasonably. Poyang Station is located in the east of the lake, with high water levels all year round, while Hukou Station is located in the northernmost part of the lake with the conspicuously changed water level. Figure 7 reflects the year-round variation in the lake area and the water level at Hukou Station and Poyang Station. It can be found that the water level and the lake area have similar annual change trends, and the water levels observed by the two hydrological stations are almost the same. During the dry season from January to May, the area of Poyang Lake was small and fluctuating. However, the lake area began to rise on 3 May, reached its maximum (4077.12 km²) on July 14, and kept this state over 3000 km² until early October. Similarly, the water level remained low from January to May. However, from the beginning of May, the water level continued to rise sharply, reached its highest level on about July 14, and then slowly decreased. Therefore, it can be inferred that there is a certain relationship between the water level and lake area.
For further quantitative study, the water level data of each hydrological station and lake area were used to perform linear regression analyses to explore the relationship between the lake area and water level changes in Poyang Lake during the year. The established flood inundation models are shown in Figure 8. Furthermore, only based on the hydrological observation data, the inundation models can be applied to monitor the area of the lake in near-real-time, providing auxiliary materials for the full lifecycle monitoring of floods in the absence of remote sensing images.
In order to evaluate the performance of flood inundation models, three indicators [56]—coefficient of determination (R2), root mean square error (RMSE), and Nash–Sutcliffe efficiency coefficient (NSE)—were calculated. The indicator R2 manifests the fitting effect of models, while RMSE measures the difference between the observation value and the predicted value by model. The NSE, a common indicator of hydrological models, ranges from −∞ to 1, which measures the match level between observation and predicted values. According to Figure 8, although the R2 values of the flood inundation models established based on Hukou Station and Poyang Station are different, they both show excellent fitting effects. Therefore, it is believed that there is a certain linear relationship between water level and lake area. Especially, the NSE of the model based on Hukou is relatively close to 1, indicating that it is of good quality and the predicted values are highly reliable. To test whether the linear relationship is significant, we conducted F tests, and the results were satisfactory, indicating that the linear relationship of lake area and water level in the models is relatively significant. Out of different positions of two hydrological stations in Poyang Lake, the models above have some differences. The model based on Hukou Station can better reflect seasonal changes, while the other cannot. Only by using the observational data of the two stations can we reasonably study the flood.

3.2. Potential Causes of Drought-Converted Flood Hazard

The flooding period of Poyang Lake usually begins from May to early July. During this period, the precipitation is relatively concentrated and intensified, which causes the water level to rise sharply and easily triggers flood hazards. Furthermore, the flood hazard of the Poyang Lake region in 2020 was more severe than any flood event in the past 20 years. In order to explore the potential causes of this flood hazard, the article presents a detailed hydrological and meteorological analysis.

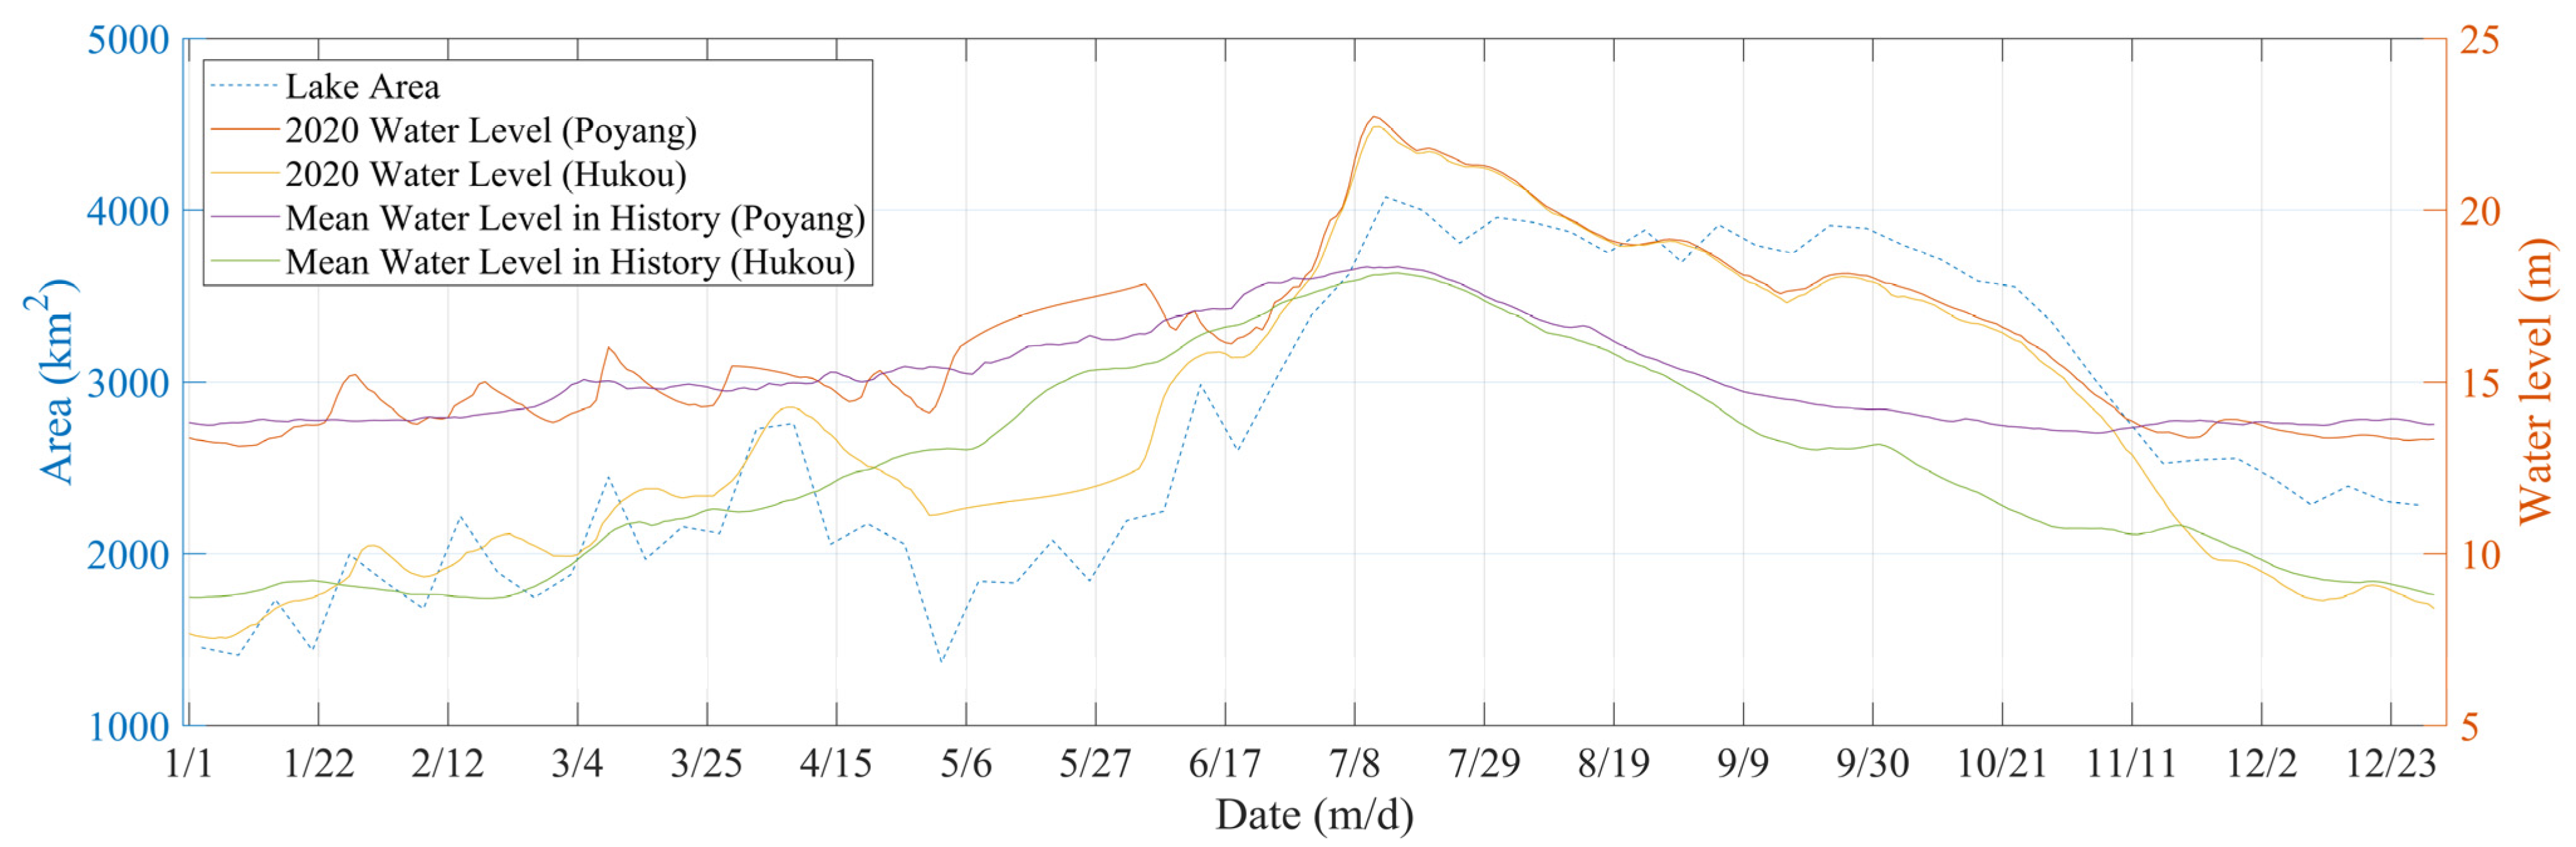
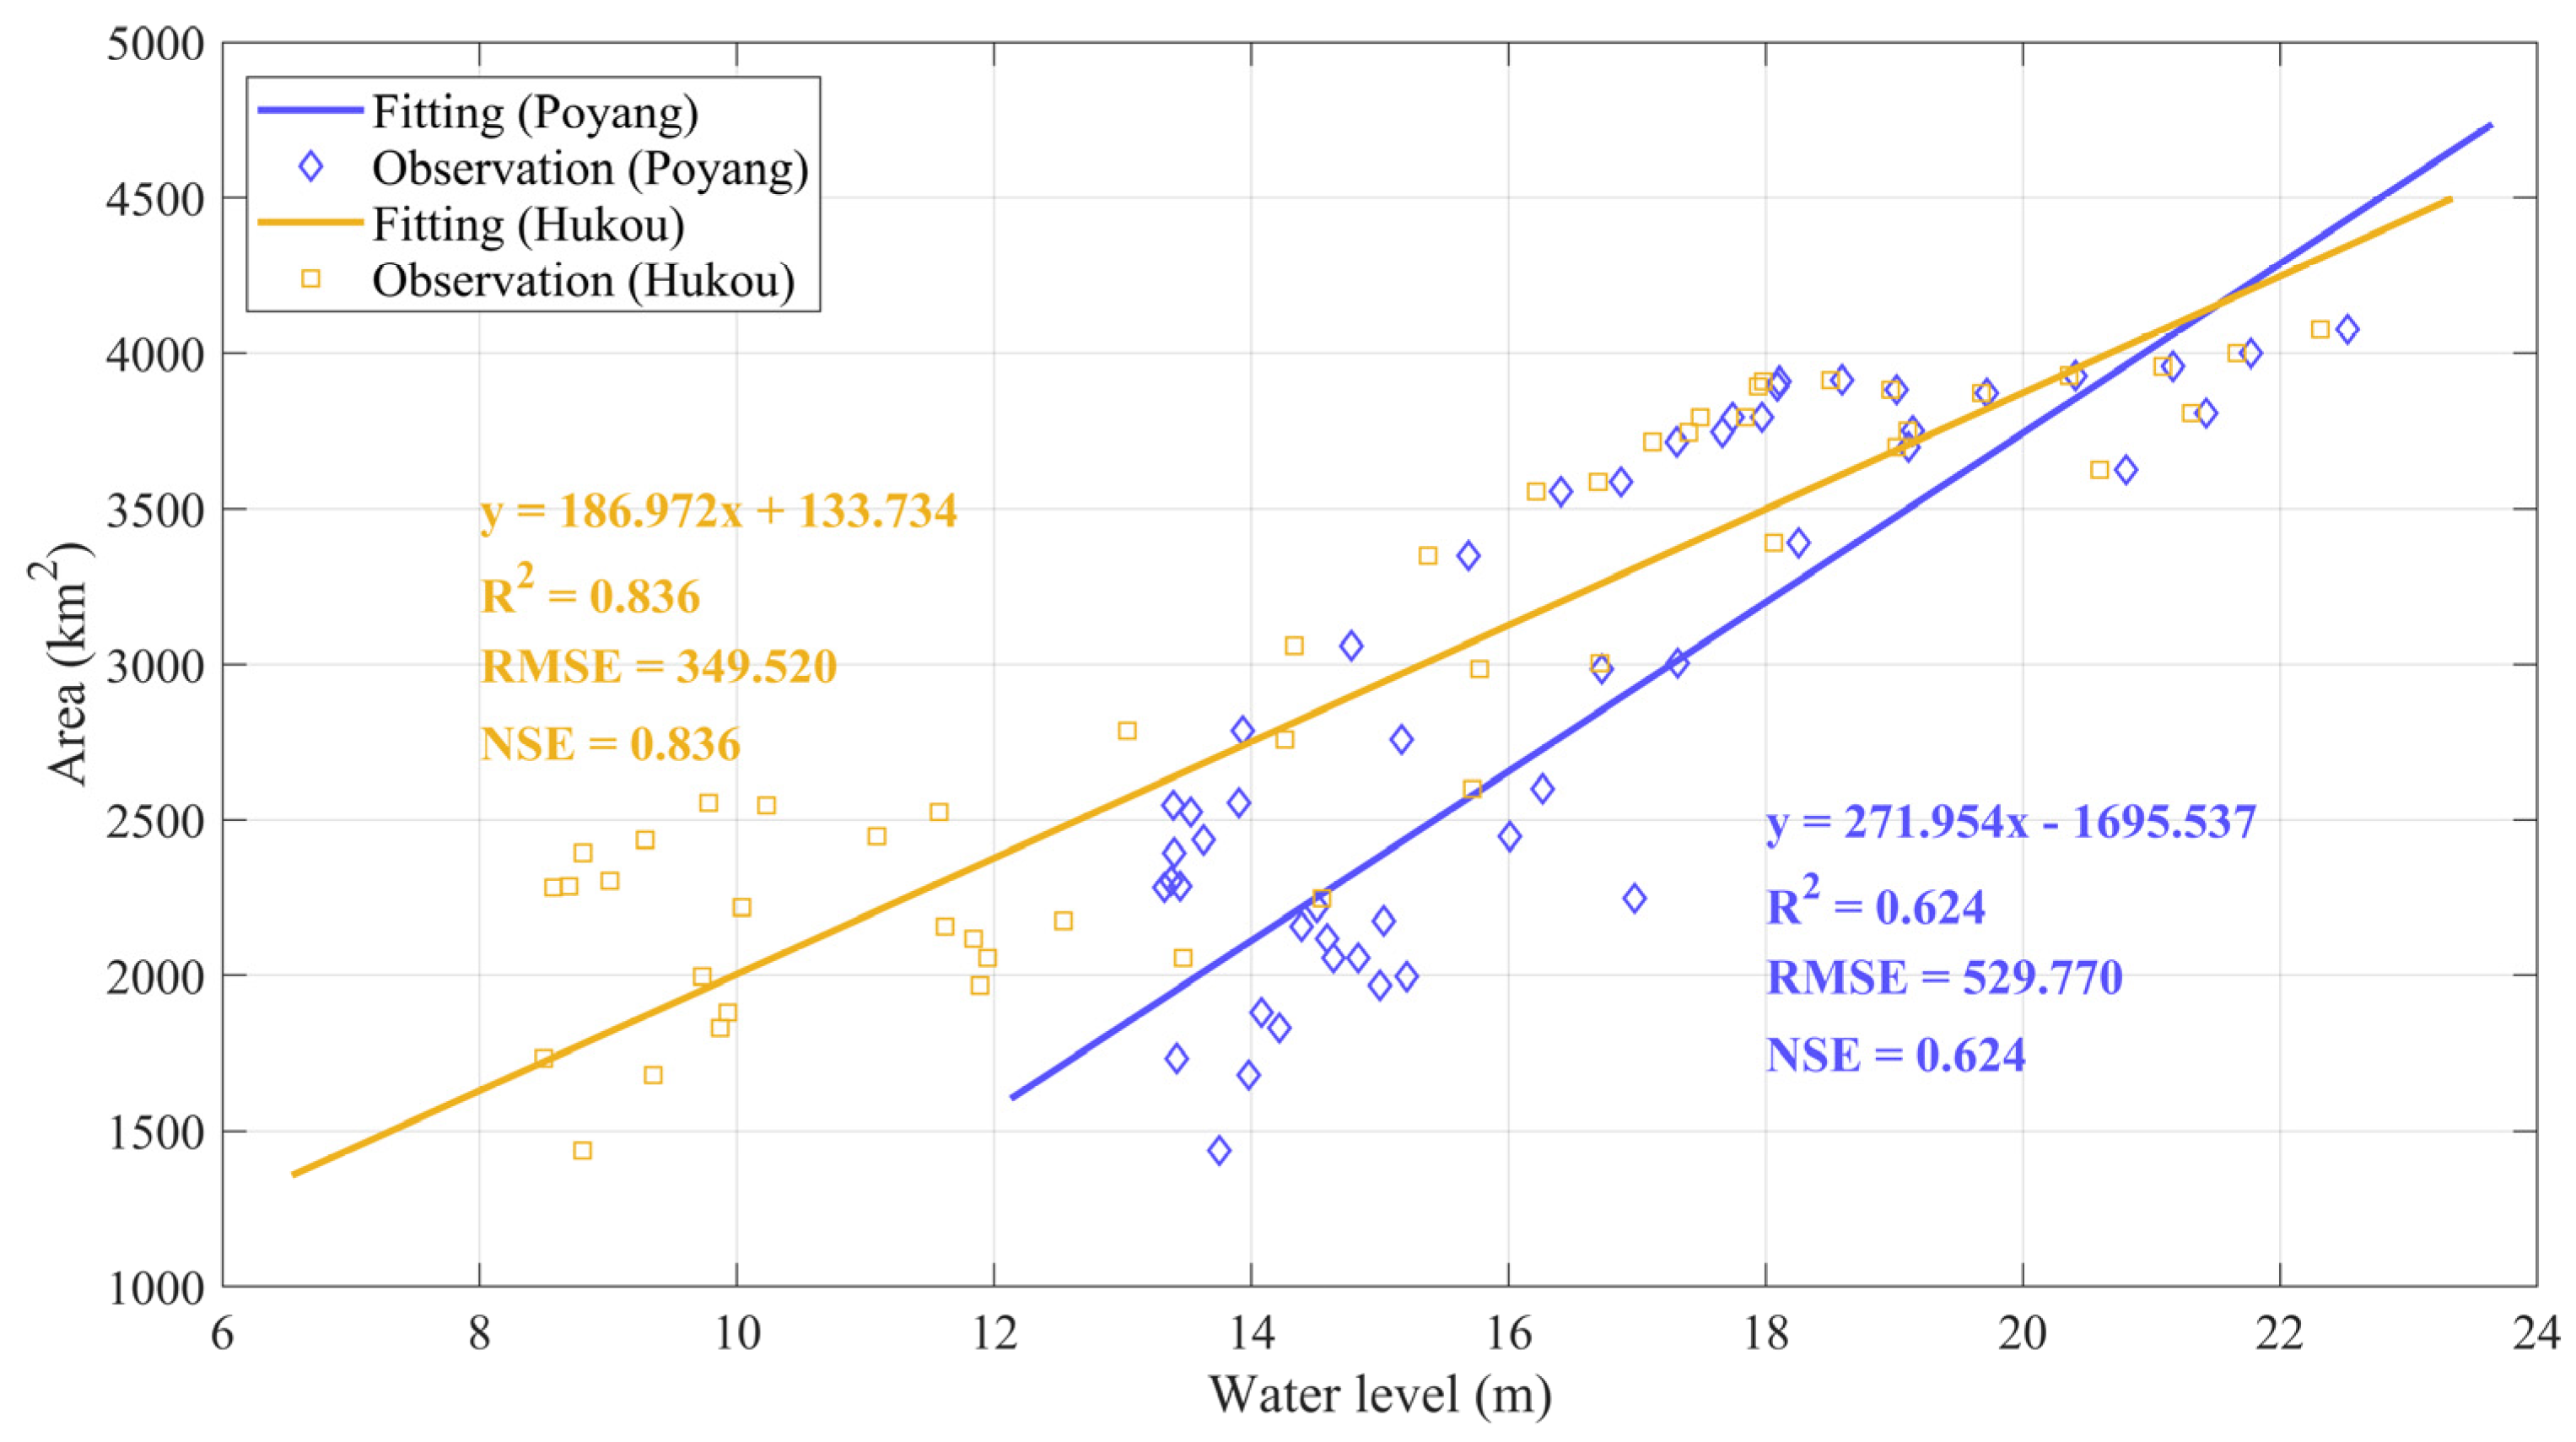
3.2.1. Hydrological Analysis

Specifically, in 2020, the rainy season was prolonged, leading to the water level rising rapidly during the flooding period, and the flood water receded relatively later. What is more, this flood event presented an abrupt turn from relatively moderate drought to severe flood. Therefore, to further explore the potential causes of this catastrophe from the perspective of hydrology, this article analyzed the water level observation data series of two key hydrological stations mentioned above.
According to observation data, we averaged the daily water levels from 2010 to 2019 and compared them with the water levels in the same period of 2020. As shown in Figure 7, the water level change trends of Hukou Station and Poyang Station were similar, and especially the water level was significantly higher than the warning level for a long period of time in July and August. The flooding in 2020 mainly presented three characteristics: First, from May to the end of June 2020, the water level was lower than in previous years, indicating that the lake was relatively dry. Second, the water level rose quickly and continued to maintain a high level. From the beginning of June to mid-July, the water level rose sharply, exceeding the warning level on 5 July, with the highest water level (22.43 m) significantly higher than the average of previous years (about 18 m). The water level from July to October was significantly higher than the average of previous years, which was one of the most important factors for the flood disaster. Last but not least, the water level declined extremely slowly in the late flooding season, indicating that the flood water receded marginally, and there were high plateaus or slight increases in the water level in different degrees from July to October. In addition, even in the dry season, taking October for instance, the water level at Poyang Station was 39.96% higher than the highest in the same period in previous years, while the highest at Hukou Station was 40.21% higher than that in the same period, which shows that the flood lasted at high water levels for a long time.
In addition, taking Hukou Station as an example, the extreme value of the water level during the flooding season is shown in Table 2. We calculated the maximum and minimum values of the water level from 2010 to 2019, and then compared them with the counterpart extreme values of the water level in the same period in 2020 correspondingly. From Table 2, it can be found that during the flooding season from August to October, the maximum water levels at Hukou Station in 2020 were all much higher than the maximum during the same period historically. Meanwhile, the minimum values of the 2020 water level were also higher than previous years, reflecting the heavy severity of this flood hazard.
With abundant seasonal landscape changes, the water volume of Poyang Lake varies greatly in different periods, whereas the occurrence of floods exacerbates these changes. Based on flood inundation mapping, the water level, and DEM data, the increased water volume during the flooding period was estimated. It was found that, from 3 May to 14 July, the water level at Poyang Station rose sharply from 14.72 m to 22.52 m, causing the water volume of Poyang Lake to increase by approximately 44.13 billion m3. Moreover, the water volume of the entire lake reached about 57.28 billion m3 in the Peak-Flood period and increased by about 4.36 times compared with the Pre-Flood period, which shows that the degree of this flood was very serious.

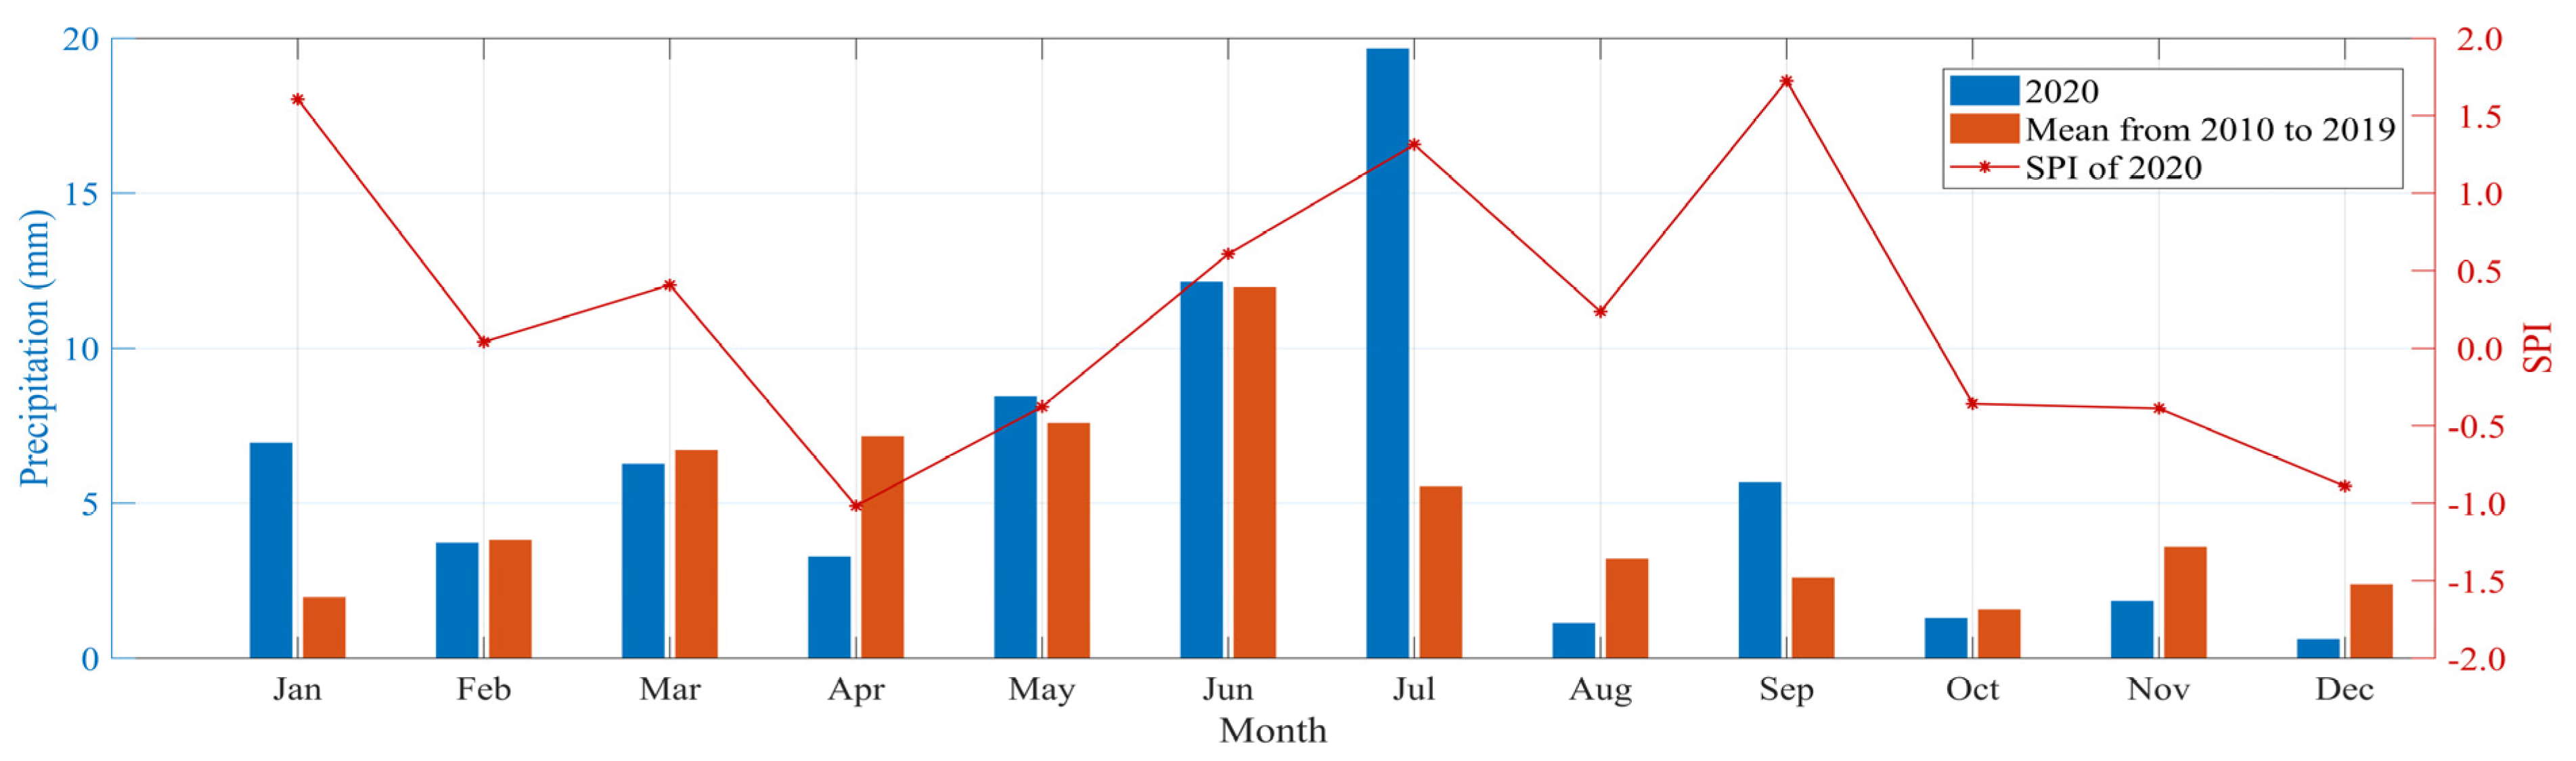
3.2.2. Meteorological Analysis

From the perspective of meteorology, this study analyzed the precipitation characteristics between 2020 and previous years, which is also one of the critical causes of the catastrophic flood event. According to the precipitation observation data at Boyang Station, we averaged the monthly precipitation from 2010 to 2019, and then compared this with the monthly average in 2020. As shown in Figure 9, it is the abnormal rainfall abruptly changing from less to more in 2020 that caused this drought-converted flood. In the dry season, the precipitation in 2020 was less than that of previous years, leading to less water in the lake and the lake presenting a particularly dry state. By contrast, the monthly average precipitation in 2020 was significantly higher than in historical years from June to September, triggering a sudden conversion from drought to a catastrophic flood. In addition, the most attention-grabbing figures are the abnormal precipitation on 3 June and 8 July, with 149.6 mm and 132.3 mm, respectively. In particular, the average monthly precipitation in July and September was, respectively, 2.40 and 2.77 times that of previous years. Actually, the cumulative precipitation in July at the beginning of the flooding period reached 414.6 mm, which is an important factor that triggered the rapid rise in the water level. From 2010 to 2019, the monthly average precipitation at Boyang Station showed a slow increase at first and reached an extreme value in June before a rapid decline. However, in 2020, the precipitation continued to increase rapidly from May to July. After reaching the peak in July, it peaked again in September, and the two peaks were much higher than the average of the same period in previous years, which brought plenty of water to the lake.
Moreover, the Standardized Precipitation Index (SPI) [57] was introduced to measure the level of drought and flood, indicating a more serious drought with a more negative value. In Figure 9, the SPI value of 2020 on the monthly scale is illustrated. It is worth noting that the SPI value of April is only about −1.02, which can be regarded as a moderate drought according to the grades of meteorological drought of China (GB/T 20481-2017). Then, the SPI increasingly grew from April to July, manifesting an abrupt transformation from a drought state to a severe flood. The SPI values of July and September are both more than 1, which demonstrates that this drought-converted flood event is very serious.
To sum up, in the Pre-Flood stage of 2020, especially April, the Poyang Lake was in a relatively dry state due to a lack of water. However, the extremely abnormal precipitation brought excessive water to the lake and made it abruptly convert from drought to flood, which shows the characteristics of fast speed and high intensity. What is more, during the Peak-Flood period, the rainfall was very violent, long-lasting, and with sufficient stamina, causing the water level to rise rapidly above the warning level while remaining a high level and contributing to the catastrophic severity of the flood hazard. In the Post-Flood period, precipitation returned to its normal level, which caused the retreat of the flood. It was the uneven distribution of precipitation during the year that led to this drought-converted flood event.

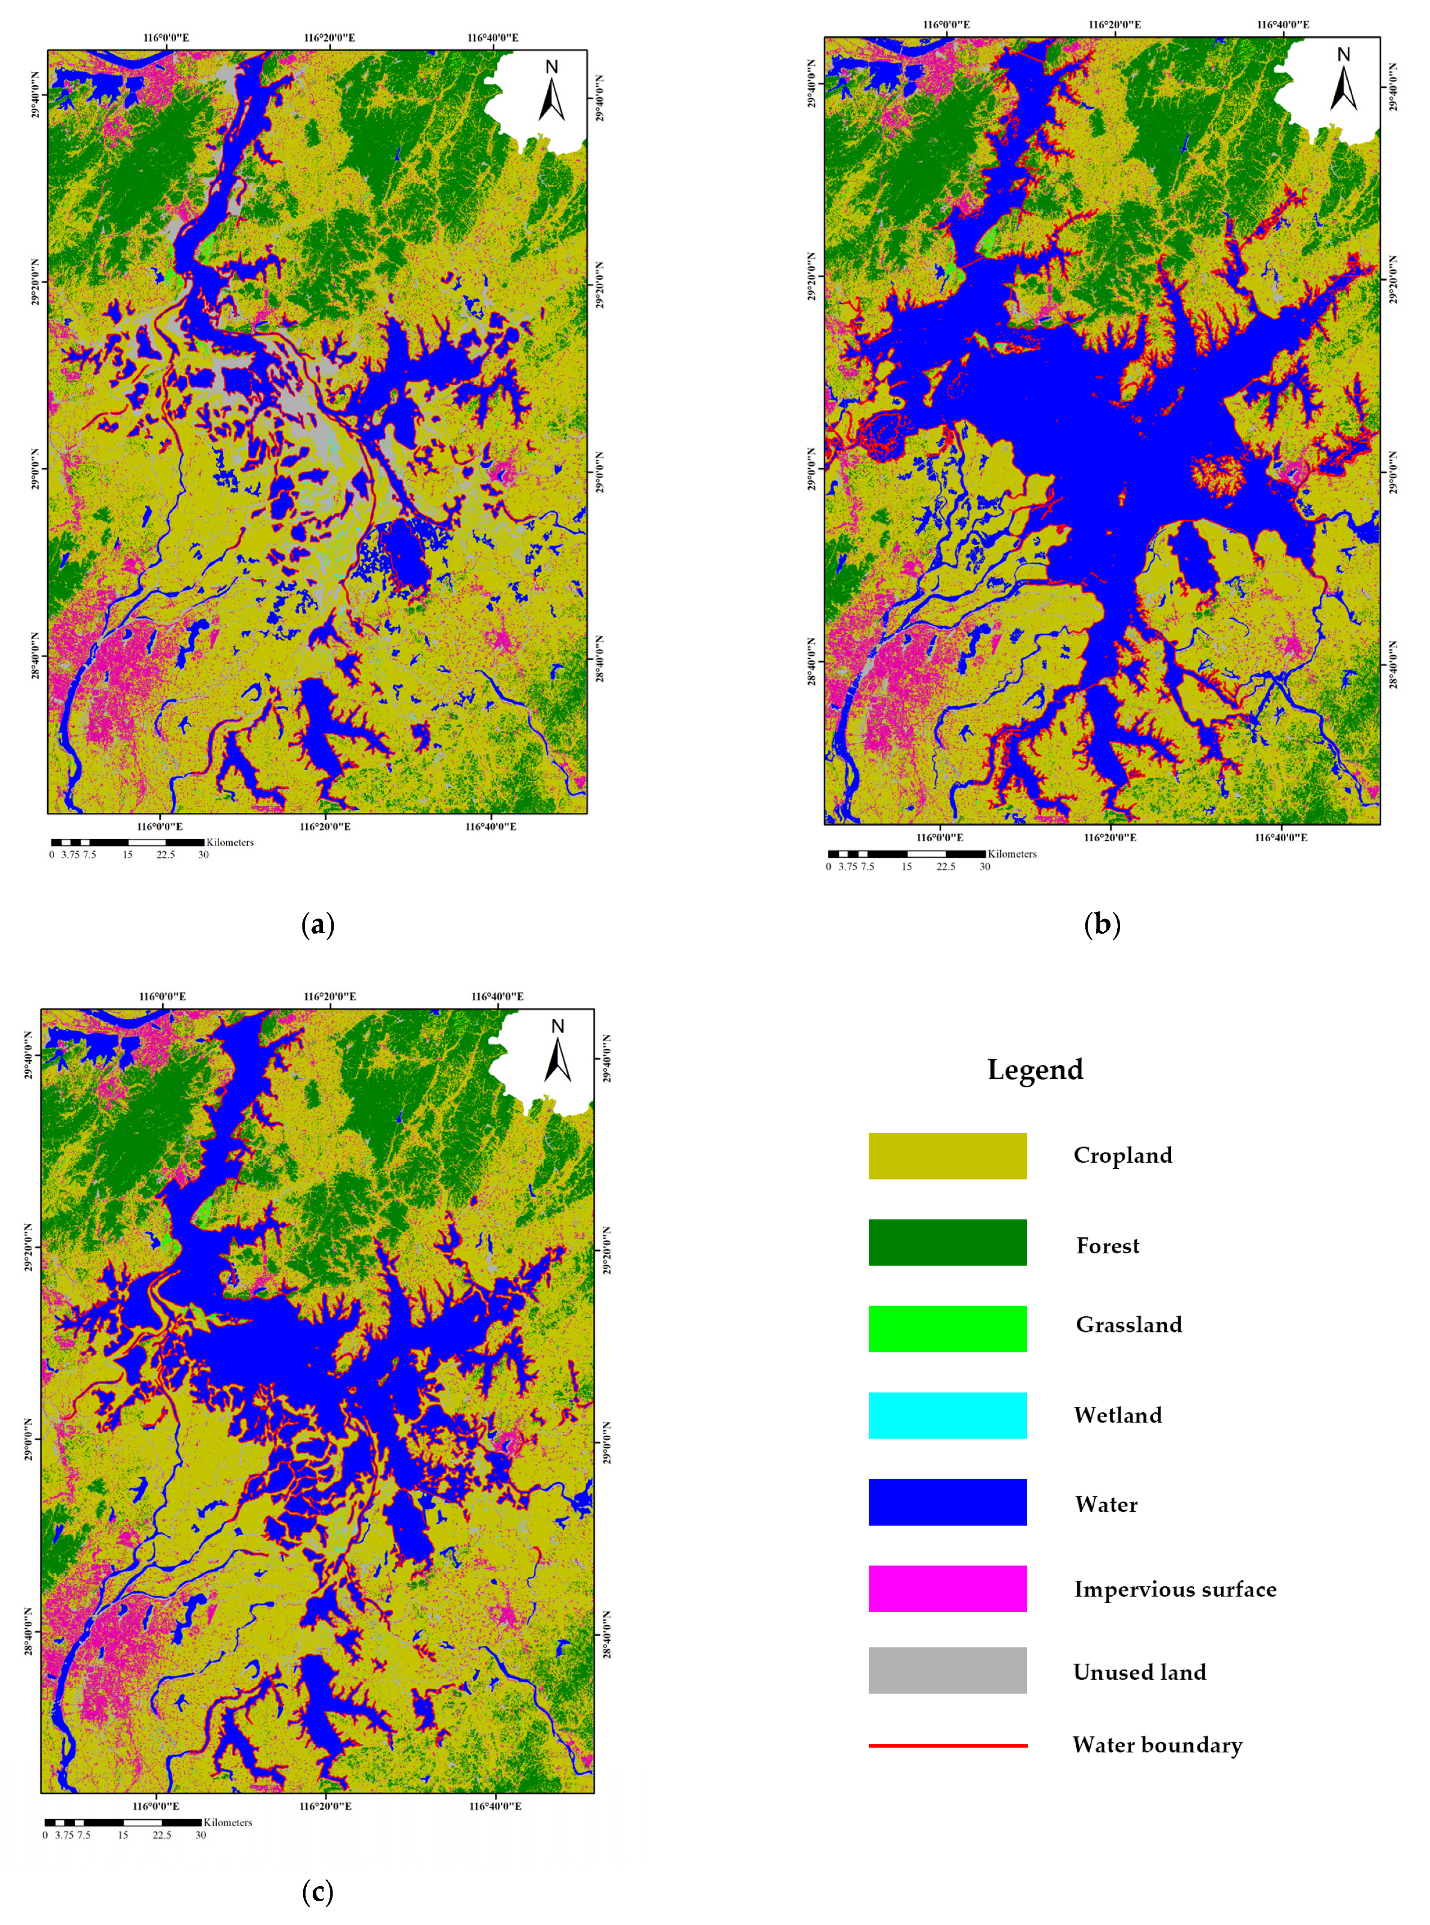
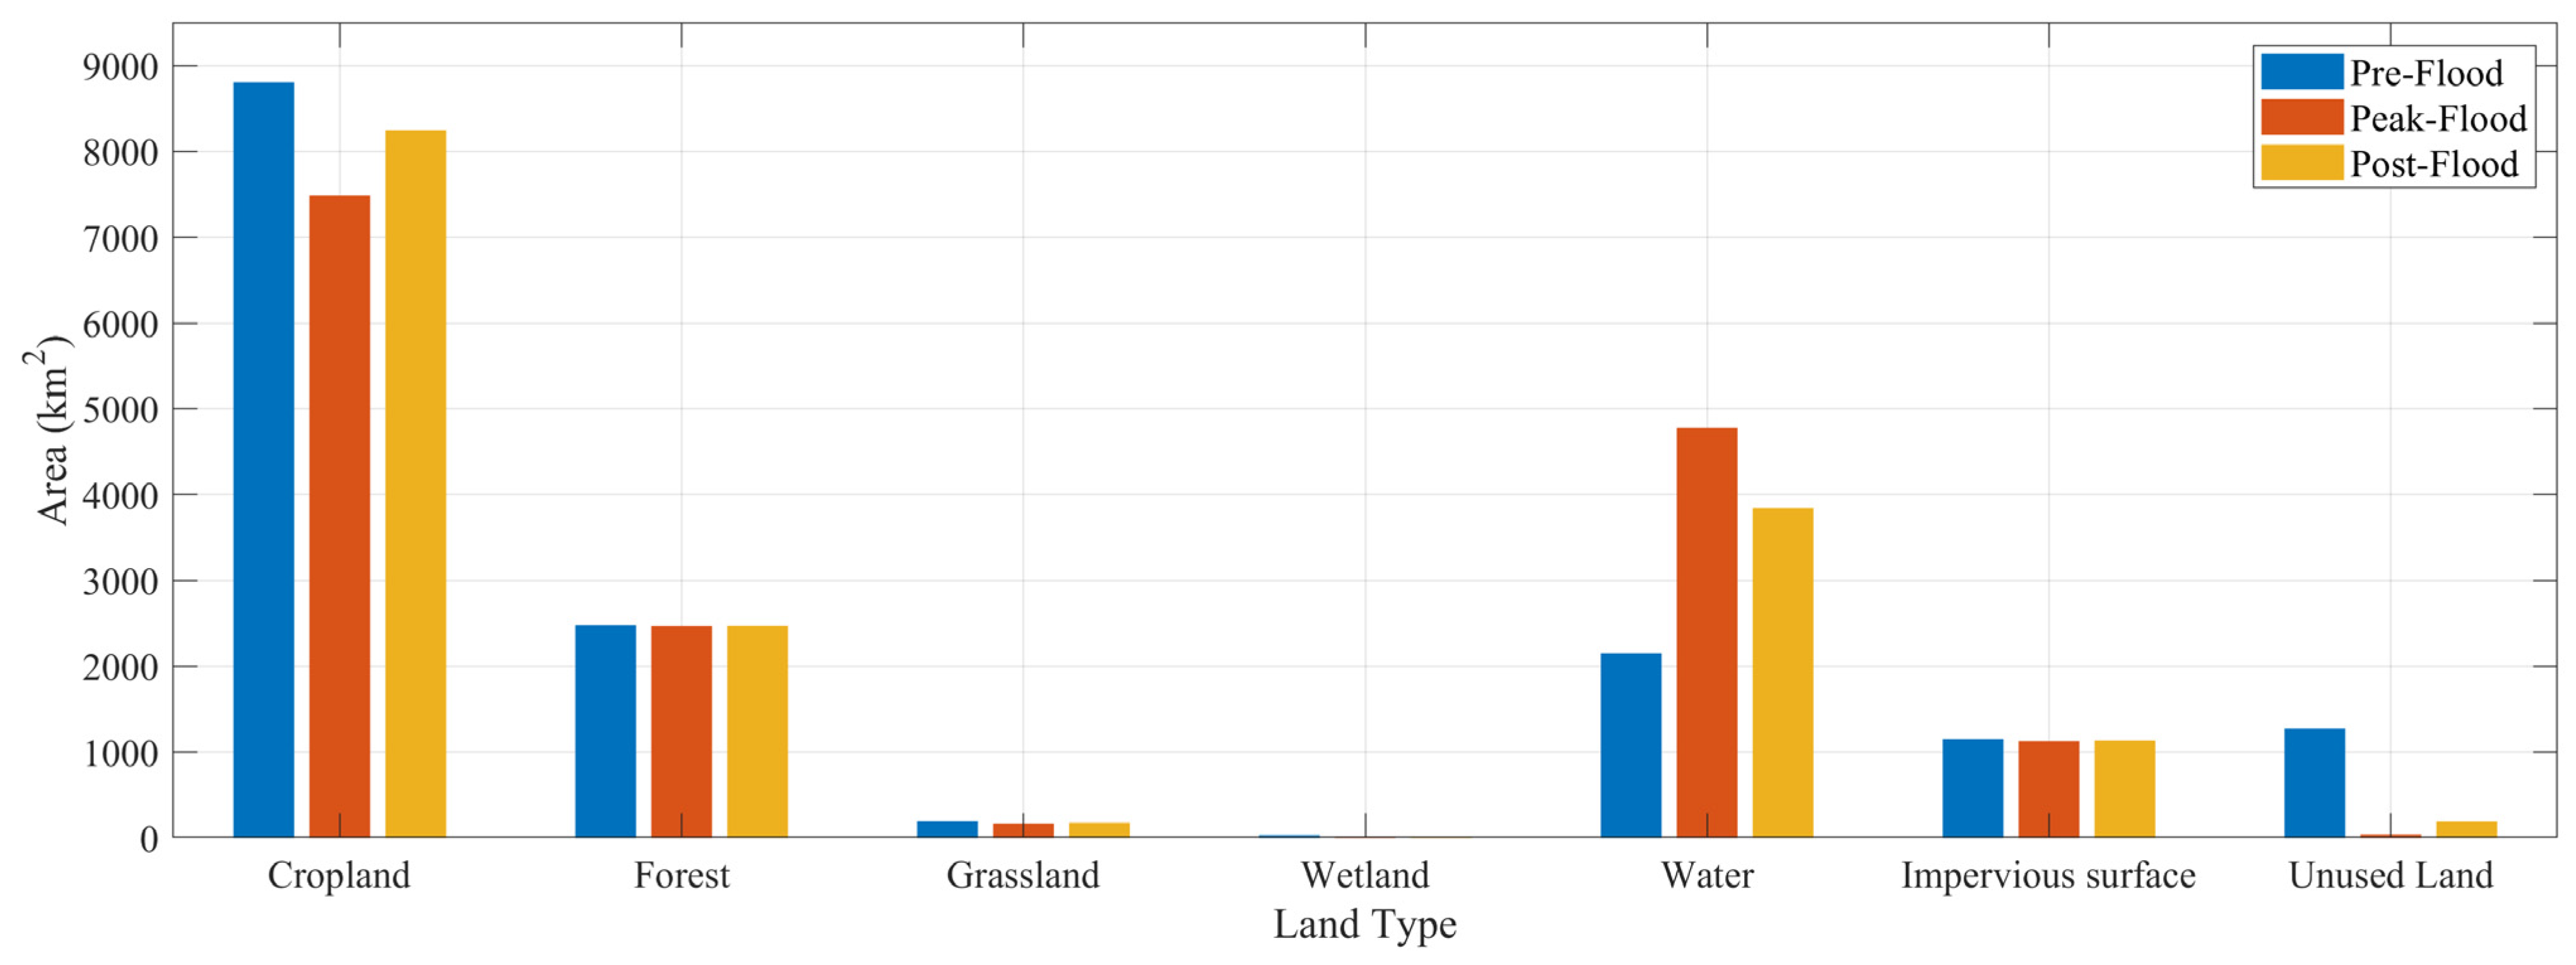
3.3. Flood Damage Assessment

In order to further assess the damage, this study selected the three Sentinel-1 images on 3 May, 14 July, and 5 November to, respectively, represent flood-inundated ranges of three periods: Pre-Flood, Peak-Flood, and Post-Flood. Then, combined with land cover use data, the disaster damages were assessed using GIS-based techniques, including spatial overlay analysis and geographic statistics.
The inundation states during different periods of the full lifecycle are shown in Figure 10, where the boundaries of the flood water are highlighted in red and various land types are emphasized in corresponding colors so that it is clear to distinguish what types of land were inundated. In the Pre-Flood period (Figure 10a), Poyang Lake was in a drought state due to the precipitation shortage. As a result, the distribution of water bodies was fragmented, which divided the lake into many scattered sections. Due to the lack of water, the inundation area was scarce, resulting in numerous ground surfaces in the lake being exposed, which were considered to be unused land. At the same time, the lake rarely inundated the surrounding land. From the center of the lake to the surrounding area, the landscape pattern of ‘wetland–cropland–grassland–forest’ was generally presented. By contrast, in the Peak-Flood period (Figure 10b), increasingly sustained heavy rainfall led to a sharp rise in water level and more water flow, and the catastrophic flood was consequently triggered. In this process, the lake area expanded at high speed, which inundated a large amount of land. Especially, the unused land that was previously exposed due to drought and the surrounding agricultural cropland were the most inundated. Other land types such as grassland and wetland were not inundated as much because their original areas in the study region were relatively small, whereas forest and impervious surface areas were the least inundated because forests have strong floodproof ability while impervious surfaces are mainly distributed far away from the main lake body. It was this inundation state that lasted for almost two months. During the Post-Flood period (Figure 10c), the precipitation reduced and the water level dropped gradually, so the lake area began to decrease. At this moment, the surrounding land was still inundated to a certain extent despite the retreat of the flood. Compared to the Peak-Flood period, the water area at this time was much smaller, especially in the southern lake. Most of the previously inundated cropland, located in the lowlands of the lake, had returned to its normal state, but other land types had not returned yet.
In Figure 11, the area changes of various land types of the Poyang Lake region in the full lifecycle are illustrated. Taking the area in the Pre-Flood period as a reference benchmark, we calculated the area of various types of land inundated by flood in the Peak-Flood and Post-Flood periods to assess disaster damage. On the whole, cropland and unused land were the most severely inundated by floods, while forest, grassland, wetland, and impervious surface were relatively less inundated. The unused land is mainly the surface of the lakebed, which was inundated with a maximum area of 1237.25 km2. As the most damaged land type, cropland was flooded by 1375.67 km2 during the Peak-Flood period, which severely destroyed agriculture. In comparison, the inundated area of other land types was nearly less than 25 km2. Specifically, the maximum inundated areas of various land types were: 9.58 km2 of forest, 22.95 km2 of grassland, 20.17 km2 of wetland, and 23.27 km2 of impervious surface. Even during the Post-Flood period, due to the slow retreat of the flood, cropland was still inundated by 566.07 km2 and had not recovered to its normal state. In general, the flood event caused the most damage to agriculture, followed by grassland, wetland, and impervious surface, while forest suffered the least losses.

4. Discussion

4.1. Comparison with Previous Studies

As mentioned in the introduction, multi-source optical sensors have been widely used in studies of floods, which have achieved satisfactory effects to a certain extent. It is the open-source Terra MODIS that is particularly suitable for long-term flood monitoring with relatively high resolution and multi-bands. However, its highest spatial resolution only reaches 250 m, usually leading to large errors in flood inundation extraction. As a mainstream optical sensor, Landsat-8 OLI has a spatial resolution of up to 30 m with nine spectral bands, which could capture high-resolution images applied in flood monitoring with better performance. Nevertheless, its revisit cycle time is as long as 16 days, bringing great difficulties to performing high-time-density flood monitoring. As emerging advanced Chinese optical sensors, GF-1 WFV and HJ-1 A/B CCD also have both high spatial resolution and temporal resolution, which are mainly used for environmental monitoring and forecasting. However, they are not suitable for the full lifecycle monitoring of floods because of their low spatial–temporal resolutions and weak cloud penetration capacities. In comparison, this study on the full lifecycle monitoring of floods benefits a lot from the application of Sentinel-1 SAR. SAR has the ability to work under all-weather and all-day conditions, penetrates clouds without obstacles, and is not affected by meteorological conditions and light levels. What is more, in the Poyang Lake region, the combined use of Sentinel-1 A and Sentinel-1 B can reduce the revisit period to only 6 days. It is the short revisit cycle and high spatial resolution of Sentinel-1 that provide enough reliable images for continuous monitoring of the full lifecycle of floods.
The previous study [55] was based on cloudless Terra MODIS images from 2000 to 2010 to evaluate the inundation changes of Poyang Lake. According to its long-term monitoring results, the inundation area of Poyang Lake during any particular year can vary from 2.3 to 3.2, while the maximum/minimum inundation area ratio in this study is about 2.98, which demonstrates the reliable monitoring of Sentinel-1 SAR. Through long-term monitoring, the 11-year inundated areas can be refereed to quantify the conditions of drought and flood, such as the 2011 drought–flood abrupt alternation event in the Poyang Lake region. Hence, inspired by this, the long-term monitoring method will be used in future research to investigate the full lifecycle of floods during many years, and will be helpful to more clearly explore flood evolution patterns.

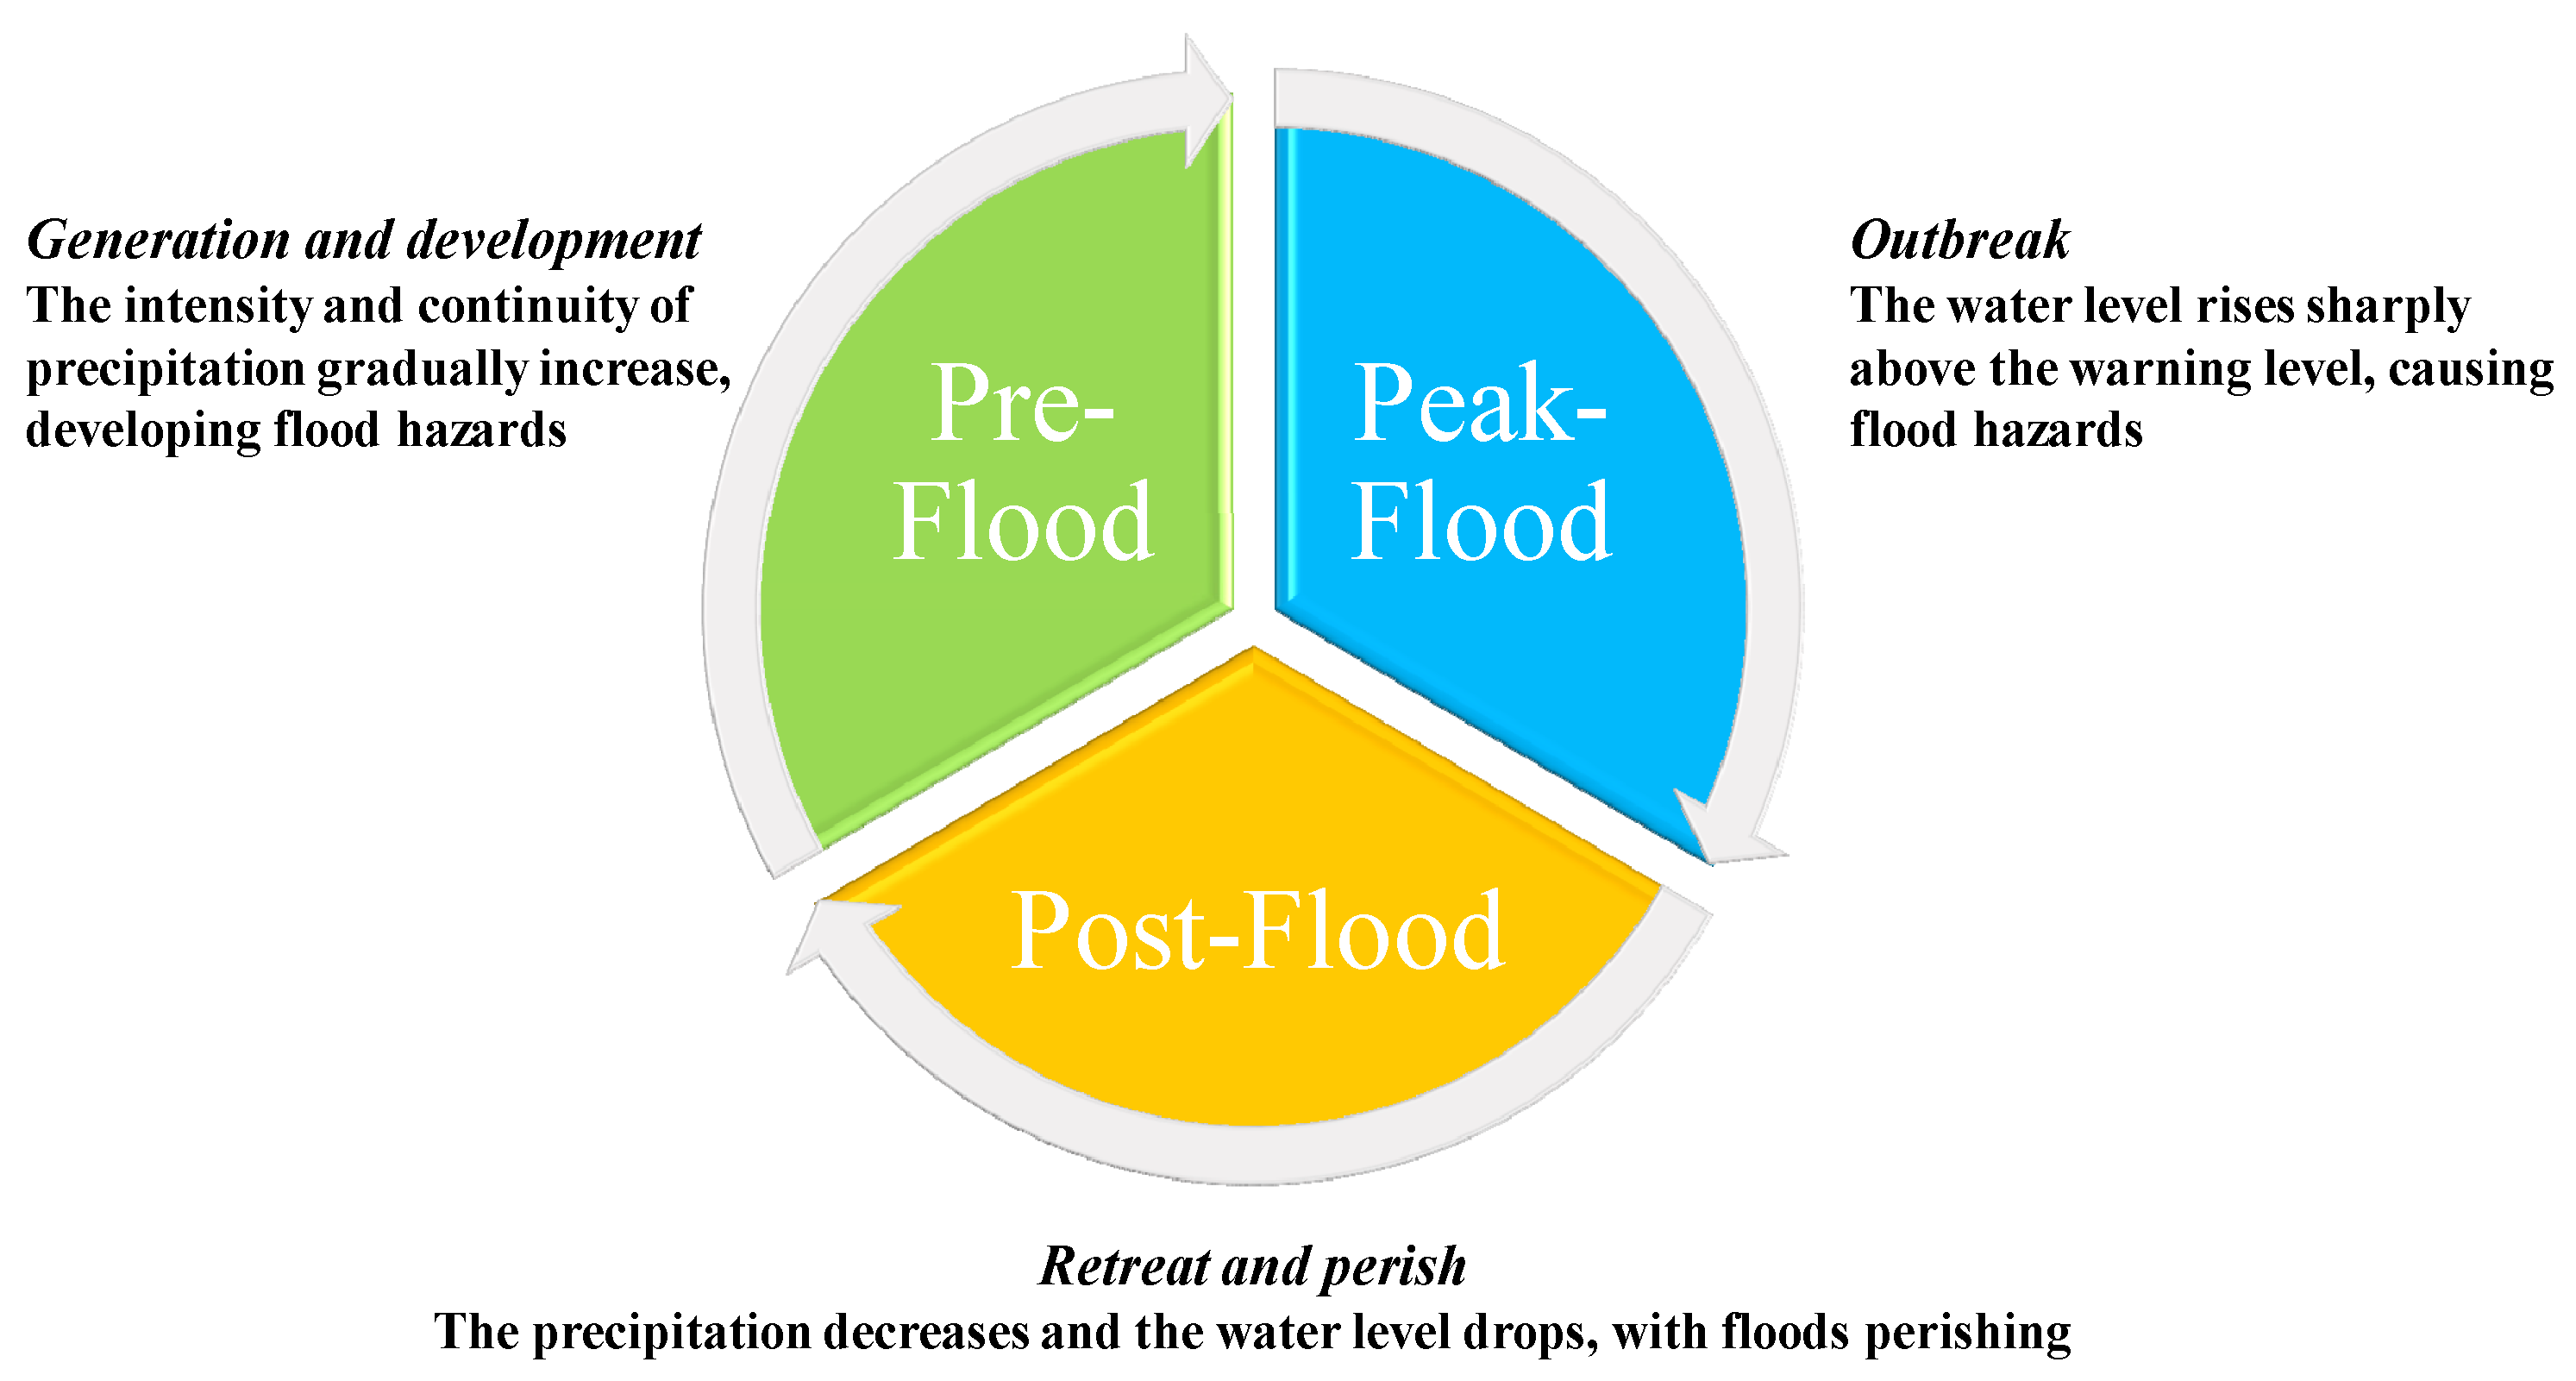
4.2. Flood Full Lifecycle Model

In this article, for the purpose of exploring the evolution patterns and characteristics of floods during different periods, the flood full lifecycle model is innovatively proposed. Based on this model, a novel study was conducted on the entire evolution process of the drought-converted catastrophic flood in the Poyang Lake region during summer 2020. As mentioned in the introduction, previous studies focused more on peak flood periods instead of the full lifecycle, which leads to little knowledge about floods. Through the monitoring of the flood using Sentinel-1 SAR, we divided the full lifecycle of floods into three periods, Pre-Flood, Peak-Flood, and Post-Flood, according to the entire processes and the characteristics of hazards.
As displayed in Figure 12, in the Pre-Flood period, floods generate and develop gradually. At this stage, precipitation increases gradually, and then its intensity and continuity rise over time, which brings adequate water to lakes and rivers, laying great hidden dangers for floods. In the Peak-Flood period, with more sustained heavy precipitation, the water levels of rivers and lakes rise sharply, exceeding the warning water level for a time. Meanwhile, the river flow continues to increase, causing the lake’s water storage to exceed the normal level, leading to the outbreak of floods. Usually, this stage lasts for a long period. However, in the Post-Flood period, the amount and intensity of precipitation decrease dramatically, while the water level drops below the warning level, leading to floods retreating. Finally, the water storage of lakes and rivers returns to normal conditions, marking the recession of floods.

4.3. Drought-Converted Flood with Its Prevention and Mitigation

It was in 2020 that Poyang Lake suffered the most serious flood since 1998, with a maximum daily precipitation of 149.6 mm and a maximum water level of 22.43 m, whereas, different from the 1998 flood, the 2020 flood was abruptly converted from a relative drought state. Taking this flood event as a typical case, this article carries out a detailed discussion about drought-converted floods to provide disaster prevention and mitigation strategies.
As mentioned in the relevant references [37,55], drought-to-flood events in the Poyang Lake region are more and more frequent in the context of global warming. It is not enough to only focus on the flood event itself to explore its outbreak mechanism and evolution patterns. In terms of the full lifecycle model, drought may occur in the Pre-Flood and Post-Flood periods. In the Pre-Flood period of the 2020 flood event, a short-lived drought happened because of less precipitation. However, speedily, abnormal sustained heavy precipitation led to the outbreak of a catastrophic flood in the Peak-Flood period. Particularly, precipitation brought more water to the lake in this drought-converted flood than a pure flood event, which resulted in a higher water level and more water flow. What is worse, this type of drought-converted flood has more damaging power. For this reason, it is high time that prevention and mitigation strategies based on characteristics during different stages of the full lifecycle should be taken.
It is important to strengthen the monitoring of the early warning of water levels and precipitation in the Pre-Flood stage, since the sharp rise in water level and heavy rainfall are important factors of flood hazards. In this article, flood inundation models were established based on long-term Sentinel-1 SAR images and water level data, which can serve for flood prediction in disaster management. The real-time water level data monitored by the hydrological stations can be substituted into the models to predict the corresponding lake area, judging the possibility of flooding. Even drought disasters are worth precautions. In the Peak-Flood stage, it is important to enhance the monitoring of floods to predict the risks and damages of floods. The timely transfer of affected residents and their property in the disaster zone can minimize casualties. In the Post-Flood stage, although floods perish, many measures are expected to be adopted to guard against potential floods; for example, improving the conservation of water and soil, effectively increasing the vegetation coverage rate in the watershed, and vigorously promoting tree planting and afforestation to protect cropland. In addition, promoting the construction of flood disaster prevention projects is an effective action. Research [58,59] indicates that the construction of reservoirs, flood control embankments, and river dredging can effectively prevent and decrease the occurrence of floods.

5. Conclusions

In this article, a study that applied Sentinel-1 SAR to monitor the drought-converted catastrophic flood in the Poyang Lake region during summer 2020 is presented. To this end, the flood full lifecycle model was proposed to study the outbreak mechanism and entire evolution patterns of this drought-converted flood, which is in favor of cause analysis and damage assessment.
The key takeaways of this work can be concluded as follows: (1) Considering the requirements of full lifecycle monitoring for high spatial–temporal resolution and all-day and all-weather working capabilities, Sentinel-1 SAR data were utilized to efficiently extract flood inundation mapping based on the bimodal threshold algorithm. Verified with optical data, the result demonstrated that the flood areas extracted using Sentinel-1 SAR are highly reliable, with a minimum error of only 0.18%. Thus, employing 61 images of Sentinel-1 SAR, the inundation area sequences were created to monitor the full lifecycle of the flood in 2020, indicating three characteristics: rapid water rising, wide inundated range, and slow water retreat. In the Pre-Flood period, Poyang Lake was in a relative drought state with the minimum area of 1368.77 km² (3 May). By contrast, the lake area reached the maximum value of 4077.12 km² (14 July) in the Peak-Flood period and remained above 3000 km² from July to October. In the Post-Flood period (early October), water began to retreat, and the flood perished gradually. In addition, flood inundation models that reflect the water level–area change relationship were established, achieving near-real-time monitoring. (2) In terms of hydrological and meteorological analysis, while there was insufficient water in the Pre-Flood period, increasingly sustained heavy rainfalls and rapidly rising water levels from May to July triggered a conversion from drought to flood. The average water level during the flood in 2020 was at least 17% higher than that in the previous decade, with the maximum water level being even higher. Simultaneously, the water volume increased by approximately 44.13 billion m3 in the Peak-Flood period, which is an increase of 4.36 times compared with that of the Pre-Flood period. Even in the dry seasons of previous years such as September and October, the water level in 2020 was still above 30% higher. In addition, the precipitation from June to September in 2020 was significantly higher than the average of the previous decade, with the most prominent precipitation difference in July and September (2.39 times and 2.77 times that of previous years, respectively). (3) In damage assessment, the inundated areas of various land types during three periods of the full lifecycle were calculated using GIS-based techniques. The catastrophic flood inundated a lot of land, especially in the Peak-Flood period, while it was relatively attenuated in the Post-Flood period, which resulted in tremendous inundation: cropland (1375.67 km2), impervious surface (23.27 km2), grassland (22.95 km2), wetland (20.17 km2), forest (9.58 km2).
Despite the fact that this study was oriented in the Poyang Lake region, the summarized methods and technical routes using SAR data to monitor the flood’s full lifecycle can be used for reference in flood studies in other floodplains. Meanwhile, paying attention to the sharp turn from drought to flood events broadens the field of flood research. In prospective work, multi-source data methods that combine SAR with optical data would be applied to increase the time density of flood monitoring and bring the superiority of various data into full play. Simultaneously, hydrodynamic models would be introduced to simulate the continuous evolution and accurate forecast of floods, which could achieve better near-real-time monitoring of the full lifecycle of floods.

Author Contributions

Conceptualization and methodology, J.L.; data collection, H.Y., Q.F., H.W., Z.Z., Y.W. and J.L.; data process, H.Y., Q.F. and H.W; data analysis, H.Y., Q.F., H.W., Z.Z. and Y.W.; writing—original draft preparation, H.Y., Q.F., H.W., Z.Z. and Y.W; writing—review and editing, H.Y., Y.W. and J.L.; visualization, H.W.; supervision, J.L. All authors have read and agreed to the published version of the manuscript.

Funding

This work was funded by the National Key Research and Development Program (2018YFC1506506), the Frontier Project of Applied Foundation of Wuhan (2019020701011502), the Key Research and Development Program of Jiangxi Province (20201BBG71002), the National College Student Innovation and Entrepreneurship Training Program (202010486005), and the LIESMARS Special Research Funding.

Data Availability Statement

Sentinel-1 SAR data are available at https://scihub.copernicus.eu/dhus/#/home accessed on 1 June 2021. Water level data are available at http://slt.jiangxi.gov.cn accessed on 1 June 2021. Daily rainfall data are available at http://data.cma.cn accessed on 1 June 2021. Land use cover data and DEM data are available at http://www.geodata.cn accessed on 1 June 2021.

Acknowledgments

We acknowledge data support from Sentinels Scientific Data Hub (https://scihub.copernicus.eu accessed on 1 June 2021), “National Earth System Science Data Center, National Science & Technology Infrastructure of China (http://www.geodata.cn accessed on 1 June 2021)”, and so on. All authors are sincerely grateful to anonymous reviewers and editors for their insightful comments.

Conflicts of Interest

The authors declare no conflict of interest.

References

  1. Sajjad, A.; Lu, J.; Chen, X.; Chisenga, C.; Mahmood, S. The Riverine Flood Catastrophe in August 2010 in South Punjab, Pakistan: Potential Causes, Extent and Damage Assessment. Appl. Ecol. Environ. Res. 2019, 17, 14121–14142. [Google Scholar] [CrossRef]
  2. Ward, P.J.; Jongman, B.; Weiland, F.S.; Bouwman, A.; Van Beek, R.; Bierkens, M.F.; Ligtvoet, W.; Winsemius, H.C. Assessing flood risk at the global scale: Model setup, results, and sensitivity. Environ. Res. Lett. 2013, 8, 044019. [Google Scholar] [CrossRef]
  3. Hammond, M.; Chen, A.; Djordjević, S.; Butler, D.; Mark, O. Urban flood impact assessment: A state-of-the-art review. Urban Water J. 2015, 12, 14–29. [Google Scholar] [CrossRef] [Green Version]
  4. Tate, E.; Strong, A.; Kraus, T.; Xiong, H. Flood recovery and property acquisition in Cedar Rapids, Iowa. Nat. Hazards 2016, 80, 2055–2079. [Google Scholar] [CrossRef] [Green Version]
  5. Qiu, J.; Cao, B.; Park, E.; Yang, X.; Zhang, W.; Tarolli, P. Flood Monitoring in Rural Areas of the Pearl River Basin (China) Using Sentinel-1 SAR. Remote Sens. 2021, 13, 1384. [Google Scholar] [CrossRef]
  6. Liang, D.; Lu, J.; Chen, X.; Liu, C.; Lin, J. An investigation of the hydrological influence on the distribution and transition of wetland cover in a complex lake–floodplain system using time-series remote sensing and hydrodynamic simulation. J. Hydrol. 2020, 587, 125038. [Google Scholar] [CrossRef]
  7. Refice, A.; D’Addabbo, A.; Capolongo, D. Methods, Techniques and Sensors for Precision Flood Monitoring Through Remote Sensing. In Flood Monitoring through Remote Sensing; Refice, A., D’Addabbo, A., Capolongo, D., Eds.; Springer International Publishing: Cham, Switzerland, 2018; pp. 1–25. [Google Scholar]
  8. Sanyal, J.; Lu, X.X. Application of Remote Sensing in Flood Management with Special Reference to Monsoon Asia: A Review. Nat. Hazards 2004, 33, 283–301. [Google Scholar] [CrossRef]
  9. Haq, M.; Akhtar, M.; Muhammad, S.; Paras, S.; Rahmatullah, J. Techniques of Remote Sensing and GIS for flood monitoring and damage assessment: A case study of Sindh province, Pakistan. Egypt. J. Remote Sens. Space Sci. 2012, 15, 135–141. [Google Scholar] [CrossRef] [Green Version]
  10. Psomiadis, E.; Soulis, K.X.; Zoka, M.; Dercas, N. Synergistic Approach of Remote Sensing and GIS Techniques for Flash-Flood Monitoring and Damage Assessment in Thessaly Plain Area, Greece. Water 2019, 11, 448. [Google Scholar] [CrossRef] [Green Version]
  11. Sajjad, A.; Lu, J.; Chen, X.; Chisenga, C.; Saleem, N.; Hassan, H. Operational Monitoring and Damage Assessment of Riverine Flood-2014 in the Lower Chenab Plain, Punjab, Pakistan, Using Remote Sensing and GIS Techniques. Remote Sens. 2020, 12, 714. [Google Scholar] [CrossRef] [Green Version]
  12. Faisal, A.; Kafy, A.; Roy, S. Integration of remote sensing and GIS techniques for flood monitoring and damage assessment: A case study of naogaon district. Bangladesh J. Remote Sens. GIS 2018, 7, 2. [Google Scholar] [CrossRef]
  13. Lin, L.; Di, L.; Yu, E.G.; Kang, L.; Shrestha, R.; Rahman, S.; Tang, J.; Deng, M.; Sun, Z.; Zhang, C.; et al. A review of remote sensing in flood assessment. In Proceedings of the 2016 Fifth International Conference on Agro-Geoinformatics (Agro-Geoinformatics), Tianjin, China, 18–20 July 2016; pp. 1–4. [Google Scholar]
  14. Sakamoto, T.; Van Nguyen, N.; Kotera, A.; Ohno, H.; Ishitsuka, N.; Yokozawa, M. Detecting temporal changes in the extent of annual flooding within the Cambodia and the Vietnamese Mekong Delta from MODIS time-series imagery. Remote Sens. Environ. 2007, 109, 295–313. [Google Scholar] [CrossRef]
  15. Boschetti, M.; Nutini, F.; Manfron, G.; Brivio, P.A.; Nelson, A. Comparative Analysis of Normalised Difference Spectral Indices Derived from MODIS for Detecting Surface Water in Flooded Rice Cropping Systems. PLoS ONE 2014, 9, e88741. [Google Scholar] [CrossRef]
  16. Sianturi, R.; Jetten, V.; Sartohadi, J. Mapping cropping patterns in irrigated rice fields in West Java: Towards mapping vulnerability to flooding using time-series MODIS imageries. Int. J. Appl. Earth Obs. Geoinf. 2018, 66, 1–13. [Google Scholar] [CrossRef]
  17. Dao, P.D.; Liou, Y.-A. Object-Based Flood Mapping and Affected Rice Field Estimation with Landsat 8 OLI and MODIS Data. Remote Sens. 2015, 7, 5077–5097. [Google Scholar] [CrossRef] [Green Version]
  18. Tong, X.; Luo, X.; Liu, S.; Xie, H.; Chao, W.; Liu, S.; Liu, S.; Makhinov, A.; Makhinova, A.; Jiang, Y. An approach for flood monitoring by the combined use of Landsat 8 optical imagery and COSMO-SkyMed radar imagery. ISPRS J. Photogramm. Remote Sens. 2018, 136, 144–153. [Google Scholar] [CrossRef]
  19. Lei, S.; Wu, D.; Li, Y.; Wang, Q.; Huang, C.; Liu, G.; Zheng, Z.; Du, C.; Mu, M.; Xu, J.; et al. Remote sensing monitoring of the suspended particle size in Hongze Lake based on GF-1 data. Int. J. Remote Sens. 2018, 40, 3179–3203. [Google Scholar] [CrossRef]
  20. Yang, N.; Li, J.; Mo, W.; Luo, W.; Wu, D.; Gao, W.; Sun, C. Water depth retrieval models of East Dongting Lake, China, using GF-1 multi-spectral remote sensing images. Glob. Ecol. Conserv. 2020, 22, e01004. [Google Scholar] [CrossRef]
  21. Yang, S.; He, H.; Chen, W.; Wang, L. Direct tangible damage assessment for regional snowmelt flood disasters with HJ-1 and HR satellite images: A case study of the Altay region, northern Xinjiang, China. Nat. Hazards 2018, 94, 1099–1116. [Google Scholar] [CrossRef]
  22. Liu, H.; Zheng, L.; Jiang, L.; Liao, M. Forty-year water body changes in Poyang Lake and the ecological impacts based on Landsat and HJ-1 A/B observations. J. Hydrol. 2020, 589, 125161. [Google Scholar] [CrossRef]
  23. Ramsey, E.; Lu, Z.; Suzuoki, Y.; Rangoonwala, A.; Werle, D. Monitoring Duration and Extent of Storm-Surge and Flooding in Western Coastal Louisiana Marshes With Envisat ASAR Data. IEEE J. Sel. Top. Appl. Earth Obs. Remote Sens. 2011, 4, 387–399. [Google Scholar] [CrossRef]
  24. Singh, Y.; Ferrazzoli, P.; Rahmoune, R. Flood monitoring using microwave passive remote sensing (AMSR-E) in part of the Brahmaputra basin, India. Int. J. Remote Sens. 2013, 34, 4967–4985. [Google Scholar] [CrossRef]
  25. Zeng, L.; Schmitt, M.; Li, L.; Zhu, X.X. Analysing changes of the Poyang Lake water area using Sentinel-1 synthetic aperture radar imagery. Int. J. Remote Sens. 2017, 38, 7041–7069. [Google Scholar] [CrossRef] [Green Version]
  26. Yesou, H.; Huber, C.; Haouet, S.; Lai, X.; Huang, S.; De Fraipont, P.; Desnos, Y.L. Exploiting Sentinel 1 time series to monitor the largest fresh water bodies in PR China, the Poyang Lake. In Proceedings of the 2016 IEEE International Geoscience and Remote Sensing Symposium (IGARSS), Beijing, China, 10–15 July 2016; pp. 3882–3885. [Google Scholar]
  27. Yesou, H.; Pottier, E.; Mercier, G.; Grizonnet, M.; Haouet, S.; Giros, A.; Faivre, R.; Huber, C.; Michel, J. Synergy of Sentinel-1 and Sentinel-2 imagery for wetland monitoring information extraction from continuous flow of sentinel images applied to water bodies and vegetation mapping and monitoring. In Proceedings of the 2016 IEEE International Geoscience and Remote Sensing Symposium (IGARSS), Beijing, China, 10–15 July 2016; pp. 162–165. [Google Scholar]
  28. Li, J.; Wang, C.; Xu, L.; Wu, F.; Zhang, H.; Zhang, B. Multitemporal Water Extraction of Dongting Lake and Poyang Lake Based on an Automatic Water Extraction and Dynamic Monitoring Framework. Remote Sens. 2021, 13, 865. [Google Scholar] [CrossRef]
  29. Singha, M.; Dong, J.; Sarmah, S.; You, N.; Zhou, Y.; Zhang, G.; Doughty, R.; Xiao, X. Identifying floods and flood-affected paddy rice fields in Bangladesh based on Sentinel-1 imagery and Google Earth Engine. ISPRS J. Photogramm. Remote Sens. 2020, 166, 278–293. [Google Scholar] [CrossRef]
  30. Zhang, X.; Chan, N.W.; Pan, B.; Ge, X.; Yang, H. Mapping flood by the object-based method using backscattering coefficient and interference coherence of Sentinel-1 time series. Sci. Total Environ. 2021, 794, 148388. [Google Scholar] [CrossRef] [PubMed]
  31. Xue, X.; Di, L.; Guo, L.; Lin, L. An efficient classification method of fully polarimetric SAR image based on polarimetric features and spatial features. In Proceedings of the 2015 Fourth International Conference on Agro-Geoinformatics (Agro-geoinformatics), Istanbul, Turkey, 20–24 July 2015; pp. 327–331. [Google Scholar]
  32. Toté, C.; Patricio, D.; Boogaard, H.; Van Der Wijngaart, R.; Tarnavsky, E.; Funk, C. Evaluation of Satellite Rainfall Estimates for Drought and Flood Monitoring in Mozambique. Remote Sens. 2015, 7, 1758–1776. [Google Scholar] [CrossRef] [Green Version]
  33. Feng, G.; Yang, H.; Zhang, S.; Wang, K.; Shen, B. A Preliminary Research on the Reason of a Sharp Turn from Drought to Flood in the Middle and Lower Reaches of the Yangtze River in Late Spring and Early Summer of 2011. Chin. J. Atmos. Sci. 2012, 36, 1009–1026. [Google Scholar]
  34. Wang, R.; Li, X.; Xue, C.; Zhang, D. Spatio-temporal variations of the drought-flood abrupt alternation events in the Lake Poyang Basin from 1960 to 2012. J. Lake Sci. 2020, 32, 207–222. [Google Scholar]
  35. Yang, J.; Chen, H.; Hou, Y.; Zhao, Y.; Chen, Q.; Xu, C.; Chen, J. A method to identify the drought-flood transition based on the meteorological drought index. Acta Geogr. Sin. 2019, 74, 2358–2370. [Google Scholar] [CrossRef]
  36. Xue, J.-B.; Wang, X.-Y.; Zhang, L.-J.; Hao, Y.-W.; Chen, Z.; Lin, D.-D.; Xu, J.; Xia, S.; Li, S.-Z. Potential impact of flooding on schistosomiasis in Poyang Lake regions based on multi-source remote sensing images. Parasites Vect. 2021, 14, 1–13. [Google Scholar] [CrossRef]
  37. Shan, L.; Zhang, L.; Song, J.; Zhang, Y.; She, D.; Xia, J. Characteristics of dry-wet abrupt alternation events in the middle and lower reaches of the Yangtze River Basin and the relationship with ENSO. J. Geogr. Sci. 2018, 28, 1039–1058. [Google Scholar] [CrossRef] [Green Version]
  38. Zhang, P.; Lu, J.; Feng, L.; Chen, X.; Zhang, L.; Xiao, X.; Liu, H. Hydrodynamic and Inundation Modeling of China’s Largest Freshwater Lake Aided by Remote Sensing Data. Remote Sens. 2015, 7, 4858–4879. [Google Scholar] [CrossRef] [Green Version]
  39. Zhou, H.; Luo, Z.; Tangdamrongsub, N.; Zhou, Z.; He, L.; Xu, C.; Li, Q.; Wu, Y. Identifying Flood Events over the Poyang Lake Basin Using Multiple Satellite Remote Sensing Observations, Hydrological Models and In Situ Data. Remote Sens. 2018, 10, 713. [Google Scholar] [CrossRef] [Green Version]
  40. Zhang, Y.; Gong, J.; Sun, K.; Yin, J.; Chen, X. Estimation of Soil Moisture Index Using Multi-Temporal Sentinel-1 Images over Poyang Lake Ungauged Zone. Remote Sens. 2017, 10, 12. [Google Scholar] [CrossRef] [Green Version]
  41. Zhang, Q.; Ye, X.-C.; Werner, A.; Li, Y.-L.; Yao, J.; Li, X.; Xu, C.-Y. An investigation of enhanced recessions in Poyang Lake: Comparison of Yangtze River and local catchment impacts. J. Hydrol. 2014, 517, 425–434. [Google Scholar] [CrossRef] [Green Version]
  42. Huang, F.; Chunyu, X.; Wang, Y.; Zhang, X.; Qian, B.; Zhao, D.; Xia, Z. Impacts of Streamflow and Topographic Changes on Water Level during the Dry Season of Poyang Lake, China. J. Hydrol. Eng. 2020, 25, 05020001. [Google Scholar] [CrossRef]
  43. Shankman, D.; Keim, B.D.; Song, J. Flood frequency in China’s Poyang Lake region: Trends and teleconnections. Int. J. Clim. 2006, 26, 1255–1266. [Google Scholar] [CrossRef] [Green Version]
  44. Shankman, D.; Liang, Q. Landscape Changes and Increasing Flood Frequency in China’s Poyang Lake Region. Prof. Geogr. 2003, 55, 434–445. [Google Scholar] [CrossRef]
  45. Geudtner, D.; Torres, R.; Snoeij, P.; Davidson, M.; Rommen, B. Sentinel-1 System capabilities and applications. In Proceedings of the 2014 IEEE Geoscience and Remote Sensing Symposium, Quebec City, QC, Canada, 13–18 July 2014; pp. 1457–1460. [Google Scholar] [CrossRef]
  46. Torres, R.; Snoeij, P.; Geudtner, D.; Bibby, D.; Davidson, M.; Attema, E.; Potin, P.; Rommen, B.; Floury, N.; Brown, M.; et al. GMES Sentinel-1 mission. Remote Sens. Environ. 2012, 120, 9–24. [Google Scholar] [CrossRef]
  47. Twele, A.; Cao, W.; Plank, S.; Martinis, S. Sentinel-1-based flood mapping: A fully automated processing chain. Int. J. Remote Sens. 2016, 37, 2990–3004. [Google Scholar] [CrossRef]
  48. Conde, F.C.; Muñoz, M.D.M. Flood Monitoring Based on the Study of Sentinel-1 SAR Images: The Ebro River Case Study. Water 2019, 11, 2454. [Google Scholar] [CrossRef] [Green Version]
  49. Cao, H.; Zhang, H.; Wang, C.; Zhang, B. Operational Flood Detection Using Sentinel-1 SAR Data over Large Areas. Water 2019, 11, 786. [Google Scholar] [CrossRef] [Green Version]
  50. Xia, S.; Ruan, R.; Yan, M.; She, Y. Extraction of Hongze Lake Reclamation Area Based on RADARSAT SAR and LANDSAT ETM. In 2011 3rd International Conference on Environmental Science and Information Application Technology Esiat 2011; Wu, Y., Ed.; Procedia Environmental Sciences; Elsevier: Amsterdam, The Netherlands, 2011; Volume 10, Pt C; pp. 2294–2300. [Google Scholar]
  51. Hong, S.; Jang, H.; Kim, N.; Sohn, H.-G. Water Area Extraction Using RADARSAT SAR Imagery Combined with Landsat Imagery and Terrain Information. Sensors 2015, 15, 6652–6667. [Google Scholar] [CrossRef]
  52. Zhang, J.; Hu, J. Image Segmentation Based on 2D Otsu Method with Histogram Analysis. In Proceedings of the 2008 International Conference on Computer Science and Software Engineering, Wuhan, China, 12–14 December 2008; Volume 6, pp. 105–108. [Google Scholar]
  53. Simon, R.; Tormos, T.; Danis, P. Geographic object based image analysis using very high spatial and temporal resolution radar and optical imagery in tracking water level fluctuations in a freshwater reservoir. South-East. Eur. J. Earth Obs. Geomat. 2014, 3, 287–291. [Google Scholar]
  54. Dong, Z.; Wang, G.; Amankwah, S.O.Y.; Wei, X.; Hu, Y.; Feng, A. Monitoring the summer flooding in the Poyang Lake area of China in 2020 based on Sentinel-1 data and multiple convolutional neural networks. Int. J. Appl. Earth Obs. Geoinf. 2021, 102, 102400. [Google Scholar] [CrossRef]
  55. Feng, L.; Hu, C.; Chen, X.; Cai, X.; Tian, L.; Gan, W. Assessment of inundation changes of Poyang Lake using MODIS observations between 2000 and 2010. Remote Sens. Environ. 2012, 121, 80–92. [Google Scholar] [CrossRef]
  56. Gupta, H.V.; Kling, H. On typical range, sensitivity, and normalization of Mean Squared Error and Nash-Sutcliffe Efficiency type metrics. Water Resour. Res. 2011, 47. [Google Scholar] [CrossRef]
  57. McKee, T.B.; Doesken, N.J.; Kleist, J. The relationship of drought frequency and duration to time scales. In Proceedings of the 8th Conference on Applied Climatology, Boston, MA, USA, 17–22 January 1993; Volume 17, pp. 179–183. [Google Scholar]
  58. Sudheer, K.P.; Bhallamudi, S.M.; Narasimhan, B.; Thomas, J.; Bindhu, V.M.; Vema, V.K.; Kurian, C. Role of Dams on the Floods of August 2018 in Periyar River Basin, Kerala. Curr. Sci. 2019, 116, 780–794. [Google Scholar] [CrossRef]
  59. Tortajada, C. Dams: An Essential Component of Development. J. Hydrol. Eng. 2015, 20. [Google Scholar] [CrossRef] [Green Version]
Figure 1. Schematic diagram of the study area with selected hydrological stations and meteorological stations. (Background is based on Landsat-8 OLI image acquired on 8 October 2020, band 5,4,3 for RGB in false color synthesis.).
Remotesensing 13 03485 g001
Figure 2. Different imaging extents of Sentinel-1 in the Poyang Lake region. (a) Imaging range of Sentinel-1 A; (b) Imaging range of Sentinel-1 B.
Remotesensing 13 03485 g002
Figure 3. Methodological framework of flood study using Sentinel-1 SAR to monitor full lifecycle, explore potential causes, and assess damage.
Remotesensing 13 03485 g003
Figure 4. The perfect bimodal distribution in the histogram of Sentinel-1 SAR image captured on 3 May 2020. (The threshold T is −24.23 dB).
Remotesensing 13 03485 g004
Figure 5. Three sets of quantitative validation results of Sentinel-1 SAR data and Landsat-8 OLI data.
Remotesensing 13 03485 g005
Figure 6. Sequence diagram of temporal and spatial variations of Poyang Lake flood during flooding season based on Sentinel-1 SAR (selected from 3 May to 30 October in 2020).
Remotesensing 13 03485 g006
Figure 7. Comparison of the average daily water levels at Hukou Station and Poyang Station from May to October 2020 and the same period from 2010 to 2019.
Remotesensing 13 03485 g007
Figure 8. Linear regression models of flood inundation reflecting the relationship between water level and lake area.
Remotesensing 13 03485 g008
Figure 9. Values of SPI in 2020 and comparison of monthly average precipitation throughout the year at Boyang Station between 2020 and mean from 2010 to 2019.
Remotesensing 13 03485 g009
Figure 10. Flood inundated states during different periods. (a) Inundation in the Pre-Flood period, 3 May; (b) Inundation in the Peak-Flood period, 14 July; (c) Inundation in the Post-Flood period, 5 November.
Remotesensing 13 03485 g010
Figure 11. Variations in different land types’ areas in Pre-Flood, Peak-Flood, and Post-Flood periods.
Remotesensing 13 03485 g011
Figure 12. The different stages of the full lifecycle of flood hazards with main characteristics.
Remotesensing 13 03485 g012
Table 1. Detailed information of Sentinel-1 images used in the study.
SatelliteProduct LevelProduct TypeInstrument ModePolarizationStart Relative
Orbit
Stop Relative
Orbit
Sentinel-1 ALevel-1GRDIWVV, VH4040
Sentinel-1 BLevel-1GRDIWVV, VH4040
Table 2. Comparison of the maximum and minimum water level at Hukou Station between 2020 and previous years (unit: m).
MonthMaximumMinimum
Previous2020Previous2020
May17.7612.158.4211.12
June19.9117.659.9012.22
July21.3022.4313.5917.85
August20.0221.0912.8818.94
September17.0018.959.7917.30
October15.8317.918.0015.23
Publisher’s Note: MDPI stays neutral with regard to jurisdictional claims in published maps and institutional affiliations.

