Article

Solar Resource Potentials and Annual Capacity Factor Based on the Korean Solar Irradiance Datasets Derived by the Satellite Imagery from 1996 to 2019

New and Renewable Energy Map Laboratory, Korea Institute of Energy Research, Daejeon 34129, Korea
*
Author to whom correspondence should be addressed.
Remote Sens. 2021, 13(17), 3422; https://doi.org/10.3390/rs13173422
Submission received: 21 July 2021 / Revised: 24 August 2021 / Accepted: 27 August 2021 / Published: 28 August 2021
(This article belongs to the Special Issue Remote Sensing for Green Energy Development)

Abstract

:
The Korea Institute of Energy Research builds Korean solar irradiance datasets, using gridded solar insolation estimates derived using the University of Arizona solar irradiance based on Satellite–Korea Institute of Energy Research (UASIBS–KIER) model, with the incorporation of geostationary satellites over the Korean Peninsula, from 1996 to 2019. During the investigation period, the monthly mean of daily total irradiance was in a good agreement with the in situ measurements at 18 ground stations; the mean absolute error is also normalized to 9.4%. It is observed that the irradiance estimates in the datasets have been gradually increasing at a rate of 0.019 kWh m−2 d−1 per year. The monthly variation in solar irradiance indicates that the meteorological conditions in the spring season dominate the annual solar insolation. In addition, the local distribution of solar irradiance is primarily affected by the geographical environment; higher solar insolation is observed in the southern part of Korea, but lower solar insolation is observed in the mountainous range in Korea. The annual capacity factor is the secondary output from the Korean solar irradiance datasets. The reliability of the estimate of this factor is proven by the high correlation coefficient of 0.912. Thus, in accordance with the results from the spatial distribution of solar irradiance, the southern part of Korea is an appropriate region for establishing solar power plants exhibiting a higher annual capacity factor than the other regions.

1. Introduction

The long-term variability in solar resources in space and time has been considered as a crucial factor in the life cycle of solar power systems, including installation, deployment, and operation (e.g., [1,2,3,4,5,6]). The analysis of long-term in situ measurements by a pyranometer can help to understand the climatological variability in solar irradiance, due to the higher accuracy and reliability of the observations compared to remote sensing techniques [7,8]. Ground observations, however, are still limited in their ability to retrieve the spatial distribution of solar insolation and further investigate solar energy potentials at a regional or national scale. Consequently, remote sensing techniques have been considered as an alternative approach for understanding the climatological characteristics of solar insolation (e.g., [9,10,11,12,13]). The International Satellite Cloud Climatology Project (ISCCP), initiated in July 1983, is an international collaborative program set up to determine the parameters of cloud microphysics, as well as downwelling surface shortwave radiation [9,10]. The National Renewable Energy Laboratory (NREL) has developed the national solar radiation database (NSRDB) that includes meteorological elements, as well as solar irradiance data, over the United States for the last two decades [12]. The current version of the NSRDB contains gridded datasets at 4 km resolution, which has been developed using the physical solar model (PSM) with geostationary operational environmental satellite (GOES) data. Thus, there are several ways to understand the long-term variability in solar irradiance based on satellite imagery.
The empirical parameterization between satellite imagery and ground observation is the simplest way to derive solar irradiance [14,15]. However, Noia et al. [16] pointed out that the relationship between visible reflectance at the top of the atmosphere and downwelling shortwave radiation at the surface is significantly affected by the meteorological conditions at the local and regional scales; therefore, the relationship cannot be generalized for building a solar resource map. Contrary to the empirical parameterization, the direct solution of the radiative transfer model is the most reliable method for estimating solar irradiance. However, the computation cost is too high to derive the solar irradiance in real time. To resolve the numerical burden of deriving solar irradiance with high reliability, a lookup table technique has been widely employed in remote sensing (e.g., [17,18,19,20,21,22,23]). For example, Pinker et al. [21] derived the solar irradiance over the continental U.S., utilizing the University of Maryland shortwave radiation budget (UMD/SRB) model that implements GOES-8 data. More recently, Kim et al. [24] estimated the downwelling surface shortwave radiation over the southwestern U.S., including Arizona, Western New Mexico, Southern California, and Southern Nevada, using the visible reflectance and brightness temperatures from the GOES-15 that can be monitored in the atmospheric state at 135° W for 24 h each day.
In addition to studies that derived solar irradiance over the United States, several attempts have been made to derive solar irradiance over Latin America, Africa, Europe, Australia, and Asia, using geostationary satellites. Deneke et al. [25] estimated the solar irradiance over the Netherlands, using METEOSAT data. Furthermore, their estimates were extended towards solar resource assessment in Benelux countries, made by Journée et al. [26]. In Greece, a series of studies have been conducted to estimate solar resources based on METEOSAT imagery [27,28]. Geostationary satellites, operated by the Japanese Meteorological Agency (JMA), have historically been employed to assess solar irradiance over Asia and Australia. The geostationary meteorological satellite (GMS) series is a pioneer in this region, for the development of meteorological satellites. Tanahashi et al. [29] presented an improved algorithm for estimating the hourly mean insolation over Japan for GMS data. The solar resource map of developing countries in Southeast Asia was developed by Janjai et al. [30], who resolved the physical radiation model using GMS imagery. Lu et al. [31] created a look-up table by incorporating a spectral radiative transfer model, called SBDART, and then retrieved the solar irradiance by comparing the surface reflectance and atmospheric parameters. The multifunction transport satellite (MTSAT) is the next-generation satellite on the GMS platform. The spectral bands of the remote sensor onboard the MTSAT were significantly improved. Consecutive studies have been performed, as new satellites with embedded instruments have become technically progressive (e.g., [32,33,34]).
Yeom et al. [35] implemented a simple radiative transfer model to generate solar irradiance over the Korean Peninsula, using the communication, ocean, and meteorological satellite (COMS) geostationary satellite, operated by the Korea Meteorological Administration (KMA) [35]. Since then, several attempts have been made to raise the accuracy of satellite estimates (e.g., [36,37,38]). The Korea Institute of Energy Research (KIER) has developed the University of Arizona Solar Irradiance Based on Satellite (UASIBS)–KIER model to assimilate COMS imagery [39]. During the evaluation of the global horizontal irradiance (GHI) at the instantaneous time scale, the UASIBS–KIER model yielded relative root mean square errors of 7.4% and 16.7% on clear and cloudy skies, respectively. In December 2018, KMA launched the second generation of the COMS, which is called Geo–KOMPSAT 2A (GK–2A); therefore, the UASIBS–KIER model has also been modified to employ the GK–2A level-1B data. The modeling performance has increased with improved spectral bands and spatial resolution [40]. However, though innumerable efforts have been made to derive solar irradiance in Korea, there are no reliable freely available long-term datasets of solar irradiance. The KIER has completed the Korean solar irradiance datasets at 1 km × 1 km grid cells from January 2012 to July 2020, and now they are available by the public data portal in Korea [41]. Therefore, the present study aims to introduce the derivation process of solar irradiance from satellite imagery and further build a solar resource map over the Korean Peninsula for the whole year, from 1996 to 2019. The remainder of this article is organized as follows: Section 2 explains the outline of the research data, including satellite and research area. Section 3 briefly describes the UASIBS–KIER model. Subsequently, the evaluation of the data is presented in Section 4. Further analysis of the solar resource potential and renewable energy system is discussed in Section 5. Finally, Section 6 summarizes the major findings of this study.

2. Data and Research Area

2.1. Research Area and Design

The research area is limited to the Korean Peninsula (32° N–40° N, 124° E–130° E) (636 km × 459 km) and a part of the Japanese Islands (Figure 1). The investigation period was from 1996 to 2019, except for 2006, in which satellite imagery was not available for public purposes. Initially, the modeled GHI estimates at the instantaneous time scale are interpolated every 5 min. Further, they are all integrated over the interval from 7 Korean Standard Time (KST = universal time coordinate + 9 h) to 20 KST, to derive the daily total irradiance. For inter-comparison between the estimations and observations, the daily total irradiance was averaged over each month.

2.2. Satellite Imagery

Six satellite platforms have been operated to monitor the atmosphere over the Korean Peninsula since 1996, they are as follows: GMS-5, GOES-9, MTSAT-1R/2, COMS, and GK-2A. The details of the five satellites with embedded sensors are summarized in Table 2. GMS-5, operated by JMA, monitored the atmospheric status, implementing a visible and infrared spin scan radiometer (VISSR) at four different spectral ranges. When compared with the VISSR onboard GMS-5, the GOES-9 Imager contains five channels, including a shortwave infrared channel. Unfortunately, the brightness temperature or counts at 3.8 μm were not available in the archive system of Kochi University [42]. The spatial resolution of the visible and infrared channels of the VISSR and Imager were originally different, for example, 1.25 km and 5 km for the visible and infrared channels, respectively. The available datasets were reshaped into 0.05° × 0.05° grid cells for all the spectral bands. The MTSAT-1R/2 system is equipped with the Japanese advanced meteorological imager (JAMI), which collects the imagery at five spectral bands. The level-1B data of JAMI are available at the National Meteorological Satellite Center (NMSC), as part of the KMA, but the spatial resolution is 4 km for all the spectral bands. The specification of the meteorological imager onboard the COMS is almost the same as that of MTSAT-1R/2. NMSC provides the COMS level-1B data at five different channels, as follows: visible (0.67 μm), shortwave infrared (3.7 μm), water vapor (6.7 μm), and two split-infrared (10.8 μm and 12.0 μm) channels. The horizontal resolutions of the visible and infrared channels were 1 km and 4 km, respectively. The temporal resolution is coarser in GMS-5 and GOES-9, whereas the COMS facilitates the UASIBS–KIER model to produce GHI estimates every 15 min.

2.3. In Situ Observation

The present study uses in situ measurements from 18 automatic synoptic observing stations (ASOSs), operated by the KMA, to evaluate satellite-derived solar irradiance. The geographic details are listed in Table 1, which introduces GHI measured by a pyranometer at all stations. All the KMA stations provide hourly accumulated GHI measurements (MJ m−2) that are integrated from sunrise to sunset, to finally obtain the daily total irradiance (kWh m−2 d−1) for comprehensive analysis. The total number of data for the individual stations is 4860 (=22.5 years × 12 months × 18 stations). In addition to solar irradiance, photovoltaic (PV) power generation is employed to determine the application of satellite-derived solar irradiance to renewable energy resource assessment. Data are available in the electric power statistics information system (EPSIS), which is operated by the Korea Power Exchange (KPX). EPSIS data are monthly statistics, such as the monthly total power or capacity for each administrative division in Korea. Therefore, for the evaluation against EPSIS data, the modeling output from the UASIBS–KIER model must be integrated for each month.

2.4. ECMWF Reanalysis 5 Land Dataset

This study implements the ECMWF reanalysis 5 (ERA-5) land dataset for the comprehensive assessment of the UASIBS–KIER model and in situ observations. ERA-5 is produced by the Copernicus Climate Change Service as a part of ECMWF, and it provides hourly estimates of soil parameters, as well as land surface forcing data, such as solar insolation [43]. Their spatial and temporal resolutions were 9 km and 1 h, respectively. The data are available from 1980 to present for public use. Out of all the land surface data, downwelling surface shortwave radiation is employed for this study.

3. UASIBS–KIER Model

The full description of the UASIBS–KIER model is provided in the research series by Kim et al. [24,39,40]; therefore, we briefly introduce the model here. This model uses a look-up table approach to reduce the numerical burden of resolving the radiative transfer equation at each pixel [18,21,44]. A look-up table, generated by the Goddard Space Flight Center radiative transfer model (GSFC RTM) [45], represents the shortwave albedo at the top of the atmosphere (TOA) as a function of the solar zenith angle, surface albedo, ozone, water vapor, aerosol optical depth (AOD), and cloud optical depth (COD), for the four cloud classes, i.e., high-, mid-, and low-level clouds, and cumulus clouds. The monthly average ozone concentration was obtained from the climatological background datasets summarized by Tilmes et al. [46]. The vertically integrated AOD measured at Yonsei University, as a part of the AERONET station, is redistributed at each vertical level, to parameterize the aerosol extinction coefficient profile in the GSFC RTM using an exponential distribution [47]. Since the observation of AOD at Yonsei University, initiated in March 2011, the monthly mean AOD at 440, 500, and 870 nm, from 2011 to 2019, was employed to generate the AOD profiles for the investigation period before 2011. The water vapor profile was obtained from a rawinsonde that was launched at Suwon/Osan station (Figure 1) at 1200 UTC (2100 KST = UTC + 9) on the previous day.
After creating the look-up table, the cloudy pixels were determined using the brightness temperatures and visible reflectance [21,48]. As the horizontal resolution and central wavelength vary between different remote sensors onboard satellites, cloud detection procedures are also implemented between satellite imagery. When the UASIBS–KIER model derives solar irradiance using GMS-5 and GOES-9 satellite imagery, the brightness temperature at 3.7 μm is missing; therefore, the brightness temperature difference presented by Jedlovec et al. [48] cannot be used to detect the cloudy pixels. Without the brightness temperature at 3.7 μm, we simply distinguish the cloudy pixels from the clear ones through the joint classification table presented by Rossow and Garder [49], who carried out space and time contrast tests. As the spectral coverage in JAMI onboard MTSAT-1R/2 includes the wavelength range from 3.5 μm to 4.0 μm, the brightness temperature difference results in the detection of cloudy pixels, in a manner similar to the UASIBS–KIER model with the COMS satellite [39]. Furthermore, visible reflectance is employed to detect optically thin clouds, i.e., cirrus or shallow clouds. Clear-sky composite shortwave albedo was generated by the minimum value of visible reflectance for the previous 15 days. Compared with the clear-sky composite albedo, the observed shortwave TOA albedo classifies pixels into either clear or cloudy pixels.
The horizontal resolution between infrared and visible channels is exactly similar to all satellite imagery, except the COMS imagery. Cloud detection was first carried out using brightness temperature for a 4 km resolution; the visible reflectance for a 1 km resolution is implemented to classify cloudy pixels in the case of COMS imagery. The difference in spatial resolution in cloud detection raises the accuracy of detecting small cloudy pixels, i.e., popcorn clouds.
Next, classification of the cloud type was performed using the cloud top pressure (CTP) and shortwave TOA albedo, based on Rossow and Garder [49], as follows: high-level cloud (50 ≤ CTP < 440 hPa and shortwave TOA albedo < 0.6), mid-level cloud (440 ≤ CTP < 680 hPa), low-level cloud (680 ≤ CTP < 1000 hPa), and cumulus cloud (50 ≤ CTP < 440 hPa and shortwave TOA albedo ≥ 0.6). The atmospheric transmittance was obtained by comparing the shortwave TOA albedo between the satellite observations and the look-up table, under the given conditions of the cloud class, solar zenith angle, and surface albedo. Finally, the solar irradiance on the ground surface was calculated by multiplying the cloud fraction, atmospheric transmittance, and time-varying extraterrestrial solar irradiance, corrected by the equation of time and the sun–Earth distance.

4. Results

The monthly average of the daily total irradiance that is derived by the UASIBS–KIER model, is evaluated against observations conducted at 18 ASOS stations. The error statistics employed in this study were as follows:
rMBE = 1 N i = 1 N E i O i 1 N i = 1 N O i ,
rMAE = 1 N i = 1 N E i O i 1 N i = 1 N O i .
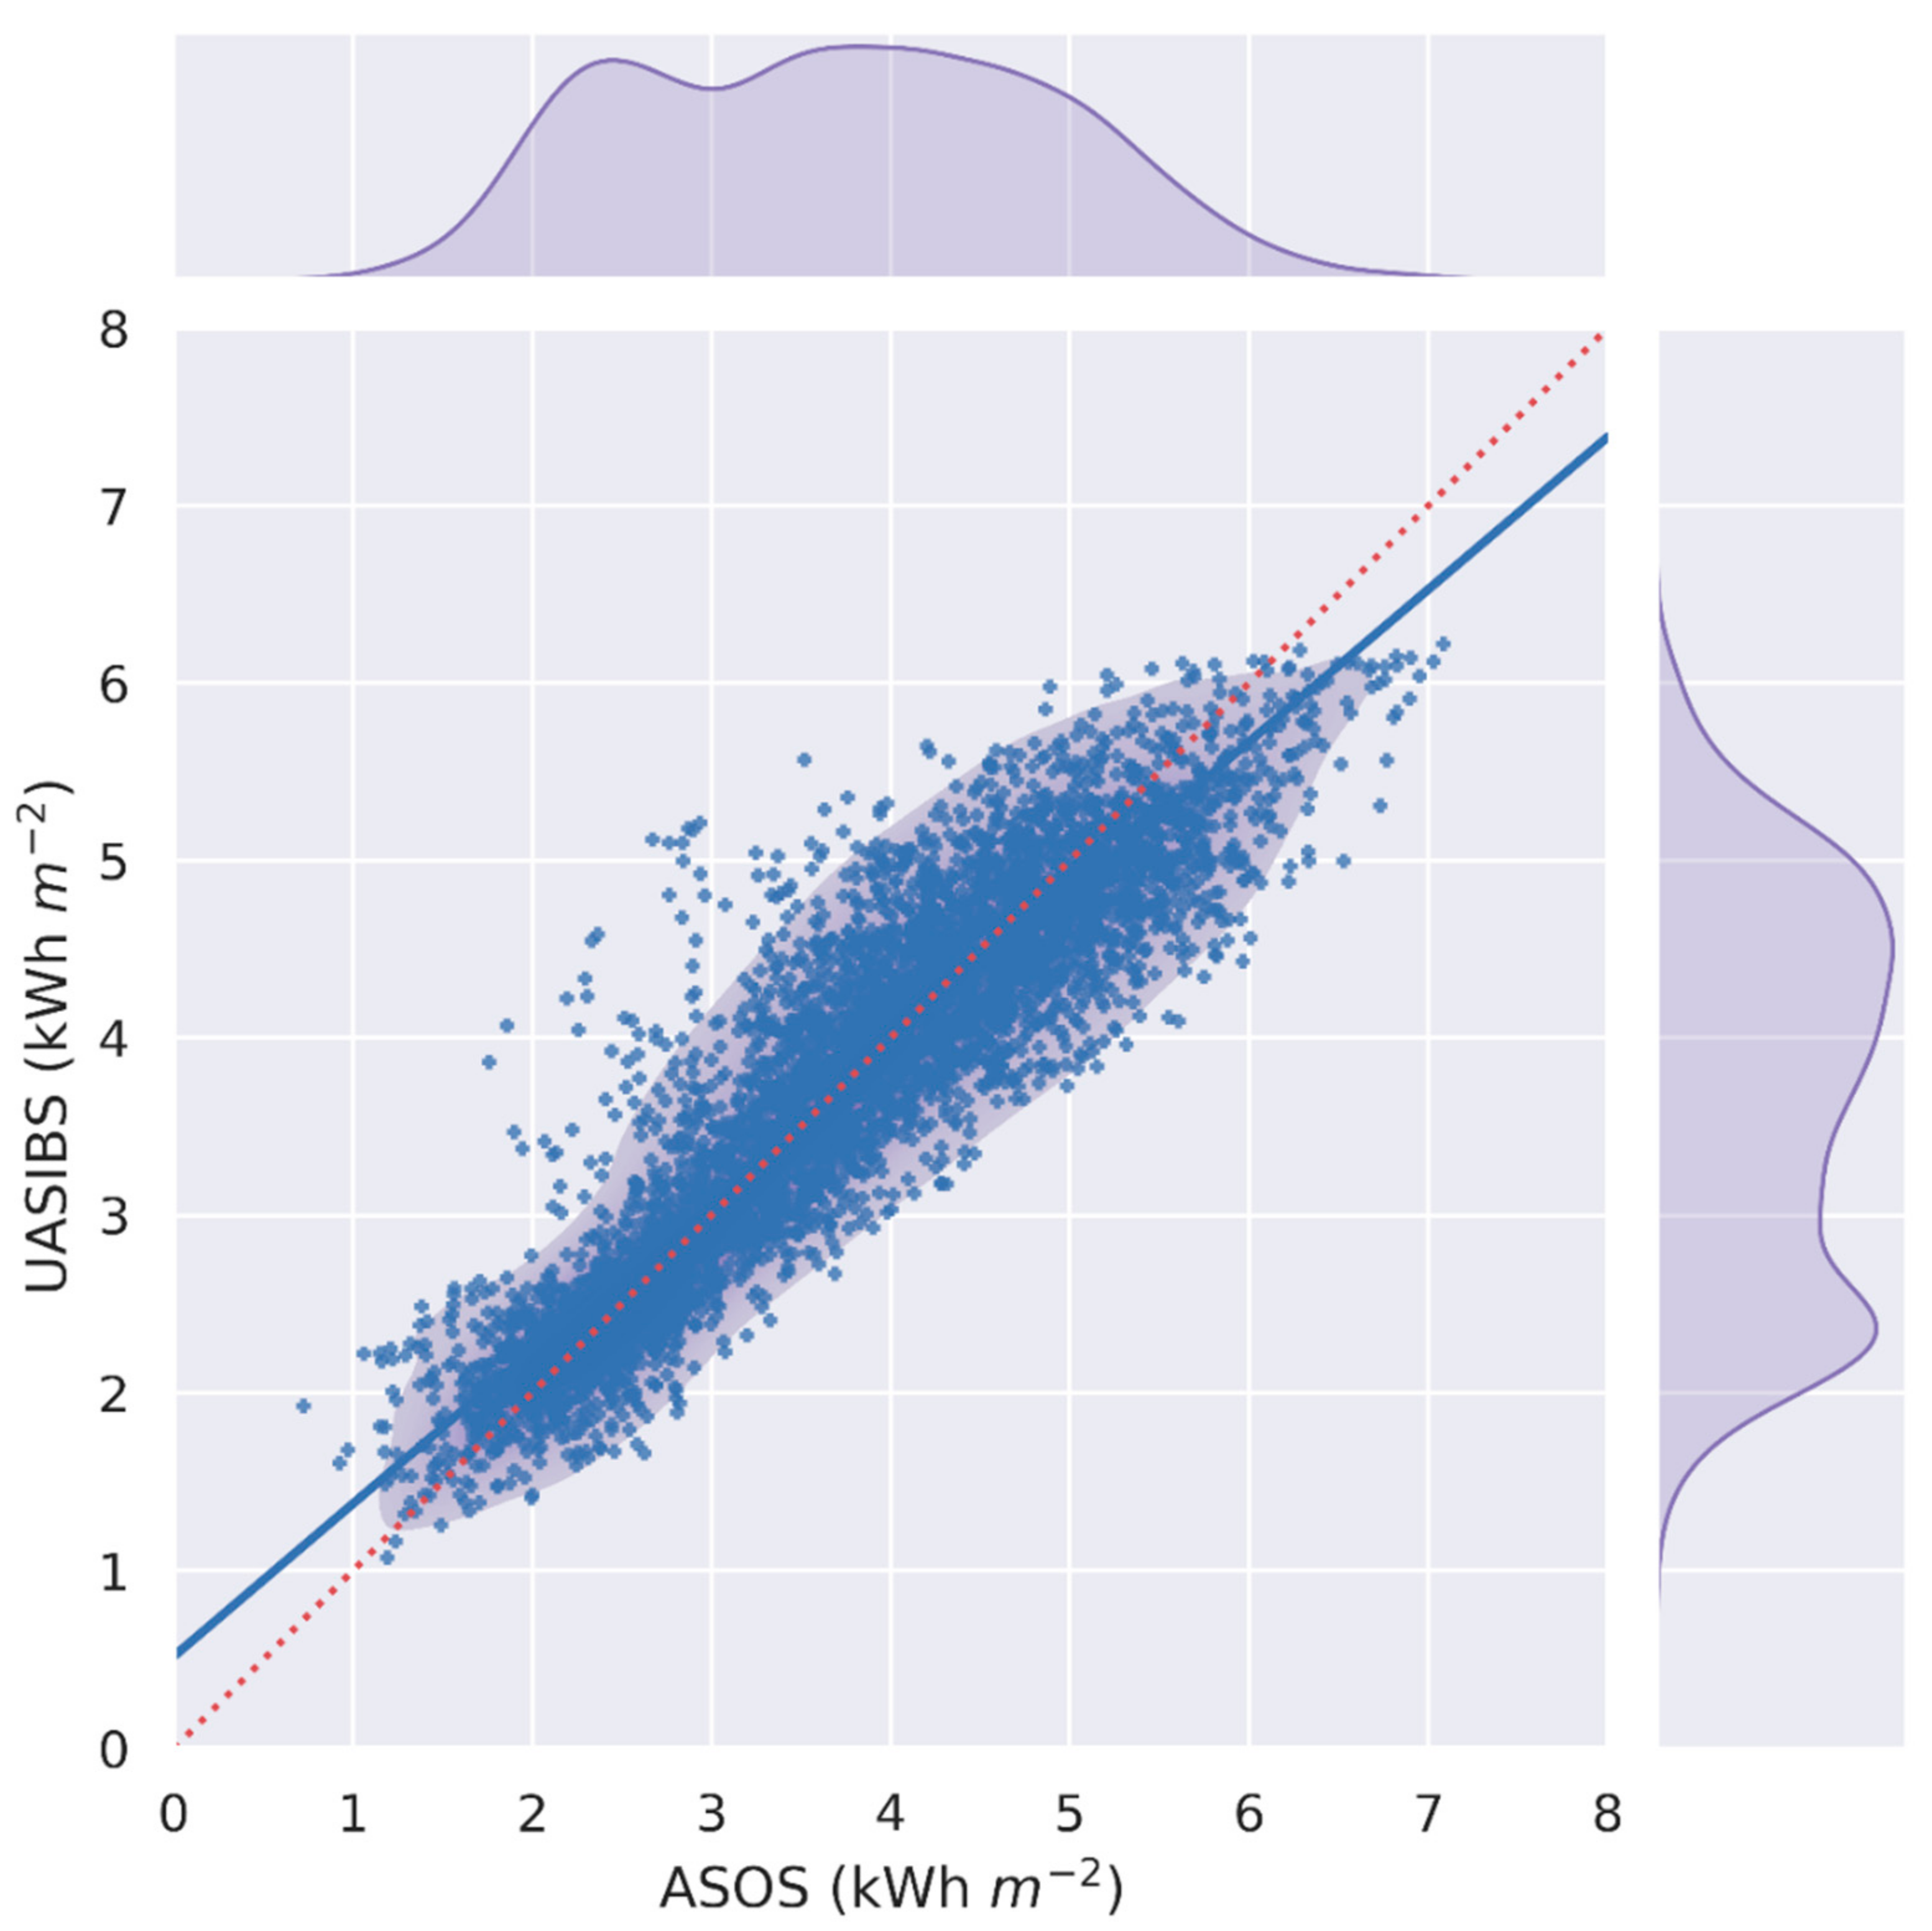
Above Ei, Oi, and N indicate the estimates, observations, and number of samples, respectively. The rMBE and rMAE are the mean bias error and mean absolute error, respectively, which are normalized to the observed averages. In addition to the aforementioned two error statistics, Pearson correlation (γ) and determination (γ2) coefficients were used to determine the correlation between the estimations and observations for each station. Figure 2 exhibits the scatter plot of solar irradiance between the UASIBS–KIER model and in situ observations at 18 ASOS stations, from 1996 to 2019. Most of the estimates are included in the 95% confidence level, which is consistent with the high correlation coefficient of 0.963 (Table 3). The determination coefficient was also higher than 0.80. The slope of linear regression with intercepts indicates that GHI is overestimated when GHI is lower than 4 kWh m−2 d−1; however, the opposite is true for GHI > 5 kWh m−2 d−1. The contrast between the estimations and the observed GHI results in a nearly zero value of rMBE (see the rMBE value in Table 3). However, the dispersion of estimates from the regression line results in an rMAE of 9.4%.
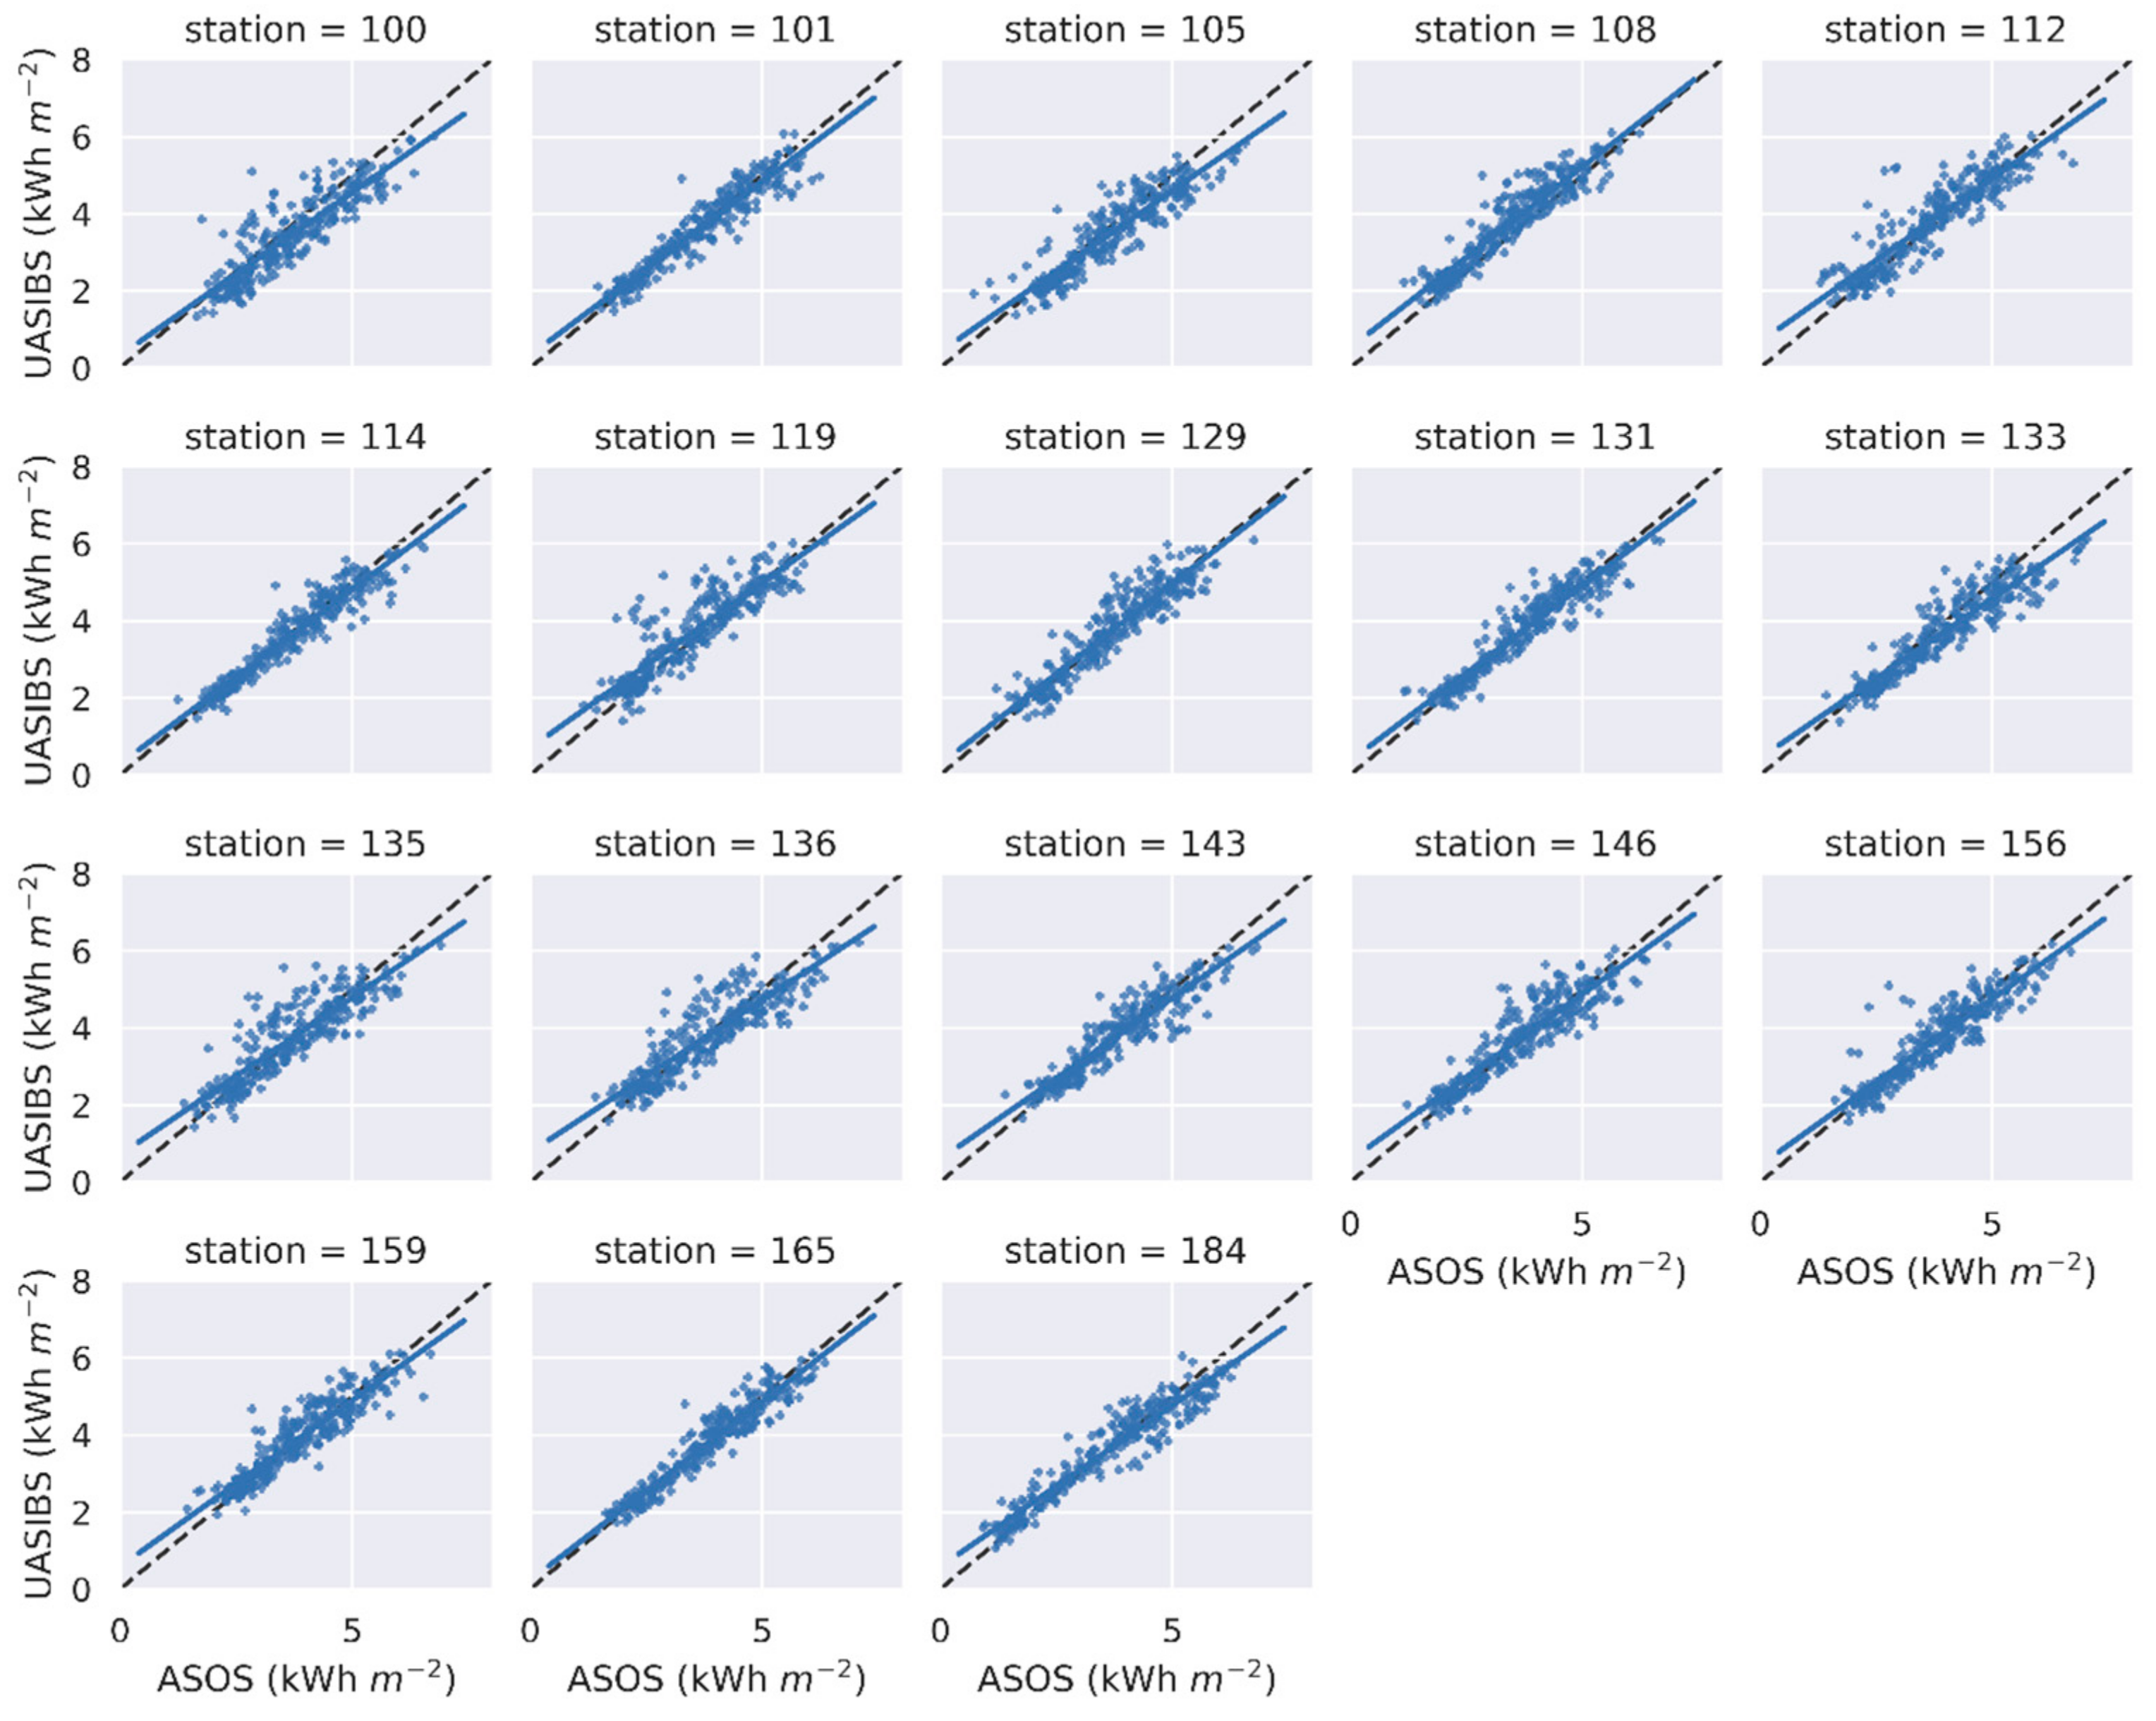
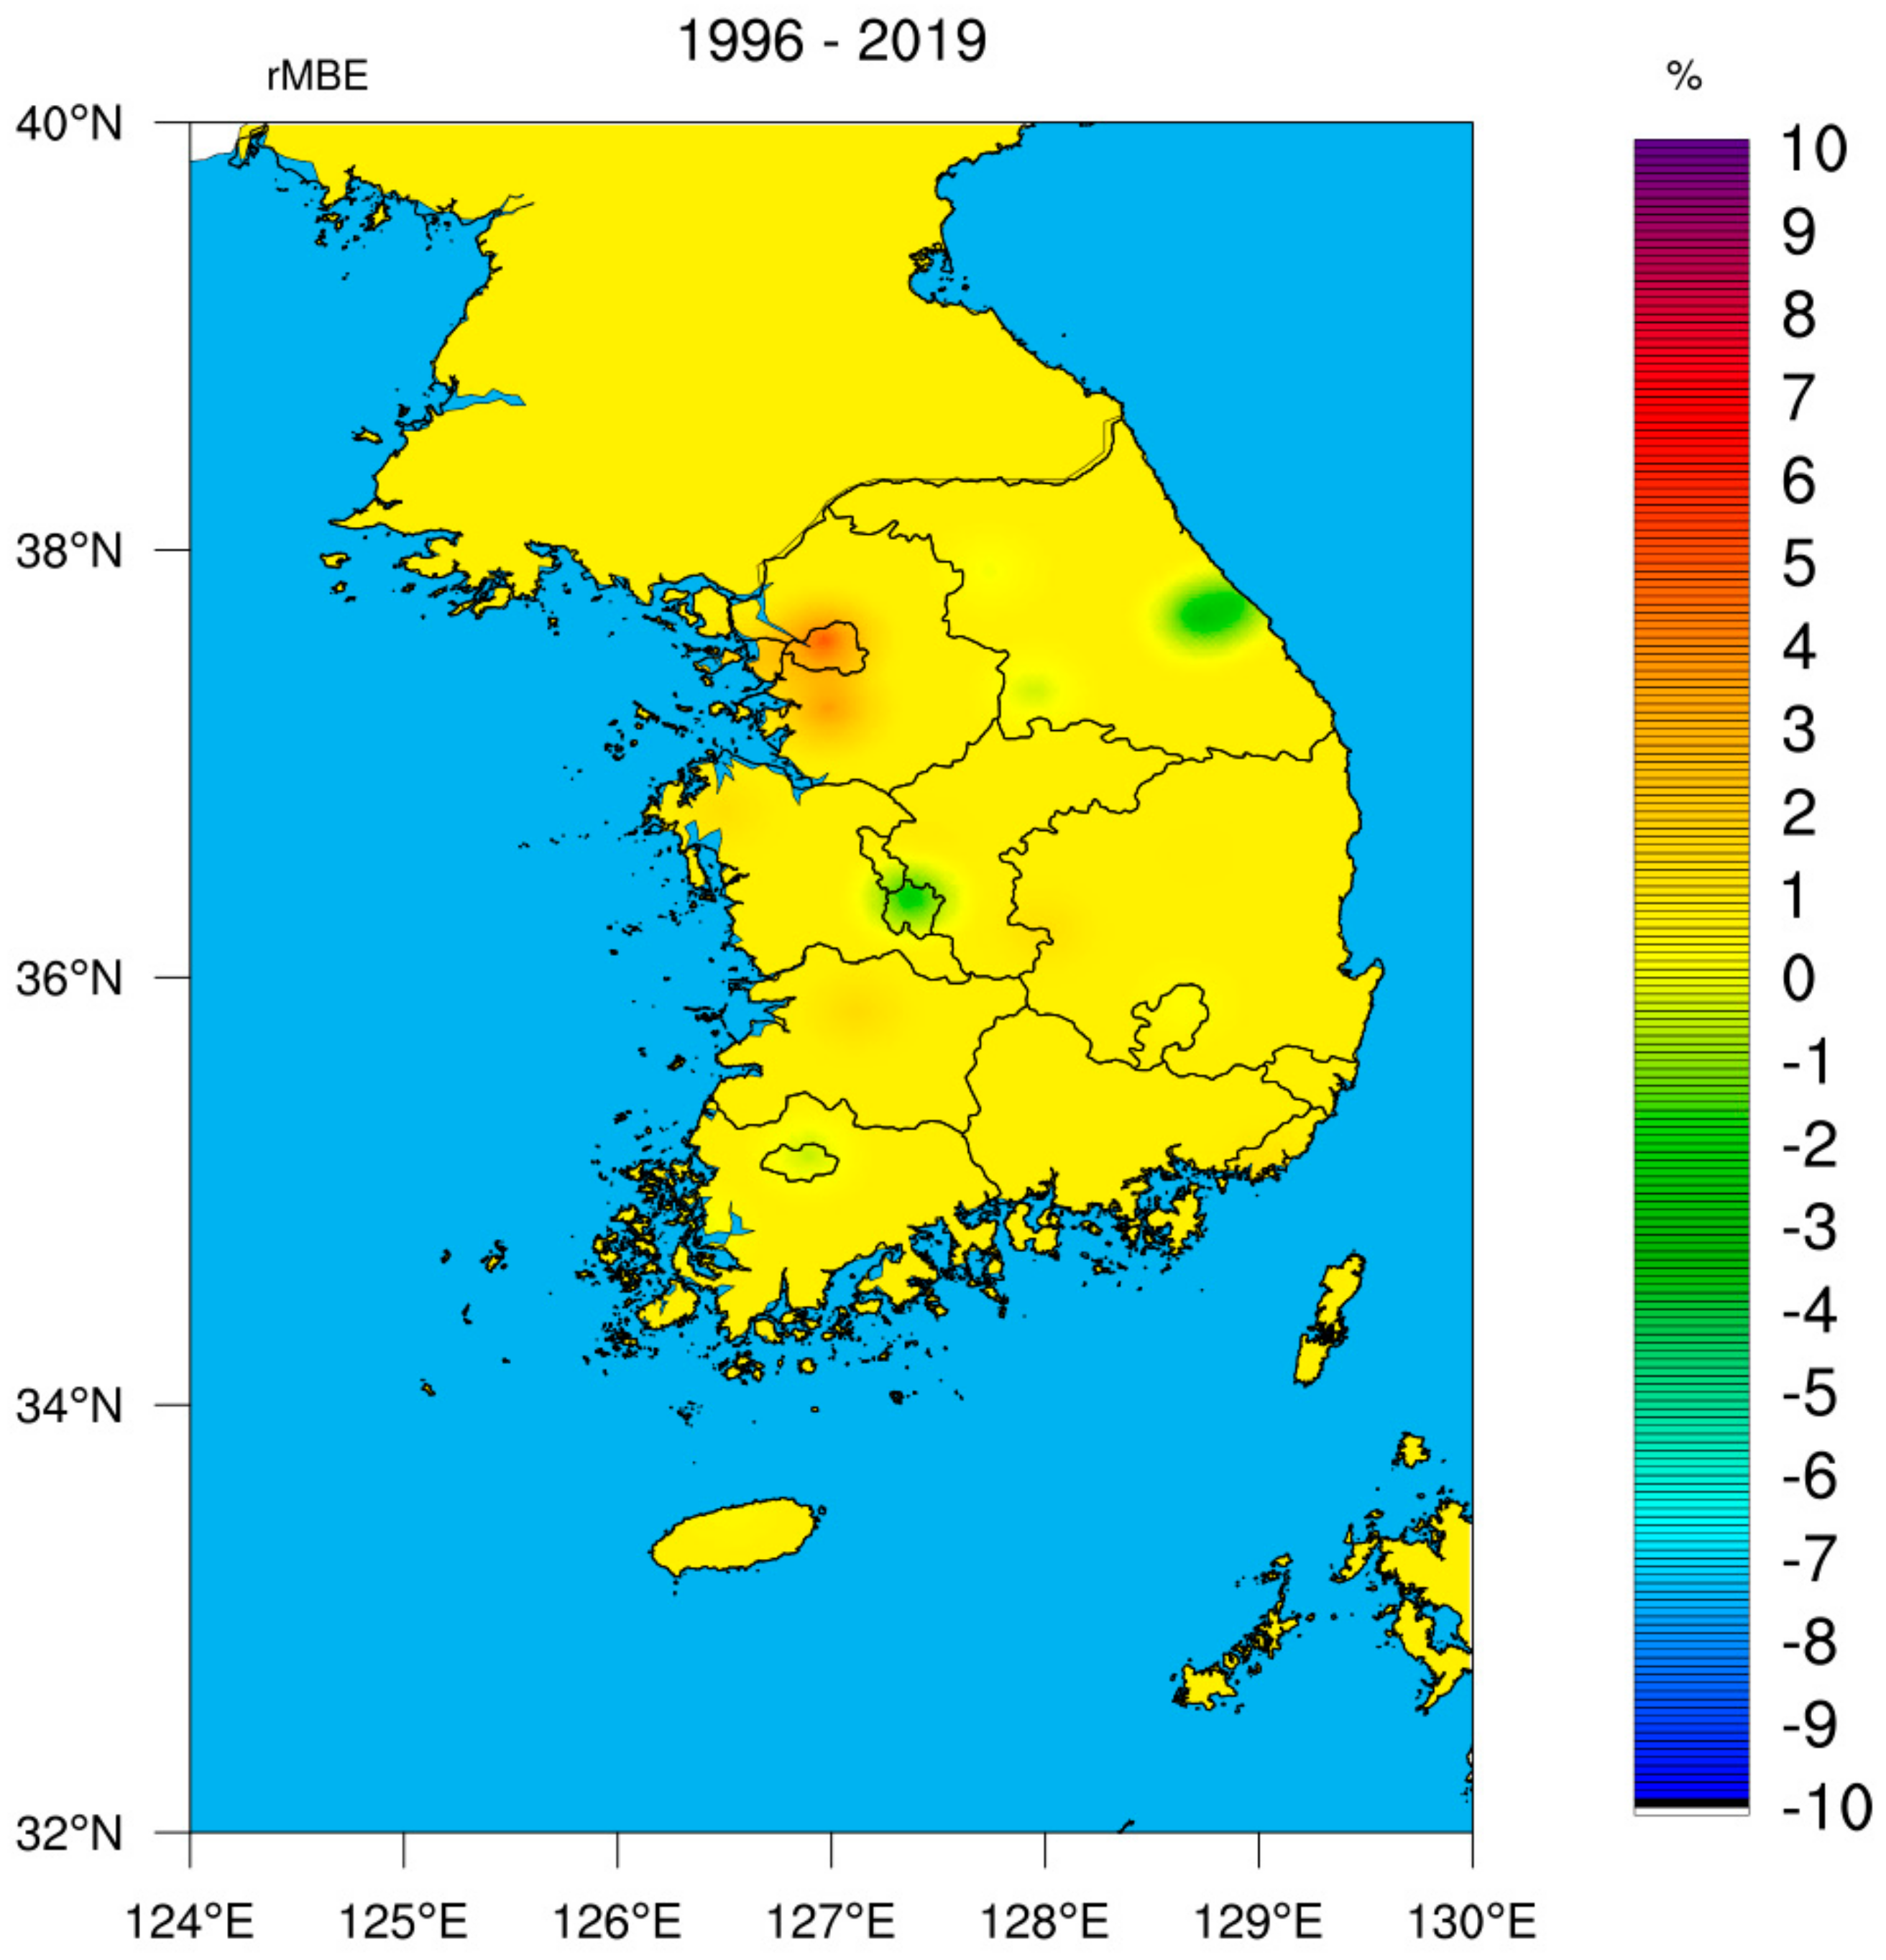
The horizontal distribution of solar irradiance is an important parameter in the assessment of solar resources. The scatter plot matrix of solar irradiance between the UASIBS–KIER model and the measurement for each station is illustrated in Figure 3. The error statistics in relation to the scatter plots are also listed in Table 3. Almost all the GHI estimates are in good agreement with the observed correlation coefficients being higher than 0.92 at all the stations. The rMBE values are between −2% and 2% at 10 stations, which means that all the estimates are unbiased towards the observed GHI. The rMBE value at station 108, however, was the largest positive. Figure 4 shows the spatial distribution of the rMBE values. The UASIBS–KIER model overestimates the observed GHI at the Seoul station (108), in comparison with satellite cities, Incheon (112) and Suwon (119) stations. This might be because the current version of the UASIBS–KIER model employs the observed AOD recently, even if the aerosol optical depth gradually decreases in metropolitan cities [50]. In the UASIBS–KIER model, the AOD observed was lower than the actual values that were depicted in the 1990s and the early 2000s, which resulted in higher solar irradiance when the sky was clear. This is further discussed at a later stage.
In contrast to the metropolitan cities, negative biases were observed in the mountainous regions, as follows: −5.8% and −4.5% at stations 100 and 105, respectively. These bias characteristics were also found in a previous study by Kim et al. [39], who concluded that the cloud optical depth is extremely large when shallow or orographic clouds exist over the ground stations. The GHI estimations at station 165 appeared to be the most reliable, because the rMAE was the second lowest and the correlation coefficient was the largest (Table 3).
Meanwhile, the GHI observations and estimations are distributed in two branches at stations 135 and 136, as shown in Figure 3. The number of outliers is too large to be treated as a simple outlier. The UASIBS–KIER model seems to have a symmetrical error while deriving the solar irradiance. To investigate symmetrical biases, ECMWF reanalysis v5, ERA-5, was employed in this study. Figure 5 demonstrates the correlation matrix for the monthly average of the daily total irradiance from the UASIBS–KIER model, ERA-5, and in situ measurements at stations 135 and 136. In comparison with the ground observations, the ERA-5 model also estimates the daily total irradiance averaged over each month, in a similar manner to the UASIBS–KIER model; there are two branches in the correlation matrix between ERA-5 and ASOS, as observed in Figure 5. Contrary to the relationship between estimates and observations, the UASIBS–KIER model produces GHI estimates that are in good agreement with the ERA-5 products. Consequently, the solar irradiance data from ground stations could be limited to the ground truth. In relation to this limitation, Kim et al. [40] found that the problem in data quality control exists in ground observation stations that are operated by the KMA.
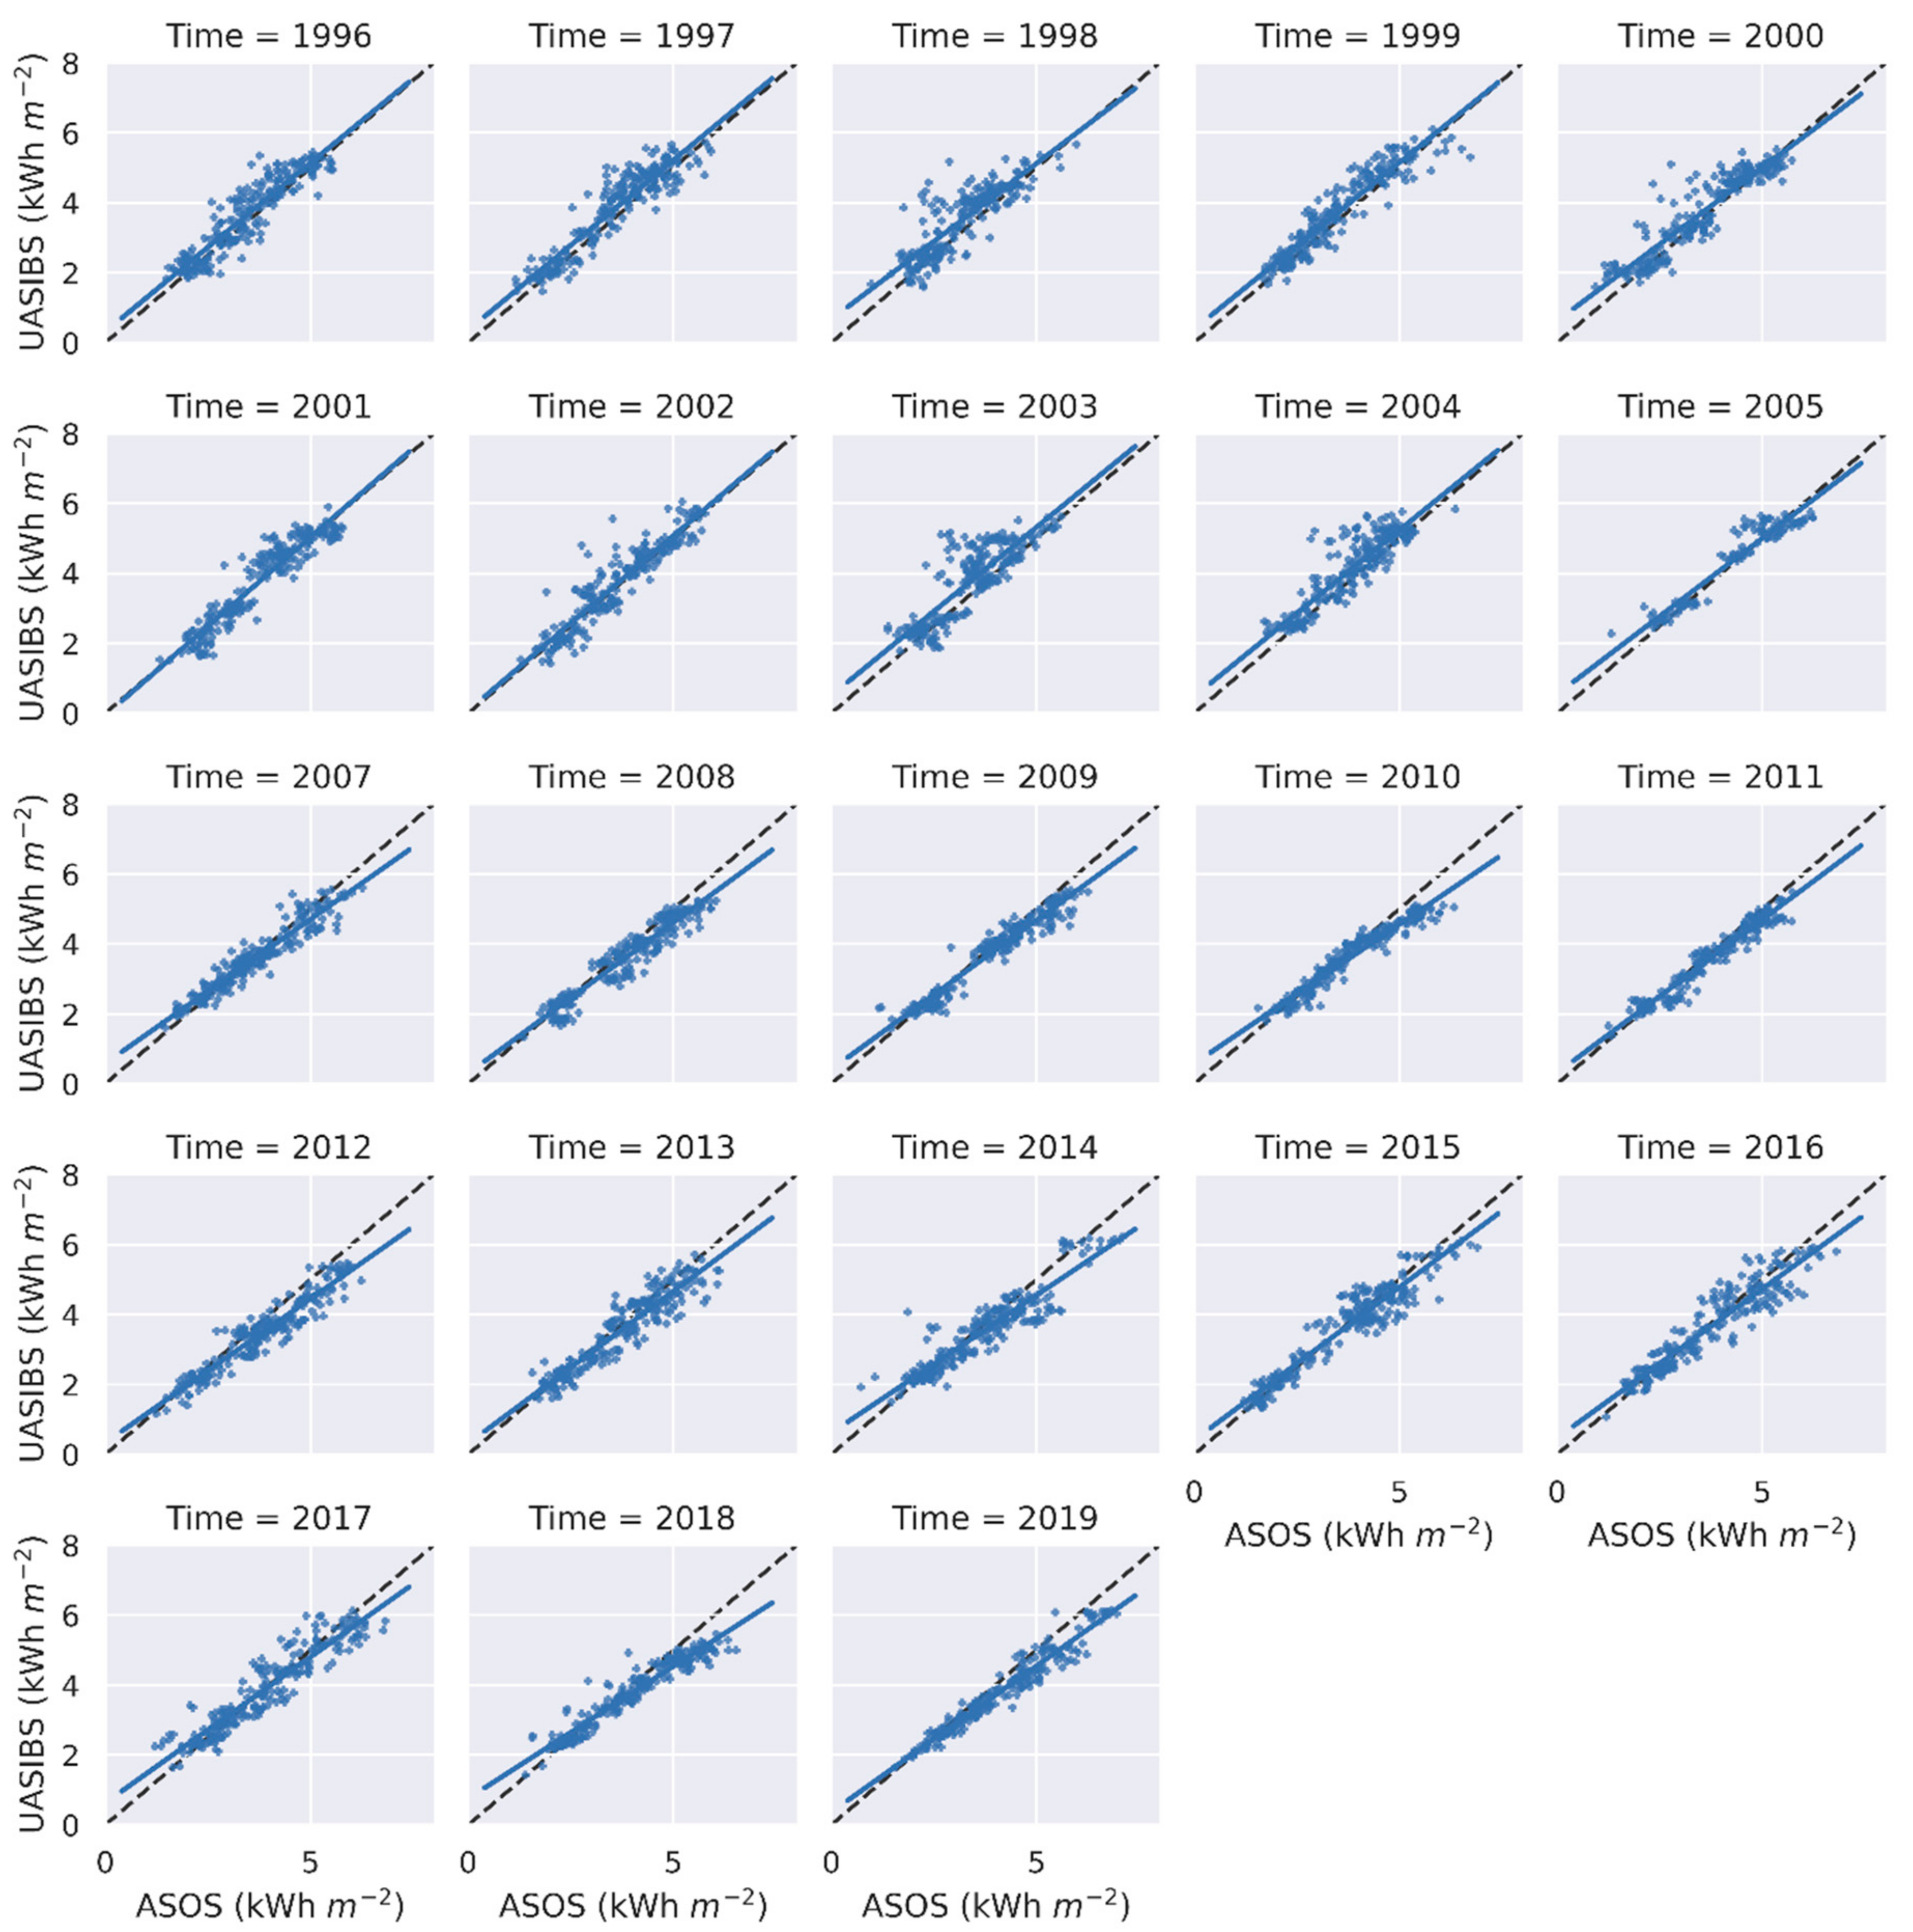
From 1996 to 2019, geostationary satellites have changed over the Korean Peninsula. The UASIBS–KIER model has also been modified to implement various satellite imagery data and adjust according to the different horizontal resolutions. Thus, henceforth, we will examine the yearly modeling performance. The scatter plots for the investigation period are shown in Figure 6, which indicates that the GHI estimates agree with the observed values at all the KMA stations. The error statistics for the operation period of each satellite are summarized in Table 4. The UASIBS–KIER model, with the MTSAT-2 satellite, produces the largest correlation coefficient between the estimates and observations. Moreover, the rMAE is the lowest, which means that the GHI estimations are the most reliable of the four satellite platforms. The UASIBS–KIER model derived larger positive GHI estimates, biased to the observed value, when the GOES-9 satellite was implemented into the model. Positively biased estimates are also exhibited in Figure 6 (see the scatter plot for 2003 and 2004). Moreover, the rMBE averages appear to have a discrepancy between the old- and new-generation satellites. As mentioned in Section 2.2, the GMS-5 and GOES-9 satellites are equipped with instruments that can produce the image at spectral bands (3.0–4.0 μm). Without a shortwave infrared channel, the UASIBS–KIER model has a limitation in finding low-level clouds in the cloud classification. On a few occasions, the model could not detect cloudy pixels, instead defining cloudy pixels as clear. Consequently, the average GHI estimates were positively larger than the observed values.
The monthly variation in error statistics is substantially related to the Korean monsoon, i.e., the East Asian monsoon. In spring and fall seasons, the sky is usually clear; however, heavy precipitation events occur in the summer, due to the strong front system [51,52,53]. The rMAE values were relatively low in the spring and fall seasons. However, the UASIBS–KIER model failed to estimate the GHI in the right direction in June and July. Furthermore, the behavior of rMBE is strictly distinguished by season; it is almost negative from January to June, but positive from July to December. Therefore, the derivation model overestimated the COD in the warming season, whereas the opposite was true in the cooling season.

5. Discussion

5.1. Solar Resource Potentials

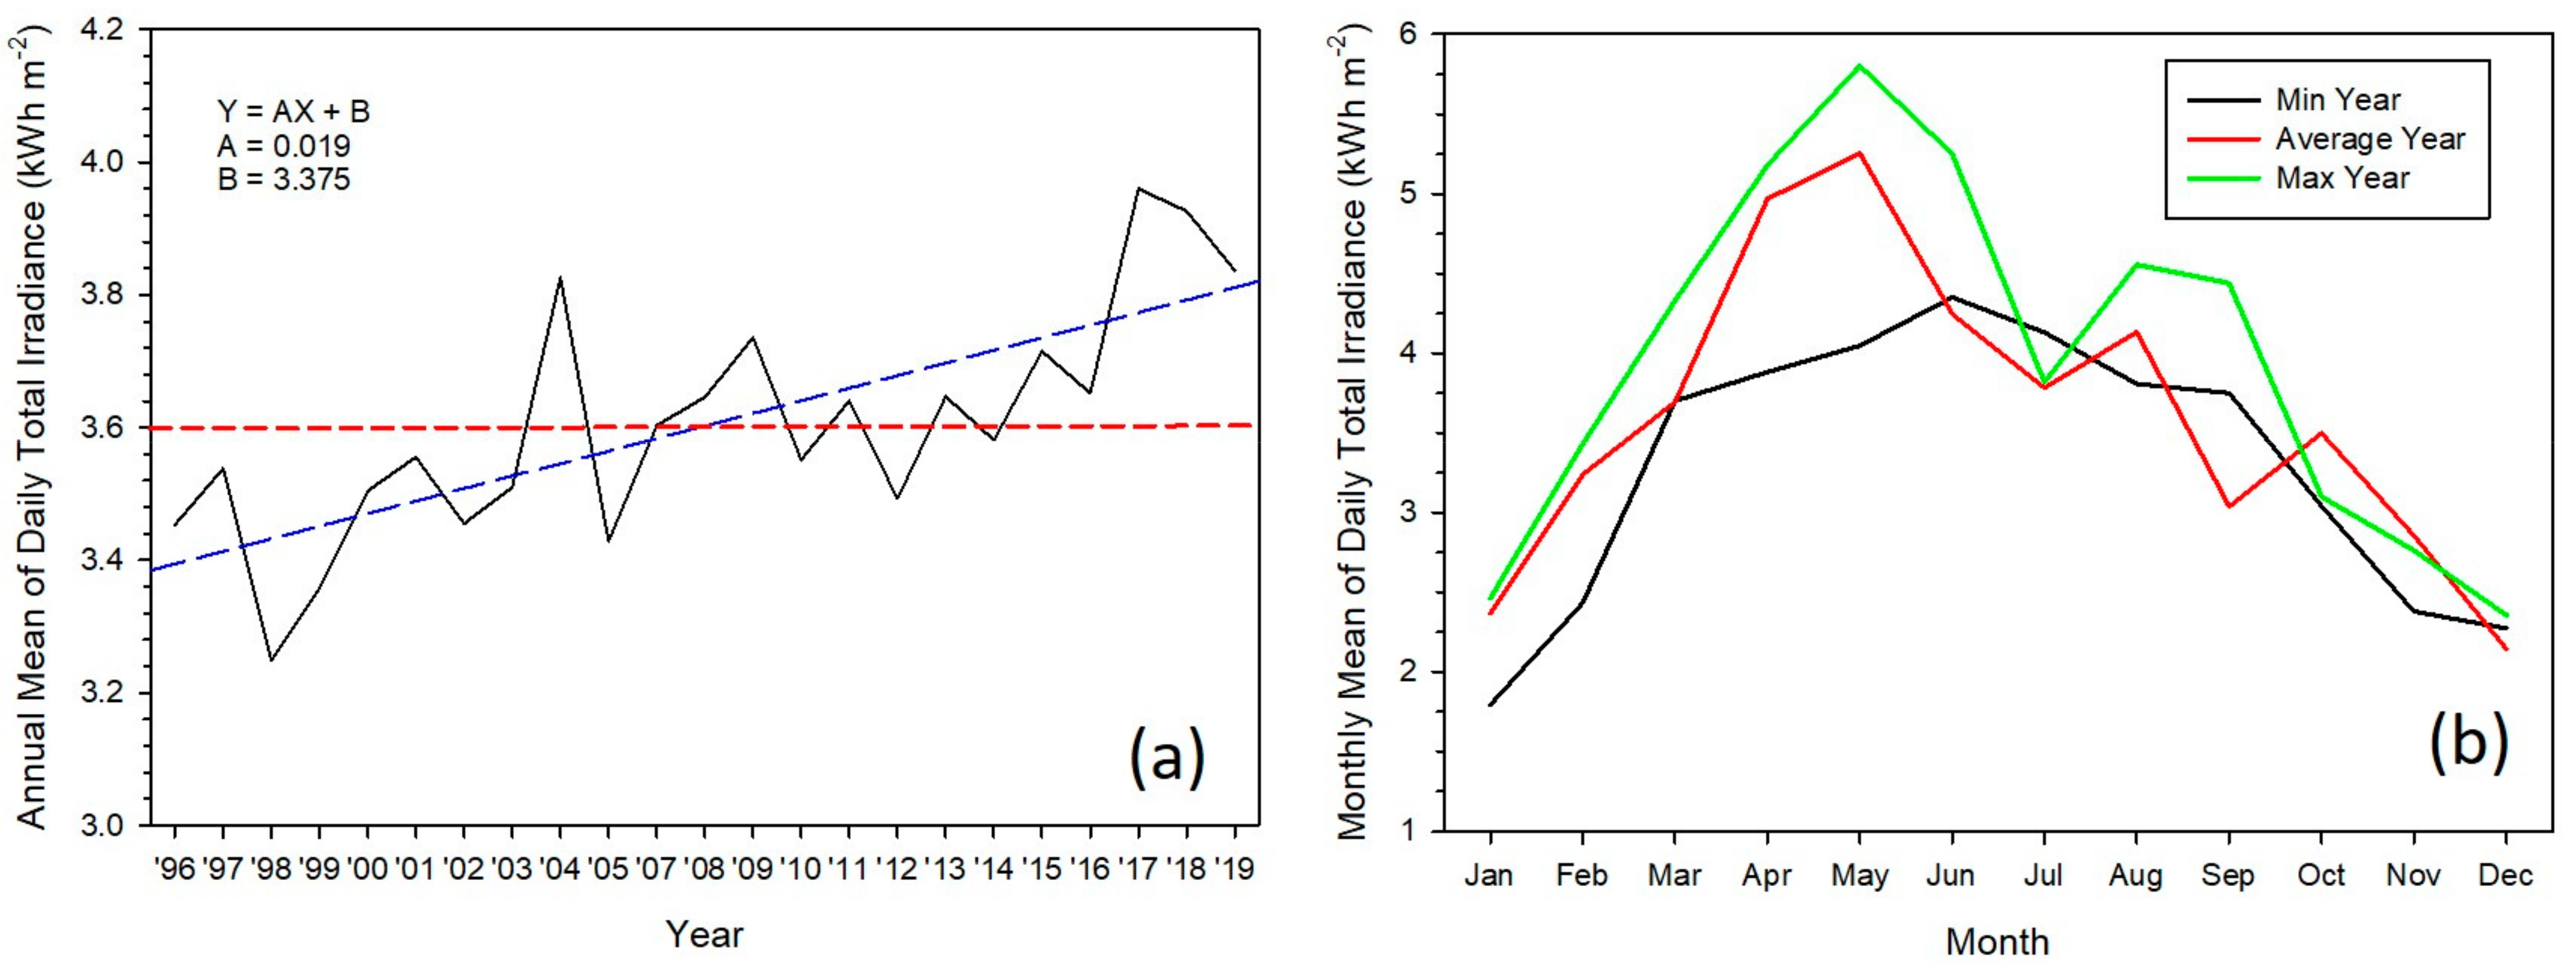
The UASIBS–KIER model is capable of estimating solar irradiance for at least 5 km × 5 km pixels for more than 20 years, from 1996 to 2019. Long-term solar irradiance datasets are essential for producing typical yearly meteorological data for the energy system design, or building a solar resource map itself. This section examines the solar resource potentials, based on the Korean solar irradiance datasets, as a result of the UASIBS–KIER model. The annual mean daily total irradiance over the Korean Peninsula, from 1996 to 2019, is illustrated in Figure 7a, with an average value of 22 years. Even if there are fluctuations by year, the solar irradiance over the Korean Peninsula increases gradually, at a rate of 0.019 kWh m−2 d−1 per year. The annual mean of the daily total irradiance averaged over 22 years is found to be 3.602 kWh m−2 d−1, which is equivalent to 3.6 h at the peak sun hour. Based on this average value, the present study determines the average year during the investigation period as 2007, with an annual mean of 3.604 kWh m−2 d−1. In this study, the dark year was defined as the year when the daily total irradiance averaged over the year was the lowest. Conversely, the bright year was defined as the year when the daily total irradiance averaged over the year was the highest. As shown in Figure 7a, the dark and bright years are determined as 1998 and 2019, respectively.
The monthly variation in solar irradiance for average, dark, and bright years is shown in Figure 7b. The meteorological conditions in the spring season play a dominant role in differentiating between dark and bright years. As mentioned in the previous section and literature [51,52,53], the monthly solar insolation from March to May is recognized as being higher in both average and bright years, whereas the opposite is true in the dark year. This might be attributed to the high precipitation amount in 1998. The KMA annual reports from 1996 to 2019 demonstrated that the annual precipitation in Korea was the largest in 1998, for the last three decades [54]. The difference in the daily total irradiance between dark and bright years, accumulated for three months from March to May, is 112.78 kWh m−2, which is equivalent to 1.227 kWh m−2 d−1 in daily total irradiance. When it is converted into the peak sun hour in the standard test condition, the operation hour of the PV system can be increased more in 2017 than in 1998, by 1 h. Therefore, solar power generation would be increased to more than 10 GWh when the capacity of the photovoltaic system is assumed to be 10 GW in Korea.
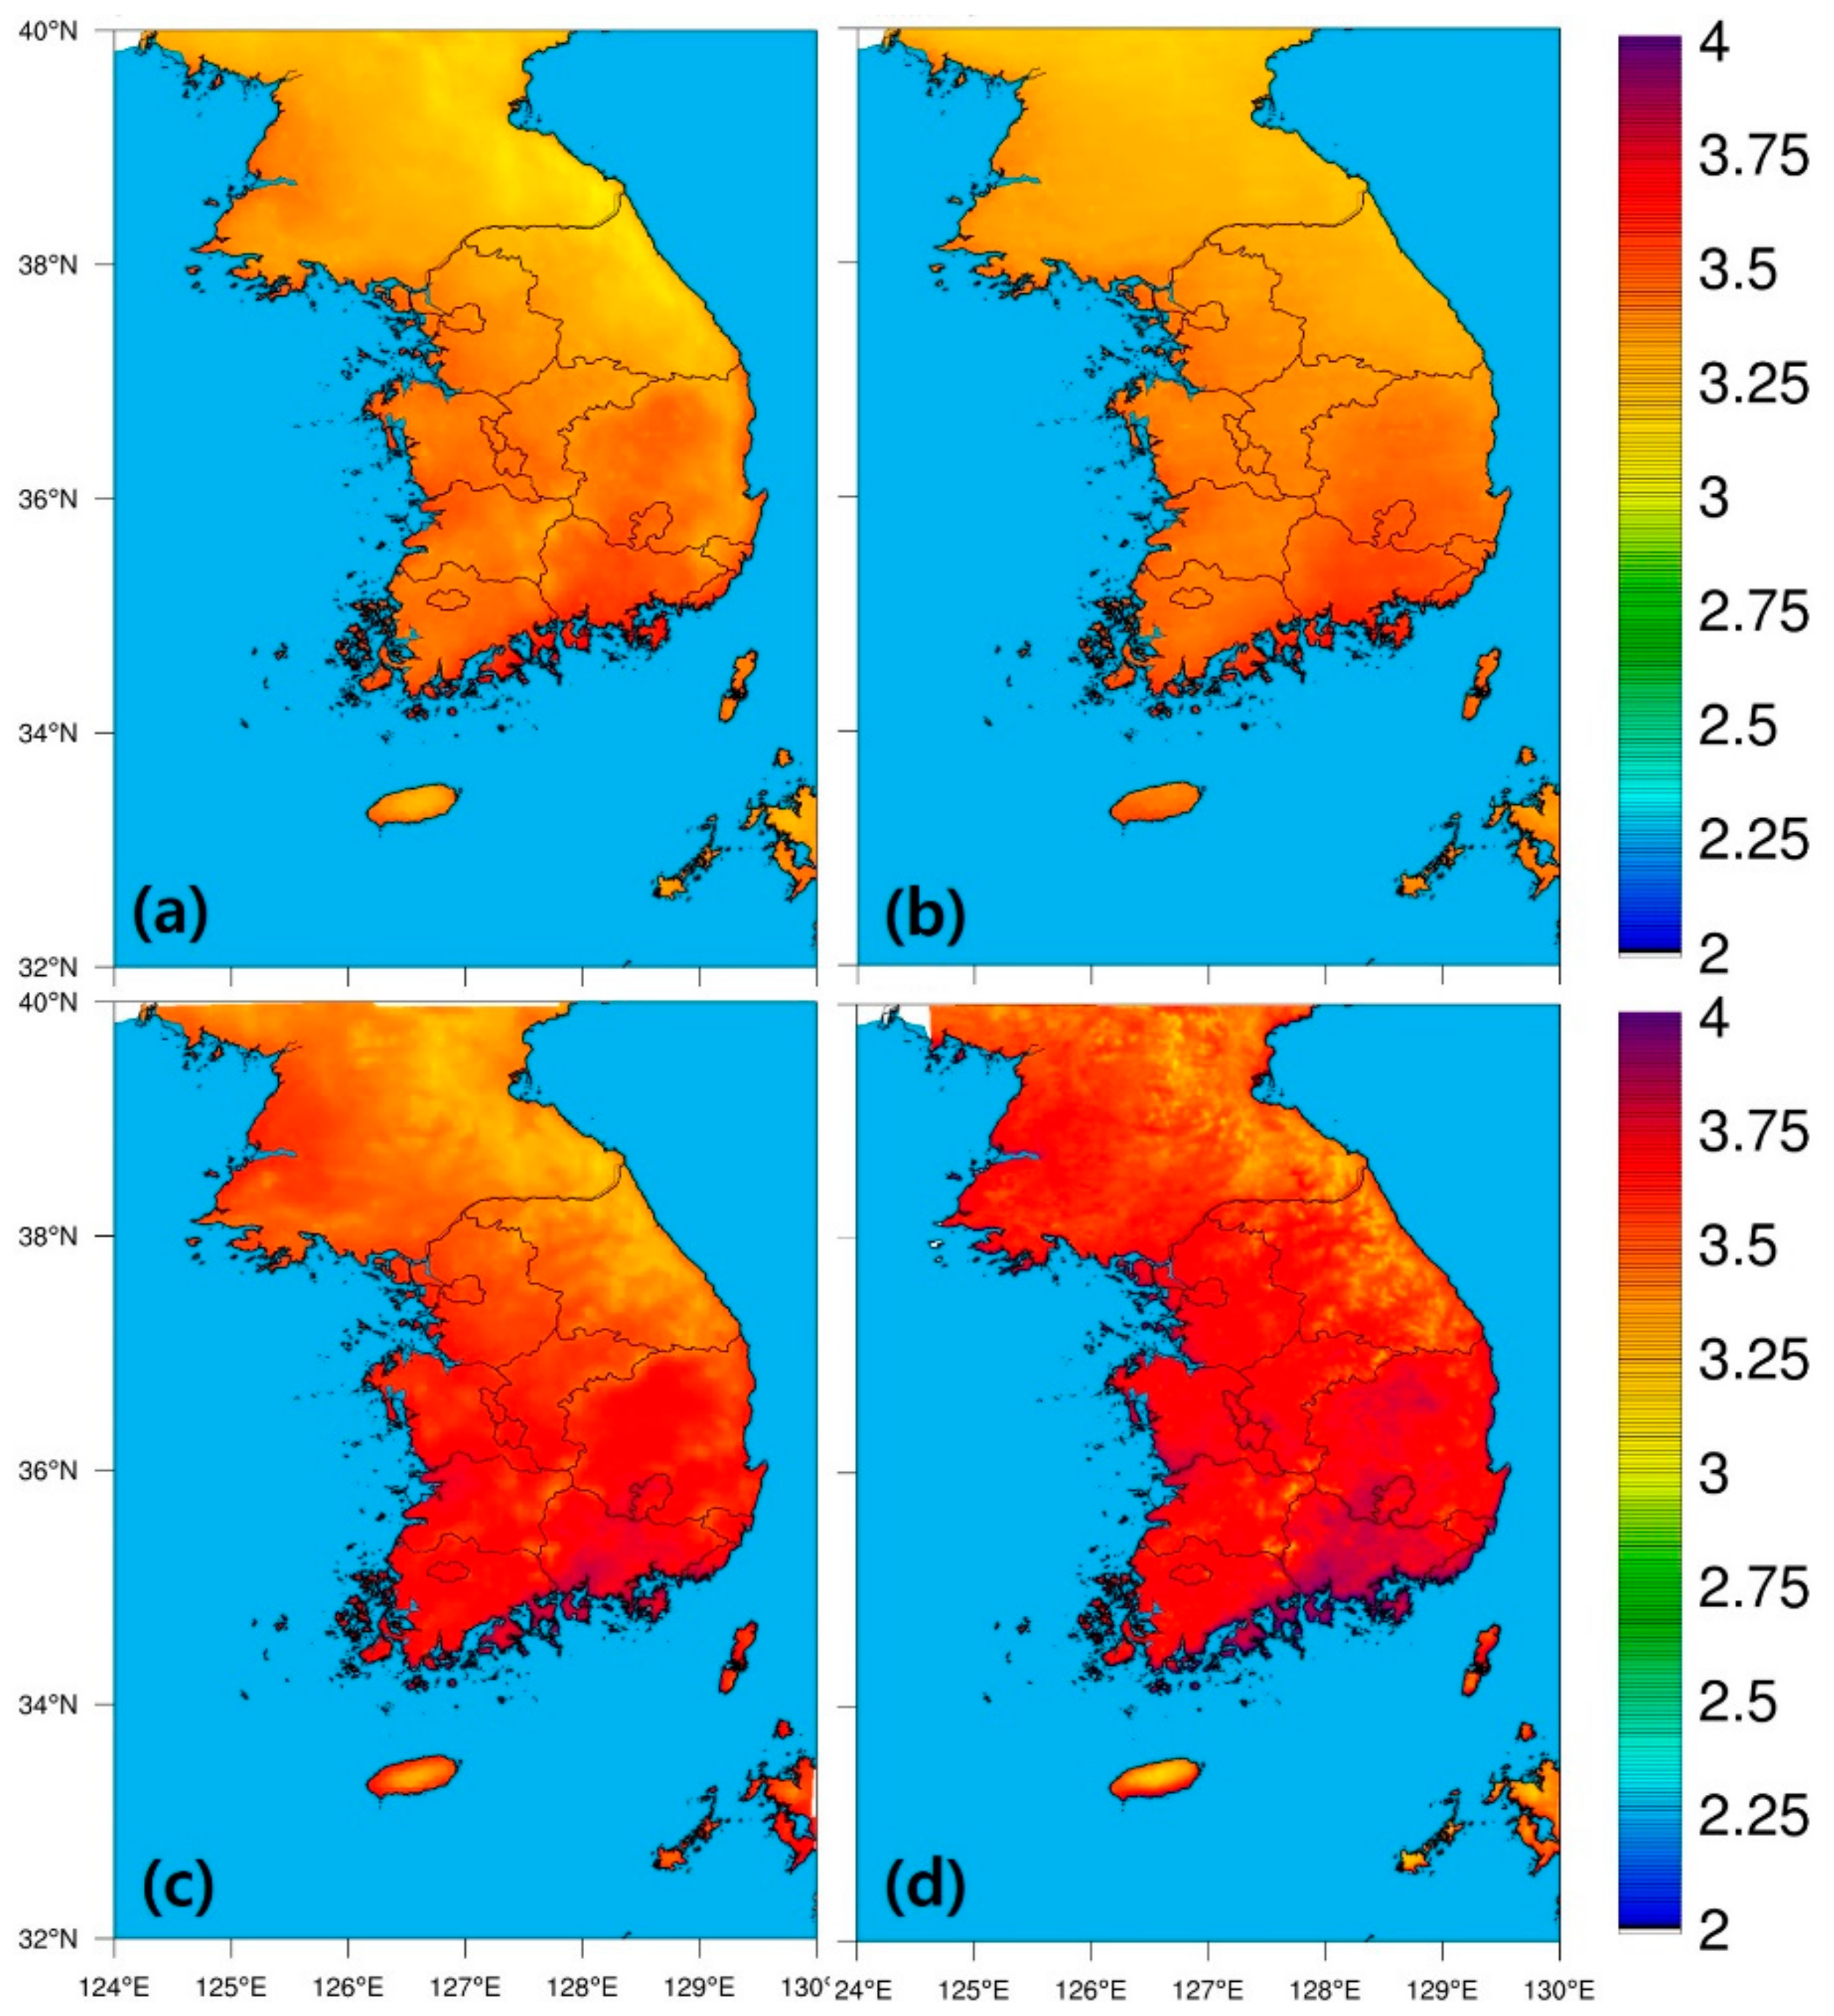
Figure 8 shows the horizontal distribution of the daily total solar irradiance, averaged over four satellite operation periods. The solar irradiance derived from each satellite imagery was consistent with the annual mean of the daily total irradiance. It is interesting to investigate solar irradiance by region or administrative divisions. Korea is composed of 17 administrative divisions. The behavior of solar irradiance in 2007 is very similar to that of the climatological mean, i.e., averages over 22 years from 1996 to 2019. The three largest values in the average year were the GN, JN, and BS divisions. These results, along with the climatological mean, are the same for the bright year. In the dark year, the JJ division, instead of the BS division, is included as the region with the third largest solar irradiance, out of seventeen divisions. The lowest solar irradiance is observed in the GW division for all the representative years, because this division is located in the mountainous range and forest (Figure 1b and Figure 8).

5.2. Applications for the Photovoltaic System

Solar resource assessments were carried out for photovoltaic system installation and operation in the feasibility study. We now analyze the capacity factor of PV power plants installed over seventeen administrative divisions, and then compare it with the solar resource map built by satellite-derived solar irradiance. The capacity factor is a measure that indicates the amount of the power plant operated for a given time period. The annual capacity factor was formulated as follows:
CF   ( % ) = AEP   ( Wh ) Capacity   ( W ) × 8760   ( h ) × 100 ,
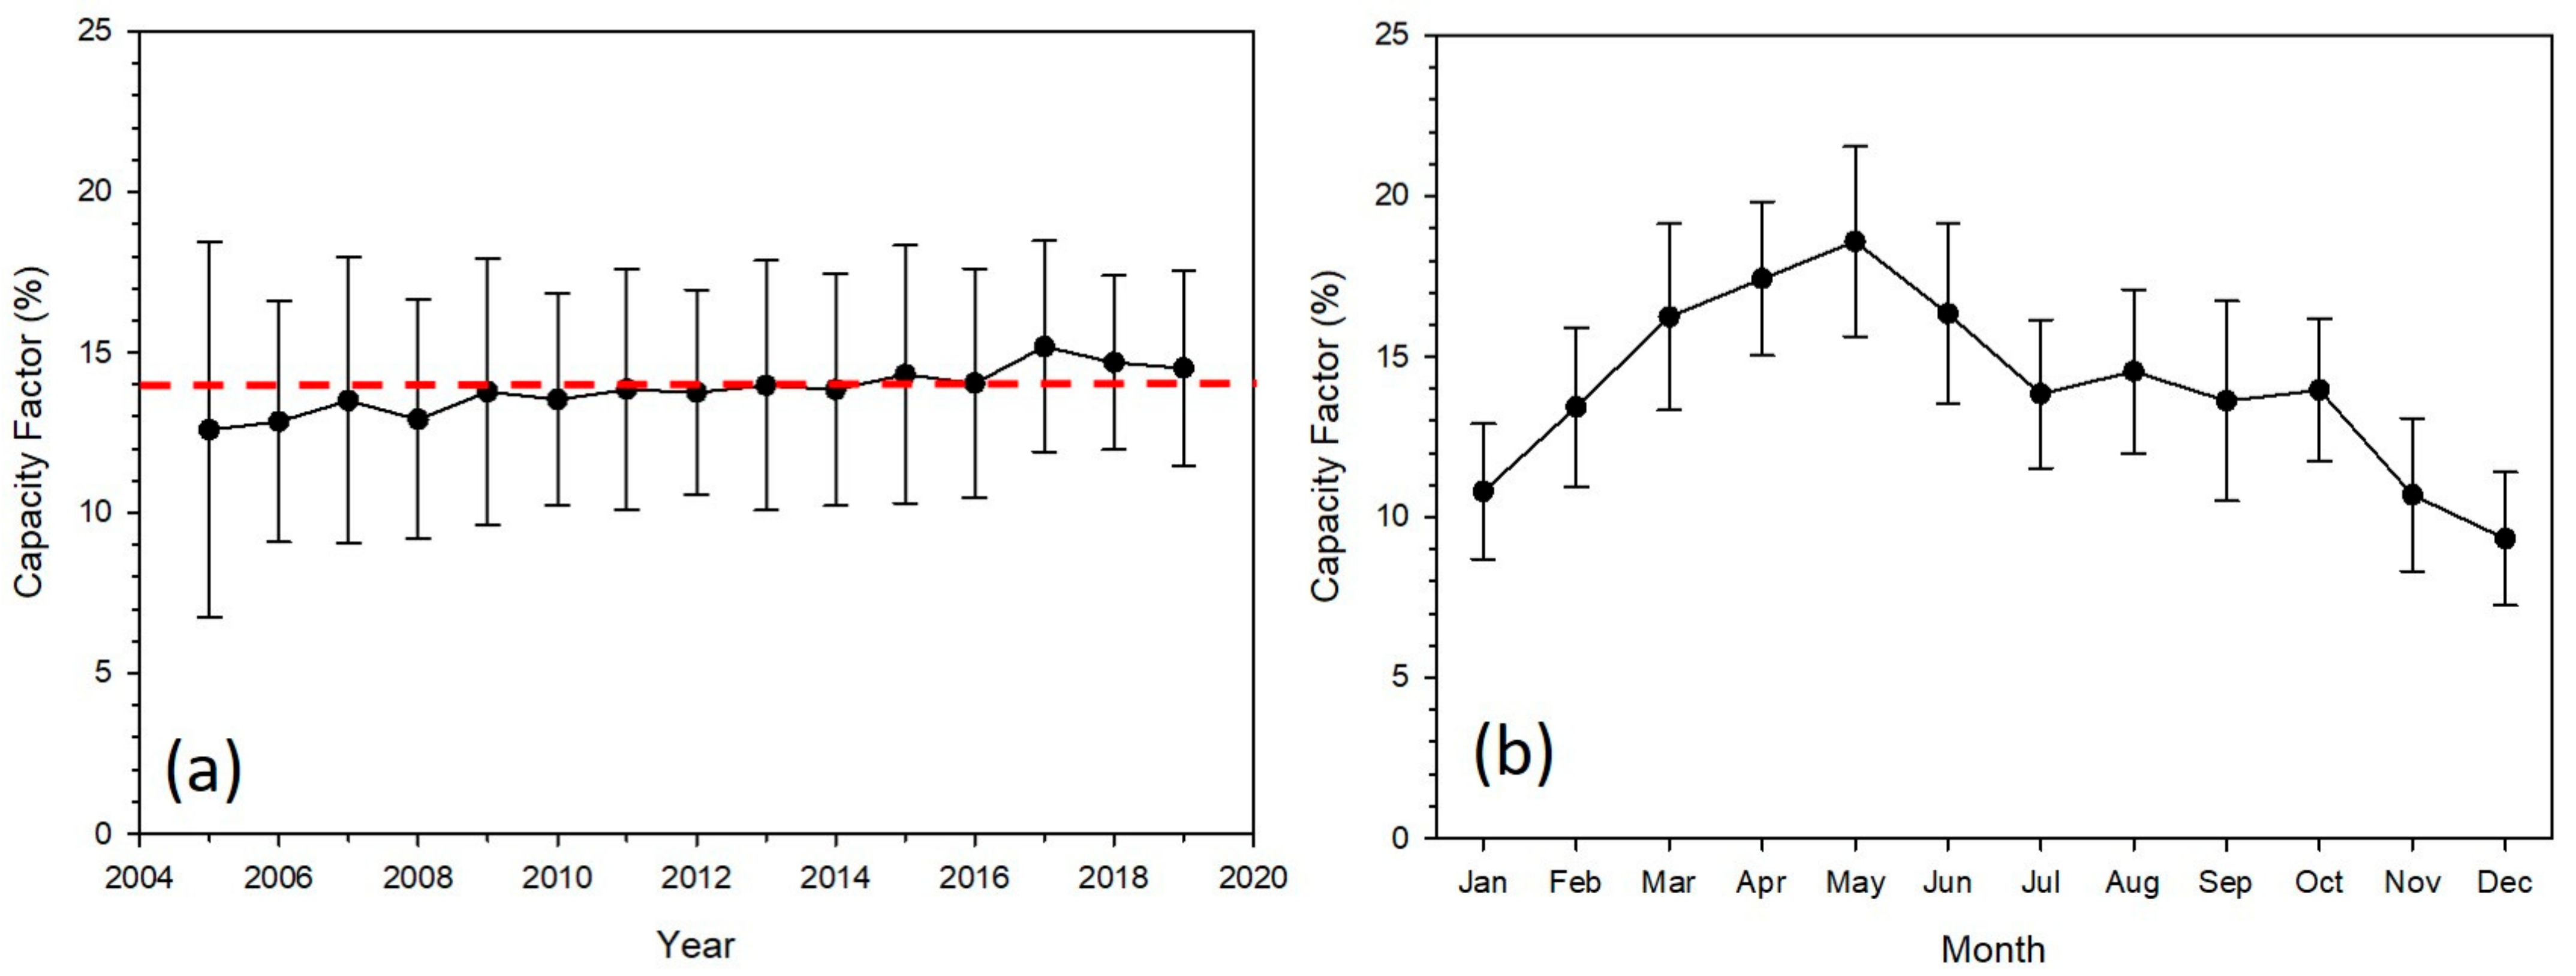
where AEP indicates the annual energy production, i.e., solar power generation for a year. Equation (3) is modified for the monthly capacity factor to which the monthly energy production is employed. Figure 9a demonstrates the annual capacity factor of PV power plants over the Korean Peninsula, from 2005 to 2019. The actual capacity factors are calculated by solar power generation and capacity, which are extracted from the EPSIS data operated by KPX. The annual capacity factor gradually increases with an average capacity factor of 13.8% over 15 years. The length of the bar every year implies the magnitude of monthly variation for each year; the monthly variation has decreased in the late 2010s. The rank correlation between the standard deviation of the monthly capacity factor and year is displayed in Figure 10a, which provides good evidence to prove the inter-annual trend of monthly variation. A negative value of −0.714 was recognized in the correlation. The monthly variation in the capacity factor is illustrated in Figure 9b, with inter-annual variability (=length of bar in Figure 9b). The capacity factors were relatively higher in the spring season; the opposite was observed in the monsoon season. The behavior of the capacity factor is similar to that of solar irradiance in Figure 7b (see the solar irradiance in the average year in Figure 7b). This seems logical because the capacity factor is dependent on the actual power generation by PV power plants that are pre-dominated by incoming solar irradiance. Figure 10b demonstrates that the monthly capacity is highly correlated with the daily total irradiance averaged for each month, with a determination coefficient of 0.894.
The technological sophistication of PV power systems over the years is the reason why monthly variation has reduced with time. For example, the champion PV module efficiency chart, examined by NREL [55], shows that, on average, PV module efficiency has increased by 20% from 2005 to 2020. In Korea, installed PV capacity has drastically increased during the last decade (Figure 11). Consequently, a PV module with higher efficiency can generate electricity, even at lower solar insolation; the annual capacity factor could be increased throughout the year.
The UASIBS–KIER model output was employed to estimate the capacity factor in Korea. Due to a lack of information on PV plants, the annual capacity factor from the UASIBS–KIER model was derived, with the following assumptions [56]:
  • The plane of array irradiance is not considered.
  • The effect of cell temperature on the nameplate efficiency is ignored.
  • The peak power of PV module is the same for all grid cells in the model.
  • With the aforementioned assumptions, the capacity factor is formulated by Equation (4), as follows:
    CF   ( % ) = i = 1 365 DTI ( kWh   m 2   d 1 ) 1000   ( W   m 2 )   ×   Capacity   ( W ) Capacity   ( W )   ×   8760   ( h ) × 100 ,
    where DTI is the total daily irradiance. Equation (4) is calculated for 365 days, as it is the annual capacity factor. When applied to the monthly capacity factor, the number of days for each month was employed, instead of days in the year. Statistical analysis was performed to identify the reliability of the modeling output against the measurements. Figure 12 shows a scatter plot of the monthly capacity factor between EPSIS and the UASIBS–KIER model. The Pearson correlation and determination coefficients are 0.912 and 0.832, respectively, inferring that the UASIBS–KIER model is sufficiently reliable to represent the PV output and solar irradiance. The slope of the linear regression, however, was 1.301, i.e., the UASIBS–KIER model overestimated the capacity factor when the measurements exceeded 15%. Vilanova et al. [57] stated that solar irradiance is not directly proportional to PV output, because higher solar insolation plays a role in heating the solar cell itself. This reduces the efficiency of the PV module. For simplicity, however, this study ignored the effect of cell temperature on the PV module. Consequently, the PV output is commensurate with the solar irradiance, regardless of the solar cell influence.
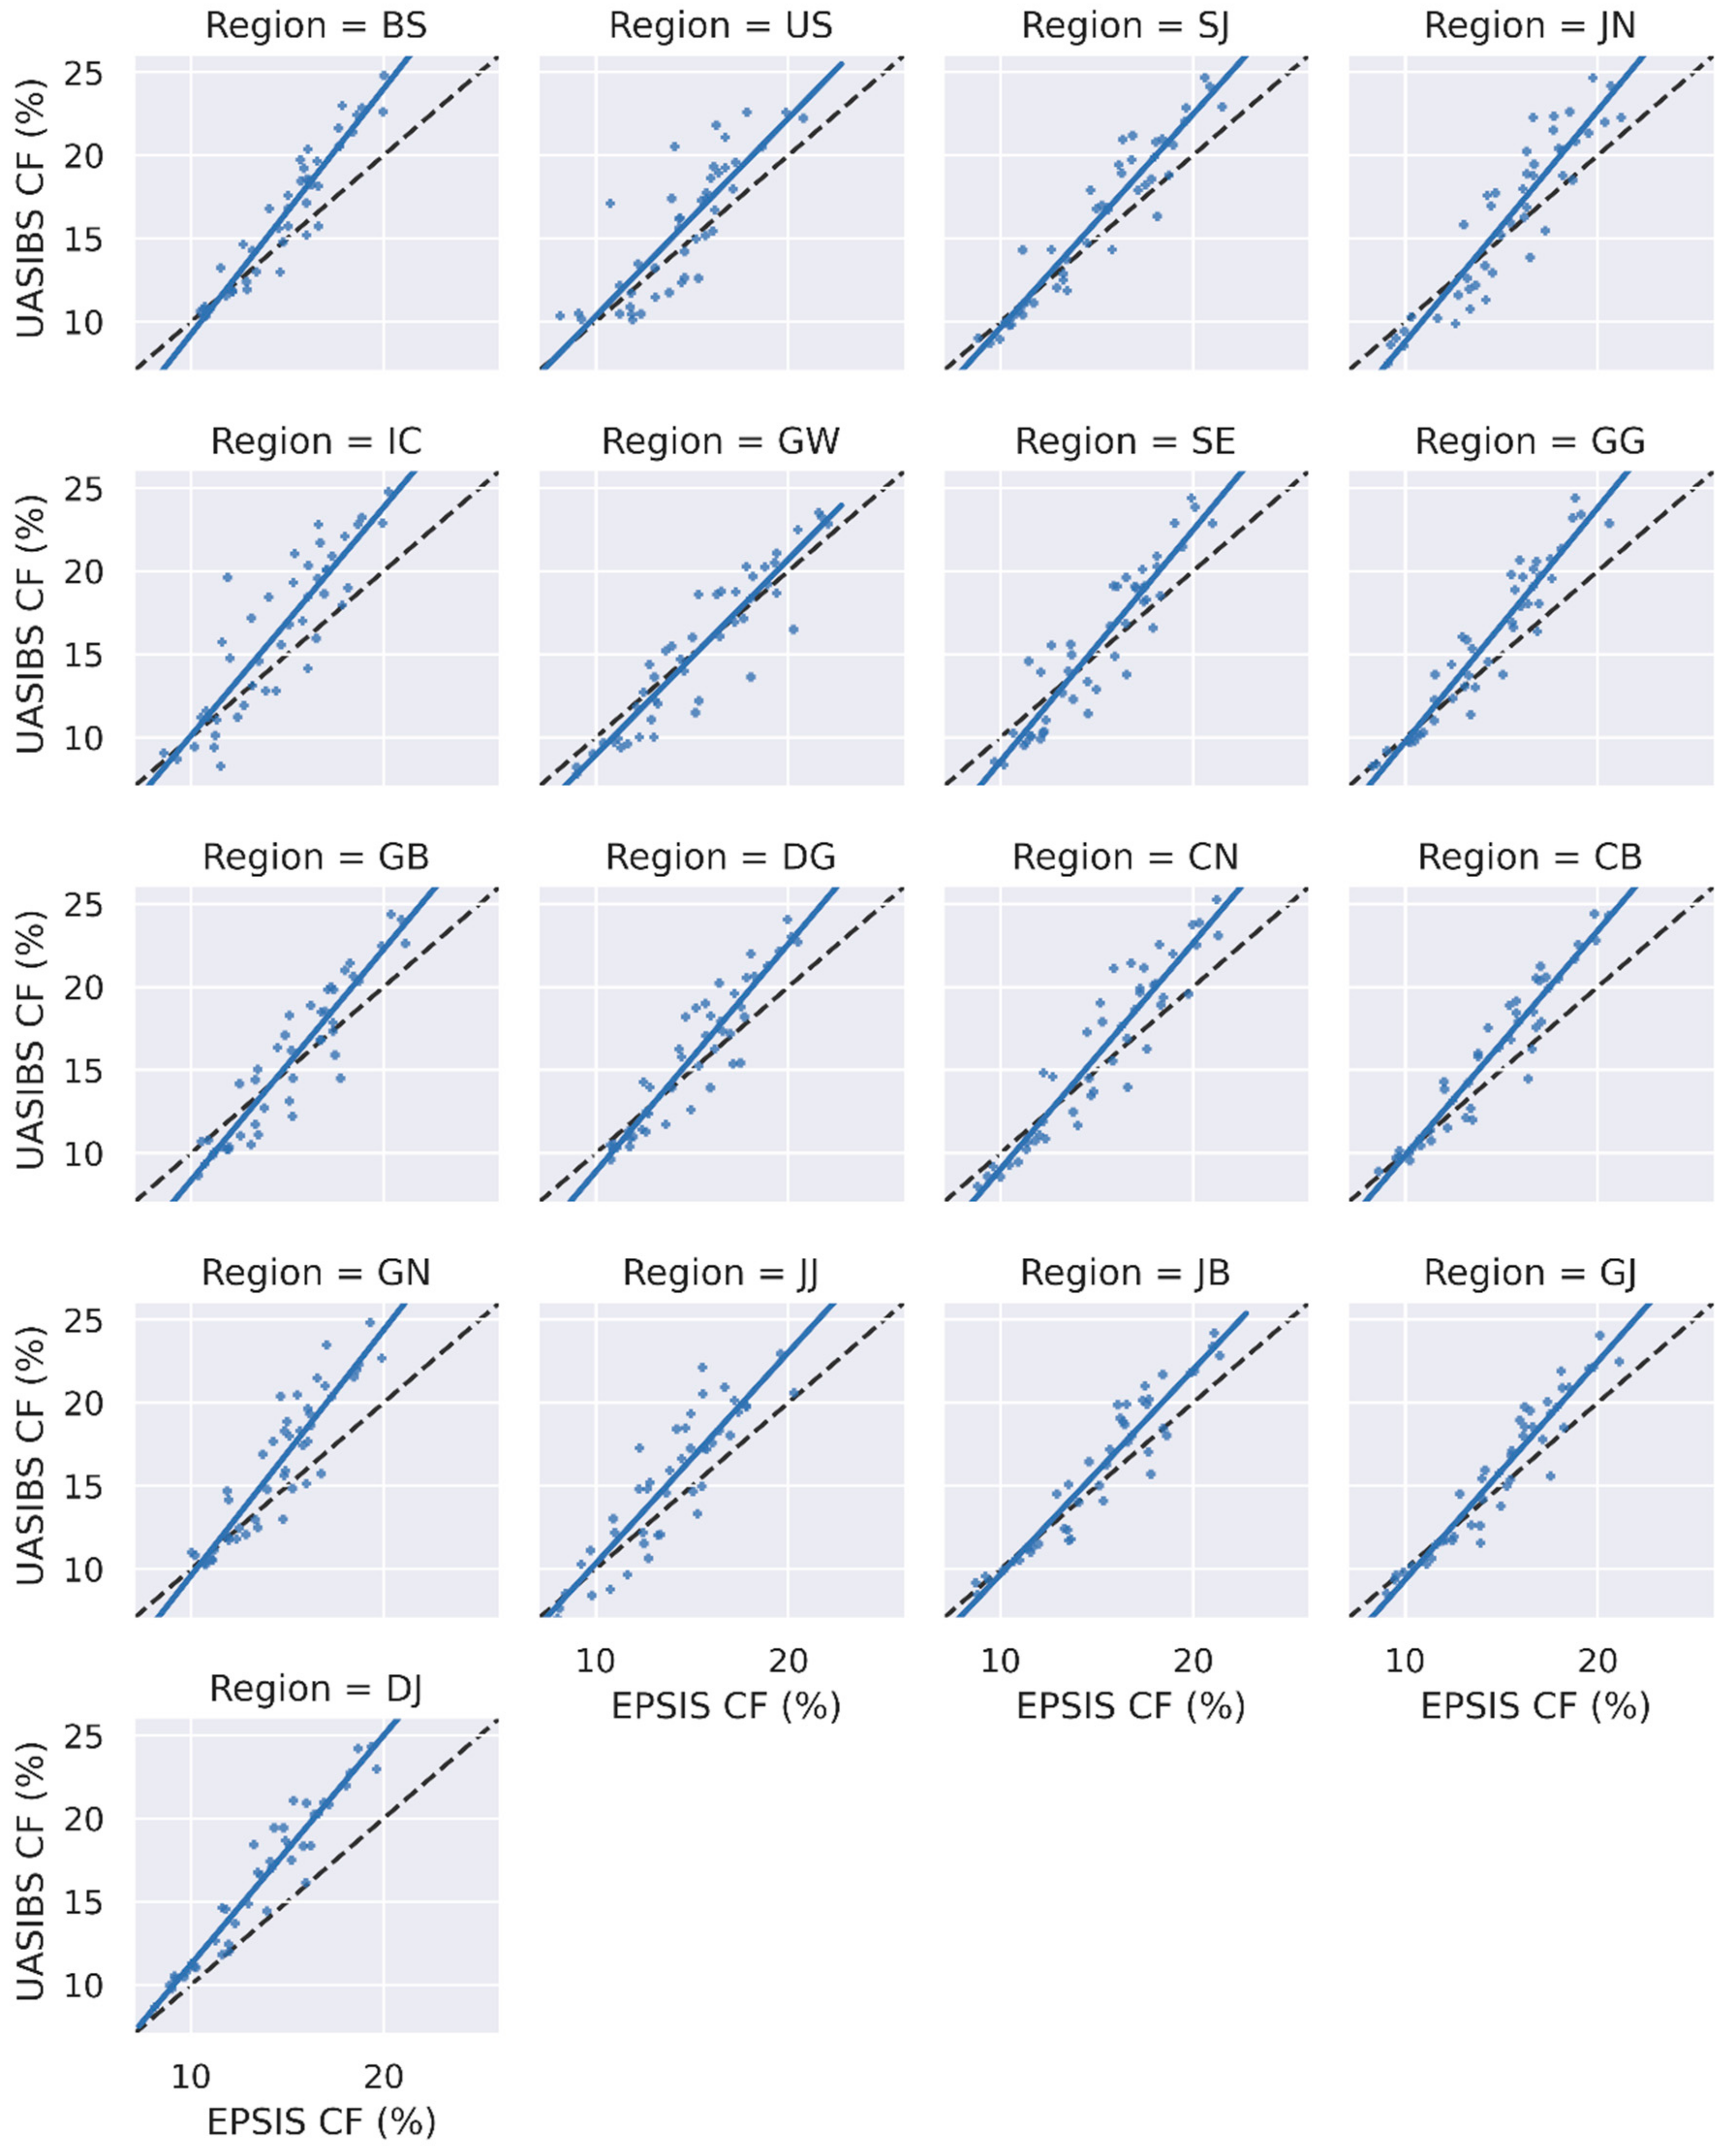
Meanwhile, in Figure 13, the horizontal distributions of the annual capacity factor, derived from the UASIBS–KIER model from 2016 to 2019, are demonstrated. The difference in the annual capacity factors between the 17 administrative divisions is not large enough to justify the local characteristics. Nevertheless, GN, BS, and JN are determined as administrative divisions in which the capacity factors are larger than the other divisions. This is similar to the results from the solar irradiance distribution shown in Figure 8. Moreover, the divisions GW and JJ are administrative divisions demonstrating relatively small capacity factors. Lastly, the monthly capacity factor was compared for each division from 2016 to 2019. Similarly to the annual capacity factor in Figure 12, an overestimation is observed for all the divisions with high correlation coefficients. Positive biases at larger EPSIS capacity factors might be related to the impact of cell temperature on the PV module efficiency. In general, the capacity factor is higher on a clear day in summer, because solar irradiance is not diffused by the cloud droplets. However, the electricity generation is not proportional to the incoming solar irradiance, since the high temperature on the PV module, raised by the solar insolation, makes the conversion rate into electricity worse. In Equation (4), we do not assume the cell-temperature impacts that play a role in reducing the capacity factor when solar irradiance is high. Therefore, the effect of cell temperature on the PV module must be considered, to reduce the positive bias of the capacity factor (Figure 14).

6. Conclusions

Korean solar irradiance datasets for the long-term period were built using the UASIBS–KIER model, with geostationary satellite imagery that is available in Korea. The monthly estimations appear to be unbiased, because the rMBE is only 0.2% for all the stations. These results are also consistent with the higher correlation coefficient of 0.92. The dispersion of estimates results in an rMAE of 9.4%. The local characteristics of rMBE are interesting; they are positive in metropolitan regions, but negative in mountainous regions. AOD profiles, used in generating the look-up table, ensued from the in situ observation at Yonsei University, as part of the AERONET program. As the AERONET program was initiated in March 2011, the UASIBS–KIER model estimated the solar irradiance that was measured before 2011 using the climatological mean of the AOD data from the Yonsei University, from 2011 to 2019. This results in larger positive GHI estimates than that observed in the metropolitan region, as the AOD that is lower than the actual observation is parameterized into the UASIBS–KIER model. The UASIBS–KIER model with MTSAT-1R/2 satellites performed the best in deriving the solar irradiance, even if the spatial and temporal resolutions were better in the COMS than in the MTSAT series. The horizontal resolution of the MTSAT series was 4 km, but the COMS produced the imagery at 1 km. Therefore, by upscaling into coarse resolution, the biases can be eliminated from each other, as a result of smoothing.
Solar resources have been gradually increasing in Korea, at a rate of 0.019 kWh m−2 d−1 per year. The daily total irradiance, averaged over 22 years, was 3.602 kWh m−2 d−1, which is equivalent to 3.6 h at the peak sun hour. From 1996 to 2019, the average year was determined to be 2007, which was when the average value of daily total irradiance was the closest to 3.602 kWh m−2 d−1. The dark and bright years are set as 1998 and 2019, respectively, based on the annual mean of the daily total irradiance. The distinct difference between the dark and bright years is the solar irradiance in the spring season. In Korea, clear skies prevail from March to May. During this period, on average, the peak sun hours every day were an hour longer in the bright year than in the dark year. Out of the 17 administrative divisions, the GN, JN, and BS divisions that belong to the southern part of the Korean Peninsula were divisions with comparatively more solar irradiance than the other divisions. In contrast to these divisions, GW located in a mountainous region was recognized as a region with a relatively small amount of solar resources.
As an application of the PV power system, the annual capacity factor averaged over 15 years, from 2005 to 2019, is computed to be 13.8%, based on EPSIS data. The capacity factor is derived from the GHI estimates using the UASIBS–KIER model. The correlation coefficient between the model estimates and EPSIS data is 0.912, which implies that the UASIBS–KIER model is capable of extending the viability of this study in renewable energy. However, positive biases appear at larger capacity factors, as recorded by EPSIS. Therefore, this study did not consider the temperature dependence of the efficiency of the PV module. When solar insolation is high, the surface temperature of the PV module also increases, thereby lowering the efficiency of the module. Consistent with the solar resource map, the southern part of the Korean Peninsula is determined as a region where the annual capacity factor is larger than the other parts. This study is the first to estimate solar irradiance values as a gridded dataset in Korea for a long period. The reliable solar irradiance datasets, built by the UASBIS–KIER model, are expected to contribute to the typical meteorological year data for energy system modeling.

Author Contributions

C.K.K. and H.-G.K. conceptualized and designed the study. B.K., C.-Y.Y. and J.Y.K. provided the data for system. Y.-H.K. gave insight into the research and then H.-G.K. supervised the research. C.K.K. wrote sections of the manuscript. All authors contributed to the manuscript revision, read, and approved the submitted version. All authors have read and agreed to the published version of the manuscript.

Funding

This work was conducted under framework of the research and development program of the Korea Institute of Energy Research (C1-2410).

Data Availability Statement

The original contributions presented in the study are included in the article; further inquiries can be directed to the corresponding author.

Acknowledgments

The authors express deep thanks to the Korea Power Exchange for providing the electricity generation data at the individual solar power plants.

Conflicts of Interest

The authors declare no conflict of interest.

References

  1. Zelenka, A.; Perez, R.; Seals, R.; Renné, D. Effective Accuracy of Satellite-Derived Hourly Irradiances. Theor. Appl. Climatol. 1999, 62, 199–207. [Google Scholar] [CrossRef]
  2. Vignola, F.; Harlan, P.; Perez, R.; Kmiecik, M. Analysis of satellite derived beam and global solar radiation data. Sol. Energy 2007, 81, 768–772. [Google Scholar] [CrossRef]
  3. Chow, C.W.; Urquhart, B.; Lave, M.; Dominguez, A.; Kleissl, J.; Shields, J.; Washom, B. Intra-hour forecasting with a total sky imager at the UC San Diego solar energy testbed. Sol. Energy 2011, 85, 2881–2893. [Google Scholar] [CrossRef] [Green Version]
  4. Kleissl, J.P. Solar Energy Forecasting and Resource Assessment, 1st ed.; Academic Press: Cambridge, MA, USA, 2013; 2p. [Google Scholar]
  5. He, G.; Kammen, D.M. Where, when and how much solar is available? A provincial-scale solar resource assessment for China. Renew. Energy 2016, 85, 74–82. [Google Scholar] [CrossRef] [Green Version]
  6. Wegertseder, P.; Lund, P.; Mikkola, J.; Alvarado, R.G. Combining solar resource mapping and energy system integration methods for realistic valuation of urban solar energy potential. Sol. Energy 2016, 135, 325–336. [Google Scholar] [CrossRef]
  7. Gilgen, H.; Wild, M.; Ohmura, A. Means and Trends of Shortwave Irradiance at the Surface Estimated from Global Energy Balance Archive Data. J. Clim. 1998, 11, 2042–2061. [Google Scholar] [CrossRef]
  8. Stanhill, G.; Cohen, S. Solar Radiation Changes in the United States during the Twentieth Century: Evidence from Sunshine Duration Measurements. J. Clim. 2005, 18, 1503–1512. [Google Scholar] [CrossRef]
  9. Bishop, J.K.B.; Rossow, W.B. Spatial and temporal variability of global surface solar irradiance. J. Geophys. Res. Ocean. 1991, 96, 16839–16858. [Google Scholar] [CrossRef]
  10. Bishop, J.K.B.; Rossow, W.B.; Dutton, E.G. Surface solar irradiance from the International Satellite Cloud Climatology Project 1983–1991. J. Geophy. Res. 1997, 102, 6883–6910. [Google Scholar] [CrossRef]
  11. Janjai, S.; Pankaew, P.; Laksanaboonsong, J.; Kitichantaropas, P. Estimation of solar radiation over Cambodia from long-term satellite data. Renew. Energy 2011, 36, 1214–1220. [Google Scholar] [CrossRef]
  12. Sengupta, M.; Xie, Y.; Lopez, A.; Habte, A.; Maclaurin, G.; Shelby, J. The National Solar Radiation Data Base (NSRDB). Renew. Sustain. Energy Rev. 2018, 89, 51–60. [Google Scholar] [CrossRef]
  13. Haupt, S.E.; Kosović, B. Variable Generation Power Forecasting as a Big Data Problem. IEEE Trans. Sustain. Energy 2017, 8, 725–732. [Google Scholar] [CrossRef]
  14. Gautier, C.; Diak, G.; Masse, S. A Simple Physical Model to Estimate Incident Solar Radiation at the Surface from GOES Satellite Data. J. Appl. Meteorol. Climatol. 1980, 19, 1005–1012. [Google Scholar] [CrossRef] [Green Version]
  15. Moser, W.; Raschke, E. Incident Solar Radiation over Europe Estimated from METEOSAT Data. J. Clim. Appl. Meteorol. 1984, 23, 166–170. [Google Scholar] [CrossRef] [Green Version]
  16. Noia, M.; Ratto, C.F.; Festa, R. Solar irradiance estimation from geostationary satellite data: I. Statistical models. Sol. Energy 1993, 51, 449–456. [Google Scholar] [CrossRef]
  17. Pinker, R.T.; Ewing, J.A. Modeling Surface Solar Radiation: Model Formulation and Validation. J. Clim. Appl. Meteorol. 1985, 24, 389–401. [Google Scholar] [CrossRef] [Green Version]
  18. Pinker, R.T.; Laszlo, I. Modeling Surface Solar Irradiance for Satellite Applications on a Global Scale. J. Appl. Meteorol. 1992, 31, 194–211. [Google Scholar] [CrossRef] [Green Version]
  19. Li, Z.; Leighton, H.G. Global climatologies of solar radiation budgets at the surface and in the atmosphere from 5 years of ERBE data. J. Geophys. Res. 1993, 98, 4919–4930. [Google Scholar] [CrossRef]
  20. Gupta, S.K.; Ritchey, N.A.; Wilber, A.C.; Whitlock, C.H.; Gibson, G.G.; Stackhouse, P.W. A Climatology of Surface Radiation Budget Derived from Satellite Data. J. Clim. 1999, 12, 2691–2710. [Google Scholar] [CrossRef]
  21. Pinker, R.T.; Tarpley, J.D.; Laszlo, I.; Mitchell, K.E.; Houser, P.R.; Wood, E.F.; Schaake, J.C.; Robock, A.; Lohmann, D.; Cosgrove, B.A.; et al. Surface radiation budgets in support of the GEWEX Continental-Scale International Project (GCIP) and the GEWEX Americas Prediction Project (GAPP), including the North American Land Data Assimilation System (NLDAS) project. J. Geophys. Res. 2003, 108, 8844. [Google Scholar] [CrossRef]
  22. Wang, H.; Pinker, R.T. Shortwave radiative fluxes from MODIS: Model development and implementation. J. Geophys. Res. 2009, 114, D20201. [Google Scholar] [CrossRef]
  23. Ma, Y.; Pinker, R.T. Modeling shortwave radiative fluxes from satellites. J. Geophys. Res. 2012, 117, D23202. [Google Scholar] [CrossRef]
  24. Kim, C.K.; Holmgren, W.F.; Stovern, M.; Betterton, E.A. Toward Improved Solar Irradiance Forecasts: Derivation of Downwelling Surface Shortwave Radiation in Arizona from Satellite. Pure Appl. Geophys. 2016, 173, 2535–2553. [Google Scholar] [CrossRef]
  25. Deneke, H.M.; Feijt, A.J.; Roebeling, R.A. Estimating surface solar irradiance from METEOSAT SEVIRI-derived cloud properties. Remote Sens. Environ. 2008, 112, 3131–3141. [Google Scholar] [CrossRef]
  26. Journée, M.; Müller, R.; Bertrand, C. Solar resource assessment in the Benelux by merging Meteosat-derived climate data and ground measurements. Sol. Energy 2012, 86, 3561–3574. [Google Scholar] [CrossRef]
  27. Nikitidou, E.; Kazantzidis, A.; Tzoumanikas, P.; Salamalikis, V.; Bais, A.F. Retrieval of surface solar irradiance, based on satellite-derived cloud information, in Greece. Energy 2015, 90, 776–783. [Google Scholar] [CrossRef]
  28. Kazantzidis, A.; Nikitidou, E.; Salamalikis, V.; Tzoumanikas, P.; Zagouras, A. New challenges in solar energy resource and forecasting in Greece. Int. J. Sustain. Energy 2018, 37, 428–435. [Google Scholar] [CrossRef]
  29. Tanahashi, S.; Kawamura, H.; Matsuura, T.; Takahashi, T.; Yusa, H. Improved Estimates of Hourly Insolation from GMS S-VISSR Data. Remote Sens. Environ. 2000, 74, 409–413. [Google Scholar] [CrossRef]
  30. Janjai, S.; Laksanaboonsong, J.; Nunez, M.; Thongsathitya, A. Development of a method for generating operational solar radiation maps from satellite data for a tropical environment. Sol. Energy 2005, 78, 739–751. [Google Scholar] [CrossRef]
  31. Lu, N.; Liu, R.; Liu, J.; Liang, S. An algorithm for estimating downward shortwave radiation from GMS 5 visible imagery and its evaluation over China. J. Geophys. Res. 2010, 115. [Google Scholar] [CrossRef]
  32. Blanksby, C.; Bennett, D.; Langford, S. Improvement to an existing satellite data set in support of an Australia solar atlas. Sol. Energy 2013, 98, 111–124. [Google Scholar] [CrossRef]
  33. Zhang, X.; Liang, S.; Zhou, G. Estimating downward surface shortwave radiation using MTSAT-1R and ground measurements data by Bayesian maximum entropy method. In Proceedings of the 2013 IEEE International Geoscience and Remote Sensing Symposium—IGARSS, Melbourne, VIC, Australia, 21–26 July 2013; pp. 1541–1543. [Google Scholar]
  34. Dehghan, A.; Prasad, A.A.; Sherwood, S.C.; Kay, M. Evaluation and improvement of TAPM in estimating solar irradiance in Eastern Australia. Sol. Energy 2014, 107, 668–680. [Google Scholar] [CrossRef]
  35. Yeom, J.-M.; Han, K.-S.; Lee, C.-S.; Kim, D.-Y. An Improved Validation Technique for the Temporal Discrepancy when Estimated Solar Surface Insolation Compare with Ground-based Pyranometer: MTSAT-1R Data use. Korean J. Remote Sens. 2008, 24, 605–612. [Google Scholar]
  36. Lee, K.; Yoo, H.; Levermore, G.J. Quality control and estimation hourly solar irradiation on inclined surfaces in South Korea. Renew. Energy 2013, 57, 190–199. [Google Scholar] [CrossRef]
  37. Jee, J.-B.; Zo, I.-S.; Lee, K.-T. A Study on the Retrievals of Downward Solar Radiation at the Surface based on the Observations from Multiple Geostationary Satellites. Korean J. Remote Sens. 2013, 29, 123–135. [Google Scholar] [CrossRef]
  38. Zo, I.-S.; Jee, J.-B.; Lee, K.-T. Development of GWNU (Gangneung-Wonju National University) one-layer transfer model for calculation of solar radiation distribution of the Korean peninsula. Asia-Pac. J. Atmos. Sci. 2014, 50, 575–584. [Google Scholar] [CrossRef]
  39. Kim, C.K.; Kim, H.-G.; Kang, Y.-H.; Yun, C.-Y. Toward Improved Solar Irradiance Forecasts: Comparison of the Global Horizontal Irradiances Derived from the COMS Satellite Imagery over the Korean Peninsula. Pure Appl. Geophys. 2017, 174, 2773–2792. [Google Scholar] [CrossRef]
  40. Kim, C.K.; Kim, H.-G.; Kang, Y.-H.; Yun, C.-Y.; Lee, Y.G. Intercomparison of Satellite-Derived Solar Irradiance from the GEO-KOMSAT-2A and HIMAWARI-8/9 Satellites by the Evaluation with Ground Observations. Remote Sens. 2020, 12, 2149. [Google Scholar] [CrossRef]
  41. OGD. Public Data Portal. Available online: https://www.data.go.kr/en/index.do (accessed on 1 March 2021).
  42. Kikuchi, T.; Kitsuregawa, M. GMS-5 Meteorological Satellite Image Database and Integrated Visualization System. IPSJ Rep. SIG8 (TOD10), 2001; (in Japanese with English abstract). [Google Scholar]
  43. Muñoz Sabater, J. ERA5-Land Hourly Data from 1981 to Present. Copernicus Climate Change Service (C3S) Climate Data Store (CDS). Available online: https://cds.climate.copernicus.eu/cdsapp#!/dataset/reanalysis-era5-land?tab=overview (accessed on 1 March 2021).
  44. Ineichen, P.; Barroso, C.S.; Geiger, B.; Hollmann, R.; Marsouin, A.; Mueller, R. Satellite Application Facilities irradiance products: Hourly time step comparison and validation over Europe. Int. J. Remote Sens. 2009, 30, 5549–5571. [Google Scholar] [CrossRef]
  45. Chou, M.-D.; Suarez, M.J. A Solar Radiation Parameterization for Atmospheric Studies; 1999–104606; Goddard Space Flight Center: Greenbelt, MD, USA, 1999; p. 65. [Google Scholar]
  46. Tilmes, S.; Lamarque, J.F.; Emmons, L.K.; Conley, A.; Schultz, M.G.; Saunois, M.; Thouret, V.; Thompson, A.M.; Oltmans, S.J.; Johnson, B.; et al. Technical Note: Ozonesonde climatology between 1995 and 2011: Description, evaluation and applications. Atmos. Chem. Phys. 2012, 12, 7475–7497. [Google Scholar] [CrossRef] [Green Version]
  47. Ruiz-Arias, J.A.; Dudhia, J.; Gueymard, C.A.; Pozo-Vázquez, D. Assessment of the Level-3 MODIS daily aerosol optical depth in the context of surface solar radiation and numerical weather modeling. Atmos. Chem. Phys. 2013, 13, 675–692. [Google Scholar] [CrossRef] [Green Version]
  48. Jedlovec, G.J.; Haines, S.L.; LaFontaine, F.J. Spatial and Temporal Varying Thresholds for Cloud Detection in GOES Imagery. Geosci. Remote Sens. IEEE Trans. 2008, 46, 1705–1717. [Google Scholar] [CrossRef]
  49. Rossow, W.B.; Walker, A.W.; Garder, L.C. Comparison of ISCCP and Other Cloud Amounts. J. Clim. 1993, 6, 2394–2418. [Google Scholar] [CrossRef] [Green Version]
  50. Nam, J.; Kim, S.-W.; Park, R.J.; Park, J.-S.; Park, S.S. Changes in column aerosol optical depth and ground-level particulate matter concentration over East Asia. Air Qual. Atmos. Health 2018, 11, 49–60. [Google Scholar] [CrossRef]
  51. Chung, Y.-S.; Yoon, M.-B.; Kim, H.-S. On Climate Variations and Changes Observed in South Korea. Clim. Chang. 2004, 66, 151–161. [Google Scholar] [CrossRef]
  52. Ho, C.-H.; Lee, E.-J.; Lee, I.; Jeong, S.-J. Earlier spring in Seoul, Korea. Int. J. Climatol. 2006, 26, 2117–2127. [Google Scholar] [CrossRef]
  53. Ha, K.-J.; Heo, K.-Y.; Lee, S.-S.; Yun, K.-S.; Jhun, J.-G. Variability in the East Asian Monsoon: A review. Meteorol. Appl. 2012, 19, 200–215. [Google Scholar] [CrossRef]
  54. KMA. Climate of Korea. Available online: https://web.kma.go.kr/eng/biz/climate_01.jsp (accessed on 1 March 2021).
  55. NREL. Best Research-Cell Efficiency Chart. Available online: https://www.nrel.gov/pv/cell-efficiency.html (accessed on 1 March 2021).
  56. Dobos, A.P. PVWatts Version 5 Manual Technical Report NREL/TP-6A20-62641, 2014. [CrossRef] [Green Version]
  57. Vilanova, A.; Kim, B.-Y.; Kim, C.K.; Kim, H.-G. Linear-Gompertz Model-Based Regression of Photovoltaic Power Generation by Satellite Imagery-Based Solar Irradiance. Energies 2020, 13, 781. [Google Scholar] [CrossRef] [Green Version]
Figure 1. Map of the research area and 17 administrative divisions in Korea (a) and the topography and the locations of the ground observations (b). The number in (b) indicates the station index in Table 1.
Remotesensing 13 03422 g001
Figure 2. Scatter plot of the monthly mean of daily total irradiance between the ground observation (ASOS) and the satellite estimates (UASIBS) with probability density function of frequency for each dataset. The red dotted line indicates the reference line for perfect correlation.
Remotesensing 13 03422 g002
Figure 3. Same as Figure 2, but distributed for each ground station.
Remotesensing 13 03422 g003
Figure 4. The relative mean bias error for the monthly mean of daily total irradiance that is estimated by the UASBIS–KIER model with satellite imagery from 1996 to 2019.
Remotesensing 13 03422 g004
Figure 5. Correlation matrix of daily total irradiance averaged over each month from 1996 to 2019 between ground observation (ASOS), satellite estimates (UASIBS) and reanalysis (ERA-5). The green and orange colors indicate the dataset at 135 and 136 stations, respectively.
Remotesensing 13 03422 g005
Figure 6. Same as Figure 2, but distributed for every year.
Remotesensing 13 03422 g006
Figure 7. Time series of daily total irradiance that is estimated by the UASIBS–KIER model from 1996 to 2019 in Korea; annual mean (a) and monthly mean (b). The red and blue line in (a) indicate the average value for 22 years and trend line, respectively. The black, green and red line mean the monthly variations at dark, bright and average year, respectively.
Remotesensing 13 03422 g007
Figure 8. Horizontal distribution of annual mean of daily total irradiance (kWh m−2 d−1) that is estimated by the UASIBS–KIER model with GMS–5 (a), GOES–9 (b), MTSAT–1R/2 (c) and COMS (d).
Remotesensing 13 03422 g008
Figure 9. Capacity factor of photovoltaic systems in Korea with their standard deviation (bar) as a function of year (a) and month (b). Capacity factor in (a,b) is calculated by using EPSIS data. The red bar in (a) indicates the average value from 1996 to 2019.
Remotesensing 13 03422 g009
Figure 10. Scatter plots: (a) rank between year and σCF (standard deviation) that is EPSIS data, (b) capacity factor and monthly mean of daily total irradiance that is output from the UASIBS–KIER model.
Remotesensing 13 03422 g010
Figure 11. Annual capacity of photovoltaic system installed in Korea, based on the EPSIS data.
Remotesensing 13 03422 g011
Figure 12. Scatter plot of the annual capacity factors between the EPSIS data and the UASIBS–KIER model estimates with probability density function of frequency for each dataset. The red dotted line indicates the reference line for perfect correlation.
Remotesensing 13 03422 g012
Figure 13. Horizontal distribution of annual capacity factor that is estimated by the UASIBS–KIER model in 2016 (a), 2017 (b), 2018 (c), and 2019 (d).
Remotesensing 13 03422 g013
Figure 14. Same as Figure 12, but distributed for each administrative division in Korea.
Remotesensing 13 03422 g014
Table 1. Summary of the details for the ground observation stations.
Station IndexStation IDStation NameLatitude (°N)Longitude (°E)Information
1100Daegwallyeong37.6771128.7183Mountain
2101Chuncheon37.9026127.7357Rural
3105Gangneung37.7515128.8910Coast
4108Seoul37.5714126.9658City
5112Incheon37.4777126.6240City
6114Wonju37.3376127.9466Rural
7119Suwon37.2723126.9853City
8129Seosan36.7766126.4939Coast
9131Cheongju36.6392127.4407City
10133Daejeon36.372127.3721City
11135Chupungnyeong36.2202127.9946Mountain
12136Andong36.5729128.7073Rural
13143Daegu35.8280128.6522City
14146Jeonju35.8408127.1190City
15156Gwangju35.1729126.8916City
16159Busan35.1047129.0320City
17165Mokpo34.8169126.3812Coast
18184Jeju33.5141126.5297Island
Table 2. Summary of geostationary satellite employed in the UASIBS–KIER model from 1996 to 2019.
SatelliteGMS—5GOES—9MTSAT—1RMTSAT—2COMS
Data Availability1996.01~2003.062003.07~2005.062007.01~2009.122010.01~20111.122012.01~2019.12
InstrumentVISSRImagerJAMIJAMIMI
Spectral Bands
(μm)
0.5–1.05
10.5–11.5
11.5–12.5
6.5–7.0
0.55–0.75
3.8–4.0
10.5–11.5
11.5–12.5
6.5–7.0
0.55–0.90
3.5–4.0
10.3–11.3
11.5–12.5
6.5–7.0
0.55–0.90
3.5–4.0
10.3–11.3
11.5–12.5
6.5–7.0
0.55–0.90
3.5–4.0
10.3–11.3
11.5–12.5
6.5–7.0
Spatial Resolution0.05°0.05o4 km4 km1 km
Center Longitude140°E155°E140°E145°E128.2°E
Table 3. Summary of the relative mean bias error (rMBE, %) and root mean square error (rRMSE, %) for the hourly mean estimations from the UASIBS/KIER and KMA-INS models for the 18 KMA ground stations.
Station IndexStation IDASOS
(kWh m−2 d−1)
UASIBS
(kWh m−2 d−1)
RrMBE
(%)
rMAE
(%)
11003.7103.4710.930–5.8512.82
21013.6643.6330.975–0.647.09
31053.6933.5090.959–4.4810.50
41083.4033.7190.9679.7411.38
51123.6913.8070.9574.1810.55
61143.7153.6520.977–1.466.79
71193.5373.7300.9527.0312.29
81293.6723.7200.9681.939.06
91313.7043.7370.9691.127.28
101333.9893.7550.971–5.489.89
111353.6953.7290.9402.1011.53
121363.8133.8010.9650.8611.73
131433.8583.8210.971–0.357.72
141463.7033.7640.9682.479.98
151563.8343.7490.953–1.708.85
161593.8713.9240.9581.928.51
171653.8403.7910.978–1.006.88
181843.6453.6370.9760.029.23
Average3.7243.7190.9630.589.56
Table 4. Error statistics of satellite estimates for each satellite.
SatelliteRrMBE (%)rMAE (%)
GMS–50.9585.911.0
GOES–90.9227.310.7
MTSAT–1R/20.976−3.87.1
COMS0.974−3.99.4
Publisher’s Note: MDPI stays neutral with regard to jurisdictional claims in published maps and institutional affiliations.