Review

Forest Leaf Mass per Area (LMA) through the Eye of Optical Remote Sensing: A Review and Future Outlook

by
Tawanda W. Gara
1,*,
Parinaz Rahimzadeh-Bajgiran
1 and
Roshanak Darvishzadeh
2
1
School of Forest Resources, College of Natural Sciences, Forestry, and Agriculture, University of Maine, Orono, ME 04469, USA
2
Faculty of Geo-Information Science and Earth Observation (ITC), University of Twente, 7500 AE Enschede, The Netherlands
*
Author to whom correspondence should be addressed.
Remote Sens. 2021, 13(17), 3352; https://doi.org/10.3390/rs13173352
Submission received: 22 June 2021 / Revised: 6 August 2021 / Accepted: 19 August 2021 / Published: 24 August 2021
(This article belongs to the Special Issue Remote Sensing and Vegetation Mapping)

Abstract

:
Quantitative remote sensing of leaf traits offers an opportunity to track biodiversity changes from space. Augmenting field measurement of leaf traits with remote sensing provides a pathway for monitoring essential biodiversity variables (EBVs) over space and time. Detailed information on key leaf traits such as leaf mass per area (LMA) is critical for understanding ecosystem structure and functioning, and subsequently the provision of ecosystem services. Although studies on remote sensing of LMA and related constituents have been conducted for over three decades, a comprehensive review of remote sensing of LMA—a key driver of leaf and canopy reflectance—has been lacking. This paper reviews the current state and potential approaches, in addition to the challenges associated with LMA estimation/retrieval in forest ecosystems. The physiology and environmental factors that influence the spatial and temporal variation of LMA are presented. The scope of scaling LMA using remote sensing systems at various scales, i.e., near ground (in situ), airborne, and spaceborne platforms is reviewed and discussed. The review explores the advantages and disadvantages of LMA modelling techniques from these platforms. Finally, the research gaps and perspectives for future research are presented. Our review reveals that although progress has been made, scaling LMA to regional and global scales remains a challenge. In addition to seasonal tracking, three-dimensional modeling of LMA is still in its infancy. Over the past decade, the remote sensing scientific community has made efforts to separate LMA constituents in physical modelling at the leaf level. However, upscaling these leaf models to canopy level in forest ecosystems remains untested. We identified future opportunities involving the synergy of multiple sensors, and investigated the utility of hybrid models, particularly at the canopy and landscape levels.

Graphical Abstract

1. Introduction

Forests are a key component of the global biogeochemical cycle, and they harbor the majority of terrestrial biodiversity. Occupying over 30% of the Earth’s landscape, forests contribute to 80% of the total primary productivity of terrestrial ecosystems [1]. However, forests’ health and productivity are under increasing pressure from several biotic and abiotic stressors that include pests and diseases, climate change, and land-use change. These factors have hampered biodiversity conservation efforts, in addition to ecological services that humans derive from forests. Plants’ traits provide a diagnostic pathway for assessing forest ecosystem processes, functions, and services over space and time [2]. Traits are largely categorized into plant morphological, biochemical, anatomical, physiological, and phenological groupings. Biochemicals include chlorophyll, nitrogen, and carotenes, whereas morphological traits comprise leaf mass per area (LMA) and specific leaf area (SLA), among several others. Morphological traits such as LMA indicate plant functioning and productivity [3]. LMA, defined as the ratio of total mass of dry leaf to its surface area (g m−2), quantitatively expresses the plant economic spectrum strategy in terms of nutrients uptake and use, light harvesting, and carbon sequestration. LMA is a key variable of species traits—one of the six essential biodiversity variable (EBV) classes that are important for monitoring ecosystem structure and function [4]. As an ecological indicator, LMA is vital in examining, monitoring, reporting, and managing biodiversity change [5].
The enduring threats to forests require monitoring the state of forest health and productivity using key proxies such as LMA and other leaf traits [6]. Several studies demonstrated the intrinsic relationship between LMA, canopy photosynthetic capacity, and subsequently forest productivity [7,8,9]. Plant physiological studies also demonstrated changes in LMA constituents, including foliar nitrogen due to biotic disturbances such as pest infestation [10]. Therefore, timely and accurate monitoring of LMA is essential for the management of ecological systems. Although in situ measurements are the most accurate method of determining LMA, this approach is costly, time-consuming, inefficient, and spatially handicapped. Previous efforts to understand vegetation adaption to climate change and disturbance have been based on assessing patterns of trait data collected and archived in plant databases such as TRY (not an acronym) [11]. Although this approach can reveal changes in vegetation physiological pattern over time, it lacks the ability to understand plant trait dynamics at the landscape and regional scale. In situ measurements undeniably play a role in interpreting spectral signatures at both leaf and canopy levels. Data collected from field measurements play a key role in parameterizing, calibrating, and scaling traits using remote sensing models. LMA measured at the leaf level and upscaled to canopy level using the leaf area index (LAI) can be retrieved and mapped over large spatial extents using remotely sensed data [12]. Given its importance to ecology and biodiversity, the retrieval and estimation of LMA from spectral signals mandates more attention, especially in forest ecosystems, to complement the information on other key drivers of foliar reflectance.
Remote sensing instruments mounted on different platforms continue to acquire spectral data, which are critical for retrieving leaf traits, such as LMA, which mirror forest health and productivity over space and time [13]. Understanding the mechanism linking vegetation physiological properties and spectral signature acquired from satellite imagery dates to the 1970s, with the launch of Landsat in 1972, although research on vegetation-radiation can be traced to the 1920s [14]. Variations in LMA are known to control foliar optical properties, especially in the shortwave infrared (SWIR) region and therefore, spectral indices developed to estimate LMA have been predominantly optimized based on spectral data in the SWIR region of the spectrum [15,16,17]. For example, Wang et al. [18] successfully developed a normalized dry matter index (NDMI) centered on 1649 and 1722 nm based on PROSPECT simulations (R2 = 0.85, RMSE = 0.0019 g cm−2). The need to enhance the interpretation of spectral data has advanced physical modelling of vegetation using radiative transfer models (RTM) such as the leaf PROSPECT model (PROpriétésSPECTrales) [19,20]. LMA, as a key input into the PROSPECT model, has successfully been retrieved through model inversion at both leaf and canopy scales [21,22,23,24]. LMA constituents such as nitrogen, lignin, and cellulose have received commendable attention in research. Recent efforts have successfully separated LMA into carbon-based constituents, i.e., cellulose, lignin, hemicellulose, starch, and sugars, and nitrogen-based constituents (proteins), in the PROSPECT PRO model [22]. The PROSPECT model has been intricately coupled with canopy models such as Scattering by Arbitrary Inclined Leaves (SAIL) in PROSAIL and subsequently inverted to retrieve LMA [21,25].
Improvements in sensors’ design technology have enhanced the spectral, radiometric, spatial, and temporal resolutions of available data. As such, strategically positioned spectral measurements in the red-edge spectrum of remote sensing sensors (RapidEye and WorldView) and the expansion in the use of unmanned aerial systems (UASs) have increased the sensors’ capabilities and improved the spatial, spectral, and temporal resolutions of imagery data. These advancements, which have progressively expanded during the past two decades, have augmented the retrieval and estimation accuracy of LMA over time and space in different vegetation ecosystems. Despite progress made in remote sensing of LMA and findings indicating the potential to retrieve LMA across different global biomes [26], scaling LMA from leaf to canopy scales, and subsequently to a global scale, using multi-source remote sensing datasets calls for further research. There is a need to leverage remote sensing datasets of different spatial and spectral resolutions to improve LMA mapping from small study sites to regional and global scales. One major challenge with multi-source optical data is wavelength calibration, because different sensors have varying central wavelengths for each spectral band [27]. Spectral resampling of the spectral bands to new wavelengths is data and process intensive, and demands expert knowledge on spectral response functions.
There are several reviews on remote sensing of plant traits [12,28,29,30] covering various aspects of current technology; however, a comprehensive review focusing on LMA in the context of the forest ecosystem is not available. Therefore, the goal of this review paper is to present the contribution of remote sensing in the estimation and retrieval of LMA in forested ecosystems, and to provide a review of current approaches in LMA retrieval/estimation and their relative strengths and weaknesses. This review includes several inter-related sections. Following this introduction, LMA chemical composition and variations are described in Section 2. In Section 3, remote sensing of vegetation and leaf trait estimation is reviewed. In Section 4, remote sensing systems used for the LMA retrieval and estimation are introduced and discussed. Section 5 focuses on models available to estimate LMA from remote sensing data and their advantages and limitations. Finally, research gaps are identified and the future outlook is presented.

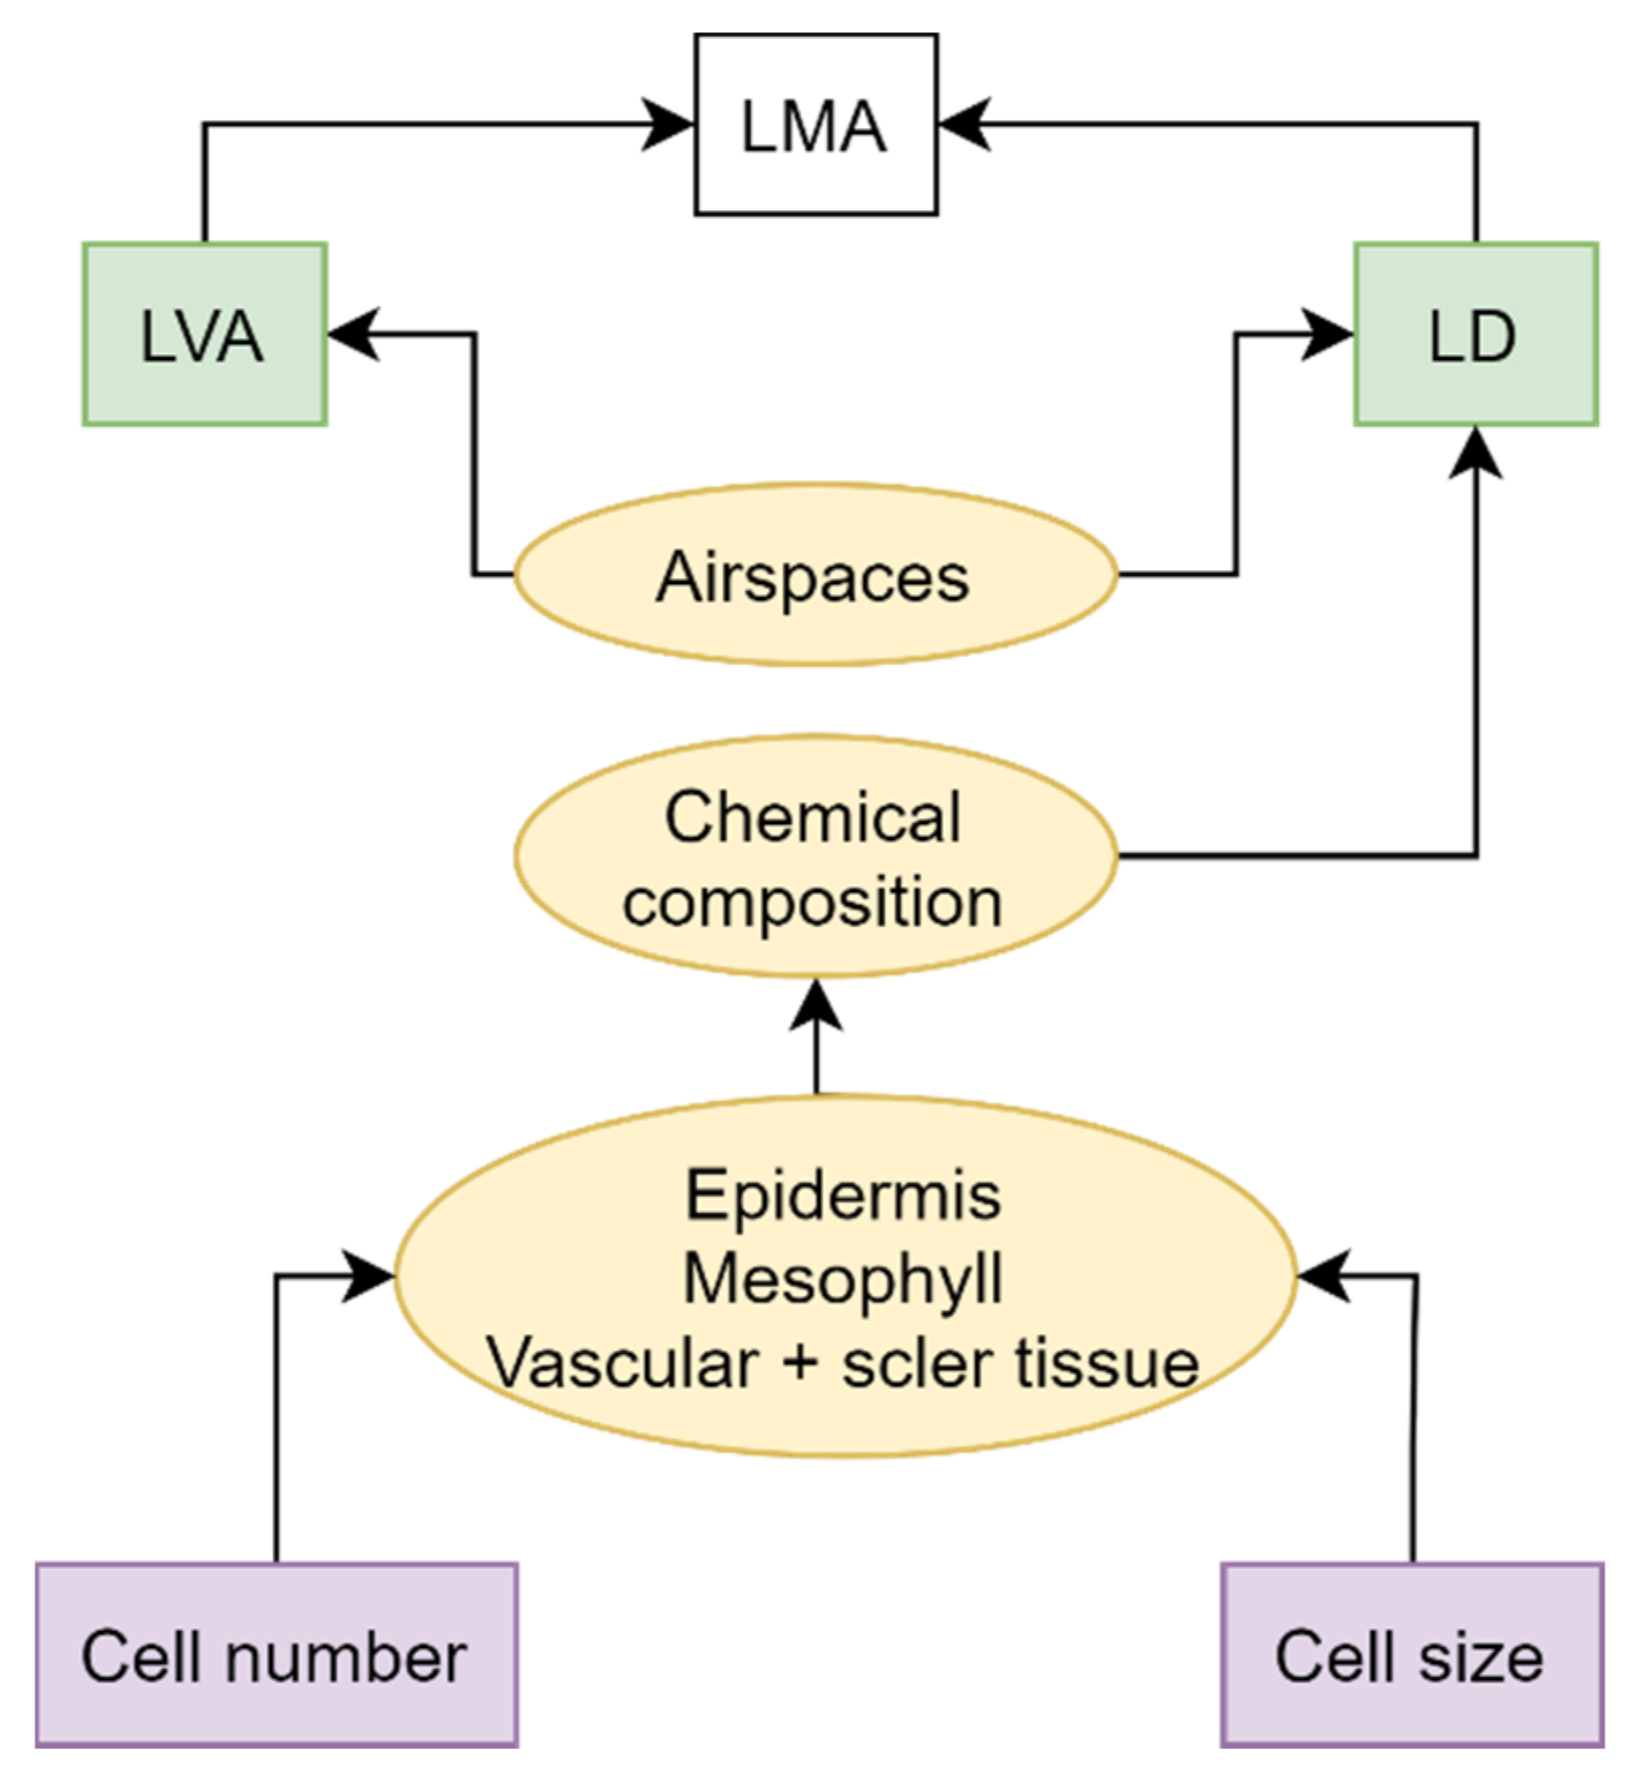
2. LMA Chemical Composition and Variation over Space and Time

LMA is a morphological trait that indicates the leaf economic spectrum (LES) with regard to a plant investment in leaf mass and storage strategies [31,32]. It is a functional trait that depicts plant performance with regard to growth strategies, reproduction, and survival, and provides a picture of vegetation dynamics and response to environmental change over space and time [33]. LMA is a key input parameter in dynamic global vegetation models and nutrient budget simulations. It is also a bio-indicator of water stress, pest infestation, and forest fire fuel availability [32,34,35]. Quantitative knowledge on LMA is critical in improving our understanding of the taxonomy of plant functional groups, plant physiological regulation, and the impact of environmental controls on ecosystem structure and functioning [36].
LMA (g cm−2) is the product of leaf density (LD, g cm−3) and the leaf volume to area ratio (LVA, cm3 cm−2) (Equation 1) [3,37]. There is no consensus on which of the two variables (LD or LVA) control variations in LMA, as the relationship between LD and LVA is species- dependent [38]. However, LD and LVA are determined by several factors, including airspaces in the spongy mesophyll layer, leaf chemical composition, thickness of the epidermis, and the size and number of cells within a leaf volume (Figure 1) [9]. Alternatively, LMA can be considered to be the total weight of the compounds that constitute leaf dry mass divided over its surface area (Equation 2). It is important to highlight that terms such as specific leaf weight (SLW) and mass-based leaf dry matter content (LDMC) have been used to refer to LMA in some studies [18,39,40,41]. The reciprocal of LMA is the specific leaf area (SLA, cm2 g−1). Measuring LMA as the ratio of dry weight and leaf surface is relatively easy and is widely used in the remote sensing of this trait.
LMA   g   cm 2 = LVA × LD
LMA   g   cm 2 = DW LA
where DW (g) is dry weight and LA (cm2) is leaf surface area.
Leaf dry mass consists of at least eight groups of compounds, i.e., minerals, organic acids, total non-structural carbohydrates (TNC; starch, soluble sugars, fructans), total structural carbohydrates (TSC; cellulose), soluble phenolics, proteins, lignin, and lipids. These compounds constitute approximately 90–95% of foliage dry biomass [3]. This entails a high concentration of LMA-related constituents in high-LMA vegetation communities compared to vegetation communities of low LMA. However, it is crucial to understand that these compounds do not increase proportionally with an increase in LMA. Minerals, lipids, and organic acids increase marginally from low to high LMA compared to TSC and lignin [3].
Explicitly, the relationship between LMA and its constituents is complex and depends on the expression used, i.e., concentration (mg g−1) or content (g cm−2) (Figure 2). In some instances, low-LMA species contain a high concentration (mg g−1) of proteins and minerals, and a low concentration of lignin and other secondary compounds. However, in general, the relationship between LMA and related constituents’ content is usually positive, i.e., high LMA yields high content (g cm−2) of protein, minerals, and lignin. Plants having low LMA have a short lifespan and are associated with an increased rate of photosynthesis and respiration per unit leaf dry mass. LMA controls forage quality and, subsequently, habitat selection and utilization of herbivores. Herbivores avoid species having high LMA as forage quality and digestibility declines with an increase in LMA due to an increase in lignin and TSC [42].
LMA varies widely between forest ecosystems. Poorter et al. [3] reported a 30–330 g m−2 variation in LMA, whereas other studies have reported maximum values of over 400 g m−2 [26,43,44]. Research demonstrates that LMA varies by over 70% between species [36], with over 26% variation occurring within an individual plant [45]. Although variation in LMA between species is determined by their respective growth strategies and anatomical composition, variation within an individual plant is primarily a function of the light gradient within a canopy [46,47]. Higher LMA contributes to a longer life span and nutrient retention of foliage material. For example, longer life-spanned evergreen foliage is characterized by high LMA, whereas short-seasoned deciduous foliage yields low LMA. Intrinsically, plants allocate more nutrients such as proteins to the upper illuminated leaves that receive the highest photon flux density compared to lower shaded leaves of low LMA [48]. The non-uniformity in LMA across the canopy vertical profile (three-dimensional space) improves plant photosynthetic capacity and light use efficiency by 20% and 30%, respectively [49]. The mechanisms behind the non-uniformity in nutrients across the canopy vertical profile are explained in detail by the optimization [47] and coordination theories [46]. LMA also phenologically varies between seasons due to ageing and changes in photoperiod, especially for deciduous vegetation. In evergreen coniferous forests, needles from the previous season are associated with higher LMA compared to young and fresh needles [50]. However, LMA gradually decreases with needle age. Across space and between ecosystems, LMA increases concomitantly with an increase in total photon irradiance integrated over the daily photon irradiance (DPI) [3]. Tropical forests and temperate evergreen forests generally yield higher LMA (Figure 3).
Soil properties such as nutrient and water availability affect spatial patterns in LMA. For example, LMA is known to increase with a gradient of decreasing soil water availability. Generally, plants thriving in water-limited environments are associated with low leaf expansion rates and are subsequently exhibit high leaf density [52]. The high leaf density results from tightly packed cells and limited air spaces within the leaf volume [53]. Soil nutrients, especially nitrogen and phosphorous, also affect leaf density, plant development, and growth. Inadequate soil nutrients substantially affect canopy biomass and LAI, and subsequently reduce overall canopy LMA. Plants extract less nutrients from depleted soils, which influences the net nutrients accumulated per leaf area and leaf density. Other soil properties that influence variation in LMA include type, salinity, and compactness [3]. Atmospheric composition, especially CO2 and ozone [54], also affects LMA over space and time. Above an ambient concentration of atmospheric CO2, leaves accumulate starch, resulting in increased leaf thickness and subsequently high LMA. However, the effect of atmospheric gases is negligible compared to soil fertility.
Finally, understanding the factors that influence spatial and temporal variations in LMA is essential in designing sampling protocols that can adequately capture the variation in LMA within a study site [3]. Representative samples from each vegetation type, elevation, and soil thematic class should constitute the complete dataset available for LMA modelling [55]. Sampling should be performed in vegetation communities that represent the key environmental gradients within a landscape. Accordingly, stratified random sampling remains a popular technique in the selection of sampling locations for vegetation trait estimation.

3. Remote Sensing of Forest LMA and Its Scaling
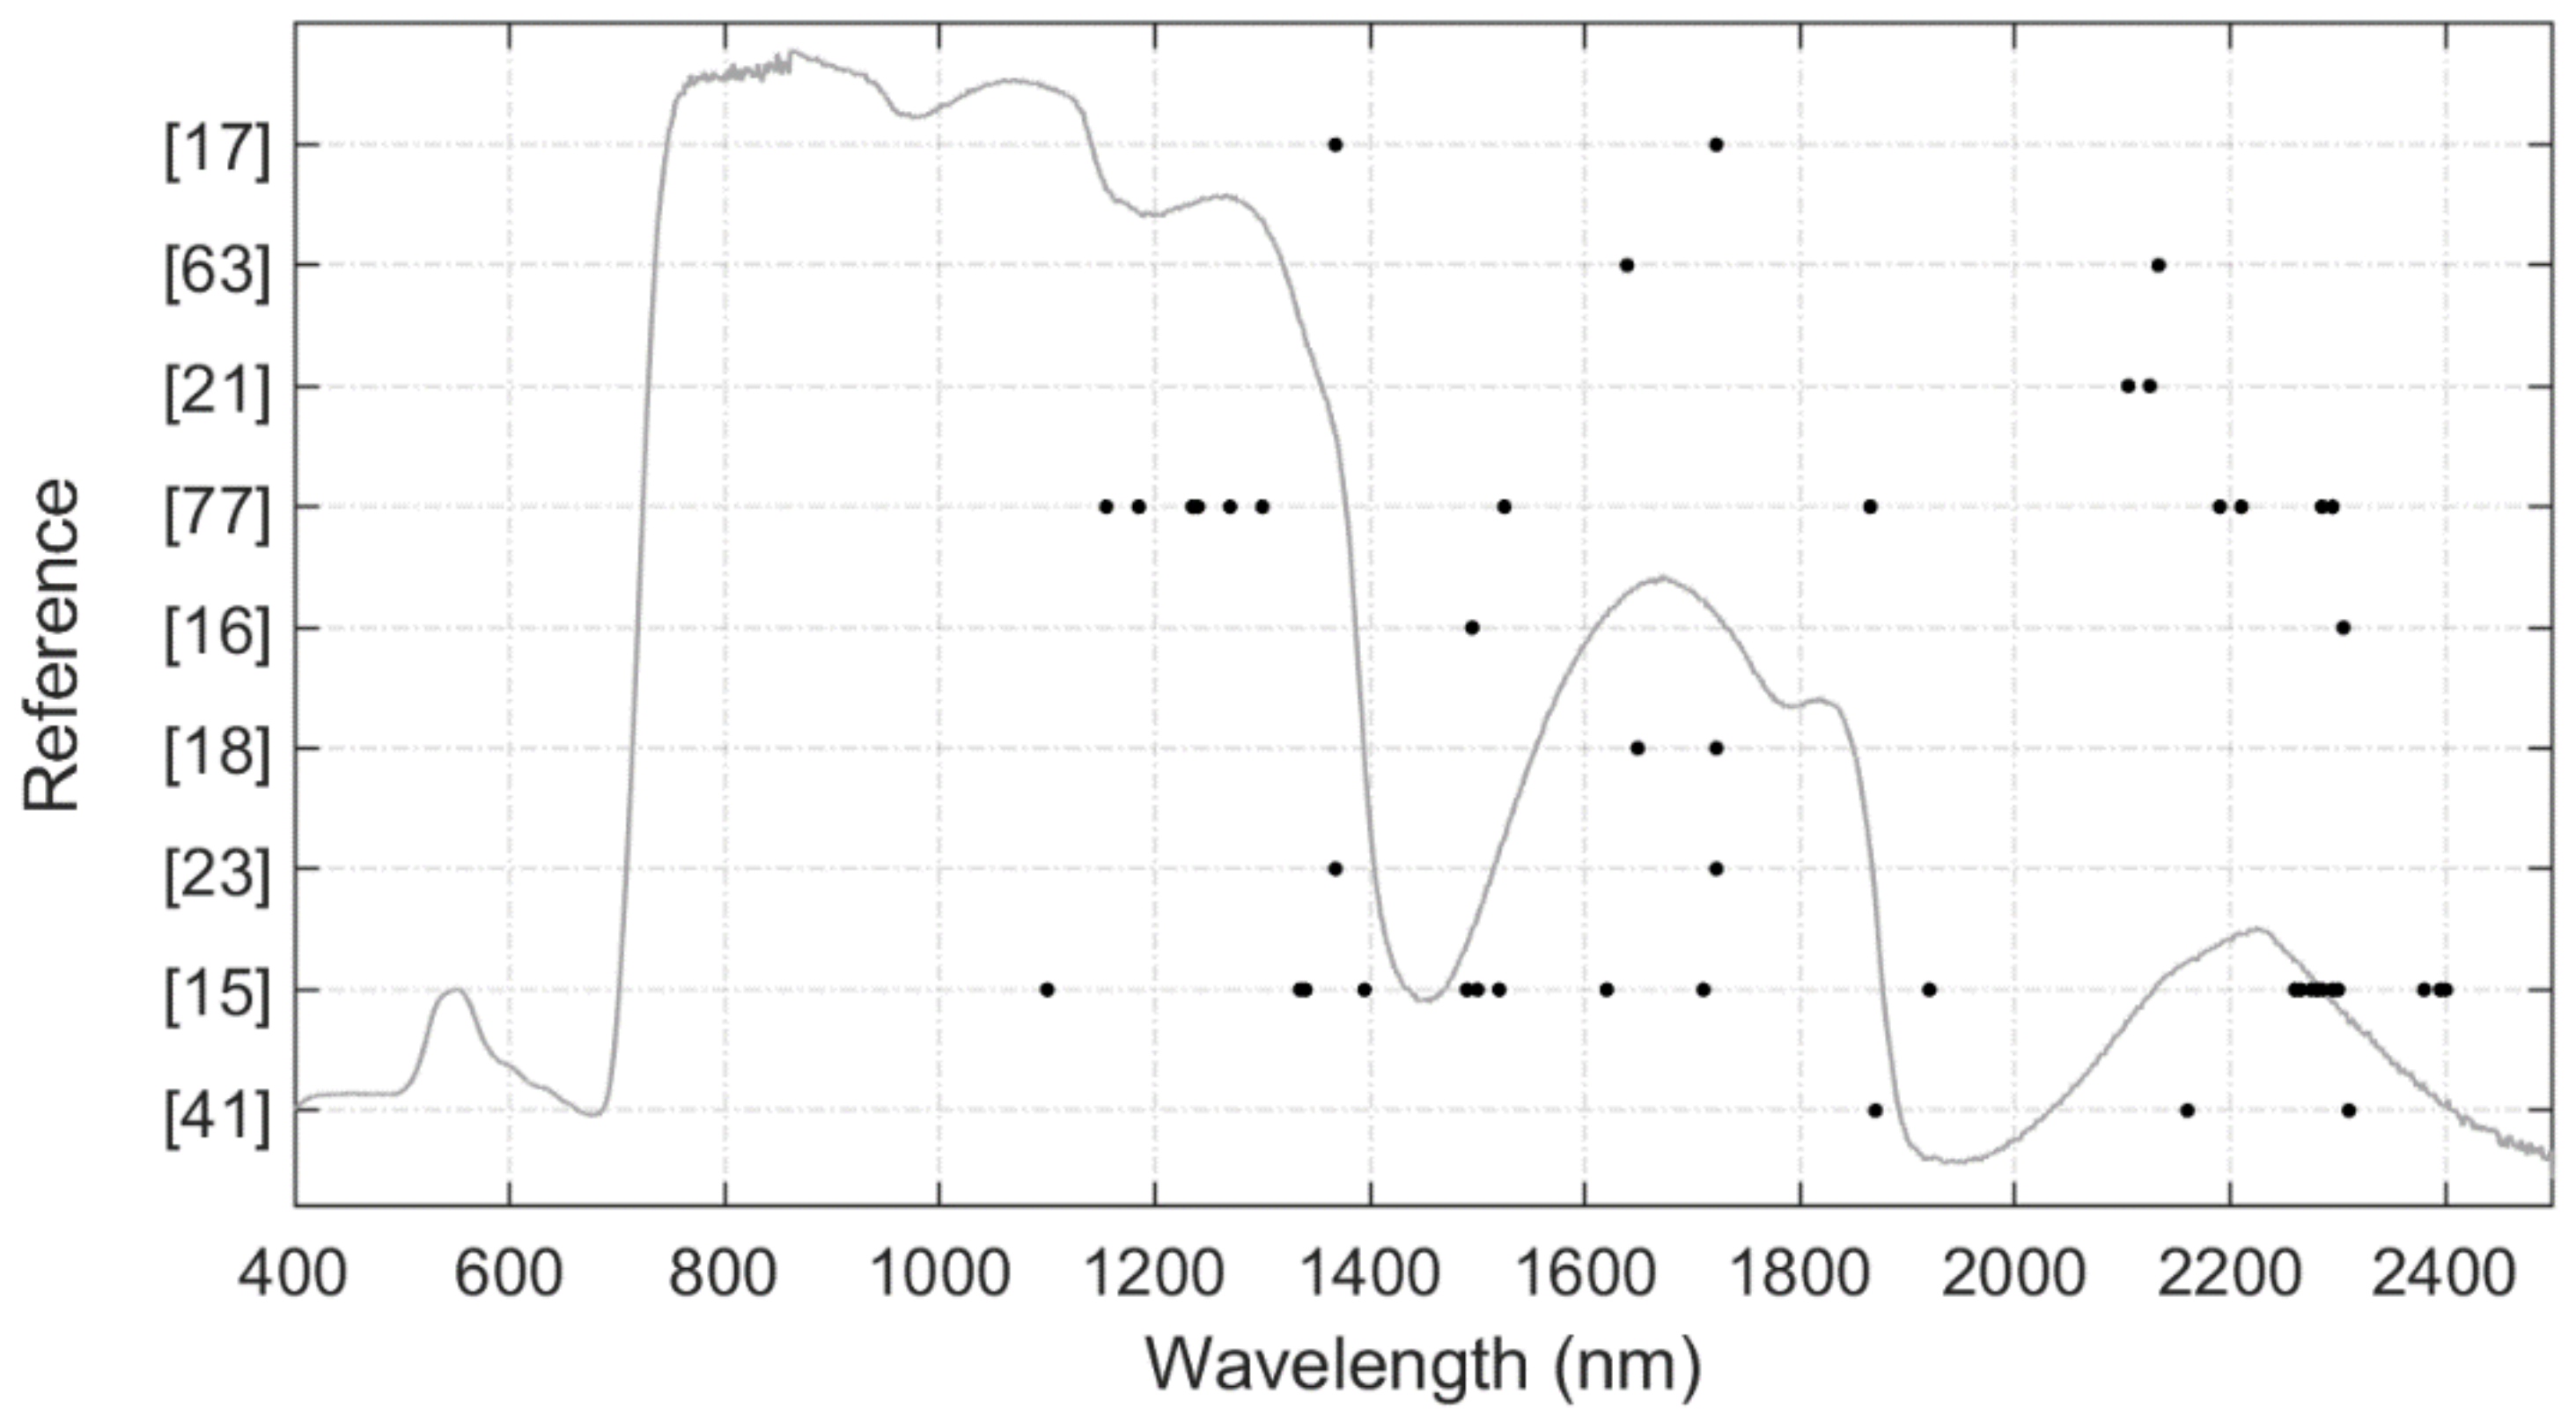
The optical domain (380–2500 nm) is widely used in vegetation bio-physical and chemical assessment because of known characteristic absorption features in this spectral region. Vegetation optical properties are controlled by well-defined absorptions in the visible spectrum (VIS, 400–700 nm) caused by photosynthetic pigments such as chlorophyll, carotenoids, and anthocyanins. Scattering in the near-infrared (NIR, 700–1300 nm) at leaf and canopy scales is dominated by leaf structure and leaf area index, respectively. Optical properties in the shortwave infrared (SWIR, 1300–2500 nm) are driven by moisture content and dry matter-related traits such as protein, starch, and lignin. Several other factors at leaf level, such as the ratio of mesophyll cell surface to intercellular air spaces and leaf thickness, influence leaf optical properties [56]. Curran’s [57] pioneering work presents distinct absorption features within the electromagnetic spectrum (400–2500nm). Most of the wavelengths related to compounds that constitute LMA are located in the NIR and SWIR regions (Table 1).
Remote sensing estimation of LMA is often challenging because most of the absorption features related to LMA are concealed by water, especially in the SWIR region [23,58]. The SWIR region is difficult to characterize with high fidelity from space due to low signal to noise ratio [36]. The most important wavelengths sensitive to LMA have been identified in 1500–1850 nm and 2100–2300 nm, which overlap with water absorption bands [58]. However, spectral indices related to LMA have been developed based on wavebands between 1200 and 2400 nm [15,19,59,60,61] (Figure 4). Chlus et al. [62] observed that a 2000–2450 nm spectral subset generated the highest accuracy (%RMSE = 15.37) compared to the other spectral subsets (400–2450, 800–2450, 1600–2450 nm) in estimating top of the canopy LMA using National Ecological Observatory Network (NEON)’s Airborne Observatory Platform—an AVIRIS-NG like spectrometer. Wavelet features centered at 1639 and 2133 nm yielded the most accurate model for LMA estimation using several datasets [63]. Although the biophysical constituents governing optical properties at leaf level are well understood, decoupling canopy reflectance from several confounding factors remains a challenge. Canopy structure (quantified as LAI or crown biomass) controls variations in reflectance in the NIR. Soil background, understory vegetation, leaf angle distribution, non-photosynthetic material such as tree trunk and deadwood, and sensor and illumination geometry also influence canopy reflectance properties [64,65]. The ultimate challenge of LMA estimation and retrieval at the canopy level is to minimize the effect of these confounding factors and obtain spectra sensitive to LMA. Studies that have estimated LMA from remote sensing at both leaf and canopy scales have generally generated inconsistent results with low to very high accuracy (R2 = 0.24−0.96, RMSE =45 ± 30%, Table 2) [12]. An RMSE of <25% is generally sufficient and acceptable in remote sensing vegetation studies [66,67].
Figure 4. An overview of spectral wavelengths used in the literature to develop spectral indices to estimate LMA. A typical green leaf reflectance is plotted to improve clarity.
Remotesensing 13 03352 g004
Table 1. Absorption features linked to compounds that constitute LMA.
Wavelength (nm)Electron TransitionAbsorbing Compound
910C-H stretch, 3rd overtoneProtein
970O-H bend, 1st overtoneStarch
990O-H stretch, 2nd overtoneStarch
1020N-H stretchProtein
1120C-H stretch, 2nd overtoneLignin
1200O-H bend, 1st overtoneCellulose, starch, lignin
1420C-H stretch, C-H deformationLignin
1450O-H stretch, 1st overtone
C-H stretch,
C-H deformation
Starch, sugar, lignin
1490O-H stretch, 1st overtoneCellulose, sugar
1510N-H stretch, 1st overtoneProtein, nitrogen
1530O-H stretch, 1st overtoneStarch
1540O-H stretch, 1st overtoneStarch, cellulose
1580O-H stretch, 1st overtoneStarch, sugar
1690C-H stretch, 1st overtoneLignin, starch, protein, nitrogen
1730C-H-stretchProtein
1736O-H stretchCellulose
1780C-H stretch, 1st overtone
O-H stretch
H-O-H deformation
Cellulose, sugar, starch
1820O-H stretch, C-O stretch, 2nd overtoneCellulose
1900O-H stretch, C-O stretchStarch
1924O-H stretch, O-H deformationCellulose
1940O-H stretch, O-H deformationWater, lignin, protein, nitrogen, starch, cellulose
1960O-H stretch, O-H bendSugar, starch
1980N-H asymmetryProtein
2000O-H deformation
C-O deformation
Starch
2060N=H bend, 2nd overtone
N=H bend
N-H stretch
Protein, nitrogen
2080O-H stretch, O- deformationSugar, starch
2100O-H bend/ C-O stretch
C-O-C stretch, 3rd overtone
Starch cellulose
2130N-H stretchProtein
2180N-H bend, 2nd overtone, C-H stretch, C-O stretch, C=O stretch
C-N stretch
Protein, nitrogen
2240C-H stretchProtein
2250O-H stretch, O-H deformationStarch
2270C-H stretch, O-H stretch, CH2 bend, CH2 stretchCellulose, sugar, starch
2280C-H stretch, CH2 deformationStarch, Cellulose
2300N-H stretch, C=O stretch,
C-H bend, 2nd overtone
Protein, nitrogen
2310C-H bend, 2nd overtoneOil
2320C-H stretch, CH2 deformationStarch
2340C-H deformation, O-H deformation, C-H deformation, O-H deformationCellulose
2350CH2 bend, 2nd overtone, C-H deformation, 2nd overtoneCellulose, protein, nitrogen
Compiled from [56,57].
A spatial scale mismatch exists between in situ measured LMA and canopy reflectance. To match air- and space-borne spectral measurements, the spatial mismatch necessitates scaling LMA from leaf to canopy level [68,69]. In pure forest stands, this is accomplished by multiplying LMA determined from dominant trees by LAI to obtain canopy LMA. In mixed-species stands, in contrast, LMA varies significantly between species [3]. Therefore, a weighted community LMA that represents the dominant species has to be determined prior to scaling the LMA to the canopy scale [70]. The community weighted LMA is derived by weighting LMA by the proportion of the crown biomass or basal area of each dominant species within a plot. Asner et al. [71] evaluated three approaches of determining the LMA community mean: unweighted, weighted by stem density, and weighted by basal area. When compared to the stem density (RMSE: 5.14 g m−2) and unweighted (RMSE: 5.86 g m−2) approaches, the basal area weighted LMA produced the lowest RMSE (4.95 g m−2) from remote sensing prediction using Carnegie Airborne Observatory-2 data. The community weighted mean LMA is then scaled by LAI to obtain a canopy integrated trait value, which is compatible with canopy reflectance. Homolová et al. [12] provide extensive details on scaling traits to canopy level. Similar scaling consideration and challenges for upscaling general traits, as presented by Serbin and Townsend [27], also apply to LMA estimation.

4. Remote Sensing Systems in LMA Retrieval and Estimation

Conventionally, LMA is retrieved from leaf samples collected from representative trees at fixed sampling locations before upscaling to canopy scale using biomass or LAI [12]. Enabled by advancements in technology, leaf surface area can be measured in situ using portable leaf surface area scanners. For decades, remote sensing has provided an opportunity to augment and upscale LMA measurements from localized points to canopy and landscape scales enabled by the availability of numerous remote sensing data acquired through airborne and satellite spectroradiometers over large spatial scales. Broadly, three remote sensing systems based on their viewing platforms are used to link LMA and remote sensing signal. These systems are near-ground, airborne, and spaceborne (satellite) platforms.

4.1. Near-Ground Based Platforms

Near-ground based platforms allow in situ proximal sensing of vegetation traits using field spectrometers. The earliest efforts of linking spectroscopic measurements to vegetation traits date back to the 1950s and 1960s, when researchers in the US Department of Agriculture (USDA) measured spectra of dried and ground leaves, and identified 42 minor absorption features linked to several traits that include LMA-related constituents [57]. Through advanced research, these features were successfully linked to the concentration of LMA-related organic compounds such as protein, starch, cellulose, and lignin. Sensors mounted on near-ground platforms have three advantages over sensors onboard air- and spaceborne platforms. Firstly, the target can be manipulated to examine the spectral response of each treatment. For example, Nunes et al. [72] examined the effect of soil type on LMA estimation using in situ hyperspectral measurements within the 1100–2500 nm spectral range. Secondly, the mixed-pixel effect can be reduced or eliminated by ensuring the field of view (FOV) is covered entirely with vegetative material [73]. Thirdly, spectral measurements using these sensors are not affected by atmospheric conditions because the distance between the sensor and the target is often short. Thus, in situ hyperspectral measurements are often spectrally “pure”, because measurements are not constrained by the atmosphere that attenuates radiation in airborne and spaceborne remote sensing systems. Thus, proximal sensors are reliably independent systems often used to calibrate airborne and spaceborne sensors [74].
Near-ground hyperspectral data measurements provide invaluable insights for new sensor design, in addition to the development and optimization of new spectral indices [75,76]. Researchers have the opportunity to investigate a wide range of band combinations at both leaf and canopy levels. Several studies have developed new indices for estimating LMA based on field spectral measurements [15,18,77]. Furthermore, techniques requiring contiguous wavebands, such as red-edge inflection positioning (REIP) [78], continuum removal, wavelets [63], and spectral derivatives are adequately examined using in situ hyperspectral measurements.
In situ hyperspectral data are typically used to validate simulated spectral responses during the development or modification (addition of other biochemical traits) of leaf RTM. For example, the recent addition of protein and cellulose + lignin to the PROSPECT model was first investigated using in situ hyperspectral measurements [79] before the modified PROSPECT model was coupled with the Invertible Forest Reflectance Model (INFORM) [80] and upscaled to canopy and landscape levels [81]. In addition, the PROSPECT leaf radiative transfer model has been modified to include carotenoids, brown pigments, and anthocyanins in PROSPECT-D [82], and the recent PROSPECT PRO disentangled LMA into protein and carbon-based constituents [22]. Simulated spectra after model modification require in situ measured spectra to assess model sensitivity and robustness for which in situ hyperspectral measurements are required.

4.2. Airborne Platforms

Airborne campaigns have traditionally been used to estimate plant traits at canopy and landscape levels, mainly in temperate forest ecosystems [83,84]. Multispectral, hyperspectral, and thermal scanners fitted on aircraft have been used to retrieve vegetation biophysical properties with great success. For example, recently, Singh et al. [85] estimated LMA at canopy scale (R2 = 0.88, RMSE = 15.06 g m−2) using 51 time-series AVIRIS-Classic images acquired between 2008 and 2011. This study demonstrated the utility of imaging spectroscopy and partial least squares regression (PLSR) in predicting and mapping LMA across different functional types, sites, and years. Chadwick and Asner [86] estimated LMA (R2 = 0.43, NRMSE= 0.12) using PLSR based on hyperspectral measurements obtained from a High-Fidelity Imaging Spectrometer (HiFIS) sensor mounted on an aircraft in a tropical forest of Peru. Airborne spectral measurements have been instrumental in testing spaceborne sensors before their launch.
Unmanned aerial systems (UASs), also known as drones, have revolutionized airborne remote sensing of vegetation. The influx of commercial vendors, in addition to novel software and hardware, has boosted UAS data acquisition and analysis [87]. Subsequently, the past decade has seen a shift from aircrafts towards relatively low-cost and operation-friendly UAS [88]. These instruments are operation-friendly in terms of flight planning and provide immediate access to data compared to satellite and aircraft imagery acquisition. The prompt access to data is critical for “near real-time” ecosystem assessment, particularly after disturbances such as fire or landslides. Drones have the capability to provide imagery of high spatial resolution with a short temporal resolution. Thomson et al. [89] used hyperspectral data (450–950 nm) acquired using a UAS to estimate LMA (R2 = 0.24 RMSE = 18%) in a managed forest in Ghana, West Africa. The absence of the full NIR and SWIR potentially affected the accuracy generated from this study. The utility of UASs in estimating LMA across the entire spectrum requires further testing in forest ecosystems.

4.3. Spaceborne Satellite Platforms

Spaceborne or satellite-based platforms enable spectroradiometers to monitor vegetation’s spectral signatures at varying spatial and temporal scales from space. Instruments on board satellites scan vegetation communities from localized pixels to landscape and global scales at various temporal scales of monthly, biweekly (Landsat), near weekly (Sentinel-2s), and approximately daily (MODIS-Moderate Resolution Imaging Spectroradiometer).
Currently, operational satellite instruments of moderate spectral and spatial resolutions, such as Sentinel- 2 Multi-Spectral Instrument (MSI) and Landsat-8 Operational Land Imager (OLI), are used with considerable success to estimate LMA in various biomes, including temperate forest [44] and tropical rainforest [90]. These multispectral instruments have spectral bands strategically positioned to increase plant trait response. For example, Sentinel-2 and WorldView-3 instruments measure radiance in the red-edge spectrum (680–780 nm). The red-edge spectral region is highly sensitive to variation in foliar nitrogen, a constituent of LMA [78]. Recent research demonstrates that the red-edge band improves plant trait mapping [91]. Red-edge indices, such as the Red-edge Chlorophyll Index (CIrededge) and Sentinel-2 Red-edge Position (S2REP), have been successfully used to estimate LMA [44]. The launch of commercial high spatial resolution sensors, such as IKONOS (4 m), Quickbird (2.88 m), and WorldView (1.24 m), has ostensibly provided researchers with opportunities to link spectral data with LMA at very fine spatial scales, such as individual tree crowns compared to Landsat and Sentinel-2. The inclusion of the panchromatic band (at very fine resolution <50 cm) and the red-edge spectral band has provided an immense opportunity to map LMA at even finer resolutions. To the best of our knowledge, the application of these high spatial resolution sensors remains untested in estimating LMA.
The launch of spaceborne hyperspectral sensors, such as Hyperion in November 2000, established the capability of spectroscopic imaging of plant traits from space. Hyperion on Earth Observing One (EO-1) provided 220 spectral bands between 357 and 2576 nm with a 10 nm bandwidth before decommissioning in March 2017. le Maire et al. [15] demonstrated the utility of a PROSAIL-derived normalized difference index (ND1490,2260) validated on the Hyperion imagery (RMSE = 35.3 g m−2) in estimating LMA in two deciduous temperate forests in France. Although a few studies have shown the utility of Hyperion data to estimate foliar nitrogen [66,92], the utility of Hyperion data to estimate LMA requires further investigation. Future missions, such as the German Environmental Mapping and Analysis Program (ENMAP) and NASA’s Hyperspectral Infrared Imager (HyspIRI) [93], have the potential to provide high quality hyperspectral data for tracking plant traits from space. HyspIRI instrumentation has a visible-to-short-wave-infrared (VSWIR) imaging spectrometer within the 380–2510 nm spectral range at 10 nm contiguous spectral bands and a multispectral imager within the range of 3–13 μm with eight discrete bands across the mid- and thermal-IR (TIR) portion of the spectrum. This dataset will present an opportunity to sense LMA and related constituents in the thermal spectral domain, which remain untested at the canopy and landscape levels.

4.4. Challenges in the Estimation of LMA using Air- and Space-borne Systems

Although remote sensing of LMA using air- and space-borne sensors has received increased attention in the past decade, scientists continue to face several challenges during vegetation remote sensing using these tools. Primarily, finding a dataset with optimal spectral, spatial, and temporal resolution at low cost remains a daunting challenge [27,94]. Ideally, accurate estimation and retrieval of LMA from remote sensing require imagery of higher spatial resolution comparable to the average size of individual tree crowns. In addition to the fine grain size, spectral and temporal resolutions are also key in accurately estimating LMA. Subtle absorption features associated with LMA and related constituents (Table 1) require hyper-spectral data with strategically positioned spectral bands across the electromagnetic spectrum. However, hyperspectral datasets are costly and require expert knowledge to process due to their high dimensionality.
Available LMA-related data products, particularly at regional scales, are derived from coarse resolution datasets such as MODIS (Figure 3) [51]. These coarse resolution datasets are vulnerable to the problem of mixed pixels, especially in environments where vegetation communities are patchy and scattered. Despite having a global footprint and a high temporal resolution (daily), which are important for large scale trait monitoring, datasets such as MODIS and Advanced Very High Resolution Radiometer (AVHRR) have high estimation errors [95]. Alternative options, such as Landsat data, have a low temporal resolution (16 days), whereas ideal high spatial resolution imagery, such as WorldView, is expensive, and UAV systems are virtually impractical on larger scales. The discontinuity of broadband sensors, such as Landsat (TM and MSS), AVHRR, and the ENVISAT MERIS missions, has made time-series analysis of leaf traits difficult. Subsequently, there is a tradeoff between the high temporal, coarse spatial resolution datasets and low temporal resolution of moderate spatial resolution systems. However, the European Space Agency’s Sentinel-2 MSI is potentially a game changer in mapping LMA [44] due to its high temporal (5 days at the equator) and moderate spatial resolution (10/20 m), in addition to the inclusion of red-edge spectral bands.
Utilizing multi-source datasets of varying resolutions to characterize LMA across large spatial extents has the potential to generate global maps of this important trait. However, the main challenge with multi-source optical data is wavelength calibration, as different sensors have varying central wavelengths for each spectral band [27]. Resampling of spectral bands to new wavelengths is data and process intensive, and demands expert knowledge on spectral response functions of images of varying signal-to-noise ratio. Generating global maps of LMA using multi-source remote sensing imagery requires species abundance data at optimal resolution across the globe to accurately compute the community weighted mean [51]. Global species abundance data at desired resolution facilitate upscaling LMA to spatial scales compatible with coarse resolution imagery with a global footprint. However, global-scale species abundance products at the desired resolution (<1 km) are not available.

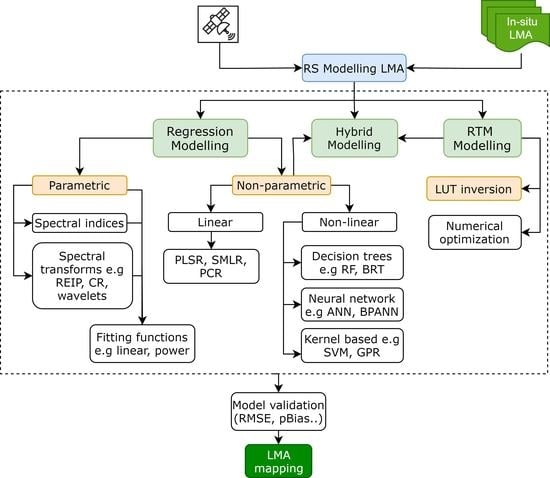
5. Models to Estimate/Retrieve LMA from Remote Sensing Data

Two key modelling approaches, i.e., statistical (empirical) and physical modelling techniques, are often used to link traits such as LMA to remote sensing data at three different scales, i.e., leaf, canopy, and landscape level [28]. Recently, hybrid-modelling techniques, which combine elements of empirical and physical modelling, have received notable reception [59]. An overview of methods and techniques used in LMA retrieval/estimation is presented in Figure 5. Table 2 summarizes studies that have used these models and the results they have obtained.

5.1. Statistical Modelling

Empirical models explore statistical relationships between traits and remote sensing data (spectral bands, vegetation indices, texture metrics, spectral derivatives, i.e., continuum removed spectra, wavelets, band depth). The approach relates remote sensing data to in situ or in vitro measured traits at both leaf and canopy scales to identify the optimal predictors using fitting functions (linear, logarithmic, polynomial, etc.) via regression analysis [96]. There are two types of empirical models: parametric regression and non-parametric regression. The parametric regression models assume an explicit relationship between remote sensing data and traits. They employ parameterized expressions (fitting functions) to link a small number of independent variables to traits. For example, Cheng et al. [63] used simple regression to estimate LMA using continuous wavelets across a wide range of plant species at leaf scale using the ANGERS, LOPEX, and PANAMA datasets. Wavelet features allow the identification of absorption features using multi-scale analysis of spectral signatures [97]. In the study of Cheng et al. [63], the wavelet feature that generated the least RMSE (19.66 g m−2) was centered at waveband 1639 nm, demonstrating the importance of the SWIR in LMA estimation. Several other studies have used parametric models to develop indices to estimate LMA [15,18].
Non-parametric regression, by comparison, optimizes the traits’ remote sensing model through a learning phase of the training data, i.e., the process is data driven. These models can use the entire spectrum or data from different sources by assigning weights to each spectral band, and subsequently determine the relative importance of each predictor variable [29]. Two classes of non-parametric regression models i.e., linear and non-linear non-parametric models, have been identified and are widely used in remote sensing of LMA. Linear models include partial least squares (PLS) [98], stepwise multiple linear regression (SMLR) [99], and principal component regression (PCR) [100], whereas non-linear models include decision tree learning (random forest, bagging decision trees) [101], artificial neural networks (ANNs) [102], kernel (support vector machines), and Bayesian methods [103]. PLSR remains the most widely used model in LMA estimation across biomes (Table 2) because of its ease of calibration and assessment of the contribution of each waveband [104]. Recently, Serbin et al. [26] used PLSR to calibrate a multibiome model using leaf reflectance to predict LMA (R2 = 0.89 and RMSE = 15.45 g m−2). Random forest, by comparison, has recently gained popularity in the vegetation remote sensing community. Moreno-Martínez et al. [51] demonstrated that random forest outperformed five other models (Extreme Learning Machine (ELM), kernel ridge regression (KRR), Gaussian Process Regression (GPR), and regularized linear regression) in LMA prediction using MODIS at a global scale. In addition, Gara et al. [44] used random forest to estimate canopy LMA (R2 = 0.67 NRMSE = 0.16) based on Sentinel-2 across three seasons in Bavaria Forest National Park in Germany.

5.2. Physical Models

Physical models or radiative transfer models (RTMs) are superior to empirical models due to their contextualization, transferability, and robustness [12]. RTMs simulate absorption and scattering of radiation in foliage material at both leaf and canopy levels using well-established physical laws and knowledge. The operation of RTMs involves parameterizing a model with its respective input parameters and then executing (running) the model in forward mode to generate a synthetic spectral library or a look-up table (LUT). The spectral library (of m × n dimensions) is composed of variables of the input parameters, including traits and the corresponding spectra. Model inversion through querying the spectral library remains the most intelligent avenue of retrieving traits, such as LMA using in situ, airborne, and satellite spectra [28,105]. Several RTMs with LMA as an input have been developed and subsequently modified at both leaf and canopy levels.
At leaf scale, Gara et al. [24] successfully retrieved LMA from PROSPECT-4 simulations across canopy (sunlit: NRMSE = 0.154 and shaded: NRMSE = 0.176) throughout the growing season (spring: NRMSE 0.154, summer: NRMSE 0.148, and autumn: NRMSE = 0.159) in a temperate forest using in situ leaf spectral measurements. The widely used leaf RTM, PROSPECT, has been modified to include carotenoids, brown pigments, anthocyanins, protein, and cellulose + lignin [79,82]. Recently, Féret et al. [22] developed PROSPECT-PRO, a recalibrated PROSPECT model separating LMA into nitrogen and carbon-based constituents (CBCs). CBCs include lignin, cellulose, hemicellulose, and non-structural carbohydrates (sugars and starch). Jiang et al. [106] recently developed FASPECT, a leaf radiative transfer model that simulates reflectance and transmittance of upper and lower leaf faces. In LMA retrieval, FASPECT produced a lower RMSE (0.0017 g cm−2) compared to PROSPECT-5 (0.0028), PROSPECT-D (0.0029 g cm−2), and Dorsiventral Leaf Model (0.0033 g cm−2). Leaf radiative transfer models such as PROSPECT can be intrinsically coupled with canopy models, such as Scattering by Arbitrarily Inclined Leaves (SAIL) and INFORM, to simulate reflectance at canopy scale [20,80]. For example, recently, Miraglio et al. [107] achieved low accuracy (R2 = 0.14, RMSE = 0.0022 g cm−2) using a synergy of 3D DART and 1D PROSAIL based on AVIRIS-C airborne hyperspectral data. However, a related study [108] successfully retrieved SLA, a reciprocal of LMA (R2 =0.76, RMSE = 5.33%), from Landsat-8 multispectral data based on INFORM RTM simulations. To the best of our knowledge, few studies [21,107] have used RTMs to retrieve LMA at the canopy scale (Table 2). As a result, there is an urgent need to evaluate the utility of existing canopy RTMs to retrieve LMA in forest ecosystems.

5.3. Hybrid Modelling

Hybrid models combine the properties of empirical (especially non-parametric models) and physical models [96]. The procedure often entails calibrating an empirical model based on synthetic data generated from an RTM in forward mode. The hybrid model is subsequently validated using field-collected data. Hybrid modelling can be performed at both leaf and canopy scale using leaf and canopy radiative transfer models. The hybrid modelling approach is fast and computationally inexpensive compared to inverting RTMs using LUT or numerical optimization [29]. Few studies have explored the synergy between empirical models and radiative transfer models in estimating LMA at both leaf and canopy scales. Such studies include le Maire et al. [15], who successfully developed spectral indices to estimate LMA at leaf and canopy level from PROSPECT and PROSAIL simulations. Their study observed that normalized indices utilizing wavebands centered at 2295 and 1500 nm yielded the most accurate model at leaf level (RMSE = 15.9 µg cm−2), whereas 2280 and 1395 nm wavebands yielded the lowest RMSE of 14.4 µg cm−2 at canopy scale. Wang et al. [18] developed a normalized dry matter index (NDMI) based on PROSPECT simulations (R2 = 0.85, 0.0019 g cm−2) that were also validated using the LOPEX dataset [109] with an R2 = 0.68 and RMSE of 0.0014 g cm−2. Féret et al. [23], by comparison, calibrated partial least squares (PLS) models based on PROSPECT-5 simulations and generated RMSE ranging between 0.002 and 0.0025 g cm−2 on synthetic data and 0.0007 g cm−2 on an experimental dataset. Using Sentinel-2 multispectral data, Hauser et al. [110] successfully demonstrated the utility of PROSAIL-D/support vector regression hybrid technique in retrieving LMA (R2 = 0.59, RMSE = 5.77 mg cm−2) in a forest and shrubland ecosystem at canopy scale. It is worth noting that very few studies have evaluated the utility of hybrid modelling in the retrieval of LMA, particularly at the canopy level in forest ecosystems.
In the mid-1990s and early 2000s, several studies demonstrated the utility of ANN models trained using RTM synthetic data in estimating leaf traits using remotely sensed data at different scales. Faurtyot and Baret [111] demonstrated the utility of the ANN over multiple regression using simulated canopy spectra (880–2380 nm) generated from the PROSAIL RTM in estimating LMA at both leaf and canopy scale. At an operational level, the European Space Agency’s SNAP (Sentinel Application Platform) toolbox inverts PROSAIL simulations based on Sentinel-2 MSI using ANN to retrieve several traits that include LMA, etc. For example, Hauser et al. [110] recently used SNAP to retrieve LMA (R2 = 0.51, RMSE = 5.5 mg cm−2) in a forest and shrubland ecosystem in a temperate forest in Portugal using Sentinel-2 data. More research is required to determine the utility of the SNAP toolbox in LMA retrieval in forest ecosystems.

5.4. Challenges in Remote Sensing Modeling of LMA

Although the three models described above have shown great potential in estimating LMA from remote sensing, they are associated with a number of challenges. The challenges associated with each model are outlined below.
Empirical models: The performance of parametric models is influenced by the selected band combination, the form of the index used, and the chosen fitting algorithm. Band optimization (all possible band combinations), especially with hyperspectral data, is required to select a band combination that yields the best fit (R2) and the lowest error (RMSE) [112]. However, one challenge with band optimization is that the bands that yield the lowest accuracy may be located outside the known absorption features of a particular trait. Multi-collinearity is also a major challenge in parametric regression because remotely sensed data are often highly correlated [113]. The use of parametric models, especially using vegetation indices as predictors, has been documented to be affected by model saturation, where an index reaches an asymptote and any further increase in trait content does not trigger a response in the model. However, some studies [96] have demonstrated that three-band indices are less affected by model saturation than two-band indices. A recent study by Moreno-Martínez et al. [51] showed that the inclusion of bioclimatic data, such as temperature and precipitation, improves LMA prediction and thus mitigates the model saturation effect.
The identification of spectral bands that match known absorption features of biochemicals remains a common problem with empirical models [114]. Matching spectral bands to known absorption features feeds into the generic knowledge of vegetation spectroscopy and is subsequently critical in explaining the cause–effect relationships between spectral bands and vegetation biochemicals. Model saturation of traditional indices, such as the NDVI, is a well-known challenge reported extensively in the literature. For example, Streher et al. [115]] observed that spectra measurements collected using a field spectrometer failed to accurately estimate LMA values above 300 gm−2 in a study conducted in tropical Brazil. Although narrowband indices have been demonstrated to ameliorate the saturation challenges [116], hyperspectral datasets at the landscape and regional scales remain unobtainable for most remote sensing researchers.
Table 2. Studies that estimated/retrieved LMA from remote sensing data.
CategoryMethodSpectral DataSensorScaleMain Findings ReportedReference
Parametric regressionsContinuous wavelet
transform
Leaf hyperspectral reflectanceField spectrometerleafWavelet features at 1639 nm and 2133 nm, yielded the most accurate model to estimate LMA (R2 = 0.74, RMSE = 18.97 g m−2)[63]
Non-parametric linear regressionsPLSIn situ leaf reflectanceField spectrometerleafA multibiome leaf spectra–LMA PLS model was built explaining 85% variance in LMA. The model incorporating vegetation from the Arctic to the tropics, included broad- and needle leaf species, sunlit and shade foliar yielded a RMSE of 15.45 g m−2[26]
PLSIn situ optical and thermal reflectanceField spectrometerleafSynergy of Visible Short Wave Infrared (VSWIR) and Thermal Infrared spectrum (TIR) improve LMA prediction (RMSEP = 18.31) compared to using the spectral regions in isolation[117]
SMLRLeaf reflectance and derive spectraField spectrometerleafWavebands selected by the SMLR did not match known absorption features of LMA and other related traits.
The SMLR performed differently depending on the expression used i.e., more accurate models were generated using content (g m−2) compared to concentration (g g−1)
[114]
PLSAirborne hyperspectralCarnegie Airborne ObservatorycanopyVSWIR and LiDAR generated R2 = 0.69 and RMSE = 9.99% in LMA estimation[32]
PLSAirborne hyperspectral and LiDARNEON’s Airborne Observatory Platform- AVIRIS-NG-like sensorcanopyCombining top-of-canopy (R2 = 0.57, RMSE = 10.8 g m−2) and within canopy (R2 = 0.78, RMSE = 8.3 g m−2) LMA, significantly improved three-dimensional PLSR modelling (R2 = 0.82, RMSE = 8.5 g m−2) of LMA. The 2000–2450 nm spectral subset generated the highest accuracy (%RMSE = 15.37) compared to the other spectral subsets (400–2450, 800–2450, 1600–2450 nm)[62]
Non-linear parametric regressionsSVMIn situ leaf reflectanceField spectrometerleafSVM using spectral data between 900-2400 nm generated a RMSE of 2.52 mg cm−2[59]
RFRaw bands and spectral indicesSentinel-2canopyLMA varied significantly (p < 0.05) across the canopy between sunlit and shaded. A weighted canopy expression outperformed (R2 = 0.67, NRMSE = 0.16) the traditional sunlit based expression (R2 = 0.54, NRMSE = 0.18). predictive maps of LMA were generated using Sentinel-2 bands and vegetation indices.[44]
Physical models (RTM based)PROSPECT-PROLeaf reflectance and transmittanceField spectrometerleafPROSPECT PRO separates LMA into the nitrogen-based constituents (proteins) and CBC (carbon-based constituents i.e., cellulose, lignin, hemicellulose, starch, and sugars)
CBC was accurately estimated for both fresh (R2 = 0.96, NRMSE = 9.6%) and dry leaves samples (R2 = 0.95 and 13.4%) while the sum of CBC and proteins (LMA) was estimated (R2 = 0.90 and NRMSE = 0.165)
[22]
PROSPECTLeaf reflectanceField spectrometerleafLMA across the vertical canopy profile throughout the growing season was successfully retrieved (R2 0.54–0.82, NRMSE 0.15–0.24) from PROSPECT simulations using the LUT inversion. The best retrieval was obtained for the summer (R2 = 0.82, NRMSE= 0.15) and for upper canopy leaf samples (R2 = 0.61 NRMSE = 0.15)[24]
PROSAILAirborne hyperspectralAVIRIScanopyPROSAIL inversion yielded a RMSE of 0.004.[21]
Hybrid modelsPROSPECT and PLSLeaf reflectanceField spectrometerleafA PLS model calibrated using PROSPECT-5 spectral simulations yielded an RMSE of 0.007 g cm−2 on experimental data compared to spectral index (NDLMA= 0.0021 g cm−2)[23]
Spectral indices
Leaf hyperspectral reflectanceField spectrometerleafA narrow band index (normalized dry matter index, NDMI) centered at 1649 and 1722 nm developed from PROSPECT simulations (R2 = 0.85 RMSE 0.0019 g cm−2 and validated on the LOPEX dataset (R2 = 0.68, RMSE = 0.0014 g cm−2) yielded the lowest estimation error[18]
RMSE = root mean square error; NRMSE = normalized root mean square error; RMSEP = root mean square error of prediction.
Although non-parametric models have received increased use in the past decade, they are associated with a challenge of overfitting the training dataset, especially when using a small size or a dataset that has missing values. The overfitting challenge can be addressed by tuning the model, including optimal selection of the number of predictors that minimize the estimation error. This approach has the advantage of reducing model complexity and achieving model parsimony. Rocha et al. [118] developed a valuable tool (Naïve Overfitting Index Selection) to detect, quantify, and reduce overfitting in seven non-parametric regression models for estimating leaf traits using hyperspectral data.
Despite the availability of empirical models and their ease of calibration and subsequent validation, they are associated with model transferability and robustness challenges. Parametric and non-parametric models are not generic and are thus sensor, time, and ecosystem dependent [119]. A model calibrated using data collected in one ecosystem for a particular season using a specified sensor often underperforms when tested in another setup. However, Nakaji et al. [120] demonstrated the potential of building a multi-biome PLSR model (R2 = 0.85 and RMSE = 14.9 g m−2) to predict LMA at different leaf developmental stages using in situ leaf hyperspectral data across 14 deciduous and evergreen forests in Japan, Thailand, and Malaysia. Therefore, there is a need to ascertain whether similar results are obtainable at canopy and landscape levels using air- or space- borne sensors. Moreover, the robustness of empirical models is affected by the representativeness of the reference samples used for calibration and validation partitions. However, techniques such as cross-validation and bootstrapping are known to correct for sample imbalance between calibration and validation datasets [121].
Physical models: A major challenge of RTMs is that different combinations of the input parameters can yield similar spectra (ill posedness), thus compromising model inversion [122]. However, a few techniques have been proposed to ameliorate the ill-posedness problem. Firstly, spectral sub-setting has been demonstrated to yield a better accuracy compared to using the full wavelength [123,124]. For example, Féret et al. [59] demonstrated that using spectral information between 1700 and 2400 nm decreased the LMA estimation error by 33%. Secondly, selecting the mean or median of several best solutions compared to using a single solution has been documented to yield a better result for LMA-related constituents, such as protein and cellulose+ lignin [79]. Finally, Verrelst et al. [96] proposed adding a Gaussian noise component to compensate for model uncertainty.
The collection of a suite of traits to calibrate and validate an RTM is a daunting activity in itself that requires considerable investment in both time and resources [105]. A virtuous trait dataset that captures variability in LMA within a study site is collected based on a proper sampling design stratified across biophysical factors described in Section 2. However, this approach is expensive and labor demanding. In addition, recalibrated RTMs [22,82] require additional biochemicals as input variables to parameterize a model. The equipment required to measure these leaf traits is often expensive and are not available to most remote sensing vegetation scientists. Engaging the services of independent laboratories is also expensive, especially for non-funded research projects. These challenges have a bearing on in situ measurement and subsequent retrieval of LMA, especially using physical and hybrid modelling.
Hybrid models: Hybrid models are associated with challenges related to both empirical and physical models, as described in detail for each model above. The need to collect a set of traits required to parameterize an RTM is a significant challenge with hybrid models. For example, the recently published PROSPECT PRO requires at least six traits as input variables [22]. Measuring these traits is time consuming and very expensive due to the high-tech laboratory instruments required. Model overfitting also affects the performance of hybrid models due to collinearity and spectral dependence [29]. However, Rivera-Caicedo et al. [125] demonstrated that dimensional reduction techniques. such as canonical correlation analysis (CCA) or ortho-normalized PLS (OPLS), significantly improve the performance of the PROSAIL-ANN hybrid model compared to using all bands in LAI estimation. Nevertheless, these dimensional reduction techniques remain untested in LMA estimation using hybrid models. Furthermore, the robustness of the RTM, signal-to-noise ratio of the spectral data, and prior knowledge used in model parameterization have an impact on hybrid model performance.

6. Research Gaps and Future Outlook

The gaps identified by our review can be classified into four categories, i.e., field data availability, model development, remote sensing data availability, and scaling issues. Increased cooperation between sensor designers, the vegetation remote sensing community, and plant physiologists is critical for monitoring LMA from space. The Group on Earth Observations Biodiversity Observation Network (GEOBON) emphasize increased coordination between ecologists and remote sensing scientists, particularly regarding standardization and harmonization of trait measurements and subsequent integration of Earth Observation (EO) products [126]. Agreeing on a list of biodiversity variables and their respective indicators that can be monitored from space has been an achievement in the past decade [127]. However, the availability of ground truthing data through field measurements or data stored in trait databases remain a major challenge. Scaling LMA from in situ leaf measurements to regional and global scales is difficult due to the patchiness and scarcity of field data across the globe.
Most data (approximately 60%) archived in trait databases, such as the TRY plant database, lack an explicit georeference and are thus difficult to use from a remote sensing perspective [51]. Scaling LMA to canopy, and subsequently to regional and global scales, requires species abundance data to compute the weighted community mean of each sampling unit. Weighted community data that correspond to coarse spatial resolution of sensors with a large footprint, such as MODIS, are largely unavailable. The commendable efforts by the US NEON project to collect hyperspectral and LiDAR data in 20 ecoregions during the past 30 years [27], coupled with field measurements of several traits, are important steps towards addressing these issues, and emphasize the need to replicate these efforts around the world to create global maps of LMA.
Decoupling LMA in radiative transfer modelling remains an ongoing challenge in quantitative remote sensing. The unbundling of LMA into various constituents in the physical modelling of vegetation has made somewhat progress in the last decade. The specific absorption coefficient spectrum used in the PROSPECT model is a weighted average of the molecular absorption spectra of a wide-range of LMA constituents [58]. This has resulted in relatively poor retrieval of LMA compared to other parameters because different components of LMA can yield different specific absorption coefficients in different vegetation types [59]. The recent separation of LMA constituents, such as nitrogen, cellulose + lignin [79], and other carbon-based constituents (CBCs) [22] in the PROSPECT leaf radiative transfer models has improved spectral matching and subsequent retrieval of LMA in broadleaf samples. Although the incorporation of nitrogen was demonstrated using the LIBERTY radiative transfer model [128], the model is specifically designed for needles. The robustness of retrieving LMA and its related constituents using the revised PROSPECT models requires further testing in several ecosystems and vegetation types using multiple optical sensors.
There is also a need to develop new indices based on recalibrated leaf RTM models such as PROSPECT-D and PROSPECT PRO coupled with canopy models (SAILH and INFORM). Determining the form and wavelengths related to LMA is essential for landscape and ecosystem modelling. Previous work conducted by le Maire et al. [15] demonstrated the capability of calibrating and validating new indices from synthetic data generated from PROSAIL and validated against airborne and in situ hyperspectral measurements. This approach requires further testing in different forest ecosystems and biomes.
Although advanced non-parametric modelling approaches, such as ANN, PLSR, random forest, and GPR, have proven to yield better estimation accuracy in estimating leaf traits compared to traditional parametric regression in the past decade, most of these non-parametric techniques remain black boxes and are not grounded in theory. However, training non-parametric models based on RTM simulations (hybrid modelling) has opened up opportunities for further research and experiments [129]. Hybrid models are fast and thus save computation time compared to conventional RTM inversion using LUT and numerical optimization [96]. However, the utility of hybrid models requires further validation in different ecosystems, especially in tropical vegetation communities, where research on remote sensing of LMA has been lacking. Féret et al. [59] successfully demonstrated the retrieval of LMA based on the SVM trained model using the PROSPECT-D at leaf level. Our literature search showed that the retrieval of LMA using machine-learning techniques trained using simulated spectra remains understudied across forest ecosystems. Chlorophyll content remains the most retrieved trait using hybrid modelling across various ecosystems [129,130,131]. Therefore, there is a need for further research on other traits, such as LMA and trace elements, especially using new generation sensors such as Sentinel-2 and WorldView.
The integration of different sensors (multi-source), particularly optical and thermal sensors, promises exciting results for the future of remote sensing of LMA. Several LMA constituents have been linked to thermal spectra at the laboratory level. For example, Meerdink et al. [117] successfully estimated LMA together with other traits, such as lignin, cellulose, and nitrogen, at leaf level using a synergy of in situ hyperspectral shortwave infrared spectrum (0.3–2.5 µm) and thermal infrared spectrum (2500–15,400 nm) across multiple seasons. Similarly, Ullah et al. [132] demonstrated the utility of TIR (2500–1400 nm) collected in a laboratory to estimate water content (R2 = 0.67, RMSE = 13.27%). Several other studies have demonstrated the utility of thermal spectra in leaf thickness estimation in laboratory measurements [133]. There is a need to upscale these studies to landscape and regional scales using thermal scanners mounted on aircraft (such as Hyperspectral Thermal Emission Spectrometer) and spaceborne platforms. Forthcoming sensors, such as HyspIRI, which will provide both optical and thermal spectra, will provide opportunities for integration of VSWIR and TIR at large footprints for monitoring LMA and other leaf traits. HyspIRI will provide spectral measurements in the visible to short wave (380–2500 nm) and eight multispectral channels in the mid- to thermal infrared domain (2500–12,000 nm) with a spatial resolution of 60 m and a revisit time of 5 days [93]. To date, experimental studies have demonstrated the utility of simulated HyspIRI data in estimating leaf traits [117,134,135,136]; however, landscape mapping using TIR multispectral data at short temporal resolution remains on the horizon.
Most studies conducted to date have predominantly quantified the two-dimensional variation in LMA, without capturing the three-dimensional structure of canopies. Two-dimensional mapping based on LMA of foliar samples collected from the top of the canopy is the predominant approach used in modelling LMA. Research has demonstrated that LMA significantly varies across the canopy vertical profile [137,138]. Therefore, functional traits such as LMA vary across the three-dimensional space in forest ecosystems. Few studies have successfully incorporated the three-dimensional variation in LMA modelling [44,62,139]. For example, Chlus et al. [62] demonstrated that combining top-of-canopy (R2 = 0.57, RMSE = 10.8 g m−2) and within-canopy (R2 = 0.78, RMSE = 8.3 g m−2) LMA significantly improved three-dimensional PLSR modelling (R2 = 0.82, RMSE = 8.5 g m−2) of LMA using imaging spectroscopy and LiDAR in a temperate broadleaf forest. The National Ecological Observatory Network’s Airborne Observation Platform (NEON AOP) in the United States, has been simultaneously collecting LiDAR and hyperspectral data to improve our understanding of the three-dimensional modelling of functional traits and vegetation structure across a variety of ecoregions. For example, Kamoske et al. [139] demonstrated the fusion of LiDAR (Riegl Q780 Laser Measurement System; 9.48 points/m2) and hyperspectral data (380–2500 nm; 5 nm band sampling interval) in modelling LMA for the entire canopy volume (R2 = 0.5) in a mixed forest using PLSR. In light of this background, the integration of optical imagery and LiDAR in estimating 3D patterns in LMA requires further research across sensors, functional types, and biomes. With increased access to NEON AOP, NASA Goddard’s LiDAR, Hyperspectral, and Thermal Imager (G-LiHT), the Global Ecosystem Dynamics Investigation (GEDI), and the proposed Surface Biology and Geology Mission (SBG) collecting hyperspectral and LiDAR data across a variety of biomes, there is a unique opportunity to improve our understanding on forest functioning across horizontal and vertical space and multiple temporal domains.
The unmanned aerial system (UAS) will continue to modernize airborne and spaceborne multi- and hyperspectral imaging of traits. UASs are likely to become powerful in the near future because of their advantageous revisit time and the continuous improvement in the spectral quality of sensors that can be mounted on these systems. In addition to providing a high throughput of data at localized spatial scales, these sensor-based platform systems will also play a significant part in calibrating and providing reference data for LMA mapping from spaceborne sensors.

7. Conclusions

The estimation/retrieval of LMA using remote sensing has gained considerable attention in the past decade. Accurate and timely prediction of LMA is important to understand the forest’s photosynthetic capacity and health, and for fire risk management. Remote sensing has the capacity to upscale and augment the labor-intensive field measurement across space and time. Our review presented the status, challenges, and future opportunities of remote sensing of LMA in forest ecosystems. The main findings of the review are as follows:
  • Studies on remote sensing of LMA are mainly based on leaf reflectance measured using field spectrometers. A number of studies have been conducted using airborne and spaceborne sensors. With the availability of multispectral sensors, such as Sentinel-2 and Landsat-8, and new generation sensors, such as WorldView and GeoEye, further research is required to assess the utility of these sensors to characterize a key EBV at a large spatial scale.
  • Most studies on the estimation/retrieval of LMA have been conducted using the optical range of 400–2500 nm. A few studies have assessed the utility of sensor integration, especially data in the thermal spectrum for LMA estimation. Upcoming sensors such as HyspIRI, which sense radiance in the thermal domain, will provide an opportunity to test and upscale LMA estimation in the thermal domain over large spatial extents.
  • Optical imagery can be used to estimate LMA in two-dimensional space. Studies have demonstrated that LMA significantly varies across the canopy vertical profile due to variation in radiance. Therefore, the characterization of LMA in three-dimensional space by synergizing optical sensors and LiDAR products requires further investigation in different forest types at various temporal domains.
  • Despite recent achievements in the separation of LMA constituents in radiative models such as PROSPECT, continuous efforts to unbundle LMA constituents remain an ongoing process. The modified PROSPECT models require further testing by scaling them to canopy and landscape scale in forest ecosystems.
  • The advancement in novel non-parametric algorithms, such as GPR, and the improvement in physical models, such as PROSPECT PRO, have provided opportunities for validating the utility of hybrid models in LMA retrieval from RTM simulations. Currently, hybrid models for LMA retrieval have been calibrated based on earlier versions of radiative transfer models and non-parametric models such as PLS.
  • There is potential confusion regarding the terminology used in scientific reports in referring to LMA. Terms such as mass-based leaf dry matter content (LDMC) and specific leaf weight have been used interchangeably with LMA. Consistent use of the term LMA to refer to the area-based dry matter is encouraged.

Author Contributions

Conceptualization, T.W.G., P.R.-B. and R.D.; investigation, T.W.G.; writing—original draft preparation, T.W.G.; writing—review and editing, T.W.G., P.R.-B. and R.D.; supervision, P.R.-B. and R.D.; project administration, P.R.-B.; funding acquisition, P.R.-B. All authors have read and agreed to the published version of the manuscript.

Funding

This research was funded by National Aeronautics and Space Administration (NASA) Cooperative Agreement awarded through the Maine Space Grant Consortium (Award No. 80NSSC19M0155) and the USDA National Institute of Food and Agriculture, McIntire-Stennis Project No. ME042119 through the Maine Agricultural and Forest Experiment Station (Maine Agricultural and Forest Experiment Station Publication Number 3844).

Data Availability Statement

Not applicable.

Acknowledgments

The authors appreciate comments and suggestions from the three anonymous reviewers that improved the quality of the manuscript.

Conflicts of Interest

The authors declare no conflict of interest.

References

  1. He, L.; Chen, J.; Pan, Y.; Birdsey, R.; Kattge, J. Relationships between net primary productivity and forest stand age in U.S. Forests. Glob. Biogeochem. Cycles 2012, 26, 1–16. [Google Scholar] [CrossRef]
  2. Green, D.; Erickson, J.; Kruger, E. Foliar morphology and canopy nitrogen as predictors of light-use efficiency in terrestrial vegetation. Agric. For. Meteorol. 2003, 115, 163–171. [Google Scholar] [CrossRef]
  3. Poorter, H.; Niinemets, Ü.; Poorter, L.; Wright, I.J.; Villar, R. Causes and consequences of variation in leaf mass per area (LMA): A meta-analysis. New Phytol. 2009, 182, 565–588. [Google Scholar] [CrossRef] [PubMed]
  4. Pereira, H.M.; Ferrier, S.; Walters, M.; Geller, G.N.; Jongman, R.H.G.; Scholes, R.J.; Bruford, M.W.; Brummitt, N.; Butchart, S.H.M.; Cardoso, A.C.; et al. Essential biodiversity variables. Science 2013, 339, 277. [Google Scholar] [CrossRef] [PubMed] [Green Version]
  5. Jetz, W.; McGeoch, M.A.; Guralnick, R.; Ferrier, S.; Beck, J.; Costello, M.J.; Fernandez, M.; Geller, G.N.; Keil, P.; Merow, C.; et al. Essential biodiversity variables for mapping and monitoring species populations. Nat. Ecol. Evol. 2019, 3, 539–551. [Google Scholar] [CrossRef] [PubMed] [Green Version]
  6. Qin, J.; Shangguan, Z. Effects of forest types on leaf functional traits and their interrelationships of pinus massoniana coniferous and broad-leaved mixed forests in the subtropical mountain, southeastern China. Ecol. Evol. 2019, 9, 6922–6932. [Google Scholar] [CrossRef] [Green Version]
  7. Wright, I.J.; Reich, P.B.; Westoby, M.; Ackerly, D.D.; Baruch, Z.; Bongers, F.; Cavender-Bares, J.; Chapin, T.; Cornelissen, J.H.C.; Diemer, M.; et al. The worldwide leaf economics spectrum. Nature 2004, 428, 821–827. [Google Scholar] [CrossRef]
  8. Oren, R.; Schulze, E.D.; Matyssek, R.; Zimmermann, R. Estimating photosynthetic rate and annual carbon gain in conifers from specific leaf weight and leaf biomass. Oecologia 1986, 70, 187–193. [Google Scholar] [CrossRef]
  9. Villar, R.; Ruiz-Robleto, J.; Ubera, J.L.; Poorter, H. Exploring variation in leaf mass per area (LMA) from leaf to cell: An anatomical analysis of 26 woody species. Am. J. Bot. 2013, 100, 1969–1980. [Google Scholar] [CrossRef]
  10. Abdullah, H.; Darvishzadeh, R.; Skidmore, A.K.; Groen, T.A.; Heurich, M. European spruce bark beetle (ips typographus, l.) green attack affects foliar reflectance and biochemical properties. Int. J. Appl. Earth Obs. Geoinf. 2018, 64, 199–209. [Google Scholar] [CrossRef] [Green Version]
  11. Kattge, J.; Díaz, S.; Lavorel, S.; Prentice, I.C.; Leadley, P.; Bönisch, G.; Garnier, E.; Westoby, M.; Reich, P.B.; Wright, I.J.; et al. Try—A global database of plant traits. Glob. Change Biol. 2011, 17, 2905–2935. [Google Scholar] [CrossRef]
  12. Homolová, L.; Malenovský, Z.; Clevers, J.G.P.W.; García-Santos, G.; Schaepman, M.E. Review of optical-based remote sensing for plant trait mapping. Ecol. Complex. 2013, 15, 1–16. [Google Scholar] [CrossRef] [Green Version]
  13. Rahimzadeh-Bajgiran, P.; Hennigar, C.; Weiskittel, A.; Lamb, S. Forest potential productivity mapping by linking remote-sensing-derived metrics to site variables. Remote Sens. 2020, 12, 2056. [Google Scholar] [CrossRef]
  14. Shull, C.A. A spectrophotometric study of reflection of light from leaf surfaces. Bot. Gaz. 1929, 87, 583–607. [Google Scholar] [CrossRef]
  15. Le Maire, G.; François, C.; Soudani, K.; Berveiller, D.; Pontailler, J.-Y.; Bréda, N.; Genet, H.; Davi, H.; Dufrêne, E. Calibration and validation of hyperspectral indices for the estimation of broadleaved forest leaf chlorophyll content, leaf mass per area, leaf area index and leaf canopy biomass. Remote Sens. Environ. 2008, 112, 3846–3864. [Google Scholar] [CrossRef]
  16. Romero, A.; Aguado, I.; Yebra, M. Estimation of dry matter content in leaves using normalized indexes and prospect model inversion. Int. J. Remote Sens. 2012, 33, 396–414. [Google Scholar] [CrossRef]
  17. Yang, X.; Tang, J.; Mustard, J.F.; Wu, J.; Zhao, K.; Serbin, S.; Lee, J.-E. Seasonal variability of multiple leaf traits captured by leaf spectroscopy at two temperate deciduous forests. Remote Sens. Environ. 2016, 179, 1–12. [Google Scholar] [CrossRef] [Green Version]
  18. Wang, L.; Qu, J.J.; Hao, X.; Hunt, E.R. Estimating dry matter content from spectral reflectance for green leaves of different species. Int. J. Remote Sens. 2011, 32, 7097–7109. [Google Scholar] [CrossRef]
  19. Jacquemoud, S.; Baret, F. Prospect: A model of leaf optical properties spectra. Remote Sens. Environ. 1990, 34, 75–91. [Google Scholar] [CrossRef]
  20. Jacquemoud, S.; Verhoef, W.; Baret, F.; Bacour, C.; Zarco-Tejada, P.J.; Asner, G.P.; François, C.; Ustin, S.L. PROSPECT + SAIL models: A review of use for vegetation characterization. Remote Sens. Environ. 2009, 113 (Suppl. 1), S56–S66. [Google Scholar] [CrossRef]
  21. Casas, A.; Riaño, D.; Ustin, S.L.; Dennison, P.; Salas, J. Estimation of water-related biochemical and biophysical vegetation properties using multitemporal airborne hyperspectral data and its comparison to MODIS spectral response. Remote Sens. Environ. 2014, 148, 28–41. [Google Scholar] [CrossRef]
  22. Féret, J.-B.; Berger, K.; de Boissieu, F.; Malenovský, Z. PROSPECT-PRO for estimating content of nitrogen-containing leaf proteins and other carbon-based constituents. Remote Sens. Environ. 2021, 252, 112173. [Google Scholar] [CrossRef]
  23. Féret, J.-B.; François, C.; Gitelson, A.; Asner, G.P.; Barry, K.M.; Panigada, C.; Richardson, A.D.; Jacquemoud, S. Optimizing spectral indices and chemometric analysis of leaf chemical properties using radiative transfer modeling. Remote Sens. Environ. 2011, 115, 2742–2750. [Google Scholar] [CrossRef] [Green Version]
  24. Gara, T.W.; Darvishzadeh, R.; Skidmore, A.K.; Wang, T.; Heurich, M. Evaluating the performance of PROSPECT in the retrieval of leaf traits across canopy throughout the growing season. Int. J. Appl. Earth Obs. Geoinf. 2019, 83, 101919. [Google Scholar] [CrossRef]
  25. Berger, K.; Atzberger, C.; Danner, M.; D’Urso, G.; Mauser, W.; Vuolo, F.; Hank, T. Evaluation of the PROSAIL model capabilities for future hyperspectral model environments: A review study. Remote Sens. 2018, 10, 85. [Google Scholar] [CrossRef] [Green Version]
  26. Serbin, S.P.; Wu, J.; Ely, K.S.; Kruger, E.L.; Townsend, P.A.; Meng, R.; Wolfe, B.T.; Chlus, A.; Wang, Z.; Rogers, A. From the arctic to the tropics: Multibiome prediction of leaf mass per area using leaf reflectance. New Phytol. 2019, 224, 1557–1568. [Google Scholar] [CrossRef]
  27. Serbin, S.P.; Townsend, P.A. Scaling functional traits from leaves to canopies. In Remote Sensing of Plant Biodiversity; Cavender-Bares, J., Gamon, J.A., Townsend, P.A., Eds.; Springer: Cham, Switzerland, 2020; pp. 43–82. [Google Scholar]
  28. Verrelst, J.; Camps-Valls, G.; Muñoz-Marí, J.; Rivera, J.P.; Veroustraete, F.; Clevers, J.G.P.W.; Moreno, J. Optical remote sensing and the retrieval of terrestrial vegetation bio-geophysical properties—A review. ISPRS J. Photogramm. Remote Sens. 2015, 108, 273–290. [Google Scholar] [CrossRef]
  29. Verrelst, J.; Malenovský, Z.; Van der Tol, C.; Camps-Valls, G.; Gastellu-Etchegorry, J.-P.; Lewis, P.; North, P.; Moreno, J. Quantifying vegetation biophysical variables from imaging spectroscopy data: A review on retrieval methods. Surv. Geophys. 2019, 40, 589–629. [Google Scholar] [CrossRef] [Green Version]
  30. Houborg, R.; Fisher, J.B.; Skidmore, A.K. Advances in remote sensing of vegetation function and traits. Int. J. Appl. Earth Obs. Geoinf. 2015, 43, 1–6. [Google Scholar] [CrossRef] [Green Version]
  31. Gutschick, V.P.; Wiegel, F.W. Optimizing the canopy photosynthetic rate by patterns of investment in specific leaf mass. Am. Nat. 1988, 132, 67–86. [Google Scholar] [CrossRef]
  32. Asner, G.P.; Knapp, D.E.; Anderson, C.B.; Martin, R.E.; Vaughn, N. Large-scale climatic and geophysical controls on the leaf economics spectrum. Proc. Natl. Acad. Sci. USA 2016, 113, E4043. [Google Scholar] [CrossRef] [Green Version]
  33. McGill, B.J.; Enquist, B.J.; Weiher, E.; Westoby, M. Rebuilding community ecology from functional traits. Trends Ecol. Evol. 2006, 21, 178–185. [Google Scholar] [CrossRef]
  34. Raymond Hunt, J.E.; Lingli, W.; John, J.Q.; Xianjun, H. Remote sensing of fuel moisture content from canopy water indices and normalized dry matter index. APPRES 2012, 6, 1–11. [Google Scholar] [CrossRef]
  35. Wang, L.; Hunt, E.R.; Qu, J.J.; Hao, X.; Daughtry, C.S.T. Remote sensing of fuel moisture content from ratios of narrow-band vegetation water and dry-matter indices. Remote Sens. Environ. 2013, 129, 103–110. [Google Scholar] [CrossRef] [Green Version]
  36. Asner, G.P.; Martin, R.; Tupayachi, R.; Emerson, R.; Martinez, P.; Sinca, F.N.; Powell, G.V.N.; Wright, S.J.; Lugo, A.E. Taxonomy and remote sensing of leaf mass per area (LMA) in humid tropical forests. Ecol. Appl. 2011, 21, 85–98. [Google Scholar] [CrossRef]
  37. Witkowski, E.T.F.; Lamont, B.B. Leaf specific mass confounds leaf density and thickness. Oecologia 1991, 88, 486–493. [Google Scholar] [CrossRef]
  38. Niinemets, Ü. Research review. Components of leaf dry mass per area—Thickness and density—Alter leaf photosynthetic capacity in reverse directions in woody plants. New Phytol. 1999, 144, 35–47. [Google Scholar] [CrossRef]
  39. Baret, F.; Fourty, T. Estimation of leaf water content and specific leaf weight from reflectance and transmittance measurements. Agronomie 1997, 17, 455–464. [Google Scholar] [CrossRef] [Green Version]
  40. Sims, D.A.; Gamon, J.A. Relationships between leaf pigment content and spectral reflectance across a wide range of species, leaf structures and developmental stages. Remote Sens. Environ. 2002, 81, 337–354. [Google Scholar] [CrossRef]
  41. Fourty, T.; Baret, F. On spectral estimates of fresh leaf biochemistry. Int. J. Remote Sens. 1998, 19, 1283–1297. [Google Scholar] [CrossRef]
  42. Lee, M.A. A global comparison of the nutritive values of forage plants grown in contrasting environments. J. Plant Res. 2018, 131, 641–654. [Google Scholar] [CrossRef]
  43. Wang, Z.; Chlus, A.; Geygan, R.; Ye, Z.; Zheng, T.; Singh, A.; Couture, J.J.; Cavender-Bares, J.; Kruger, E.L.; Townsend, P.A. Foliar functional traits from imaging spectroscopy across biomes in eastern north America. New Phytol. 2020, 228, 494–511. [Google Scholar] [CrossRef] [PubMed]
  44. Gara, T.W.; Darvishzadeh, R.; Skidmore, A.K.; Wang, T.; Heurich, M. Accurate modelling of canopy traits from seasonal Sentinel-2 imagery based on the vertical distribution of leaf traits. ISPRS J. Photogramm. Remote Sens. 2019, 157, 108–123. [Google Scholar] [CrossRef]
  45. Shipley, B. Structured interspecific determinants of specific leaf area in 34 species of herbaceous angiosperms. Funct. Ecol. 1995, 9, 312–319. [Google Scholar] [CrossRef]
  46. Chen, J.-L.; Reynolds, J.F.; Harley, P.C.; Tenhunen, J.D. Coordination theory of leaf nitrogen distribution in a canopy. Oecologia 1993, 93, 63–69. [Google Scholar] [CrossRef] [PubMed]
  47. Hirose, T.; Werger, M.J.A. Maximizing daily canopy photosynthesis with respect to the leaf nitrogen allocation pattern in the canopy. Oecologia 1987, 72, 520–526. [Google Scholar] [CrossRef] [PubMed]
  48. Aranda, I.; Pardo, F.; Gil, L.; Pardos, J.A. Anatomical basis of the change in leaf mass per area and nitrogen investment with relative irradiance within the canopy of eight temperate tree species. Acta Oecologica 2004, 25, 187–195. [Google Scholar] [CrossRef]
  49. Li, H.; Zhao, C.; Huang, W.; Yang, G. Non-uniform vertical nitrogen distribution within plant canopy and its estimation by remote sensing: A review. Field Crop. Res. 2013, 142, 75–84. [Google Scholar] [CrossRef]
  50. Wright, I.J.; Leishman, M.R.; Read, C.; Westoby, M. Gradients of light availability and leaf traits with leaf age and canopy position in 28 Australian shrubs and trees. Funct. Plant Biol. 2006, 33, 407–419. [Google Scholar] [CrossRef] [Green Version]
  51. Moreno-Martínez, Á.; Camps-Valls, G.; Kattge, J.; Robinson, N.; Reichstein, M.; van Bodegom, P.; Kramer, K.; Cornelissen, J.H.C.; Reich, P.; Bahn, M.; et al. A methodology to derive global maps of leaf traits using remote sensing and climate data. Remote Sens. Environ. 2018, 218, 69–88. [Google Scholar] [CrossRef] [Green Version]
  52. Chaves, M.; Marôco, J.; Pereira, J. Understanding plant responses to drought—from genes to the whole plant. Funct. Plant Biol. FPB 2003, 30, 239–264. [Google Scholar] [CrossRef] [PubMed]
  53. Lambers, H.; Poorter, H. Inherent variation in growth rate between higher plants: A search for physiological causes and ecological consequences. In Advances in Ecological Research; Begon, M., Fitter, A.H., Eds.; Academic Press: Cambridge, MA, USA, 1992; Volume 23, pp. 187–261. [Google Scholar]
  54. Li, L.; Wang, X.; Niu, J.; Cui, J.; Zhang, Q.; Wan, W.; Liu, B. Effects of elevated atmospheric O3 concentrations on early and late leaf growth and elemental contents of acer truncatum bung under mild drought. Acta Ecol. Sin. 2017, 37, 31–34. [Google Scholar] [CrossRef]
  55. Pakeman, R.J.; Quested, H.M. Sampling plant functional traits: What proportion of the species need to be measured? Appl. Veg. Sci. 2007, 10, 91–96. [Google Scholar] [CrossRef]
  56. Kumar, L.; Schmidt, K.; Dury, S.; Skidmore, A. Imaging spectrometry and vegetation science. In Imaging Spectrometry: Basic Principles and Prospective Applications; Meer, F.D., Jong, S.M.D., Eds.; Springer: Dordrecht, The Netherlands, 2001; pp. 111–155. [Google Scholar]
  57. Curran, P.J. Remote sensing of foliar chemistry. Remote Sens. Environ. 1989, 30, 271–278. [Google Scholar] [CrossRef]
  58. Qiu, F.; Chen, J.M.; Ju, W.; Wang, J.; Zhang, Q.; Fang, M. Improving the prospect model to consider anisotropic scattering of leaf internal materials and its use for retrieving leaf biomass in fresh leaves. IEEE Trans. Geosci. Remote Sens. 2018, 56, 3119–3136. [Google Scholar] [CrossRef]
  59. Féret, J.B.; le Maire, G.; Jay, S.; Berveiller, D.; Bendoula, R.; Hmimina, G.; Cheraiet, A.; Oliveira, J.C.; Ponzoni, F.J.; Solanki, T.; et al. Estimating leaf mass per area and equivalent water thickness based on leaf optical properties: Potential and limitations of physical modeling and machine learning. Remote Sens. Environ. 2019, 231, 110959. [Google Scholar] [CrossRef]
  60. Riano, D.; Vaughan, P.; Chuvieco, E.; Zarco-Tejada, P.J.; Ustin, S.L. Estimation of fuel moisture content by inversion of radiative transfer models to simulate equivalent water thickness and dry matter content: Analysis at leaf and canopy level. IEEE Trans. Geosci. Remote. Sens. 2005, 43, 819–826. [Google Scholar] [CrossRef]
  61. Zhao, K.; Valle, D.; Popescu, S.; Zhang, X.; Mallick, B. Hyperspectral remote sensing of plant biochemistry using bayesian model averaging with variable and band selection. Remote Sens. Environ. 2013, 132, 102–119. [Google Scholar] [CrossRef]
  62. Chlus, A.; Kruger, E.L.; Townsend, P.A. Mapping three-dimensional variation in leaf mass per area with imaging spectroscopy and lidar in a temperate broadleaf forest. Remote Sens. Environ. 2020, 250, 112043. [Google Scholar] [CrossRef]
  63. Cheng, T.; Rivard, B.; Sánchez-Azofeifa, A.G.; Féret, J.-B.; Jacquemoud, S.; Ustin, S.L. Deriving leaf mass per area (LMA) from foliar reflectance across a variety of plant species using continuous wavelet analysis. ISPRS J. Photogramm. Remote Sens. 2014, 87, 28–38. [Google Scholar] [CrossRef]
  64. Ali, A.M.; Darvishzadeh, R.; Skidmore, A.K.; Duren, I.v. Effects of canopy structural variables on retrieval of leaf dry matter content and specific leaf area from remotely sensed data. Sel. Top. Appl. Earth Obs. Remote Sens. IEEE J. 2015, 9, 898–909. [Google Scholar] [CrossRef]
  65. Ollinger, S.V. Sources of variability in canopy reflectance and the convergent properties of plants. New Phytol. 2011, 189, 375–394. [Google Scholar] [CrossRef]
  66. Townsend, P.A.; Foster, J.R.; Chastain, R.A.; Currie, W.S. Application of imaging spectroscopy to mapping canopy nitrogen in the forests of the central appalachian mountains using Hyperion and AVIRIS. IEEE Trans. Geosci. Remote Sens. 2003, 41, 1347–1354. [Google Scholar] [CrossRef]
  67. Asner, G.P.; Martin, R.E.; Anderson, C.B.; Knapp, D.E. Quantifying forest canopy traits: Imaging spectroscopy versus field survey. Remote Sens. Environ. 2015, 158, 15–27. [Google Scholar] [CrossRef]
  68. Gara, T.W. Quantitative Remote Sensing of Essential Biodiversity Variables. Ph.D. Thesis, University of Twente, ITC, Enschede, The Netherlands, 2019. [Google Scholar]
  69. Gara, T.W.; Skidmore, A.K.; Darvishzadeh, R.; Wang, T. Leaf to canopy upscaling approach affects the estimation of canopy traits. GISci. Remote Sens. 2019, 56, 554–575. [Google Scholar]
  70. Lavorel, S.; Grigulis, K.; McIntyre, S.; Williams, N.S.G.; Garden, D.; Dorrough, J.; Berman, S.; Quétier, F.; Thébault, A.; Bonis, A. Assessing functional diversity in the field—Methodology matters! Funct. Ecol. 2008, 22, 134–147. [Google Scholar] [CrossRef]
  71. Asner, G.P.; Martin, R.E.; Anderson, C.B.; Kryston, K.; Vaughn, N.; Knapp, D.E.; Bentley, L.P.; Shenkin, A.; Salinas, N.; Sinca, F.; et al. Scale dependence of canopy trait distributions along a tropical forest elevation gradient. New Phytol. 2016, 214, 973–988. [Google Scholar] [CrossRef] [PubMed]
  72. Nunes, M.H.; Davey, M.P.; Coomes, D.A. On the challenges of using field spectroscopy to measure the impact of soil type on leaf traits. Biogeosciences 2017, 14, 3371–3385. [Google Scholar] [CrossRef] [Green Version]
  73. Milton, E.J.; Schaepman, M.E.; Anderson, K.; Kneubühler, M.; Fox, N. Progress in field spectroscopy. Remote Sens. Environ. 2009, 113, S92–S109. [Google Scholar] [CrossRef] [Green Version]
  74. Thome, K.; Wenny, B.; Anderson, N.; McCorkel, J.; Czapla-Myers, J.; Biggar, S. Ultra-portable field transfer radiometer for vicarious calibration of earth imaging sensors. Metrologia 2018, 55, S104–S117. [Google Scholar] [CrossRef] [Green Version]
  75. Le Maire, G.; François, C.; Dufrêne, E. Towards universal broad leaf chlorophyll indices using prospect simulated database and hyperspectral reflectance measurements. Remote Sens. Environ. 2004, 89, 1–28. [Google Scholar] [CrossRef]
  76. Li, P.; Wang, Q. Developing and validating novel hyperspectral indices for leaf area index estimation: Effect of canopy vertical heterogeneity. Ecol. Indic. 2013, 32, 123–130. [Google Scholar] [CrossRef]
  77. Wang, Q.; Li, P. Hyperspectral indices for estimating leaf biochemical properties in temperate deciduous forests: Comparison of simulated and measured reflectance data sets. Ecol. Indic. 2012, 14, 56–65. [Google Scholar] [CrossRef]
  78. Cho, M.A.; Skidmore, A.K. A new technique for extracting the red edge position from hyperspectral data: The linear extrapolation method. Remote Sens. Environ. 2006, 101, 181–193. [Google Scholar] [CrossRef]
  79. Wang, Z.; Skidmore, A.K.; Wang, T.; Darvishzadeh, R.; Hearne, J. Applicability of the prospect model for estimating protein and cellulose + lignin in fresh leaves. Remote Sens. Environ. 2015, 168, 205–218. [Google Scholar] [CrossRef]
  80. Schlerf, M.; Atzberger, C. Inversion of a forest reflectance model to estimate structural canopy variables from hyperspectral remote sensing data. Remote Sens. Environ. 2006, 100, 281–294. [Google Scholar] [CrossRef]
  81. Wang, Z.; Skidmore, A.K.; Darvishzadeh, R.; Wang, T. Mapping forest canopy nitrogen content by inversion of coupled leaf-canopy radiative transfer models from airborne hyperspectral imagery. Agric. For. Meteorol. 2018, 253–254, 247–260. [Google Scholar] [CrossRef]
  82. Féret, J.B.; Gitelson, A.A.; Noble, S.D.; Jacquemoud, S. PROSPECT-D: Towards modeling leaf optical properties through a complete lifecycle. Remote Sens. Environ. 2017, 193, 204–215. [Google Scholar] [CrossRef] [Green Version]
  83. Hoeppner, J.M.; Skidmore, A.K.; Darvishzadeh, R.; Heurich, M.; Chang, H.-C.; Gara, T.W. Mapping canopy chlorophyll content in a temperate forest using airborne hyperspectral data. Remote Sens. 2020, 12, 3573. [Google Scholar] [CrossRef]
  84. Blackburn, G.A. Remote sensing of forest pigments using airborne imaging spectrometer and lidar imagery. Remote Sens. Environ. 2002, 82, 311–321. [Google Scholar] [CrossRef]
  85. Singh, A.; Serbin, S.P.; McNeil, B.E.; Kingdon, C.C.; Townsend, P.A. Imaging spectroscopy algorithms for mapping canopy foliar chemical and morphological traits and their uncertainties. Ecol. Appl. 2015, 25, 2180–2197. [Google Scholar] [CrossRef] [Green Version]
  86. Chadwick, K.D.; Asner, G.P. Organismic-scale remote sensing of canopy foliar traits in lowland tropical forests. Remote Sens. 2016, 8, 87. [Google Scholar] [CrossRef] [Green Version]
  87. Chauhan, S.; Darvishzadeh, R.; Boschetti, M.; Pepe, M.; Nelson, A. Remote sensing-based crop lodging assessment: Current status and perspectives. ISPRS J. Photogramm. Remote Sens. 2019, 151, 124–140. [Google Scholar] [CrossRef] [Green Version]
  88. Xie, C.; Yang, C. A review on plant high-throughput phenotyping traits using uav-based sensors. Comput. Electron. Agric. 2020, 178, 105731. [Google Scholar] [CrossRef]
  89. Thomson, E.R.; Malhi, Y.; Bartholomeus, H.; Oliveras, I.; Gvozdevaite, A.; Peprah, T.; Suomalainen, J.; Quansah, J.; Seidu, J.; Adonteng, C.; et al. Mapping the leaf economic spectrum across west african tropical forests using UAV-acquired hyperspectral imagery. Remote Sens. 2018, 10, 1532. [Google Scholar] [CrossRef] [Green Version]
  90. Wallis, C.I.B.; Homeier, J.; Peña, J.; Brandl, R.; Farwig, N.; Bendix, J. Modeling tropical montane forest biomass, productivity and canopy traits with multispectral remote sensing data. Remote Sens. Environ. 2019, 225, 77–92. [Google Scholar] [CrossRef]
  91. Shamsoddini, A.; Raval, S. Mapping red edge-based vegetation health indicators using landsat tm data for Australian native vegetation cover. Earth Sci. Inform. 2018, 11, 545–552. [Google Scholar] [CrossRef]
  92. Coops, N.C.; Smith, M.L.; Martin, M.E.; Ollinger, S.V. Prediction of eucalypt foliage nitrogen content from satellite-derived hyperspectral data. IEEE Trans. Geosci. Remote. Sens. 2003, 41, 1338–1346. [Google Scholar] [CrossRef]
  93. Lee, C.M.; Cable, M.L.; Hook, S.J.; Green, R.O.; Ustin, S.L.; Mandl, D.J.; Middleton, E.M. An introduction to the NASA hyperspectral infrared imager (HYSPIRI) mission and preparatory activities. Remote Sens. Environ. 2015, 167, 6–19. [Google Scholar] [CrossRef]
  94. Shoko, C.; Mutanga, O.; Dube, T. Progress in the remote sensing of C3 and C4 grass species aboveground biomass over time and space. ISPRS J. Photogramm. Remote. Sens. 2016, 120, 13–24. [Google Scholar] [CrossRef]
  95. Le Maire, G.; Marsden, C.; Verhoef, W.; Ponzoni, F.J.; Lo Seen, D.; Bégué, A.; Stape, J.-L.; Nouvellon, Y. Leaf area index estimation with MODIS reflectance time series and model inversion during full rotations of eucalyptus plantations. Remote Sens. Environ. 2011, 115, 586–599. [Google Scholar] [CrossRef]
  96. Verrelst, J.; Rivera, J.P.; Veroustraete, F.; Muñoz-Marí, J.; Clevers, J.G.P.W.; Camps-Valls, G.; Moreno, J. Experimental Sentinel-2 LAI estimation using parametric, non-parametric and physical retrieval methods—A comparison. ISPRS J. Photogramm. Remote Sens. 2015, 108, 260–272. [Google Scholar] [CrossRef]
  97. Blackburn, G.A. Wavelet decomposition of hyperspectral data: A novel approach to quantifying pigment concentrations in vegetation. Int. J. Remote Sens. 2007, 28, 2831–2855. [Google Scholar] [CrossRef]
  98. Geladi, P.; Kowalski, B.R. Partial least-squares regression: A tutorial. Anal. Chim. Acta 1986, 185, 1–17. [Google Scholar] [CrossRef]
  99. Kokaly, R.F.; Clark, R.N. Spectroscopic determination of leaf biochemistry using band-depth analysis of absorption features and stepwise multiple linear regression. Remote Sens. Environ. 1999, 67, 267–287. [Google Scholar] [CrossRef]
  100. Wold, S.; Esbensen, K.; Geladi, P. Principal component analysis. Chemom. Intell. Lab. Syst. 1987, 2, 37–52. [Google Scholar] [CrossRef]
  101. Breiman, L. Random forests. Mach. Learn. 2001, 45, 5–32. [Google Scholar] [CrossRef] [Green Version]
  102. Haykin, S. Neural Networks: A Comprehensive Foundation; Prentice Hall PTR: Hoboken, NJ, USA, 1994. [Google Scholar]
  103. Shawe-Taylor, J.; Cristianini, N. Kernel Methods for Pattern Analysis; Cambridge University Press: Cambridge, UK, 2004. [Google Scholar]
  104. Doughty, C.E.; Asner, G.P.; Martin, R.E. Predicting tropical plant physiology from leaf and canopy spectroscopy. Oecologia 2011, 165, 289–299. [Google Scholar] [CrossRef]
  105. Sun, J.; Shi, S.; Yang, J.; Du, L.; Gong, W.; Chen, B.; Song, S. Analyzing the performance of prospect model inversion based on different spectral information for leaf biochemical properties retrieval. ISPRS J. Photogramm. Remote Sens. 2018, 135, 74–83. [Google Scholar] [CrossRef]
  106. Jiang, J.; Comar, A.; Weiss, M.; Baret, F. Faspect: A model of leaf optical properties accounting for the differences between upper and lower faces. Remote Sens. Environ. 2021, 253, 112205. [Google Scholar] [CrossRef]
  107. Miraglio, T.; Adeline, K.; Huesca, M.; Ustin, S.; Briottet, X. Joint use of Prosail and dart for fast LUT building: Application to gap fraction and leaf biochemistry estimations over sparse oak stands. Remote Sens. 2020, 12, 2925. [Google Scholar] [CrossRef]
  108. Ali, A.M.; Darvishzadeh, R.; Skidmore, A.K. Retrieval of specific leaf area from Landsat-8 surface reflectance data using statistical and physical models. IEEE J. Sel. Top. Appl. Earth Obs. Remote Sens. 2017, 10, 3529–3536. [Google Scholar] [CrossRef]
  109. Hosgood, B.; Jacquemoud, S.; Andreoli, G.; Verdebout, J.; Pedrini, G.; Schmuck, G. Leaf optical properties experiment 93 (LOPEX93). Rep. EUR 1995, 16095, 1–46. [Google Scholar]
  110. Hauser, L.T.; Féret, J.-B.; An Binh, N.; van der Windt, N.; Sil, Â.F.; Timmermans, J.; Soudzilovskaia, N.A.; van Bodegom, P.M. Towards scalable estimation of plant functional diversity from Sentinel-2: In-situ validation in a heterogeneous (semi-)natural landscape. Remote Sens. Environ. 2021, 262, 112505. [Google Scholar] [CrossRef]
  111. Faurtyot, T.; Baret, F. Vegetation water and dry matter contents estimated from top-of-the-atmosphere reflectance data: A simulation study. Remote Sens. Environ. 1997, 61, 34–45. [Google Scholar] [CrossRef]
  112. Darvishzadeh, R.; Skidmore, A.; Schlerf, M.; Atzberger, C.; Corsi, F.; Cho, M. LAI and chlorophyll estimation for a heterogeneous grassland using hyperspectral measurements. ISPRS J. Photogramm. Remote Sens. 2008, 63, 409–426. [Google Scholar] [CrossRef]
  113. Dormann, C.F.; Elith, J.; Bacher, S.; Buchmann, C.; Carl, G.; Carré, G.; Marquéz, J.R.G.; Gruber, B.; Lafourcade, B.; Leitão, P.J.; et al. Collinearity: A review of methods to deal with it and a simulation study evaluating their performance. Ecography 2013, 36, 27–46. [Google Scholar] [CrossRef]
  114. Grossman, Y.L.; Ustin, S.L.; Jacquemoud, S.; Sanderson, E.W.; Schmuck, G.; Verdebout, J. Critique of stepwise multiple linear regression for the extraction of leaf biochemistry information from leaf reflectance data. Remote Sens. Environ. 1996, 56, 182–193. [Google Scholar] [CrossRef]
  115. Streher, A.S.; Torres, R.d.S.; Morellato, L.P.C.; Silva, T.S.F. Accuracy and limitations for spectroscopic prediction of leaf traits in seasonally dry tropical environments. Remote Sens. Environ. 2020, 244, 111828. [Google Scholar] [CrossRef]
  116. Mutanga, O.; Skidmore, A.K. Narrow band vegetation indices overcome the saturation problem in biomass estimation. Int. J. Remote Sens. 2004, 25, 3999–4014. [Google Scholar] [CrossRef]
  117. Meerdink, S.K.; Roberts, D.A.; King, J.Y.; Roth, K.L.; Dennison, P.E.; Amaral, C.H.; Hook, S.J. Linking seasonal foliar traits to vswir-tir spectroscopy across california ecosystems. Remote Sens. Environ. 2016, 186, 322–338. [Google Scholar] [CrossRef]
  118. Rocha, A.D.; Groen, T.A.; Skidmore, A.K.; Darvishzadeh, R.; Willemen, L. The naïve overfitting index selection (NOIS): A new method to optimize model complexity for hyperspectral data. ISPRS J. Photogramm. Remote Sens. 2017, 133, 61–74. [Google Scholar] [CrossRef]
  119. Verrelst, J.; Rivera, J.P.; Leonenko, G.; Alonso, L.; Moreno, J. Optimizing LUT-based RTM inversion for semiautomatic mapping of crop biophysical parameters from Sentinel-2 and -3 data: Role of cost functions. IEEE Trans. Geosci. Remote Sens. 2014, 52, 257–269. [Google Scholar] [CrossRef]
  120. Nakaji, T.; Oguma, H.; Nakamura, M.; Kachina, P.; Asanok, L.; Marod, D.; Aiba, M.; Kurokawa, H.; Kosugi, Y.; Kassim, A.R.; et al. Estimation of six leaf traits of east asian forest tree species by leaf spectroscopy and partial least square regression. Remote Sens. Environ. 2019, 233, 111381. [Google Scholar] [CrossRef]
  121. Rocha, A.D.; Groen, T.A.; Skidmore, A.K.; Darvishzadeh, R.; Willemen, L. Machine learning using hyperspectral data inaccurately predicts plant traits under spatial dependency. Remote Sens. 2018, 10, 1263. [Google Scholar] [CrossRef] [Green Version]
  122. Combal, B.; Baret, F.; Weiss, M.; Trubuil, A.; Macé, D.; Pragnère, A.; Myneni, R.; Knyazikhin, Y.; Wang, L. Retrieval of canopy biophysical variables from bidirectional reflectance: Using prior information to solve the ill-posed inverse problem. Remote Sens. Environ. 2003, 84, 1–15. [Google Scholar] [CrossRef]
  123. Richter, K.; Atzberger, C.; Vuolo, F.; Weihs, P.; D’Urso, G. Experimental assessment of the Sentinel-2 band setting for RTM-based LAI retrieval of sugar beet and maize. Can. J. Remote Sens. 2009, 35, 230–247. [Google Scholar] [CrossRef]
  124. Spafford, L.; le Maire, G.; MacDougall, A.; de Boissieu, F.; Féret, J.-B. Spectral subdomains and prior estimation of leaf structure improves PROSPECT inversion on reflectance or transmittance alone. Remote Sens. Environ. 2021, 252, 112176. [Google Scholar] [CrossRef]
  125. Rivera-Caicedo, J.P.; Verrelst, J.; Muñoz-Marí, J.; Camps-Valls, G.; Moreno, J. Hyperspectral dimensionality reduction for biophysical variable statistical retrieval. ISPRS J. Photogramm. Remote Sens. 2017, 132, 88–101. [Google Scholar] [CrossRef]
  126. Skidmore, A.K.; Pettorelli, N.; Coops, N.C.; Geller, G.N.; Hansen, M.; Lucas, R.; Mücher, C.A.; O’Connor, B.; Paganini, M.; Pereira, H.M.; et al. Environmental science: Agree on biodiversity metrics to track from space. Nature 2015, 523, 403–405. [Google Scholar] [CrossRef] [Green Version]
  127. Pettorelli, N.; Wegmann, M.; Skidmore, A.; Mücher, S.; Dawson, T.P.; Fernandez, M.; Lucas, R.; Schaepman, M.E.; Wang, T.; O’Connor, B.; et al. Framing the concept of satellite remote sensing essential biodiversity variables: Challenges and future directions. Remote Sens. Ecol. Conserv. 2016, 2, 122–131. [Google Scholar] [CrossRef]
  128. Dawson, T.P.; Curran, P.J.; Plummer, S.E. Liberty—modeling the effects of leaf biochemical concentration on reflectance spectra. Remote Sens. Environ. 1998, 65, 50–60. [Google Scholar] [CrossRef]
  129. Verrelst, J.; Rivera, J.P.; Moreno, J.; Camps-Valls, G. Gaussian processes uncertainty estimates in experimental Sentinel-2 lai and leaf chlorophyll content retrieval. ISPRS J. Photogramm. Remote Sens. 2013, 86, 157–167. [Google Scholar] [CrossRef]
  130. Ali, A.M.; Darvishzadeh, R.; Skidmore, A.; Gara, T.W.; Heurich, M. Machine learning methods’ performance in radiative transfer model inversion to retrieve plant traits from Sentinel-2 data of a mixed mountain forest. Int. J. Digit. Earth 2021, 14, 106–120. [Google Scholar] [CrossRef]
  131. Ali, A.M.; Darvishzadeh, R.; Skidmore, A.; Gara, T.W.; O’Connor, B.; Roeoesli, C.; Heurich, M.; Paganini, M. Comparing methods for mapping canopy chlorophyll content in a mixed mountain forest using Sentinel-2 data. Int. J. Appl. Earth Obs. Geoinf. 2020, 87, 102037. [Google Scholar] [CrossRef]
  132. Ullah, S.; Skidmore, A.K.; Ramoelo, A.; Groen, T.A.; Naeem, M.; Ali, A. Retrieval of leaf water content spanning the visible to thermal infrared spectra. ISPRS J. Photogramm. Remote Sens. 2014, 93, 56–64. [Google Scholar] [CrossRef]
  133. Buitrago, M.F.; Groen, T.A.; Hecker, C.A.; Skidmore, A.K. Spectroscopic determination of leaf traits using infrared spectra. Int. J. Appl. Earth Obs. Geoinf. 2018, 69, 237–250. [Google Scholar] [CrossRef]
  134. Sibanda, M.; Mutanga, O.; Rouget, M. Comparing the spectral settings of the new generation broad and narrow band sensors in estimating biomass of native grasses grown under different management practices. GISci. Remote Sens. 2016, 53, 614–633. [Google Scholar] [CrossRef]
  135. Mitchell, J.J.; Shrestha, R.; Spaete, L.P.; Glenn, N.F. Combining airborne hyperspectral and lidar data across local sites for upscaling shrubland structural information: Lessons for hyspiri. Remote Sens. Environ. 2015, 167, 98–110. [Google Scholar] [CrossRef]
  136. Bell, T.W.; Cavanaugh, K.C.; Siegel, D.A. Remote monitoring of giant kelp biomass and physiological condition: An evaluation of the potential for the hyperspectral infrared imager (HYSPIRI) mission. Remote Sens. Environ. 2015, 167, 218–228. [Google Scholar] [CrossRef]
  137. Coble, A.P.; VanderWall, B.; Mau, A.; Cavaleri, M.A. How vertical patterns in leaf traits shift seasonally and the implications for modeling canopy photosynthesis in a temperate deciduous forest. Tree Physiol. 2016, 36, 1077–1091. [Google Scholar] [CrossRef] [PubMed] [Green Version]
  138. Gara, T.; Darvishzadeh, R.; Skidmore, A.; Wang, T. Impact of vertical canopy position on leaf spectral properties and traits across multiple species. Remote Sens. 2018, 10, 346. [Google Scholar] [CrossRef] [Green Version]
  139. Kamoske, A.G.; Dahlin, K.M.; Serbin, S.P.; Stark, S.C. Leaf traits and canopy structure together explain canopy functional diversity: An airborne remote sensing approach. Ecol. Appl. 2020, 31, e02230. [Google Scholar] [CrossRef] [PubMed]
Figure 1. Anatomical variation in leaf characteristics at cell (purple), tissue (yellow), and leaf (green) levels that govern variation in LMA. Vascular + scler tissue = vascular tissue plus sclerenchymatous tissue. Adapted from [9].
Remotesensing 13 03352 g001
Figure 2. Correlation coefficients between LMA (g cm−2) and other leaf traits based on the Leaf Optical Properties Experiment (LOPEX) dataset (n = 126). Crops and vegetables were not included in the analysis. Cab = total chlorophyll (µg cm−2), Car = carotenoid concentration (in µg/cm2), EWT = equivalent water thickness (cm), LT = leaf thickness (in µm), Carea = area based carbon (g cm−2), Cmass = mass based carbon (mg g−1), Nmass = mass based nitrogen (mg g−1), Narea = area based nitrogen (g cm−2), Cell_mass = mass based cellulose (mg g−1), Cell_area = area based cellulose (g cm−2), Lign_mass = mass based lignin (mg g−1), Lign_area = area based lignin (g cm−2), Star_mass = mass based starch (mg g−1), Star_area = area based starch (g cm−2), SLA = specific leaf area (cm2 g−1).
Remotesensing 13 03352 g002
Figure 3. Global variation in LMA generated from MODIS reflectance product (MCD43A4) and WorldClim climatic data (temperature and rainfall) at 500 m spatial resolution using the random forest machine learning technique (R2 = 0.58). Inversely retrieved from SLA based on [51].
Remotesensing 13 03352 g003
Figure 5. An overview of methods and techniques used in leaf trait retrieval/estimation. Modified based on [29] REIP: red edge inflection position, CR: continuum removal, PLSR: partial least squares regression, SMLR: stepwise multiple linear regression, PCR: principal component regression, RF: random forest, BRT: boosted regression trees, ANN: artificial neural network, BPANN: back propagation artificial neural network, SVM: support vector model, GPR: Gaussian process regression, LUT: lookup table, RTM: radiative transfer model.
Remotesensing 13 03352 g005
Publisher’s Note: MDPI stays neutral with regard to jurisdictional claims in published maps and institutional affiliations.

