
Detection and Mapping of Active Landslides before Impoundment in the Baihetan Reservoir Area (China) Based on the Time-Series InSAR Method

Abstract
:
1. Introduction
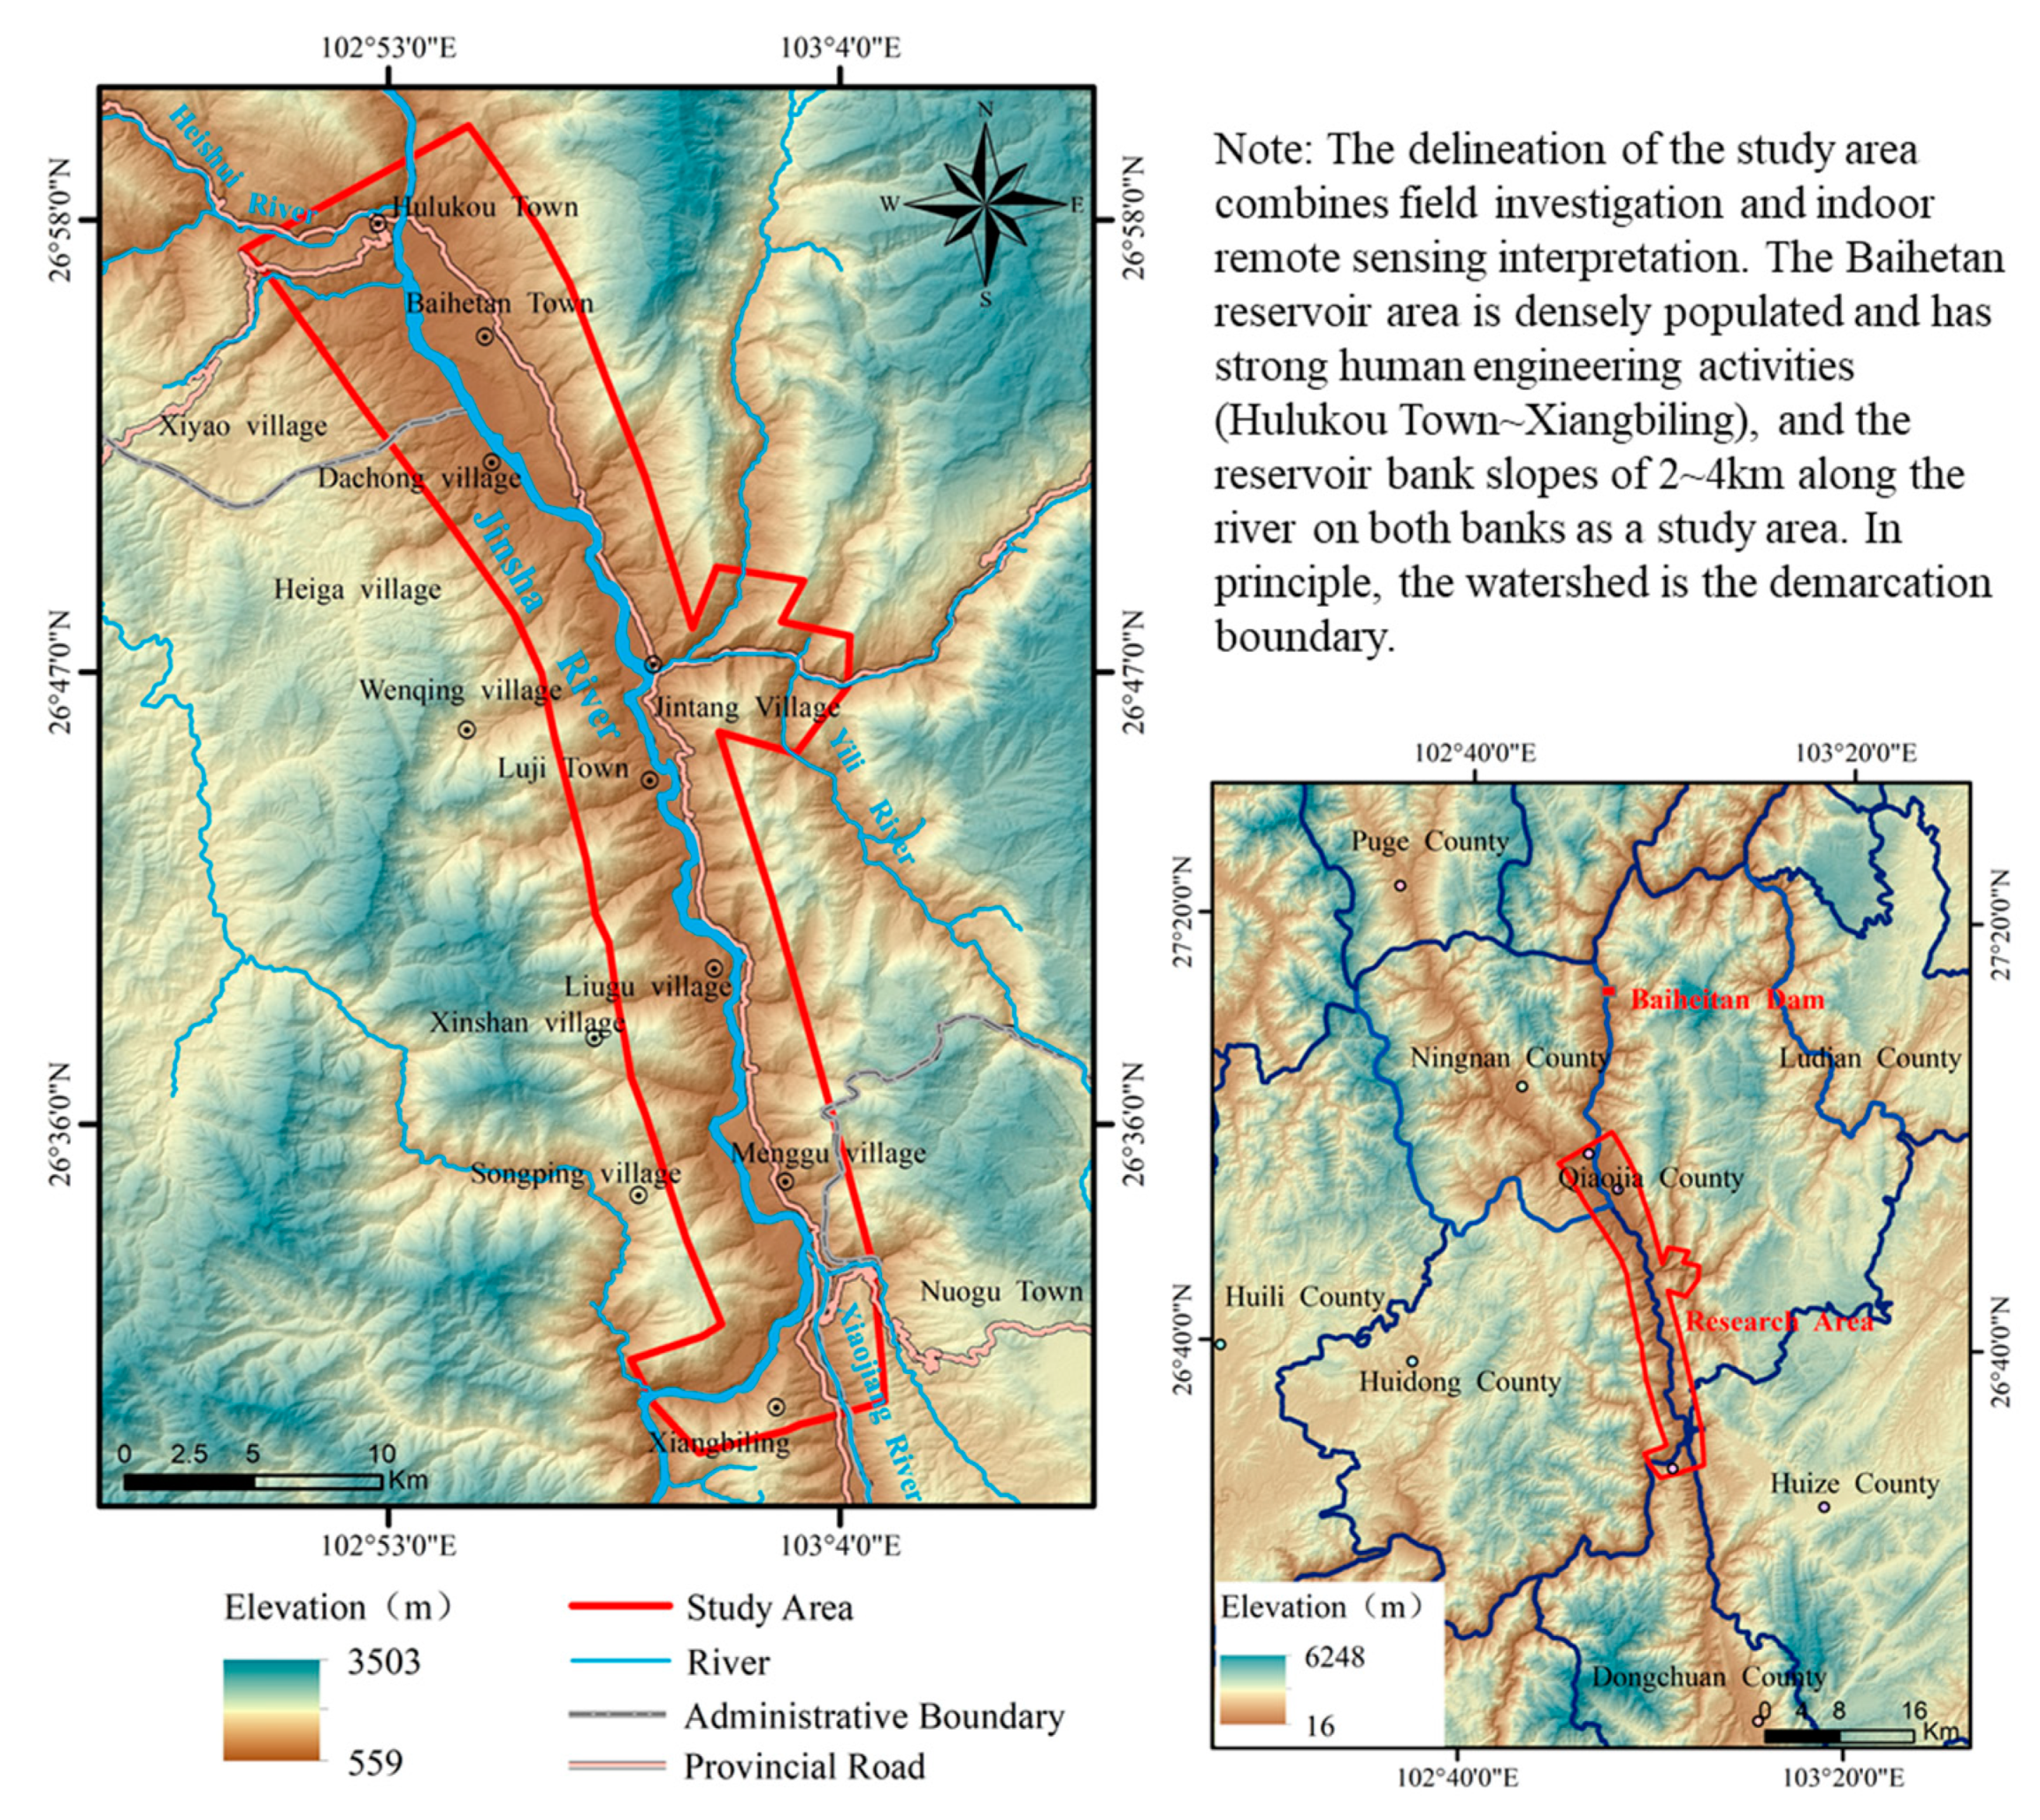
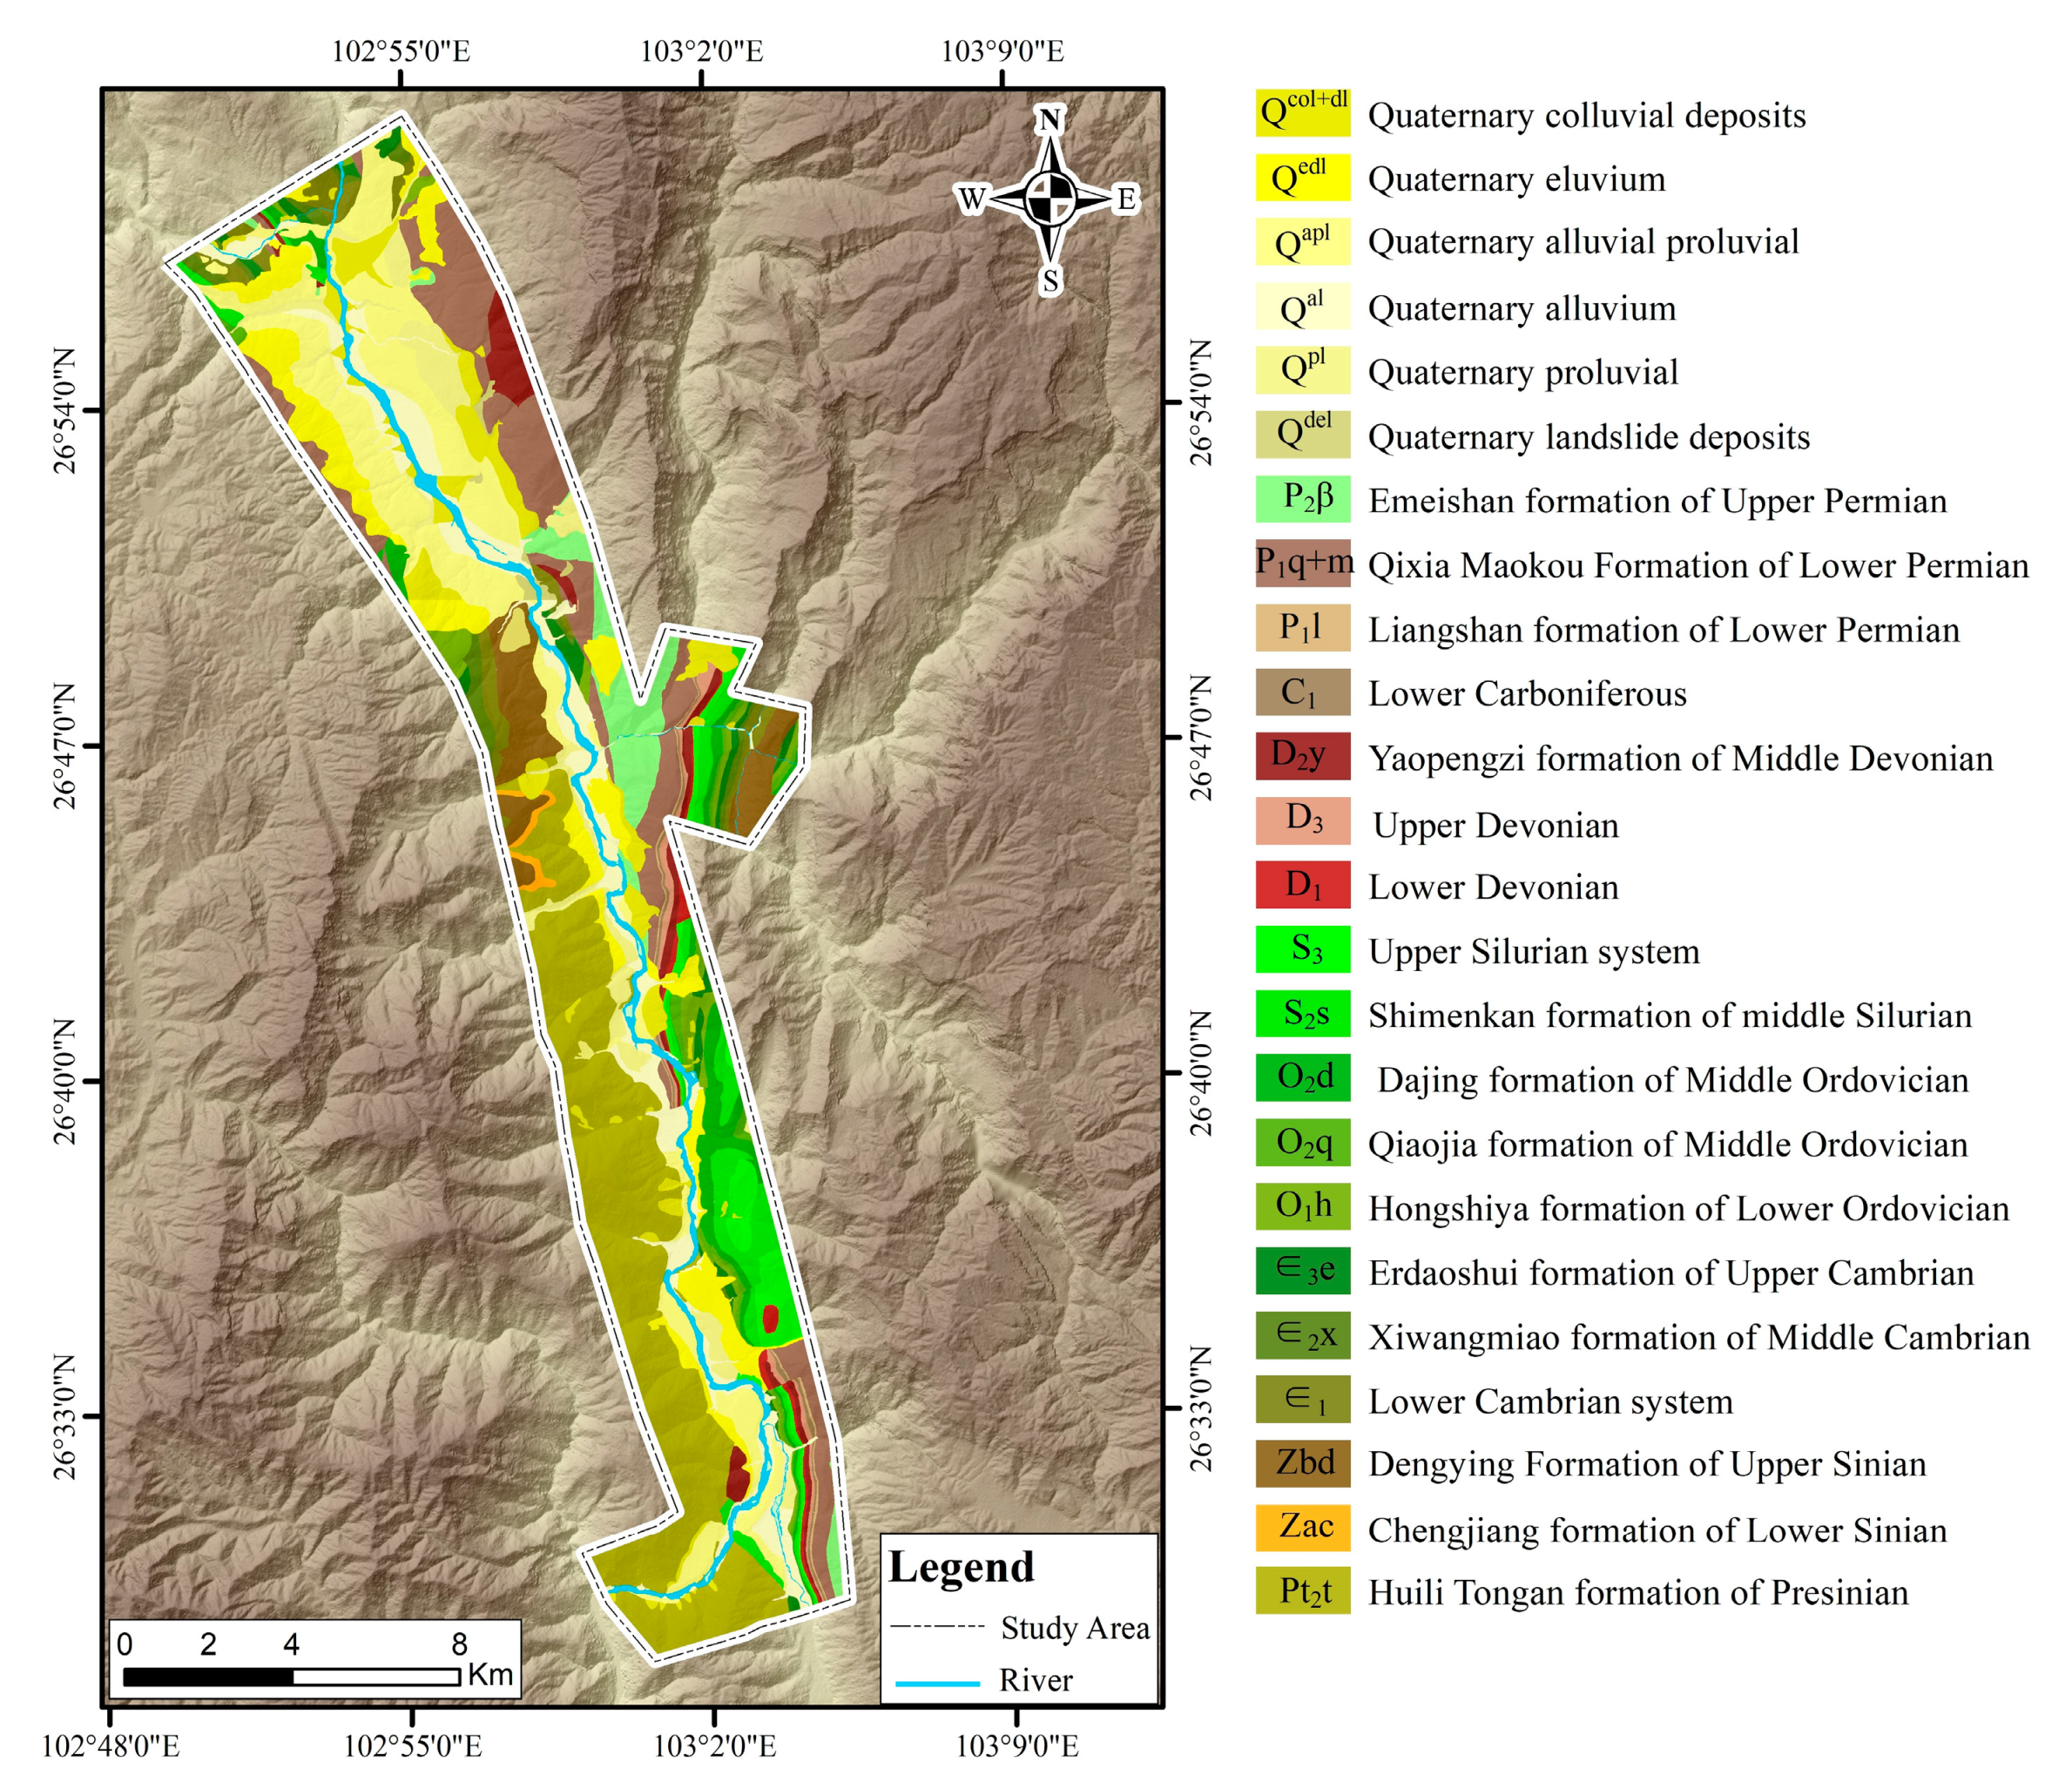
2. Study Area
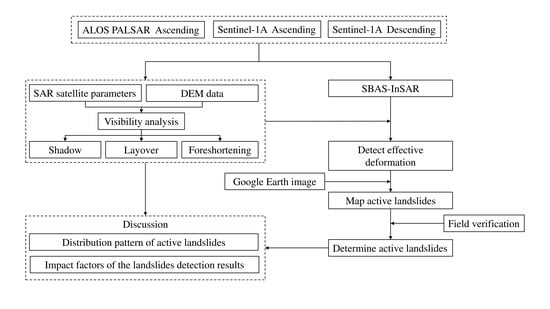
3. Data and Methodology
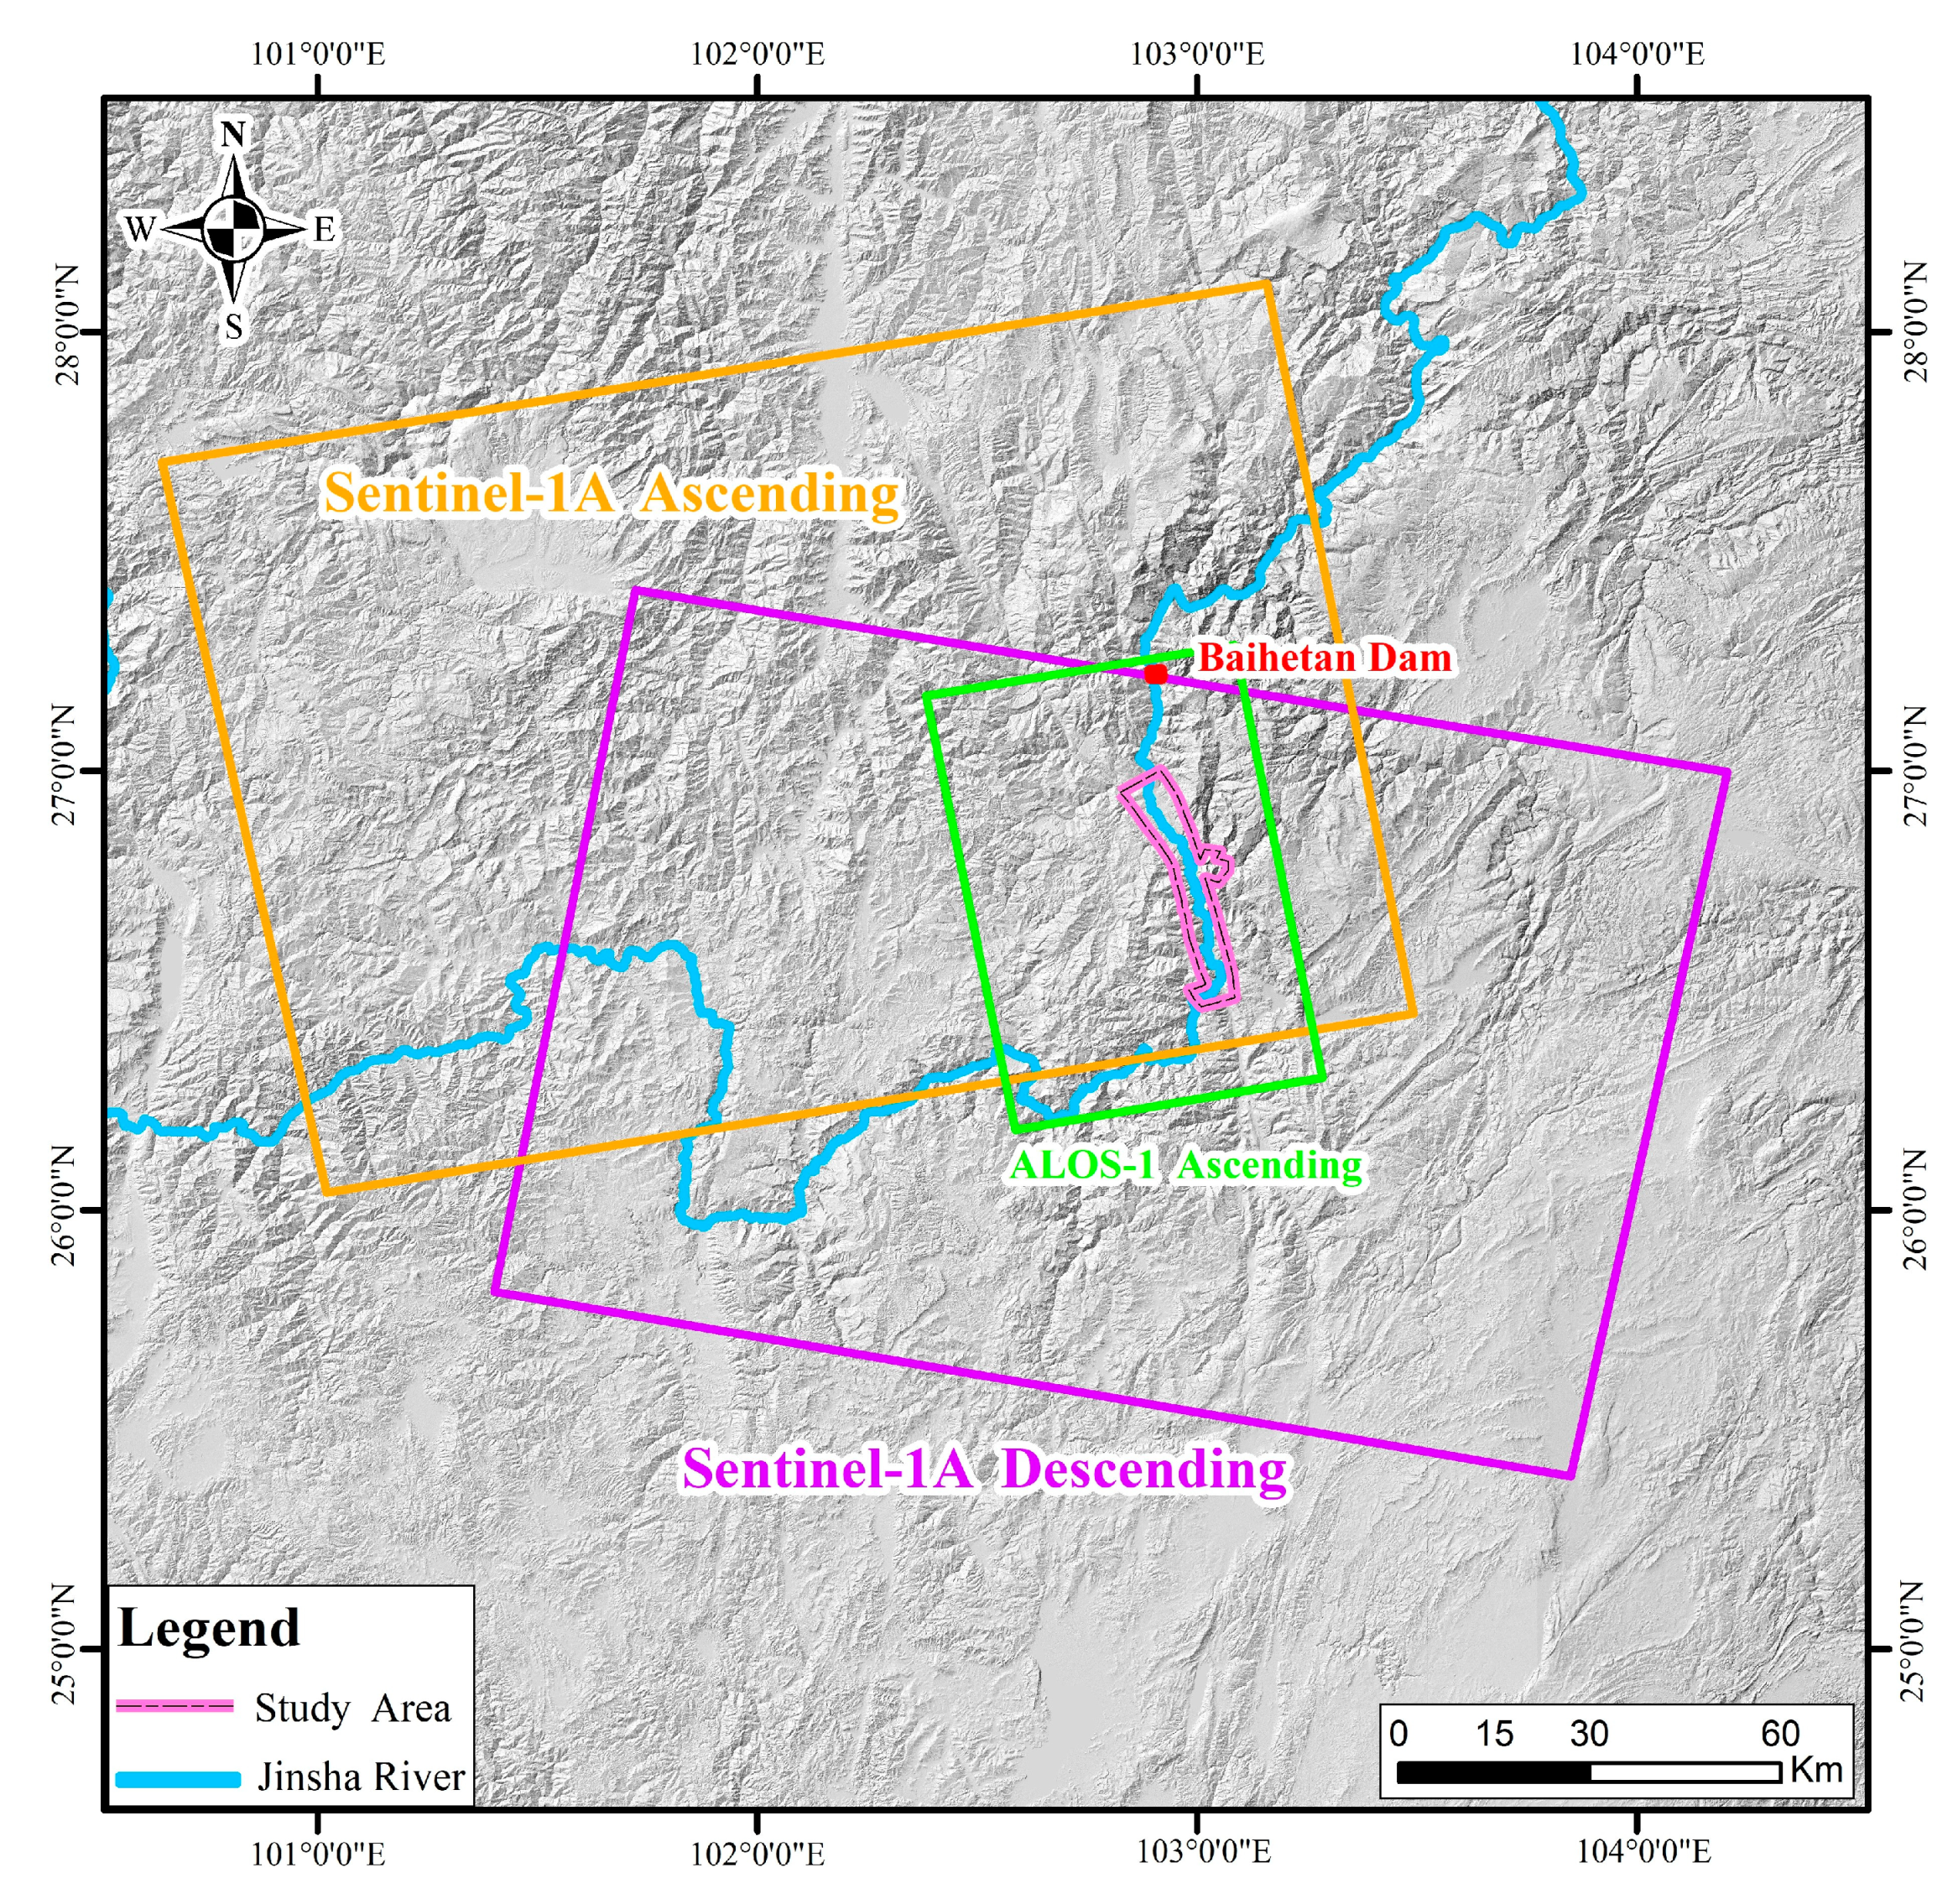
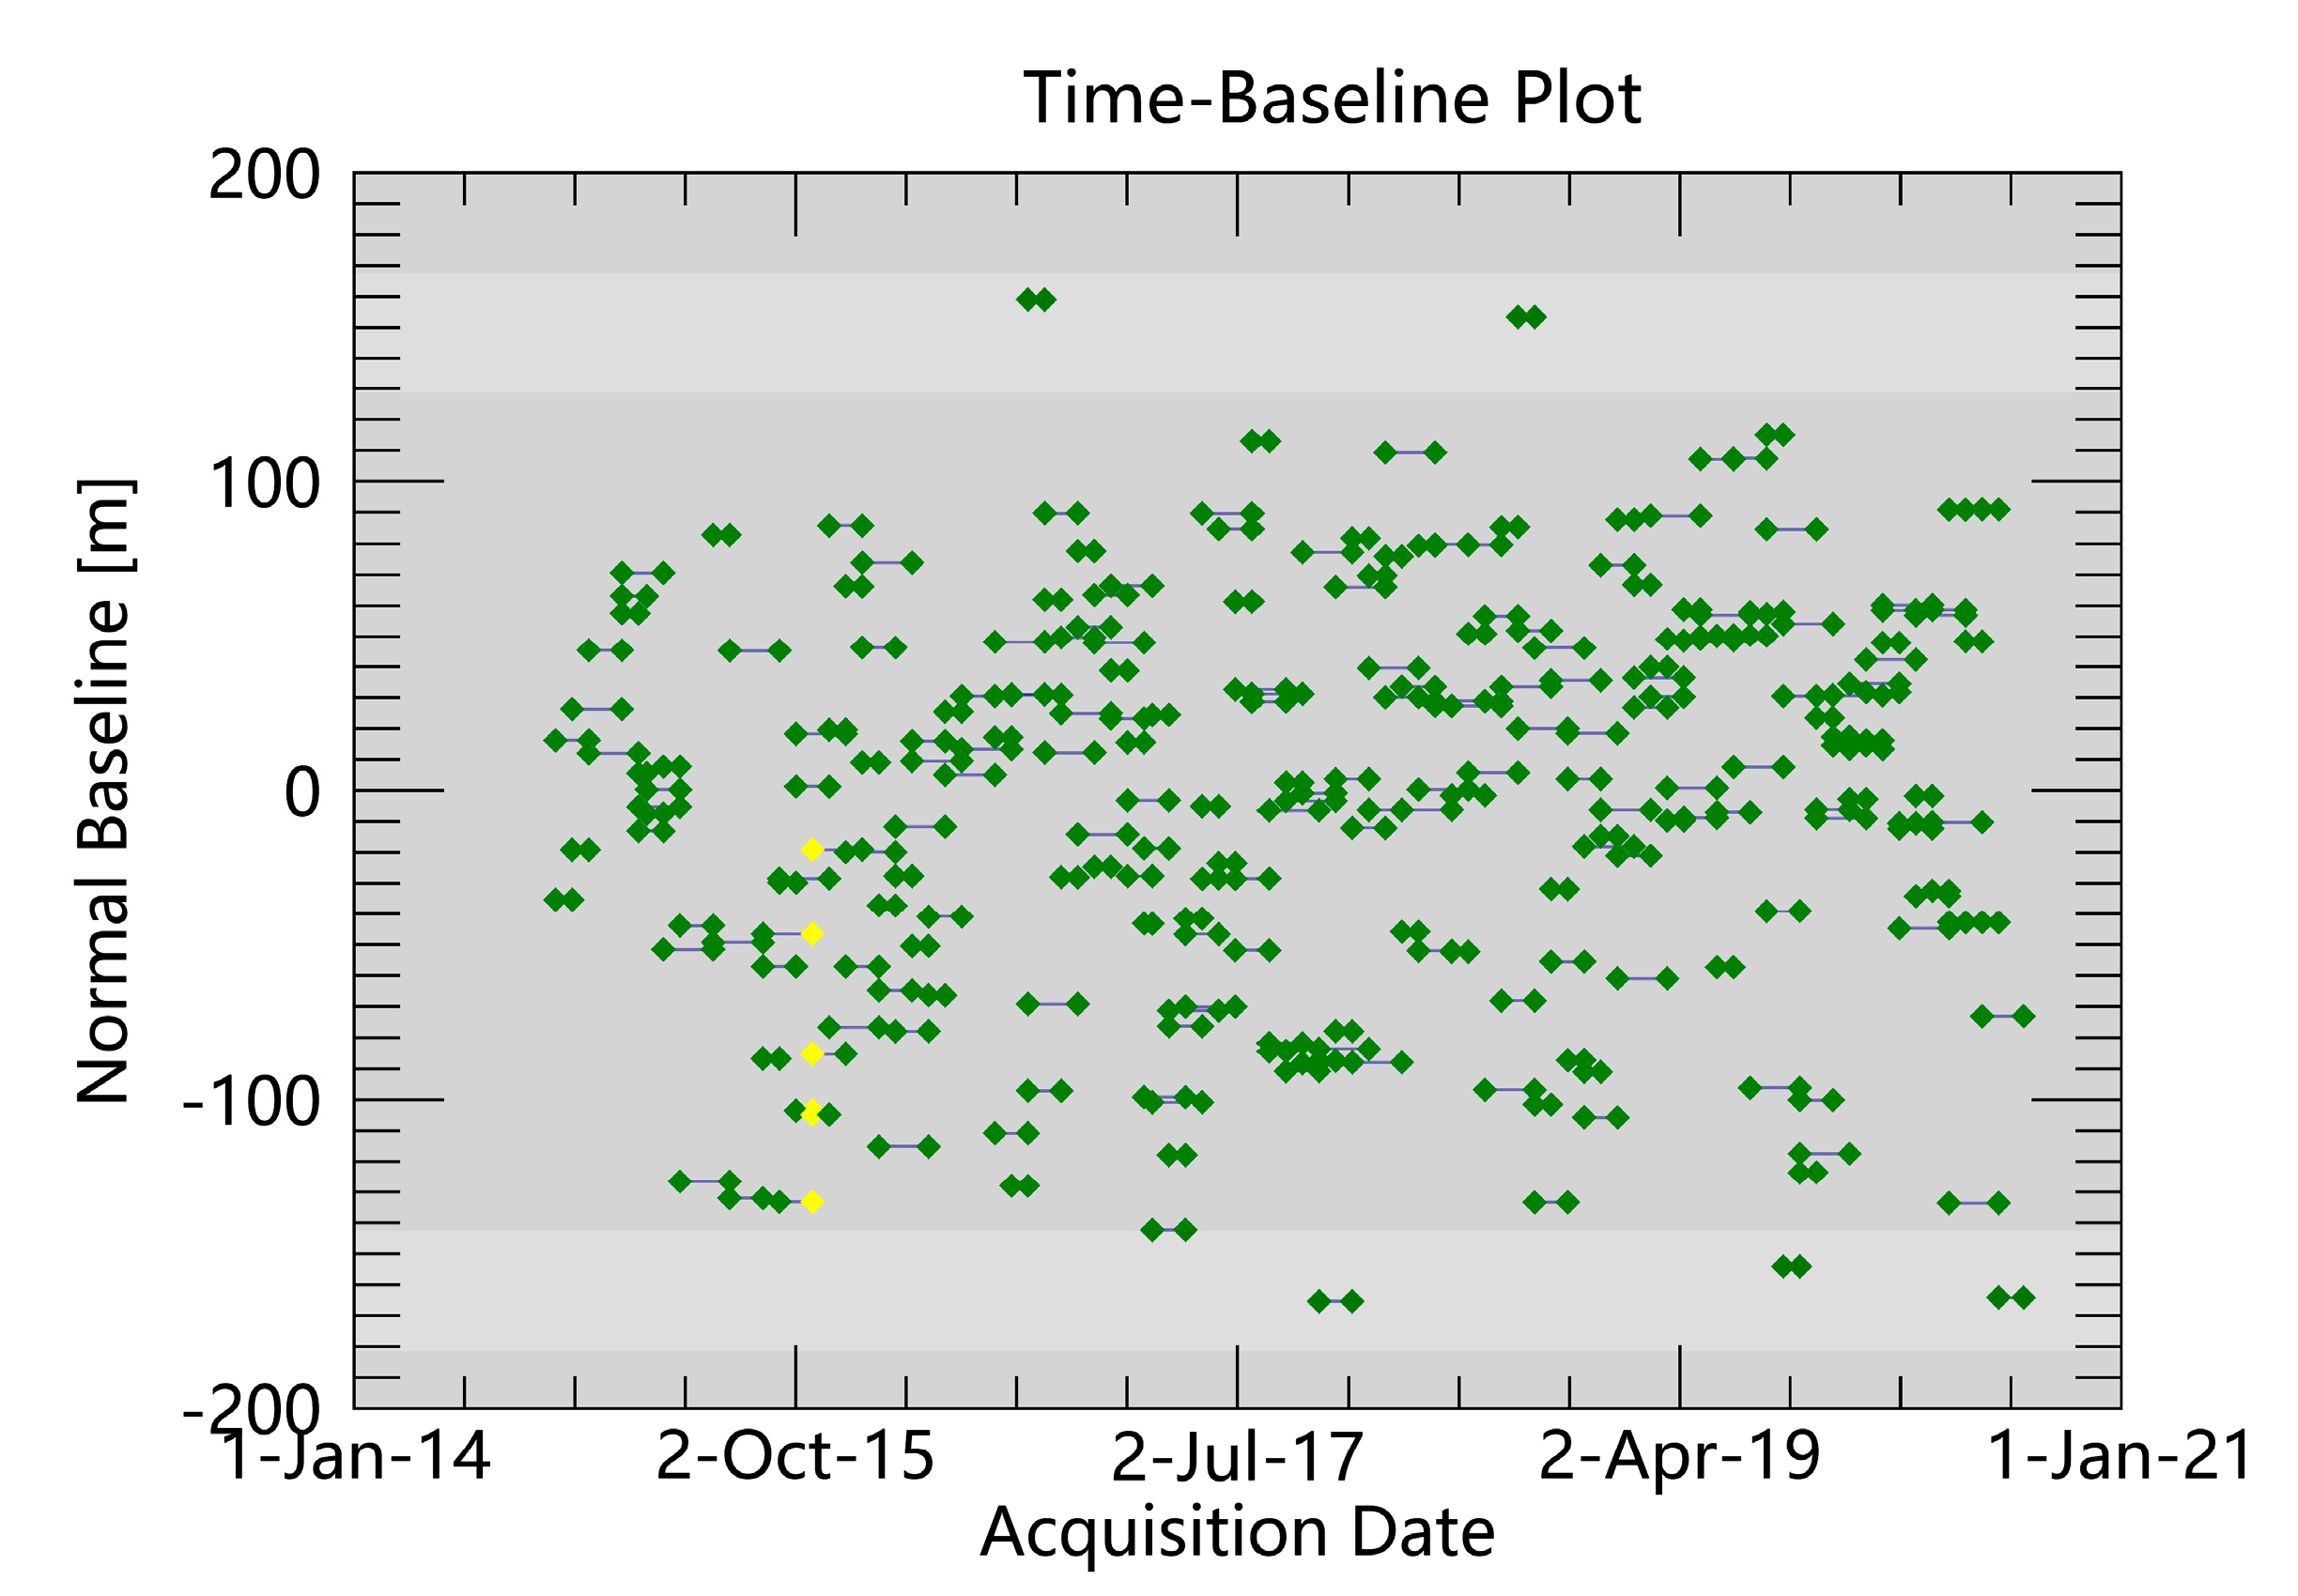
3.1. Data
3.2. Methodology
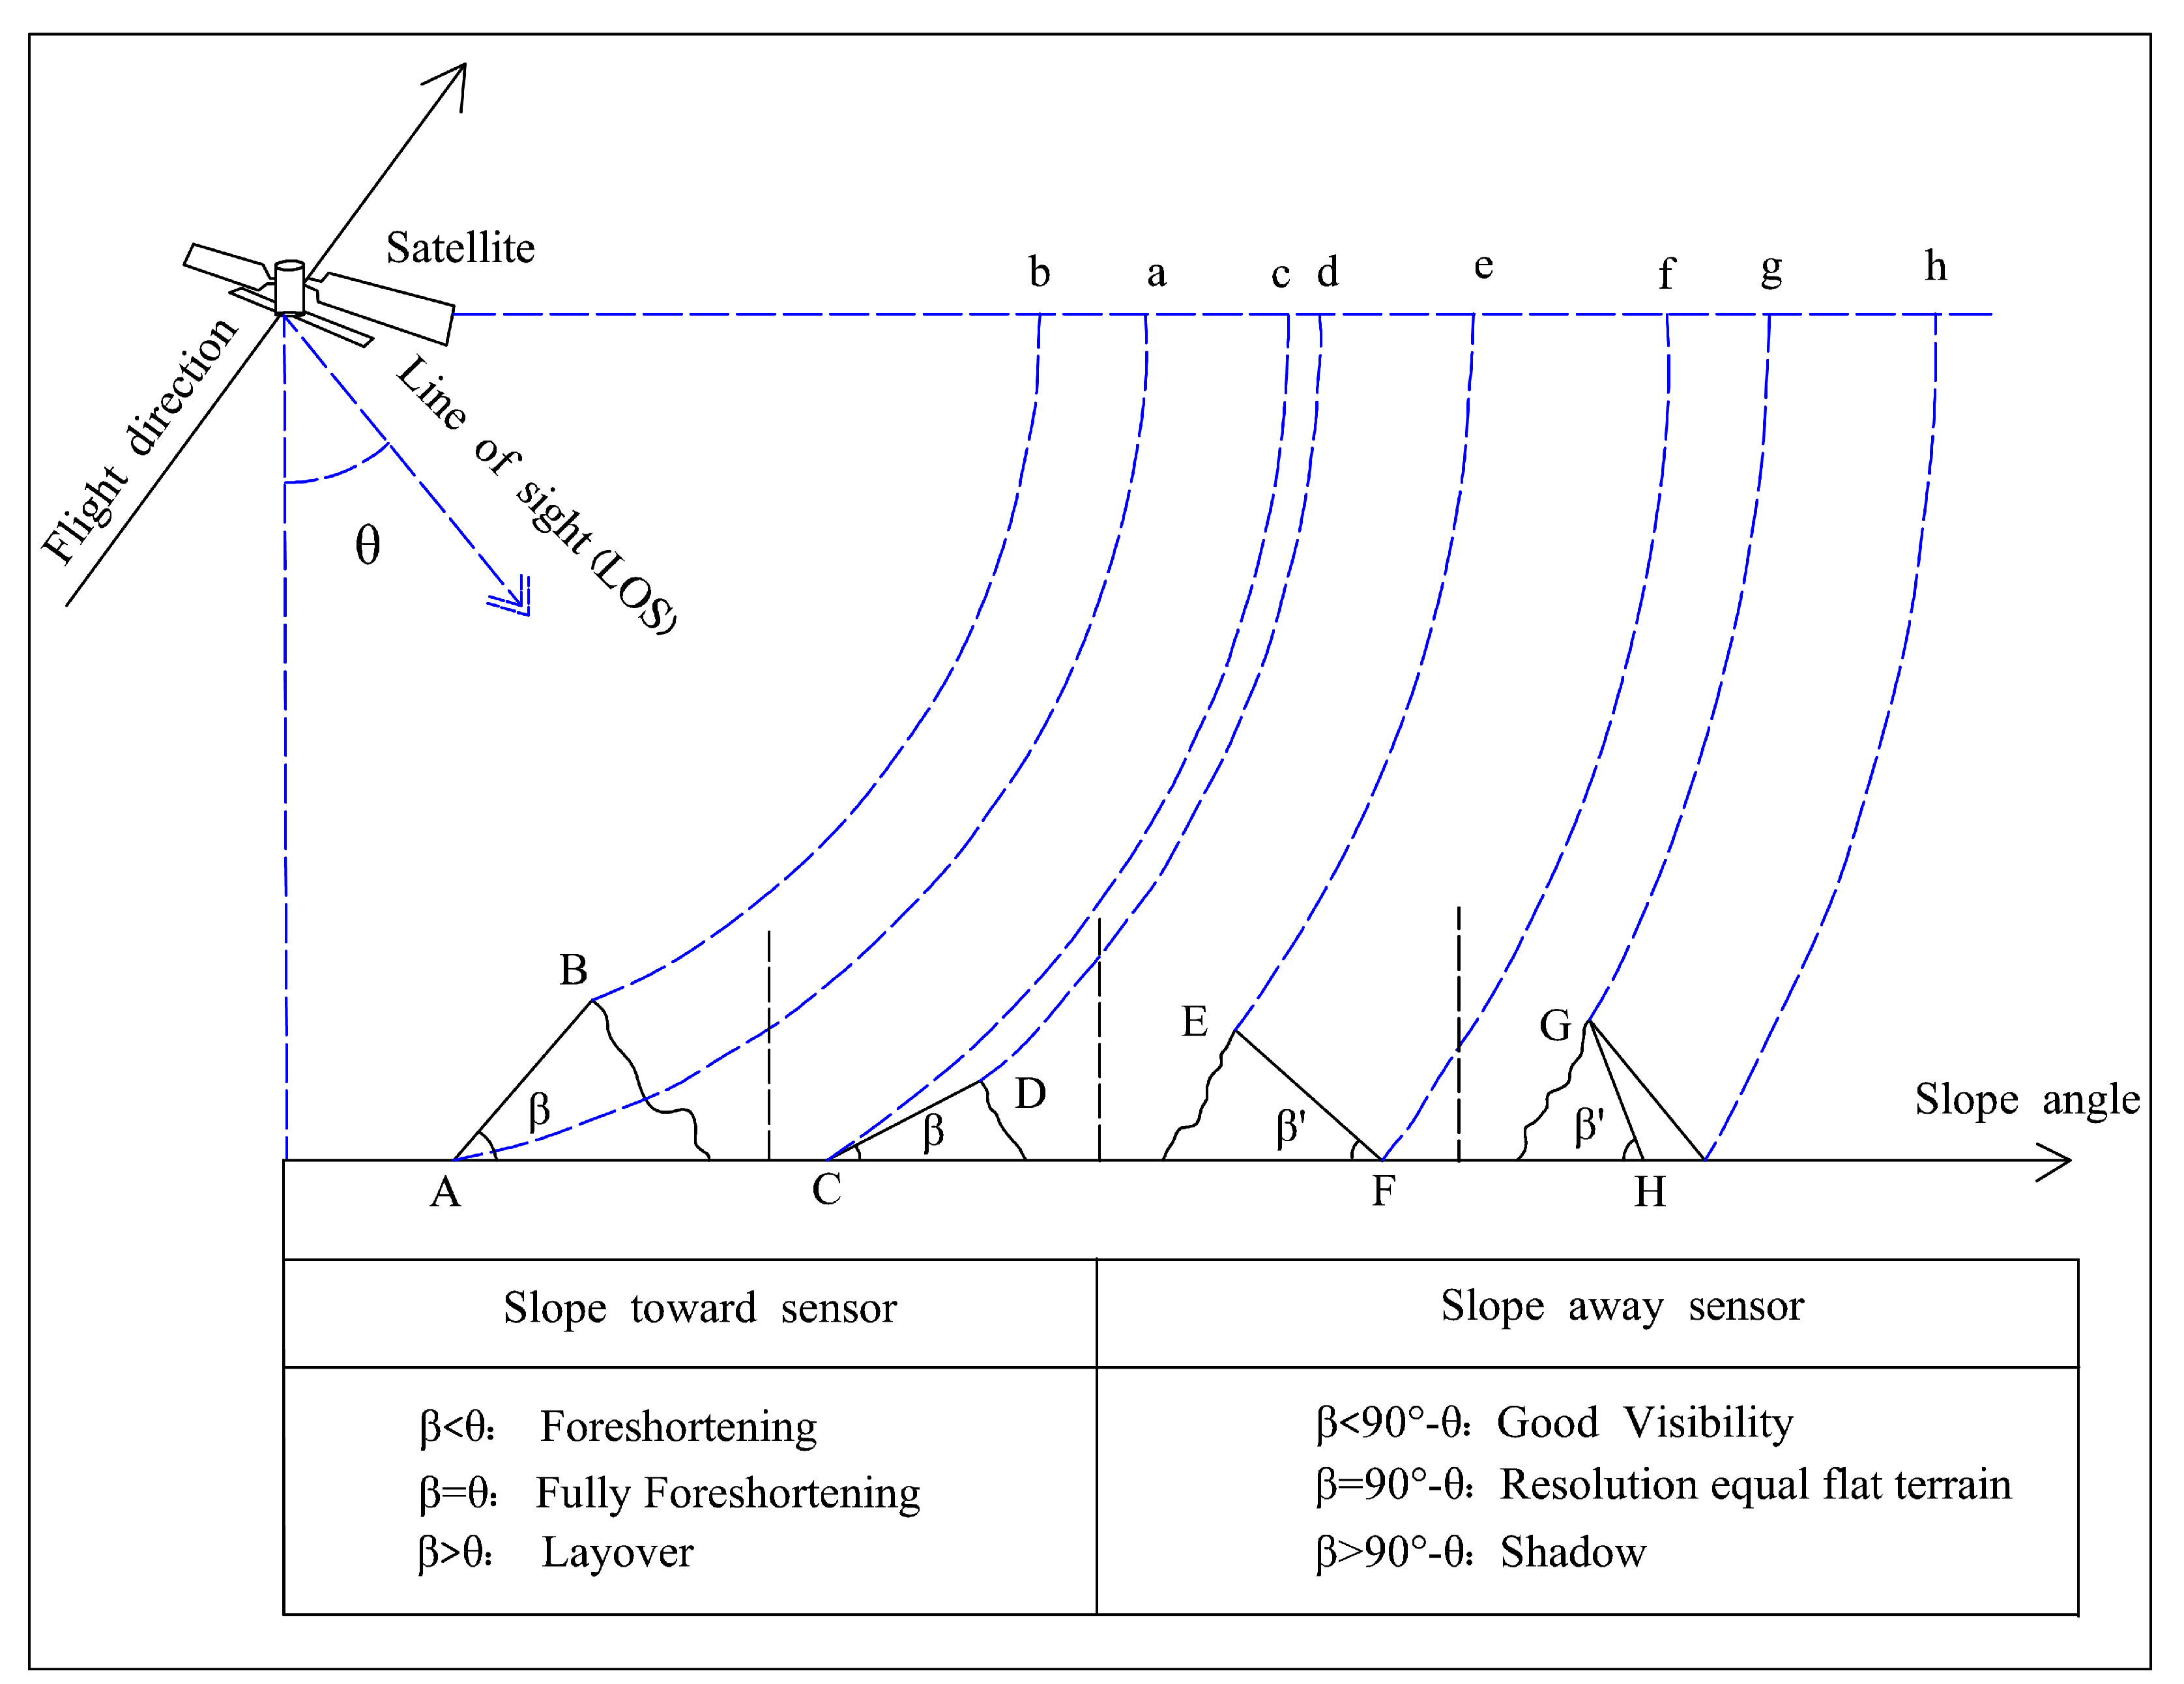
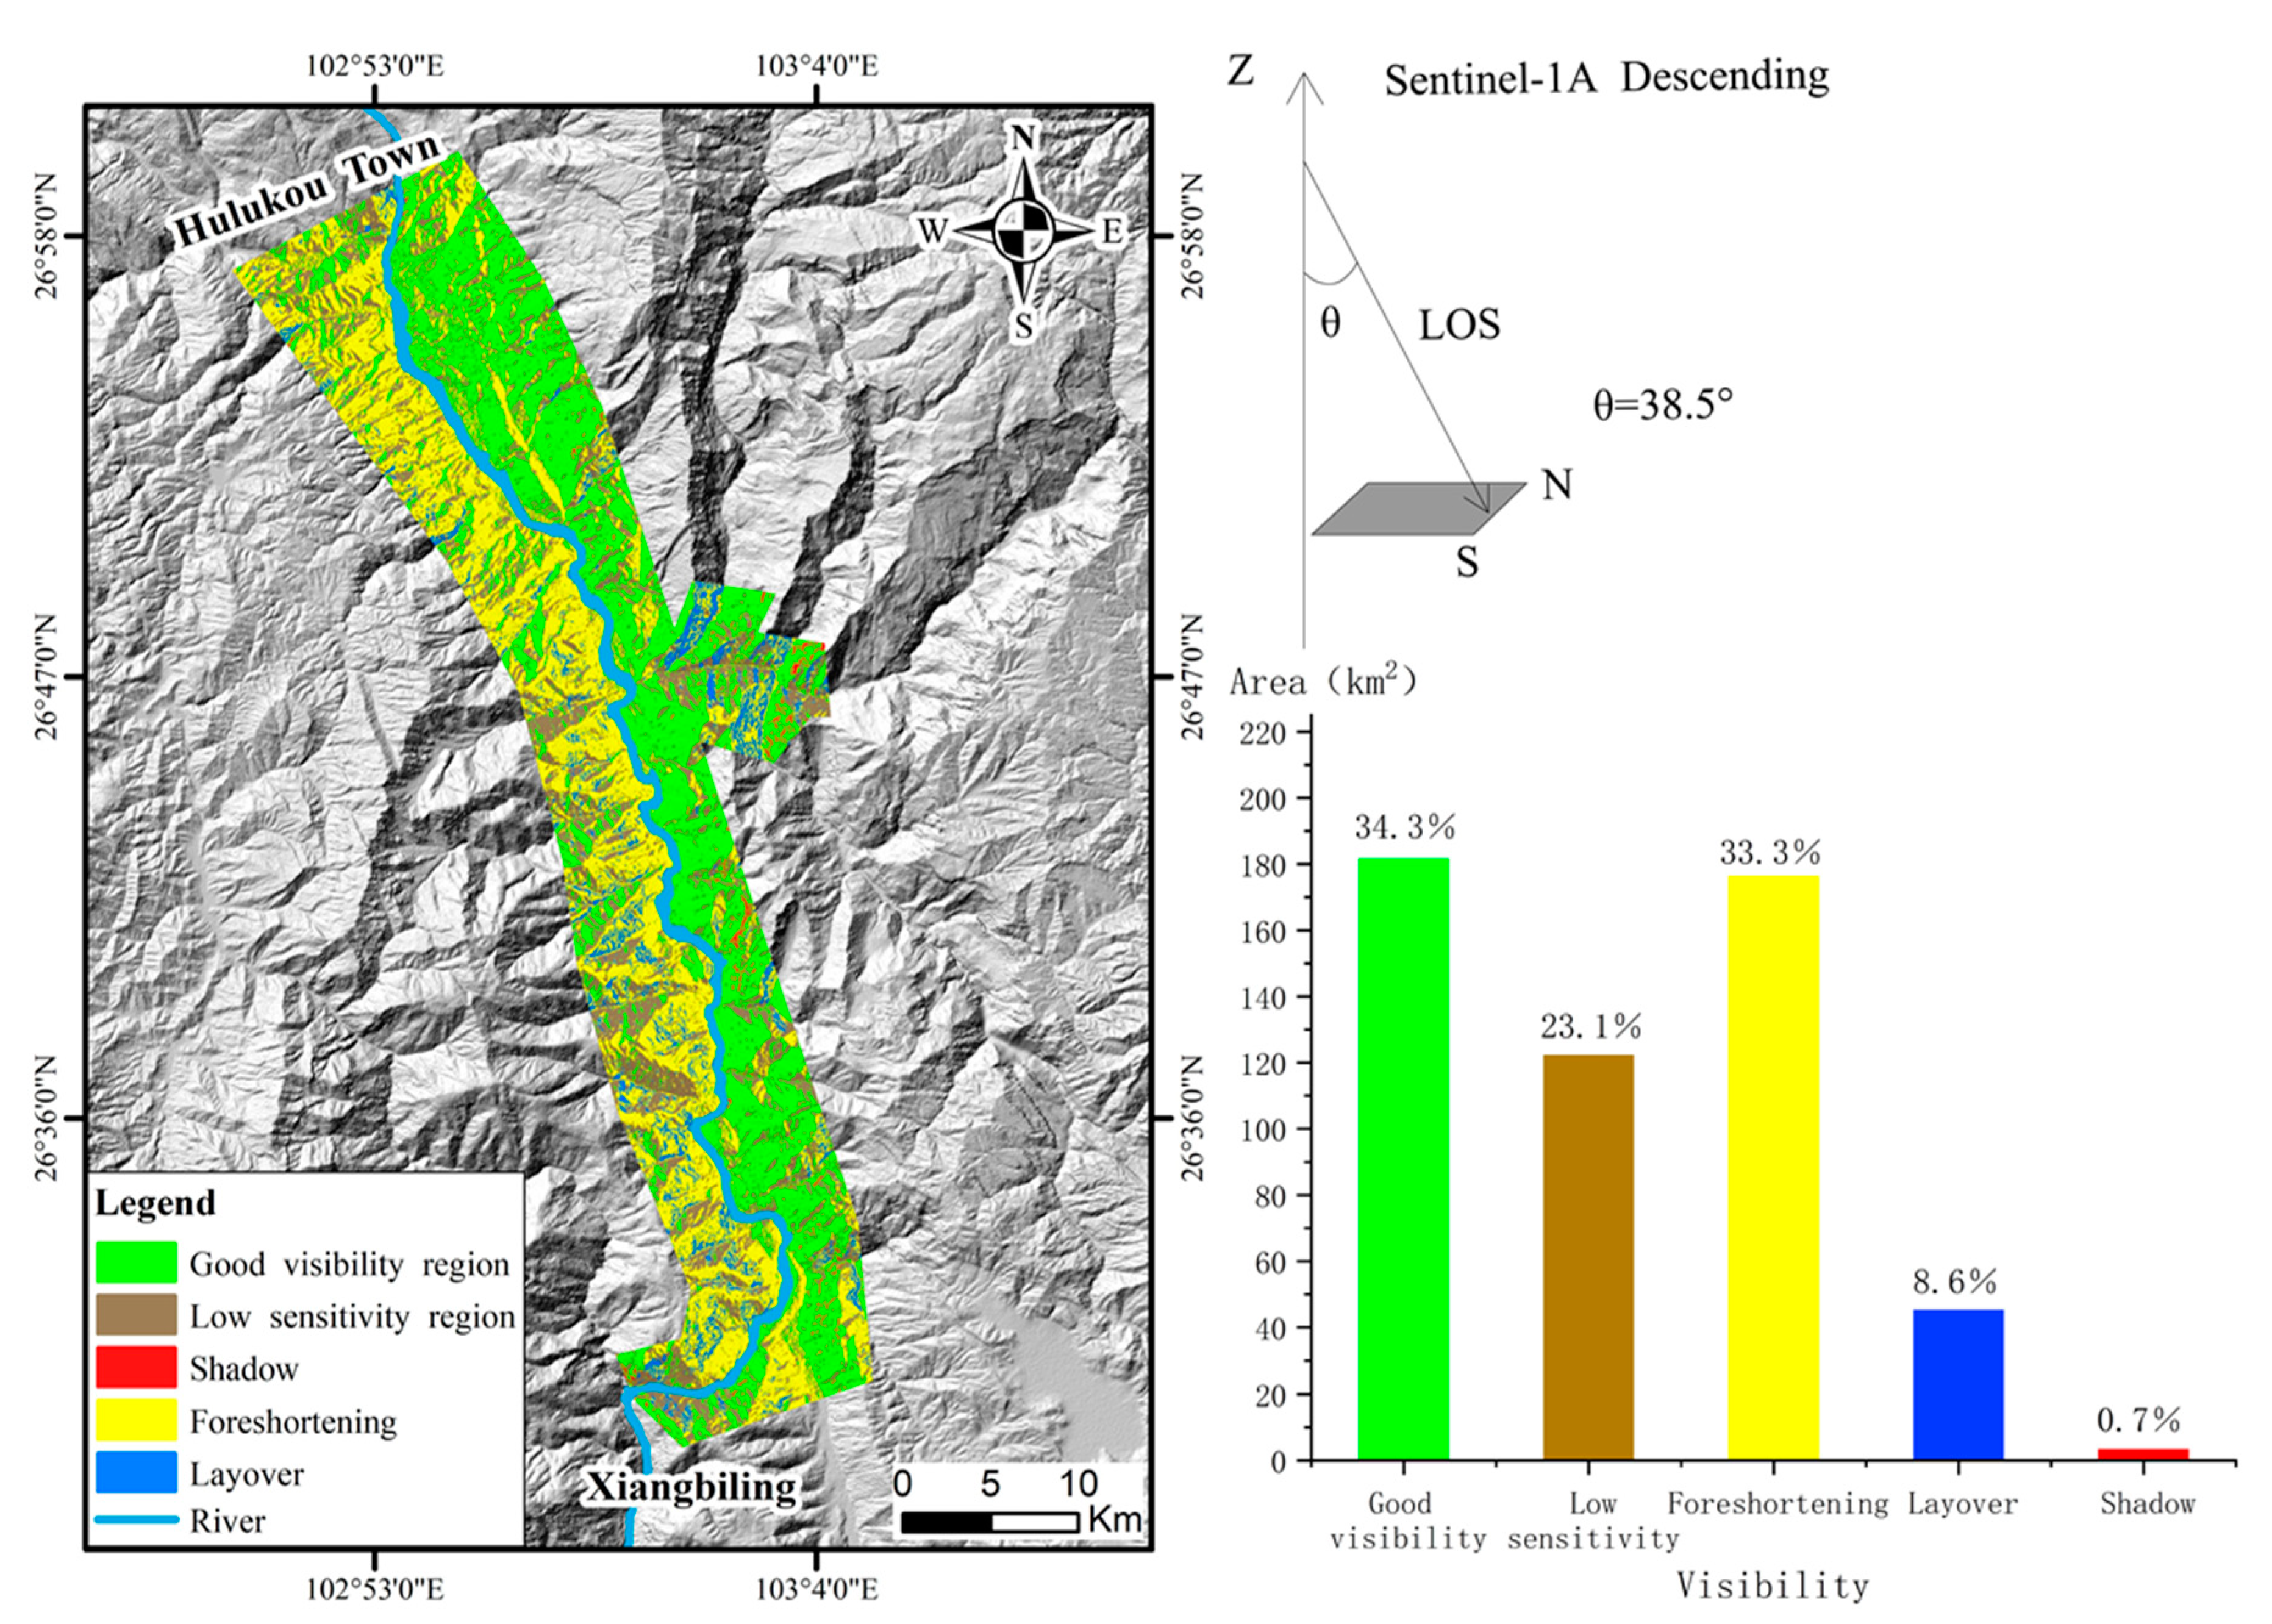
3.2.1. Topographic Visibility
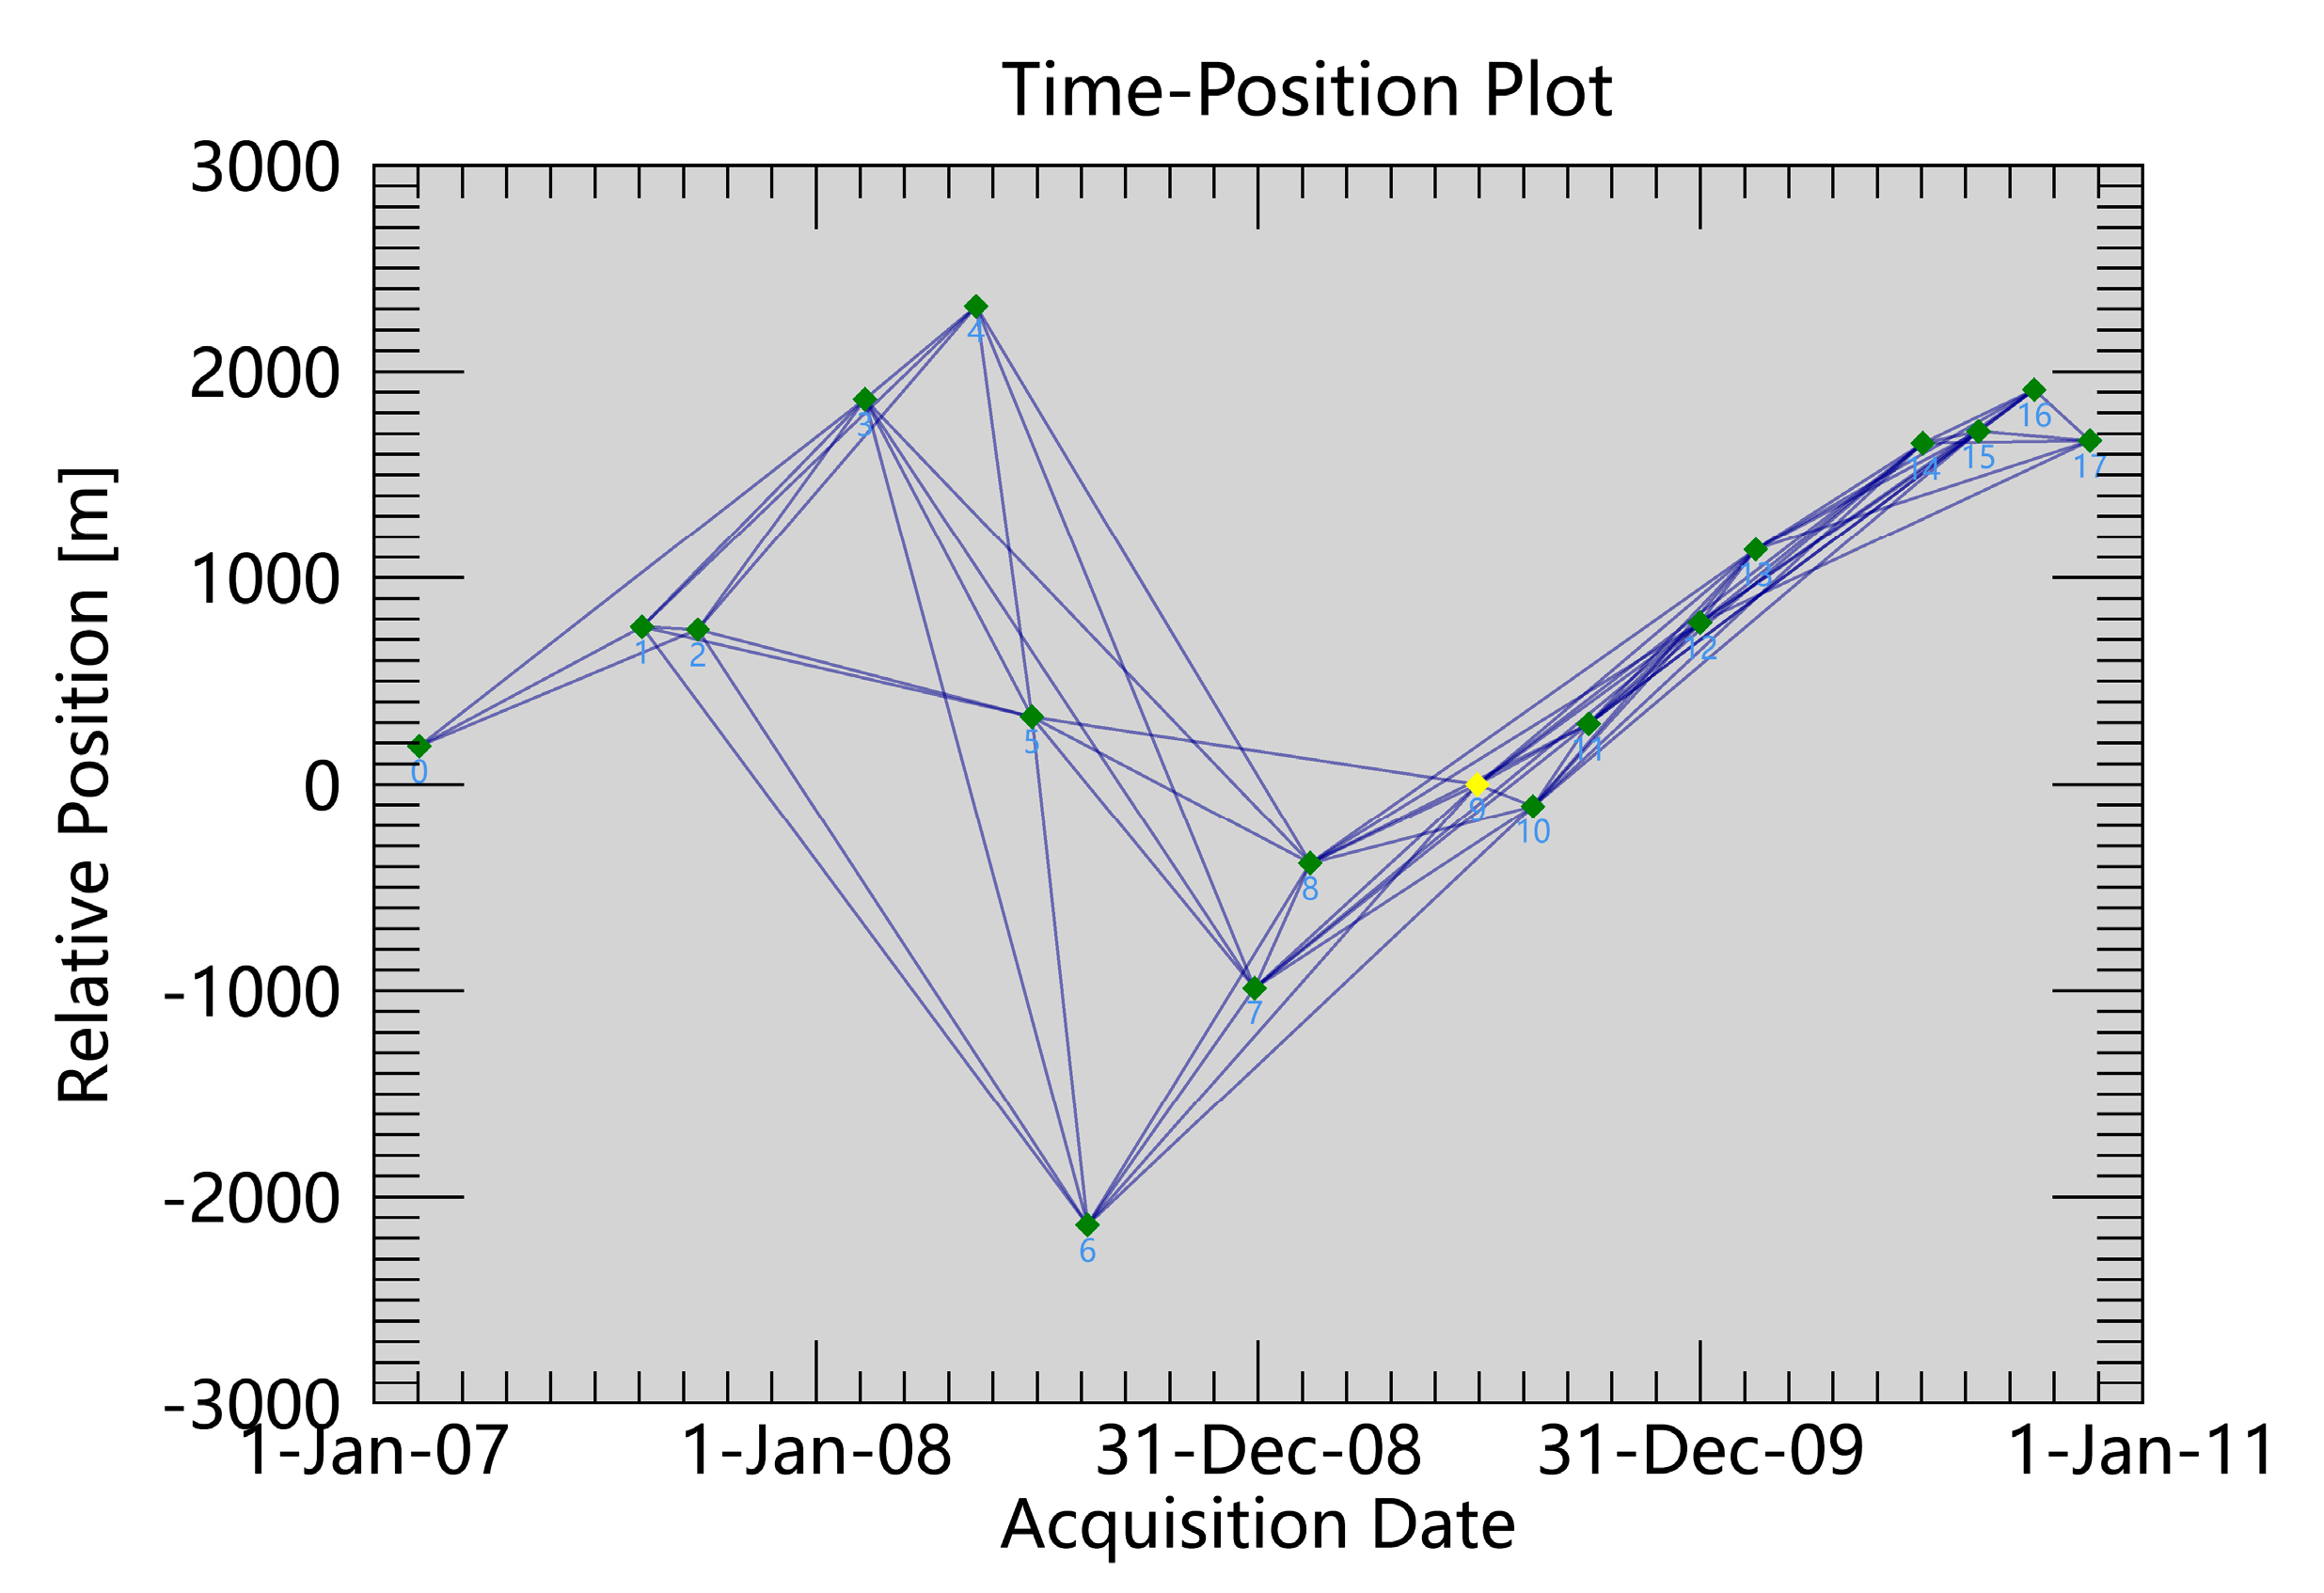
3.2.2. InSAR Processing
4. Results and Analysis
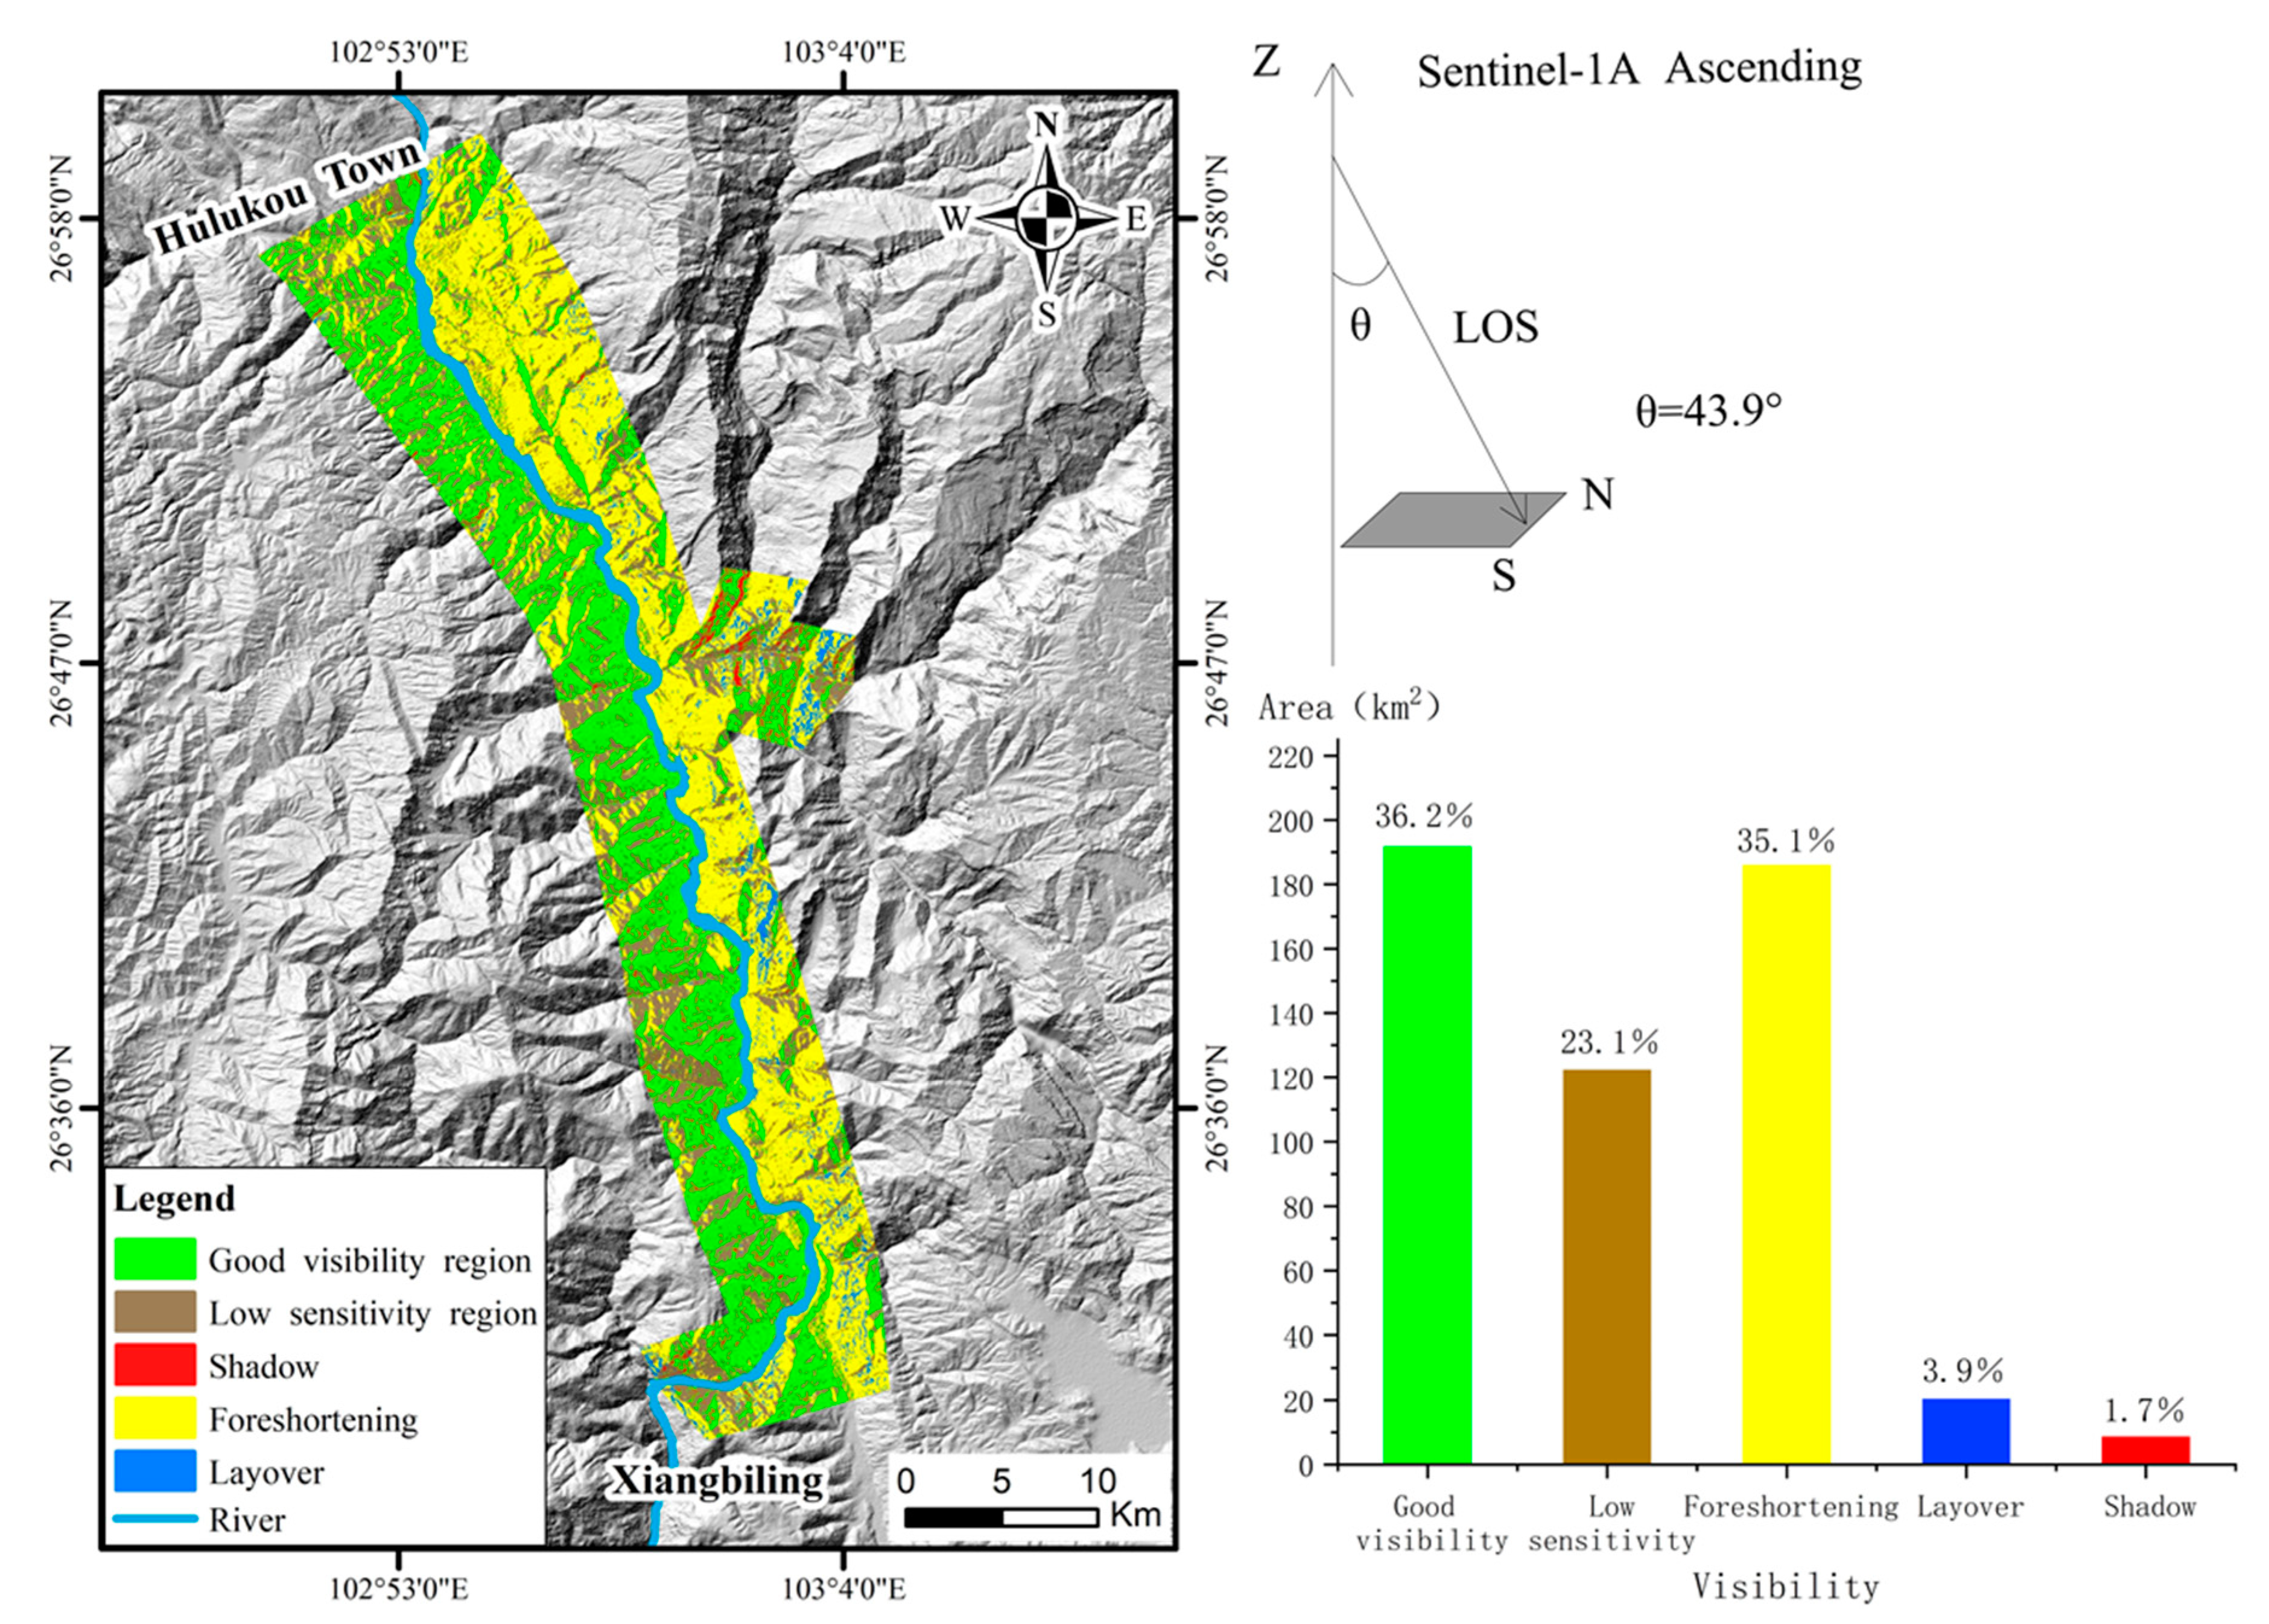
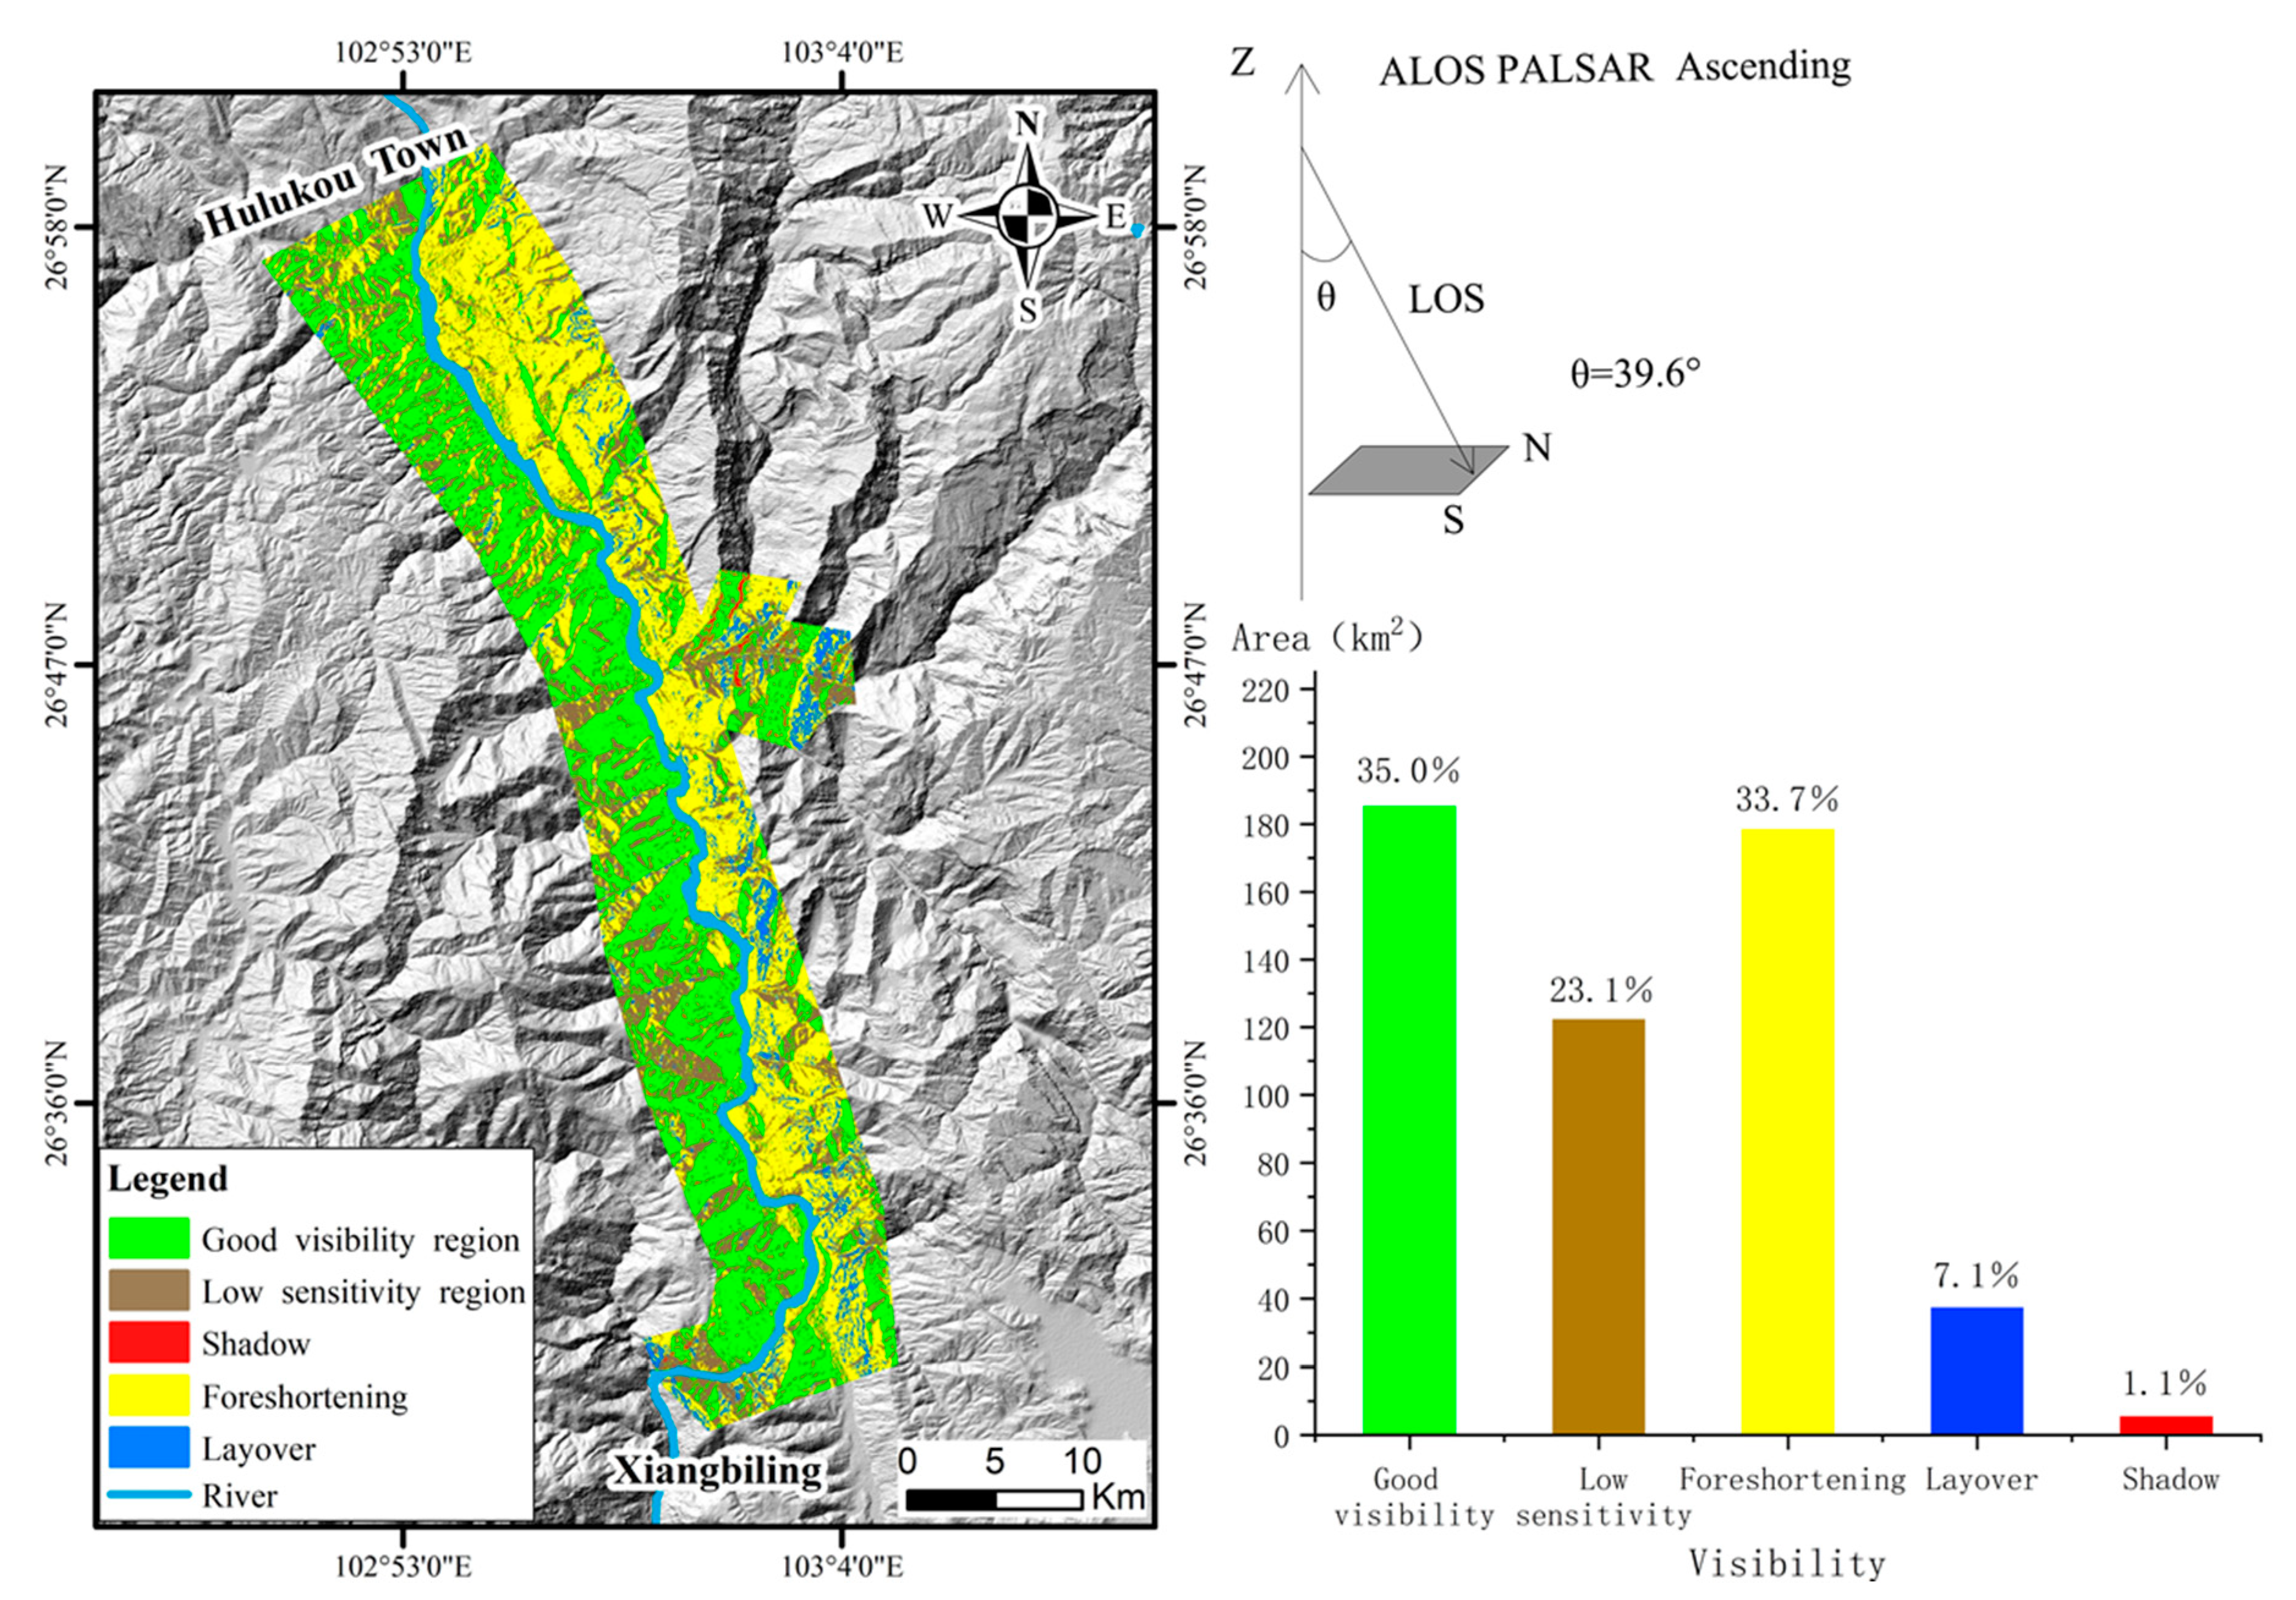
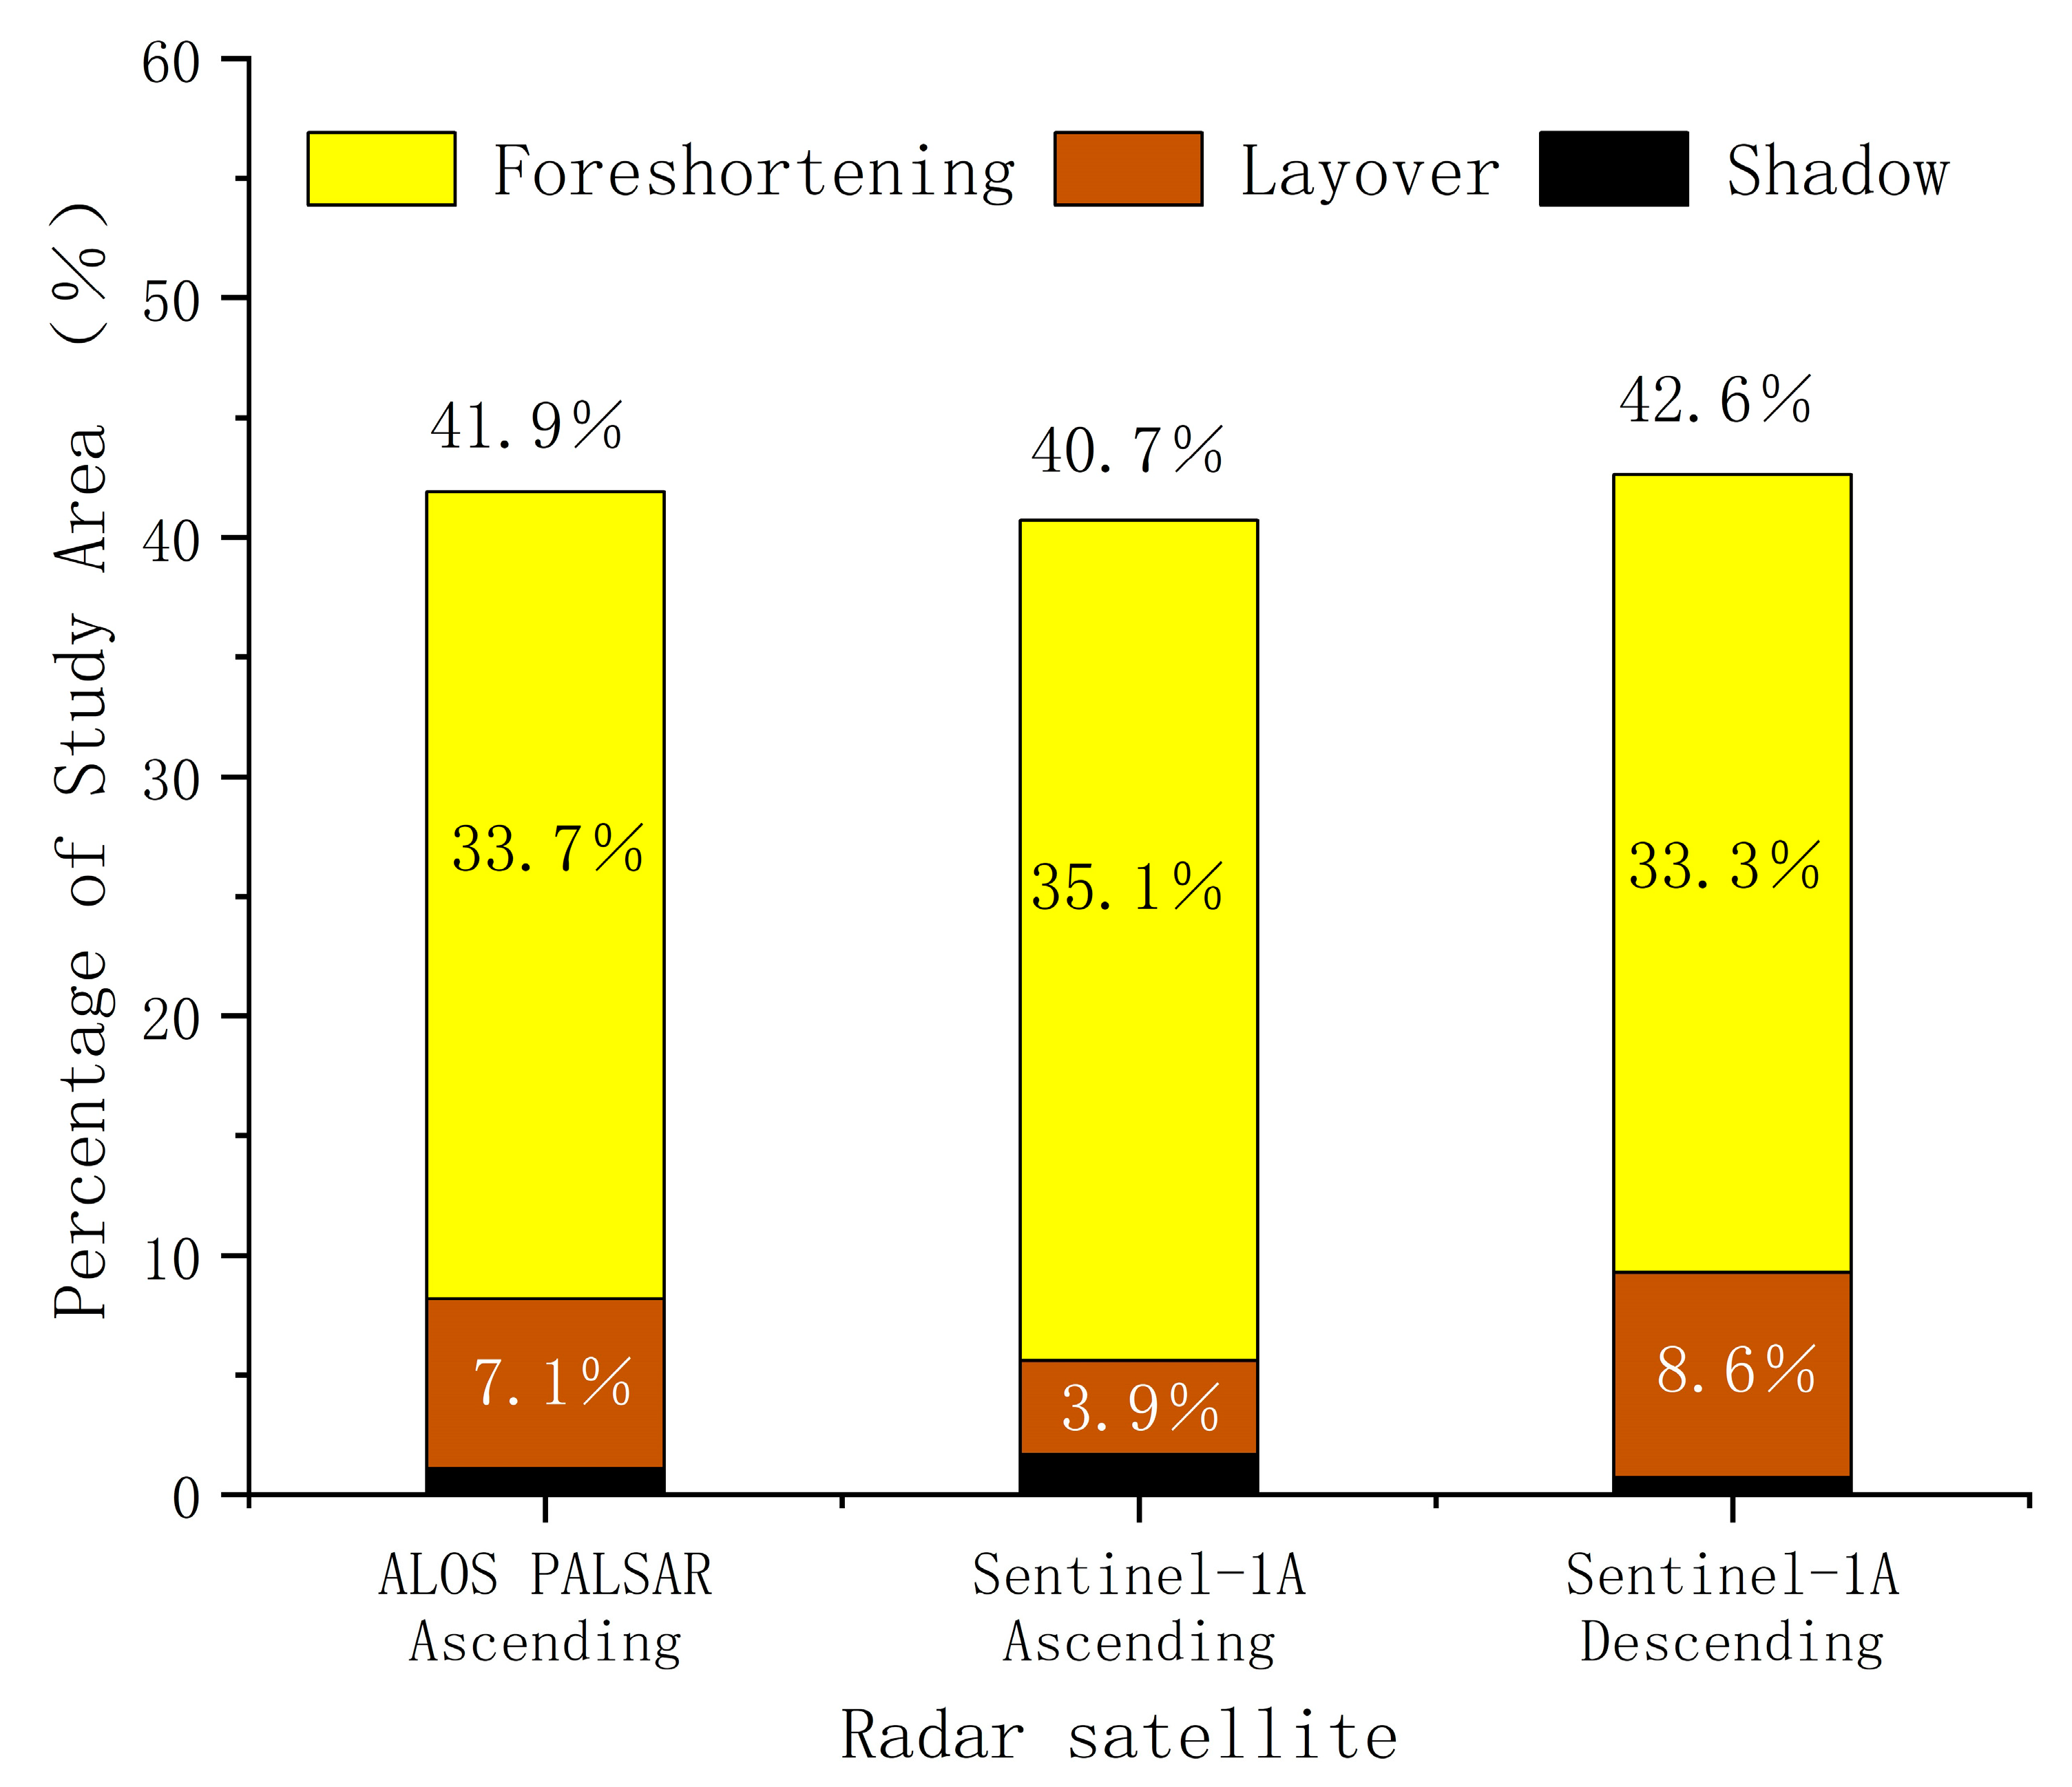
4.1. Topographic Visibility Results
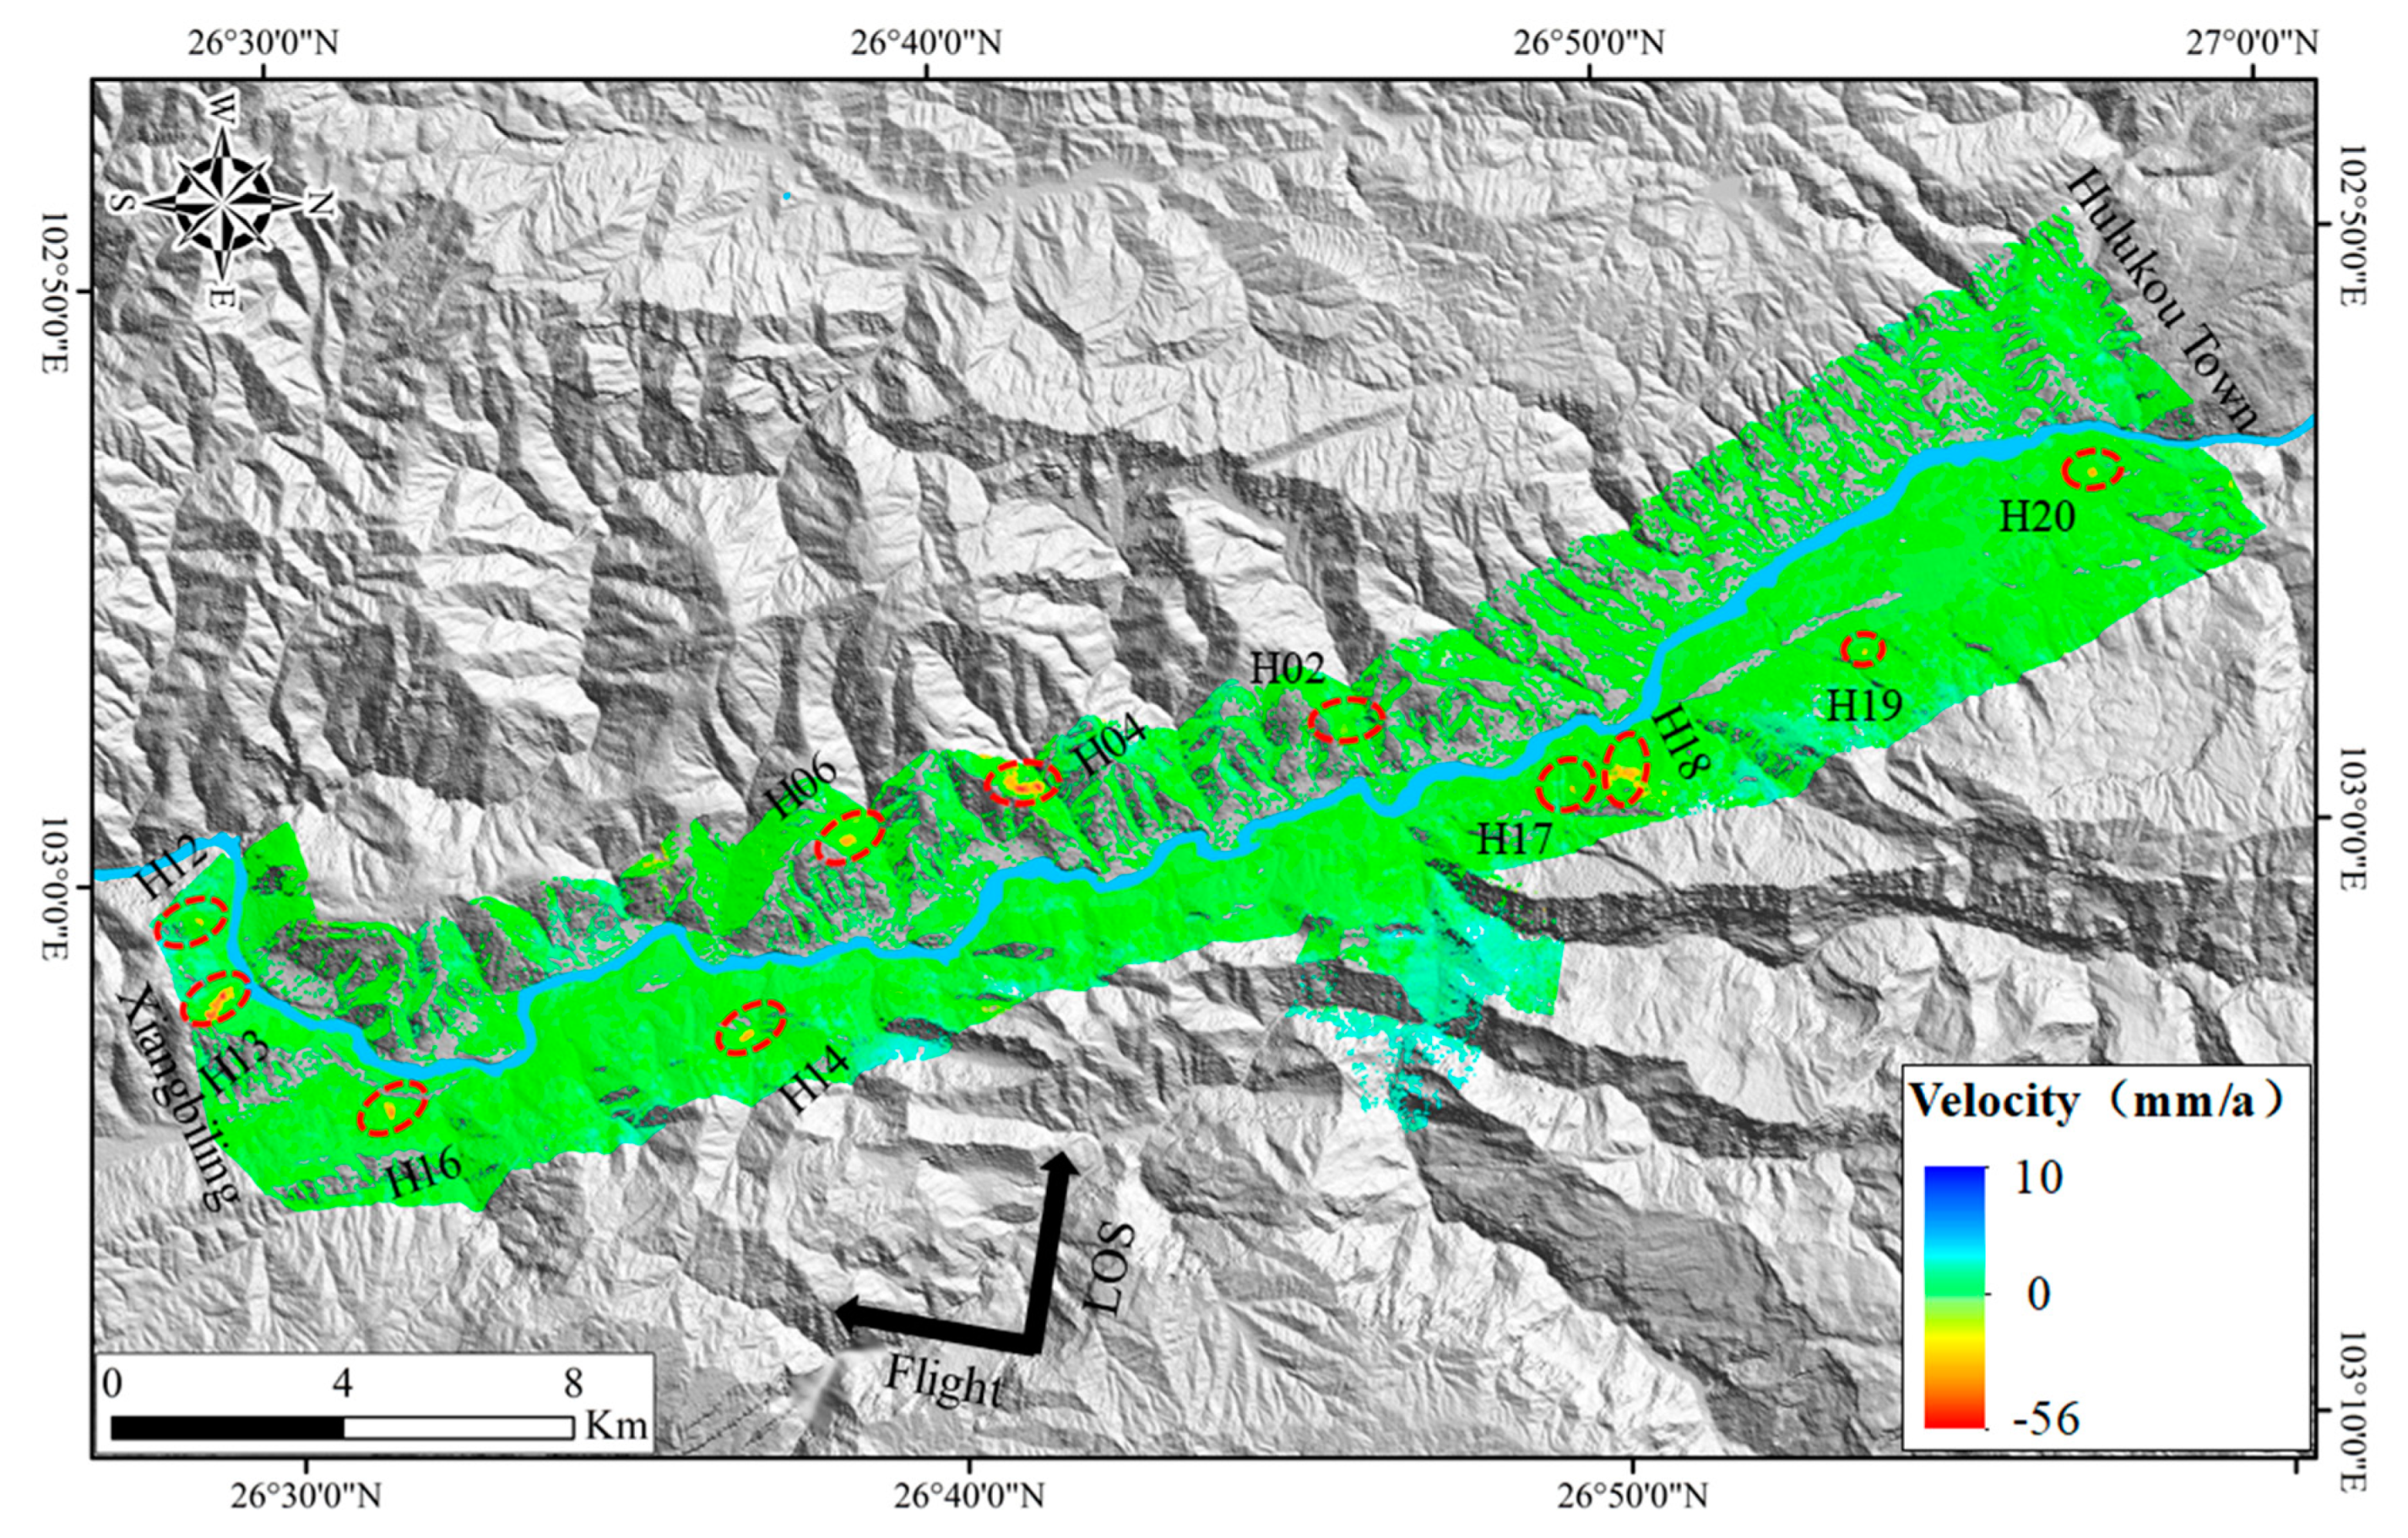
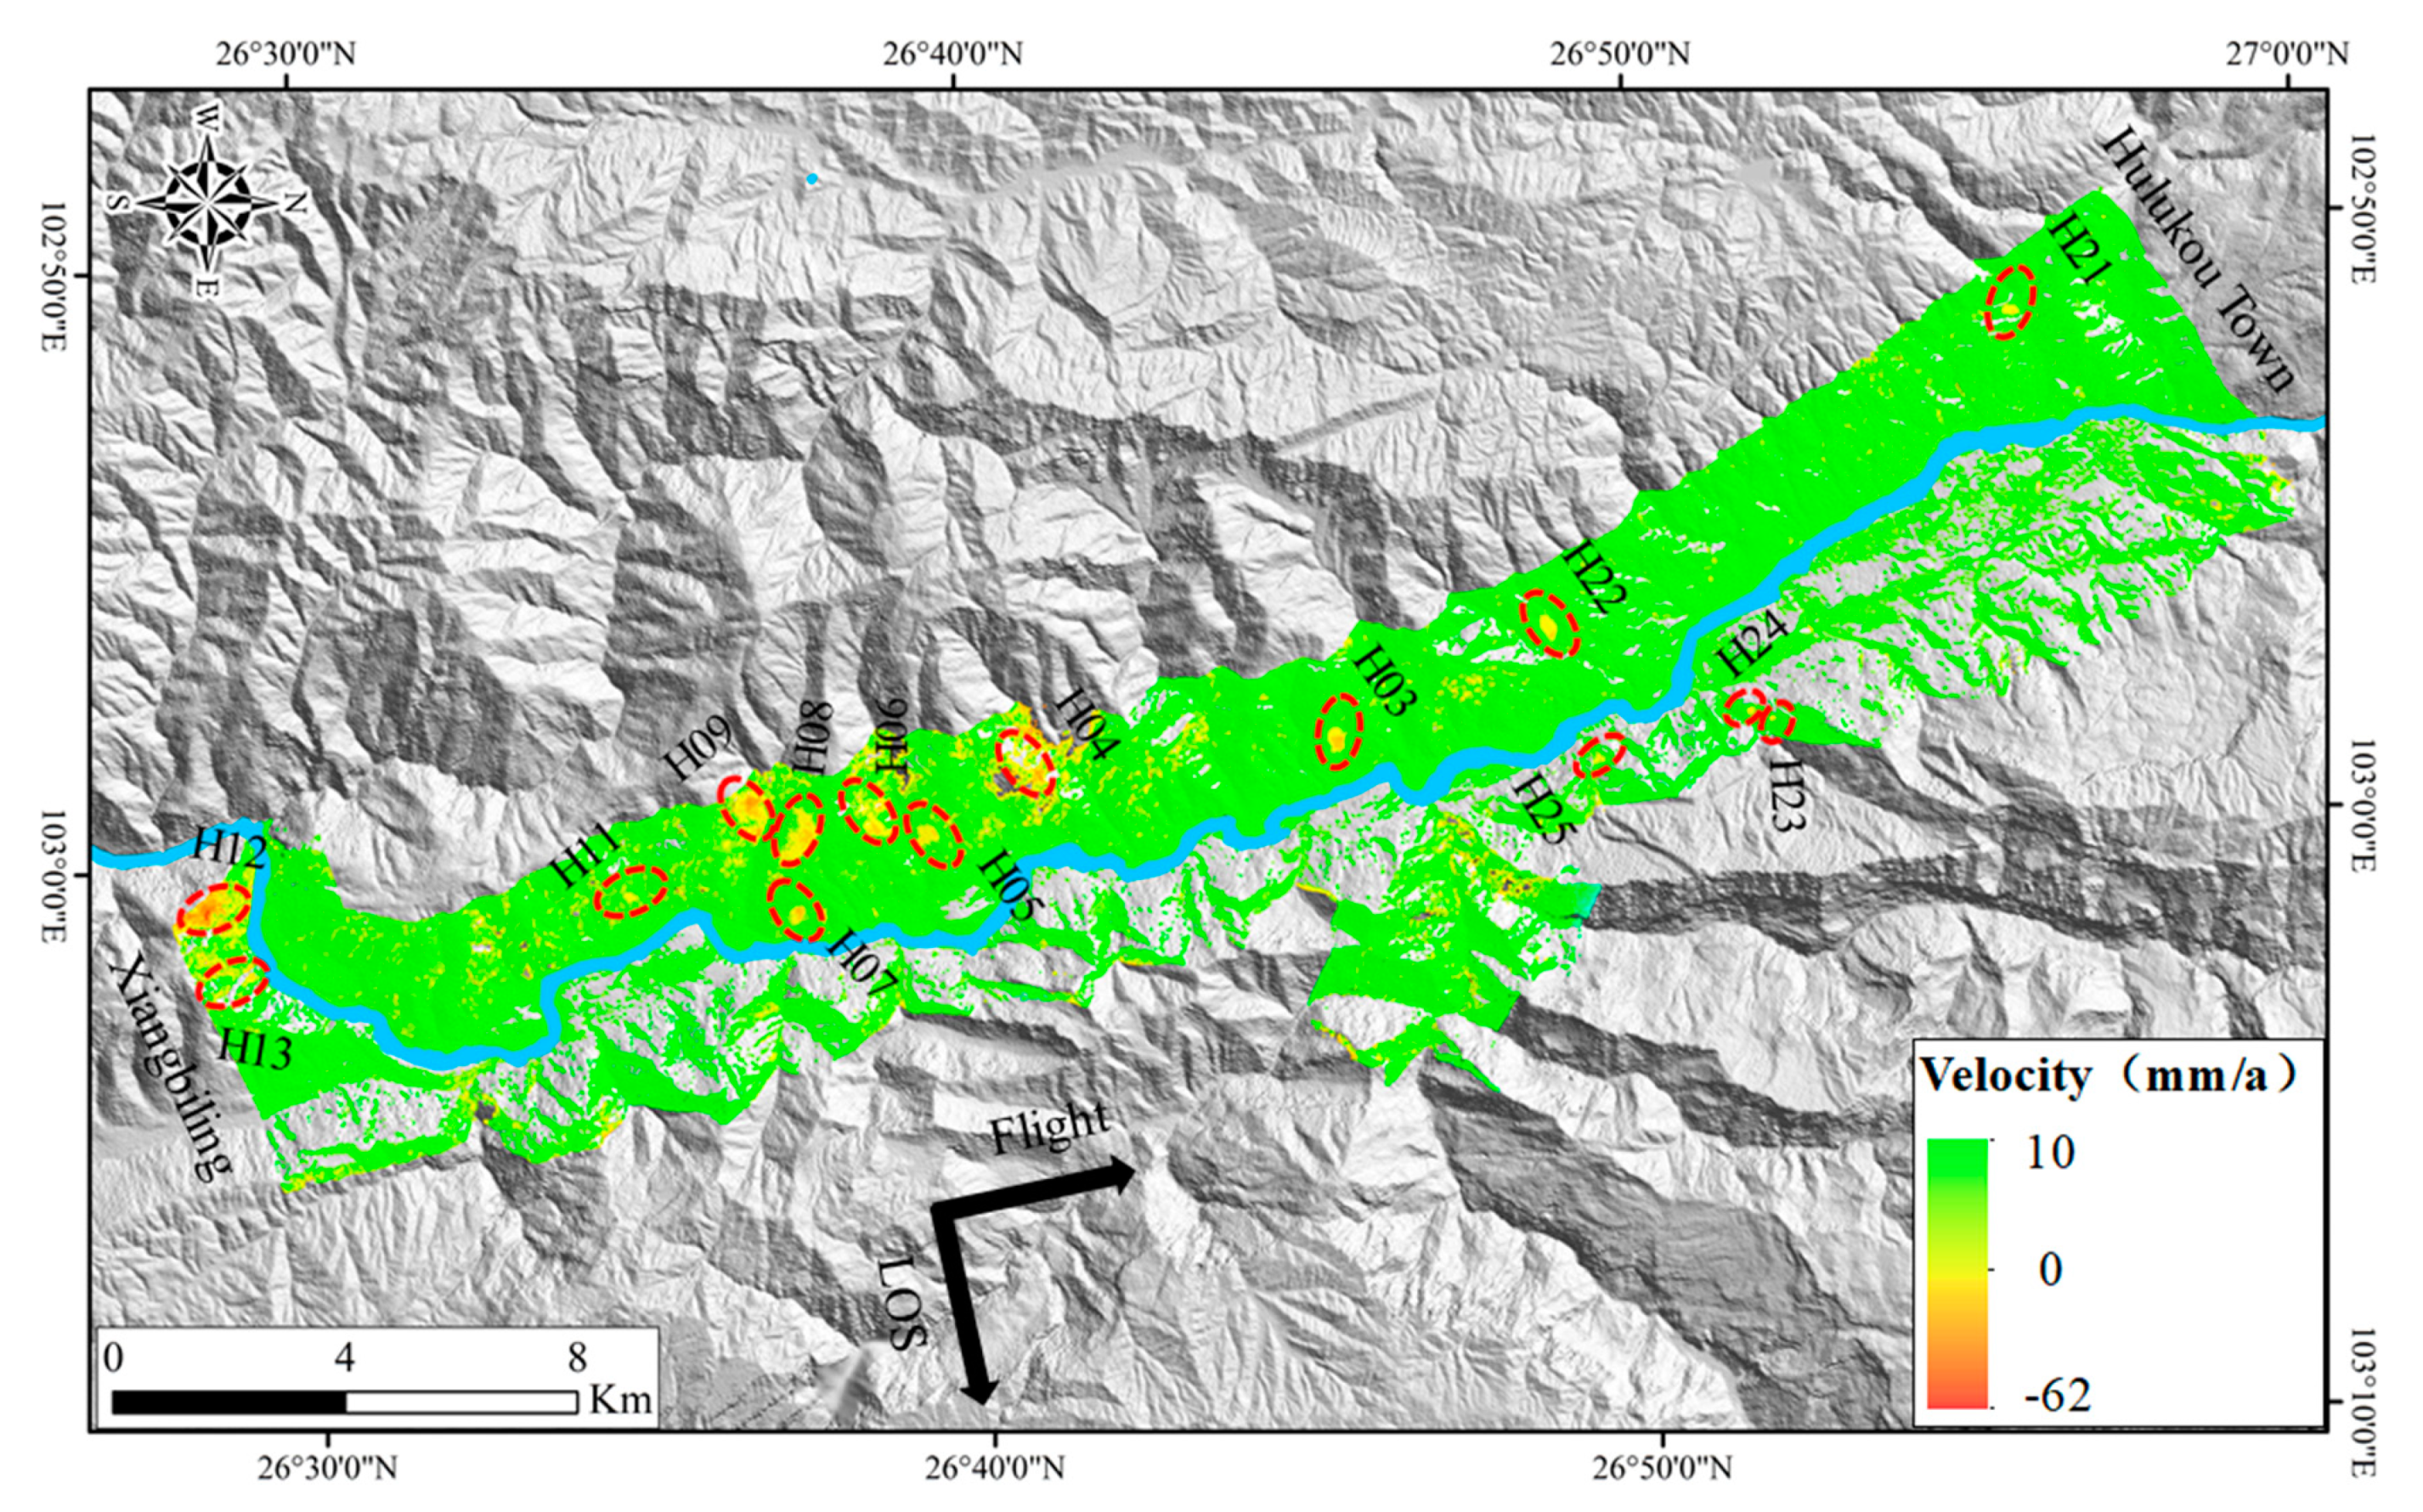
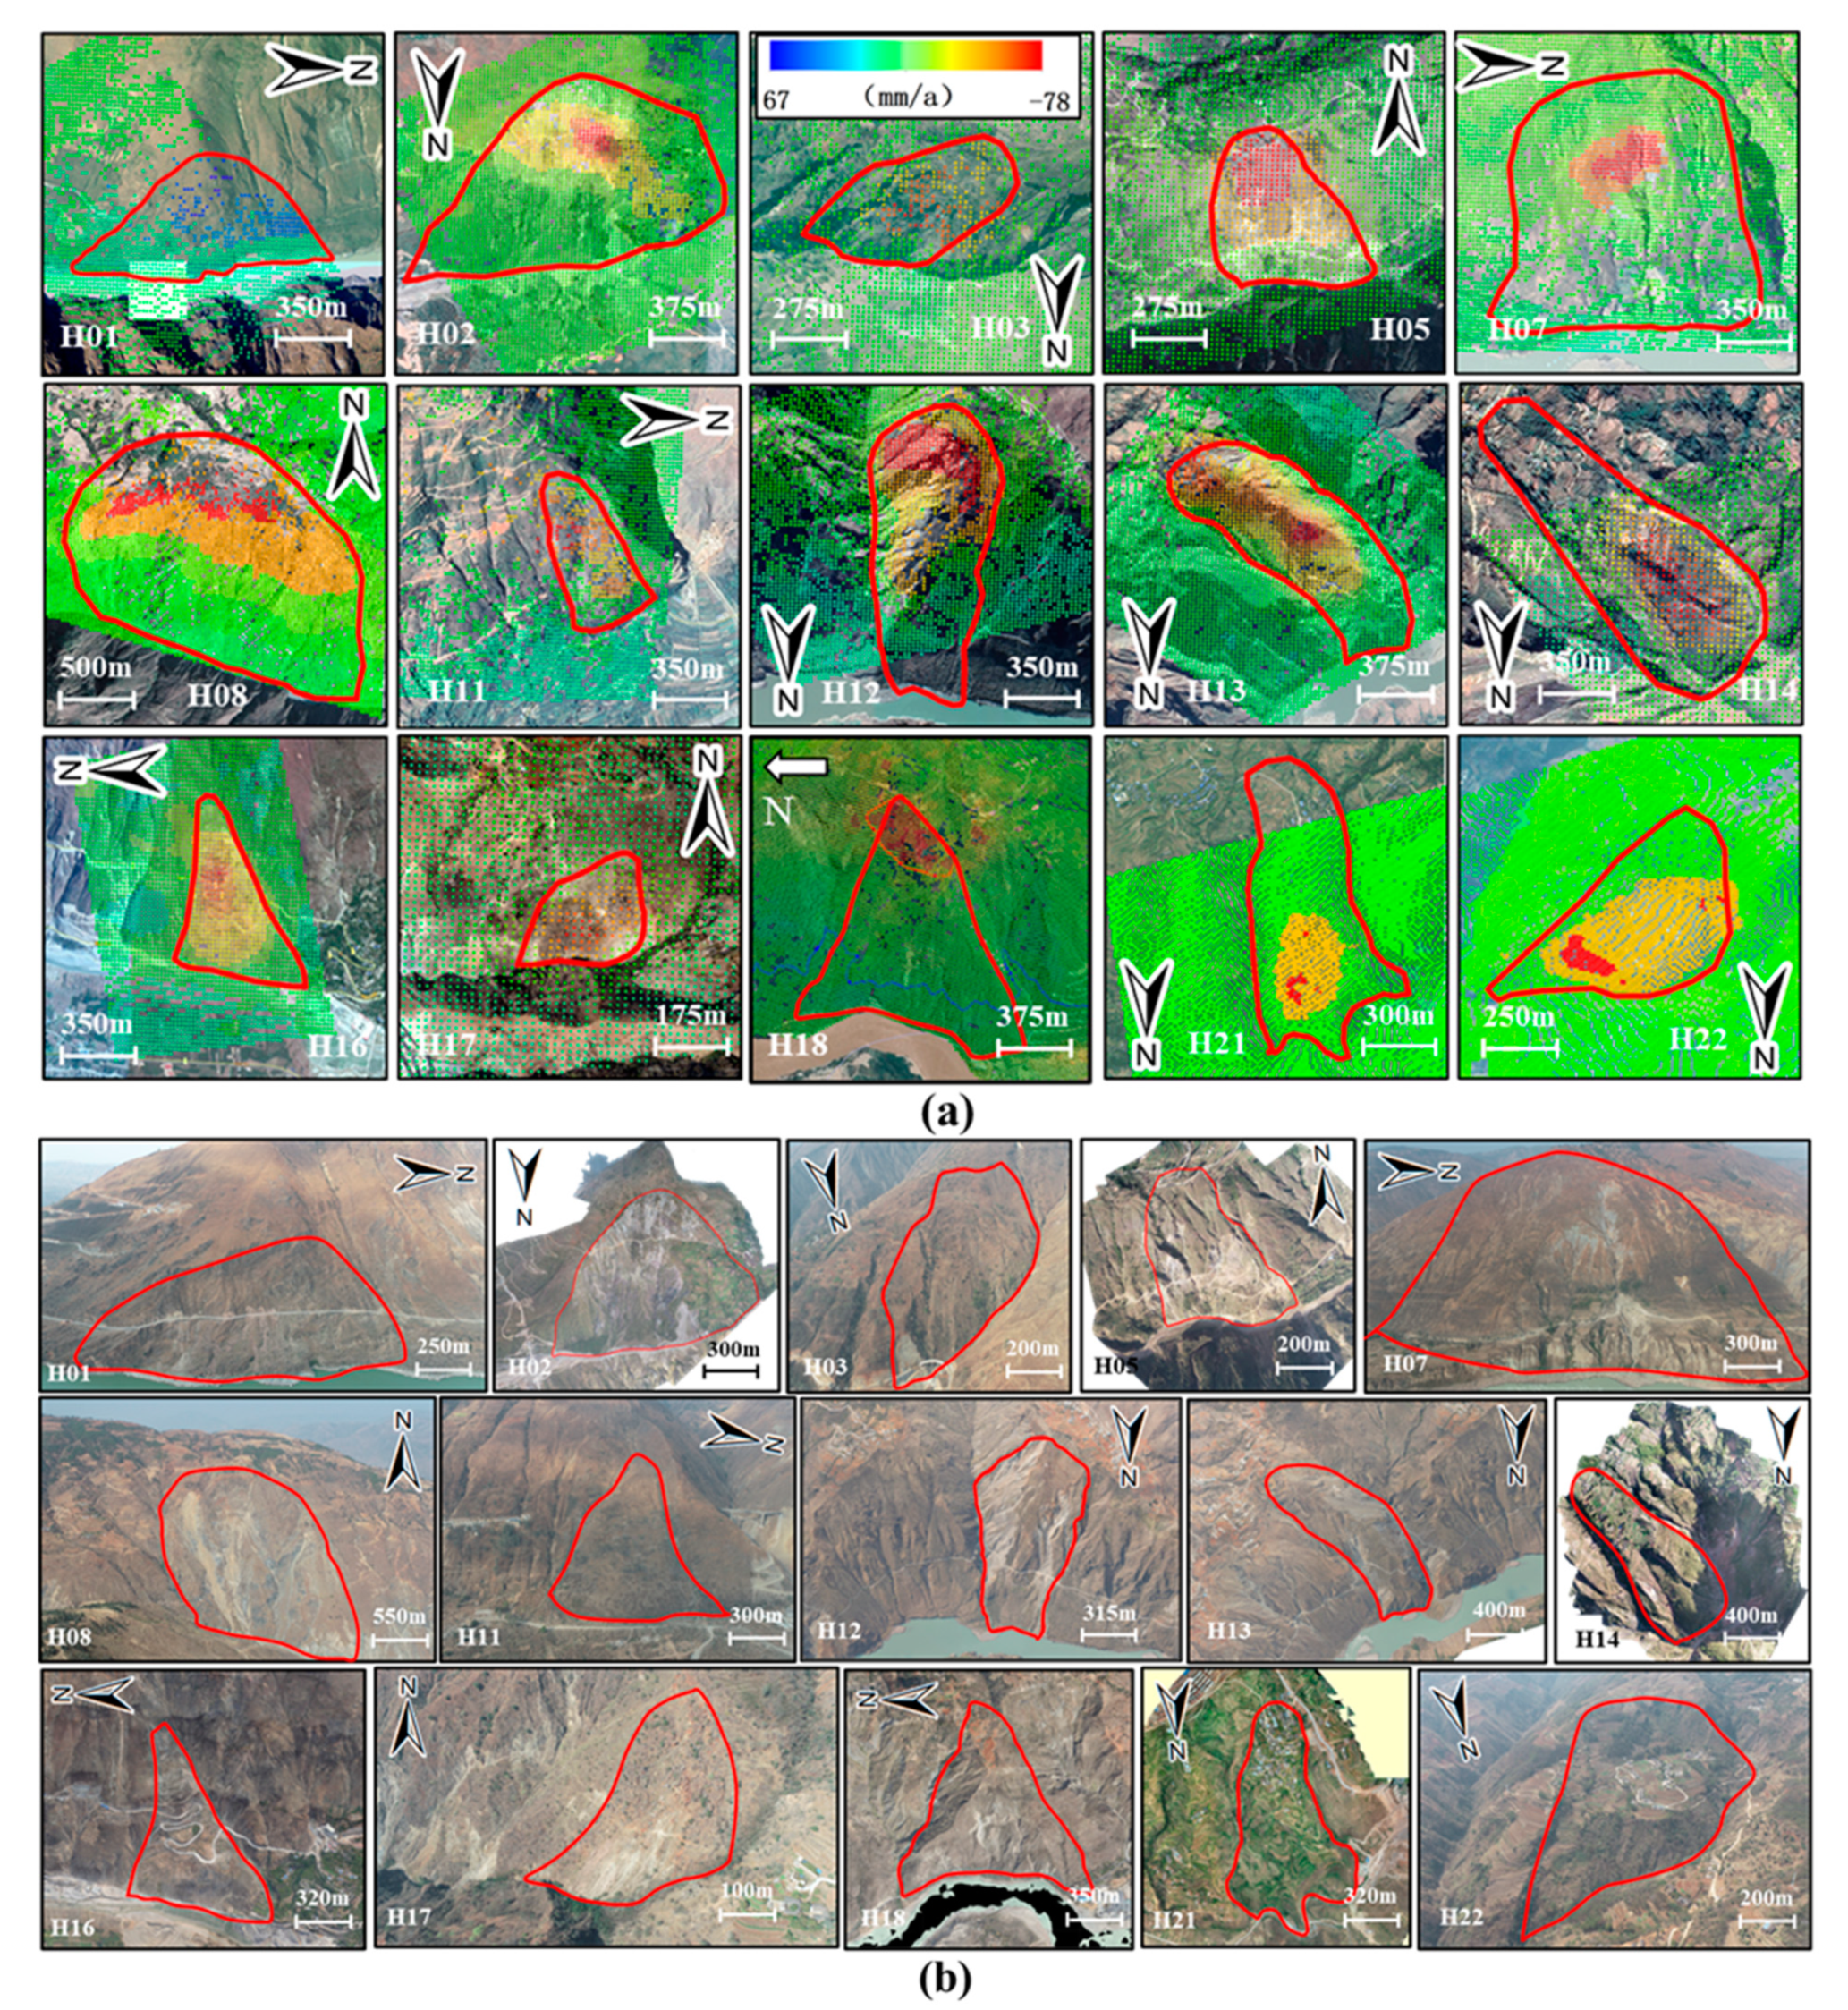
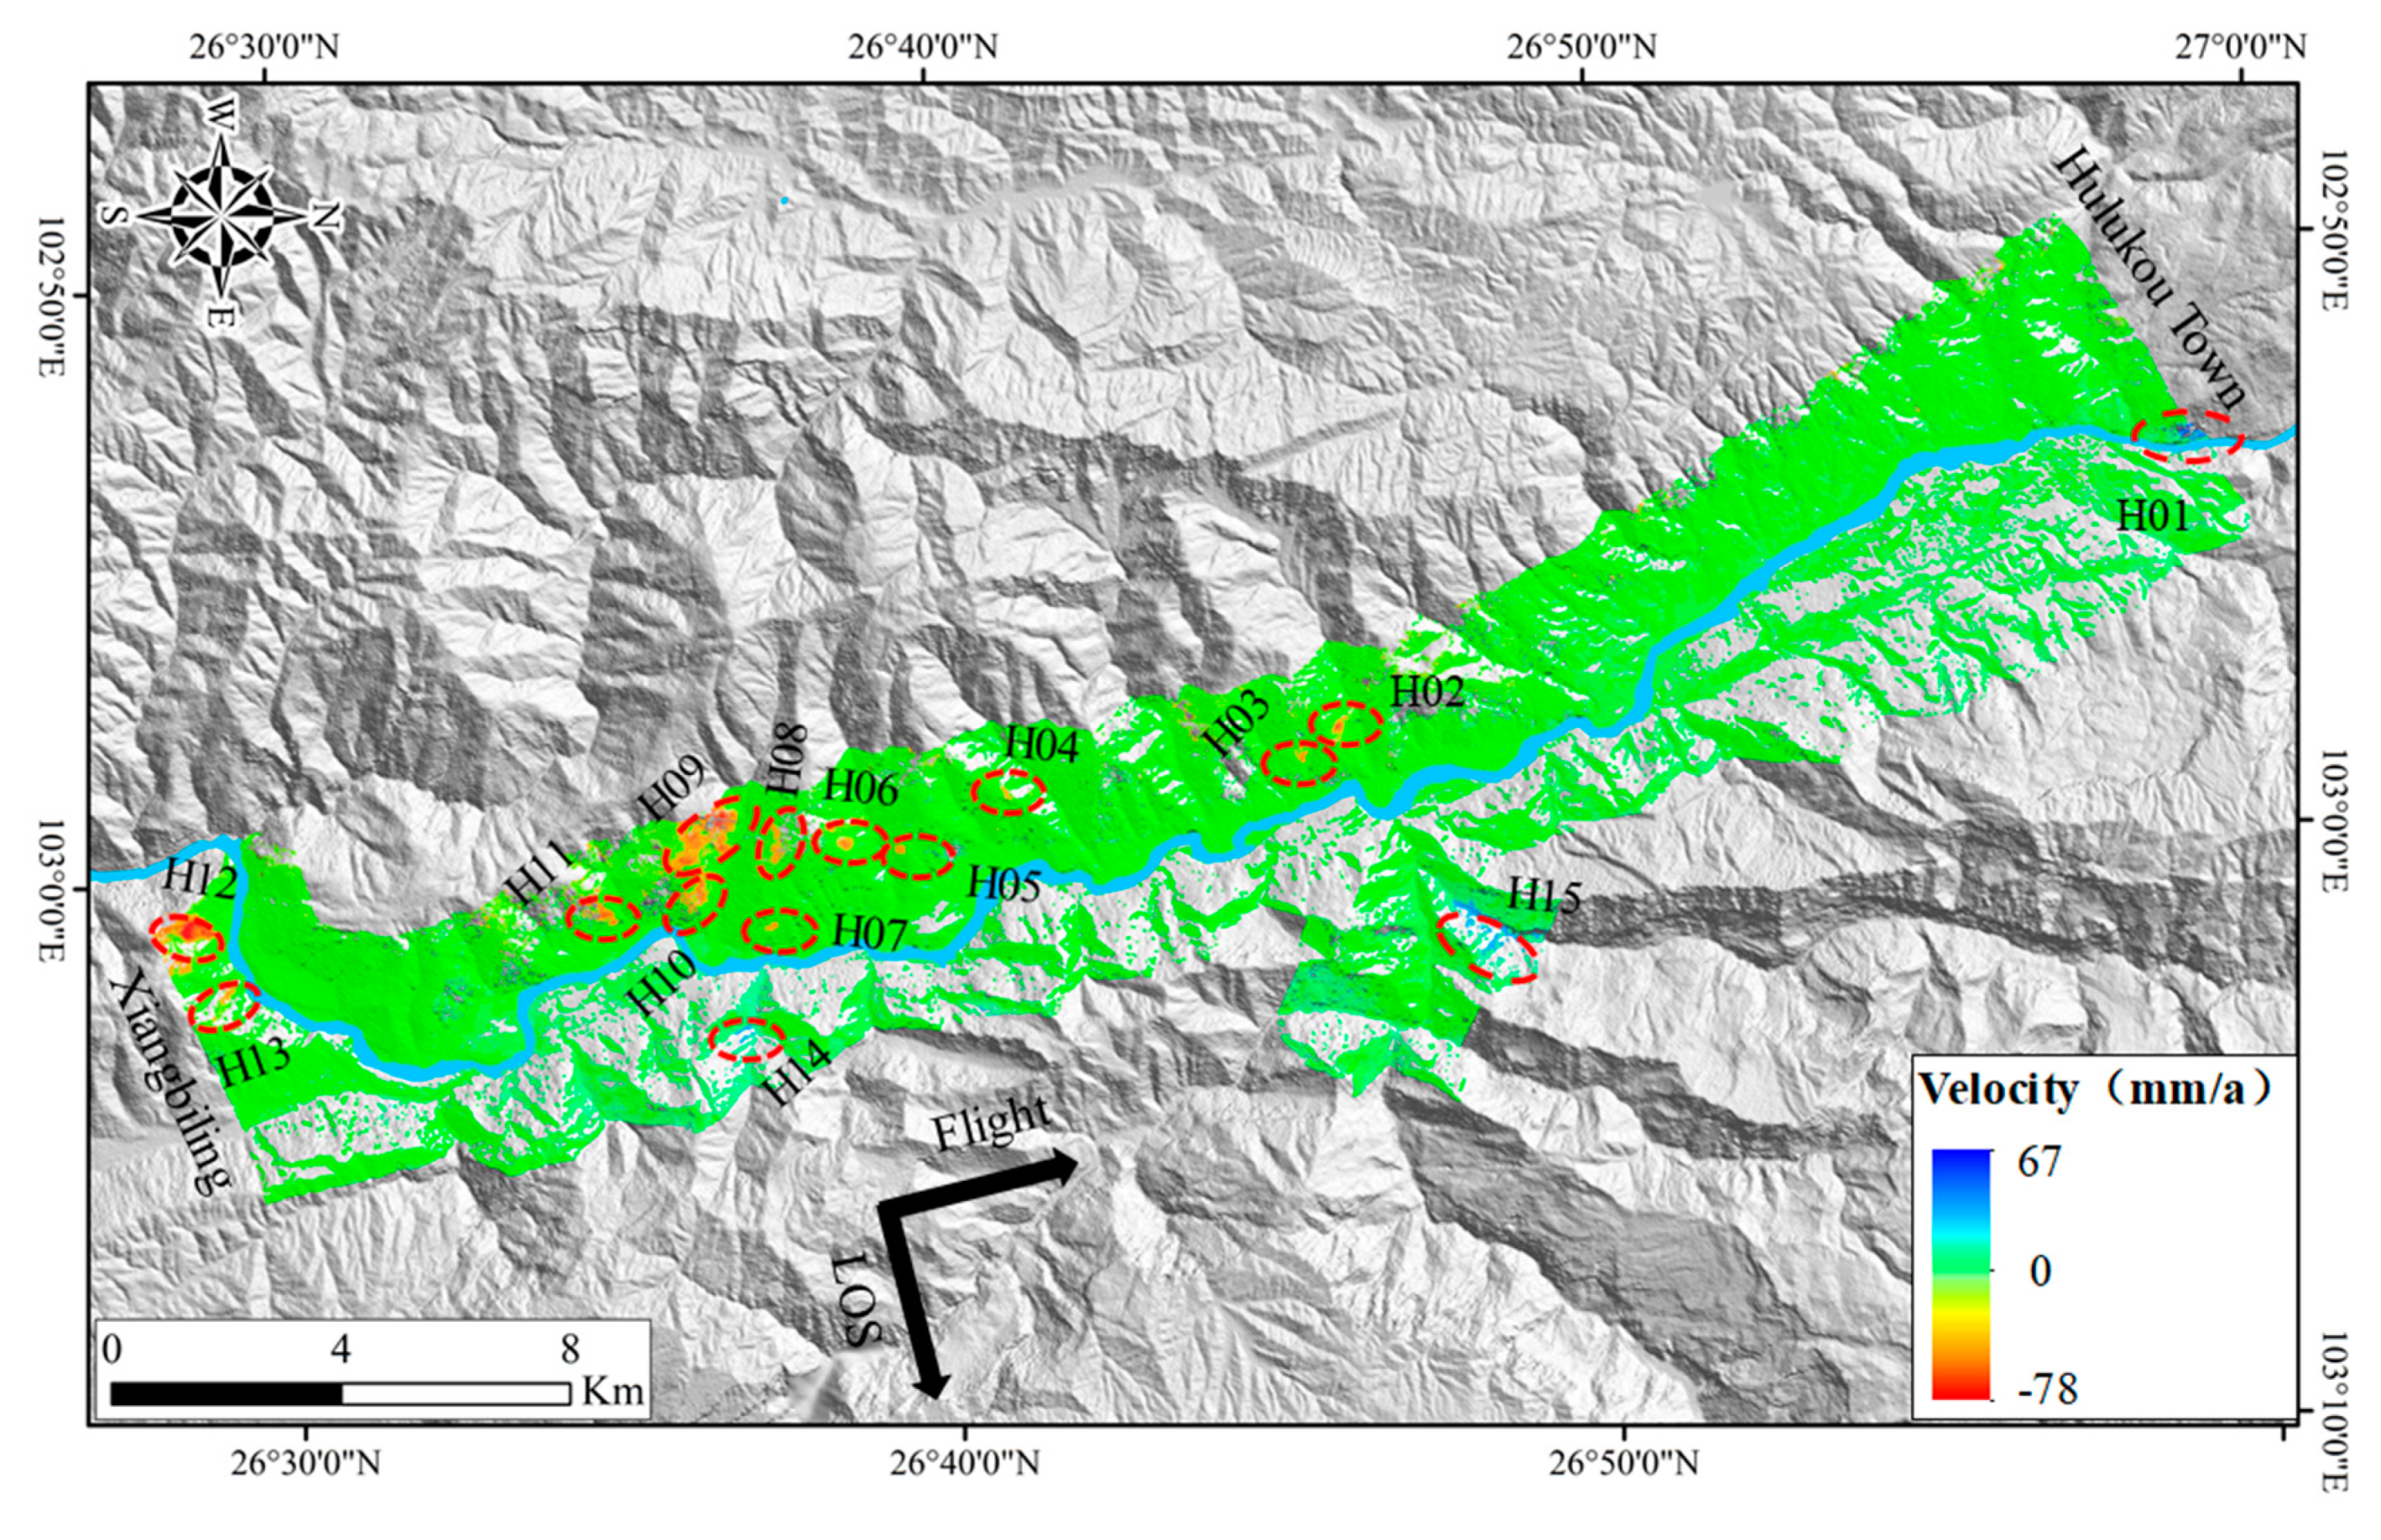
4.2. Deformation Detection Results
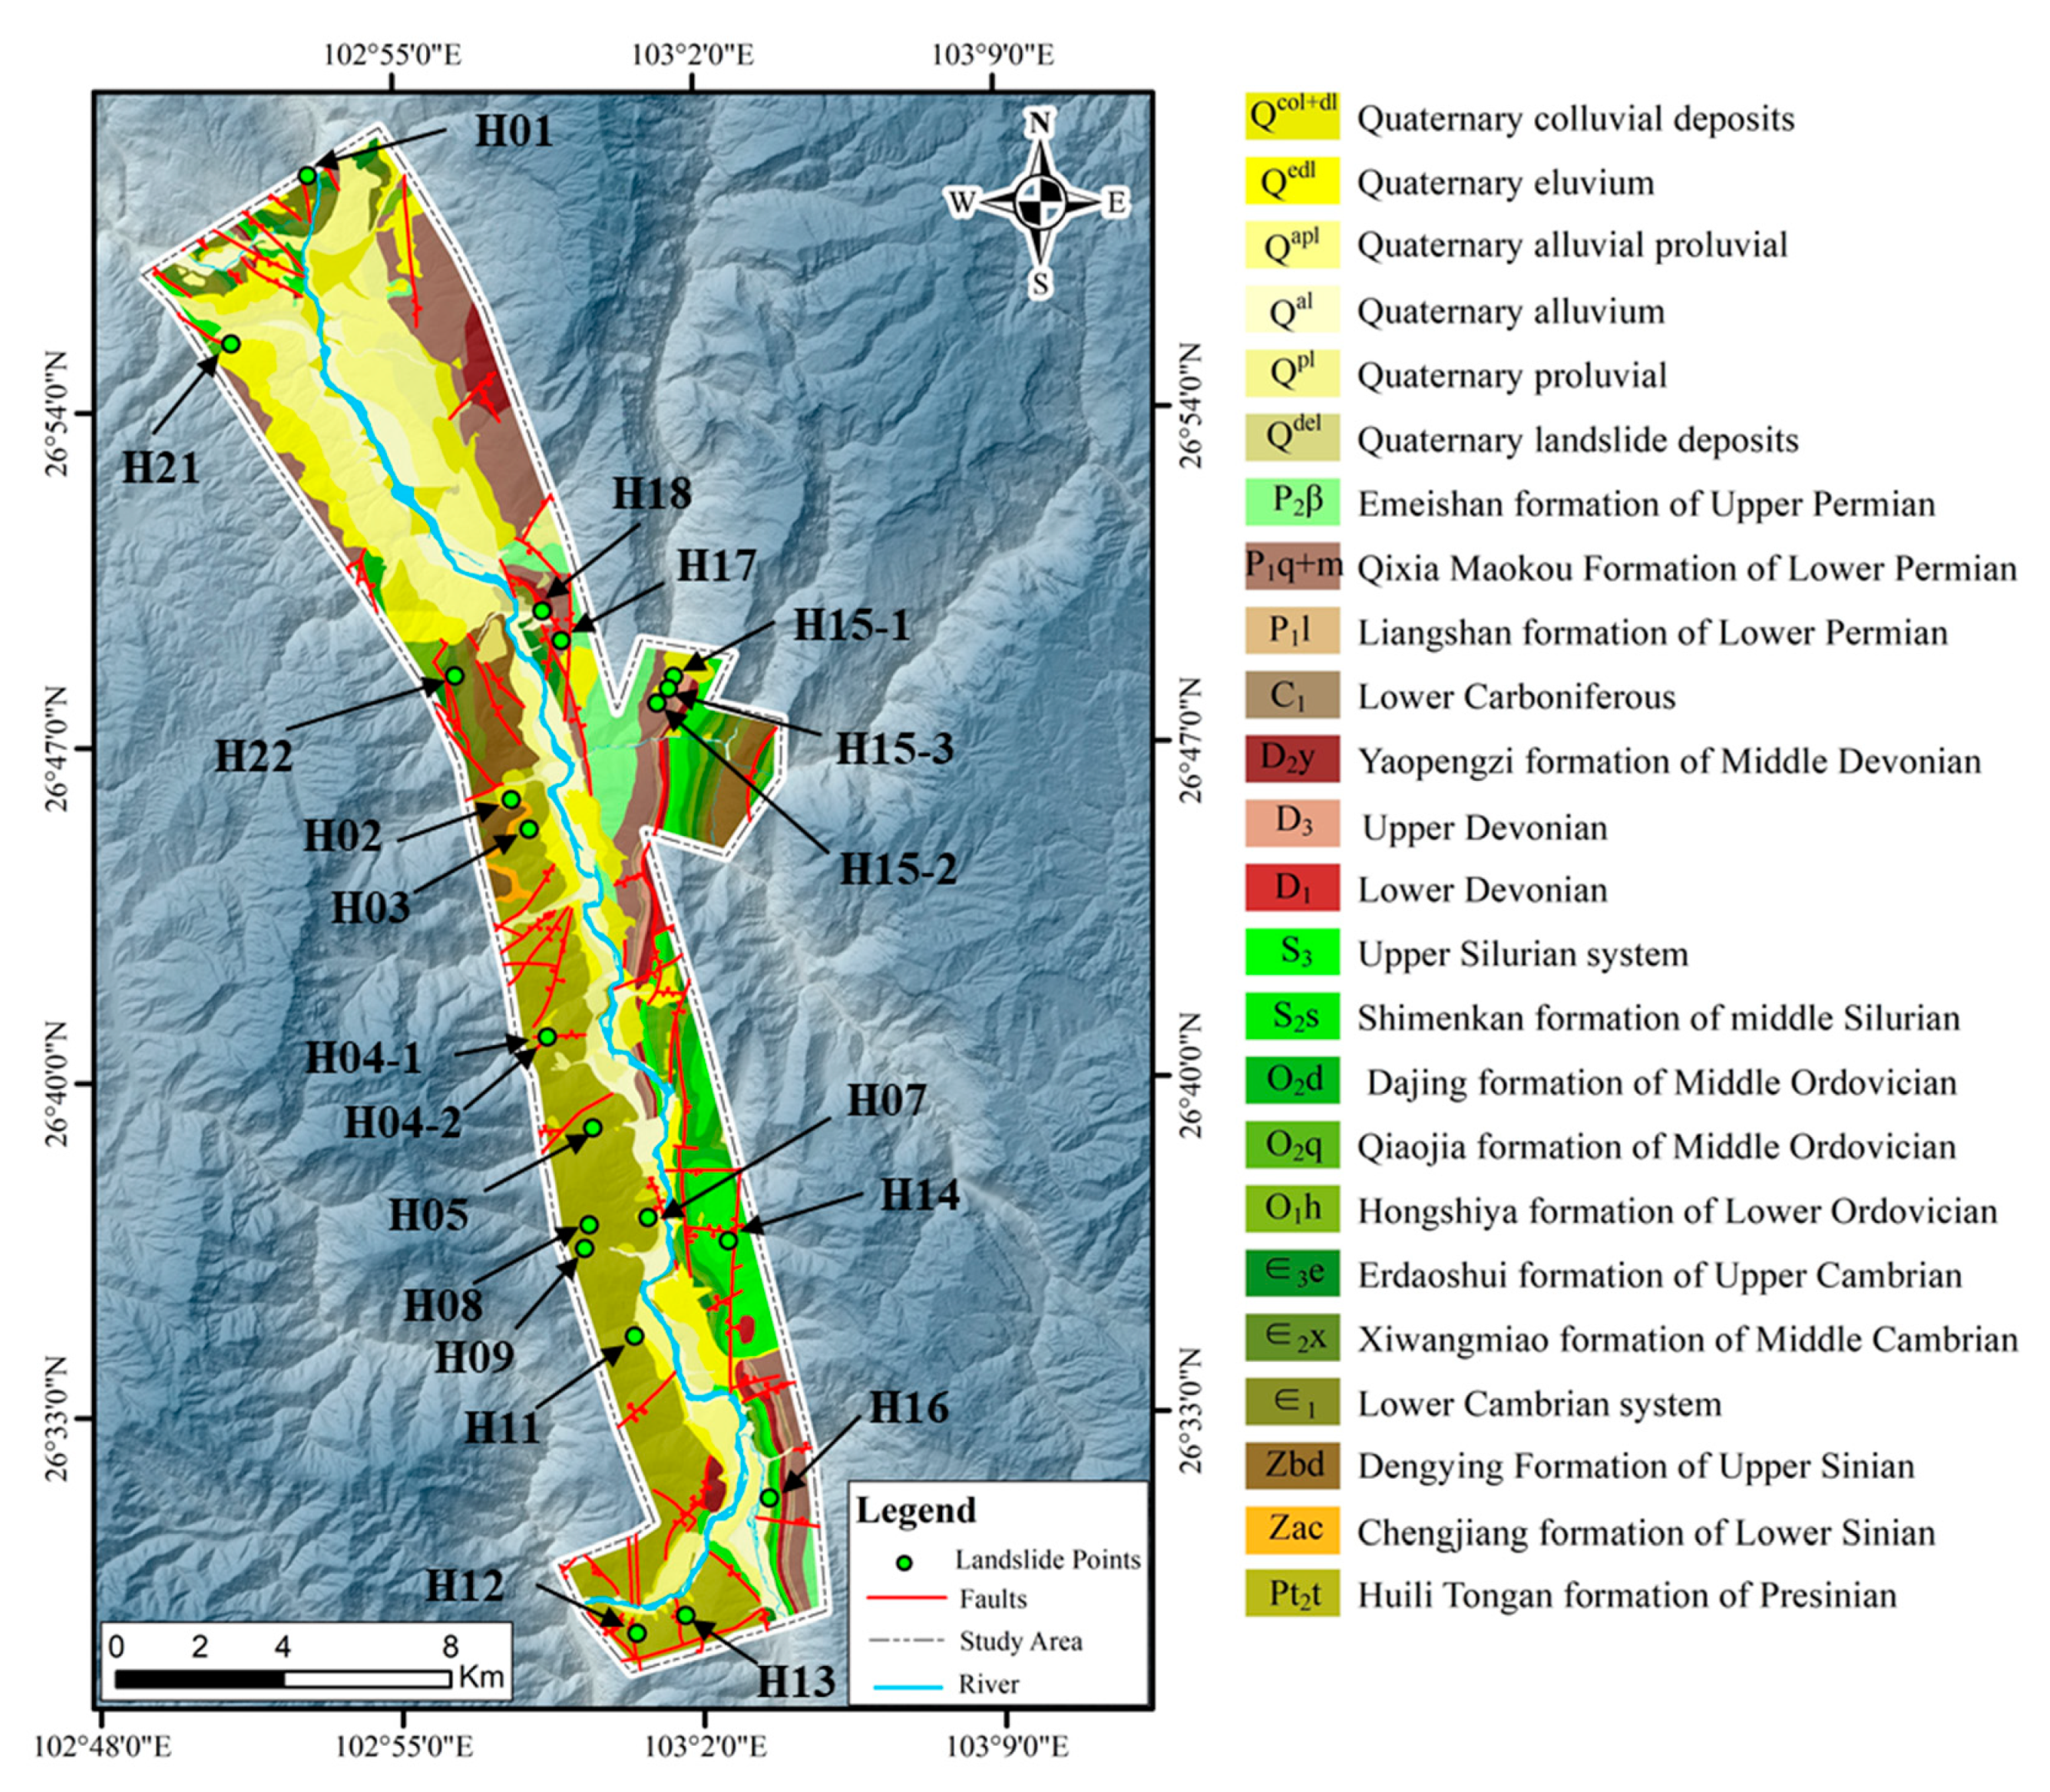
4.3. Mapping Active Landslides
5. Discussion
5.1. Distribution Pattern of the Detected Landslides
5.2. Impact Factors of the Landslide Detection Results
- (1)
- Each kind of satellite data corresponds to different wavelengths. Sentinel-1A is a C-band radar satellite; the wavelengths of the C-band are shorter than the wavelengths of the ALOS PALSAR data. The Sentinel-1A data exhibit the poor ability to penetrate dense vegetation, which might affect the intensification of the echo signal and frequently result in decoherence effects; this may result in a zero deformation point in areas with dense vegetation, thereby distorting the differences in the monitoring results.
- (2)
- The two satellites acquired data at different times, so the deformation computed with InSAR reflects only the deformation results within the data acquisition period.
- (3)
- The vegetation penetration capabilities of the ALOS PALSAR data are higher than those of the Sentinel-1A data since the wavelengths of the ALOS PALSAR data are longer than those of the Sentinel-1A data. However, decoherence of the interference pattern also occurred because of the fewer ALOS PALSAR inventory data points for the study area, the excessively long acquisition time interval, and the poorer data continuity than Sentinel-1A. The amount of data and the acquisition interval of the data may have affected the final deformation results. The more SAR data involved in the InSAR calculation and the shorter and more continuous the intervals between each data acquisition, the better the deformation results are; for the opposite, the deformation results are poor.
6. Conclusions
Author Contributions
Funding
Acknowledgments
Conflicts of Interest
References
- Qiao, P. Research on Revival Mechanism and Stability of Meilishi 3# Giant Landslide of Gushui Hydropower Station on Lancang River. Master’s Thesis, Chengdu University of Technology, Chengdu, China, 12 July 2016. [Google Scholar]
- Wang, S.; Xu, W.; Liu, J. Stability and failure mechanism analyses of the Zhenggang landslide in southwestern China. Adv. Civ. Eng. 2018, 2018, 1–16. [Google Scholar] [CrossRef]
- Zhou, J.; Shi, C.; Xu, F.G. Geotechnical characteristics and stability analysis of rock-soil aggregate slope at the Gushui Hydropower Station. Southwest China Sci. World J. 2013, 2013, 540636. [Google Scholar] [CrossRef]
- Kang, Y.; Zhao, C.; Zhang, Q.; Lu, Z.; Li, B. Application of InSAR techniques to an analysis of the Guanling landslide. Remote. Sens. 2017, 9, 1046. [Google Scholar] [CrossRef] [Green Version]
- Yi, X.Y.; Feng, W.K.; Bai, H.L. Catastrophic landslide triggered by persistent rainfall in Sichuan, China: August 21, 2020, Zhonghaicun landslide. Landslides 2021, 18, 2907–2921. [Google Scholar] [CrossRef]
- Burgmann, R.; Rosen, P.A.; Fielding, E.J. Synthetic aperture radar interferometry to measure Earth’s surface topography and its deformation. Annu. Rev. Earth Planet Sci. 2000, 28, 169–209. [Google Scholar] [CrossRef]
- Dong, J.; Liao, M.; Xu, Q.; Zhang, L.; Tang, M.; Gong, J. Detection and displacement characterization of landslides using multi- temporal satellite SAR interferometry: A case study of Danba County in the Dadu River. Eng. Geol. 2018, 240, 95–109. [Google Scholar] [CrossRef]
- Shi, X.G.; Yang, C.; Zhang, L.; Jiang, H.J.; Liao, M.S.; Zhang, L.; Liu, X.G. Mapping and characterizing displacements of active loess slopes along the upstream Yellow River with multi-temporal InSAR datasets. Sci. Total Environ. 2019, 674, 200–210. [Google Scholar] [CrossRef] [PubMed]
- Shi, X.G.; Liao, M.S.; Li, M.H.; Zhang, L.; Cunningham, C. Wide-area landslide deformation mapping with multi-path ALOS PALSAR data stacks: A case study of three gorges area, China. Remote. Sens. 2016, 8, 136. [Google Scholar] [CrossRef] [Green Version]
- Zhao, C.Y.; Liu, X.J.; Zhang, Q.; Peng, J.B.; Xu, Q. Research on loess landslide identification, monitoring and failure mode with InSAR technique in Heifangtai, Gansu. Geomat. Inf. Sci. Wuhan Univ. 2019, 44, 996–1007. (In Chinese) [Google Scholar] [CrossRef]
- Dai, C.; Li, W.L.; Lu, H.Y.; Yang, F.; Xu, Q.; Jian, J. Landalides detection using InSAR technology, A Cast Study in Zhouqu County, Gansu Province, China. Geomat. Inf. Sci. Wuhan Univ. 2020, 44, 996–1007. (In Chinese) [Google Scholar] [CrossRef]
- Shi, X.G.; Zhang, L.; Tang, M.G.; Li, M.H.; Liao, M.S. Investigating a reservoir bank slope displacement history with multi-frequency satellite SAR data. Landslides 2017, 14, 1961–1973. [Google Scholar] [CrossRef]
- Li, M.; Zhang, L.; Shi, X.; Liao, M.; Yang, M. Monitoring active motion of the Guobu landslide near the Laxiwa Hydropower Station in China by time-series point-like targets offset tracking. Remote Sens. Environ. 2019, 221, 80–93. [Google Scholar] [CrossRef]
- Zhang, Y.; Meng, X.; Jordan, C.; Novellino, A.; Dijkstra, T.; Chen, G. Investigating slow-moving landslides in the Zhouqu region of China using InSAR time series. Landslides 2018, 15, 1299–1315. [Google Scholar] [CrossRef]
- Meisina, C.; Zucca, F.; Notti, D. Geological interpretation of PSInSAR data at regional scale. Sensors 2008, 8, 7469–7492. [Google Scholar] [CrossRef] [Green Version]
- Xu, W.Y.; Zhang, Q.; Zhang, J.C.; Wang, R.B.; Wang, R.K. Deformation and control engineering related to huge landslide on left bank of Xiluodu reservoir, south-West China. Eur. J. Environ. Civ. Eng. 2013, 17, 249–268. [Google Scholar] [CrossRef]
- Zhao, C.Y.; Lu, Z.; Zhang, Q.; de la Fuente, J. Large-area landslide detection and monitoring with ALOS/PALSAR imagery data over northern California and southern Oregon, USA. Remote Sens. Environ. 2012, 124, 348–359. [Google Scholar] [CrossRef]
- Zhang, Y.; Meng, X.M.; Dijkstra, T.A.; Jordan, C.J.; Chen, G.; Zeng, R.Q.; Novellino, A. Forecasting the magnitude of potential landslides based on InSAR techniques. Remote Sens. Environ. 2020, 241, 111738. [Google Scholar] [CrossRef]
- Bianchini, S.; Cigna, F.; Righini, G. Landslide HotSpot Mapping by means of Persistent Scatterer Interferometry. Environ. Earth Sci. 2012, 67, 1155–1172. [Google Scholar] [CrossRef]
- Zhao, C.Y.; Kang, Y.; Qin, Z.; Zhong, L.; Bin, L. Landslide Identification and Monitoring along the Jinsha River Catchment (Wudongde Reservoir Area), China, Using the InSAR Method. Remote Sens. 2018, 10, 993. [Google Scholar] [CrossRef] [Green Version]
- Lu, H.Y.; Li, W.L.; Xu, Q.; Dong, X.J.; Dai, C.; Wang, D. Early detection of landslides in the upstream and downstream areas of the Baige Landslide, the Jinsha River based on optical remote sensing and InSAR technologies. Geomat. Inf. Sci. Wuhan Univ. 2019, 44, 1342–1354. (In Chinese) [Google Scholar] [CrossRef]
- Zhang, Y. Detecting Ground Deformation and Investigating Landslides Using InSAR Technique—Taking Middle Reach of Bailong River Basin as an Example. Ph.D. Thesis, Lanzhou University, Lanzhou, China, 2018. [Google Scholar]
- Chen, L. Study on the Influence of Reservoir Water Storage on the Stability of Reservoir Bank—Take Baihetan Area of Ningnan County as an Example. Master’s Thesis, Chang’an University, Xi’an, China, 21 July 2016. [Google Scholar]
- Feng, W.K.; Dun, J.W.; Yi, X.Y.; Zhang, G.Q. Deformation Analysis of WoDa village Old Landslide in Jinsha River Basin Based on SBAS-InSAR Technology. J. Eng. Geol. 2019, 28, 384–393. [Google Scholar]
- Cascini, L.; Fornaro, G.; Peduto, D. Advanced low-and full-resolution D-InSAR map generation for slow-moving landslide analysis at different scales. Eng. Geol. 2010, 112, 29–42. [Google Scholar] [CrossRef]
- Cigna, F.; Bateson, L.B.; Jordan, C.J.; Dashwood, C. Simulating SAR geometric distortions and predicting persistent scatterer densities for ERS-1/2 and ENVISAT C-band SAR and InSAR applications: Nationwide feasibility assessment to monitor the landmass of Great Britain with SAR imagery. Remote Sens. Environ. 2014, 152, 441–466. [Google Scholar] [CrossRef] [Green Version]
- Herrera, G.; Gutierrez, F.; Garcia-Davalillo, J.C.; Guerrero, J.; Notti, D.; Galve, J.P.; Fernandez-Merodo, J.A.; Cooksley, G. Multi-sensor advanced DInSAR monitoring of very slow landslides: The Tena Valley case study (central Spanish Pyrenees). Remote Sens. Environ. 2013, 128, 31–43. [Google Scholar] [CrossRef]
- Dai, K.R.; Zhang, L.L.; Song CLi, Z.H.; Zhuo, G.C.; Xu, Q. Quantitative Analysis of Sentinel-1 Imagery Geometric Distortion and their suitability along Sichuan-Tibet Railway. Geomat. Inf. Sci. Wuhan Univ. 2021. (In Chinese) [Google Scholar] [CrossRef]
- Xu, J.Q.; Ma, T.; Lu, Y.K.; Bai, W.M.; Zhao, S. Land Subsidence Monitoring in North Henan Plain Based on SBAS-InSAR Technology. J. Jilin Univ. Earth Sci. Ed. 2019, 49, 1182–1191. [Google Scholar] [CrossRef]
- He, X.F.; He, M. InSAR Earth Observation Data Processing Method and Comprehensive Measurement; Science Press: Beijing, China, 2012. [Google Scholar]
- Ferretti, A.; Prati, C.; Rocca, F. Permanent scatterers in SAR interferometry. IEEE Trans. Geosci. Remote. Sens. 2001, 39, 21. [Google Scholar] [CrossRef]
- Liu, G.Q. Landslide Detection and Monitoring of Danba County Based on SBAS-InSAR. Master’s Thesis, Chang’an University, Xi’an, China, 21 July 2015. [Google Scholar]
- Doin, M.P.; Lasserre, C.; Peltzer, G.; Cavali’e, O.; Doubre, C. Corrections of stratifed tropospheric delays in SAR interferometry: Validation with global atmospheric models. J. Appl. Geophys. 2009, 69, 35–50. [Google Scholar] [CrossRef]
- Liu, X.J.; Zhao, C.Y.; Zhang, Q.; Lu, Z.; Li, Z.H. Deformation of the Baige Landslide, Tibet, China, revealed through the integration of cross-platform ALOS/ PALSAR-1 and ALOS/PALSAR-2 SAR observations. Geophys. Res. Lett. 2020, 47, e2019GL086142. [Google Scholar] [CrossRef] [Green Version]
- Liang, J.T. Study On The Early Remot Sensing Identification and Evolution Characteristics of Typical Geological Disaster in High Intensity Earthquake Zone. Master’s Thesis, Chengdu University of Technology, Chengdu, China, 12 July 2018. [Google Scholar]
- Zuo, X.F. Study on the Influence of Active Fault on Slope Hazards in Ningqiang County. Master’s Thesis, Xi’an University of Science and Technology, Xi’an, China, 21 July 2020. [Google Scholar]


| Satellite | Wavelength | Ascending/Descending Orbit | Time | Return to the Cycle | Resolution | Angle of Incidence | Imaging Mode | Polarization Mode |
|---|---|---|---|---|---|---|---|---|
| Sentinel-1A | 5.6 cm/C Band | Ascending orbit | 19 October 2014~12 August 2020 | 12 Days | 20 m | 43.9° | IW | VV |
| Sentinel-1A | 5.6 cm/C Band | Descending orbit | 19 February 2017~26 August 2020 | 12 Days | 20 m | 38.5° | IW | VV |
| ALOS PALSAR | 23.6 cm/L Band | Ascending orbit | 7 February 2007~18 November 2010 | 46 Days | 20/10 m | 39.6° | FBD /FBS | HH |
| Observation | ALOS PALSAR Ascending | Sentinel-1A Ascending | Sentinel-1A Descending |
|---|---|---|---|
| Shadow | 1.1% | 1.7% | 0.7% |
| Layover | 7.1% | 3.9% | 8.6% |
| Foreshortening | 33.7% | 35.1% | 33.3% |
| Geometric distortion region | 41.9% | 40.1% | 42.6% |
| Low sensitivity region | 23.1% | 23.1% | 23.1% |
| Effective deformation region | 35% | 36.8% | 34.3% |
| Effective deformation region(fusion ascending and descending data) | 35% | 71.1% | |
| InSAR Deformation Area Number | Long (m) | Wide (m) | Slope (°) | Aspect (°) | Maximum Deformation Rate (mm/a) | Deformation Characteristics | |
|---|---|---|---|---|---|---|---|
| H01 | 500 | 960 | 23~30 | 80 | 67 | The rock mass is broken, and the rock collapses in the deformation area | |
| H02 | 1180 | 1640 | 25~45 | 5 | −56 | There are many fractures and lower staggered scarps, with local collapses in the deformation area | |
| H03 | 780 | 500 | 22~34 | 48 | −46 | There are many lower staggered scarps and a three-step stepped topography in the deformation area | |
| H04 | H04-1 | 650 | 380 | 16~39 | 320 | −56 | The rock mass is broken, and substantial bedrock collapse downward in the deformation area |
| H04-2 | 660 | 440 | 28~46 | 340 | −78 | The rock mass is broken, and the road is cracked in the deformation area | |
| H05 | 670 | 500 | 34~54 | 162 | −39 | The rock mass is broken, and the broken stone has collapsed in the deformation area | |
| H07 | 1340 | 1390 | 30~40 | 88 | −49 | The branch gullies are developed, the surface of the slope is seriously eroded, and the broken stone has collapsed downward in the deformation area | |
| H08 | 1530 | 1080 | 28~46 | 173 | −45 | The slope surface is weathered and eroded, and the rock and soil mass of the slope has collapsed in the deformation area | |
| H09 | 1330 | 600 | 40~56 | 38 | −74 | There is an obvious lower staggered scarp in the deformation area | |
| H11 | 520 | 360 | 28~40 | 73 | −57 | The bedrock is exposed, and the rock mass on the surface of the slope is relatively broken, with the local collapse in the deformation area | |
| H12 | 1680 | 430 | 40~58 | 320 | −56 | The rock mass is broken and loose, and the broken stone has collapsed downward in the deformation area | |
| H13 | 1740 | 620 | 40~60 | 22 | −78 | The fractures are well developed, and rock blocks have fallen in the deformation area | |
| H14 | 1220 | 460 | 16~40 | 318 | −37 | There is a secondary sliding, and serious cracks appear in houses in the deformation area | |
| H15 | H15-1 | 700 | 610 | 30~40 | 282 | 30 | There are many lower staggered scarps and small-scale landslides in the deformation area |
| H15-2 | 660 | 210 | 40~50 | 323 | 32 | The shallow surface of the slope has collapsed in the deformation area | |
| H15-3 | 600 | 230 | 40~55 | 280 | 35 | The rock mass is broken, and the broken surface stone of the slope has collapsed downward in the deformation area | |
| H16 | 930 | 660 | 15~50 | 258 | −43 | The retaining wall and the highway are cracked, and signs of deformation are obvious in the deformation area | |
| H17 | 380 | 300 | 28~46 | 208 | −33 | There are lower staggered scarps and local collapses in the deformation area | |
| H18 | 1300 | 1330 | 16~54 | 270 | −36 | Several fractures have developed in the deformation area | |
| H21 | 1280 | 570 | 10~34 | 348 | −32 | Secondary sliding has occurred, and there was obvious dislocation in the deformation area | |
| H22 | 780 | 840 | 16~40 | 27 | −37 | The building has cracked, and the platform was staggered in the deformation area | |
| InSAR Deformation Area Number | Maximum Deformation Rate (mm/a) | Causes of Deformation |
|---|---|---|
| H06 | −47 | The original stress of the rock and soil has changed, and the local collapse was caused by highway construction |
| H10 | −50 | The original stress of the rock and soil has changed, and the local collapse was caused by highway construction |
| H19 | −28 | Road construction, artificial excavation |
| H20 | −36 | The settlement deformation was caused by artificial excavation and heaped load |
| H23 | −32 | The original stress of the rock and soil has changed, and local collapse was caused by highway construction |
| H24 | −29 | The original stress of the rock and soil has changed, and local collapse was caused by highway construction |
| H25 | −27 | The construction of the tunnel has changed the original stress of the rock and soil mass and caused local collapse |
Publisher’s Note: MDPI stays neutral with regard to jurisdictional claims in published maps and institutional affiliations. |
© 2021 by the authors. Licensee MDPI, Basel, Switzerland. This article is an open access article distributed under the terms and conditions of the Creative Commons Attribution (CC BY) license (https://creativecommons.org/licenses/by/4.0/).
Share and Cite
Dun, J.; Feng, W.; Yi, X.; Zhang, G.; Wu, M. Detection and Mapping of Active Landslides before Impoundment in the Baihetan Reservoir Area (China) Based on the Time-Series InSAR Method. Remote Sens. 2021, 13, 3213. https://doi.org/10.3390/rs13163213
Dun J, Feng W, Yi X, Zhang G, Wu M. Detection and Mapping of Active Landslides before Impoundment in the Baihetan Reservoir Area (China) Based on the Time-Series InSAR Method. Remote Sensing. 2021; 13(16):3213. https://doi.org/10.3390/rs13163213
Chicago/Turabian StyleDun, Jiawei, Wenkai Feng, Xiaoyu Yi, Guoqiang Zhang, and Mingtang Wu. 2021. "Detection and Mapping of Active Landslides before Impoundment in the Baihetan Reservoir Area (China) Based on the Time-Series InSAR Method" Remote Sensing 13, no. 16: 3213. https://doi.org/10.3390/rs13163213
APA StyleDun, J., Feng, W., Yi, X., Zhang, G., & Wu, M. (2021). Detection and Mapping of Active Landslides before Impoundment in the Baihetan Reservoir Area (China) Based on the Time-Series InSAR Method. Remote Sensing, 13(16), 3213. https://doi.org/10.3390/rs13163213