Article

An Investigation of NEXRAD-Based Quantitative Precipitation Estimates in Alaska

1
NOAA National Environmental Satellite, Data, and Information Service (NESDIS), Asheville, NC 28801, USA
2
Cooperative Institute for Satellite Earth System Studies, North Carolina State University, Asheville, NC 28801, USA
*
Author to whom correspondence should be addressed.
Remote Sens. 2021, 13(16), 3202; https://doi.org/10.3390/rs13163202
Submission received: 5 July 2021 / Revised: 10 August 2021 / Accepted: 10 August 2021 / Published: 12 August 2021
(This article belongs to the Special Issue Remote Sensing of Precipitation at the Mid- to High-Latitudes)

Abstract

:
Precipitation estimation by weather radars in Alaska is challenging. In this study, we investigate National Weather Service (NWS) precipitation products that are produced from the seven NEXRAD radar sites in Alaska. The NWS precipitation processing subsystem generates stages of data at each NEXRAD site which are then input to the weather forecast office to generate a regionwide precipitation product. Data from the NEXRAD sites and the operational rain gauges in the weather forecast region are used to produce this regionwide product that is then sent to the National Centers for Environmental Prediction (NCEP) to be included in the NCEP Stage IV distribution. The NCEP Stage IV product for Alaska has been available since 2017. We use the United States Climate Reference Network (USCRN) data from Alaska to compare to the NCEP Stage IV data. Given that the USCRN can be used in the production of the NCEP Stage IV data for Alaska, we also used the NEXRAD Digital Precipitation Array (DPA) that is generated at the site for comparison of the radar-only products. Comparing the NEXRAD-based data from Alaska to the USCRN gauge estimates using the USCRN site information on air temperature, we are able to condition the analysis based on the hourly or 6-hourly average air temperature. The estimates in the frozen phase of precipitation largely underestimate as compared to the gauge, and the correlation is low with larger errors as compared to other phases of precipitation. In the mixed phase the underestimation of precipitation improves, but the correlation is still low with relatively large errors as compared to the rain phases of precipitation. The difficulties in precipitation estimation in cold temperatures are well known and we show the evaluation for the NCEP Stage IV regional data for Alaska and the NEXRAD site specific Digital Precipitation Array (DPA) data. Results show the challenges of estimating mixed-phase and frozen precipitation. However, the DPA data shows somewhat better performance in the mixed precipitation phase, which suggests that the NWS Precipitation Processing Subsystem (PPS) is tuned to the climatology as it relates to precipitation in Alaska.

1. Introduction

Remotely sensing precipitation in high latitudes is difficult due to complex terrain, snow and frozen phase estimation, limited power grid availability, etc. [1]. In addition, in situ observations (gauge based) are sparse in high latitudes and are difficult to maintain and manage due to extreme temperatures, limited power grid, data transmission, etc. Some studies have examined ground-based radar observations as they compare to satellite-based estimates. Norin et al. [2] provide an intercomparison of the C-Band network of SweRad ground-based radars to the CloudSat profiling radar and provide a statistical analysis of snow intensity, snow rate conversion, and performance of observations versus distance from the ground-based radar. Smalley et al. [3] compared precipitation estimates from the CloudSat profiling radar with NCEP Stage IV over the contiguous United States (CONUS) and found that CloudSat performance based on statistical measures of probability of detection (POD), false alarm ratio (FAR), and detected precipitation percent were better for CloudSat in the western U.S. and for cold/frozen precipitation. By striating their analysis based on the near-surface air temperatures of T > 10 °C and T < 0 °C they showed the marked improvement in CloudSat as compared to NCEP Stage IV in cool and frozen precipitation. Similarly, [4] performed similar analyses using CloudSat and MRMS high-resolution quantitative precipitation and found very similar results except that MRMS compares very well within 100 km of the radar site. They narrowed their analysis as compared to [3] based on temperature by calling 0–2 °C mixed phase and below 0 °C snow.
Remotely sensed precipitation estimates in Alaska can be obtained from spaceborne satellites (i.e., GPM) and Weather Surveillance Radar—1988 Doppler (WSR-88D) (also known as NEXRAD) ground-based radars. The periods of record for these remotely sensed precipitation estimates makes it difficult to do intercomparisons or generate a long-term blended product. We provide an investigation into the available ground-based precipitation products (both gauge-based and NEXRAD-based) in Alaska for the period in which the data overlap. The WSR-88D sites in Alaska came online starting in 1996 and 1997 providing level II data precipitation estimates at the NEXRAD radar sites [5]. Alaskan statewide precipitation estimates based on remotely sensed platforms have been limited to satellite-based algorithms such as the Tropical Rainfall Measurement Mission (TRMM), Global Precipitation Measurement (GPM), and the Climate Prediction Center Morphing method (CMORPH). Satellite observations in high latitudes have their limitations due to temperature variations, overpass angles, and complex terrain [6]. Another statewide precipitation product comes from the National Centers for Environmental Prediction (NCEP), which produces a Stage IV precipitation estimate for Alaska [7] but only since 2017. While the NCEP Stage IV product has been produced in some form since 2001, it has only recently become available from the Alaska region. The National Weather Service (NWS) precipitation processing subsystem (PPS) generates precipitation estimates in stages at NEXRAD radar specific sites (Stage I) and these estimates are used at the NWS River Forecast Centers (RFCs) to generate regionwide maps of precipitation (Stage III). Stage III estimates are sent to NCEP for the generation of the Stage IV precipitation estimate. We provide a comprehensive overview of the NCEP Stage IV product in [8]. Rain gauges in Alaska (Figure 1) are a mix of networks (RAWS, ALERT, SNOTEL) and these rain gauge data that are reported to the Meteorological Assimilation Data System (MADIS) [9] are included in the NWS PPS.
In this study, we investigate both the NCEP Stage IV precipitation and NEXRAD site specific Stage I radar-only data. For intercomparisons, we use data from the U.S. Climate Reference Network (USCRN) rain gauges in Alaska. There are 21–24 (depending on the year) USCRN sites in Alaska that provide 5 min precipitation estimates as well as temperature and wind speed (along with other variables, see [10]). We also use the processed data that provide hourly information from the USCRN.
This paper is organized as follows. In Section 2 we discuss the data from three sources and the methodology we use to present the analysis. In Section 3 we discuss the results of our investigation, and in Section 4 we provide conclusions of our study.

2. Data and Methodology

2.1. NEXRAD Stage IV Alaska

The NCEP Stage IV product, herein referred to as Stage IV, is a near-real-time product that is generated at NCEP. It is based on the NEXRAD Precipitation Processing System (PPS) [11] and the NWS River Forecast Center (RFC) precipitation processing. Originally, the Stage IV product was intended for assimilation into atmospheric forecast models to improve quantitative precipitation forecasts (QPF) [12]. However, the product as it is currently generated and archived has become quite popular for various applications. In short, Stage IV data are the mosaicked data from the River Forecast Centers (RFCs) that use data generated by the NWS PPS algorithm from the NEXRAD radar site. RFC data are bias-adjusted by available rain gauge data in the domain. The rain gauge data used at each RFC vary depending on the RFC. However, some of the main rain gauge networks are the Hydrometeorological Automated Data System (HADS), Automated Surface Observing System (ASOS), and Remote Automatic Weather Stations (RAWS), and Automatic Local Evaluation in Real-Time (ALERT). In Alaska, a large contribution of rain gauge data comes from SNOTEL, Alaska DOT, and Alaska DNR. An extensive assessment and a description of the processing system of the Stage IV data set can be found in [8]. While the Stage IV data are available since 2002, we only use the concurrent data to the rain gauge, Stage IV, and NEXRAD site-specific DPA available data (2017–2020).

2.2. NEXRAD Level III Digital Precipitation Array

The Weather Surveillance Radar—1988 Doppler (also referred to as NEXRAD) Level III data set includes many products ranging from reflectivity to precipitation estimates. In this study, we use precipitation products that are generated at the NEXRAD sites via the Precipitation Processing Subsystem (PPS) [13]. The digital precipitation array (DPA) is the hourly running total radar rainfall estimate for a specific radar that is updated every volume scan. The DPA is computed by the PPS using the radar-only reflectivity estimates and a transformation from polar coordinates to Cartesian coordinates (Hydrologic Rainfall Analysis Projection (HRAP)) [11]. Evaluation of DPA estimates has shown that it is subject to many types of biases [14,15]. These biases are due to hardware, microphysical and geophysical factors such as anomalous propagation, beam blockage, bright band contamination, radar calibration, and range dependency, among others.
Data (both Level II and Level III) from all NEXRAD sites for the period of record are archived at the National Centers for Environmental Information (NCEI) [16] and they are now available through the NOAA Big Data partnership [17] via Amazon Web Services (AWS), Google, IBM Microsoft, and Open Geospatial Consortium (OCC). The NEXRAD Stage I DPA data are available as part of the Level III NEXRAD archive and thus are distributed as part of the package for the NEXRAD specific site by day. A complex series of scripts allowed us to extract the specific Stage I DPA data for each NEXRAD site in Alaska. Data for Alaska come from seven NEXRAD sites and have been archived since 2001. Table 1 provides information on the data availability dates, latitude, longitude, and elevation for these sites.

2.3. U.S. Climate Reference Network

The U.S. Climate Reference Network (USCRN) is a systematic and sustained network of climate monitoring stations with sites across the conterminous U.S., Alaska, and Hawaii. The primary purpose of the USCRN network is to monitor air temperature, precipitation, and soil moisture/soil temperature. In addition to these parameters, each station measures ground surface (IR) temperature, solar radiation, wind speed, relative humidity, wetness from precipitation, and several values that monitor the operating condition of the equipment. Some of the secondary parameters contribute to improving the confidence in the observational measurements, and provide insight into the reliability and performance of the primary sensors [10]. Of the parameters measured by the USCRN network, we use information on precipitation and ground surface temperature at 5 min and hourly intervals. The USCRN precipitation gauges in Alaska are surrounded by double alter or a small double fence intercomparison reference (SDFIR) shield and has a heating element in the gauge throat so this system measures snow better than standard COOP or ASOS gauges [18,19]. The U.S. Climate Reference Network’s precipitation gauges are instrumented with heaters and gauge temperature to prevent snow and ice from building up on the gauge rim. The gauge temperature serves as an indicator if the heating element has failed and used to determine if measures should be flagged. In addition, the gauges are well shielded to limit the impact of surface winds on precipitation capture, and an antifreeze mixture is added to the reservoir to ensure solid precipitation is reported as liquid-equivalent total. In addition, network stations in Alaska are equipped with backup power (gas-powered generators) to ensure the stations stay online during power failures. As result, USCRN measures of precipitation are about as reliable in Alaska as they are in CONUS. To address the network’s observed precipitation by temperature, we refer to [18], which outlines how USCRN measures of precipitation compare against the Cooperative Observer Program (COOP) measures by temperature, wind speed, and intensity. These results indicate that the gauge performed similarly to this well-established network and for the freezing-condition case, suggesting the COOP network has an under-reporting bias compared to the USCRN.
Figure 1 shows the location of the USCRN stations used in this study and Table 2 provides the information on each USCRN station in Alaska including location, commission date, minimum and maximum average hourly temperature, and the maximum hourly precipitation estimate at the gauge. The USCRN stations that are reported to MADIS [9] are most likely used in the NWS PPS system for production of the bias-adjusted precipitation estimates, which are then used in the mosaicking of the Stage IV data. However, the USCRN stations are not used in the production of the DPA data. A note about the comparisons is that the USCRN 5 min precipitation requires an initial precipitation amount of 0.2 mm in any 5 min period, which can be problematic for comparisons with radar observations. For example, it may take multiple 5 min periods to reach a 0.2 mm increment recorded in a single 5 min period, while the stratiform rain is falling at a steady but lighter rate, making it seem like the radar is underestimating precipitation rate when it is not. Therefore, we restricted comparison to whenever the rain gauge estimate was at least 0.2 mm.

2.4. Methodology

A comparison of radar rainfall estimates with rain gauges should provide a measure of their relative closeness and should take into consideration the subjectivity of comparing a gridded estimate with a point estimate [20]. There are several statistical measures that when combined can tell the story of this closeness. Many studies have provided verification studies of rain gauge versus radar precipitation estimates using measures such as bias, correlation, and some measure of error [21]. In this study, we take advantage of the information in the USCRN network that provides the corresponding air temperature at the time of the rain gauge observation so that we can stratify the relative estimates of closeness with the aim of segmenting the results by precipitation type. In this study, we use a similar temperature regime as [4] where temperatures less than zero degrees Celsius (°C) are snow, temperatures between zero °C and 2 °C are mixed phase, and temperatures above 2 C are rain. Nelson et al. [22] showed that using the co-located temperature variable from the USCRN network provided important information when evaluating different precipitation types such as snow, hail, stratiform, and tropical rainfall, among others. In their study, they found the temperature ranges that correspond to snow and cool stratiform (mixed phase) correspond to the temperature ranges we are using in this study. We compare data for the period 2017–2020 and we use the measures of bias, correlation, and fractional standard error in this study for the evaluation of the radar-based precipitation products. The rain gauge observation is assumed as the reference and the USCRN is a highly quality controlled network that provides accurate and reliable in situ measurements [18,19].
The fractional standard error (FSE) provides a measure of the error in a relative sense. The FSE is a root-mean-square error that is normalized by the average gauge value for the given condition. The normalization of the root-mean-square error allows for a comparison of the error across scales and conditions. The FSE provides a measure of the error for various conditions of rain rate defined from the rain gauge measurement (Gn) and the radar-based observation (Rn).
F S E = 1 N n = 1 N ( G n R n ) 2 1 N n = 1 N ( G n )
Correlation is defined as a measure of interdependence of variable quantities. In most radar rainfall studies the sample Pearson correlation coefficient is used as the metric to illustrate this interdependence [21]. Bias in terms of comparison of radar estimates with gauge estimates can be simply defined as the long-term ratio of the rain gauge measurement (Gn) as compared to the radar-based observation (Rn). In this study, we use a multiplicative bias defined as:
B i a s = i = 1 N R n i = 1 N G n
The rain gauge measurement (Gn) is assumed the reference, hence its summation is in the denominator (a bias value of 1.0 being unbiased).

3. Results

3.1. Long-Term Accumulations/Climatology

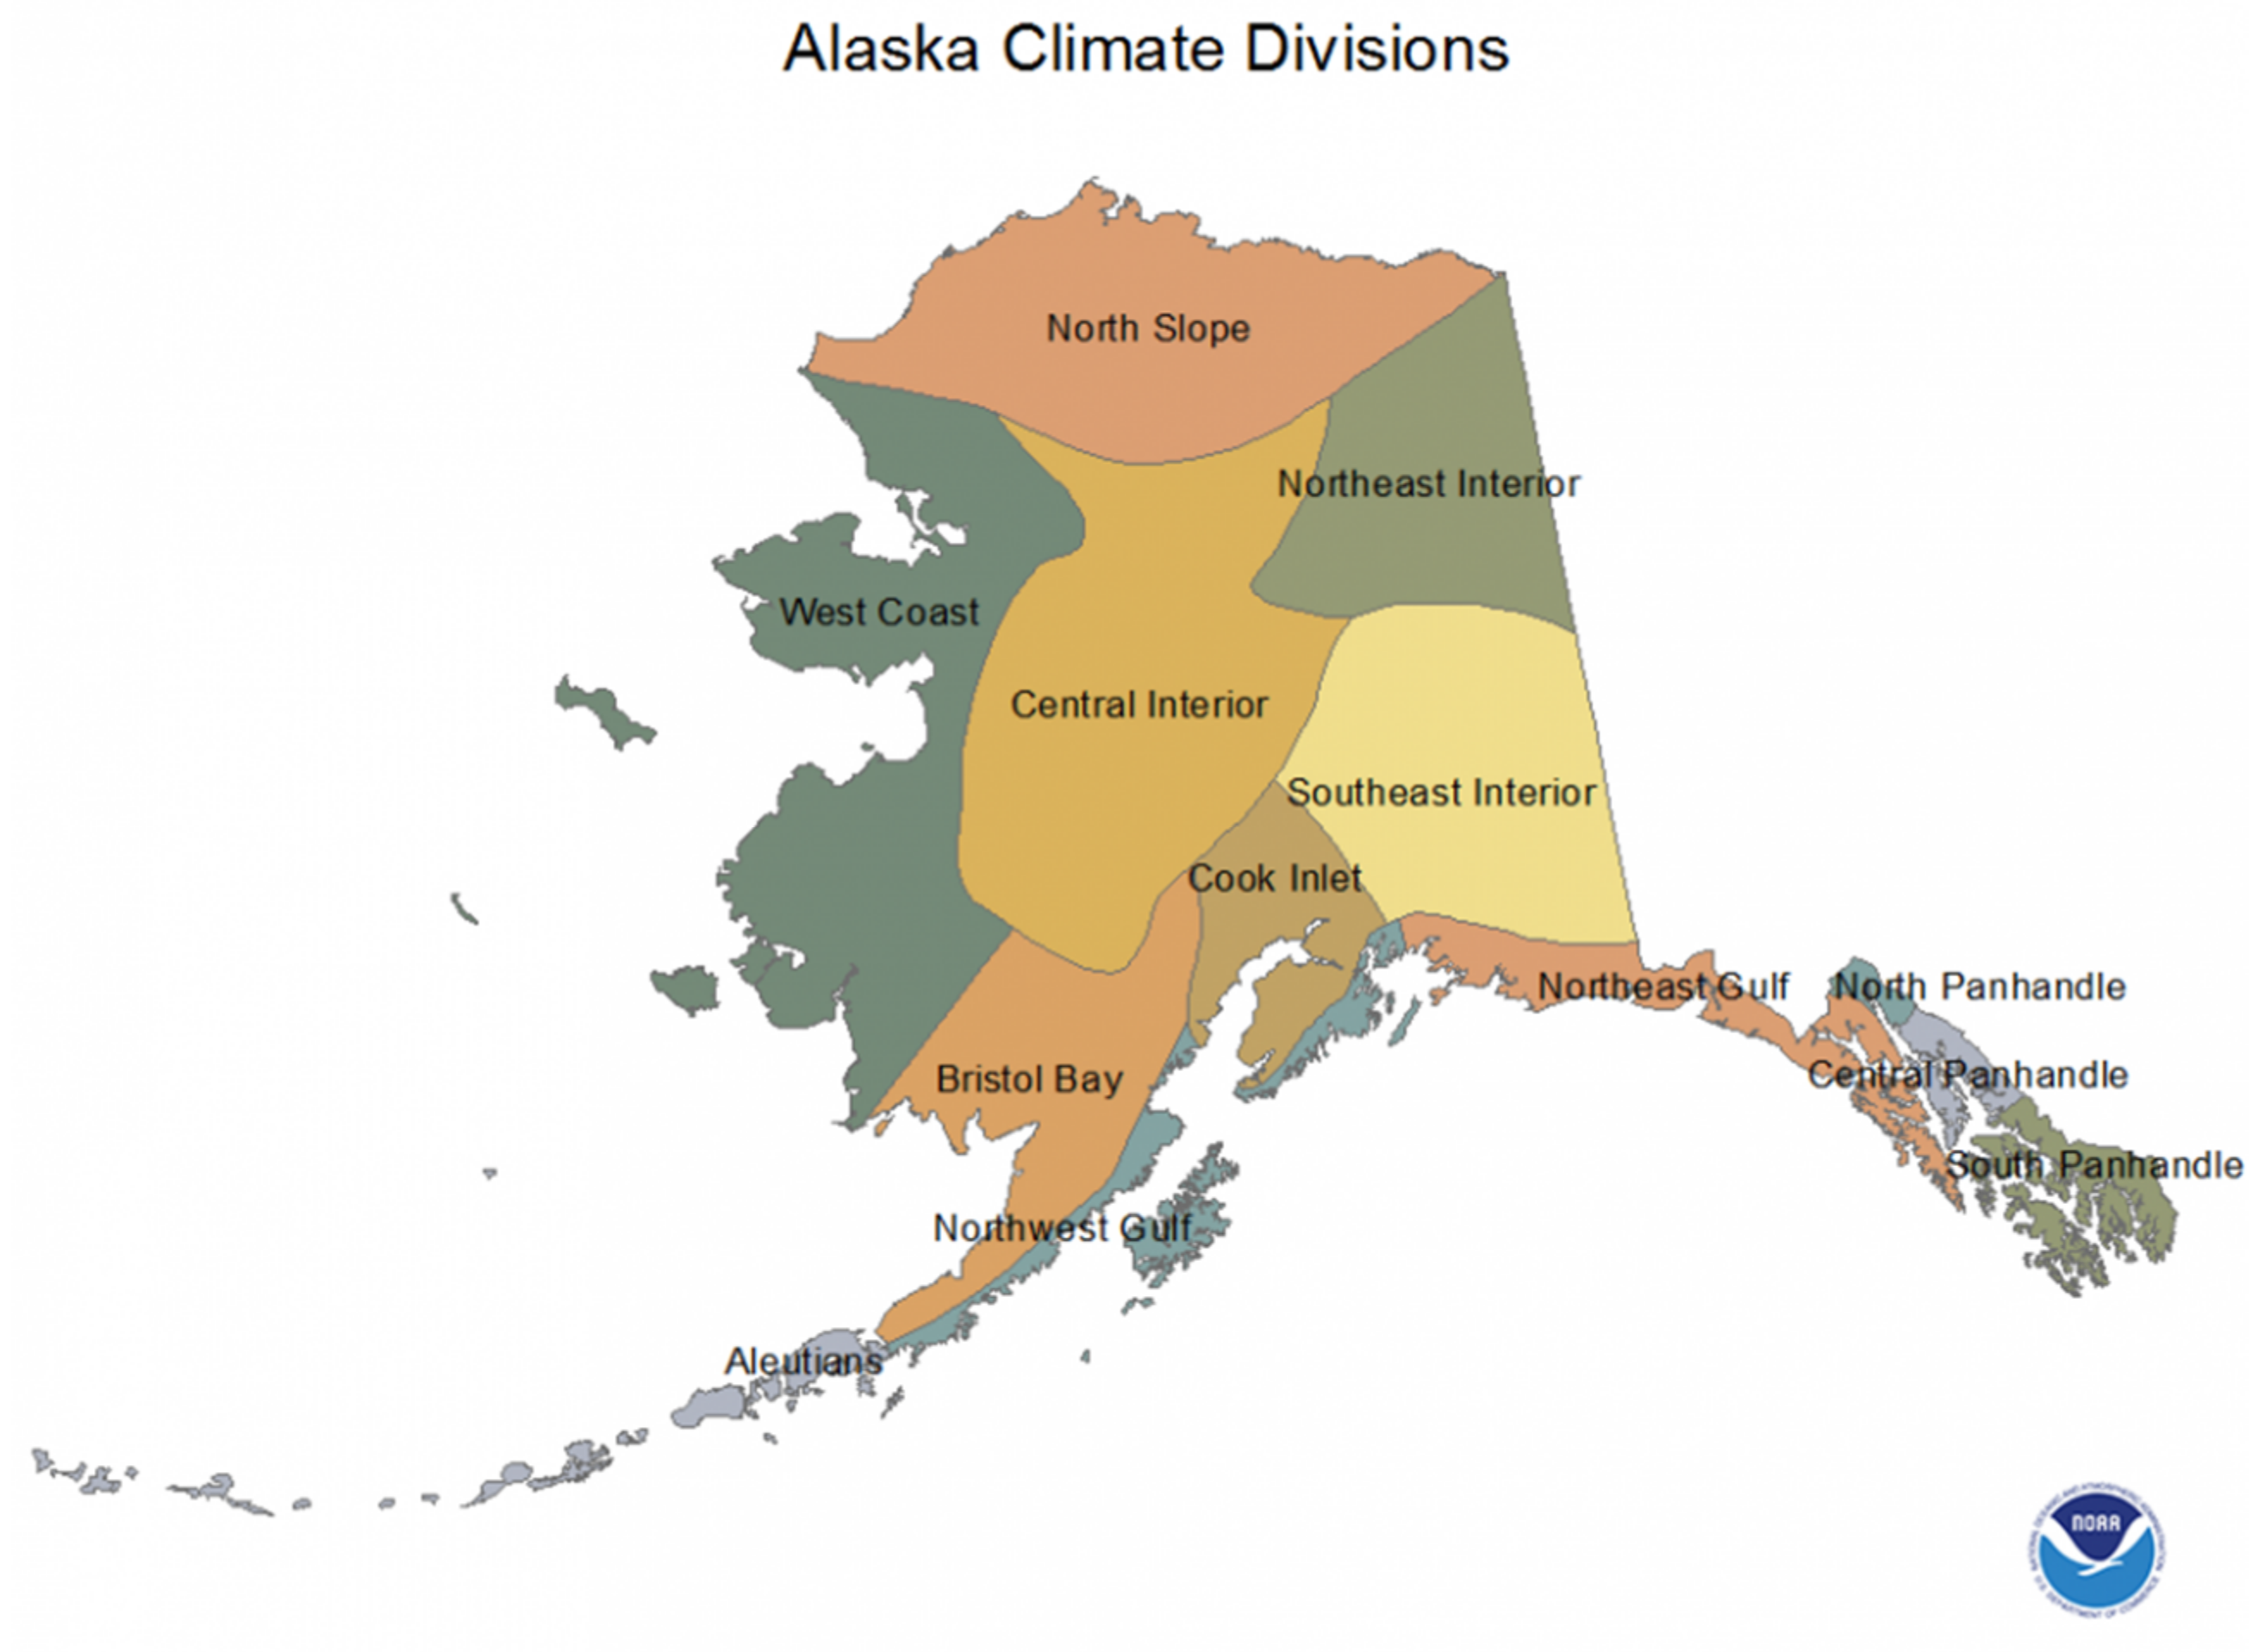
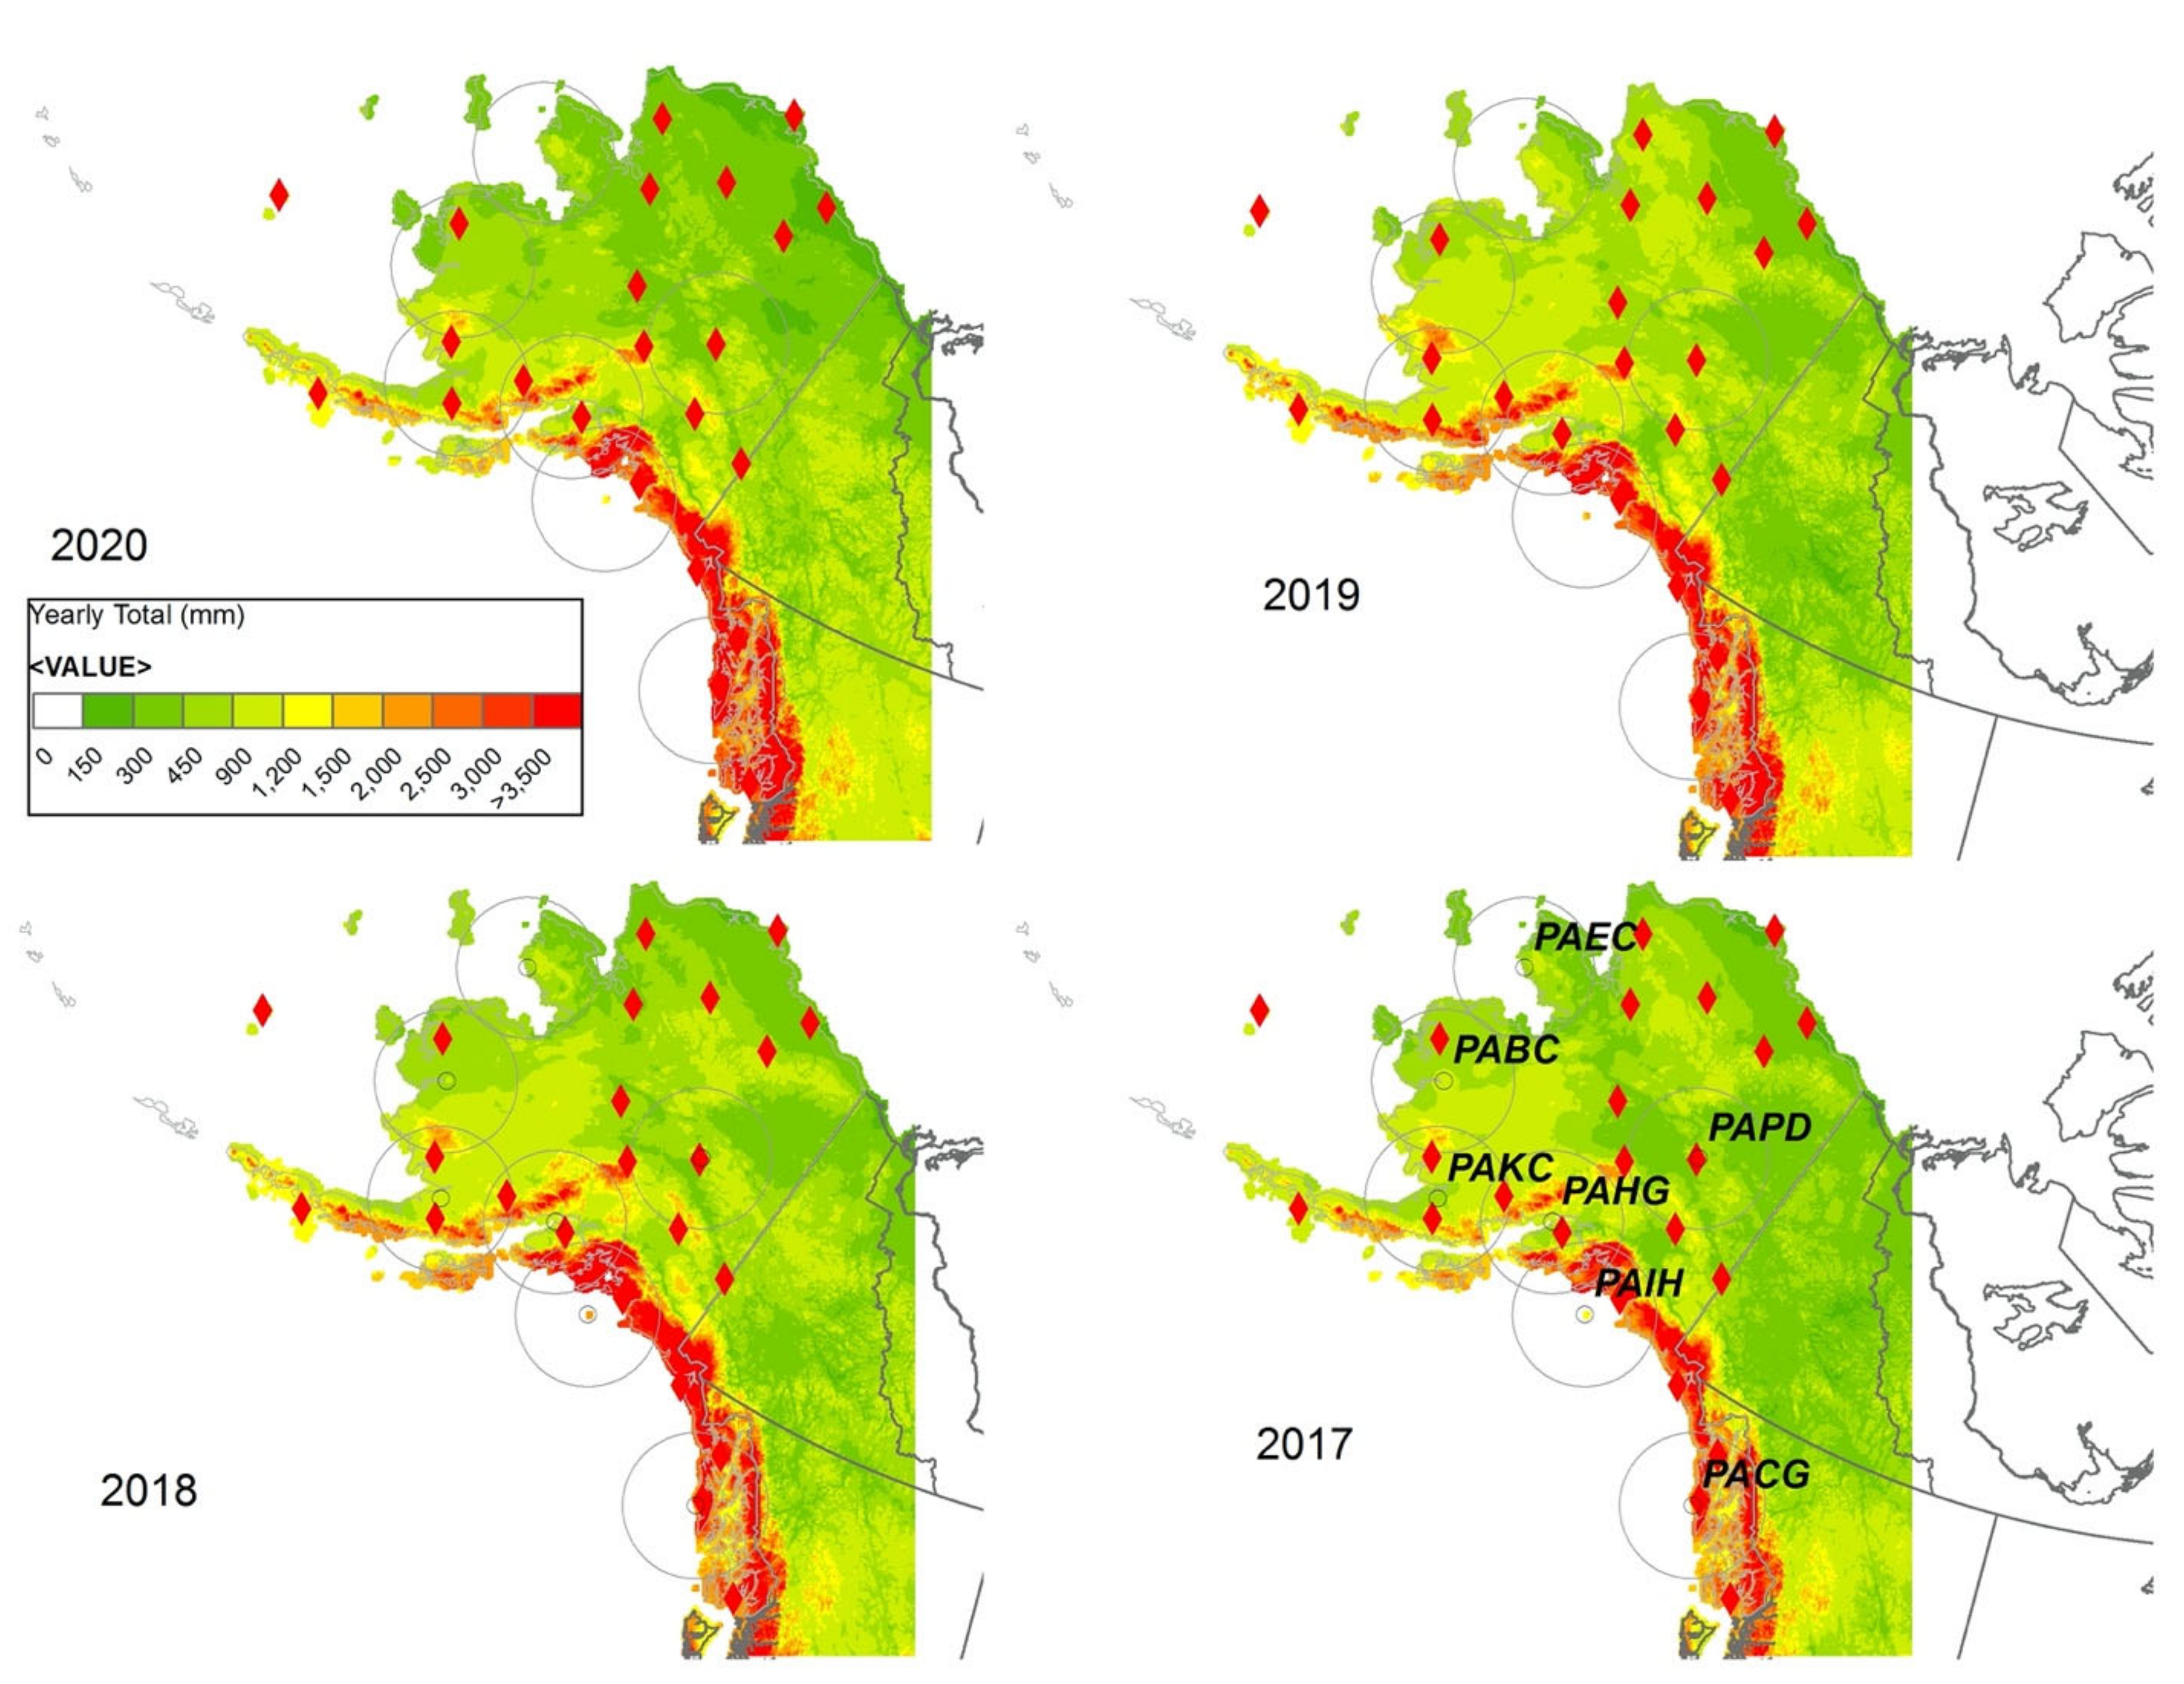
The Stage IV period of record for Alaska ranges from 2017 to present but provides one of the first interannual looks at the precipitation distribution in the state. Our analysis centers on 2017 through 2020. The state is divided into thirteen climate divisions (Figure 2). Encompassing over 660,000 square miles—more than twice the size of Texas—with over 6600 miles of coastline and a wide range of topography, Alaska has many different climates. This variable climate is evident as it relates to precipitation with large ranges in yearly precipitation (Figure 3). While the magnitudes of precipitation are largest along the coasts, there is still significant precipitation across the higher latitudes. The magnitudes of precipitation in Alaska range from 300 mm (~10 inches) per year in the North Slope and Northern Interior climate divisions [23] to greater than 3000 mm (~100 inches) per year in the coastal regions of the Panhandles (North, Central, South), Northeast and Northwest Gulf, Bristol Bay, and Cook Inlet (Figure 3). As will be discussed, the magnitudes of these values are biased low depending on the type of precipitation (frozen, mixed, rain).
The seasonal variability of precipitation over Alaska can be depicted for this short period of record by looking at Figure 4. Figure 4 shows the month when the highest 6-hourly precipitation was estimated by the Stage IV data set. What this figure tells us is that the coastal climate divisions (Aleutians, Northwest Gulf, Cook Inlet, Northeast Gulf, and the North, Central and South Panhandles) mostly see their largest 6-hourly estimates in the fall and winter months, whereas the central climate divisions (West Coast, Central Interior, and Southeast Interior) see their largest 6-hourly estimates in the summer months. In the northernmost climate divisions (North Slope and Northeast Interior), the largest 6-hourly estimates occur during the fall and winter months.
Figure 5 investigates the diurnal cycle of precipitation in Alaska based on the average hourly air temperature. In this figure we use data from the USCRN sites and extract the average hourly air temperature that is reported at the same time as the precipitation estimate. We then condition the average hourly air temperature to the following conditions: T < 0 °C, 0 °C < T < 2 °C, 2 °C < T < 10 °C, 10 °C < T. Then we determine the frequency of precipitation estimates for each hour and then normalize these by the hour with the maximum frequency for each given temperature bin. The result is Figure 5, which shows the diurnal frequency of precipitation over the day varies based on the average hourly air temperature. We present these results in local time accounting for daylight savings time. Figure 5 suggests that at the colder temperatures, less than 0 °C, the diurnal variability has more hourly precipitation during the 5:00–10:00 am time period with the frequency of precipitation varying more than the other phases. For the mixed phase temperatures, the highest frequency of hourly precipitation happens at 9:00 am During the next phase, 2–10 °C, the highest frequency of hourly precipitation happens during the 6:00–7:00 am time period, and during the warm temperatures, the highest frequency of hourly precipitation happens at 7:00 pm. An important distinction in Figure 5 is that for the frozen, mixed, and cooler temperatures, the diurnal cycle is similar across these phases with precipitation in the daytime, and that when the temperature increases, the diurnal cycle shifts to higher frequencies in the evening.

3.2. CRN versus Radar-Based Precipitation Estimates

In this section we examine the comparisons of the USCRN gauge data and the NEXRAD-based precipitation products. The USCRN gage data provide data for average hourly precipitation and average hourly air temperature as well as the minimum and maximum air temperature for the same corresponding hour. Table 2 shows the lowest minimum and largest maximum hourly temperature and the largest precipitation estimate for each USCRN site. In this study, we compare co-located gauge data with the corresponding pixel information from the Stage IV radar-based precipitation estimate or the NEXRAD DPA product. The radar-based products end on an approximately 4 km grid. Thus, the point-to-pixel comparison has a discrepancy in the point vs. areal estimates, often called representativeness error. This study is not a study to evaluate this so-called representativeness error. Numerous studies such as [20] discuss this radar error, and we do acknowledge that this radar error exists especially when comparing data using the Stage IV and DPA data in Alaska. A particular study [24] provided a detailed analysis of the theoretical error that can exist by comparing a point to a given gridded area (i.e., 4–5 km as in the Stage IV and DPA in Alaska). This error depends on the type of rain, the climatic regime, and the gridded area being compared, the temporal scale, and assumptions related to the shape of the decorrelation function. Suffice it to say, without a specific investigation in to these parameters it is difficult to assign a value to this error, but we do acknowledge that it exists in our investigation since we compare one gauge to a pixel estimate. In this study, we provide comparisons of USCRN gauge and radar-based estimates only in the NEXRAD radar overlap areas, except in some cases where we provide the comparisons for all the USCRN stations, for example, when we compare only the Stage IV data.
Figure 6 shows the point-to-pixel comparisons for the USCRN stations at the 6-hourly accumulation and the Stage IV 6-hourly accumulations for the study years 2017–2020. Remarkably, the comparison of the USCRN and Stage IV at the 6-hourly time scale show very good agreement. Given this result, we searched the MADIS database and found the USCRN is reported to MADIS in Alaska, which would result in the USCRN sites being used in the NWS PPS and hence the good agreement. Simply because the USCRN are used in the NWS PPS, it does not guarantee a perfect agreement with the point-to-pixel comparison. For this reason, we wanted to look at the radar-only precipitation estimates and compare them to the USCRN data. In this study, we use the DPA data by extracting these files from the NEXRAD Level III data set [14,17] and then extract the DPA estimate that corresponds to the USCRN site location. We plot these comparisons in Figure 6. Both scatter plots in this figure are for 6-hourly comparisons. Figure 6a shows the (dis)agreement between the USCRN and the Stage IV data in which there is a bias (underestimation of the Stage IV) as the precipitation rates increase. Figure 6b shows the (dis)agreement between the USCRN and the DPA data. There is considerably more scatter (suggesting larger errors) and more bias in this comparison.
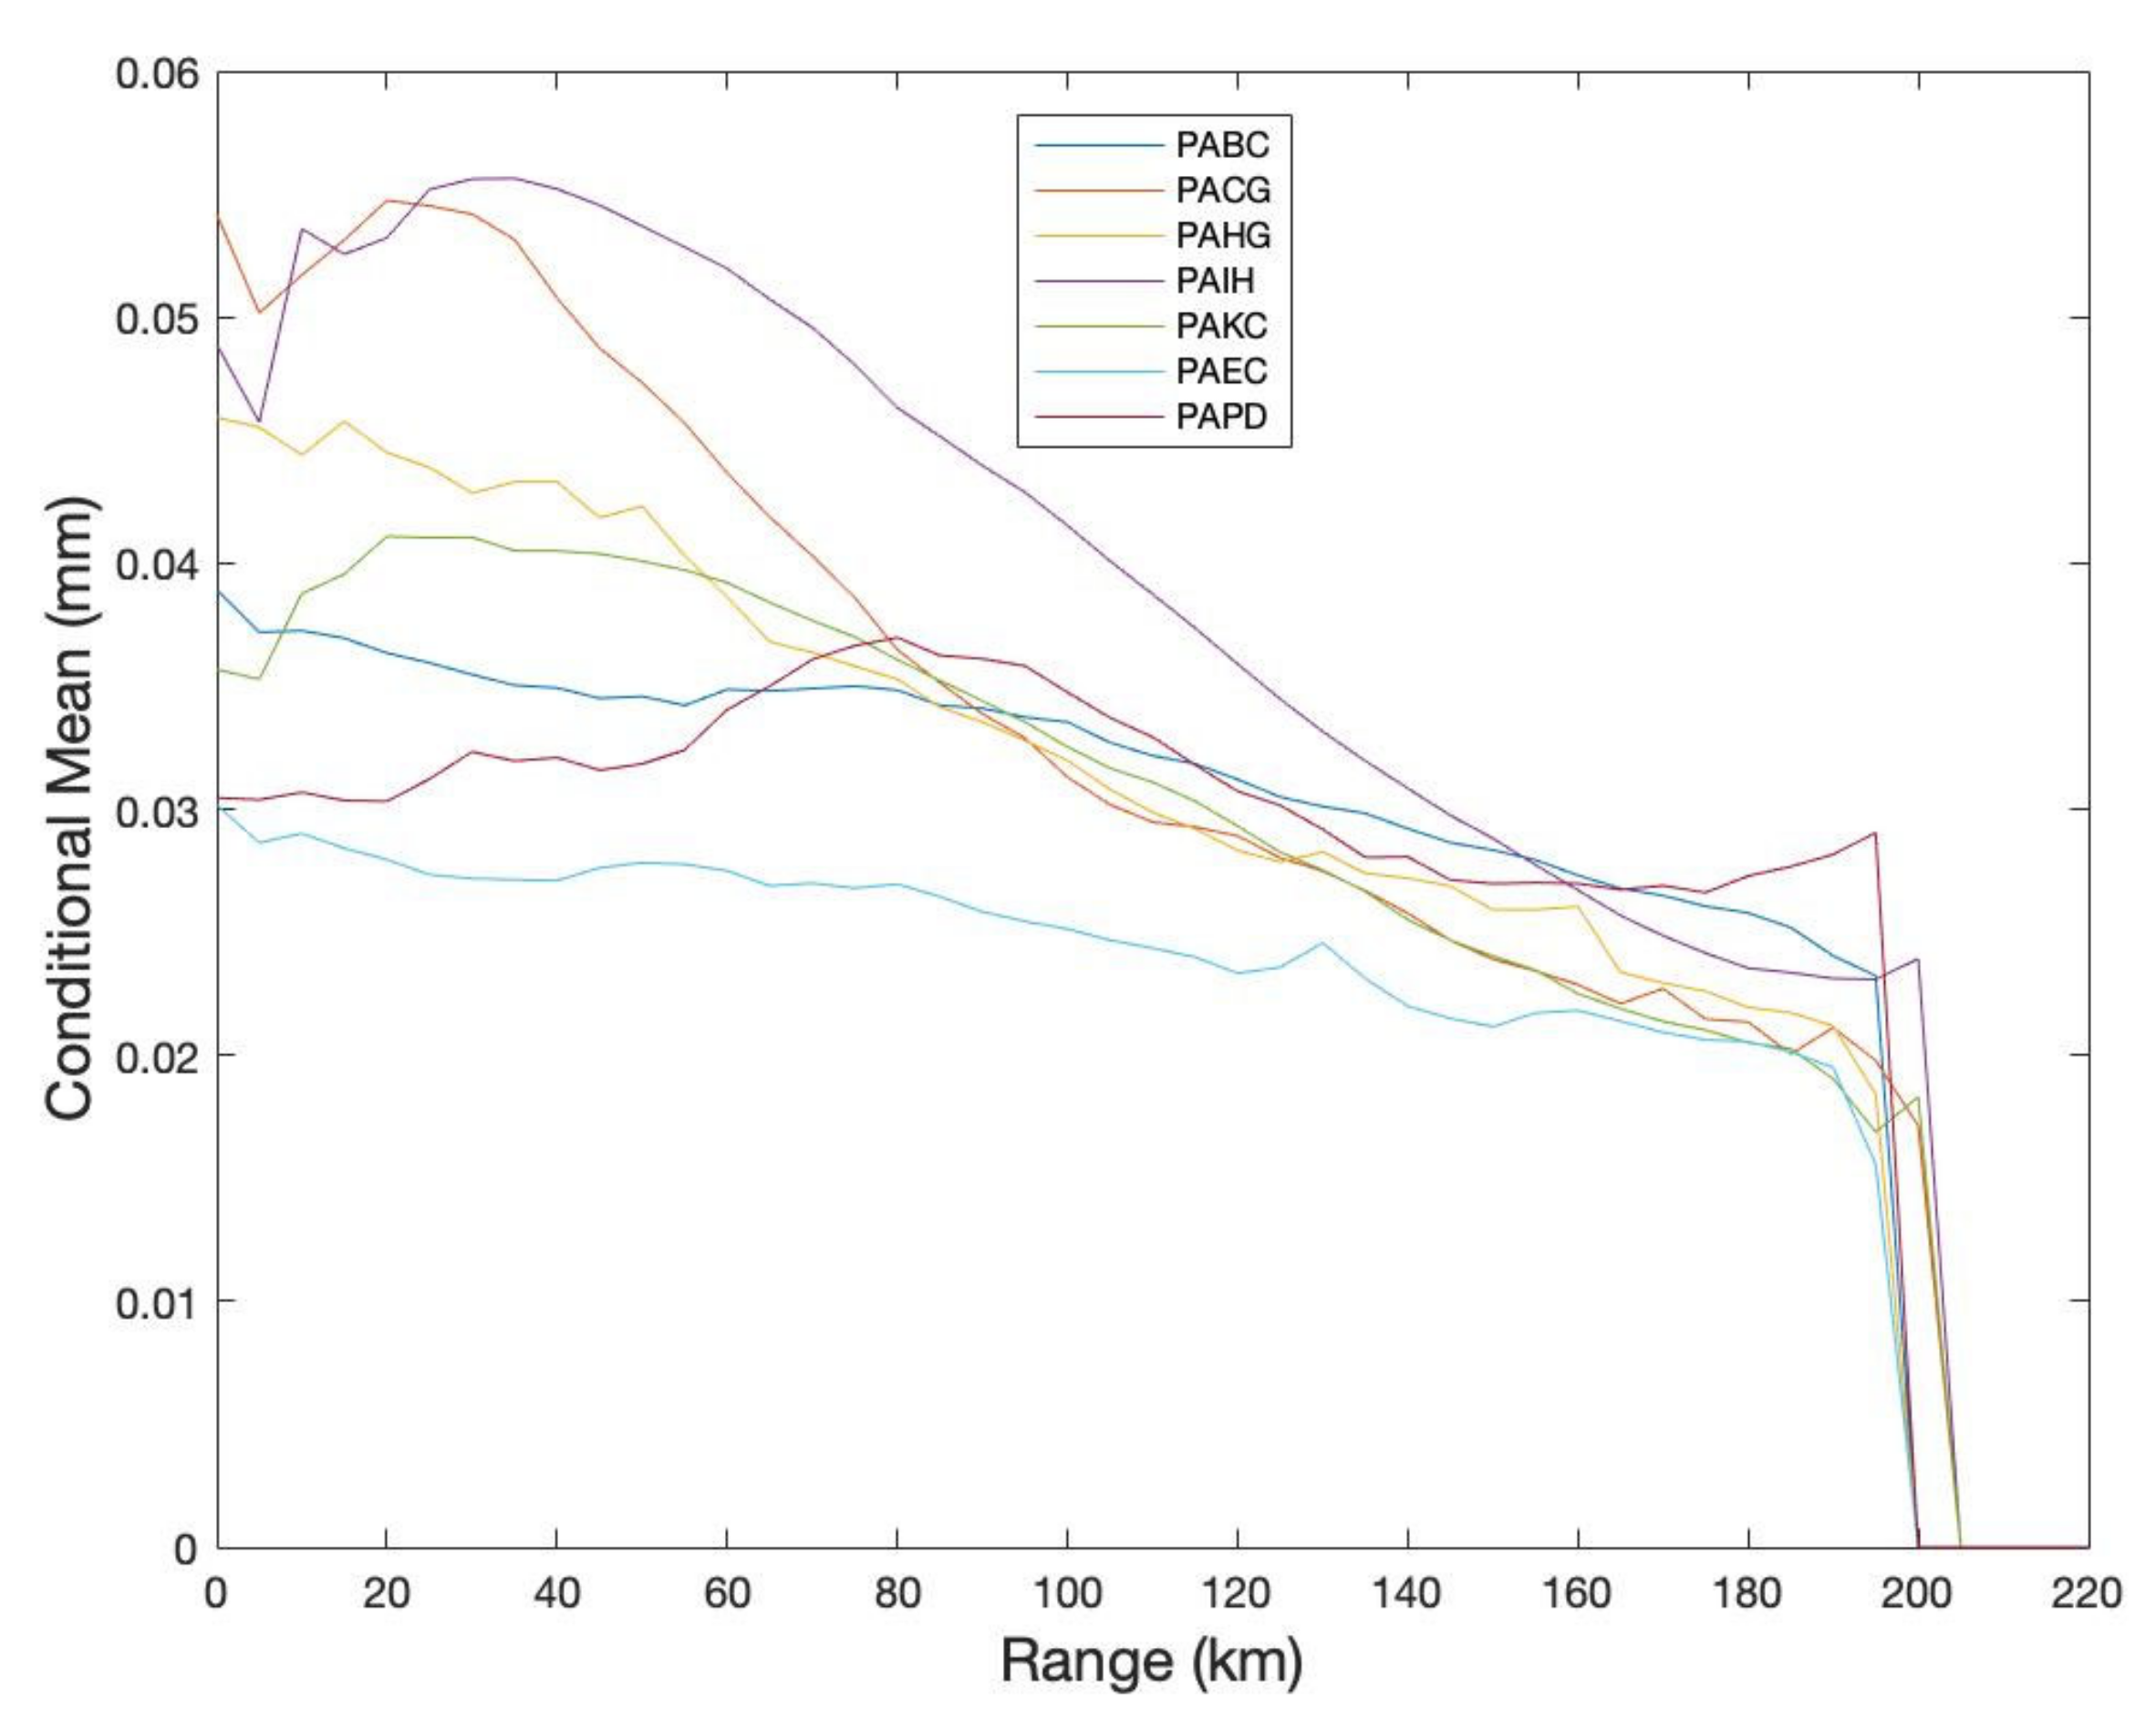
We delve deeper into the DPA product by providing the average hourly precipitation for the study period at each radar site (Figure 7). These maps of the DPA data provide an insight into the difficulties of estimating precipitation via NEXRAD in Alaska. At Sitka, AK, USA (PACG) most of the inland radar coverage is blocked by mountainous terrain. This radar site can be useful for coastal precipitation but not for inland precipitation. At Middleton Island, AK, USA (PAIH) at far ranges the radar is blocked. However, this radar could be useful for coastal precipitation. At Anchorage, AK, USA (PAHG) the radar is blocked in the northwest and southeast direction so it is only useful for precipitation estimation close to the radar. There is also significant beam return from the northeast mountains. At King Salmon, AK, USA (PAKC) the radar is blocked to the southeast, but the radar could be useful for precipitation estimation at other locations in the radar umbrella. At Nome, AK, USA (PAEC) and Fairbanks, AK, USA (PAPD) the radar suffers from beam blockage and serious range effect, most likely due to low-level rain and snow events thus limiting the effective range of the radar. The radar at Bethel, AK, USA (PABC) appears to have the most unobstructed area with only a sliver of beam blockage. We also synthesize these radar coverage issues in Figure 8. This figure shows the conditional mean precipitation for a given range from the radar. These conditional means are normalized by the number of pixels in that given range from the radar. The figure shows the effective range of the radar given all these issues for “usability” of the radar for precipitation estimation. For all radars there is a range close to the radar that is difficult for precipitation estimation. This is the so-called cone of silence. Therefore, the Alaska radars have a range from about 5 km to about 80 km that is somewhat useful for precipitation estimation. For most of the Alaska, radars at ranges past 80 km the conditional mean of precipitation reduces significantly, indicating that the radar is missing certain precipitation echoes either due to how high the beam is in the atmosphere related to the clouds or due to beam blockage.
Given these issues related to radar estimation of precipitation, we still feel it useful to use the unadjusted DPA precipitation estimates for comparisons to the gauge estimates. Providing that the USCRN has information on air temperature, we are able to evaluate the gauge and radar estimates based on temperature and then show how the NWS PPS products improve in stages from radar-only products to gauge-adjusted products.

3.3. Radar-Based Precipitation Performance

The USCRN gauges provide information on the hourly average, maximum, and minimum air temperature. In this study, we use the hourly average air temperature to condition the evaluation of the precipitation estimates. Figure 9 provides information on the frequency of precipitation given the hourly average air temperature. We use conditions of T < 0 °C (frozen), 0 °C < T < 2 °C (mixed), 20 °C < T < 10 °C (seasonal), and 10 °C < T (warm) as discussed in Section 2.4, where T is the hourly average air temperature at the USCRN site. As can be seen in the figure, most of the precipitation in Alaska happens in the 2–10 °C temperature range (approximately 45%). However, there is significant precipitation both at the <0 °C and 0 °C < T < 2 °C range (snow and mixed)—greater than 30%. In addition, precipitation in the >10 °C range is approximately 20% with a very low frequency of precipitation at >20 °C. We also provide information on precipitation frequency by phase in Table 3 for each USCRN location. The table shows the highly variable phases of precipitation across the state as they are reported at the USCRN site.
Given these conditions on when the hourly or 6-hourly rainfall happens, we evaluate the following comparisons of precipitation estimates. First, we compare the USCRN with the hourly DPA estimate and then we accumulate these values to the 6-hourly scale in order to make a comparison with the 6-hourly Stage IV data. Figure 10 shows the bias, correlation, and fractional standard error as defined in Section 2 for each of the conditions of the air temperature bins. In terms of bias, a value of 1.0 would signify that the NEXRAD-based precipitation estimate agrees with the gauge-based precipitation observation. Values less than 1.0 signify that the NEXRAD-based product underestimates precipitation as compared to the gauge-based observation. Figure 10 (top panel) shows that for the frozen/snow (<0 °C) condition, all products underestimate precipitation (0.35–0.45) as compared to the gauge estimates. Of note is that the 6-hourly DPA data bias is slightly better than the 6-hourly Stage IV bias (0.45 vs. 0.4). Figure 10 (top panel) shows a large improvement in bias in the mixed (0 °C < T < 2 °C) condition with the bias improving significantly even to almost 1.0 for the 6-hourly DPA. In the mixed phase, Figure 10 (top panel) shows the DPA products (hourly and 6-hourly) (0.9, 0.98 vs. 0.78) have an improved bias as compared to the 6-hourly stage IV product. The bias in the cool/seasonal (2 °C < T < 10 °C) (Figure 10 top panel) ranges from 0.8 to 0.9 for the hourly DPA to the 6-hourly stage IV, and the bias in the warm (>10 °C) condition ranges from 0.7 to 0.85 for hourly DPA to the 6-hourly stage IV.
Figure 10 (middle panel) shows the correlation when comparing the NEXRAD-based precipitation estimates with the rain gauge observations. A value of 1.0 shows a perfect relation between two variables—in this case the radar-based observation versus the rain-gauge-based observation. In practice, there is never a perfect relation so the measures of correlation in precipitation analysis provide a look at how close the measurements are in general. Figure 10 (middle panel) shows that the correlation improves from the hourly DPA to the 6-hourly DPA to the 6-hourly Stage IV for each of the precipitation phases (frozen, mixed, cool, warm). Figure 10 (middle panel) shows in the frozen phase that the correlations range from 0.18 to 0.42. In the mixed phase, the correlation ranges from 0.4 to 0.78. In the cool phase, the correlation ranges from 0.5 to 0.9 and in the warm phase the correlation ranges from 0.65 to 0.9.
Figure 10 (bottom panel) shows the fractional standard error (FSE) when comparing the NEXRAD-based precipitation estimates with the rain gauge observations. The FSE is the root-mean-square error (RMSE) normalized by the average rain gauge value, which allows us to make comparisons across the scale of the hourly estimates versus the 6-hourly estimate. The RMSE is a measure of the data spread and thus a smaller RMSE would show how close the NEXRAD-based products and the rain-gauge-based observations are to the best fit line (not shown). As a measure of error, the smaller FSE (or scaled RMSE) indicates a smaller error in the radar-based precipitation estimate as the rain-gauge observation is considered the “truth”. Figure 10 (bottom panel) shows that for the frozen phase and the mixed phase the FSE increased for the 6-hourly DPA as compared to the hourly DPA, but then the 6-hourly Stage IV has a smaller FSE in these phases. For the frozen phase, the FSE ranges from 1.55 to 1.80 to 1.50. For the mixed phase, the FSE ranges from 1.94 to 2.03 to 0.92. For the cool phase, the FSE ranges from 1.37 to 1.35 to 0.55, and for the warm phase, the FSE ranges from 1.06 to 1.03 to 0.6.

4. Discussion

In this study, we present an investigation into the NEXRAD-based precipitation products that are available for Alaska. The products we evaluate are the hourly DPA, the 6-hourly DPA, and the NCEP Stage IV 6-hourly precipitation, which are compared to the hourly USCRN in situ network of precipitation and temperature observations. Our investigation focuses on varying scales from yearly average precipitation to the diurnal variability of precipitation to an analysis of the hourly and 6-hourly precipitation estimates as they compare to the in situ rain-gauge observations. Given that the Stage IV product is available from 2017 to present and has only recently been made available, this study provides a new investigation into the precipitation of Alaska. This study is intended to be a supplement to developers and users of satellite-based precipitation estimates. By providing measures of the various scales of precipitation in Alaska along with some measure of the performance of the NEXRAD-based products, developers and users of satellite-based precipitation products can use this information for verification and validation of their products. In addition, providing accurate estimates of precipitation in Alaska is challenging but important for NWS weather forecast offices [24]; river forecast centers [25]; state emergency managers, tourism and industry (i.e., fishing) [26]; and climate models [27]. Given that population centers are concentrated on the coasts and in the lower elevations of river valleys, forecasts and observations of snow, flood stage, and rain storms are extremely important for warnings, analysis, and verification.
In general, the NEXRAD-based precipitation products provide information on the interannual variability of precipitation across the 660,000 square miles that span approximately 20° latitude from 50 N to 70 N. With the information we gained from the USCRN network, we showed the diurnal precipitation as it relates to specific temperature regimes that relate to specific precipitation such as frozen, mixed, cool, and warm phases. We also evaluated each NEXRAD site in Alaska. The effective coverage of the NEXRAD radars in Alaska is affected by beam blockage from mountains, the type of precipitating clouds (i.e., low level stratiform versus high level convection), and other atmospheric conditions, which limit the range of the NEXRAD radars to about 80 km. Next, the investigation into the frequency of precipitation showed a significant percentage of precipitation in the frozen and mixed phase (approximately 30%). We were able to evaluate the performance of the NEXRAD-based precipitation products. The specific values related to bias, correlation, and error are provided in Section 3.3 and Figure 10. We found that for some statistics for certain precipitation phases, the NEXRAD DPA data performs better than the Stage IV data. For instance, the bias and the error in the frozen and mixed phase appear less biased and smaller (respectively) as compared to the Stage IV data. For these phases (frozen and mixed), it appears that the NEXRAD precipitation processing system at the specific radar site is tuned for the climate. We do acknowledge that the well-known representativeness error that exists in comparisons of in situ data and gridded data could manifest in the error statistics, and given that the USCRN gauges require 0.2 mm in a given 5 min increment, there can be an appearance of low bias in the radar observations. In addition, the Stage IV data follow a slightly different processing scheme in that it incorporates all available in situ information. In the frozen and mixed phases, it is possible that this could introduce data that is biased and error prone. The statistical analysis shows that estimating precipitation in the frozen and mixed phases still poses challenges. The radar-based products underestimate precipitation. The correlation is quite low in these phases of temperature and the errors (FSE) are large. When the temperatures increase, the statistical analysis shows that the biases improve (closer to 1.0). In addition, the correlations improve (closer to 1.0) and the errors (FSE) reduce drastically.

5. Conclusions

In this study, we present an investigation into the NEXRAD-based precipitation products that are available for Alaska. The products we evaluate are the hourly digital precipitation array (DPA), the 6-hourly DPA, and the NCEP Stage IV 6-hourly precipitation, which are compared to the hourly USCRN in situ network of precipitation and temperature observations. Based on comparisons of data from 2017 to 2020, we present the following conclusions.
  • Yearly precipitation in Alaska ranges from 150 mm in the highest latitude to 3500 mm in the Panhandle regions.
  • Maximum 6-hourly precipitation based on the NCEP Stage IV data set generally happens in the fall for the coastal and Panhandle climate regions, in the summer for the interior climate regions, and in the winter/fall for the high latitudes.
  • For air temperatures less than 10 °C, the frequency of precipitation is highest during the morning hours of 5:00–10:00 a.m. local. For air temperatures greater than 10 °C, the highest frequency of precipitation shifts to the early evening hours of 5:00–7:00 p.m.
  • Approximately 30% of precipitation in Alaska is frozen or mixed phase. Approximately 45% of precipitation in Alaska happens in the 2–10 °C temperature range and approximately 20% of precipitation happens in the 10–20 °C temperature range. There is a very low frequency of precipitation when temperatures are >20 °C.
  • An analysis of the NEXRAD site-specific DPA showed the effective coverage of the radar to be approximately 80 km. The Nome, AK, USA (PAEC) site shows an effective coverage even less than this with a particular low bias in conditional mean as compared to the other NEXRAD sites in Alaska.
  • The statistical analysis shows that estimating precipitation in the frozen and mixed phases still poses challenges. The radar-based products underestimate precipitation. The correlation is quite low in these phases of temperature, and the errors (FSE) are large. When the temperatures increase, the statistical analysis shows that the biases improve (closer to 1.0). In addition, the correlations improve (closer to 1.0) and the errors (FSE) reduce drastically.

Author Contributions

Formal analysis, B.R.N.; writing—original draft preparation, B.R.N.; writing—review and editing, O.P.P. and R.D.L. All authors have read and agreed to the published version of the manuscript.

Funding

This research received no external funding.

Institutional Review Board Statement

Not applicable.

Informed Consent Statement

Not applicable.

Data Availability Statement

Data available in a publicly available repository that does not issue DOIs. Publicly available data were analyzed in this study. These data can be found at https://www.ncei.noaa.gov/access/metadata/landing-page/bin/iso?id=gov.noaa.ncdc:C00708, https://www.ncei.noaa.gov/access/crn/, https://data.eol.ucar.edu/dataset/21.093 accessed on 5 July 2021.

Acknowledgments

We would like to acknowledge the input from an anonymous reviewer whose comments helped improve the manuscript.

Conflicts of Interest

The authors declare no conflict of interest.

References

  1. Kane, D.L.; Stuefer, S.L. Reflecting on the Status of Precipitation Data Collection in Alaska: A Case Study. Hydrol. Res. 2014, 46, 478–493. [Google Scholar] [CrossRef]
  2. Norin, L.; Devasthale, A.; L’Ecuyer, T.; Wood, N.B.; Smalley, M. Intercomparison of Snowfall Estimates Derived from the CloudSat Cloud Profiling Radar and the Ground-Based Weather Radar Network over Sweden. Atmospheric Meas. Tech. 2015, 8, 5009–5021. [Google Scholar] [CrossRef] [Green Version]
  3. Smalley, M.; L’Ecuyer, T.; Lebsock, M.; Haynes, J. A Comparison of Precipitation Occurrence from the NCEP Stage IV QPE Product and the CloudSat Cloud Profiling Radar. J. Hydrometeorol. 2014, 15, 444–458. [Google Scholar] [CrossRef]
  4. Smalley, M.; Kirstetter, P.-E.; L’Ecuyer, T. How Frequent Is Precipitation over the Contiguous United States? Perspectives from Ground-Based and Spaceborne Radars. J. Hydrometeorol. 2017, 18, 1657–1672. [Google Scholar] [CrossRef]
  5. Klazura, G.E.; Imy, D.A. A Description of the Initial Set of Analysis Products Available from the NEXRAD WSR-88D System. Bull. Am. Meteorol. Soc. 1993, 74, 1293–1311. [Google Scholar] [CrossRef] [Green Version]
  6. Beck, H.E.; Vergopolan, N.; Pan, M.; Levizzani, V.; van Dijk, A.I.J.M.; Weedon, G.P.; Brocca, L.; Pappenberger, F.; Huffman, G.J.; Wood, E.F. Global-Scale Evaluation of 22 Precipitation Datasets Using Gauge Observations and Hydrological Modeling. Hydrol. Earth Syst. Sci. 2017, 21, 6201–6217. [Google Scholar] [CrossRef] [Green Version]
  7. National Weather Service Headquarters Silver Spring, MD. Service Change Notice 17-17. 2017. Available online: https://www.weather.gov/media/notification/pdfs/scn17-17rtma_urma_aaa.pdf (accessed on 1 February 2021).
  8. Nelson, B.R.; Prat, O.; Seo, D.-J.; Habib, E. Assessment and Implications of NCEP Stage IV Quantitative Precipitation Estimates for Product Intercomparisons. Weather Forecast. 2016, 31, 371–394. [Google Scholar] [CrossRef]
  9. Miller, P.A.; Barth, M.; Benjamin, L.; Helms, D.; Campbell, M.; Facundo, J.; O’Sullivan, J. The Meteorological Assimilation Data Ingest System (MADIS)—Providing Value-Added Observations to the Meteorological Community. In Proceedings of the 21st Conference on Weather Analysis and Forecasting/17th Conference on Numerical Weather Prediction, Washington, DC, USA, 1 August 2005. [Google Scholar]
  10. Diamond, H.J.; Karl, T.R.; Palecki, M.A.; Baker, C.B.; Bell, J.E.; Leeper, R.D.; Easterling, D.R.; Lawrimore, J.H.; Meyers, T.P.; Helfert, M.R.; et al. Climate Reference Network After One Decade of Operations: Status and Assessment. Bull. Am. Meteorol. Soc. 2012, 94, 489–498. [Google Scholar] [CrossRef] [Green Version]
  11. Fulton, R.A.; Breidenbach, J.P.; Seo, D.-J.; Miller, D.A.; O’Bannon, T. The WSR-88D Rainfall Algorithm. Weather Forecast. 1998, 13, 377–395. [Google Scholar] [CrossRef]
  12. Lin, Y.; Mitchell, K.E. The NCEP Stage II/IV Hourly Precipitation Analyses: Development and Applications. In Proceedings of the 19th Conference on Hydrology, San Diego, CA, USA, 9–13 January 2005. [Google Scholar]
  13. Smith, J.A.; Seo, D.J.; Baeck, M.L.; Hudlow, M.D. An Intercomparison Study of NEXRAD Precipitation Estimates. Water Resour. Res. 1996, 32, 2035–2045. [Google Scholar] [CrossRef]
  14. Young, C.B.; Nelson, B.R.; Kruger, A.; Baeck, M.L.; Peters-Lidard, C.D.; Bradley, A.A.; Smith, J.A. An Evaluation of NEXRAD Precipitation Estimates in Complex Terrain. J. Geophys. Res. Space Phys. 1999, 104, 19691–19703. [Google Scholar] [CrossRef]
  15. Droegemeier, K.; Levit, J.J.; Kelleher, K.; Crum, T.D.; Delgreco, S.A.; Miller, L.; Fulker, D.W.; Edmon, H. Project CRAFT: A Test Bed for Demonstrating the Real Time Acquisition and Archival of WSR-88D Level II Data. In Proceedings of the 18th International Conference on IIPS, Orlando, FL, USA, 12–17 January 2002. [Google Scholar]
  16. Ansari, S.; Del Greco, S.; Kearns, E.; Brown, O.; Wilkins, S.; Ramamurthy, M.; Weber, J.; May, R.; Sundwall, J.; Layton, J.; et al. Unlocking the Potential of NEXRAD Data through NOAA’s Big Data Partnership. Bull. Am. Meteorol. Soc. 2018, 99, 189–204. [Google Scholar] [CrossRef]
  17. Leeper, R.; Rennie, J.; Palecki, M.A. Observational Perspectives from U.S. Climate Reference Network (USCRN) and Cooperative Observer Program (COOP) Network: Temperature and Precipitation Comparison. J. Atmospheric Ocean. Technol. 2015, 32, 703–721. [Google Scholar] [CrossRef]
  18. Leeper, R.; Palecki, M.A.; Davis, E. Methods to Calculate Precipitation from Weighing-Bucket Gauges with Redundant Depth Measurements. J. Atmospheric Ocean. Technol. 2015, 32, 1179–1190. [Google Scholar] [CrossRef]
  19. Kitchen, M.; Blackall, R. Representativeness Errors in Comparisons Between Radar and Gauge Measurements of Rainfall. J. Hydrol. 1992, 134, 13–33. [Google Scholar] [CrossRef]
  20. Habib, E.; Krajewski, F.W.; Ciach, G.J. Estimation of Inter-Station Correlation Coefficient in Rainfall Data. J. Hydrometeorol. 2001, 2, 621–629. [Google Scholar] [CrossRef]
  21. Nelson, B.R.; Prat, O.P.; Leeper, R. Using Ancillary Information from Radar-Based Observations and Rain Gauges to Identify Error and Bias. J. Hydrometeorol. 2021, 1, 1249–1258. [Google Scholar] [CrossRef]
  22. Bieniek, P.A.; Walsh, J.E.; Thoman, R.L.; Bhatt, U.S. Using Climate Divisions to Analyze Variations and Trends in Alaska Tem-Perature and Precipitation. J. Clim. 2014, 27, 2800–2818. [Google Scholar] [CrossRef]
  23. Krajewski, W.F.; Ciach, G.J.; Habib, E. An Analysis of Small-Scale Rainfall Variability in Different Climatic Regimes. Hydrol. Sci. J. 2003, 48, 151–162. [Google Scholar] [CrossRef] [Green Version]
  24. Monaghan, A.J.; Clark, M.P.; Barlage, M.P.; Newman, A.J.; Xue, L.; Arnold, J.R.; Rasmussen, R.M. High-Resolution Historical Climate Simulations over Alaska. J. Appl. Meteorol. Clim. 2018, 57, 709–731. [Google Scholar] [CrossRef]
  25. Poujol, B.; Prein, A.F.; Newman, A.J. Kilometer-Scale Modeling Projects a Tripling of Alaskan Convective Storms in Future Climate. Clim. Dyn. 2020, 55, 3543–3564. [Google Scholar] [CrossRef]
  26. Markon, C.J.; Trainor, S.F.; Chapin, F.S. The United States National Climate Assessment—Alaska Technical Regional Report; US Geological Survey: Reston, VA, USA, 2012. [CrossRef]
  27. Bennett, K.E.; Walsh, J. Spatial and Temporal Changes in Indices of Extreme Precipitation and Temperature for Alaska. Int. J. Clim. 2015, 35, 1434–1452. [Google Scholar] [CrossRef]
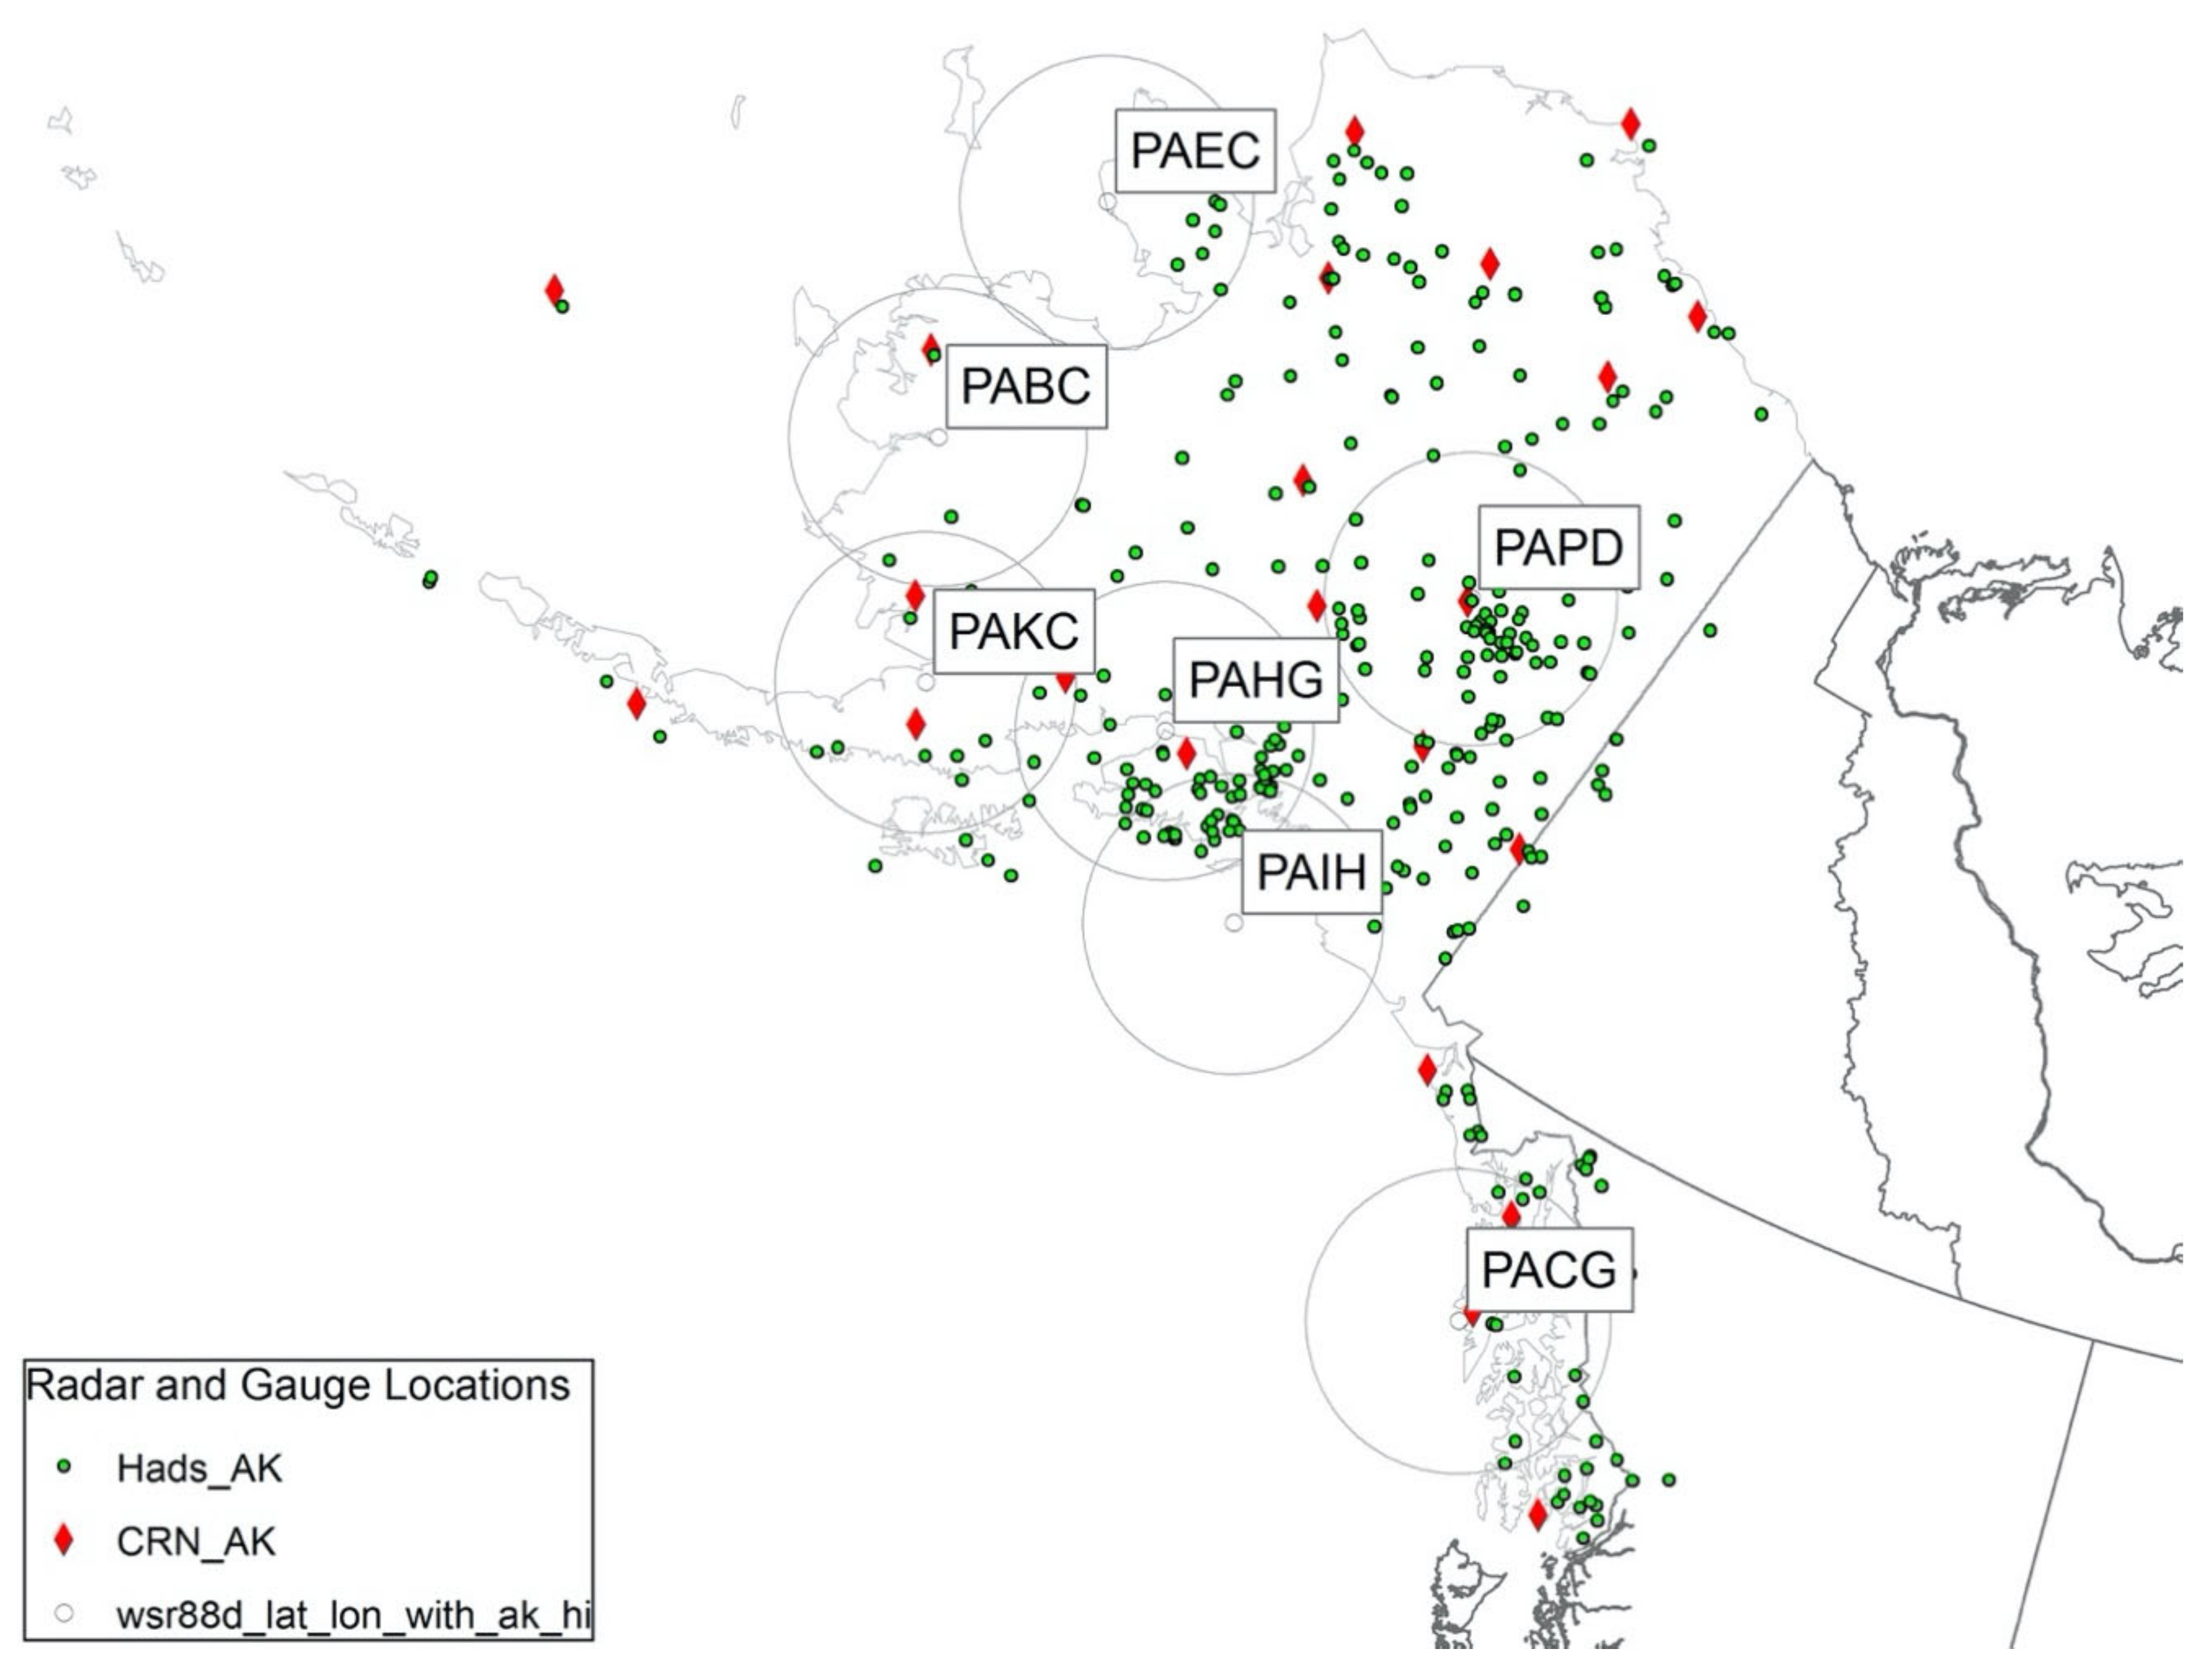
Figure 1. Locations of NEXRAD radar sites, USCRN gauges, and Hydrometeorological Automated Data System (HADS) sites. Table 1 provides information on each NEXRAD radar site.
Remotesensing 13 03202 g001
Figure 2. Alaska climate divisions. (source https://www.ncdc.noaa.gov/file/alaska-climate-divisions.png (accessed on 5 July 2021)). Reproduced with permission of NOAA.
Remotesensing 13 03202 g002
Figure 3. Yearly precipitation accumulation for Stage IV product that is available from 2017 to present. Red diamonds show the location of USCRN stations used in the study. The seven NEXRAD sites are shown for reference with their 230 km range rings.
Remotesensing 13 03202 g003
Figure 4. Month of the maximum 6-hourly precipitation estimate for the period 2017–2020 taken from the Stage IV precipitation data set.
Remotesensing 13 03202 g004
Figure 5. The hour that provides the maximum hourly precipitation estimate given the average hourly air temperature at the time of observation (local time). The frequency is normalized by the hour with the maximum.
Remotesensing 13 03202 g005
Figure 6. The 6-hourly comparison of USCRN gauge estimate versus the given NEXRAD radar-based estimate (a) the NCEP Stage IV product and (b) the radar site specific digital precipitation array.
Remotesensing 13 03202 g006
Figure 7. Long-term (2017–2020) average hourly precipitation at each NEXRAD radar site.
Remotesensing 13 03202 g007
Figure 8. Conditional (greater than zero) average precipitation by range bin for each NEXRAD radar site.
Remotesensing 13 03202 g008
Figure 9. Frequency of rainfall given the average hourly temperature at the time of the rainfall observation. Table 3 shows the frequency of rainfall given the average hourly temperature for each USCRN site location.
Remotesensing 13 03202 g009
Figure 10. Bias, correlation, and FSE for each set of data, given the corresponding average hourly temperature observation.
Remotesensing 13 03202 g010
Table 1. Alaska NEXRAD sites.
Site IDLocationLevel III AvailableLatitude (°)Longitude (°)Elevation (m)
PABCBethel, AK, USA1 May 200160.79−161.88162
PAHGAnchorage, AK, USA1 May 200160.73−151.35242
PAPDFairbanks, AK, USA1 May 200165.04−147.502593
PAKCKing Salmon, AK, USA1 May 200158.68−156.6363
PAIHMiddleton Island, AK, USA1 May 200159.46−146.3067
PAECNome, AK, USA1 May 200164.51−165.3054
PACGSitka, AK, USA1 May 200156.85−135.53209
Table 2. Minimum and maximum average hourly temperature and maximum hourly rainfall for CRN gauges in Alaska.
CRN GaugeCommission DateLatitudeMin. Average Hourly Temperature (°C)Max. Average Hourly Temperature (°C)Maximum Hourly Rainfall (mm)
Metlakatla28 September 201555.05−45.424.415.5
Sand_Point21 July 201355.35−42.820.17.6
Sitka23 September 201257.06−44.532.89.9
St._Paul17 September 201857.16−24.527.323.9
King_Salmon11 September 201158.21−36.930.518.8
Gustavus22 July 201358.43−18.316.77.9
Aleknagik12 October 202059.28−31.524.611.6
Yakutat17 September 201859.51−42.123.24.9
Port_Alsworth28 September 201560.2−4325.923.2
Cordova24 July 201360.47−24.128.79.2
Kenai6 September 201060.72−37.732.57.4
Bethel21 July 201361.35−14.828.519.1
Tok28 September 201562.74−49.532.411.5
Glennallen6 September 201063.03−1620.416
Denali4 September 201763.45−19.629.122.1
Ruby22 September 201964.5−32.231.110.4
Fairbanks24 July 201364.97−33.128.818.8
Selawik20 July 201466.56−4128.316.5
Red_Dog11 September 201168.03−36.8297.3
Ivotuk22 July 201368.49−37.928.514.8
Toolik_Lake6 September 201668.65−48.431.610.5
Deadhorse24 July 201370.16−12.930.431.2
Utqiagvik6 September 201671.32−37.628.121
Table 3. Percentage of precipitation in each phase—frozen, mixed, cool, or warm at each USCRN gauge location.
Frozen (%)Mixed (%)Cool (%)Warm (%)
T < 0 °C0 °C < T < 2°C2 °C < T < 10 °C10 °C < T
Aleknagik29.8213.8040.1816.15
Bethel3.2913.4054.8328.48
Cordova14.5512.6752.3220.46
Deadhorse1.494.3062.6731.54
Denali10.7616.0249.6823.55
Fairbanks17.3814.6246.6321.36
Glennallen4.8510.3769.3515.43
Gustavus14.1117.4860.078.34
Ivotuk42.966.2225.9324.67
Kenai28.7612.4534.7723.98
King_Salmon29.107.7032.9729.91
Metlakatla54.878.6026.809.73
Port_Alsworth44.9311.3736.087.62
Red_Dog34.926.3645.6213.10
Ruby14.2719.2936.8729.40
Sand_Point58.4810.1827.663.68
Selawik31.0010.5743.7514.61
Sitka32.443.0632.9531.30
St._Paul12.567.1953.6426.61
Tok38.927.2224.2629.27
Toolik_Lake39.2410.3024.5525.67
Utqiagvik44.426.0630.6918.83
Yakutat55.088.1931.105.62
Publisher’s Note: MDPI stays neutral with regard to jurisdictional claims in published maps and institutional affiliations.