
Multi-Criteria Selection of Surface Units for SAR Operations at Sea Supported by AIS Data


Abstract
:1. Introduction
Literature Overview (State of the Art)
2. Materials and Methods
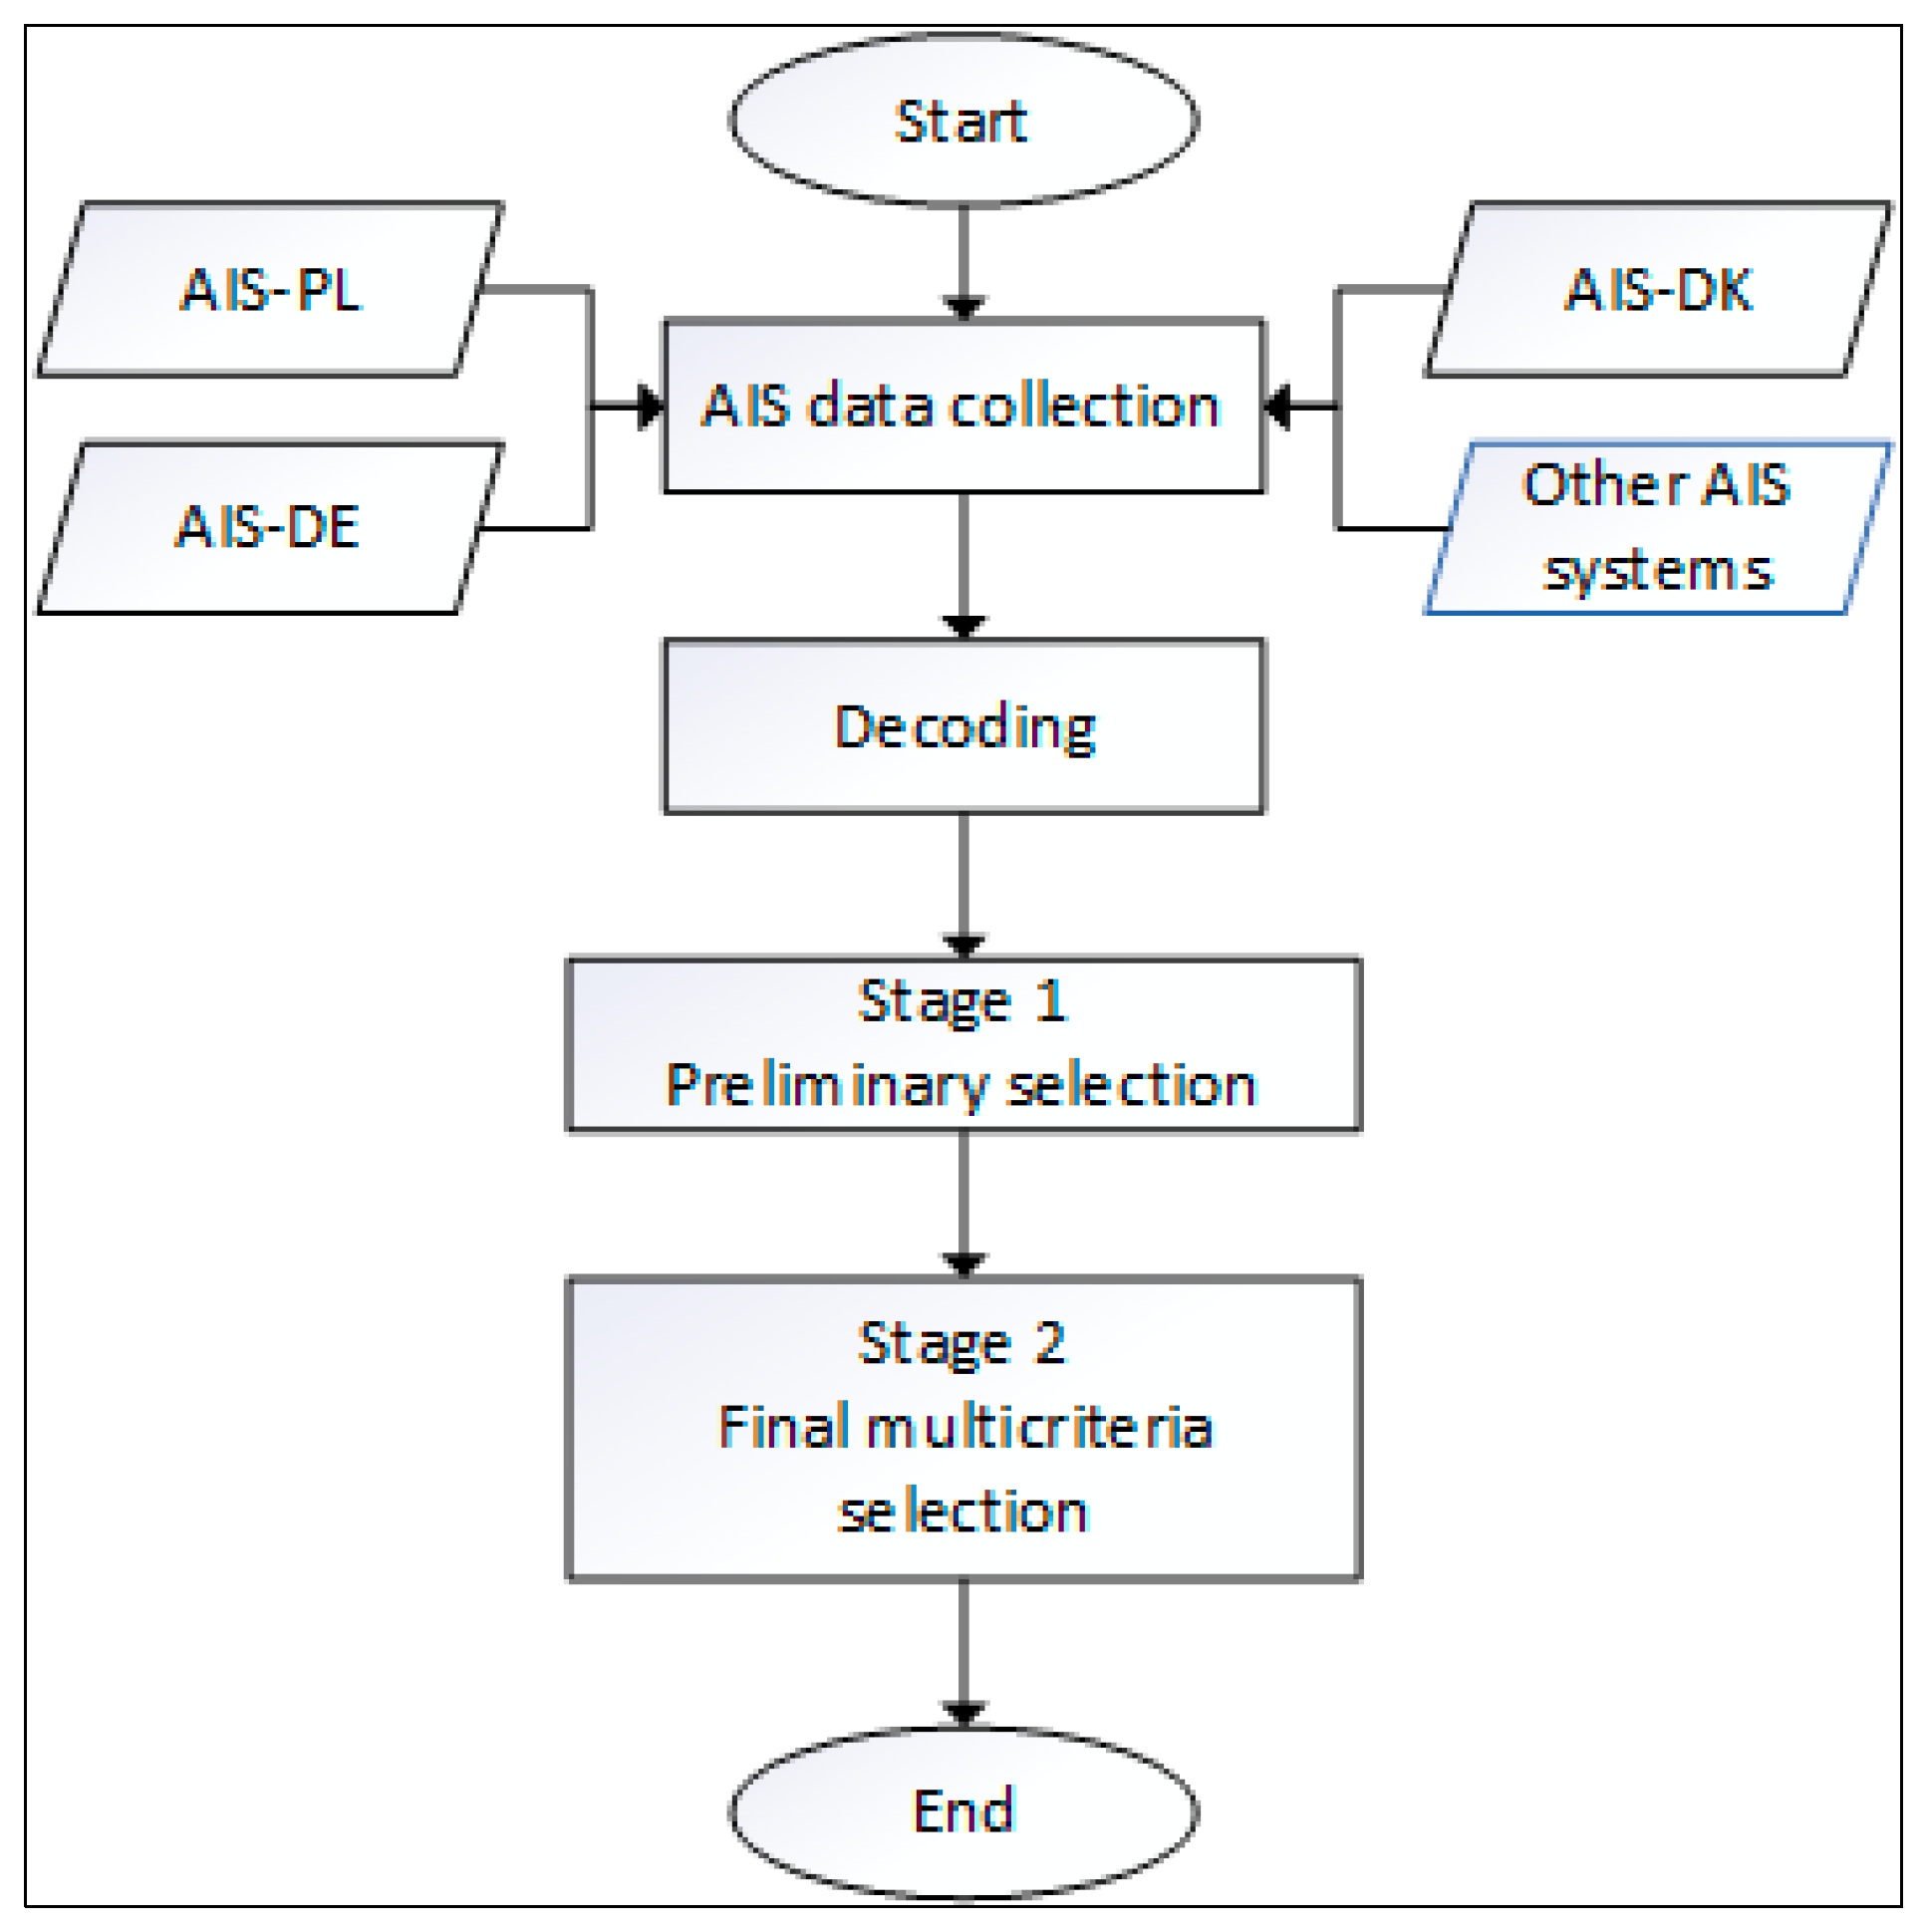
2.1. AIS Data
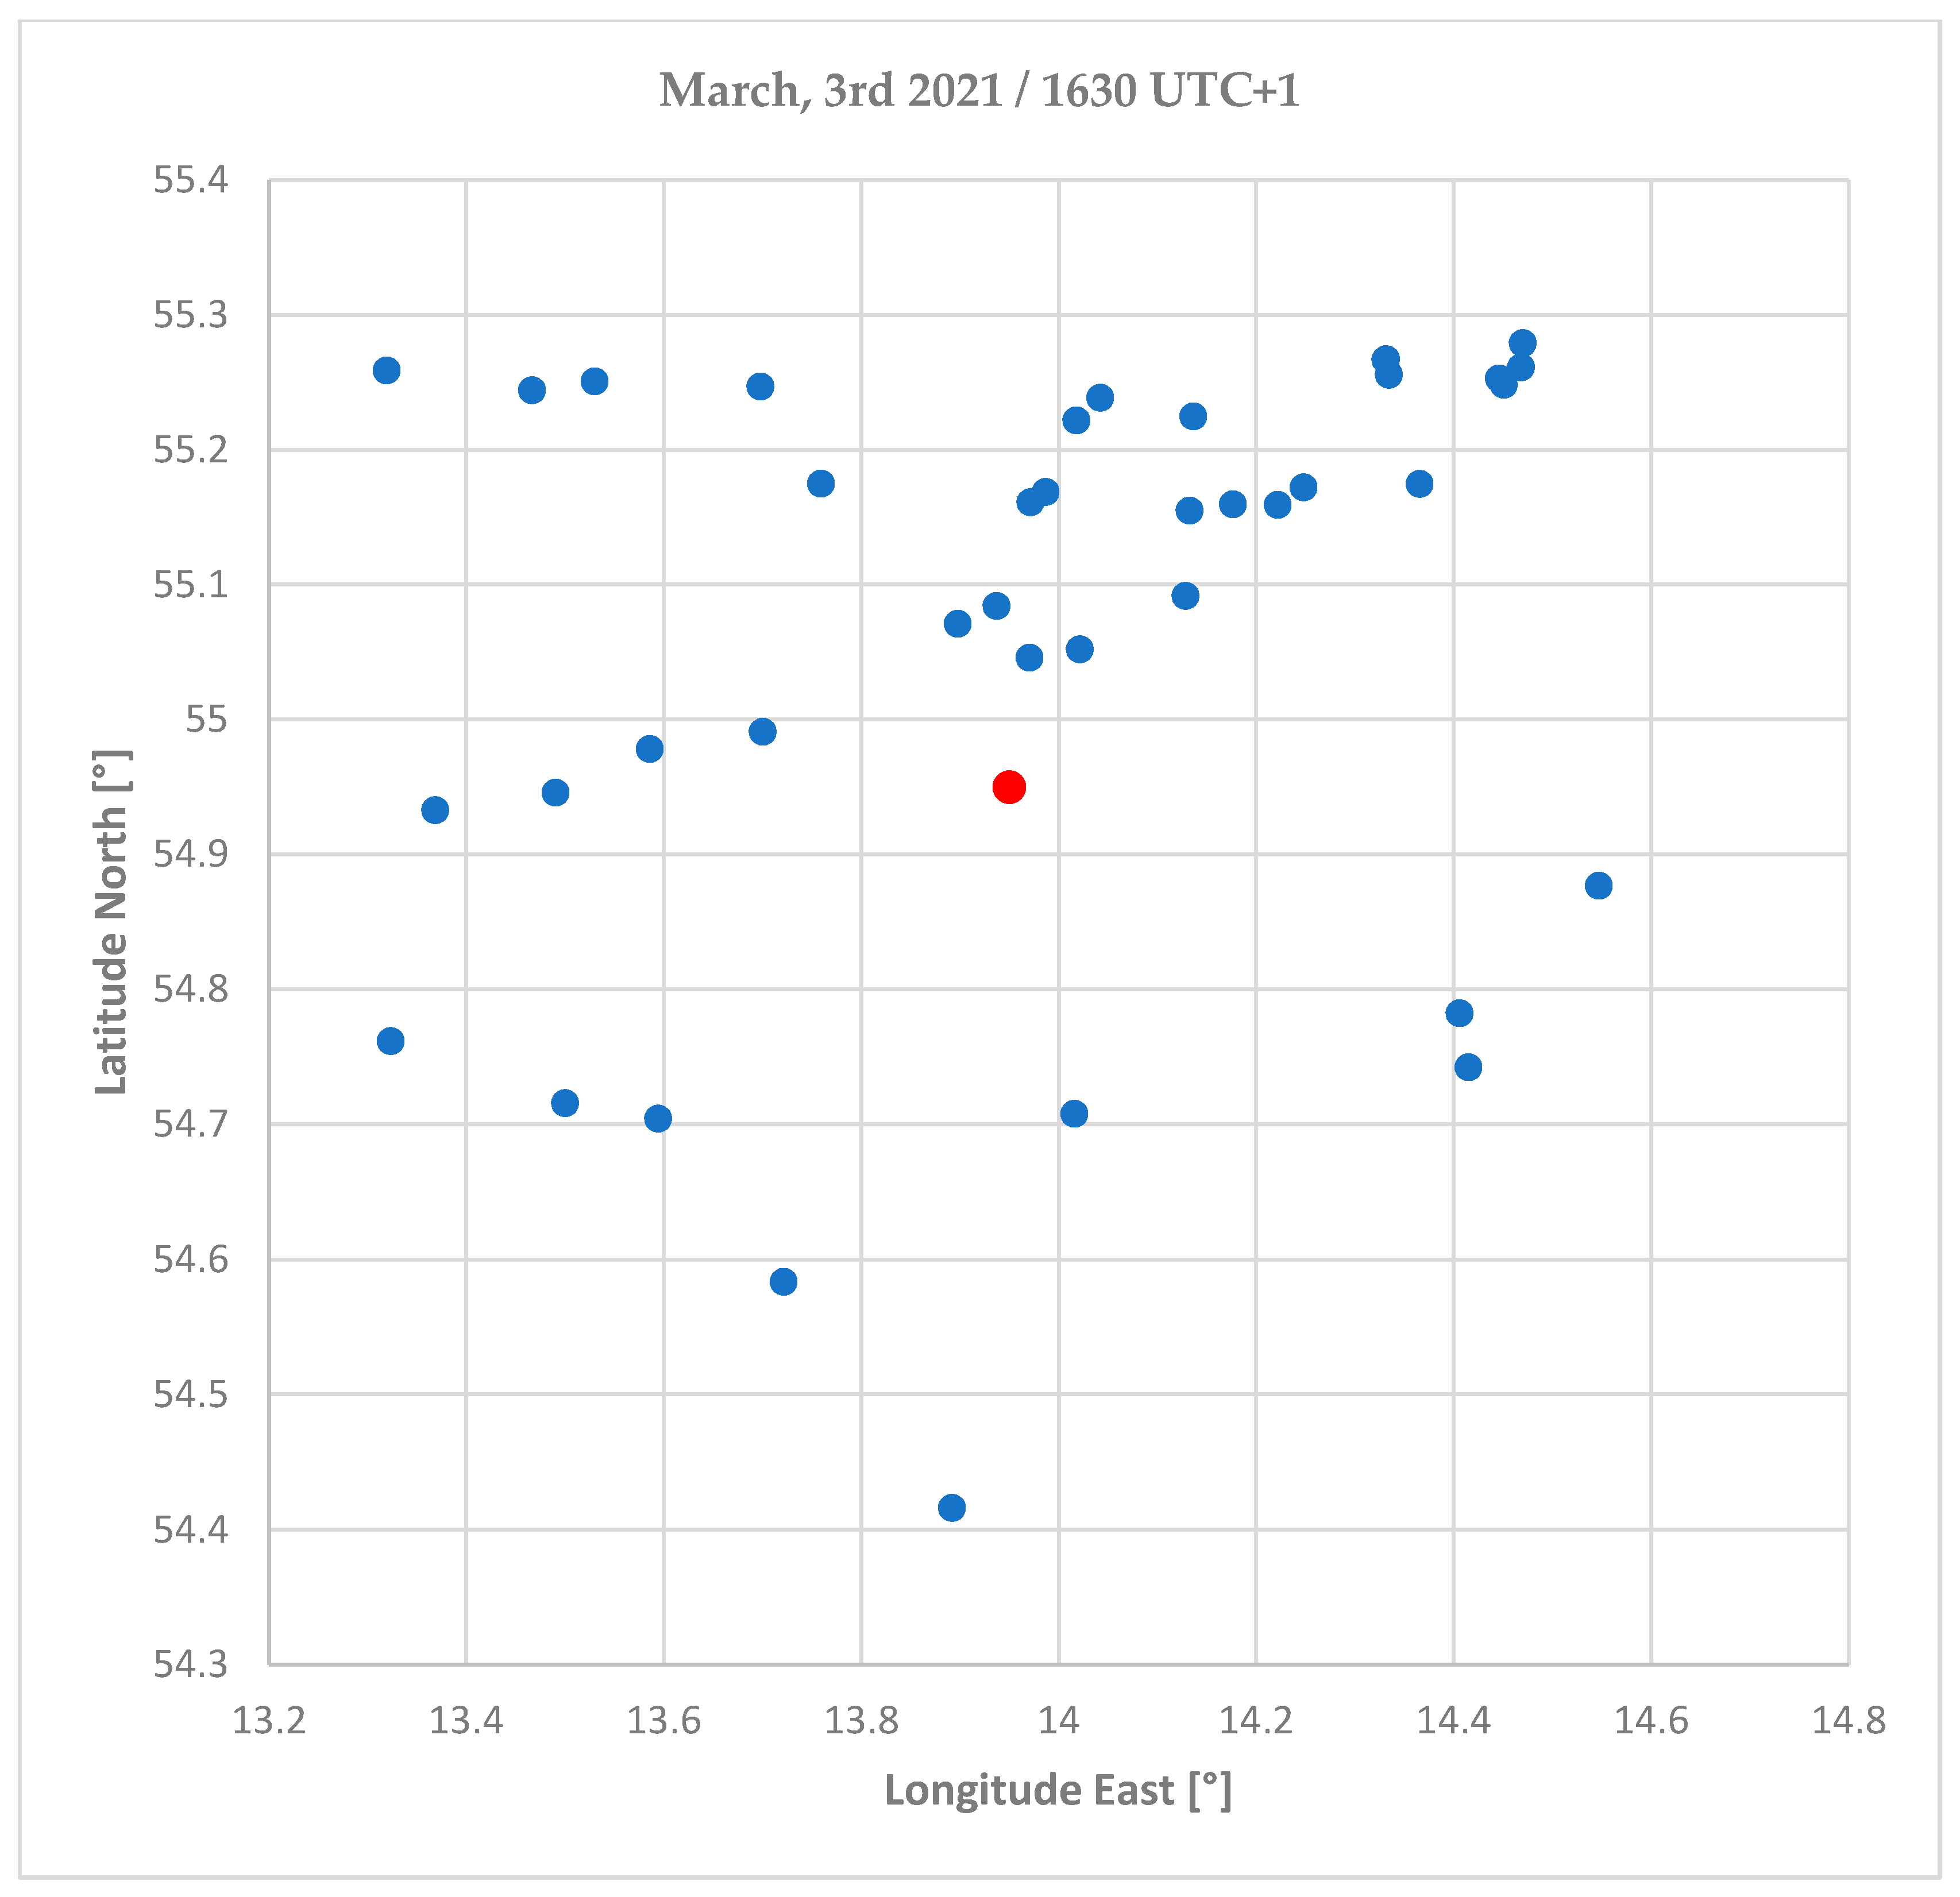
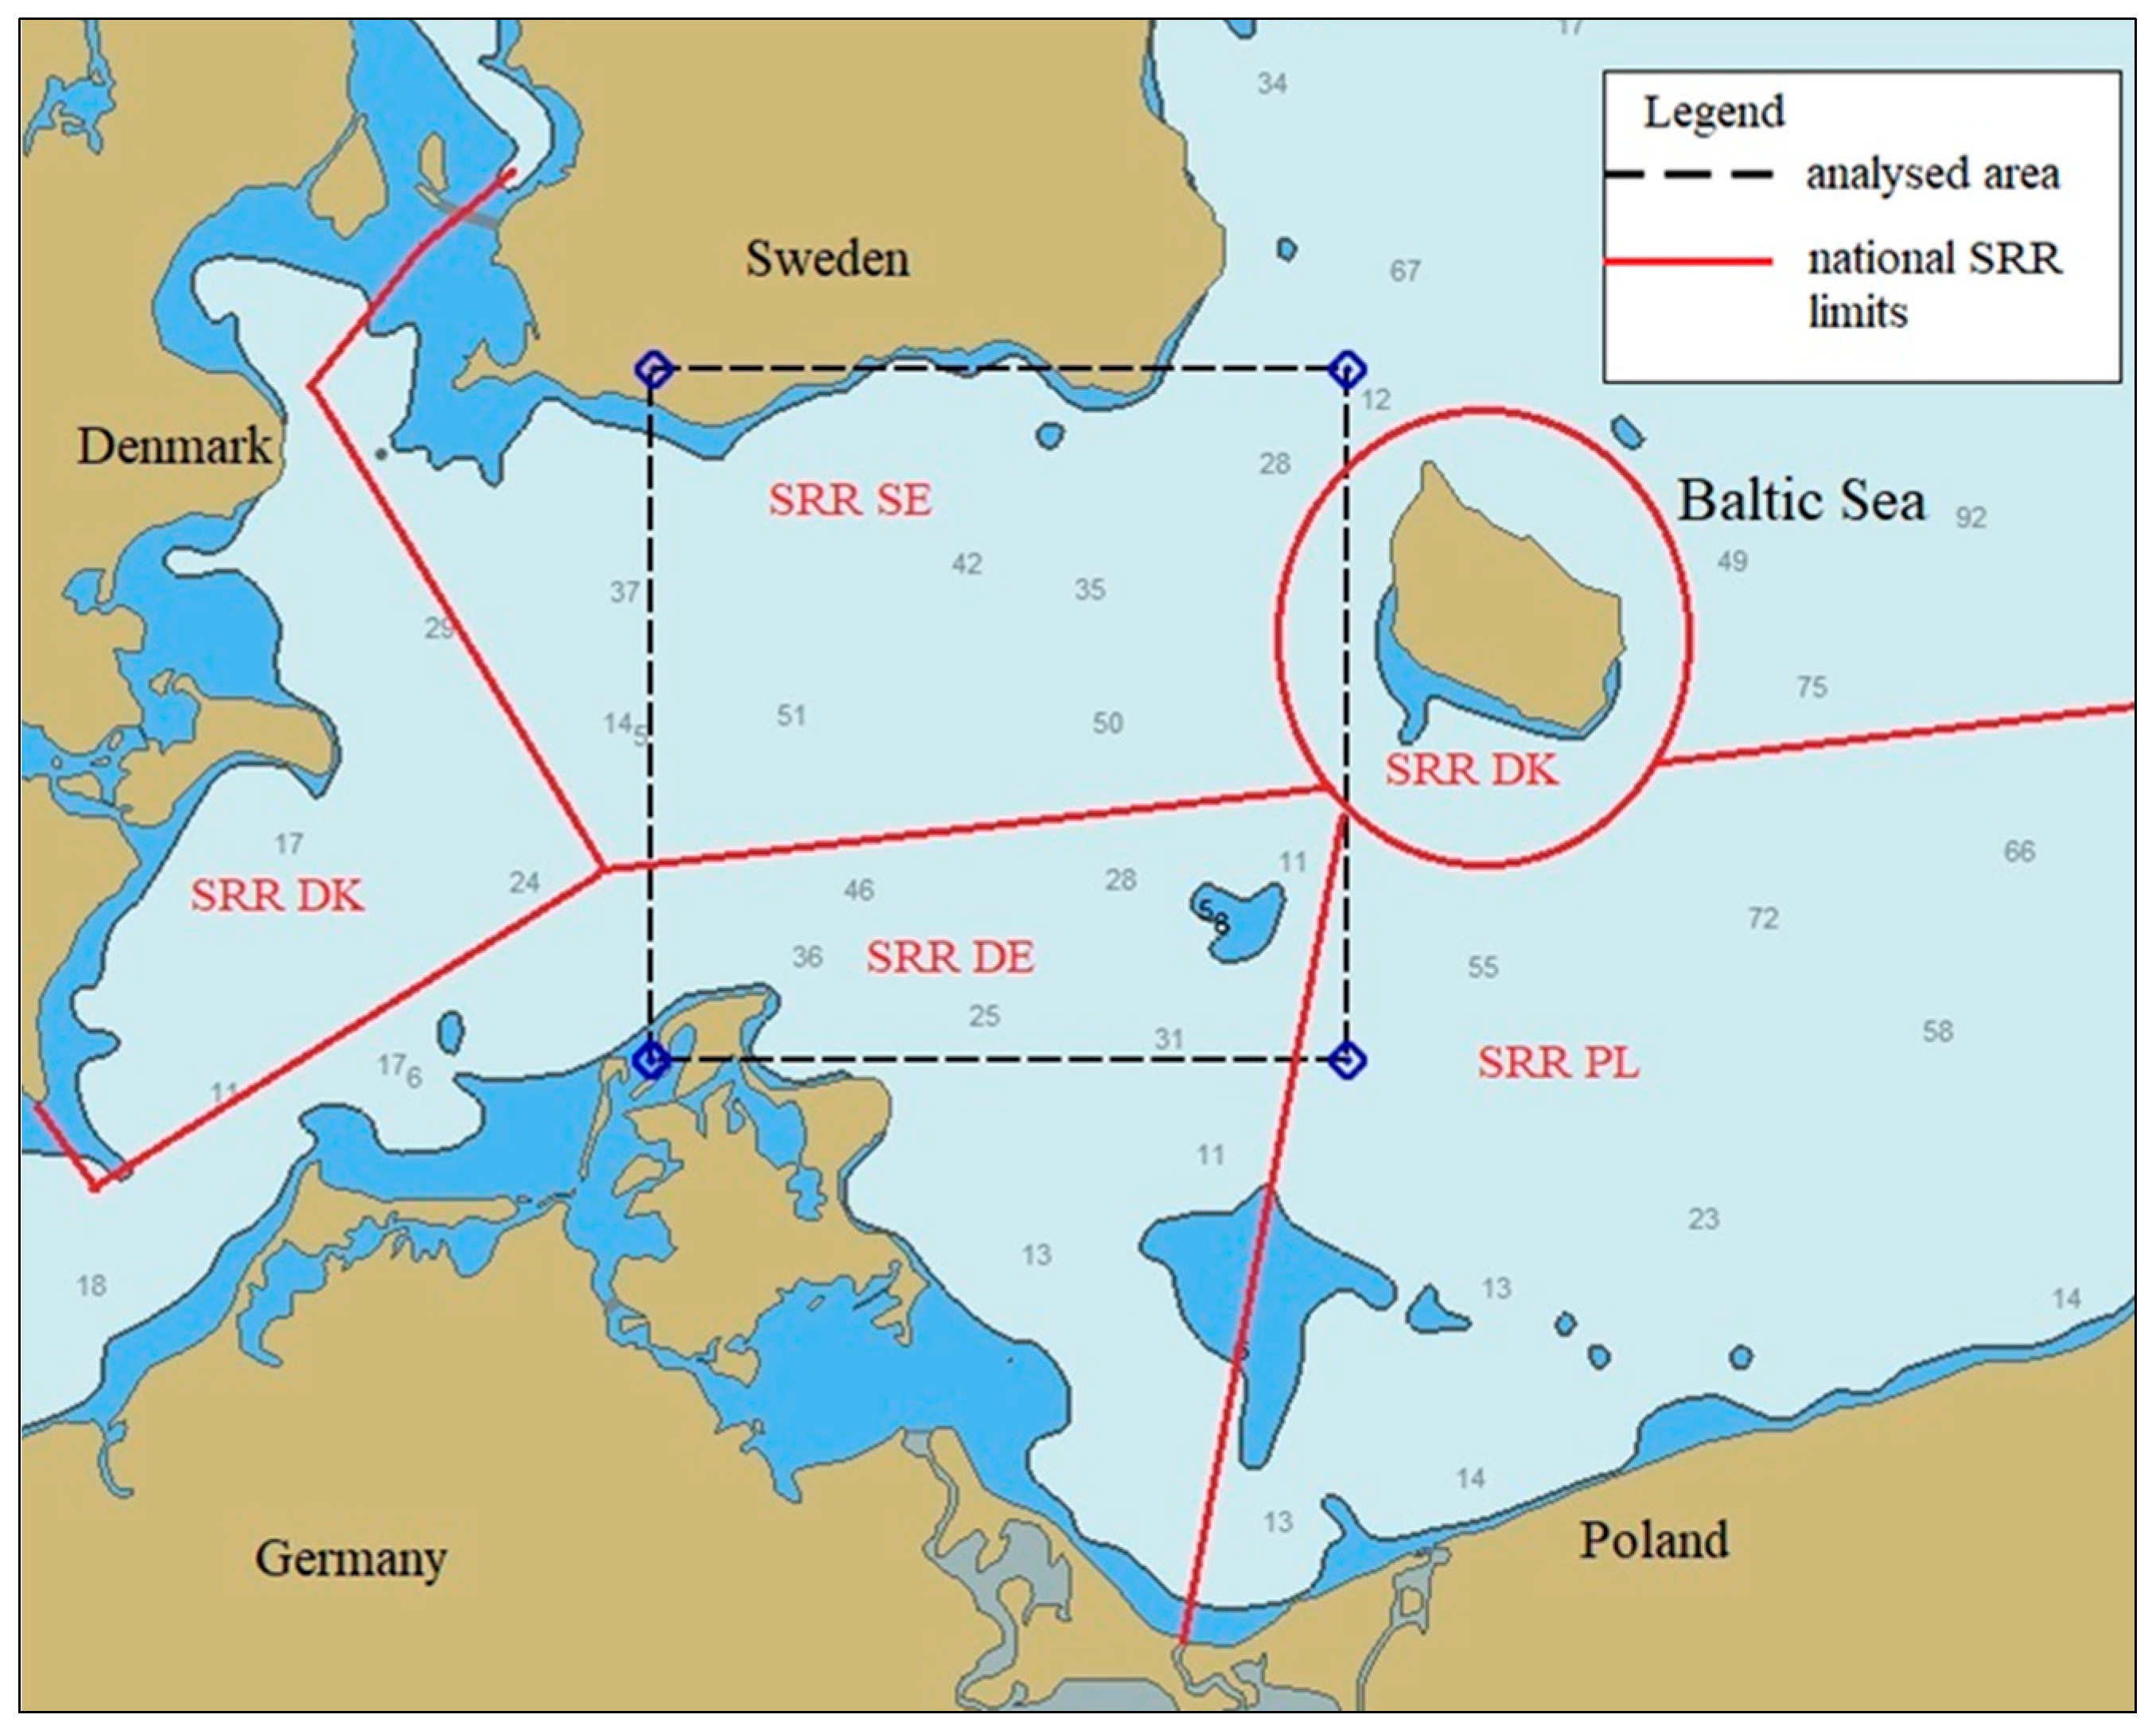
2.2. Research Area
- MMSI—Maritime Mobile Service Identity
- Lat—latitude
- Lon—longitude
- Status—navigational status
- SOG—speed over ground (knots)
- COG—course over ground (deg)
- Type—type of ship
- L—ship length (m)
- T—ship draught (m)
- B—ship breadth (m)
2.3. Vessel Selection Algorithm
2.3.1. Building of Outranking Relations
2.3.2. Determination of the Preference Index
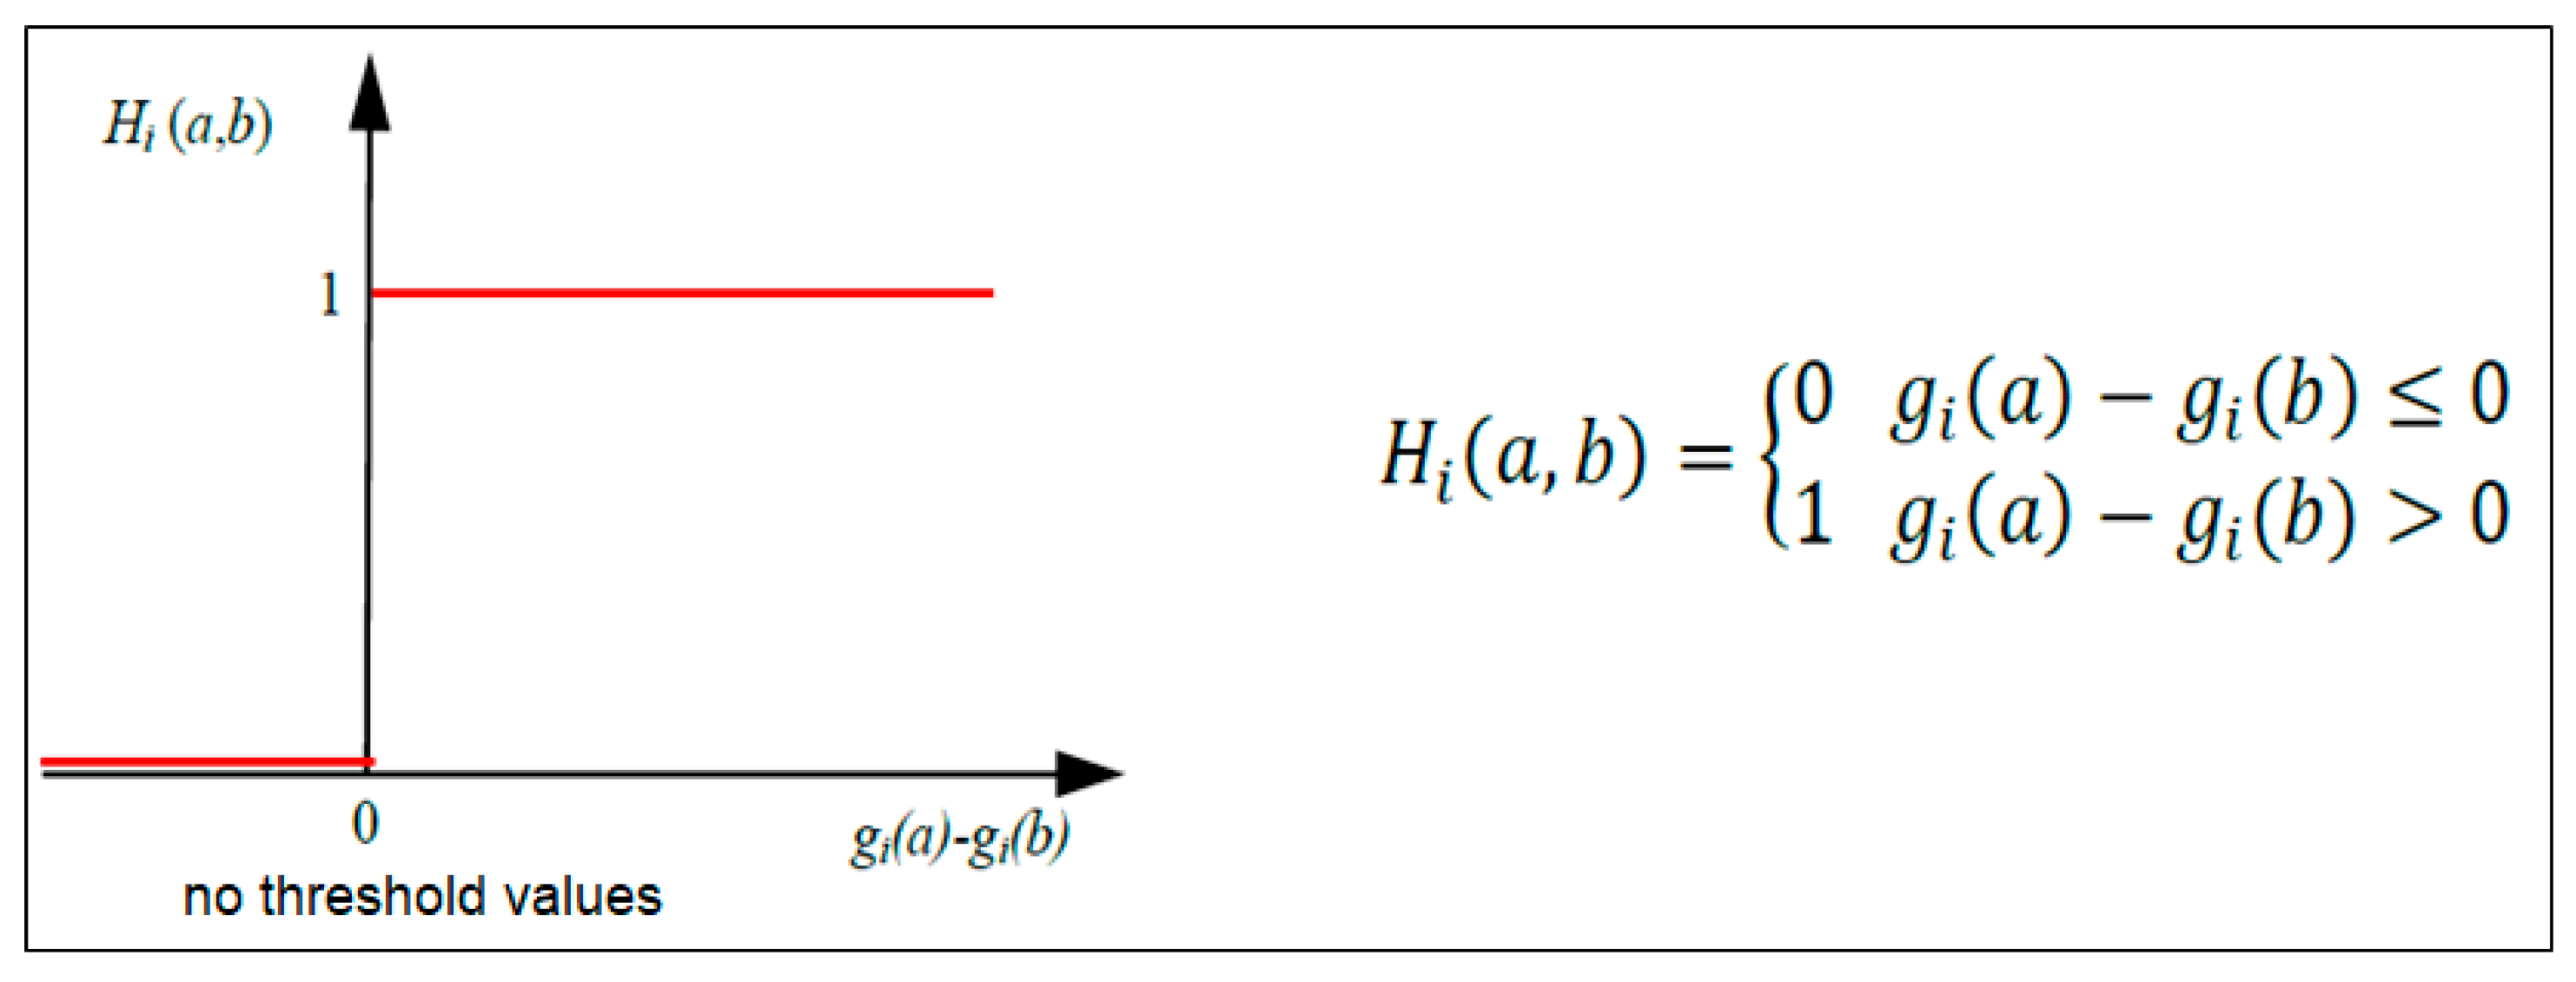
- type 1—usual,
- type 2—U-shape,
- type 3—V-shape,
- type 4—level,
- type 5—linear,
- type 6—Gaussian.
- indifference threshold (q) (the incomparability threshold)—the largest deviation which is considered by the decision maker as negligible. It determines a range of values where no outranging occurs and the minimum function value is 0 (zero);
- preference threshold (p)—the smallest deviation which is considered by the decision maker as sufficient to generate a complete preference. It is the limit value which, if exceeded, generates the maximum value 1 (one) of the preference function;
- Gaussian threshold (σ)—corresponds to the inflection point of the Gaussian curve. It is a deviation of a value between Q and P. More difficult to be determined; the use of the arithmetic mean of the sum of the indifference threshold and the preference threshold is recommended.
2.3.3. Outranking Flows for the Alternatives
2.3.4. Building of the Ranking
2.4. Expert Assessment (Assessment Criteria)
3. Results
Case Study—Search for a Missing Person
- (1)
- Diagnose the problem (define the decision maker and profile of the SAR operation).
- (2)
- Define the set of alternatives (available Search and Rescue Units, SRU).
- (3)
- Define a consistent set of criteria (and establish the method of assessment).
- (4)
- Model the decision maker’s preferences (determine their expectations).
- (5)
- Carry out the calculation experiment (select the method and carry out the testing).
- (6)
- Summarize (analyze the results and draw a conclusion).
- the action profile was defined (search for one person in the water);
- the search area was determined;
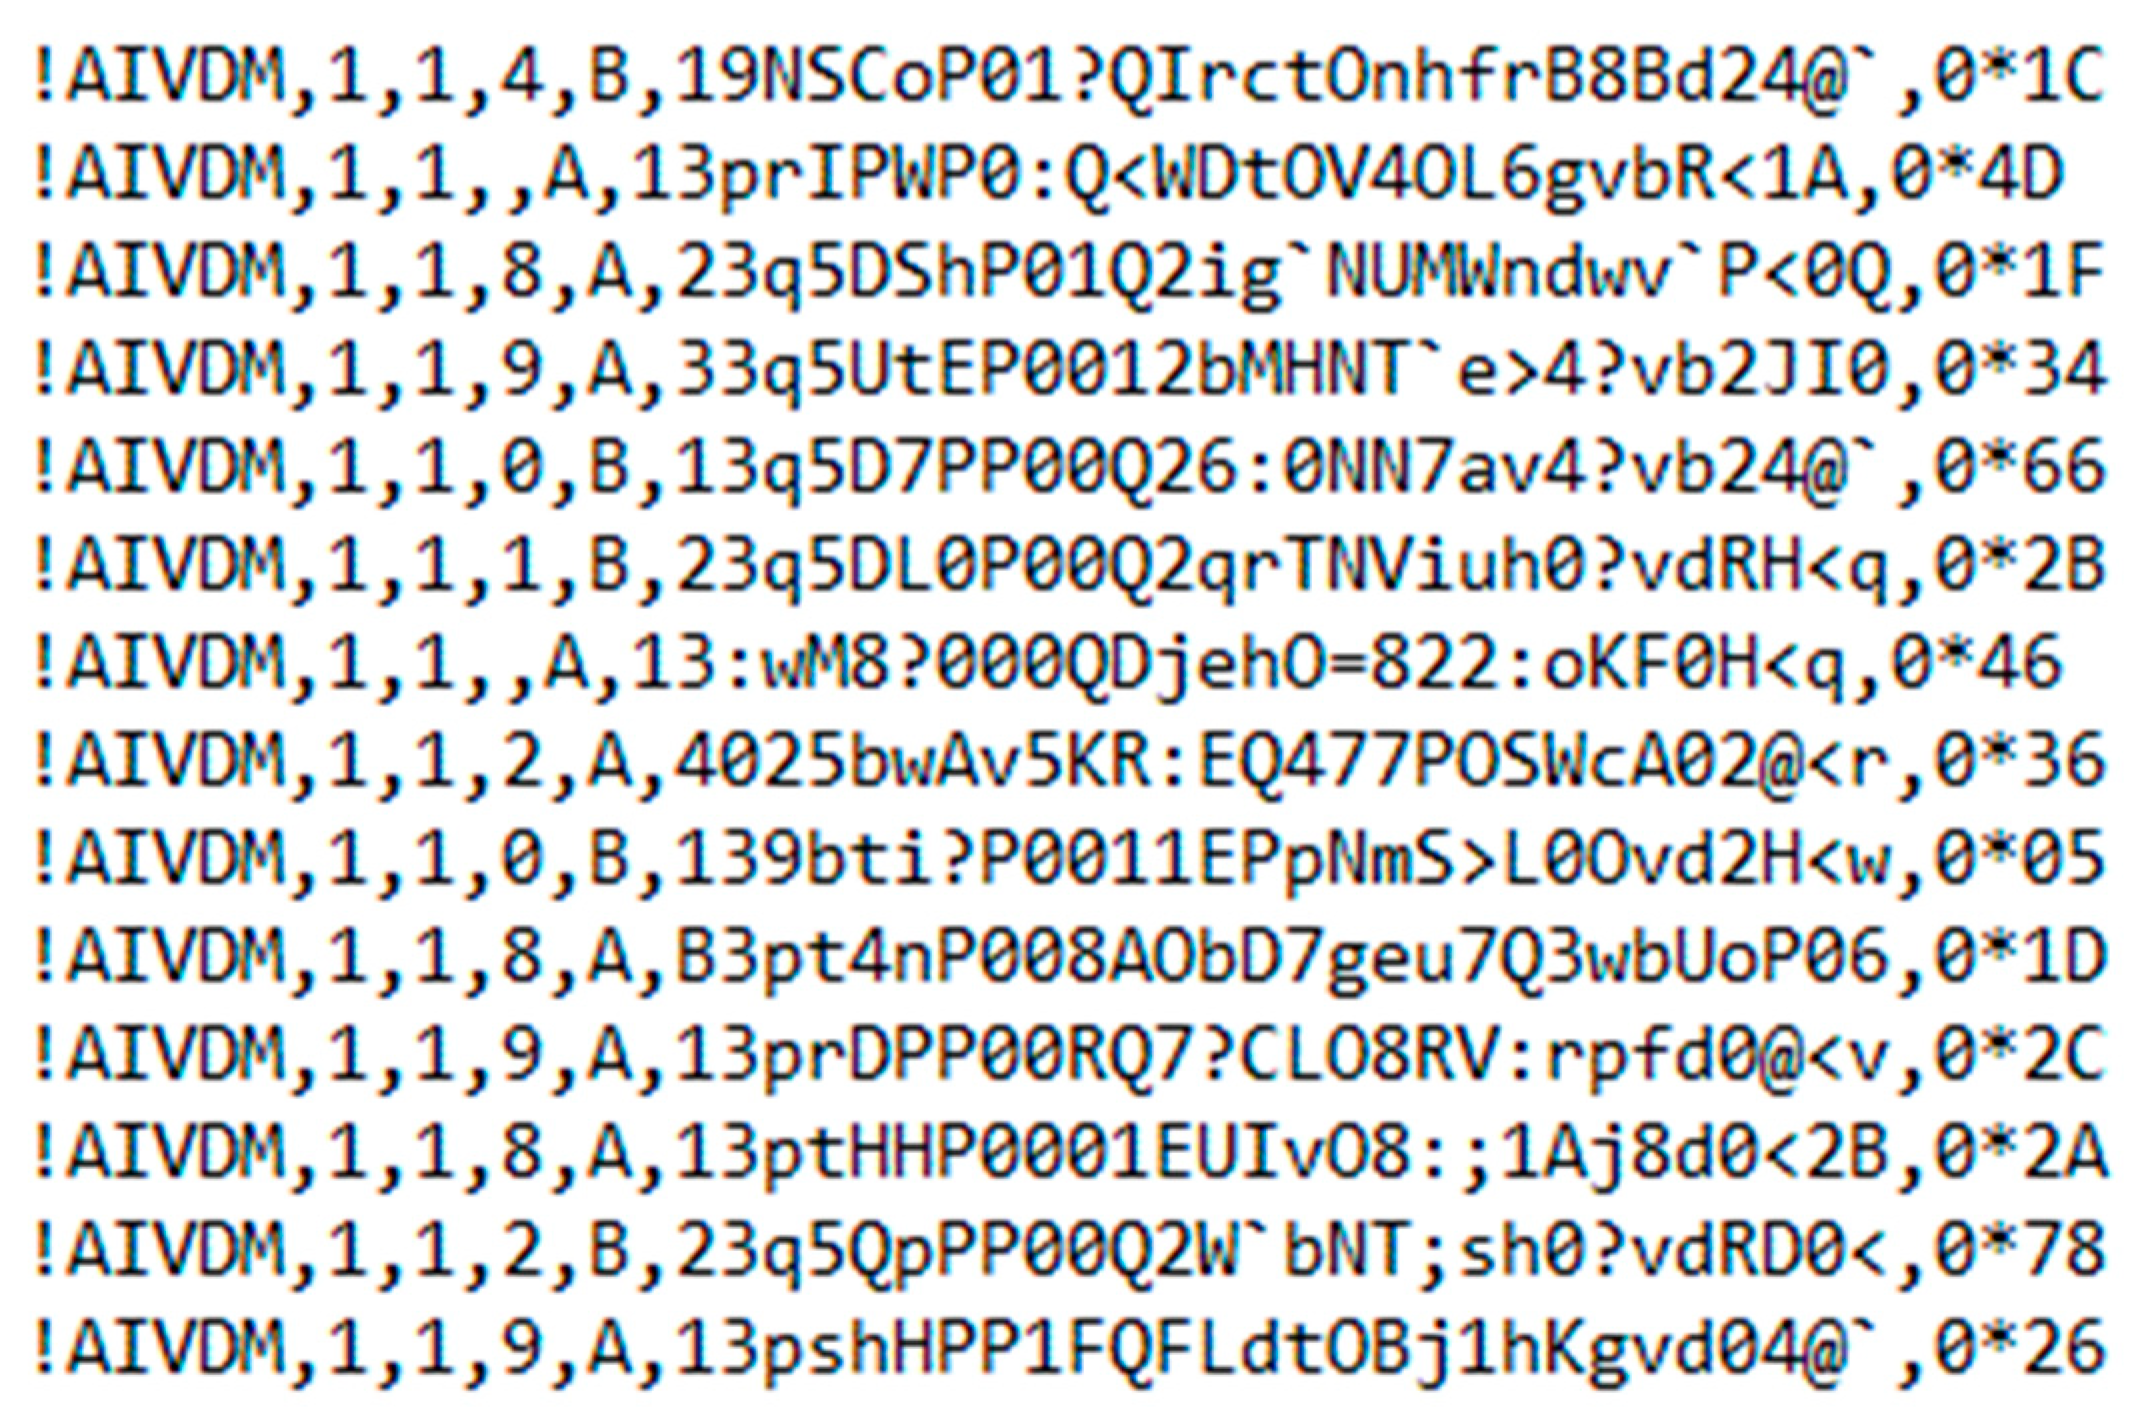
- a group of alternatives was defined (information about the ships was obtained from the AIS system, the data were decoded, several parameters of the ships were obtained; the parameters are used to assess the suitability of the ship for the search and rescue operation;
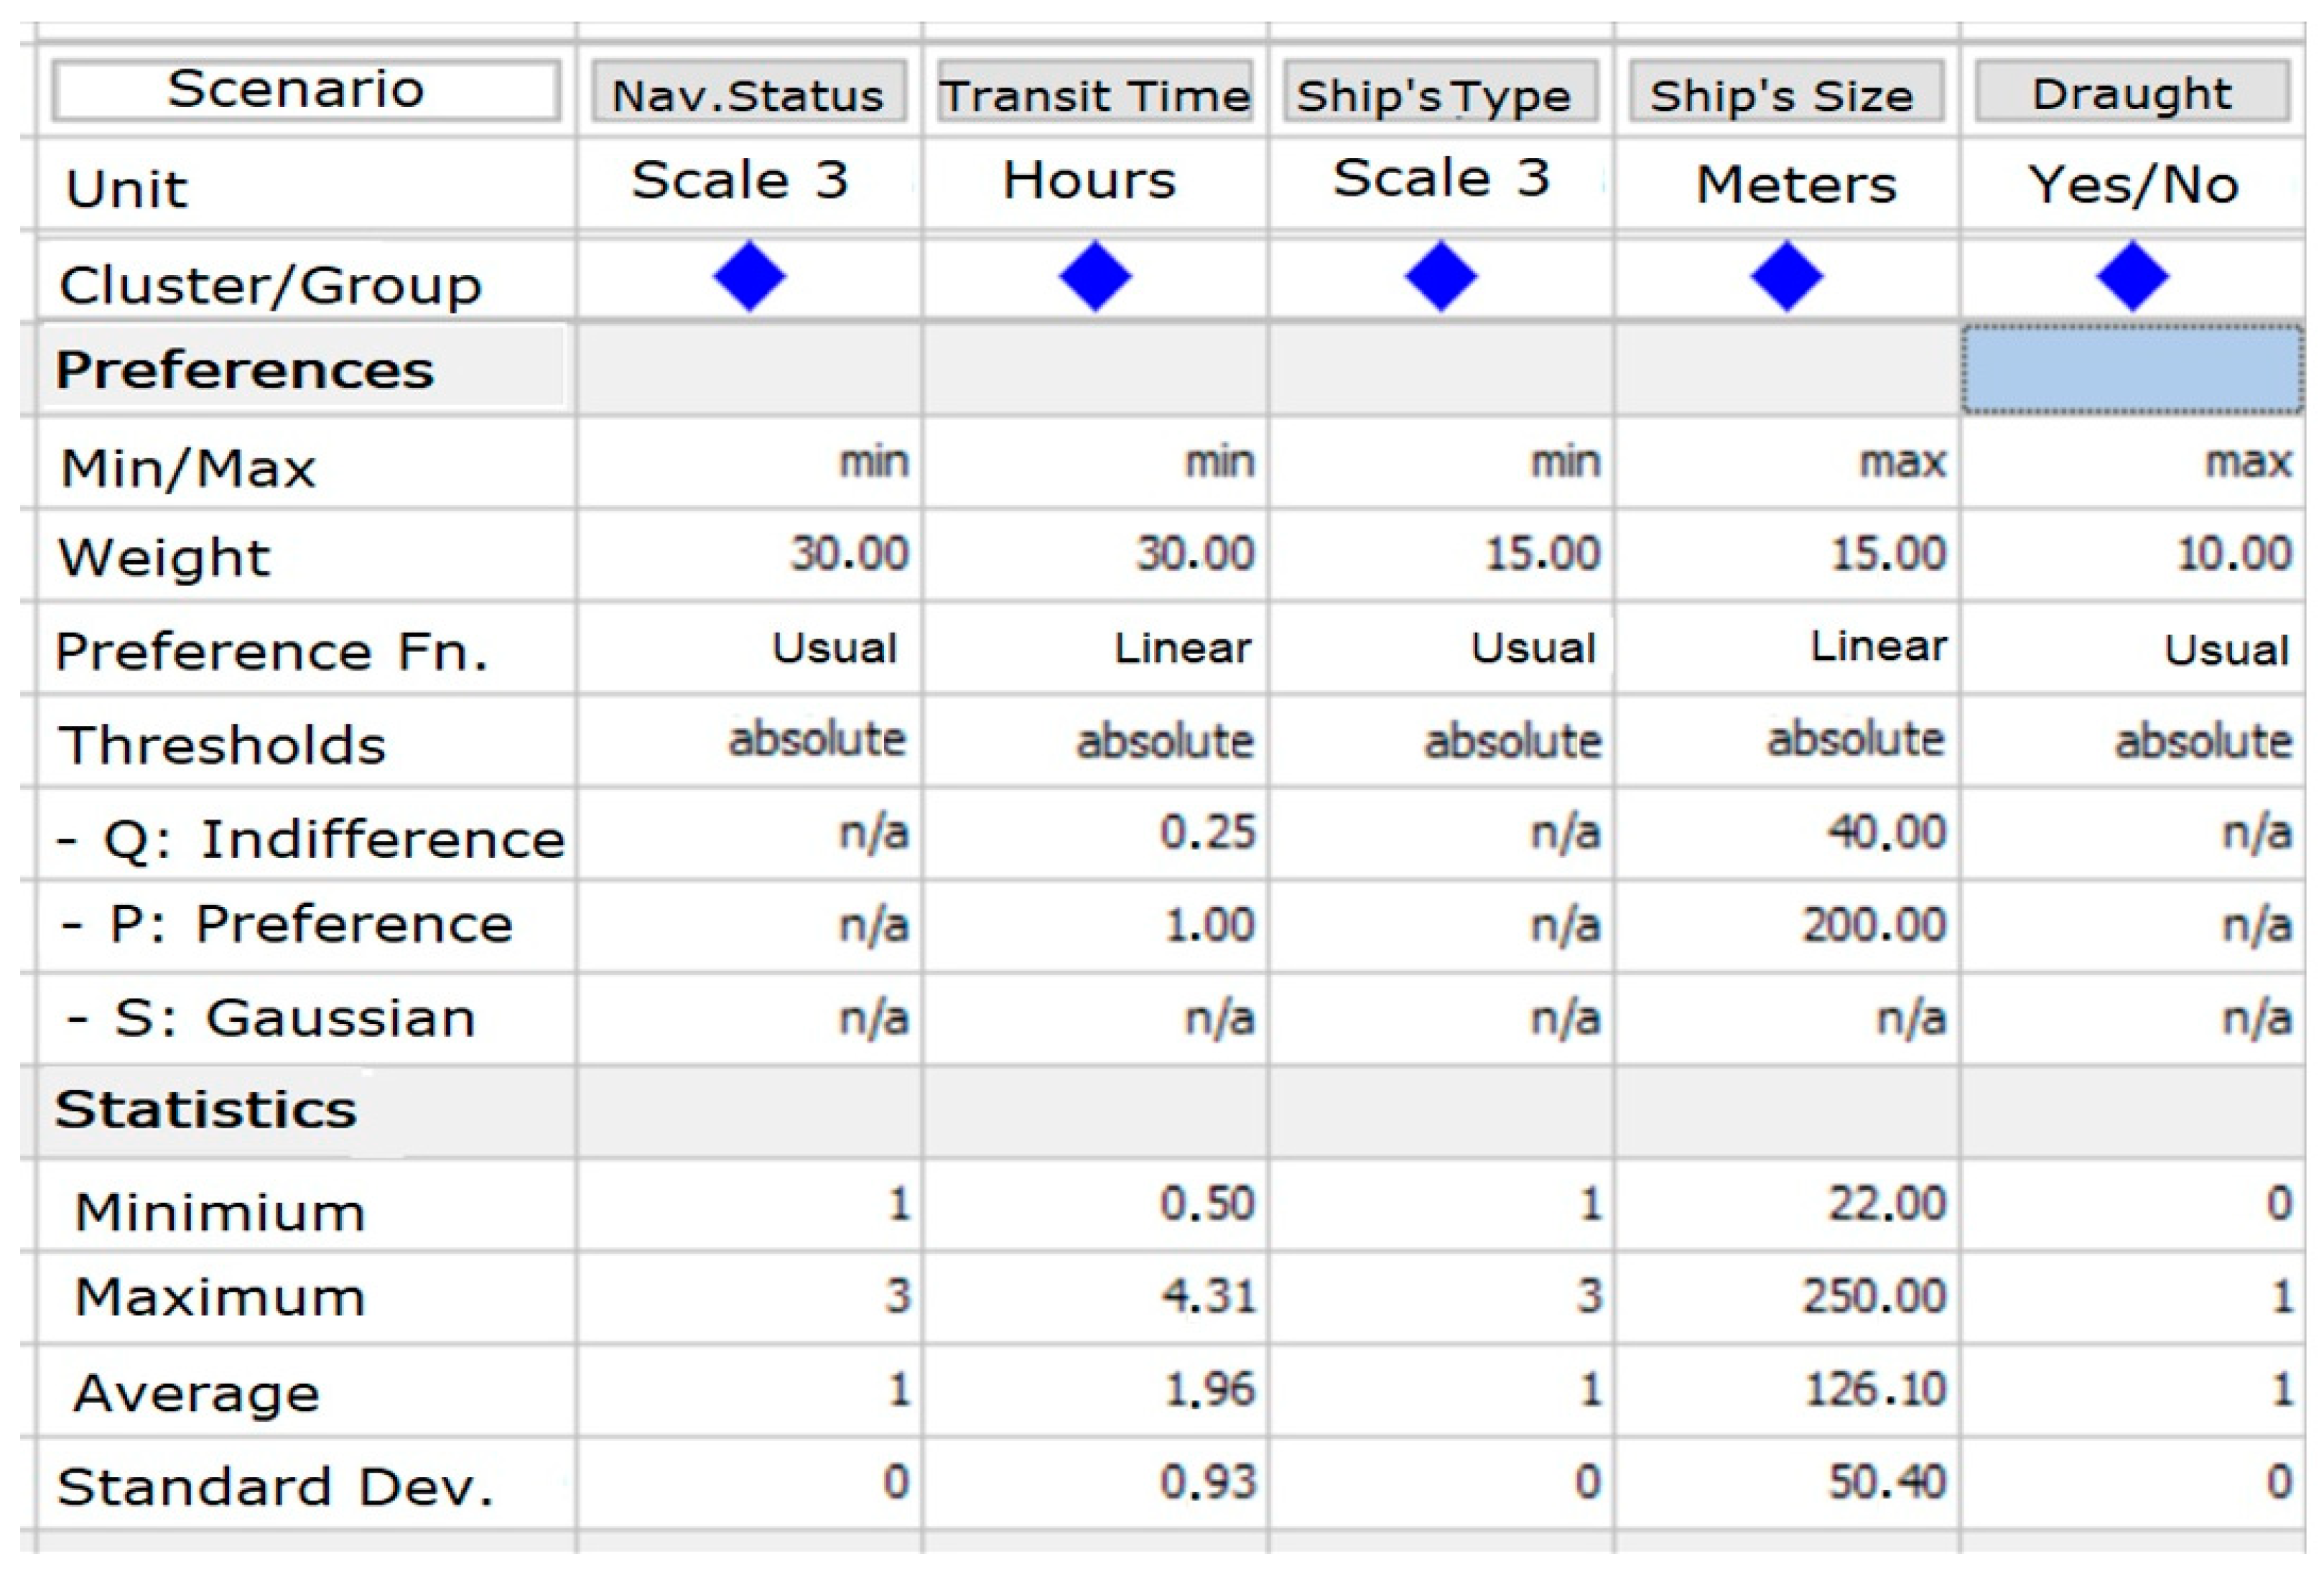
- a set of criteria and a method of evaluation was defined; modelling of the decision maker’s preferences was carried out; the criteria have weights, evaluation limits, and evaluation thresholds;
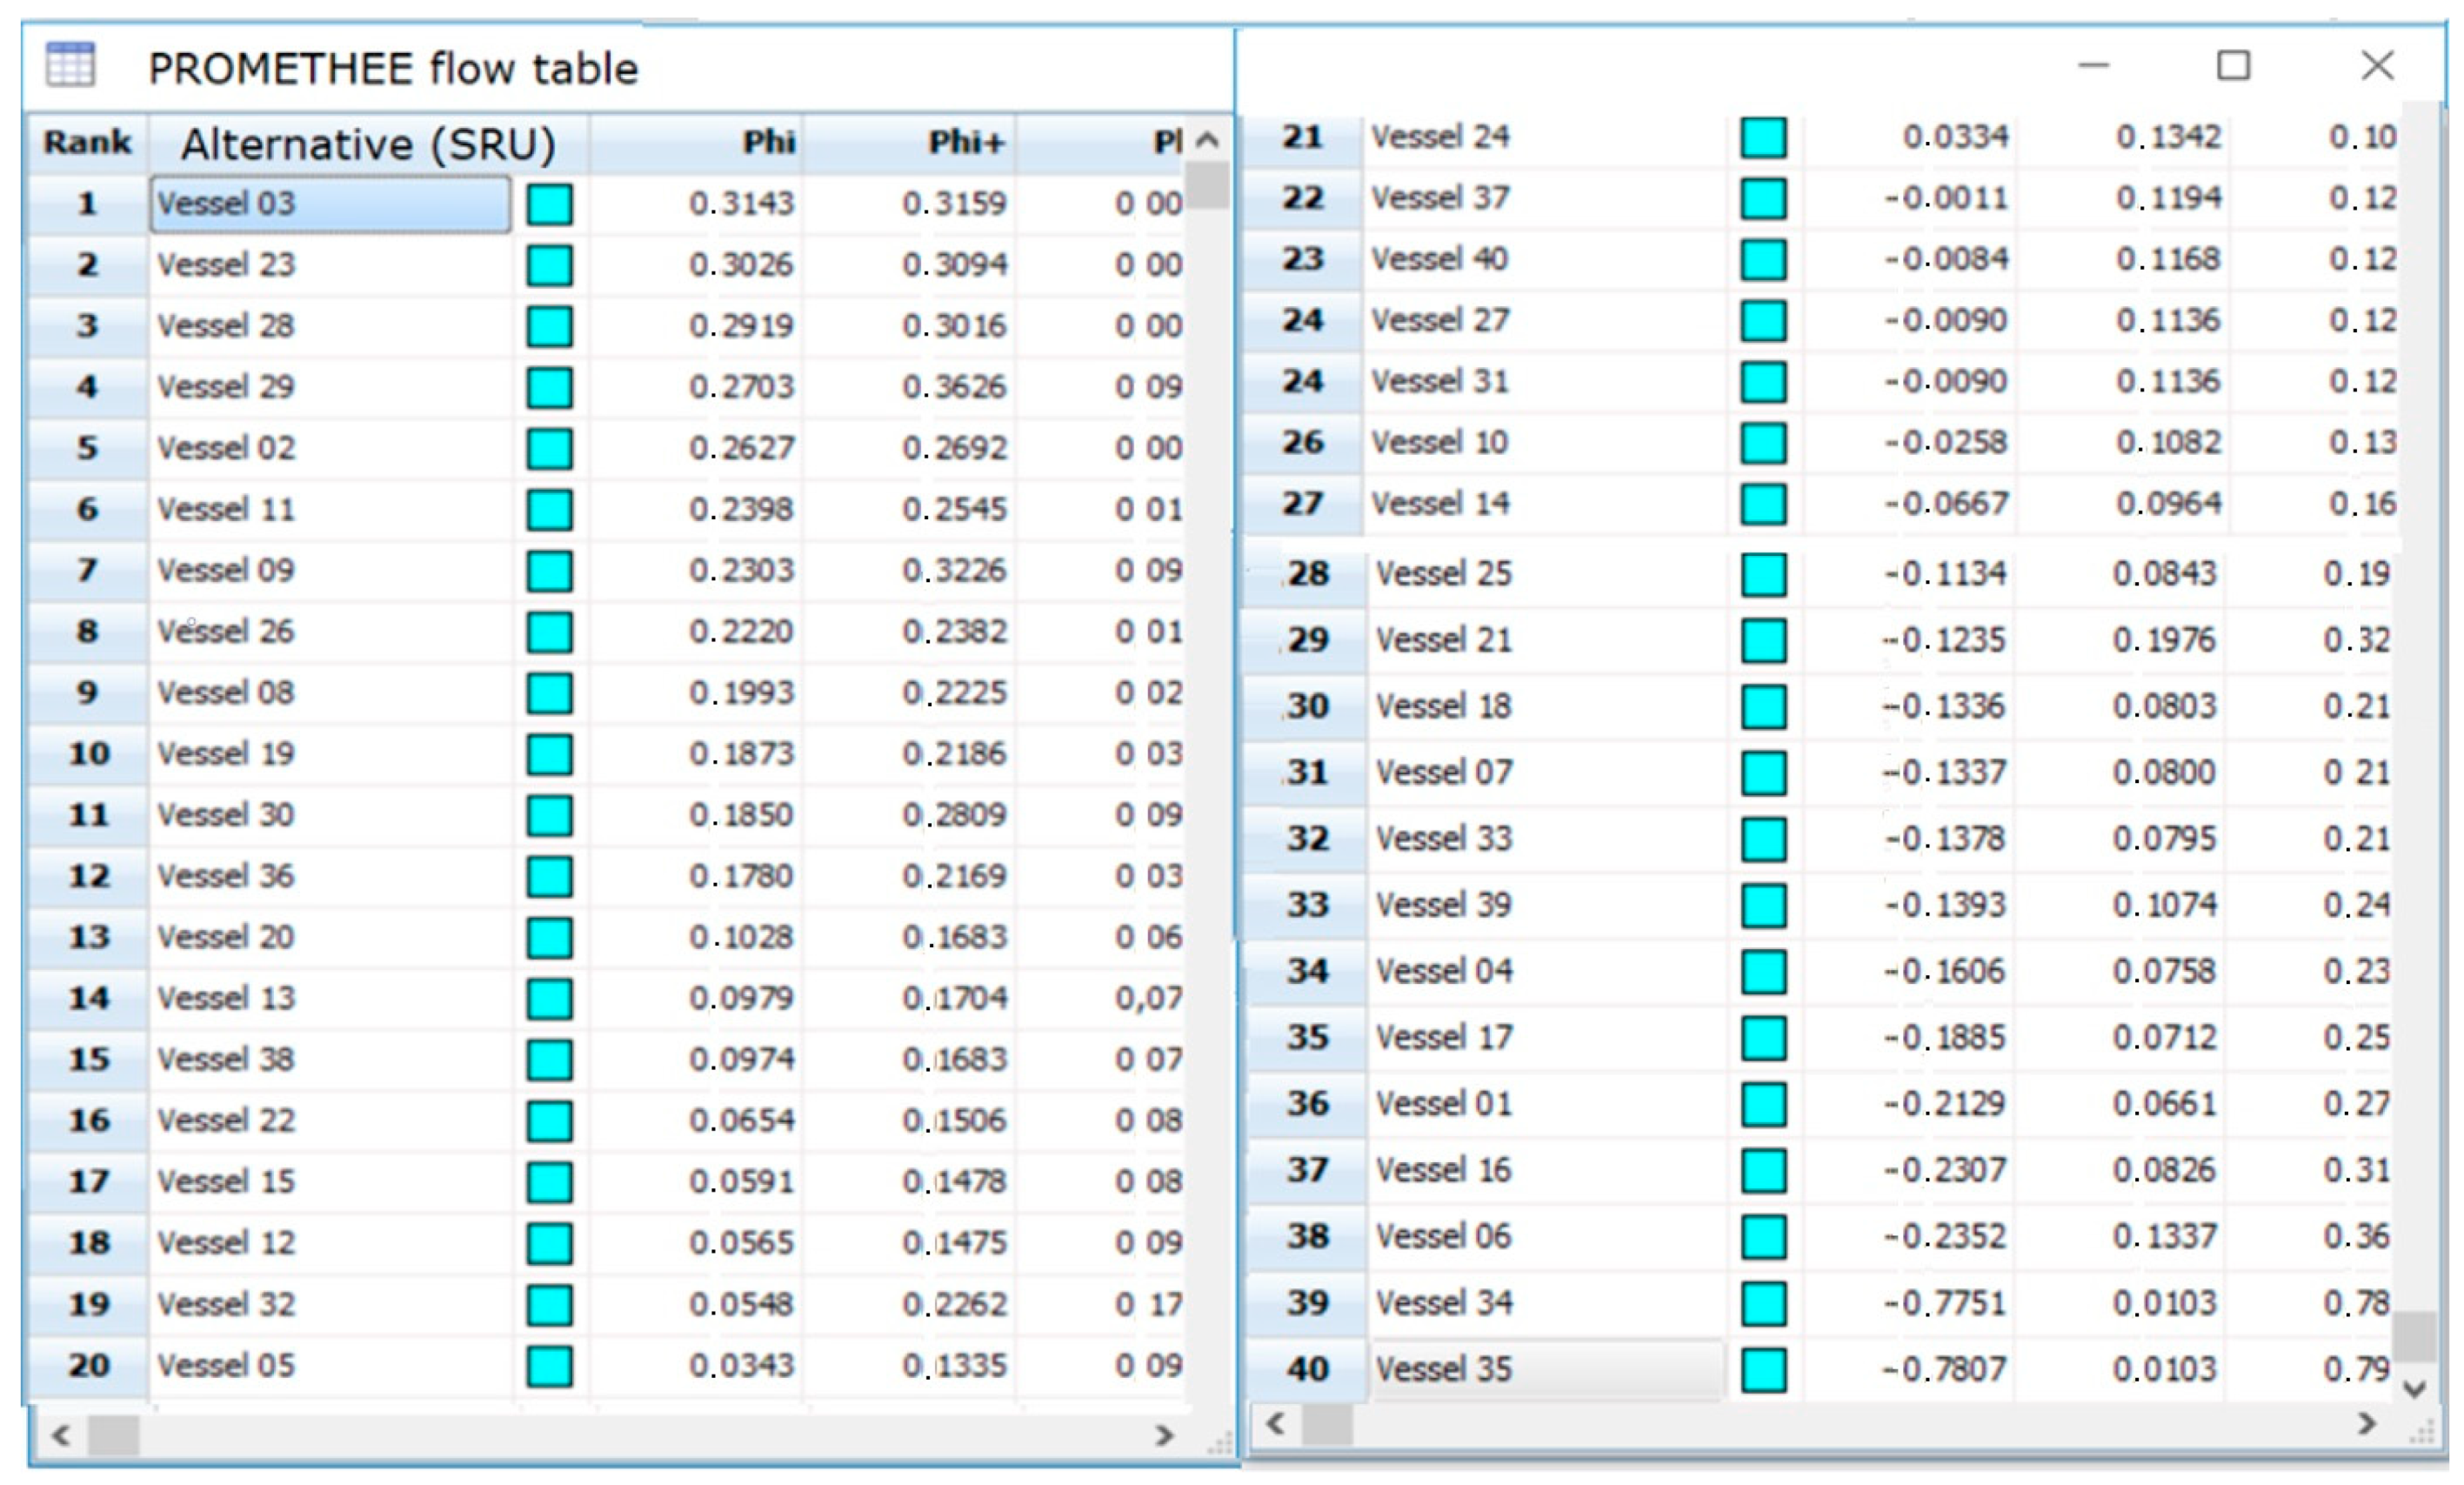
- a multi-criteria decision analysis computational experiment was conducted (Promethee II method was performed);
- the results were analysed in the form of a table and a network;
- a way of the final selection of ships for action was suggested.
4. Discussion and Conclusions
Author Contributions
Funding
Institutional Review Board Statement
Informed Consent Statement
Data Availability Statement
Conflicts of Interest
References
- IMO. International Aeronautical and Maritime Search and Rescue Manual; International Maritime Organization: London, UK, 2019; Volume III. [Google Scholar]
- Cameron, A.; Pelot, R.; Nguyen, B.; Ng, K. Modeling Canadian search and rescue operations. Mil. Oper. Res. 2000, 5, 5–16. [Google Scholar]
- Azofra, M.; Perez-Labajos, C.; Blanco, B.; Achutegui, J. Optimum placement of sea rescue resources. Saf. Sci. 2007, 45, 941–951. [Google Scholar] [CrossRef]
- Małyszko, M.; Bugajski, G.; Wielgosz, M. Wykorzystanie systemu AIS do selekcji i doboru jednostek nieratowniczych do akcji SAR (Using the AIS system to select non-professional rescue units for SAR operations). Autobusy 2017, 12, 276–280. (In Polish) [Google Scholar]
- Pelot, R.; Akbari, A.; Li, L. Vessel location modeling for maritime search and rescue. In Applications of Location Analysis; International Series in Operations Research & Management Science; Eiselt, H., Marianov, V., Eds.; Springer: Cham, Switzerland, 2015; Volume 232. [Google Scholar] [CrossRef]
- Lübcke, T.; Steigenberger, N.; Bornhorst, C.; Roßner, P. Inter-organizational simulation as a training opportunity for maritime search and rescue (SAR) missions. In Proceedings of the 7th International Conference on Applied Human Factors and Ergonomics (AHFE), Orlando, FL, USA, 27–31 July 2016. [Google Scholar]
- Shabani, A.; Asgarian, B.; Salido, M.; Gharebaghi, S.A. Search and rescue optimization algorithm: A new optimization method for solving constrained engineering optimization problems. Expert Syst. Appl. 2020, 161, 113698. [Google Scholar] [CrossRef]
- Valcic, S.; Mrak, Z.; Gulić, M. Analysis of advantages and disadvantages of existing maritime communication systems for data exchange. Sci. J. Maritime Res. 2016, 30, 28–37. [Google Scholar] [CrossRef]
- Lázaro, F.; Raulefs, R.; Wang, W.; Clazzer, F.; Plass, S. VHF Data Exchange System (VDES): An enabling technology for maritime communications. CEAS Space J. 2019, 11, 55–63. [Google Scholar] [CrossRef] [Green Version]
- Gözlan, A.; John, O.; Lübcke, T.; Maier, A.; Reimann, M.; Richter, J.-G.; Zvarev, I. Assisting Maritime Search and Rescue (SAR) Personnel with AI-Based Speech Recognition and Smart Direction Finding. JMSE 2020, 8, 818. [Google Scholar] [CrossRef]
- Yan, Z.; Xiao, Y.; Cheng, L.; He, R.; Ruan, X.; Zhou, X.; Li, M.; Bin, R. Exploring AIS data for intelligent maritime routes extraction. Appl. Open Res. 2020, 101. [Google Scholar] [CrossRef]
- Wang, G.; Ma, M.; Jiang, L.; Chen, F.; Xu, L. Multiple imputation of maritime search and rescue data at multiple missing patterns. PLoS ONE 2020, 16, e0252129. [Google Scholar] [CrossRef] [PubMed]
- Hou, X.; Ao, W.; Song, Q.; Lai, J.; Wang, H.; Xu, F. FUSAR-Ship: Building a high-resolution SAR-AIS matchup dataset of Gaofen-3 for ship detection and recognition. Sci. China Inf. Sci. 2020, 63, 140303. [Google Scholar] [CrossRef] [Green Version]
- Galdelli, A.; Mancini, A.; Ferra, C.; Tassettti, A.N. A Synergic Integration of AIS Data and SAR Imagery to Monitor Fisheries and Detect Suspicious Activities. Sensors 2021, 21, 2756. [Google Scholar] [CrossRef] [PubMed]
- Marino, A.; Sanjuan-Ferrer, M.J.; Hajnsek, I.; Ouchi, K. Ship Detection with Spectral Analysis of Synthetic Aperture Radar: A Comparison of New and Well-Known Algorithms. Remote Sens. 2015, 7, 5416–5439. [Google Scholar] [CrossRef]
- Graziano, M.D.; Renga, A.; Moccia, A. Integration of Automatic Identification System (AIS) Data and Single-Channel Synthetic Aperture Radar (SAR) Images by SAR-Based Ship Velocity Estimation for Maritime Situational Awareness. Remote Sens. 2019, 11, 2196. [Google Scholar] [CrossRef] [Green Version]
- Available online: https://www.nmea.org (accessed on 26 February 2021).
- Brans, J.; Mareschal, B.; Vincke, P. Promethee: A new family of outranking methods in multicriteria analysis. Oper. Res. 1984, 3, 408–421. [Google Scholar]
- Brans, J.; Vincke, P.; Mareschal, B. How to select and how to rank projects. The Promethee method. Eur. J. Oper. Res. 1986, 24, 228–238. [Google Scholar] [CrossRef]
- Bugajski, G.; Małyszko, M.; Wielgosz, M. Analysis of parameters influencing the suitability of the surface unit for search and rescue operation at sea. Sci. J. 2018, 125. [Google Scholar] [CrossRef]
- Li, C.; Chen, F.; Qi, F.; Liu, M.; Li, Z.; Liang, F.; Jing, X.; Lu, G.; Wang, J. Searching for Survivors through Random Human-Body Movement Outdoors by Continuous-Wave Radar Array. PLoS ONE 2016, 11, e0152201. [Google Scholar] [CrossRef]
- Vieira, F.M.; Vincent, F.; Tourneret, J.; Bonacci, D.; Spigai, M.; Ansart, M.; Richard, J. Ship Detection Using SAR and AIS Raw Data for Maritime Surveillance. In Proceedings of the 24th European Signal Processing Conference (EUSIPCO), Budapest, Hungary, 29 August–2 September 2016. [Google Scholar]
- Baber, C.; Stanton, N.A.; Atkinson, J.; McMaster, R.; Houghton, R.J. Using social network analysis and agent-based modelling to explore information flow using common operational pictures for maritime search and rescue operations. Ergonomics 2013, 56, 889–905. [Google Scholar] [CrossRef] [PubMed]


| Original Status | Code | |
|---|---|---|
| Navigational status | Underway using engine | 0 |
| At anchor | 1 | |
| Not under command | 2 | |
| Restricted manoeuvrability | 3 | |
| Constrained by her draught | 4 | |
| Moored | 5 | |
| Aground | 6 | |
| Engaged in fishing | 7 | |
| Underway sailing | 8 |
| Ship Type | Code |
|---|---|
| Cargo | 70 |
| Tanker | 80 |
| Passenger | 60 |
| Fishing | 36 |
| HSC | 40 |
| Military | 35 |
| Other | 90 |
| Pilot | 50 |
| Pleasure | 37 |
| SAR | 51 |
| Tug | 52 |
| Reserved | 38 |
| Port tender | 53 |
| Dredging | 33 |
| Law enforcement | 55 |
| Anti-pollution | 54 |
| Undefined | 0 |
| WIG | 20 |
| Diving | 34 |
| Towing | 31 |
| Towing long/wide | 32 |
| Spare 1 | 56 |
| Spare 2 | 57 |
| No party of conflict | 0 |
| Time | MMSI | Lon (deg) | Lat (deg) | Status | SOG (kn) | COG (deg) | Type | L (m) | T (m) | B (m) |
|---|---|---|---|---|---|---|---|---|---|---|
| 16:23:39 | 354749000 | 13.53027 | 55.250415 | 0 | 7.4 | 277 | 70 | 87 | 4.7 | 12 |
| 16:23:41 | 219026000 | 14.018038 | 55.221572 | 0 | 18.1 | 273.8 | 60 | 158 | 5 | 25 |
| 16:23:47 | 209864000 | 13.89797 | 55.070782 | 0 | 13.8 | 351.6 | 60 | 170 | 6 | 28 |
| 16:23:41 | 255806278 | 13.368748 | 54.932587 | 0 | 8.5 | 248.9 | 70 | 106 | 6.1 | 14 |
| 16:23:41 | 255805829 | 14.136443 | 55.224405 | 0 | 9.5 | 273.5 | 70 | 108 | 6.2 | 18 |
| 16:23:41 | 212733000 | 14.3345 | 55.255333 | 0 | 12.7 | 220 | 70 | 169 | 9.3 | 27 |
| 16:23:42 | 245772000 | 13.31946 | 55.258518 | 0 | 11.8 | 271.8 | 70 | 109 | 6.5 | 16 |
| 16:23:42 | 305299000 | 13.490572 | 54.945675 | 0 | 17.3 | 250.1 | 70 | 133 | 8.5 | 22 |
| 16:23:43 | 310133000 | 14.128607 | 55.091383 | 0 | 17.3 | 219.7 | 70 | 216 | 10.6 | 32 |
| 16:23:44 | 246670000 | 13.697983 | 55.246633 | 0 | 9.3 | 271 | 70 | 114 | 6.6 | 14 |
| 16:23:44 | 563038100 | 13.70044 | 54.990885 | 0 | 12.3 | 249.9 | 70 | 117 | 8.4 | 18 |
| 16:23:45 | 257943000 | 14.042183 | 55.23825 | 0 | 9.9 | 272 | 70 | 83 | 5 | 13 |
| 16:23:46 | 246499000 | 13.586062 | 54.977923 | 0 | 10.5 | 250.6 | 70 | 80 | 4.3 | 12 |
| 16:23:47 | 232005533 | 13.466733 | 55.24384 | 0 | 11.5 | 274.1 | 70 | 90 | 3.7 | 15 |
| 16:24:25 | 305565000 | 13.759495 | 55.174777 | 0 | 8.9 | 94.9 | 70 | 89 | 3.9 | 16 |
| 16:24:27 | 244768000 | 14.450947 | 55.247852 | 0 | 11.2 | 41.4 | 70 | 111 | 5.2 | 14 |
| 16:24:27 | 304201000 | 14.470047 | 55.278752 | 0 | 9.3 | 41.1 | 70 | 91 | 3.9 | 16 |
| 16:24:31 | 246779000 | 14.44577 | 55.25248 | 0 | 10.2 | 41.3 | 70 | 90 | 5.5 | 14 |
| 16:24:32 | 215432000 | 13.986732 | 55.16847 | 0 | 10.8 | 89 | 70 | 105 | 4.3 | 16 |
| 16:24:34 | 246447000 | 14.365483 | 55.17445 | 0 | 14.4 | 38.2 | 70 | 108 | 4.7 | 16 |
| 16:24:35 | 229010000 | 14.22193 | 55.158955 | 0 | 11.7 | 91.7 | 70 | 190 | 6.4 | 29 |
| 16:24:35 | 235059765 | 14.247938 | 55.171805 | 0 | 10.7 | 91.3 | 70 | 90 | 5.6 | 15 |
| 16:24:36 | 374821000 | 13.97153 | 55.160907 | 0 | 12.8 | 90 | 70 | 229 | 7.2 | 32 |
| 16:24:37 | 236701000 | 13.594433 | 54.70415 | 0 | 11.3 | 150.8 | 70 | 100 | 4.5 | 17 |
| 16:24:37 | 244860325 | 14.468125 | 55.260863 | 0 | 11.1 | 35.1 | 70 | 135 | 4.7 | 16 |
| 16:23:38 | 235068963 | 14.132533 | 55.154607 | 0 | 13.2 | 194.4 | 80 | 144 | 6.4 | 23 |
| 16:23:40 | 266266000 | 14.331673 | 55.266745 | 0 | 11.6 | 219.2 | 80 | 130 | 5.9 | 20 |
| 16:23:46 | 255806060 | 13.97053 | 55.04576 | 0 | 11.7 | 248.9 | 80 | 118 | 6.5 | 16 |
| 16:23:46 | 248851000 | 14.02153 | 55.051862 | 0 | 12.1 | 248.7 | 80 | 250 | 11.4 | 44 |
| 16:23:48 | 218057000 | 13.937052 | 55.084075 | 0 | 9.1 | 246.6 | 80 | 188 | 10.9 | 32 |
| 16:23:49 | 266266000 | 14.33107 | 55.266327 | 0 | 11.6 | 218.8 | 80 | 130 | 5.9 | 20 |
| 16:24:21 | 218292000 | 14.176533 | 55.15934 | 0 | 11.6 | 97 | 80 | 200 | 6.2 | 32 |
| 16:24:16 | 205465000 | 13.323733 | 54.761521 | 0 | 10.7 | 95.4 | 70 | 87 | 5.1 | 12 |
| 16:23:55 | 219001678 | 14.406083 | 54.782175 | 7 | 5.6 | 11.6 | 36 | 24 | 2.4 | 6 |
| 16:23:51 | 236111849 | 14.415112 | 54.74221 | 7 | 5.7 | 9.3 | 36 | 22 | 1.8 | 6 |
| 16:24:32 | 311033600 | 14.01603 | 54.70768 | 0 | 10.2 | 125 | 70 | 186 | 6.6 | 25 |
| 16:23:59 | 319402000 | 13.50012 | 54.715667 | 0 | 11.7 | 131.5 | 80 | 96 | 4.7 | 16 |
| 16:24:31 | 209543000 | 13.72166 | 54.583302 | 0 | 13.6 | 151.1 | 70 | 168 | 9.5 | 26 |
| 16:24:20 | 305426000 | 13.8921 | 54.416111 | 0 | 12.8 | 330.3 | 70 | 176 | 10.4 | 26 |
| 16:23:53 | 249616000 | 14.54721 | 54.87681 | 0 | 12.8 | 103 | 80 | 92 | 5.2 | 14 |
| Status | Assessment |
|---|---|
| 0, 8 | Level 1 |
| 1, 5, 7 | Level 2 |
| 2, 3, 4, 6 | Level 3 |
Publisher’s Note: MDPI stays neutral with regard to jurisdictional claims in published maps and institutional affiliations. |
© 2021 by the authors. Licensee MDPI, Basel, Switzerland. This article is an open access article distributed under the terms and conditions of the Creative Commons Attribution (CC BY) license (https://creativecommons.org/licenses/by/4.0/).
Share and Cite
Wielgosz, M.; Malyszko, M. Multi-Criteria Selection of Surface Units for SAR Operations at Sea Supported by AIS Data. Remote Sens. 2021, 13, 3151. https://doi.org/10.3390/rs13163151
Wielgosz M, Malyszko M. Multi-Criteria Selection of Surface Units for SAR Operations at Sea Supported by AIS Data. Remote Sensing. 2021; 13(16):3151. https://doi.org/10.3390/rs13163151
Chicago/Turabian StyleWielgosz, Miroslaw, and Marzena Malyszko. 2021. "Multi-Criteria Selection of Surface Units for SAR Operations at Sea Supported by AIS Data" Remote Sensing 13, no. 16: 3151. https://doi.org/10.3390/rs13163151
APA StyleWielgosz, M., & Malyszko, M. (2021). Multi-Criteria Selection of Surface Units for SAR Operations at Sea Supported by AIS Data. Remote Sensing, 13(16), 3151. https://doi.org/10.3390/rs13163151