Abstract
Taking Shanghai as an example, this paper uses remote sensing (RS) and geographical information systems (GIS) technology to conduct multisource data fusion and a spatial pattern analysis of urban carrying capacity at the micro scale. The main conclusions are as follows: (1) based on the “production, living and ecology” land functions framework and land use data, Shanghai is divided into seven types of urban spaces to reveal their heterogeneity and compatibility in terms of land use functions. (2) We propose an urban carrying capacity coupling model (UCCCM) based on multisource data. The model incorporates threshold and saturation effects, which improve its power to explain urban carrying capacity. (3) Using the exploratory spatial data analysis (ESDA) technique, this paper studies the spatial pattern of carrying capacity in different urban spaces of Shanghai. (4) We analyse the causes of the cold spots in each urban space and propose strategies to improve the urban carrying capacity according to local conditions.
1. Introduction
Rapid urbanization and expanding demand for resources and services are exerting great pressure on land and natural resources [1]. Since the 1960s, the global population has grown exponentially. The use of some resources is limited, which has led to the attraction of widespread attention to the problem of the earth’s carrying capacity [2,3]. After 40 years of reform and opening, China has gradually developed from a poor and weak developing country to the second largest economy in the world. Urbanization and industrialization have been the main themes of these years. In this process, urban diseases are not a simple problem of food shortages and environmental pollution but involve all aspects of production and human life and health. At the national level, many high-level policies and regulations have been sought to enhance urban carrying capacity [4]. Urban carrying capacity has gradually become a topic of intense interest and research among scholars.
Traditional carrying capacity research tends to focus on the macro scale and does not reflect granular information within a city. Scholars have mostly studied carrying capacity at the scale of the world, nations, urban agglomerations, provinces, basins and cities. At the global and national levels, research focuses on measuring the maximum population that can be carried by current resources (mainly food and water) and technology [5]. At the watershed scale, studies focus on evaluation of water resource carrying capacity [6,7]. At the urban level, studies have more local characteristics, focusing on the identification of major constraints. These studies look at urban land carrying capacity, urban water resource carrying capacity, urban geological carrying capacity and urban tourism carrying capacity [8,9]. Across these studies, the overall carrying capacity of a system is measured with regional statistical data. An obvious shortcoming of this traditional research is that the system cannot be measured in a more granular way.
The research object of traditional urban carrying capacity tends to be operationalized in a relatively unidimensional way, often failing to reflect the complex synthesis of components of this construct. From the perspective of the research object, studies can be divided into resource and environmental carrying capacity, which involves naturally inherent attributes, and socioeconomic carrying capacity, which can be shaped by the acquisition of attributes. The former refers to mineral, water, land and environmental resources [10,11]. The latter is the result of people’s ability to transform the city. Socioeconomic carrying capacity is essentially determined by a city’s location and the nation’s policies and economic development level. The topics considered in this stream of research include urban public infrastructure, urban public services, etc. [12,13,14]. Due to the different endowments and limitations of different regions, the contents of research on resource and environmental and socioeconomic carrying capacity are often quite different [15]. At present, most of the studies focus on the former, while few look at social and economic carrying capacity. In general, due to the multiplicity of meanings of the term carrying capacity and the uncertainty surrounding key parameters, the evaluation results are controversial.
Traditional research methods are subject to the influence of data and cannot reflect the saturation effect and threshold effect of indicators. In terms of research methods, carrying capacity is mostly measured with statistical data. The indicators generally capture positive or negative effects on carrying capacity. The weights of indicators are determined according to the analytical hierarchy process (AHP), the entropy method, the variance method, linear regression, or the Delphi method [16,17]. Finally, the ultimate carrying capacity can be determined by means of accumulation and integration through certain methods. The method of index superposition also includes the grey system clustering evaluation model with fixed or variable weights, the fuzzy comprehensive evaluation method, the TOPSIS model, etc. [18,19,20]. These kinds of methods easily ignore possible linear relationships, coupling relationships or causality between indicators. At the same time, saturation or threshold effects that may exist in the relationship between indicators often cannot be reflected in the process of index fusion, resulting in difficulties in the interpretation of the results.
To address the shortcomings in the above research, this paper zooms in on the question of urban carrying capacity at the micro scale by conducting multisource data fusion and using GIS technology. The points of innovation can be summarized into three aspects: (1) the research on urban carrying capacity is extended to the micro scale (a 300 m × 300 m grid), which makes the results more detailed and specific. (2) An urban carrying capacity coupling model (UCCCM) based on multisource data is proposed. As the model includes saturation and threshold effects, which are not considered in traditional analyses, its explanatory power is improved. (3) With an eye to the causes of low carrying capacity in certain areas, this paper proposes targeted strategies to boost the carrying capacity at the micro scale, which has important reference value.
The remainder of the paper is organized as follows: Section 2 describes the general situation of the research area and the processing of the data used in this paper, Section 3 introduces the methods, Section 4 presents the analysis results, Section 5 discusses shortcomings and directions for improvement in the future, and Section 6 summarizes the paper.
2. Overview of the Study Area and Data Processing
2.1. Study Area
Shanghai is one of the four municipalities directly under the control of the central government in China, located at the T-junction of China’s coastal economic belt and the Yangtze River economic belt. Shanghai’s administrative area is 8359 square kilometres, of which the land area is 6737 square kilometres. Since the Chinese government’s implementation of the reform and opening of the country, Shanghai has rapidly developed into an important global economic, financial, trade, shipping, scientific and technological innovation centre and cultural metropolis. Regarding its geographical coordinates, Shanghai covers 120°52′E~122°12′E, 30°40′N~31°53′N (Figure 1). From the perspective of the world, it is located in the east of the Asian continent and on the west side of the Pacific Ocean, with the Yangtze River to the north, the East China Sea to the east, Hangzhou Bay to the south, and Zhejiang and Jiangsu to the west. As shown in Figure 1, its administrative scope includes 16 districts.
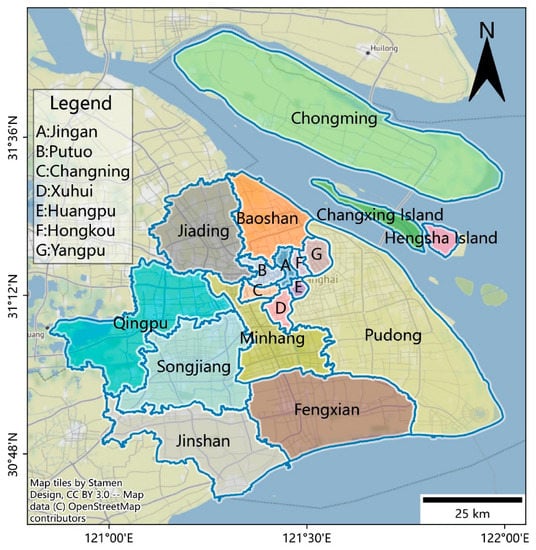
Figure 1.
Geographical location of Shanghai.
2.2. Data Processing
- (1)
- Point of interest (POI): this article collected all points of interest related to the infrastructure of Shanghai in 2018. After removal of useless information and outliers, relevant POIs were divided into eight categories: basic public facilities; scientific, educational and cultural services; medical and health care services; sports and leisure services; financial and insurance services; government agencies and social organizations; transportation facilities services; and scenic spots. The criteria of selecting interest points are whether they are related to social basic services. For example, some interest points record the activity information of the event, which are not related to this research. The standard of outlier removal is whether its information is complete and whether its category can be determined. The points of interest that cannot be judged are classified as outliers. These data contained 1,157,914 pieces of information. Due to the excessive number of observations, they were presented on a 300 m × 300 m grid in the form of point density, as shown in Figure 2a.
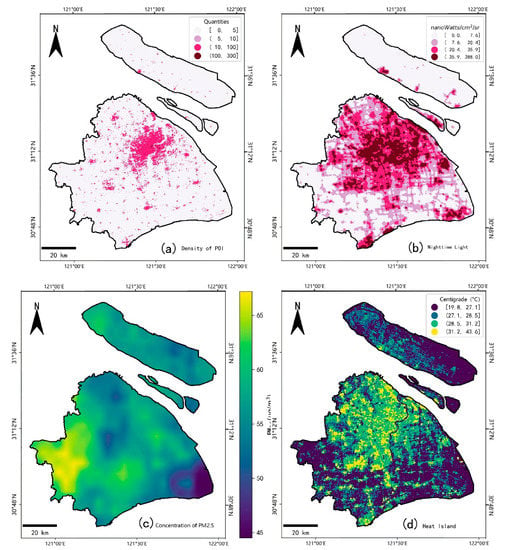 Figure 2. Results of multisource data processing. (a) Density of POI. (b) Nighttime light intensity. (c) PM2.5 concentrations. (d) Surface temperature inversion.
 - (2)
- Remote sensing data of nighttime light: nighttime light is closely related to human activities [21]. These data can be used for the estimation of socioeconomic indicators and analysis of human activities [22,23]. Based on the principle of nonsaturation and the high resolution of the radiance in the city centre, this paper selected the nighttime light data produced by NOAA’s National Climatic Data Center for research. The products selected in this paper cover daily, monthly and annual synthetic data. They correspond to different application scenarios. In order to ensure the consistency of time, this paper selects the synthetic data of 2018. After processing steps such as projection and resampling of the original data, GeoPandas [24] was finally used for visualization, as shown in Figure 2b.
- (3)
- Data on PM2.5 concentrations: PM2.5 concentration data with a global average resolution of 0.01° * 0.01° were retrieved by the Atmospheric Composition Analysis Group of Dalhousie University. The data were estimated by combining the inversion values of aerosol optical depth from MODIS, MISR and SeaWiFS sensors with the simulated values of the GEOS-Chem chemical transport mode. The accuracy verification results showed that the estimated values were highly consistent with the ground monitoring values (with an R-squared of 0.81) [25]. Through inverse distance weight interpolation and resampling, the spatial distribution of the PM2.5 concentration data of Shanghai for 2018 was finally obtained (Figure 2c).
- (4)
- Surface heat island data: most studies focus on air temperature heat islands and surface heat islands [26,27]. Temperature measurement points are limited, and most of them are located far from the Shanghai urban area. While interpolation of temperature heat island data cannot meet the accuracy requirements of this paper, surface heat islands can be retrieved by means of remote sensing data. This kind of data not only covers a wide range but also ensures the time consistency of heat island intensity. Usually, surface heat island data can be obtained by using MODIS satellite data products or thermal infrared data received by the Landsat 8 satellite. As MODIS satellite products are usually used for long time series analysis across multiple periods and have low resolution, they are not used in this paper. Landsat 8 satellite images with fewer clouds were thus selected, and the atmospheric correction method was used for inversion [28,29]. The inversion process is shown in Figure 3, and the results are presented in Figure 2d.
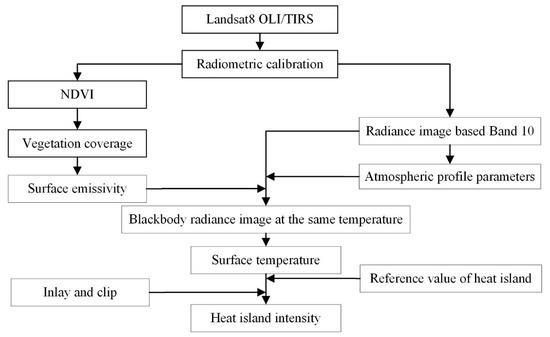 Figure 3. The process of surface heat island data inversion.
Since the theory of mixed land use was introduced into China at the beginning of the 21st century, scholars have explored the meanings and practices of mixed land use from the perspectives of spatial layout and urban development. After more than 20 years of development, China’s theoretical research in this field has become increasingly refined. Taking urban land as their research object, Wu et al. established a spatial classification of land use based on the “production, living and ecology” functional framework [30]. Based on their research, this paper divided the land in Shanghai into seven types according to their functions: urban production and living space (UPLS), rural living space (RLS), urban production space (UPS), agricultural production and ecology space (APES), agricultural ecology space (AES), other production and ecology space (OPES) and other ecology space (OES). The land use types included in different carrying spaces are shown in Table 1. The divided urban mixed-function spaces are shown in Figure 4.

Table 1.
Division of urban mixed function space based on “production, living and ecology”.
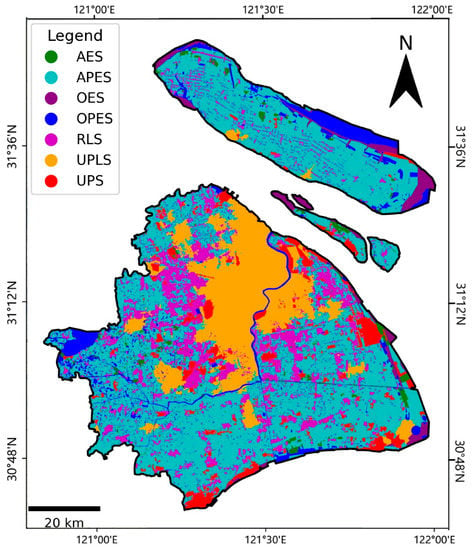
Figure 4.
Urban space division based on the “production, living and ecology” land use framework.
3. Methodology
3.1. Weight Determination Method
In information theory, entropy is a measure of uncertainty. According to the characteristics of entropy, we can use entropy to judge the degree of dispersion of an index. The greater the dispersion of the index, the greater the impact of the index on the comprehensive evaluation. Therefore, according to the variation degree of each index, the weight of each index can be calculated by using the tool of information entropy, which provides the basis for the comprehensive evaluation of multiple indexes. If m objects are selected in the evaluation, and each object has n elements, the steps of entropy method can be summarized as follows:
- (1)
- Creating original matrix R.
- (2)
- Index standardization.
- (3)
- Calculating the entropy of the j-th target.
- (4)
- Computing information entropy redundancy.
- (5)
- Calculating the weight of each index.
3.2. Multisource Data Fusion Method
The urban carrying capacity consists of the land resource carrying capacity, environmental carrying capacity, economic carrying capacity and social carrying capacity [31]. The land resource carrying capacity is represented by urban heat island data, which has a negative effect on urban carrying capacity. The environmental carrying capacity mainly considers the air quality of Shanghai and is represented by PM2.5 concentration data. The higher the concentration of PM2.5, the more serious the environmental pollution is, affecting the sustainable development of the city and reducing the city carrying capacity. The economic carrying capacity is expressed by nighttime light data. This reflects the city nighttime economic vitality, industrial structure and fixed asset investment. The stronger the economic carrying capacity, the more jobs there are for people. The dense display of advertising information is mainly concentrated in the urban economic prosperous functional areas. The traffic output light also reflects the traffic development level of the region. In a very small range, the information of light cannot be directly linked to the economy. When the scope is further expanded, there is a significant positive correlation between nighttime light and the economy [32]. Generally speaking, the higher the nighttime light intensity in a region, the more active the local economic activities, especially the life service industry, which mainly includes culture, entertainment and catering. Of course, when estimating the carrying capacity of Shanghai, the nighttime light intensity is only one of the important indexes to observe the economy. The social carrying capacity is expressed by POI data. As people upgrade the city to make it better meet their own needs, the social carrying capacity plays a supporting role in the urban carrying capacity. To sum up, the framework of the coupling model of urban carrying capacity is shown in Figure 5.
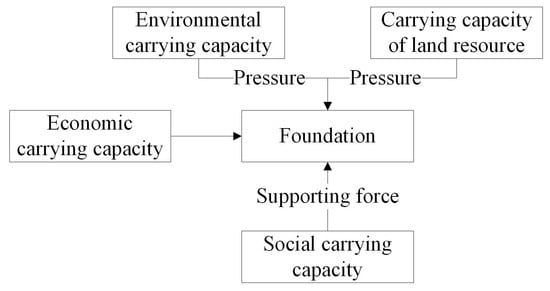
Figure 5.
Framework of the coupling model.
According to the framework, the urban carrying capacity coupling model (UCCCM) is a function of the land resource carrying capacity (C), environmental carrying capacity (E), economic carrying capacity (F) and social carrying capacity (S):
Moreover, we know that the subsystems that exert pressure on the urban carrying capacity display a threshold effect. With increasing pressure, the impact on the urban carrying capacity is constantly strengthened. For example, when air pollution is not serious, its impact on the city is not obvious. However, when air pollution exceeds a certain threshold, this impact increases sharply. The subsystems that support the urban carrying capacity display a saturation effect. For example, the initial construction of public infrastructure has an obvious effect on the urban carrying capacity. However, after the layout of infrastructure reaches a certain level, the effect of new infrastructure on the carrying capacity is weakened. Based on the above analysis and incorporating the threshold and saturation effects in the subsystem, we designed an urban carrying capacity coupling model (UCCCM), as shown in Equation (8).
where stands for the economic carrying capacity, stands for the environmental carrying capacity, stands for the land resource carrying capacity, and stands for the social carrying capacity. , and reflect the weights of the corresponding carrying capacities. is a constant, which not only ensures that the numerator is not zero but also accounts for the saturation effect within the social carrying capacity. The entropy method is used to calculate the results, which show that WR is 0.66, WE is 0.19, and WS is 0.15. At the same time, through several rounds of experiments, when k = 1, the calculation result of the bearing capacity is the most accurate.
3.3. Space Exploration Methods
In 1992, Getis et al. proposed G-statistics as indexes of spatial correlation [33]. G-statistics make it possible to evaluate the spatial association of variables within a specified distance of a single point. In these authors’ study of sudden infant death syndrome in North Carolina counties, they found that G-statistics can assess the degree of spatial refinement at different levels or the degree of spatial correlation associated with a single observation. In 1995, they optimized their original G-statistics and proposed standardized statistics (Equations (9) and (10)) [34]. Due to the unique capacity of the index to deal with high and low clustering, it has been widely used by scholars in the fields of crime analysis, demography, traffic accidents, economic geography and epidemiological studies [35,36].
where is the value of the spatial weight matrix in row of column , or represents the observed value of spatial unit or , and is the expectation. The commonly used confidence levels for a space’s cold and hot spot analysis are 99%, 95% and 90%. When the target cannot be searched at a 99% confidence level, the requirement can be relaxed to 95%, or even 90%. This paper analyzes the distribution of cold spots in Shanghai at these three confidence levels. The results show that the desired results can be found under a 99% confidence level.
4. Results
In the urban production and living space, there are obvious “cold spots” characterized by low carrying capacity in the Jiangchuan road subdistrict, Zhujing town, Yongfeng subdistrict and Songnan town (Figure 6a). The Jiangchuan road subdistrict is in the southwestern Minhang district. As many machine factories arose here, the area is emblematic of Shanghai’s heavy industry construction. The development of heavy industry has caused serious pollution, which has made development and transformation of the area slow. The region should actively promote industrial upgrading and accelerate is transition from “old Minhang” to “new Jiangchuan”. Based on regional transportation advantages, the government should seek to reshape the regional centre in important geographical areas. The government should also make a green belt along the Huangpu River to return the river to the people and actively build a livable city for the community. Zhujing town is in the geographical centre of Jinshan district. While the Jinshan district administrative centre has moved to another area, the western old city is still the main living area. At present, the eastern industrial zone is a strategically reserved grey area. Jinshan bus station is the only transportation hub in the region. Serious pollution, heavy traffic, slow renewal of old towns and population congestion are the main factors restricting the carrying capacity in this area. On the one hand, Zhujing town should take effective measures to improve the ecological environment. On the other hand, the government should promote the renewal of old towns and the transfer of population from the central area. The Yongfeng subdistrict is in the western Songjiang district. Comparatively speaking, it has no obvious advantages in terms of its economic resources or geographical location. At present, air pollution in the region is serious, infrastructure is weak, and a considerable number of zones are in the high heat island area. The Yongfeng subdistrict should fully consider its own contribution to environmental pollution and promote transformation of the region’s economic structure and industries. Its government should actively seek to brand the area as a “grain transportation state” and “memory warehouse” to enhance local culture. In addition, the government should steadily promote the construction of urban infrastructure. Songnan town is in the southeastern Baoshan district. Industry and transportation are well developed in the town. There are many large factories in the north, and the transportation industry is mainly represented by the container terminal in the east. Environmental pollution caused by large printing plants and low-density infrastructure are the main reasons for the town’s low carrying capacity. The government should formulate corresponding development policies with a view to promoting industrial upgrading and improving infrastructure construction.
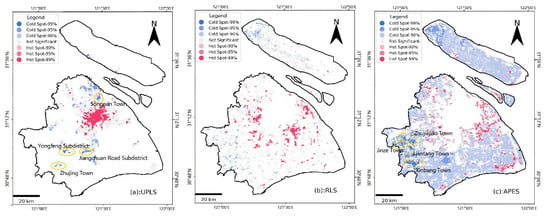
Figure 6.
Space exploration results (1).
In rural living spaces, obvious cold spots appear sporadically in Qingpu district, Songjiang district, Jinshan district and northern Chongming district (Figure 6b). Qingpu district is dominated by agriculture and is located at the junction of Jiangsu, Zhejiang and Shanghai, occupying a small area of the old city. The late development of internal rail transit resulted in poor accessibility via public transport. The government should connect the dead-end road and strive to build a comprehensive node town in the Yangtze River Delta. The branding strategy “Green Qingpu, Shangshan City” has been implemented to help improve the quality of urban ecology and life. Due to different rhythms of management and development, the residential areas in Songjiang district have become mixed with rural housing. At the same time, the transportation facilities of Songjiang and its rail transit line 9 are weak. The government should formulate a refined strategy to optimize the spatial layout and build a comprehensive transportation system with a four-network integration. Jinshan district is an industrial town with chemical industry zones on both sides. On the one hand, its government should develop other industries and gradually eliminate the ubiquitous imprint of the petrochemical industry. On the other hand, the government should actively connect with Jiashan and Pinghu, clear roadblocks, open an interprovincial bus service, and gradually build an important node of intercity interaction. There are many sporadic cold spots in the northern Chongming district. Due to the location and functional planning of Chongming Island, there is a lack of interaction with the main urban area of Shanghai. At the same time, the island’s infrastructure is weak, and educational resources are scarce. Chongming should consider a development strategy derived from the perspective of Shanghai as a whole based on the island’s special ecological function. On the premise of protecting the ecological environment, it is a good choice for Chongming to vigorously develop transportation facilities to stimulate locally advantageous industries.
In agricultural production and ecology space, a large number of obvious “cold spots” are distributed in Zhujiajiao town, Jinze town, Liantang town and Xinbang town (Figure 6c). As the main agricultural bases in Shanghai, these four towns are relatively backward in urban infrastructure, especially in transportation and medical resources. As these areas are important agricultural bases, their agricultural layout, industrial integration and functional area division also need to be further improved. Zhujiajiao town should actively break its traffic management barriers and connect with Qingpu’s new town and Qingxi’s three towns. At the same time, while pursuing its branding as a “poetic new water town”, with the help of its rich water resources, Zhujiajiao town should make efforts to build functional spaces such as water town areas, living areas and lakeside areas to build a liveable city. Jinze town should develop its high-value-added business as a national pilot programme area around Dianshan Lake. Liantang town should combine the types and distribution of agriculture, further pursue its “three-colour Liantang” and “three-life integration” branding framework, and rationalize its grain production area, water bamboo base, vegetable base and fishery breeding area. Xinbang town should develop expressways and high-speed railways so that it can serve as an important node town in the Yangtze River Delta. With the “hometown of Lotus” branding strategy at the town’s core, its ecological space should be expanded, and the integrated development of tourism, agriculture and rural areas should be promoted.
Urban production spaces are scattered around the urban area of Shanghai (Figure 7a), and the distribution of cold spots in the space is also relatively dispersed. Effective measures to enhance the carrying capacity of these regions would be to establish a high-quality business environment, work to reduce the number polluting enterprises, guide industrial transformation and upgrades, and actively improve public facilities and services. Figure 7b shows that agricultural ecology space is scattered across most areas of Shanghai. After the analysis of spatial hot spots, it was found that although there is a significant presence of cold spots, the cold spots are small and not interconnected, so the magnitude of their overall share of space is not large. Figure 7c shows that other production and ecology spaces are mainly distributed in western Shanghai and northeastern Chongming. In the space exploration, no obvious cold spots appear. Figure 7d shows that other ecology spaces are mainly distributed in southeastern Chongming, the coastal areas and the surrounding Changning Island. Spatial hot spot analysis also revealed no statistically significant cold spots. Generally, cold spots in this category are not easily detected due to the scattered distribution of these urban spaces and the weak degree of carrying capacity imbalance.
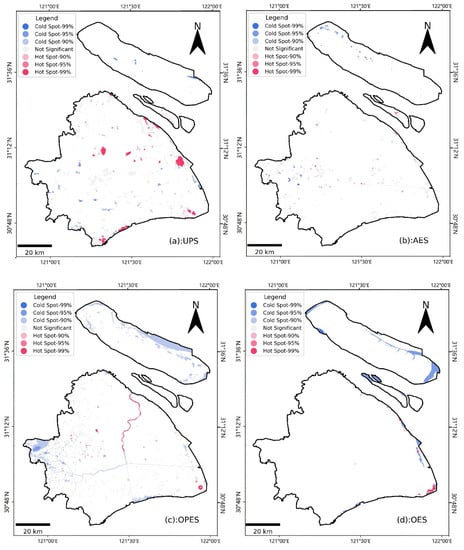
Figure 7.
Space exploration results (2).
5. Discussion
From a theoretical point of view, the analysis of geographical phenomena at the raster scale has several modern functions [37]. The integration of human and natural information at the raster scale is only an ideal representation. Naturally, economic data in society tend to be counted and analysed from the perspective of administrative units. However, for the analysis of many geographical phenomena, the results may be imprecise or unrealistic if statistics are analysed based on officially defined administrative boundaries. For example, at the intersections of different administrative boundaries, population density data can display abrupt changes that obviously do not correspond to the real situation. The possibility of encountering such discontinuities at the raster scale is greatly reduced. This scale facilitates data fusion and spatial analysis. By introducing different data processing and fusion methods at this scale, it is possible to conduct multilevel spatial analysis; this method also facilitates the overlay of data with different resolutions, different properties and different structures. From the perspective of demand, analysing the urban carrying capacity at the micro scale is conducive to granular-level management of land space. In 2018, to comprehensively improve the land planning and management capacity and enhance the spatial planning system for land resource management, Shanghai propagated the “Implementation Opinions of the CPC Shanghai Municipal Committee and Shanghai Municipal People’s Government on Strengthening the Refinement of the City’s Urban Management”. This opinion requires Shanghai’s land and urban management to be scientific and forward-looking and to establish 5902 residences and village workstations on the basis of the original urban grid management system. Obviously, to align with the objectives of granular management of land spatial planning, the urban carrying capacity must be studied at both the macro scale (Shanghai as a whole) and meso scale (subordinate districts or townships).
Similar or related studies [38,39,40] have determined that the appropriate raster size for research on Shanghai’s urban carrying capacity is between 300 m × 300 m and 1000 m × 1000 m. To this end, the authors of this paper measured the spatial distribution of urban carrying capacity in Shanghai with 300 m × 300 m, 500 m × 500 m and 1000 m × 1000 m grids based on the coupled urban carrying capacity model (Figure 8). As shown in Figure 8a, Shanghai is divided into 7442 1000 m × 1000 m grid cells, and while the distribution of the carrying capacity is visually approximately the same as that under the other two scales, the accuracy difference is very obvious. On the other hand, the maximum value of the carrying capacity at this scale is 2.29, which is significantly different from the maximum value under the 300 m × 300 m grid, which is 5.89. This large difference implies that the 1000 m × 1000 m grid scale cannot effectively identify the few areas with a very high carrying capacity in the central area of Shanghai. As shown in Figure 8b,c, when the scale is reduced to 500 m × 500 m or 300 m × 300 m, the areas with a high or low carrying capacity can be well identified. The distinction between these two scales is not great, but both are significantly better than the 1000 m × 1000 m scale. Based on the principle of the superiority of more granularity, the size of the raster was finally set at 300 m × 300 m.
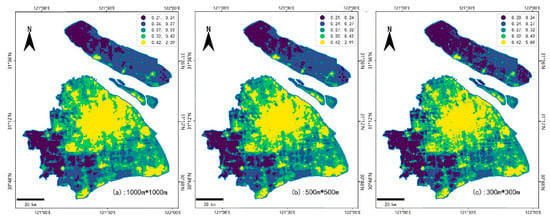
Figure 8.
Distribution of Shanghai carrying capacity at different scales.
For the reliability of the results under different scales, the total population of each district is used for verification. The carrying capacity of each district is superimposed to analyze the correlation with the total population. The population density and carrying capacity of each district in 2018 are shown in Table 2. The correlation coefficient between the carrying capacity and population is 0.749 at the scale of 300 m × 300 m; at the scale of 500 m × 500 m, the correlation coefficient between the carrying capacity and population is 0.729; under the scale of 1000 m × 1000 m, the correlation coefficient between the carrying capacity and population is 0.726. With the continuous improvement of the scale, its correlation is declining. Generally speaking, in a certain range, the lower the scale, the more accurate the bearing capacity calculation results.

Table 2.
Total population and carrying capacity of each district in Shanghai of 2018 (unit: 10,000 people).
The article still has many shortcomings. The authors hope to improve on the following aspects in the future: (1) the accuracy of some granular data is not adequate. For example, the PM2.5 concentration data have a resolution of only 0.01° × 0.01°. The authors interpolated these data for use here. In the future, the authors hope to acquire these data in a higher resolution or find more appropriate spatial data to express the corresponding carrying capacity. (2) The use of multisource data is not rich enough. For Shanghai, there are more variables that can significantly enhance or inhibit urban carrying capacity. Land subsidence, for example, also exerts pressure on the urban carrying capacity. In the fusion of multisource data, some data were missing, so they were not included in the model. (3) The integration of micro-scale research and urban planning is not close enough. The paper did not systematically analyse the spatial pattern of carrying capacity from the perspective of urban planning, despite proposing differentiated strategies to enhance the carrying capacity.
6. Conclusions
Based on the “production, living and ecology” land functions framework and land use data, Shanghai was divided into seven types of urban spaces (urban production space, urban production and living space, rural living space, agricultural ecology space, agricultural production and ecology space, other ecology space and other production and ecology space) to reveal their heterogeneity and compatibility in terms of functions and use. Then, an urban carrying capacity coupling model (UCCCM) based on multisource data was proposed and successfully applied for the spatial analysis of urban carrying capacity in Shanghai. The model incorporated the saturation and threshold effects, which have not been considered in previous analyses and which improved the explanatory power of the model for urban carrying capacity.
Using the exploratory spatial data analysis technique, this paper studied the spatial pattern of carrying capacity in different urban spaces. Carrying capacity cold spots related to urban production and living space are distributed in the Jiangchuan road subdistrict, Zhujing town, Yongfeng subdistrict and Songnan town. Cold spots related to rural living space are scattered in Qingpu, Songjiang, Jinshan and northern Chongming districts. Cold spots in agricultural production and ecology space are distributed in some areas of Zhujiajiao, Jinze, Liantang and Xinbang. Cold spots in urban production space are distributed around the downtown area of Shanghai and are relatively dispersed overall. No statistically significant cold spots were found for agricultural production and ecology space, other ecology space or other production and ecology space.
Urban production and living space cold spots are mainly caused by pollution from heavy industry and the ageing of urban areas. In view of such cold spots, the government should actively promote industrial transformation and upgrading, speed up the renewal of the old city, and gradually improve the living environment. Rural living space cold spots are mainly caused by weak infrastructure, especially a lack of transportation and education resources. To address these cold spots, the government should formulate detailed strategies, build a developed transportation network, and invest educational resources to optimize the spatial layout. Cold spots in agricultural production and ecology space arise mostly from poorly developed public infrastructure, particularly a lack of transportation and medical resources. In view of this type of cold spot, on the one hand, higher-level governments should vigorously develop transportation and medical services; on the other hand, local governments should make use of their respective cultural advantages to develop high-value-added industries.
Author Contributions
X.C., manuscript writing, methodology and visualization; Y.S., manuscript revision, conceptual design and technical guidance, fund acquisition; L.Z., data acquisition and visualization. All authors have read and agreed to the published version of the manuscript.
Funding
This research was supported by the one of key projects for Shanghai General Land Use Planning Revision (2015(D)-002(F)-11).
Acknowledgments
We thank the three anonymous reviewers for their valuable suggestions.
Conflicts of Interest
The authors declare no conflict of interest.
References
- Schroeder, P.; Anggraeni, K.; Weber, U. The Relevance of Circular Economy Practices to the Sustainable Development Goals. J. Ind. Ecol. 2019, 23, 77–95. [Google Scholar] [CrossRef] [Green Version]
- Rees, W.E. Ecological footprints and appropriated carrying capacity: What urban economics leaves out. Environ. Urban. 1992, 4, 121–130. [Google Scholar] [CrossRef]
- Wei, Y.; Huang, C.; Lam, P.T.; Yuan, Z. Sustainable urban development: A review on urban carrying capacity assessment. Habitat Int. 2015, 46, 64–71. [Google Scholar] [CrossRef]
- Central People’s Government of the People’s Republic of China. Bulletin of the State Council of the People’s Republic of China. Available online: http://www.gov.cn/gongbao/2020/issue_8266.htm (accessed on 17 April 2020).
- Taagepera, R. A world population growth model: Interaction with earth’s carrying capacity and technology in limited space. Technol. Forecast. Soc. Chang. 2014, 82, 34–41. [Google Scholar] [CrossRef] [Green Version]
- Bush, J.C.; Guhathakurta, S.; Keane, J.L.; Dworkin, J.M. Examination of the Phoenix regional water supply for sustainable yield and carrying capacity. Nat. Resour. J. 2006, 46, 925–958. [Google Scholar]
- Ait-Aoudia, M.N.; Berezowska-Azzag, E. Water resources carrying capacity assessment: The case of Algeria’s capital city. Habitat Int. 2016, 58, 51–58. [Google Scholar] [CrossRef]
- Alberti, M.; Marzluff, J.M.; Shulenberger, E.; Bradley, G.; Ryan, C.; Zumbrunnen, C. Integrating humans into ecology: Opportunities and challenges for studying ur-ban ecosystems. BioScience 2003, 53, 1169–1179. [Google Scholar] [CrossRef] [Green Version]
- Anfuso, G.; Williams, A.T.; Hernández, J.A.C.; Pranzini, E. Coastal scenic assessment and tourism management in western Cuba. Tour. Manag. 2014, 42, 307–320. [Google Scholar] [CrossRef]
- Martire, S.; Castellani, V.; Sala, S. Carrying capacity assessment of forest resources: Enhancing environmental sustainability in energy production at local scale. Resour. Conserv. Recycl. 2015, 94, 11–20. [Google Scholar] [CrossRef]
- Kessler, J. Usefulness of the human carrying capacity concept in assessing ecological sustainability of land-use in semi-arid regions. Agric. Ecosyst. Environ. 1994, 48, 273–284. [Google Scholar] [CrossRef]
- Chandra, A.; Thompson, E. Does public infrastructure affect economic activity?: Evidence from the rural interstate highway system. Reg. Sci. Urban Econ. 2000, 30, 457–490. [Google Scholar] [CrossRef]
- Papageorgiou, K.; Brotherton, I. A management planning framework based on ecological, perceptual and economic carrying capacity: The case study of Vikos-Aoos National Park, Greece. J. Environ. Manag. 1999, 56, 271–284. [Google Scholar] [CrossRef]
- Shi, Y.; Wang, H.; Yin, C. Evaluation method of urban land population carrying capacity based on GIS—A case of Shanghai, China. Comput. Environ. Urban Syst. 2013, 39, 27–38. [Google Scholar] [CrossRef]
- Pitkänen, K.; Antikainen, R.; Droste, N.; Loiseau, E.; Saikku, L.; Aissani, L.; Hansjürgens, B.; Kuikman, P.; Leskinen, P.; Thomsen, M. What can be learned from practical cases of green economy? –studies from five European countries. J. Clean. Prod. 2016, 139, 666–676. [Google Scholar] [CrossRef]
- Rezaei, R.; Yari, G. Keyfitz entropy: Investigating some mathematical properties and its application for estimating survival function in life table. Math. Sci. 2021, 1–12. [Google Scholar] [CrossRef]
- Fahim, A.; Tan, Q.; Naz, B.; Ain, Q.; Bazai, S. Sustainable Higher Education Reform Quality Assessment Using SWOT Analysis with Integration of AHP and Entropy Models: A Case Study of Morocco. Sustainability 2021, 13, 4312. [Google Scholar] [CrossRef]
- Önüt, S.; Soner, S. Transshipment site selection using the AHP and TOPSIS approaches under fuzzy environment. Waste Manag. 2008, 28, 1552–1559. [Google Scholar] [CrossRef]
- Bekesiene, S.; Vasiliauskas, A.V.; Hošková-Mayerová, Š.; Vasilienė-Vasiliauskienė, V. Comprehensive Assessment of Distance Learning Modules by Fuzzy AHP-TOPSIS Method. Mathematics 2021, 9, 409. [Google Scholar] [CrossRef]
- Elzainy, A.; El Sadik, A.; Al Abdulmonem, W. Experience of e-learning and online assessment during the COVID-19 pandemic at the College of Medicine, Qassim University. J. Taibah Univ. Med Sci. 2020, 15, 456–462. [Google Scholar] [CrossRef] [PubMed]
- Mann, M.L.; Melaas, E.K.; Malik, A. Using VIIRS day/night band to measure electricity supply reliability: Preliminary results from Maharashtra, India. Remote Sens. 2016, 8, 711. [Google Scholar] [CrossRef] [Green Version]
- Li, J.; Pan, J. Study on urban spatial expansion in Gansu Province from 1992 to 2012 based on night light. J. Glaciol. Geocryol. 2016, 38, 829–835. (In Chinese) [Google Scholar]
- Liu, H.; Du, G. Regional disparity and stochastic convergence test of China’s economic development: Based on DMSP/OLS night light data from 2000 to 2013. Quant. Tech. Econ. Res. 2017, 34, 43–59. (In Chinese) [Google Scholar]
- Jordahl, K.; Bossche, J.D.; Wasserman, J.; McBride, J.; Fleischmann, M.; Gerard, J. Geopandas/Geopandas: v0.8.1 (Version v0.8.1). Zenodo. Available online: http://doi.org/10.5281/zenodo.3946761 (accessed on 15 July 2020).
- Van Donkelaar, A.; Martin, R.V.; Li, C.; Burnett, R.T. Regional estimates of chemical composition of fine particulate matter using a combined geoscience-statistical method with information from satellites, models, and monitors. Environ. Sci. Technol. 2019, 53, 2595–2611. [Google Scholar] [CrossRef] [Green Version]
- Cristóbal, J.; Jiménez-Muñoz, J.C.; Prakash, A.; Mattar, C.; Skoković, D.; Sobrino, J.A. An Improved Single-Channel Method to Retrieve Land Surface Temperature from the Landsat-8 Thermal Band. Remote Sens. 2018, 10, 431. [Google Scholar] [CrossRef] [Green Version]
- Galdies, C.; Lau, H.S. Urban Heat Island Effect, Extreme Temperatures and Climate Change: A Case Study of Hong Kong SAR; Springer: Berlin/Heidelberg, Germany, 2020; pp. 369–388. [Google Scholar]
- Le, T.; Nie, S.; Pan, H.; Li, L. Land surface temperature inversion based on Landsat8 satellite images and analysis of urban heat island effect in Fuzhou in spring. J. Northwest For. Univ. 2019, 34, 154–160. (In Chinese) [Google Scholar]
- Cai, J.; Bai, L.; Xu, D.; Li, Y.; Liu, W. Remote sensing inversion of land surface temperature in irrigated area verified by ground infrared detection system. Trans. Chin. Soc. Agric. Eng. 2017, 33, 116–122. (In Chinese) [Google Scholar]
- Zheng, H.; Wu, C.; Shen, X. Research review and framework construction of land mixed use. Econ. Geogr. 2018, 38, 157–164. (In Chinese) [Google Scholar]
- Shi, Y.; Yin, C.; Wang, H.; Tan, W. Research progress and prospect of urban comprehensive carrying capacity. Geogr. Res. 2013, 32, 133–145. (In Chinese) [Google Scholar]
- Shi, K.; Yu, B.; Huang, Y.; Hu, Y.; Yin, B.; Chen, Z.; Chen, L.; Wu, J. Evaluating the ability of NPP-VIIRS nighttime light data to estimate the gross domestic product and the electric power consumption of China at multiple scales: A comparison with DMSP-OLS data. Remote Sens. 2014, 6, 1705–1724. [Google Scholar] [CrossRef] [Green Version]
- Wang, Z.; Lam, N.S. Extending Getis–Ord statistics to account for local space–time autocorrelation in spatial panel data. Prof. Geogr. 2020, 72, 411–420. [Google Scholar] [CrossRef]
- Ord, J.K.; Getis, A. Local spatial autocorrelation statistics: Distributional issues and an application. Geogr. Anal. 1995, 27, 286–306. [Google Scholar] [CrossRef]
- Vo, Q.T.; So, J.M.; Bae, D.H. An integrated framework for extreme drought assessments using the natural drought index, copula and Gi*statistic. Water Resour. Manag. 2020, 34, 1353–1368. [Google Scholar] [CrossRef]
- Hinman, S.E.; Blackburn, J.K.; Curtis, A. Spatial and temporal structure of typhoid outbreaks in Washington, DC 1906–1909: Evaluating local clustering with the Gi* statistic. Int. J. Health Geogr. 2006, 5, 1–17. [Google Scholar] [CrossRef] [PubMed] [Green Version]
- Zhou, C. Some understandings on the geographic grid system. In Proceedings of the National Cartography and GIS Academic Conference, Fuzhou, China, 2004. (In Chinese). [Google Scholar]
- Wang, D.; Chen, S.; Gao, Q.; Yan, L. Spatial difference analysis method of urban carrying capacity: A case study of Changzhou city. Acta Ecol. Sin. 2011, 31, 1419–1429. (In Chinese) [Google Scholar]
- Bai, Y.; Liao, S.; Sun, J. Evaluation method of accuracy loss of raster attributes and its scale effect analysis: A case study of 1:250000 land cover data in Sichuan Province. Acta Geogr. Sin. 2011, 66, 709–717. (In Chinese) [Google Scholar]
- Hu, Z.; Luo, H.; Tang, Z.; Li, S. Evaluation of natural suitability of human settlement environment based on grid scale in Yunnan Province. Reg. Res. Dev. 2009, 28, 91–94. (In Chinese) [Google Scholar]
Publisher’s Note: MDPI stays neutral with regard to jurisdictional claims in published maps and institutional affiliations. |
© 2021 by the authors. Licensee MDPI, Basel, Switzerland. This article is an open access article distributed under the terms and conditions of the Creative Commons Attribution (CC BY) license (https://creativecommons.org/licenses/by/4.0/).