Abstract
Conical hills, or residual hills, are frequently mentioned landforms in the context of humid tropical karsts as they are dominant surface elements there. Residual hills are also present in temperate karsts, but generally in a less remarkable way. These landforms have not been thoroughly addressed in the literature to date, therefore the present article is the first attempt to morphometrically characterize temperate zone residual karst hills. We use the methods already developed for doline morphometry, and we apply them to the “inverse” topography using LiDAR-based digital terrain models (DTMs) of three Slovenian sample areas. The characteristics of hills and depressions are analysed in parallel, taking into account the rank of the forms. A common feature of hills and dolines is that, for both types, the empirical distribution of planform areas has a strongly positive skew. After logarithmic transformation, these distributions can be approximated by Inverse Gaussian, Normal, and Weibull distributions. Along with the rank, the planform area and vertical extent of the hills and dolines increase similarly. High circularity is characteristic only of the first-rank forms for both dolines and hills. For the sample areas, the the hill area ratios and the doline area ratios have similar values, but the total extent of the hills is slightly larger in each case. A difference between dolines and hills is that the shapes of hills are more similar to one another than those of dolines. The reason for this is that the larger, closed depressions are created by lateral coalescence, while the hills are residual forms carved from large blocks. Another significant difference is that the density of dolines is much higher than that of hills. This article is intended as a methodological starting point for a new topic, aiming at the comprehensive study of residual karst hills across different climatic areas.
1. Introduction
The diagnostic landforms of karst terrains are dolines []. In fact, this statement is a generalization that applies primarily (but not exclusively) to temperate karsts. In humid, tropical karst areas, residual hills can be considered as the dominant forms; closed depressions are generally found in humid tropical areas as well, but their shape is usually more irregular. These irregular depressions are called cockpits []. It follows from the above that the morphometric studies aiming at the numerical characterization of the karst landforms focused more on dolines in the case of temperate karsts, while in the case of tropical karsts the characterization of positive landforms, such as cones and towers, came to the fore. In the case of tropical karsts, it is common that both positive and negative landforms are significant, therefore the parallel study of depressions and hills has been started earlier in these areas []. However, to the best of our knowledge, no detailed morphometric study of positive landforms in temperate karst areas has been performed to date, thus the aim of this article is to raise this topic, mainly from a methodological point of view, and to stimulate further studies on this topic.
To do this, we first briefly review the history of karst morphometric studies. Although some morphometric considerations have already been published by Cvijić [], we can only talk about a systematic morphometric approach from the 1970s. The work of Williams [] was seminal in this subject. He mainly dealt with polygonal karsts. The most prominent line is the morphometric study of dolines, which have been the subject of several studies since the 1980s, occasionally based on rather large databases, sometimes containing more than 10,000 sinkholes [,,]. These studies shed light on the relationship between doline development, lithology, and tectonics [,], and sought correlations between climate and some doline morphometric parameters []. Several researchers have also examined the statistical distribution of some morphometric indicators, such as the doline planform area [,,].
Morphometric analysis of tropical karst areas have also been carried out by many researchers since Balázs’s study of conical karsts []. The connection between positive and negative landforms in tropical karsts was obvious from the beginning, so this issue has been involved in morphometric studies since the work of Day [], who distinguished three landform assemblage types: in the first type, the landscape is dominated by depressions; in the second, depressions and residual hills have equal prominence; and in the third, the residual hills dominate. Attempts have also been made to classify different types of hill forms on a morphometric basis, but one of the most important objectives from the beginning was to distinguish between fengcong (peak cluster) and fenglin (peak forest) karst types and their transitions [,]. Liang et al. [] defined the following landform entities: isolated hill (IH), clustered hills (CHs), isolated sinkhole (IS), clustered sinkholes (CSs), and clustered hills with sinkholes (CHSs). An attempt to semi-automatically delineate cockpits was made by Lyew-Ayee et al. [].
In parallel with technical developments, the range of available base data and methods have also undergone significant changes. Initially, direct field measurements played a larger role, but today they are only used as ground control, as the production of large amounts of data is not realistic with this method. For decades, topographic maps have been one of the most important inputs in doline and residual hill morphometry. Naturally, the scale and quality of these varied greatly from country to country. We can say that where 1:10,000 scale maps were available, this was already a very good starting point for studying dolines, although in terrains where dolines are typically small in size, even this scale is not perfectly suitable for morphometric analysis []. In some cases, aerial photographs allowed for more accurate and detailed examinations, but in forest areas, for example, trees make it difficult to recognize doline shapes, as their growth largely equalizes the more wavy micro-topography of the ground surface [].
The most up-to-date data acquisition methods are UAV aerial photographs, from which a digital terrain model can be made using SfM methodology, and LiDAR. The disadvantage of the former is that it can also be significantly hindered by forest cover, while LiDAR is able to “see through” the forest as well. Additionally, LiDAR datasets typically cover much larger areas, so in the morphometric study of dolines and cones, LiDAR is clearly the dominant data input today. Global DEMs (SRTM, ASTER) can also be used to study larger forms (e.g., tropical cone karsts) [,], but their resolution is usually insufficient to delineate dolines.
The methods of data processing have also changed as GIS allows the handling of large amounts of data [,,,], the calculation of new parameters (e.g., doline density on a pixel basis []) and the comparison of different spatial data (e.g., geology, vegetation cover, etc.).
One of the most important steps in doline morphometric analyses is the delineation of closed forms (depressions or hills). The primary input for this is the digital terrain model and its various derivatives, such as contour lines, hillshade, slope, and curvature maps. In general, the “true edge” of dolines cannot be delineated by a contour line, but a change in slope indicates the real form outline. However, the sophisticated delimitation based on slope, or any other complex criteria, is difficult to automate, as the change in slope is very gradual in some places and the thresholds vary from place to place. Thus, according to some researchers, manual delimitation is still the most accurate method [,,]. However, automation is still needed to deal with large doline populations and to avoid subjectivity. The automated delineation can be achieved using the hydrological tools of GIS software [,,,]. The essence of this method is to first find the “sink points” of the closed depressions, and then fill the depressions to the lowermost point of the edge of their watersheds. Nevertheless, where good resolution DEMs are not available, the “outermost closed contour” method is still applied [].
Closed forms, both dolines and cones, are often nested. Dealing with these nested forms requires a hierarchical approximation. Obu and Podobnikar [] and Kobal [] have developed a method, the essence of which is to fill the already identified sinks, and then repeat the delineation procedure. As a result, there will be several ranks of depressions. With a different methodology, Liang et al. [], Wu et al. [], and Yang et al. [] analyzed the structure of closed contour lines and used them to separate cones and depressions; they also examined the hierarchy of nested forms.
Returning to the main objective, it is important to present here in what context the closed, positive landforms occurring in the temperate karst terrains are mentioned by previous researchers. As Ford and Williams [] describe: “The incision of dolines and valleys often leaves residual hills around their perimeters or along interfluves. Sometimes the hills become isolated and of conical or tower-like form.” This brief explanation of residual hill formation primarily refers to tropical forms, but similar phenomena can be found in the temperate zones as well, even if they are of different size and shape. These forms are usually referred to as “residual hill”, “conical hill”, or “rounded hill”. Ford and Williams mention, for example, a “residual hill” on the edge of Popovo Polje in the Dinaric Karst []. From Slovenia, “conical hills” are mentioned in several places, such as the Cerknica Polje [], the Classical Karst, the Dolenjska Karst, the surface above the Križna jama [], and the area of Snežnik and Gorski Kotar (the latter is already part of Croatia; []). Additionally from Croatia, the “residual hills” of the Slunj plateau are reported by Bočić [], and the frequent occurrence of “conical hills” (locally called “kuk”) is also mentioned from the southern part of Velebit []. In this area, the appearance of conical hills is explicitly associated with a geological feature, the Jelar Breccia. In the Dinaric Karst, the independent residual hills are generally called “hum” []. “Conical residual hills” have been described from the Cansiglio-Cavallo karst in Italy []. In the Slovak Karst, cone-like forms are known from the Plešivska plateau, which are considered fossil (sub) tropical forms by local researchers []. Further on, from the Taurus Mountains in Turkey, “conical or tower-shaped residual hills” are also mentioned []. Moreover, according to [], there are even “conical hills” in the Goose Arm karst of Newfoundland.
All of these descriptions show that cone peaks occur in many places, even in the temperate zone, but a review of the literature has shown that temperate karst residual hills are quite rarely dealt with in detail, and there are almost no studies on their formation or morphometry. Their occurrences along polje edges are the most characteristic, as in these places they are clearly separated from their surroundings and appear as a marked form. However, they can occur in other environments, for example on plateaus, too.
In the following, we would like to present the morphometric characterization of these landforms through the example of three small Slovenian sample areas. The crucial consideration in selecting the sample areas was that good quality LiDAR data are available for these areas.
2. Materials and Methods
2.1. Study Areas
Each of the three sample areas is an extract from a Slovenian karst plateau (Figure 1). The first sample area is located north of Snežnik mountain on the Javorniki plateau, hereinafter abbreviated in the figures as “JAV”. It has an area of 12 km2 and an elevation range of 880–1270 meters above sea level. Its main building rocks are Cretaceous limestones and, to a lesser extent, dolomites []. The second sample area is part of the Hrušica karst plateau (hereinafter abbreviated as “HRU”), with an area of 20 km2 and a slightly lower elevation range of 600–1140 meters asl. Here, Cretaceous and Jurassic limestones and, to a lesser extent, dolomites are the dominant rocks []. The third sample area is part of the Banjšice Plateau (hereinafter “BAN”), with an area of 15.3 km2 and an elevation range of 530–990 meters asl. Here, the Jurassic reef limestone is the dominant rock formation, in addition to which a small amount of Cretaceous micritic and Oolithic limestones also occur []. Each sample area is a typical temperate, mid-mountain karst plateau, belonging to the northern part of the Dinaric Karst. Their current mean annual rainfall is around 2000 mm, and they were below the snowline even during the Pleistocene, so glaciation did not directly affect their forms. Snežnik glaciation was studied in detail by [], and based on their work it is clear that the Javorniki sample area in this article was not covered by ice.
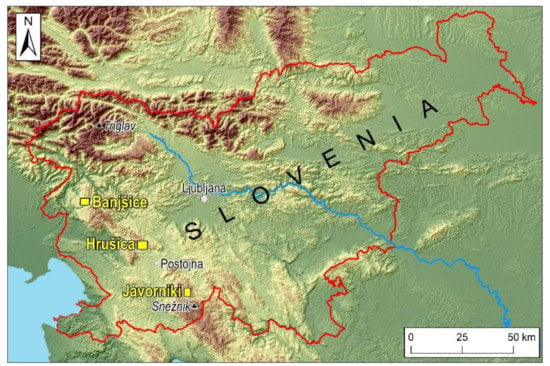
Figure 1.
Location of the study areas (Javorniki, Hrušica, and Banjšice) in Slovenia.
2.2. Base Data
The base data of this study are LiDAR data published by the Environmental Agency of the Republic of Slovenia (ARSO) []. The data is arranged in 1km × 1km tiles and can be downloaded for free. Point cloud is also available, but as only DTM was required for the present study, we used these data directly. The resolution of the DTM is 1m × 1m. Each area is significantly (or almost completely) covered by forests, but as we use LiDAR DTM, this is not a problem. No other base data were required for the present analysis.
2.3. Method
The method of processing is broadly the same as in [,,]. An important novelty of this article is that closed positive landforms are analyzed for the first time with this method. We applied the method to the closed positive landforms by multiplying the value of the elevation by −1 for the whole DTM, and in all other respects the same processing steps were applied as in the case of the dolines. Thus, the morphometric characteristics of the depressions and hills can be compared on a uniform basis.
Preprocessing consisted of two steps: first, a 5-cell (i.e., 5 m) MEAN filter was used to smooth out small bumps and pits. However, there were still plenty of small depressions that could be considered an “error” rather than a natural closed depression of karst origin (doline), so a 1 m z-limit fill was also used to eliminate these small depressions or bumps. The discussion of the value of the initial fill z-limit can be read in the study of []. Although [] suggests a value of 2 m as the minimum depth for dolines, based on the thorough inspection of DTM, we found a number of shapes with a depth of less than 2 m that otherwise looked similar to dolines, so finally a 1 m threshold was selected. As noted by [], there are no single thresholds that can achieve best results in all cases. Subsequently, the sink points (SINK) of the closed depressions were determined in the DTM, whose equivalents are the peaks (PEAK) for the closed positive forms. We then determined the watersheds belonging to the sink points and the contour of the dolines based on the lowermost point of watershed outlines. In case of hills, this step corresponds to delineation at the level of the saddle closest to the peak. After this step, the first-rank (R1) closed depressions and hills are created. In the next step, the depressions immediately adjacent to one another were filled, and the delimitation steps were repeated. This step was technically implemented in the model by selecting the depressions which were closer to each other than 10 meters, and filling them to the elevation of their common edge, before running the next iteration step. Depressions that had no close neighbor were left unfilled. Filling only the immediately adjacent depressions in one step has the advantage that no level of complex shapes is left out. If one would fill all first-order depressions after the first step, certain shapes would be omitted as demonstrated in Figure 2. The steps of fill and delineation can be repeated until the total number of higher rank depressions (or hills) drops to a very small value (or until there is no higher rank depression). In the present study, for the sake of a uniform comparison, data of the first six rank forms are presented, as the number of sixth-rank features is already small enough.
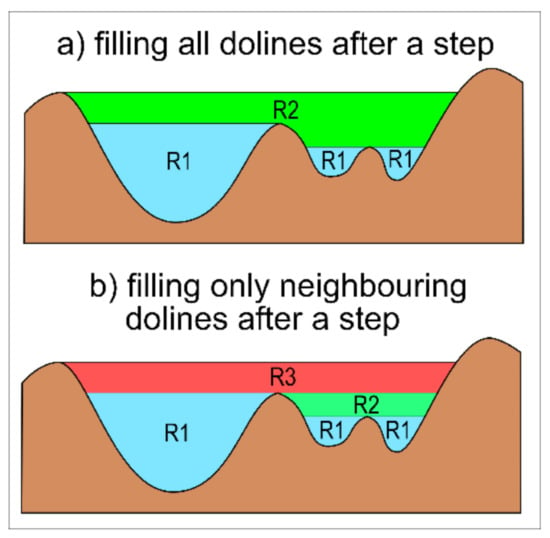
Figure 2.
The effect of filling on feature delineation. In case of filling all R1 depressions, the next step would result the large R2 doline according to the upper image. If only the neighboring depressions are filled in one step, then the smaller compound feature, R2 in the bottom image, is also detected. The second option is preferred.
The GIS part of the above procedure was performed using ArcMap 10.3 software, including Hydrological Tools (Fill, Sink, Flow direction, and Watershed) and other tools (e.g., Zonal Fill). To perform the procedures more efficiently, we created complex tools using ModelBuilder.
Abbreviation of dolines in the diagrams is “DOL”, of hills: “HILL”, and the rank is indicated by the abbreviations R1–R6. For most of the comparisons, we chose box-whisker charts as they can be used to compare several populations at once so that the important statistical parameters (min, max, quartiles, median, mean, and skewness) can be also observed in one diagram.
3. Results
The hills and dolines derived from the LiDAR DTMs are shown in the maps of Figure 3, Figure 4 and Figure 5 presenting the three sample areas (Javorniki, Hrušica, and Banjšice). Based on the shades of green and purple, it can be observed how the feature size and shape changes with increasing rank.
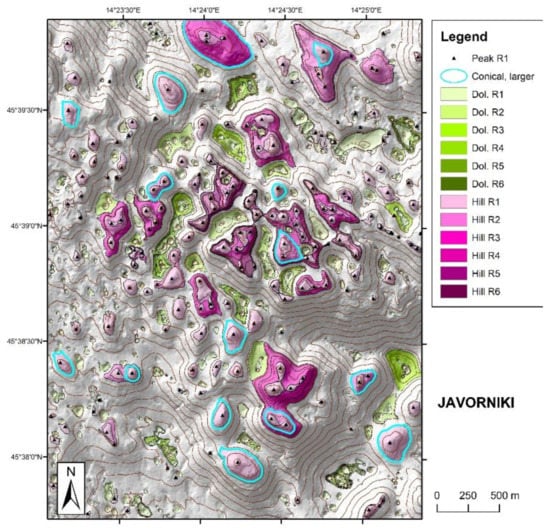
Figure 3.
Hillshade map of the Javorniki study area with dolines and karst hills of different ranks. Hills highlighted by cyan outlines are the more circular and larger conical hills (circularity > 0.7, height > 20 m). For further explanation see the Results section in text. Contour interval is 10 m.
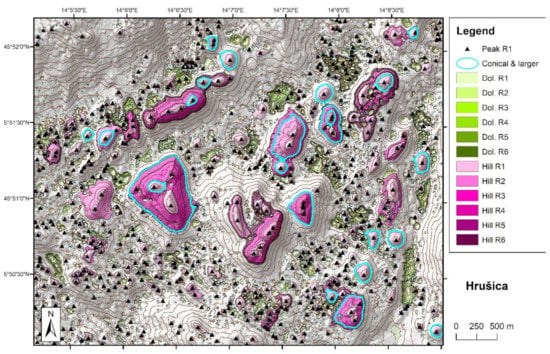
Figure 4.
Hillshade map of the Hrušica study area with dolines and karst hills of different ranks. Hills highlighted by cyan outlines are the more circular and larger conical hills (circularity > 0.7, height > 20 m). For further explanation see the Results section in text. Contour interval is 10 m.
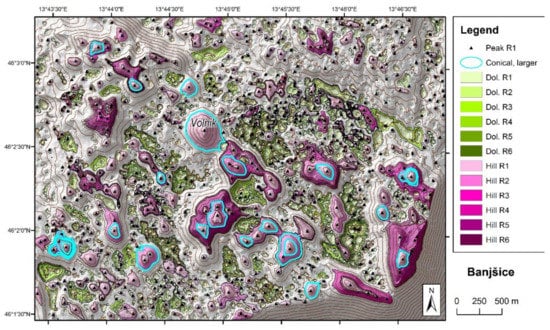
Figure 5.
Hillshade map of the Banjšice study area with dolines and karst hills of different ranks. Hills highlighted by cyan outlines are the more circular and larger conical hills (circularity > 0.7, height > 20 m). For further explanation see the Results section in text. Contour interval is 10 m. Volnik peak is the most ideal conical hill of the study areas in this paper.
3.1. Density and Area Ratio
The results of the morphometric analysis are shown numerically in Table 1 and Table 2. In addition to the minimum and maximum values of each parameter, the median value was given (where this was meaningful), as it characterizes the “typical” size of a given population better than the mean value, especially for skewed distributions, which can be strongly influenced by extreme values.

Table 1.
Morphometric parameters (count, area ratio, density, planform area, and vertical range) of dolines and hills of the study areas.

Table 2.
Morphometric parameters (A ~ H, circularity, H / D) of dolines and hills of the study areas. A: Area, H: vertical range (depth for dolines, height for cones), and D: equivalent diameter.
Firstly, the density and area ratio parameters of the forms are analyzed (Figure 6). Dolines are present in a much higher number (2–5 times) than hills in each sample area. As the rank increases, the number of features in each group decreases significantly, by a factor of 6–8 from R1 to R2, by a factor of 2–4 from R2 to R3, and by a factor of less than 2 for further steps. This applies to dolines and hills alike. The density of the first-rank dolines (which corresponds to the doline density values commonly used in doline morphometric studies) shows quite large differences among the three sample areas. It is the highest in Hrušica (140.9 km-2), medium in Banjšice (97.9 km-2), and the smallest in the area of Javorniki (30.6 km-2). The value of Hrušica is remarkably high in comparison with other areas (cf. Matarsko podolje: [], Canin: [], Velebit: [], Brač: [], Aggtelek Karst: [], Hochschwab: []), but the value of Javorniki can also be considered as upper moderate doline density. Nevertheless, doline density is not a “perfect parameter”, and it cannot be considered an unambiguous measure of karstification as, over time, for example, the density may decrease as dolines coalesce with each other, while the degree of karstification actually increases. The size of dolines must also be taken into account. The ratio of the area covered by dolines (or hills) to the total area is the area ratio (%), which takes into account the size of the forms as well []. The reciprocal of area ratio is also used in karst morphometry as the pitting index [,,], but in the present study area ratio is selected. Our results (Figure 6) demonstrate, that considering the area ratios, the dolines and the hills are approximately balanced. Among the first-rank forms, the hills predominate slightly in the case of Javorniki, the dolines in the case of Banjšice, while the values are almost identical in the case of Hrušica. However, moving towards higher rank forms, in all cases the hills predominate, i.e., they occupy more areas. Note that in the area coverage calculation, shapes smaller or equal to the given rank were taken into account, but in such a way that the overlapping parts were logically taken into account only once. Overlapping parts occur in places where lower-rank forms are in higher-rank forms.
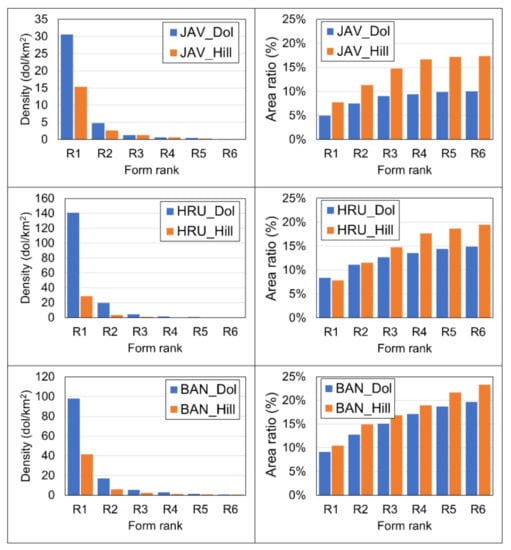
Figure 6.
Left: doline and hill density values by form rank. Right: doline and hill area ratios by form rank.
3.2. Size Parameters
Among the size parameters of dolines, a relatively robust parameter is the planform area, which better expresses the “size” of the doline than length, as the latter can give a “deceptive” impression of the size of the doline in case of highly elongated features. However, the area (A) of the doline can be easily recalculated to equivalent diameter (D), which is the diameter of the same area circle, according to the following formula:
In addition, we also examine the vertical range of the features, which can be interpreted as depth in the case of dolines and height in the case of hills. The correlation between these two factors was also examined using regression analysis.
The type of empirical distributions was examined for the first-rank forms. As many previous studies reported [,,,,,,], the distribution of the planform area of dolines is strongly positively skewed, so it is recommended to perform a logarithmic transformation on the raw data (Figure 7 and Figure 8). In the present study, we can conclude that the distribution of the planform area of the hills shows a strong positive skew similar to that of the depressions. The distributions of the vertical extent show more or less positive skewness, even after the logarithmic transformation. The distributions of the log-transformed areas, on the other hand, are closer to be symmetric. For the Javorniki sample area, both the logarithmically transformed hill area and hill height can be best modelled with the Normal distribution, which means that the type of distribution before logarithmic transformation is lognormal. For the other two sample areas, the log-transformed doline-area and hill-area distributions can be best modelled by the “Inverse Gaussian” distribution, whereas the Weibull distribution fits best to the log-transformed doline depth and hill height data (with the exception of Banjšice dolines). With two exceptions, the fit of the distributions is also supported by the Kolmogorov–Smirnov test.
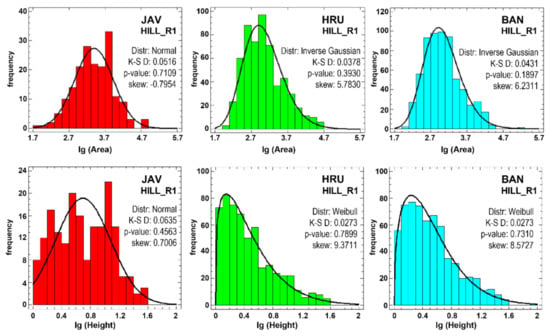
Figure 7.
Empirical distributions and fitted theoretical distributions of hill properties (area and height). Note that feature properties are logarithmically transformed on the x-axis. JAV: Javorniki; HRU: Hrušica; and BAN: Banjšice. K-S D refers to the D-value of the Kolmogorov–Smirnov tests. p-values higher than 0.05 testify that the fitted distribution cannot be rejected. Skew refers to the standard skewness of the distribution.
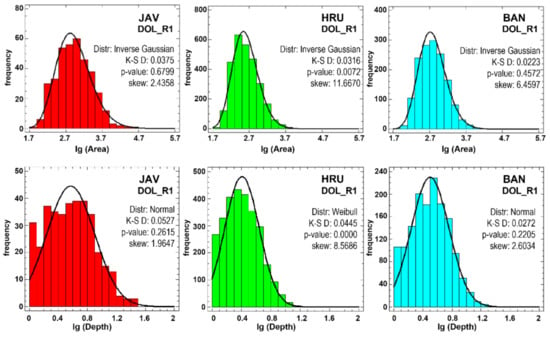
Figure 8.
Empirical distributions and fitted theoretical distributions of doline properties (area and depth). Note that feature properties are logarithmically transformed on the x-axis. JAV: Javorniki; HRU: Hrušica; and BAN: Banjšice. K-S D refers to the D-value of the Kolmogorov–Smirnov tests. p-values higher than 0.05 testify that the fitted distribution cannot be rejected. Skew refers to the standard skewness of the distribution.
In the following, we compare the parameters according to form ranks. As there are several order of magnitude differences in the planform areas, logarithmic transformation was used to illustrate them (Figure 9). The median values of the second-rank forms show a 5–7-fold increase compared to the first-order ones, a 3–4-fold increase in size when stepping from the second-order to the third-order features, and above it only a 2–fold or less increase in size. The area ratios of hills and their corresponding rank depression can be compared, for example, on the basis of the median values. In the case of Javorniki, we can find that the hills are 1.8–3.2 times larger than the same rank dolines; in the case of Hrušica, 2.6–7.8 times larger; and finally the smallest differences in the hill and doline planform areas are found in Banjšice, where this multiplier is 1.5–2.2. Considering the equivalent diameter, we find that at Javorniki, the diameter of the largest doline is 323 m and the diameter of the largest hill is 450 m. The diameters of the most extensive forms are 404 m and 792 m for Hrušica and 562 m and 645 m for Banjšice, respectively.

Figure 9.
Box-whisker plots of doline and hill planform areas. Note that feature properties are logarithmically transformed on the x-axis. The plus signs denote the mean values of the distributions. The boxes mark the ranges between the lower and upper quartiles. JAV: Javorniki; HRU: Hrušica; and BAN: Banjšice.
The depth of the closed depressions and the height of the karst hills increase at a slower rate towards the higher rank forms than in the case of the planform areas (Figure 10). Furthermore, the size multiplier between the height of the hills and the depth of the corresponding dolines is also smaller: 1.1–1.6 for Javorniki, 0.9–3.6 for Hrušica, and 0.9–2.5 for Banjšice. A value of less than 1 means that, for the latter two sample areas, the vertical extent of the karst hills is slightly smaller than that of the dolines in the case of the first-rank forms. However, this only applies to the first-rank forms. As for the deepest dolines, the record form is 37 m deep in the Javorniki sample area and, interestingly, in this area we find the deeper features, not among the higher rank forms, but among the lower rank (i.e., less complex) dolines. The forms are generally shallower in the Hrušica area, where the deepest depression is only 25 m deep. However, in this case, as expected, a complex, sixth-rank form is the deepest doline. In Banjšice, the 31.5 m depth of the deepest depression is between the values of the two previous areas, and in this case it is also a sixth-rank form. The relative height of the hills is higher than that of the corresponding dolines in each case, and again the most complex forms are not necessarily the highest. In the Javorniki area, the highest form, with 53 m, is a third-rank hill; in Hrušica, the highest value of 109 m is almost reached by a fifth-order hill; and finally Banjšice has a sixth-order hill with a similar height of 104 m.
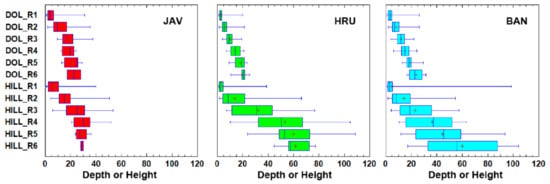
Figure 10.
Box-whisker plots of doline depths and hill heights. The plus signs denote the mean values of the distributions. The boxes mark the ranges between the lower and upper quartiles. JAV: Javorniki; HRU: Hrušica; and BAN: Banjšice.
For theoretical geometric reasons, we can assume a power function relationship between the doline depth or hill height and the planform area, in which the value of the exponent is 0.5. This relationship would apply precisely if the 3D shapes of the dolines were geometrically strictly similar to one another. In reality, of course, this is not the case, so the exponent of the best-fit power function is usually slightly higher than 0.5 (see the r2 and exponent column in Table 1). Exponents greater than 0.5 indicate that, towards larger shapes, the vertical extent increases somewhat faster than would be expected with strict geometric similarity—this is typical in most cases. On the other hand, exponents smaller than 0.5 indicate a slower increase in vertical size towards larger shapes, as can be seen for the dolines of Hrušica and Banjšice. As for the determination coefficient (r2), we always find a slightly higher determination coefficient for the hills than for the dolines. This suggests that the shape of the hills is, in a certain sense, “more uniform” than that of the dolines. This is actually an unexpected result. Even more surprising is that the determination coefficient clearly decreases with rank in the case of dolines, while it is almost constant, with some fluctuation, in the case of hills. This means that the larger hills are even more similar to one another than the larger closed depressions. This is going to be explained later in this article.
3.3. Dimensionless Parameters
Dimensionless parameters are independent of the actual size of the objects, so they are excellent for characterizing the shape. In the literature, several formulas are used for circularity (Circ); in the present study we used the following formula based on [] and []:
where A is the planform area of the feature and P is the perimeter. Accordingly, for a circle, the value of circularity is 1, and the more different the shape from the a, the smaller this value. In fact, the change in circularity can be attributed to two other factors: first, the elongation of the shape; second, the ‘zigzag’ nature of the shape can cause a decrease in circularity.
Circ = (4 · π · A)/P2
The most circular objects are undoubtedly the first-rank dolines, most of which can be characterized by circularity above 0.8 (Figure 11). However, we can also find values above 0.9 among the first-rank hills (although the median for this group is only around 0.7). As the rank increases, circularity generally decreases until the fifth-rank. An exception to this observation is the hills of Hrušica, whose circularity does not show any trend-like change from the second order upwards.
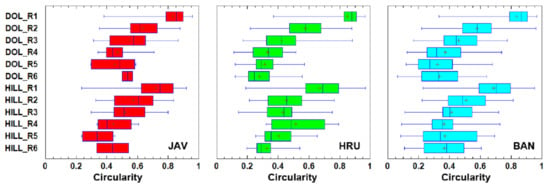
Figure 11.
Box-whisker plots of doline and hill circularity values. The plus signs denote the mean values of the distributions. The boxes mark the ranges between the lower and upper quartiles. JAV: Javorniki; HRU: Hrušica; and BAN: Banjšice.
The vertical shape of the features can be characterized by the ratio of the doline depth (or hill height) and the equivalent diameter. This is a frequently used indicator to characterize both dolines and conical hills (Figure 12). This indicator is actually closely related to the characteristic slope angle of the form; higher values are expected for steeper forms. A value of 0.1, which is typical of the study areas, indicates that a 10 m diameter corresponds to a doline depth (or hill height) of 1 m. Unlike the other parameters, the relationships are more ambiguous for this indicator, and for two study areas, we can see that the direction of change differs with increasing rank when looking at the dolines or when looking at the hills. In the case of dolines, the value of the indicator decreases with higher rank, which expresses that the larger forms are relatively shallower. This is due to the fact that they consist mainly of smaller forms that coalesce laterally, so their depths do not increase at the same rate as their areas. This is logical, and meets primary expectations. On the other hand, in the case of hills, the height/diameter ratio decreases with rank in two sample areas (Hrušica and Banjšice). This suggests that the mean slope of the hills even increases slightly for larger forms. It is in turn implied by the fact that the parts near the peak are slightly flatter than the hillsides, which corresponds to the often used term “rounded hill”. Furthermore, it also suggests that large hills, unlike dolines, are not laterally coalesced forms, but are shapes carved out from originally larger-scale blocks.

Figure 12.
Box-whisker plots of doline depth per diameter and hill height per diameter values. The plus signs denote the mean values of the distributions. The boxes mark the ranges between the lower and upper quartiles. JAV: Javorniki; HRU: Hrušica; and BAN: Banjšice.
3.4. Peaks and Sinks in Higher Rank Forms
As mentioned in the Introduction, an important aspect of the morphometric classification of tropical karsts is how the depressions and hills are located relative to each other. As Liang et al. [] pointed out, there are also small peaks in depressions, and small sinks located on hills. This kind of “mixing” is not very typical in our sample areas, but does occur. In the Javorniki sample area, for example, there are no peaks in any closed depression, even in higher ones. In the other two sample areas, there are sporadic small peaks occurring in complex depressions. For the sixth-rank depressions, the maximum number of “peaks in doline” is 5, but this is characteristic of only one form in each area. Reversed mixing (i.e., sinks in hills) is not very typical either: in the sample areas of Javorniki and Banjšice, one can find few hills having 1–3 sinks. However, in the case of Hrušica, this value can be as high as 10, though this high number is typical only for a few higher rank hills.
The complexity of dolines or hills can also be characterized by the frequency of the “own type” first-rank forms, i.e., the number of sinks in larger closed depressions or the number of peaks in larger hills. These indicators are already characterized by higher values: the fifth- and sixth-rank hills have 6–8 first-rank peaks in the median, but occasionally extreme values of greater than 10 also occur. As for the complex closed depressions, they are even more abundant in first-order sinks. The fifth- and sixth-order forms contain 8 small sinks as a median in the Javorniki area, but in the other two sample areas the median value varies between 12 and 19. The maximum number of sinks per large depression in the latter two areas is 58 and 67, respectively.
4. Discussion
According to the above results, residual hills may be significant elements of the landscape, even on temperate karst plateaus. Incidentally, it logically follows from the process of karstification that the positive forms on the karsts are closed forms with more or less circular planform shape. This is as the formation of ridges (as well as the valleys) typical of fluvial landscapes are the results of stream erosion. In holokarsts with no incised valleys, the hills remaining between the dolines will become smaller, closed forms whose “edges” are smoothed to some degree by various factors of erosion. This is essentially in line with the idea of Ford and Williams [], mentioned in the Introduction, about the formation of residual mountains, but it is important to emphasize that this also applies to temperate karst areas.
The question may arise as to what can be considered “conical hill” on a morphometric basis. In our opinion, the answer to this can be given by the above method, i.e., by the statistical analysis of the empirical distribution of “hill populations”. However, many similar questions require a short, striking answer. These answers, which represent a certain simplification, can be given using more or less arbitrarily chosen thresholds. If we consider even very small (in the order of meters) closed depressions to be dolines then, on this basis, the hills must also be considered from the order of meters. On the other hand, however, we can assign a larger size for the term “hill”. Thus, to provide here some arbitrary thresholds, we can call a feature “cone-hill” if its circularity is above 0.7 and its height is at least 20 m. Forms meeting this dual criterion are highlighted in cyan in Figure 3, Figure 4 and Figure 5. The “most ideal karst hill” within the three sample areas is certainly Volnik Hill, with a height of 98 m and a circularity of 0.83 (Figure 5).
Examining the spatial location of the hills in the studied areas in comparison with the geological maps [,,], it can be stated that in certain sample areas the spatial distribution of the larger, more pronounced hill forms can be related to certain geological formations. In the case of Javorniki, for example, to Cenomanian and Turon limestones and breccias. In the case of Hrušica, the location and elongation of the hills is parallel to the slightly curved NE–SW run of the Jurassic-Cretaceous rock boundary on the surface, and the rock boundaries are specifically associated with depressions. In the case of Banjšice, the effect of the NW–SE and WNW–ESE fault lines can be recognized. However, the analysis of these relationships is not the aim of the present work, as it is only an introduction to the parallel analysis of karst hills and depressions. Nevertheless, the analysis of the relationship of conical hills and geology should be part of future research.
It should also be noted that, in the case of morphometric calculations, the absolute values of certain indicators must be treated with care (such as the number of sinks in depressions, etc.). This is due to their actual value depending on the filling threshold value used during preprocessing. However, the relative proportions of these parameters are considered an important and objective characteristic.
An interesting question is whether the essentially raster-based methodology presented in this article or the vector-based contour algorithm presented in [,] perform better in doline and hill morphometry. We have direct experience only of the raster algorithm, and from the vector methodology we know only what was mentioned in these articles. Based on these, we can say the following:
- Theoretically, the two methods should result the same set of forms, i.e., they should, in principle, delineate the nested dolines and hills in the same way. The outlines of the forms are linked to a given elevation level by each method, so neither method solves the problem of complex delineation mentioned in the Introduction. Naturally, in further morphometric calculations, there are certain differences between the methods;
- In practice, the contour interval determines the accuracy of the delineation in case of the vector-based method. If contour lines are calculated based on a high-resolution DEM, then high accuracy can also be achieved with the vector method;
- With GIS software containing hydrological tools, the algorithm used in this article can be relatively easily implemented (although its application can be significantly accelerated by programming). The contour-based method (to our knowledge) requires the development of several stand-alone GIS tools but, once developed, they may be more efficient than the raster-based algorithm. In the absence of detailed information and analysis, this is so far only a hypothesis.
Within a single article, there is no opportunity to analyze all morphometric parameters, thus many indicators were not covered in this paper. However, this paper is not intended to close a topic, but to provide a methodological starting point for a new field of research. The following subtopics can be identified as the subject of further research:
- addition of more morphometric indicators to the analyses that were not included in this paper (e.g., hill orientation, symmetry conditions, etc.);
- comparison of different study areas. One may even think of comparing karstic and non-karstic areas; but primarily the comparison of residual hills occurring in karst areas with different climates, different geological and topographic conditions using the same methodology can be an important goal.
5. Conclusions
An important aim of this article was to draw attention to the fact that the study of karstic residual hills in the temperate karst areas also deserves more attention. This article is the first attempt to provide a thorough morphometric characterization of these landforms. The methodological principle of this approximation is that these forms can and should be analyzed in the same way as closed depressions.
Through a joint study with dolines, we demonstrated the common and different characteristics of karst residual hills and depressions in the studied sample areas in Slovenia.
One of the common features is that the empirical distribution of the planform area of both dolines and hills has a strongly positive skewness. After a logarithmic transformation, these distributions can be approximated by Inverse Gaussian or, in some cases, Normal distributions. The hill height (and to a lesser extent doline depth) distributions remain positively skewed even after the log-transformation, and can be approximated by Weibull and Normal distributions. Another common feature of dolines and hills is that, along with the rank, the planform area and the vertical extent change in a similar way. Only the first-rank forms have a high circularity for both dolines and hills. Additionally, in terms of the area ratio (or in terms of the pitting index), the hills and the dolines are surprisingly close to each other in the study areas.
Among the differences, it should be mentioned that the shape of the hills is “more uniform” compared to the dolines. This fact was proven by regression calculations between the planform area and the vertical extent. The reason for this phenomenon is that the larger closed depressions are created by the lateral coalescence of the dolines, while the karst hills can be considered as remnant forms carved out from large, uniform blocks. Related to this is the fact that the ratio of vertical extent to planform area differently varies with rank in the case of dolines or hills. We also found a significant difference in density values, in favor of dolines, which are 2–5 times as numerous as hills.
Further research should examine the extent to which observations for the present sample areas can be generalized to other karst areas.
In this article, some methodological suggestions were also made. Firstly, the basic idea was to take the inverse of the topography for the morphometric analysis of the hills, i.e., to multiply the elevation by −1. Second, although there have been examples of taking rank into account in previous publications [,,], the rank-dependent change in parameters has not yet been described in such detail for dolines. Further on, in the present article, we applied the same procedure to the hill-ranks as well.
Funding
This research received no external funding.
Institutional Review Board Statement
Not applicable.
Informed Consent Statement
Not applicable.
Data Availability Statement
Data sharing not applicable.
Conflicts of Interest
The authors declare no conflict of interest.
References
- Ford, D.; Williams, P.D. Karst Hydrogeology and Geomorphology; John Wiley & Sons: Chichester, West Sussex, UK, 2007. [Google Scholar]
- Day, M. Morphology and distribution of residual limestone hill in the karst of northern Puerto Rico. Bull. Geol. Soc. Am. 1978, 89, 426–432. [Google Scholar] [CrossRef]
- Ford, D. Jovan Cvijić and the founding of karst geomorphology. Environ. Geol. 2007, 51, 675–684. [Google Scholar] [CrossRef]
- Williams, P.W. Illustrating morphometric analysis of karst with examples from New Guinea. Z. Für Geomorphol. 1971, 15, 40–61. [Google Scholar]
- Troester, J.W.; White, E.L.; White, W.B. A comparison of sinkhole depth frequency distributions in temperate and tropic karst regions. In Proceedings of the 1st Multidisciplinary Conference on Sinkholes, Orlando, FL, USA, 15–17 October 1984; pp. 65–73. [Google Scholar]
- Kemmerly, P.R. Spatial analysis of a karst depression population: Clues to genesis. GSA Bull. 1982, 93, 1078–1086. [Google Scholar] [CrossRef]
- Kemmerly, P.R. Exploring a contagion model for karst-terrane evolution. GSA Bull. 1986, 97, 619–625. [Google Scholar] [CrossRef]
- Faivre, S.; Reiffsteck, P. from doline distribution to tectonics movements example of the Velebit mountain range, Croatia. Acta Carsologica 2002, 31, 139–154. [Google Scholar] [CrossRef]
- Pahernik, M. Spatial density of dolines in the Croatian territory. Hrvat. Geogr. Glas. 2012, 74, 5–26. [Google Scholar] [CrossRef]
- Telbisz, T. Új megközelítések a töbör-morfológiában az Aggteleki-karszt példáján (New perspectives in doline-morphometry—Aggtelek karst as an example). Földr. Közl. 2001, 125, 95–108. [Google Scholar]
- Gao, Y.; Alexander, E.C.; Barnes, R.J. Karst database implementation in Minnesota: Analysis of sinkhole distribution. Environ. Geol. 2005, 47, 1083–1098. [Google Scholar] [CrossRef]
- Pardo-Igúzquiza, E.; Dowd, P.A.; Telbisz, T. On the size-distribution of solution dolines in carbonate karst: Lognormal or power model? Geomorphology 2020, 351, 106972. [Google Scholar] [CrossRef]
- Balázs, D. Relief types of tropical karst areas. In Proceedings of the International Geographical Union European Regional Conference Symposium on Karst-Morphogenesis, Budapest, Hungary, 5–9 August 1971; pp. 16–32. [Google Scholar]
- Huang, W.; Deng, C.J.; Day, M. Differentiating tower karst (fenglin) and cockpit karst (fengcong) using DEM contour, slope, and centroid. Environ. Earth Sci. 2014, 72, 407–416. [Google Scholar] [CrossRef]
- Yang, X.; Tang, G.; Meng, X.; Xiong, L. Classification of karst fenglin and fengcong landform units based on spatial relations of terrain feature points from DEMs. Remote Sens. 2019, 11, 1950. [Google Scholar] [CrossRef]
- Liang, F.; Xu, B. Discrimination of tower-, cockpit-, and non-karst landforms in Guilin, Southern China, based on morphometric characteristics. Geomorphology 2014, 204, 42–48. [Google Scholar] [CrossRef]
- Lyew-Ayee, P.; Viles, H.A.; Tucker, G.E. The use of GIS-based digital morphometric techniques in the study of cockpit karst. Earth Surf. Process. Landf. 2007, 32, 165–179. [Google Scholar] [CrossRef]
- Day, M. Doline morphology and development in Barbados. Ann. Assoc. Am. Geogr. 1983, 73, 206–219. [Google Scholar] [CrossRef]
- Székely, B.; Telbisz, T.; Koma, Z.; Kelemen, K.; Szmorad, F.; Deák, M.; Látos, T.; Standovár, T. Geomorphometric correlations of vegetation cover properties and topographic karst features based on high-resolution LiDAR DTM of Aggtelek Karst, NE Hungary. In Proceedings of the EGU General Assembly Conference Abstracts, Vienna, Austria, 12–17 April 2015; Volume 17. [Google Scholar]
- De Carvalho, O.A.; Guimarães, R.F.; Montgomery, D.R.; Gillespie, A.R.; Trancoso Gomes, R.A.; De Souza Martins, É.; Silva, N.C. Karst depression detection using ASTER, ALOS/PRISM and SRTM-derived digital elevation models in the Bambuí group, Brazil. Remote Sens. 2014, 6, 330–351. [Google Scholar] [CrossRef]
- Orndorff, R.C.; Weary, D.J.; Lagueux, K.M. Geographic information systems analysis of geologic controls on the distribution on dolines in the Ozarks of South-Central Missouri, USA. Acta Carsologica 2000, 29, 161–175. [Google Scholar] [CrossRef]
- Denizman, C.A.N. Morphometric and spatial distribution parameters of karstic depressions, Lower Suwannee River Basin, Florida. J. Cave Karst Stud. 2003, 65, 29–35. [Google Scholar]
- Angel, J.C.; Nelson, D.O.; Panno, S.V. Comparison of a new GIS-based technique and a manual method for determining sinkhole density: An example from Illinois’ sinkhole plain. J. Cave Karst Stud. 2004, 66, 9–17. [Google Scholar]
- Telbisz, T.; Mari, L.; Ćalić, J. Doline morphometry of Mt. Miroč using GIS methods. Glas. Srp. Geogr. Drustva 2007, 87, 21–30. [Google Scholar] [CrossRef]
- Čeru, T.; Šegina, E.; Gosar, A. Geomorphological dating of pleistocene conglomerates in central Slovenia based on spatial analyses of dolines using LiDAR and ground penetrating radar. Remote Sens. 2017, 9, 1213. [Google Scholar] [CrossRef]
- Hofierka, J.; Gallay, M.; Bandura, P.; Šašak, J. Identification of karst sinkholes in a forested karst landscape using airborne laser scanning data and water flow analysis. Geomorphology 2018, 308, 265–277. [Google Scholar] [CrossRef]
- Šegina, E.; Benac, Č.; Rubinić, J.; Knez, M. Morphometric Analyses of dolines—The problem of delineation and calculation of basic parameters. Acta Carsologica 2018, 47. [Google Scholar] [CrossRef]
- Obu, J.; Podobnikar, T. Algoritem za prepoznavanje kraških kotanj na podlagi digitalnega modela reliefa (Algorithm for karst depression recognition using digital terrain model). Geod. Vestn. 2013, 57, 260–270. [Google Scholar] [CrossRef]
- Bauer, C. Analysis of dolines using multiple methods applied to airborne laser scanning data. Geomorphology 2015, 250, 78–88. [Google Scholar] [CrossRef]
- Kobal, M.; Bertoncelj, I.; Pirotti, F.; Dakskobler, I.; Kutnar, L. Using Lidar data to analyse sinkhole characteristics relevant for understory vegetation under forest cover—Case study of a high karst area in the dinaric mountains. PLoS ONE 2015, 10, e0122070. [Google Scholar] [CrossRef]
- Telbisz, T.; Látos, T.; Deák, M.; Székely, B.; Koma, Z.; Standovár, T. The advantage of lidar digital terrain models in doline morphometry compared to topographic map based datasets—Aggtelek karst (Hungary) as an example. Acta Carsologica 2016, 45, 5–18. [Google Scholar] [CrossRef]
- Öztürk, M.Z.; Şimşek, M.; Şener, M.F.; Utlu, M. GIS based analysis of doline density on Taurus Mountains, Turkey. Environ. Earth Sci. 2018, 77, 536. [Google Scholar] [CrossRef]
- Wu, Q.; Deng, C.; Chen, Z. Automated delineation of karst sinkholes from LiDAR-derived digital elevation models. Geomorphology 2016, 266, 1–10. [Google Scholar] [CrossRef]
- Stepišnik, U.; Ilc Klun, M.; Repe, B. Assessment of educational potential of geodiversity on example of Cerknica Polje, Slovenia. Dela 2017, 47, 5–39. [Google Scholar] [CrossRef][Green Version]
- Mihevc, A.; Prelovšek, M.; Zupan Hajna, N. (Eds.) Introduction to the Dinaric Karst; Karst Research Institute at ZRC SAZU: Postojna, Slovenia, 2010. [Google Scholar]
- Žebre, M.; Stepišnik, U. Glaciokarst geomorphology of the northern Dinaric Alps: Snežnik (Slovenia) and Gorski Kotar (Croatia). J. Maps 2016, 12, 873–881. [Google Scholar] [CrossRef]
- Bočić, N.; Pahernik, M.; Bognar, A. Geomorphological characteristics of the Slunj karst plateau. Hrvat. Geogr. Glas. 2010, 72, 24–25. [Google Scholar] [CrossRef]
- Gutiérrez, F.; Gutiérrez, M. Karst landforms. In Landforms of the Earth: An Illustrated Guide; Gutiérrez, F., Gutiérrez, M., Eds.; Springer International Publishing: Cham, Switzerland, 2016; pp. 59–101. ISBN 978-3-319-26947-4. [Google Scholar]
- Cucchi, F.; Finocchiaro, F. Karst landforms in Friuli Venezia Giulia: From Alpine to coastal karst. In Landscapes and Landforms of Italy; Soldati, M., Marchetti, M., Eds.; World Geomorphological Landscapes; Springer International Publishing: Cham, Switzerland, 2017; pp. 147–156. ISBN 978-3-319-26194-2. [Google Scholar]
- Jakál, J. Porovnávacia analýza krasových planín Západných Karpát (Comparative analysis of karst plateaux in the Western Carpathians). Geogr. Cas. 2001, 53, 3–21. [Google Scholar]
- Şener, M.; Öztürk, M. Relict drainage effects on distribution and morphometry of karst depressions: A casestudy from Central Taurus (Turkey). J. Cave Karst Stud. 2019, 81, 33–43. [Google Scholar] [CrossRef]
- Gunn, J. (Ed.) Encyclopedia of Caves and Karst Science; Taylor & Francis Books: Oxfordshire, UK, 2004. [Google Scholar]
- Šikić, D.; Pleničar, M.; Šparica, M. Osnovna Geološka Karta SFRJ, List Ilirska Bistrica, 1:100,000; Savezni Geološki Zavod: Belgrade, Serbia, 1972. [Google Scholar]
- Buser, S.; Grad, K.; Pleničar, M. Osnovna Geološka Karta SFRJ, List Postojna, 1:100,000; Savezni Geološki Zavod: Belgrade, Serbia, 1967. [Google Scholar]
- Buser, S. Osnovna Geološka Karta SFRJ, List Tolmin in Videm, 1:100,000; Savezni Geološki Zavod: Belgrade, Serbia, 1987. [Google Scholar]
- Lidar GIS Viewer, Slovenia. Available online: http://gis.arso.gov.si/evode/profile.aspx?id=atlas_voda_Lidar@Arso&culture=en-US (accessed on 28 May 2021).
- Verbovšek, T.; Gabor, L. Morphometric properties of dolines in Matarsko Podolje, SW Slovenia. Environ. Earth Sci. 2019, 78, 396. [Google Scholar] [CrossRef]
- Telbisz, T.; Mari, L.; Szabó, L. Geomorphological characteristics of the Italian Side of Canin Massif (Julian Alps) using digital terrain analysis and field observations. Acta Carsologica 2011, 40, 255–266. [Google Scholar] [CrossRef]
- Faivre, S.; Pahernik, M. Structural influences on the spatial distribution of dolines, Island of Brac, Croatia. Z. Für Geomorphol. 2007, 487–503. [Google Scholar] [CrossRef]
- Plan, L.; Decker, K. Quantitative karst morphology of the Hochschwab plateau, Eastern Alps, Austria. Z. Für Geomorphol. Suppl. Issues 2006, 147, 29–54. [Google Scholar]
- Bondesan, A.; Meneghel, M.; Sauro, U. Morphometric analysis of dolines. Int. J. Speleol. 1992, 21, 1–55. [Google Scholar] [CrossRef]
- Davis, J.C. Statistics and Data Analysis in Geology, 3rd ed.; JohnWiley & Sons: New York, NY, USA, 2002; ISBN 978-0-471-17275-8. [Google Scholar]
Publisher’s Note: MDPI stays neutral with regard to jurisdictional claims in published maps and institutional affiliations. |
© 2021 by the author. Licensee MDPI, Basel, Switzerland. This article is an open access article distributed under the terms and conditions of the Creative Commons Attribution (CC BY) license (https://creativecommons.org/licenses/by/4.0/).