Article

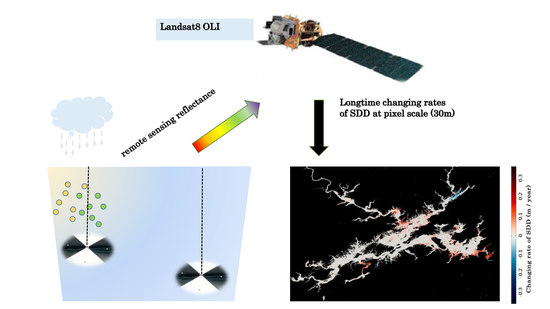
Monitoring Changes in the Transparency of the Largest Reservoir in Eastern China in the Past Decade, 2013–2020

1
State Key Laboratory of Satellite Ocean Environment Dynamics, Second Institute of Oceanography, Ministry of Natural Resources, Hangzhou 310012, China
2
Southern Marine Science and Engineering Guangdong Laboratory (Guangzhou), Guangzhou 510000, China
3
Ministry of Ecology and Environment Center for Satellite Application on Ecology and Environment, Beijing 100094, China
4
Ecological Environment Satellite Data Resource Sub-Center, The National Earth Observation Data Center, Beijing 100094, China
5
National Earth System Science Data Center, Beijing 100101, China
6
Institute of Environmental Protection Science, Hangzhou 310014, China
*
Author to whom correspondence should be addressed.
Remote Sens. 2021, 13(13), 2570; https://doi.org/10.3390/rs13132570
Submission received: 10 May 2021 / Revised: 13 June 2021 / Accepted: 26 June 2021 / Published: 30 June 2021

Abstract

:
Based on characteristics analysis about remote sensing reflectance, the Secchi Disk Depth (SDD) in the Qiandao Lake was predicted from the Landsat8/OLI data, and its changing rates on a pixel-by-pixel scale were obtained from satellite remote sensing for the first time. Using 114 matchups data pairs during 2013–2019, the SDD satellite algorithms suitable for the Qiandao Lake were obtained through both the linear regression and machine learning (Support Vector Machine) methods, with remote sensing reflectance (Rrs) at different OLI bands and the ratio of Rrs (Band3) to Rrs (Band2) as model input parameters. Compared with field observations, the mean absolute relative difference and root mean squared error of satellite-derived SDD were within 20% and 1.3 m, respectively. Satellite-derived results revealed that SDD in the Qiandao Lake was high in boreal spring and winter, and reached the lowest in boreal summer, with the annual mean value of about 5 m. Spatially, high SDD was mainly concentrated in the southeast lake area (up to 13 m) close to the dam. The edge and runoff area of the lake were less transparent, with an SDD of less than 4 m. In the past decade (2013–2020), 5.32% of Qiandao Lake witnessed significant (p < 0.05) transparency change: 4.42% raised with a rate of about 0.11 m/year and 0.9% varied with a rate of about −0.09 m/year. Besides, the findings presented here suggested that heavy rainfall would have a continuous impact on the Qiandao Lake SDD. Our research could promote the applications of land observation satellites (such as the Landsat series) in water environment monitoring in inland reservoirs.

Graphical Abstract

1. Introduction

As an important ecological environment, inland lakes and reservoirs (hereafter referred to as lakes) provide important water and fishery resources for human society [1]. It plays an important role in biodiversity protection [1] and researches on global climate change [2] or the Earth’s material circulation [3]. In the context of climate change, affected by human activities, the lakes are under multiple environmental pressures [4], have become one of the most sensitive ecological environments to global climate change [5]. In the past 100 years, the ecological environment of lakes on a global scale has changed significantly, such as the rising water temperature [6,7,8], the increasing frequency of cyanobacteria blooms [9], the decreasing water transparency [10], and the retreating of lakes basins [11]. Therefore, in the context of changing ecological environment, it is essential to monitor the water environment variability for better understanding and managing the relationship between the environment and sustainable development in the lake regions [4].
Water transparency is referred to the diminution of radiant energy with depth at visible wavelength, by both scattering and absorption mechanisms, indicating the clarity of water [12]. It is determined by both the water inherent and apparent optical properties [13]. Therefore, changes in transparency are closely related to the content and composition of optically active constituents [12,14], making it an important indicator for evaluating water ecological environment [9,15]. In field observations, water transparency could be measured by both optical sensors and the Secchi disk [12,16]. Partly owing to its simplicity, the Secchi disk depth (SDD), usually defined as the water depth where a Secchi disk is no longer visible to the human eye [17], has been widely used to indicate water transparency [14,18]. Since its origin in the Mediterranean Sea in 1865, SDD has become one of the basic parameters of ocean color research [19,20]. As phytoplankton related materials dominate the color of most oceans, SDD was also adopted to characterize the coastal eutrophication [21], ocean chlorophyll concentration [22], or primary production [16]. Unlike the situation in most oceans, using SDD to indicate lake water quality or eutrophication is limited [12]. As the constitutes in lake water vary by surrounding environments, the same SDD could be corresponding to different water qualities: e.g., black water with high dissolved organic compounds level, green water with abundant phytoplankton biomass, yellow water with rich clays, and milky color water with high particulate calcium carbonate content ([12,13] and references therein). It is inappropriate to estimate water tropic state by SDD when abundant non-algal materials existed [12]. Therefore, SDD is generally used in research to indicate the clarity of lake water [23], with its values that could vary from few centimeters to about 40 m in high turbid and clean lakes, respectively [12]. Meanwhile, under the condition that water is less effected by suspended inorganic matter, transparency (hence SDD) could provide information about water quality or eutrophication [12], which is important in the monitoring of lakes environment variability [15,24].
The Qiandao Lake, also known as the Xin’anjiang Reservoir, is located in the west of the Zhejiang Province, China (118.6°–119.23°E, 29.37°–29.83°N). As the largest (580 km2) deep reservoir (average depth is about 34 m) in eastern China and an important source of potable water [25], the monitoring of water environment in the Qiandao Lake is an important part of reservoir management. According to field and satellite observations, phytoplankton dominates the change of suspended matters in most areas of the Qiandao lake, with high values generally occur during boreal summer and early autumn (July to September) [26]. Quantitatively, Yang, et al. [27] reported that the annual mean values of chlorophyll and SDD were about 2.72 ± 1.38 mg/m3 and 5.6 ± 0.94 m in the lake, based on monthly field measurements conducted at five stations during 2002–2011. Satellite-derived results further revealed that the annual mean value of surface chlorophyll in about 94% lake areas was less than 3.65 mg/m3 [28], and the annual average suspended matter concentration for the entire lake was about 2.19 mg/L [29]. Overall, the Qiandao Lake performed oligotrophic as a whole, with the observed annual average trophic state index introduced by Carlson [30] was about 26.6 in the period of 2007–2011 [27].
In addition to the monitoring, other field and modeling efforts have added to the knowledge of regional or entire lake environment changes in this area. Since the 1990s, partially attributed to human activities-induced nutrients increase, regional eutrophication and blooms were found in the Qiandao Lake ([25] and references therein). Besides, the lake is vulnerable to climate change, under the condition of heavy rainfall events, significant environment variability happened in areas near rivers [31,32]. On the other hand, some researchers reported significant inter-annual variability of the lake environment, e.g., raising water temperature during 1951–2012 [33] and increased trophic state index during 2007–2011 [27], which might affect the SDD variability in the Qiandao Lake. Based on measurements carried out at two fixed stations, Wu, et al. [25] and Zhang, et al. [33] reported a decreasing SDD in the northeast and southeast areas from 1987 to 2013. However, as field measurements by the Secchi disk can only be conducted in limited areas, it is insufficient for longtime change analysis and couldn’t characterize the spatial fine variability of SDD, which is important for environmental monitoring in lakes that are greatly affected by regional activities [24]. At present, for SDD satellite monitoring, related research mainly focused on large-scale algorithm construction, and considered the Qiandao Lake as a whole [15,23,24,34]. As the performances of algorithms vary by the lake optical properties [34], it is necessary to collect more observation data and conduct algorithm evaluation, to improve the accuracy of SDD estimation in this area. Currently, in the context of environmental variability and continuous artificial improvement of the catchment environment (e.g., the “Xin’an River Basin Ecological Restoration” plan initiated in 2012 and the “Five Types Waters Co-governance” plan initiated in 2013), corresponding long-term changes of Qiandao Lake SDD in the past decade remain unclear.
Therefore, the objectives and contents of this research are as follows: (1) to construct satellite monitoring algorithms for SDD in the Qiandao Lake based on evaluating the performances of published models; (2) to analyze the fine spatiotemporal distribution and long-term variability of Qiandao Lake SDD in the past decade, 2013–2020; and (3) to discuss the influence of climate change-induced extreme weather events (summer heavy rainfall) on SDD changes in this region.

2. Materials and Methods

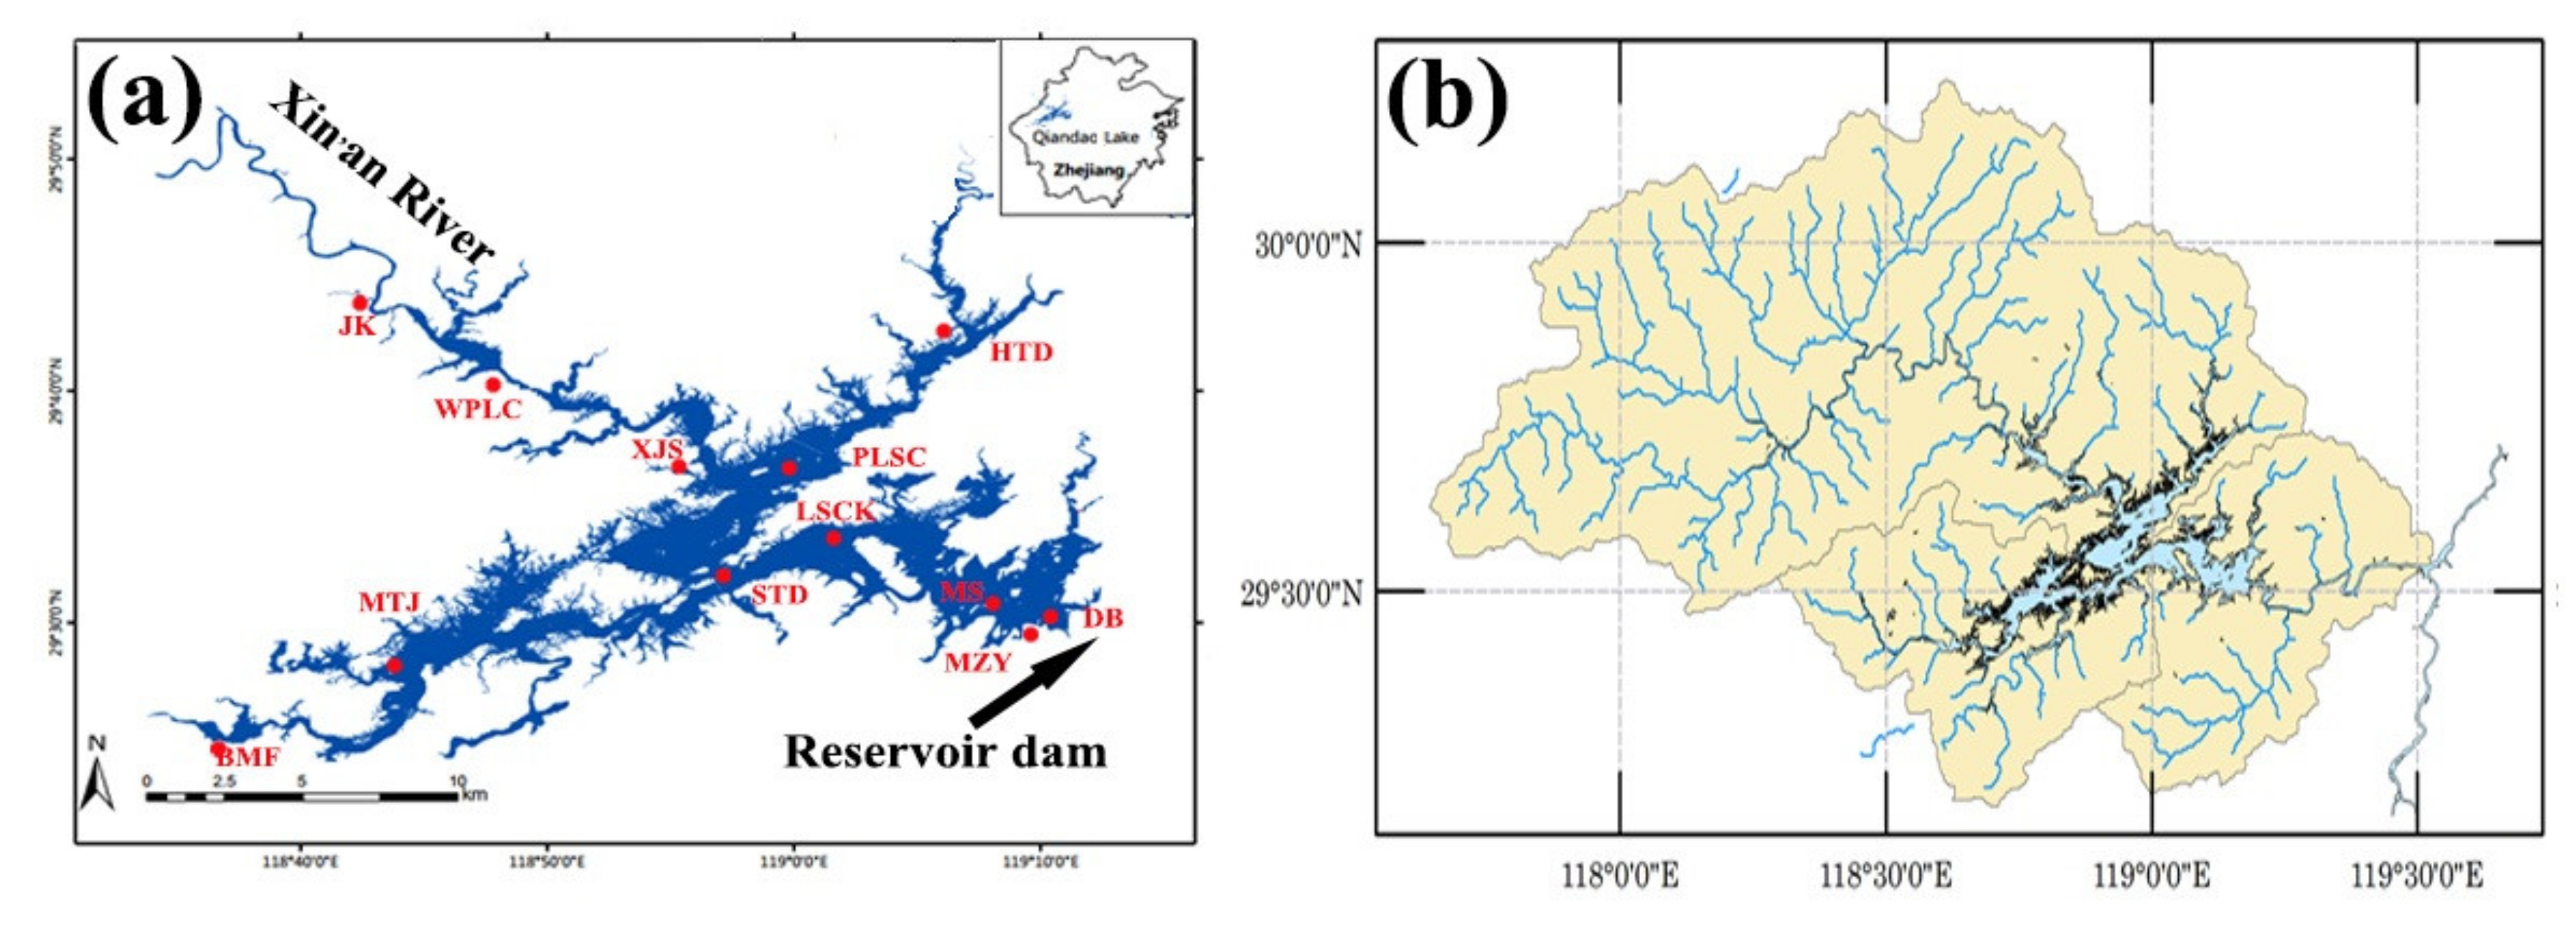
2.1. Data Used in Research
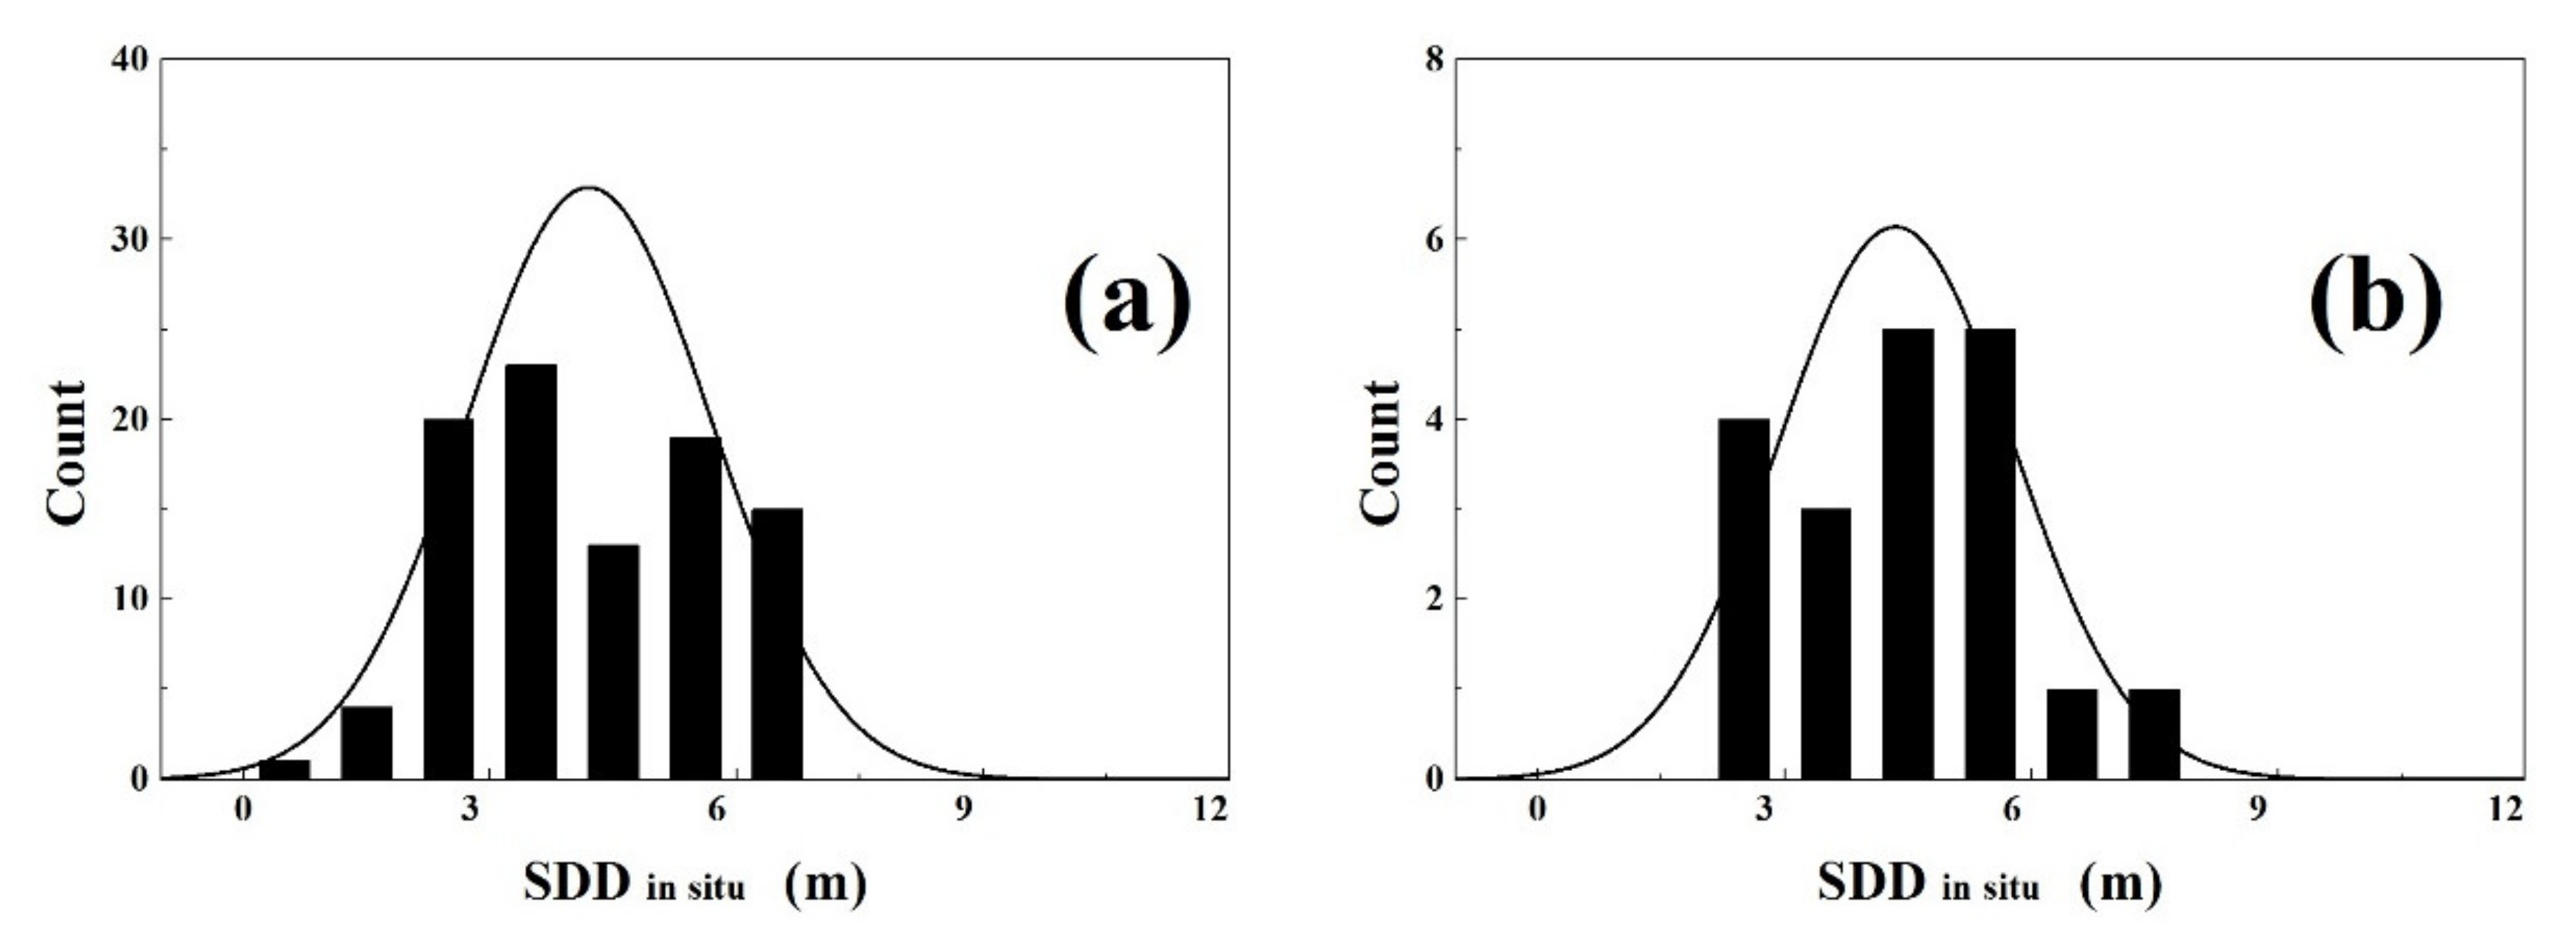
2.1.1. In Situ Data

In situ data used in this research included the SDD and water level data of the Qiandao Lake. Between them, daily water level data (m) of the Qiandao Lake in 2020 were obtained from the water and rain information online service system of Chun’an County (http://caslj.hzyuansi.com/Onereports/OneStWater_day.aspx (accessed on 2 March 2021)). SDD data were measured at 12 fixed stations (Figure 1a) during the monthly operational observation voyage of the Hangzhou Academy of Environmental Sciences between 2013 and 2019. At each station, the SDD was measured on the shady side of the boat by using a 30-cm diameter Secchi disk following the protocols of NASA [35]. Figure 1b showed the catchment region of the Qiandao Lake for reference.
As shown in Figure 2a, the field sampling period and single survey sampling quantity were relatively stable during 2013–2019. The number of SDD observations in different months was close (between 40–60), suggesting that these data could represent main characteristics of SDD in the Qiandao Lake. Despite the spatiotemporal distribution caused differences in the same month, in situ SDD of the Qiandao Lake presented as a single trough change throughout the year, with the highest in winter (average value of about 6 m) and the lowest in summer (average value of about 3 m). Based on the histogram analysis results (Figure 2b), the in situ SDD dataset was overall normally distributed, varied within the range of 5–12 m, with an average value of about 4.09 m. Most of the SDD observations were within the range of 2–6 m, with about 93% were concentrated in less than 7 m (Figure 2b). Details about the SDD monitoring stations were shown in Table 1.

2.1.2. Satellite Data

Satellite-derived data used in this research included remote sensing reflectance (sr−1) and rainfall (mm·d−1) products. Limited by spatial resolution (generally larger than 1 km), traditional watercolor sensors (e.g., SeaWiFS, MODIS, and MERIS) could not provide detailed spatial changes of SDD in narrow water masses, like the Qiandao Lake (Figure 1a). Therefore, the high spatial resolution (30 m) Operational Land Imager (OLI) multispectral bands remote sensing reflectance data carried on the Landsat8 satellite were selected for analysis in this research. The OLI observes as a 185 km wide swath, and a single observation can cover the entire water mass of the Qiandao Lake. Since its launch in 2013, the OLI data has been widely used for long-term water quality monitoring of inland rivers and lakes [24]. In this research, the valid OLI image data in the Qiandao Lake from January 2013 to August 2020 were downloaded from the Geospatial Data Cloud (http://www.gscloud.cn/ (accessed on 11 September 2020)) platform. To obtain remote sensing reflectance products, we used ENVI tools to perform radiation correction and atmospheric correction, respectively. During ENVI processing, the FLAASH method was used for atmospheric correction as proposed by Cooley, et al. [36]. Table 2 listed the detailed settings of the OLI sensor’s multispectral bands.
Rainfall data were collected from NASA’s GPM program. The GPM rainfall product is a fusion dataset of multiple satellite-based microwave/infrared sensor measurement data and ground-based verification data, which could provide accurate rainfall observation results (uncertainty < 0.5 mm·h−1) covering the world (https://pmm.nasa.gov/precipitation-measurement-missions (accessed on 19 October 2020)). When investigating rainfall change of the Qiandao Lake in 2020, we used corrected daily accumulated rainfall products (mm·d−1, precipitationCal, combined microwave-IR, estimate-Final Run, version-06), with a spatial resolution of 1/10°, for analysis. The total rainfall of the Qiandao Lake was calculated as the sum of valid GPM rainfall data within the catchment region (Figure 1b).

2.2. Analysis Method

2.2.1. The Matchup Method between Satellite and In Situ Data

Unlike in situ measurements performed at fixed locations, satellite-derived pixels reflected an average state of the observation object in a certain square (depending on the sensor spatial resolution, e.g., 30 m for OLI) as the satellite passing by. In the process of algorithm construction and verification, satellite and field observations are required to have close temporal and spatial resolutions [37]. Qiandao Lake is a deep-water artificial reservoir, so under normal conditions (non-artificial flood discharge and heavy rainfall events), the short-time SDD variability is generally weak [25]. Referring to the Song, et al. [15] method, in this research, the matching strategy of satellite and in situ observations was set as follows: spatially, filed stations were matched up to the nearest 1 × 1 satellite pixels; temporally, a time interval of 7 days was used. During analysis, the ‘Feature extraction’ function of ArcGIS10.5 software was adopted to extract the corresponding satellite data through the ‘.shp’ file of the field stations (Table 2).
Finally, 114 matching data pairs were produced through the matching strategy mentioned above during 2013–2019. Among them, 95 data pairs during 2013–2017 were selected as the modeling dataset for algorithm construction; 19 data pairs during 2018–2019 were used as the individual verification dataset for algorithm accuracy evaluation. Figure 3a,b showed the histogram distribution of the modeling and validation dataset, respectively. In general, these datasets covered the in situ SDD variability (Figure 2b), could be applied to the development and evaluation of the SDD algorithm in the Qiandao Lake.

2.2.2. SDD Algorithms Construction Approaches

At present, regression and machine learning-based methods have been widely used in research about water quality [38,39]. Therefore, in this research, based on matching data pairs, we applied both the stepwise linear regression fitting and Support Vector Machine (SVM) approaches to obtain the SDD satellite inversion algorithm. The basic idea of the stepwise regression and SVM method is to create an optimal model to predict the vector ‘Y’ using a subset of the predictors given by columns of the matrix ‘X’.
The stepwise method could build a regression model from a set of candidate variables and let the system automatically identify influential variables. During the regression process, initially no predictors are included in the model. Then, independent variables are gradually inputted into the model. If the model is statistically significant (p < 0.05), the input variable is included in the regression model. Meanwhile, the old independent variables are tested, and variables that are not statistically significant (p > 0.1) are removed. In this way, until neither the new variable is introduced nor the old variable is deleted, an automatically optimal multiple linear regression equation is obtained.
The SVM method is a supervised learning method used for classification and regression. The basic idea of the SVM method is to map the training data points into a high dimensional feature space based on a kernel function [38]. In the feature space, there exist many decision boundaries called hyperplanes that are separating different classes of data points. SVM aims to find an optimal hyperplane in the feature space that can give the correct classification and has the smallest distance from all data points. For prediction, an automatically optimal SVM model with multiple input parameters is generated through the training process. Then, based on the trained SVM model, we can predict the variability of dependent variables (e.g., SDD) by inputting new data of trained parameters (e.g., Rrs).
During the analysis process, both the stepwise linear regression and SVM methods were completed through the Matlab R2017 Regression Learner tool. It affords an interactive interface for model building and evaluation. Besides, to perform sensitivity analysis on the selection of validation samples, five folds cross-validation approach was adopted in the model construction.

2.2.3. Statistical Parameters

The determination coefficient (r2) and significant level (p) were obtained through statistics in the algorithm construction processes, to analyze the performance of the fitting results. Besides, to quantitatively evaluate the accuracy of satellite-derived SDD, some statistical parameters as follows were performed: (1) Bias (Equation (1)), provided information of overall bias. (2) MAE (mean absolute difference, Equation (2)) and RMSE (root mean squared error, Equation (3)), provided the uncertainty for the comparison. During the analysis process, statistical analyses were conducted by using the Origin9.0 software (OriginLab Corporation, Northampton, MA, USA):
Bias = (SDDiRS − SDDiin situ)/SDDiin situ,
MAE = mean(abs(SDD RS − SDDin situ)/SDDin situ)
RMSE = (sum((SDDiRS − SDDiin situ)2)/(N − 1))0.5, i ϵ [1,N]
where SDDRS and SDDin situ are satellite-derived and in situ SDD values, respectively; N is the number of matching data pairs.

3. Results

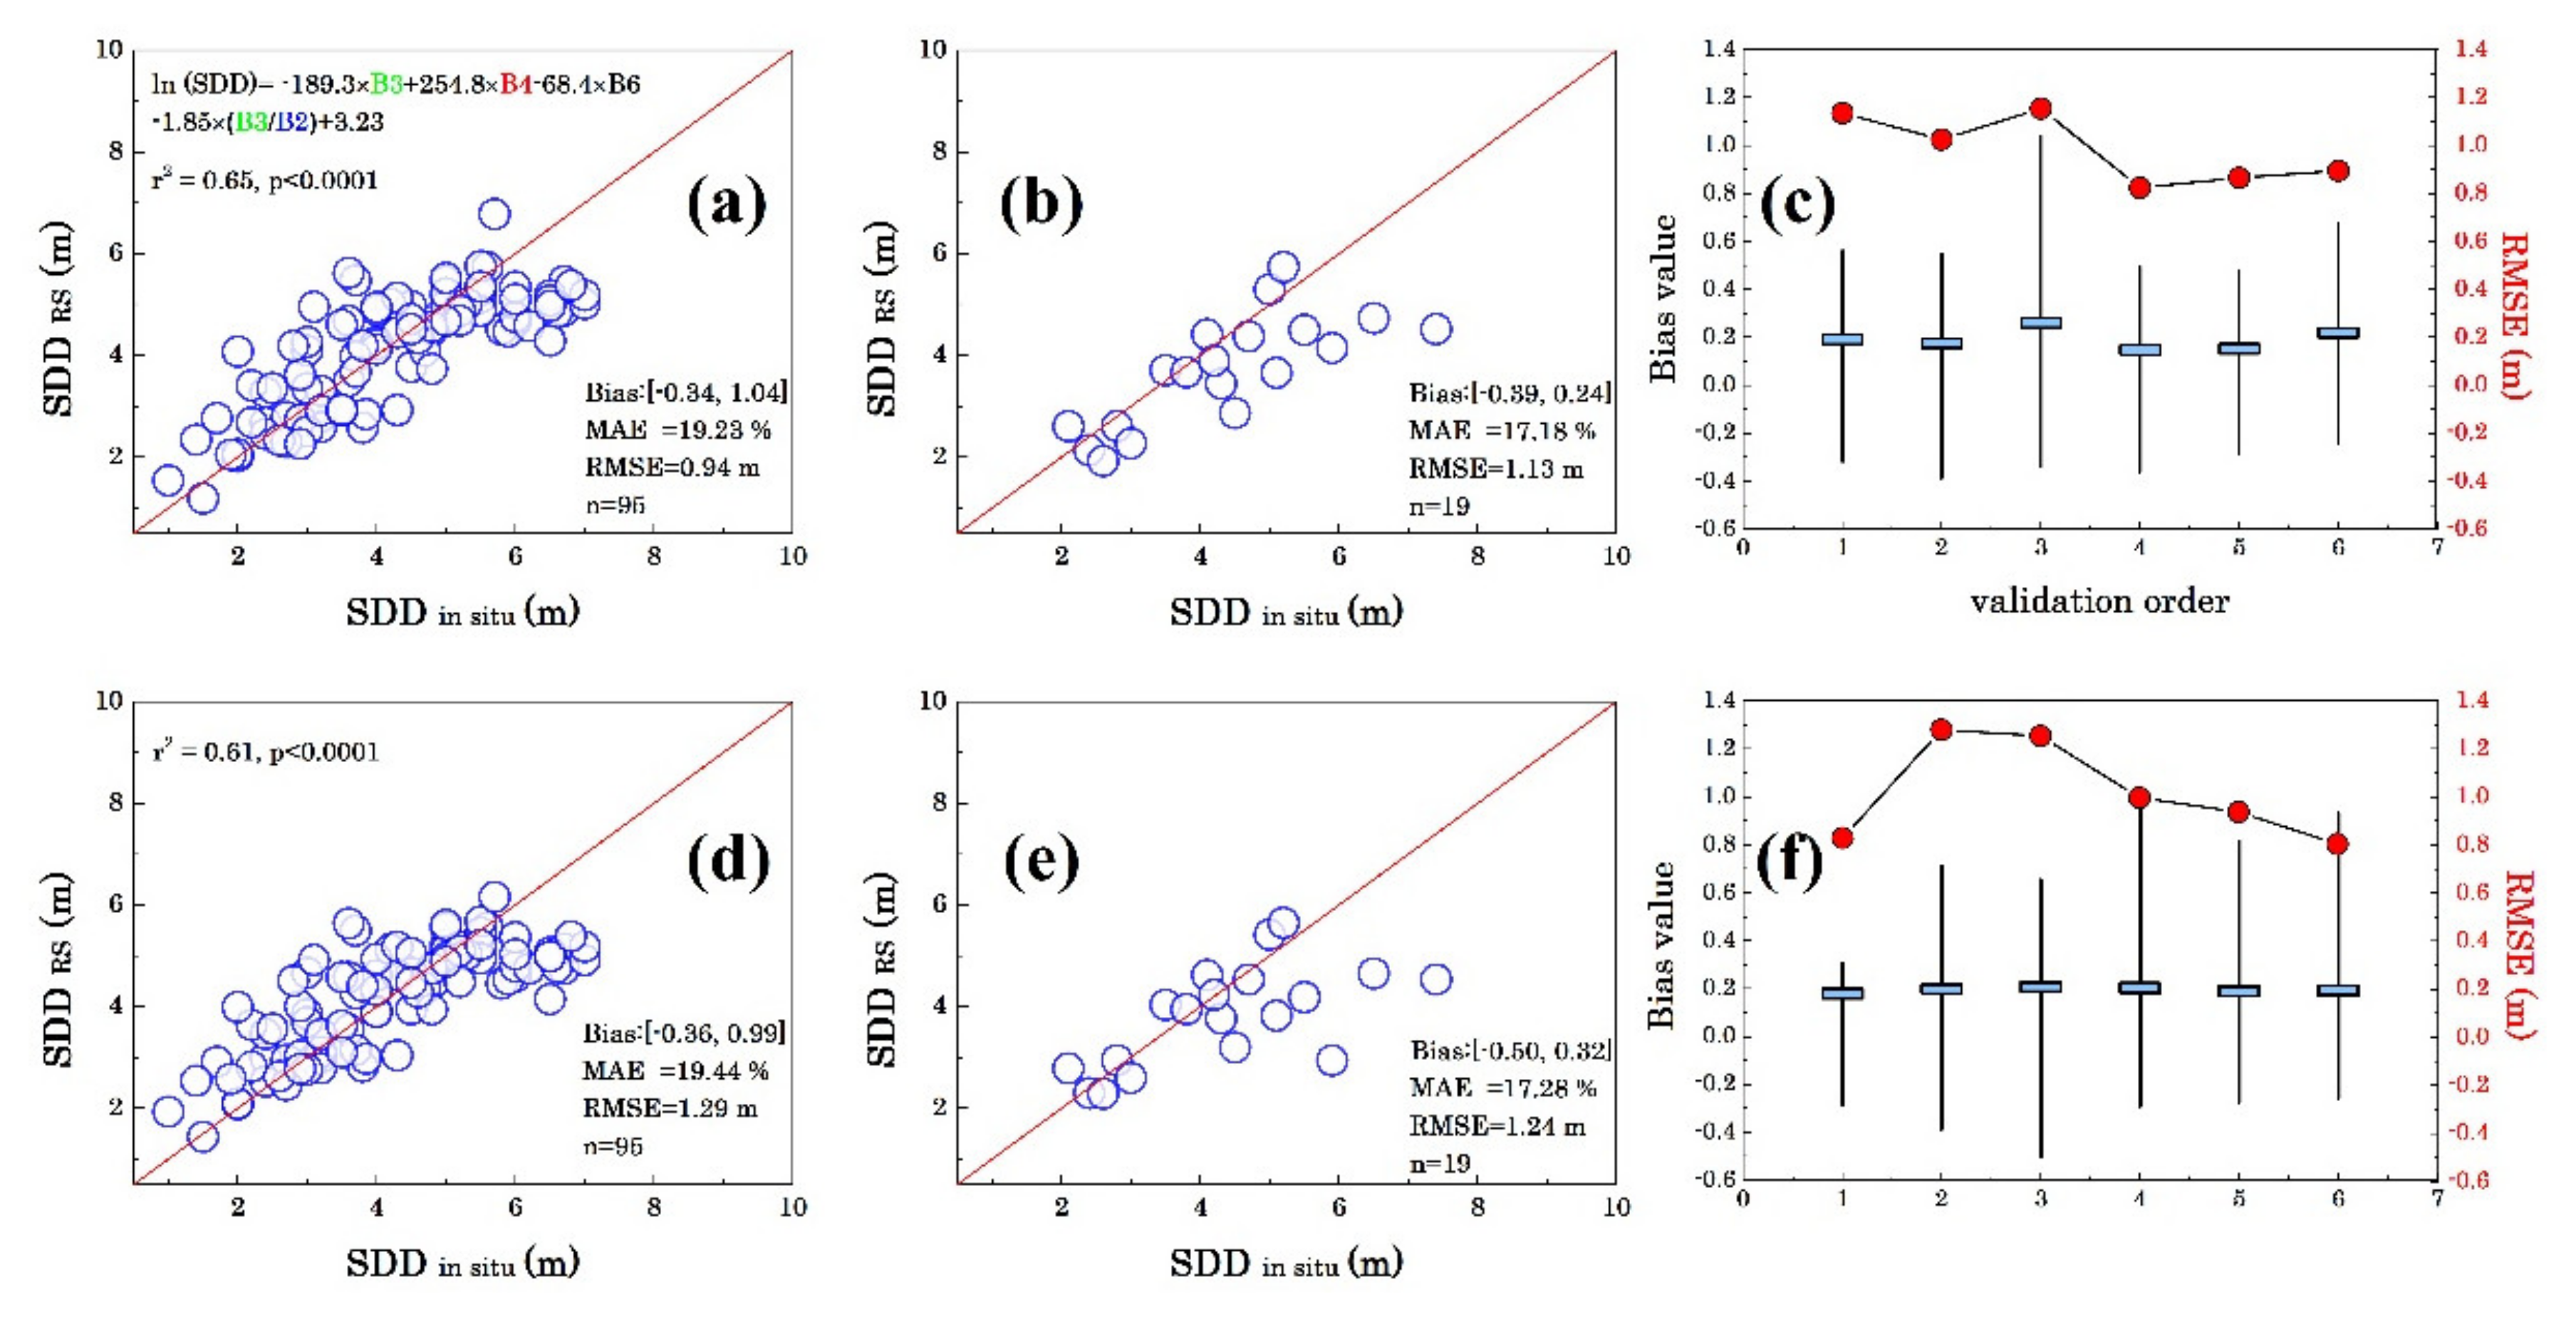
3.1. Algorithm Construction and Validation

SDD is closely related to the water optical properties, which could vary by the composition and concentration of water substances [40,41]. Analysis of water spectral characteristics could be conducive to the construction of the SDD algorithm [24]. In this section, we firstly analyzed the water spectral characteristics in the Qiandao Lake and then conducted the SDD algorithm construction.

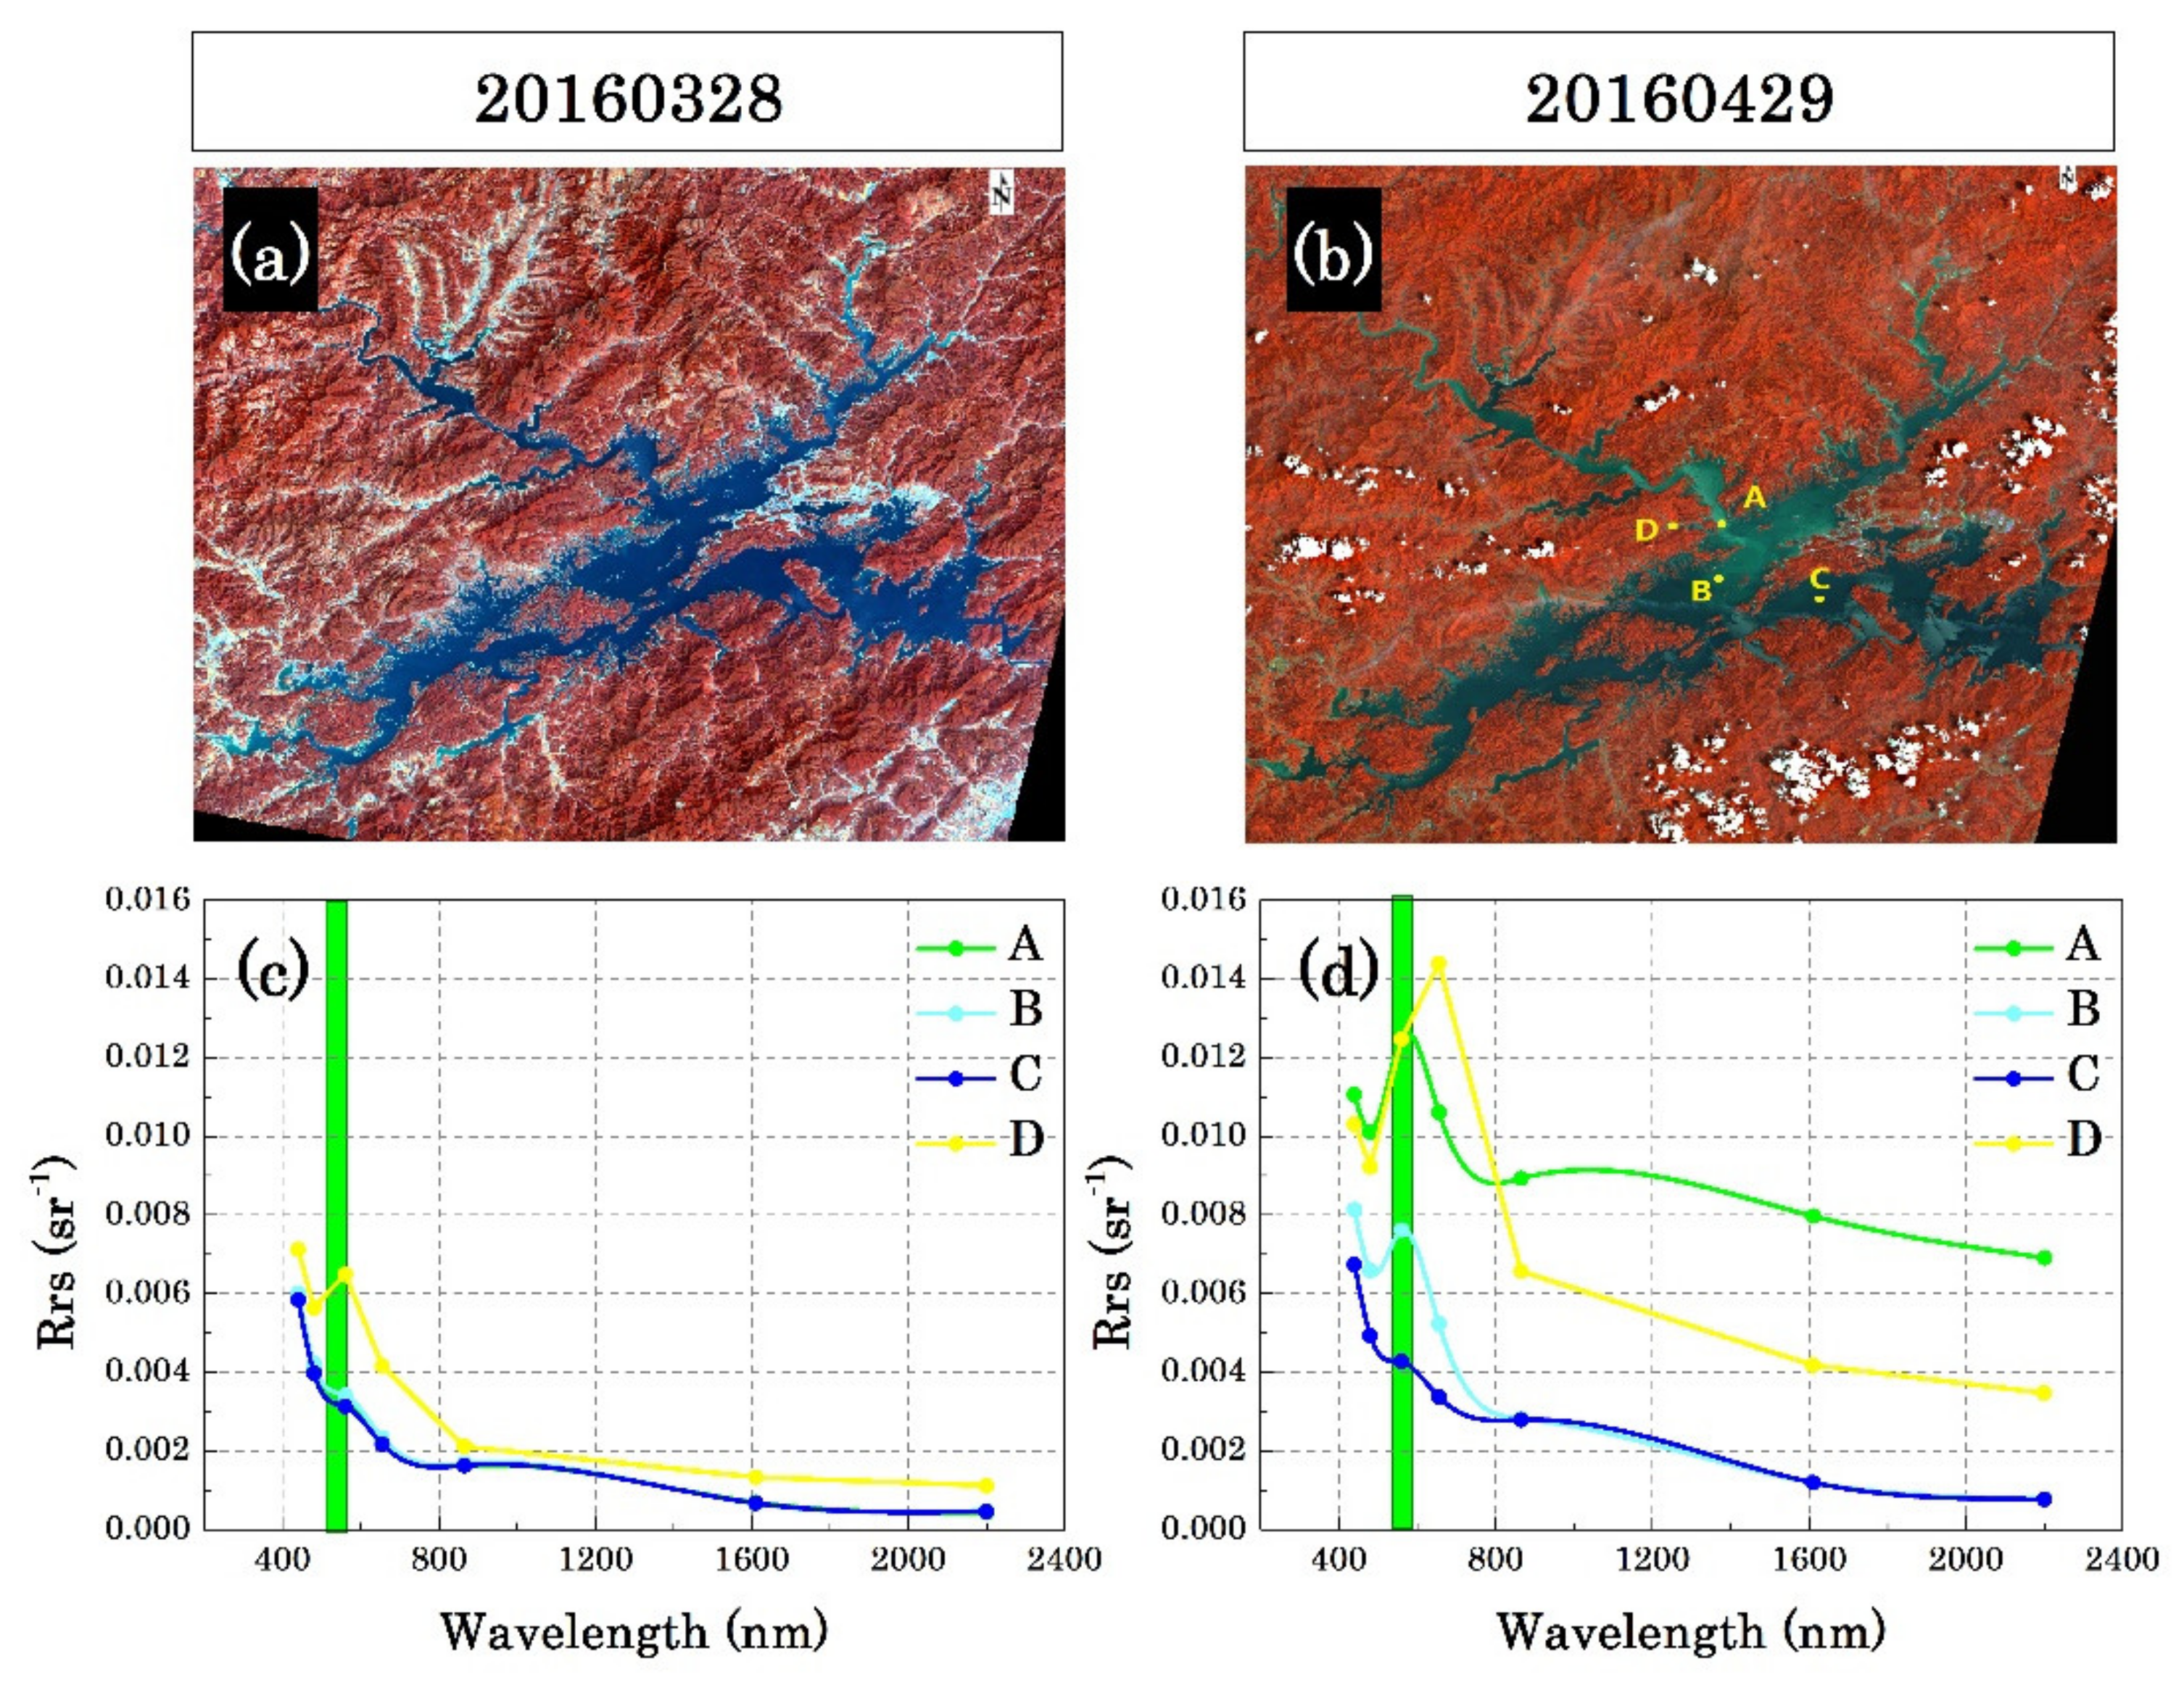
3.1.1. Spectral Feature Analysis

Among the valid OLI data from 2013 to 2020, we selected two satellite images in 2016 when the water turbidity in the Qiandao Lake was at a low and high level, respectively, for analysis (Figure 4). According to the false-color composite images, compared with that on March 28, an obvious diffusion process of water mass with high turbidity occurred in the Qiandao Lake on April 29: water masses with large turbidity was concentrated in the valley station D and nearby station A, then spread to the central lake area (station B). Meanwhile, water turbidity at station C remained at a low level, suggesting that the region around this station was less affected by the diffusion process.
Remote sensing reflectance curves at four typical stations also reflected the water turbidity changing process. In general, remote sensing reflectance raised with turbidity increase. Low turbidity water (station C) reflectance had a spectral peak at OLI blue waveband because pure water scatters blue light more effectively than at a longer wavelength and strongly absorbs near-infrared light. As the turbidity increased, absorption and scattering reduced the reflectance at the blue waveband and enhanced the reflectance at the longer waveband. At station B, pure water and phytoplankton jointly regulated the reflectance. As the maximum reflectance occurred at the blue band, reflectance also had a peak at the green band. Regulated by phytoplankton and suspended inorganic matter, reflectance at stations A and D achieved maximum values at the green and yellow bands, respectively. Besides, not only at the visible light but also reflectance at a wavelength greater than 700 nm was affected by turbidity. Unlike the situation where its values were close to zero at stations B and C due to strong absorption of pure water, the shortwave infrared reflectance remained a relatively high value at stations A and D attributed to the scattering of suspended matters. Changes of reflectance at different OLI wavebands with water turbidity (hence substances) need to be considered in the SDD algorithm construction.

3.1.2. Algorithm Evaluation

According to the spectral feature analysis results shown in Figure 4, when the water turbidity changed the Rrs amplitude of all OLI wavebands, it also adjusted the waveband where the Rrs peak was located. Therefore, in the algorithm evaluation process, we have used the Rrs of all OLI bands as predictors. Meanwhile, as the Rrs spectral curve mainly showed a peak at the blue (Band3) wavelength, we also used the Band3/Band2 ratio as a predictor to characterize the Rrs peak change with water turbidity. For the SDD, transparency represents the light penetration distance, according to the radiation transmission theory, it could be characterized as an exponential function of the water suspended matter concentration [40]. Therefore, in the algorithm construction process, we used the logarithmic transformed SDD data for analysis. Finally, a vector ‘Y:ln(SDD)’ and a subset of the predictors given by columns of the matrix ‘X:[Rrs (Bands (1:1:7)), Rrs (Band3/Band2)]’ were constructed for algorithm evaluation.
Based on the 95 matchups in situ SDD and OLI reflectance data pairs during 2013-2017, the SDD satellite algorithms suitable for the Qiandao Lake were obtained through the stepwise linear regression and SVM methods. In general, the two methods performed close accuracy in retrieving SDD in this area (Figure 5), the r2 for stepwise and SVM methods were 0.65 and 0.61, respectively. Satellite-derived results were generally consistent with the field measurements. For the stepwise method, the Bias, MAE, and RMSE values for the modeling dataset were [−0.34, 1.04], 19.23%, and 0.94 m, respectively (Figure 5a). Regarding the SVM approach, the Bias, MAE, and RMSE values for the modeling dataset were [−0.36, 0.99], 19.44%, and 1.29 m, respectively (Figure 5d). The evaluation results based on the independent validation dataset also illustrated a good performance of constructed SDD algorithms. The Bias, MAE, and RMSE values based on the validation dataset for the two methods were within [−0.50, 0.32], 18%, and 1.3 m, respectively (Figure 5b,e). Besides, to perform sensitivity analysis on the selection of validation samples, we randomly divided all matching data (114) into 6 folds to evaluate the performance of the models. Overall, as the verification dataset changed, the SDD models performed stably (Figure 5c,f). The Bias, MAE, and RMSE values based on the different validation dataset for the two methods were within [−0.50, 1.00], 25%, and 1.2 m, respectively.
Given the abundant representative observational data available and acceptable statistical validation results, the SDD algorithms developed here could be used to predict the SDD spatiotemporal variation in the Qiandao Lake. As the stepwise method performed slightly better than the SVM approach and it is easy to conduct, the stepwise linear regression algorithm (Equation (4)) was used in the following analysis:
ln (SDD RS) = −189.3 × B3 + 254.8 × B4 − 68.4 × B6 − 1.85 (B3/B2) + 3.23
where B2, B3, B4, and B6 are remote sensing reflectance data at corresponding OLI wavebands (as shown in Table 2); the unit of SDDRS is meters.

3.2. Spatiotemporal Variation of SDD in the Qiandao Lake

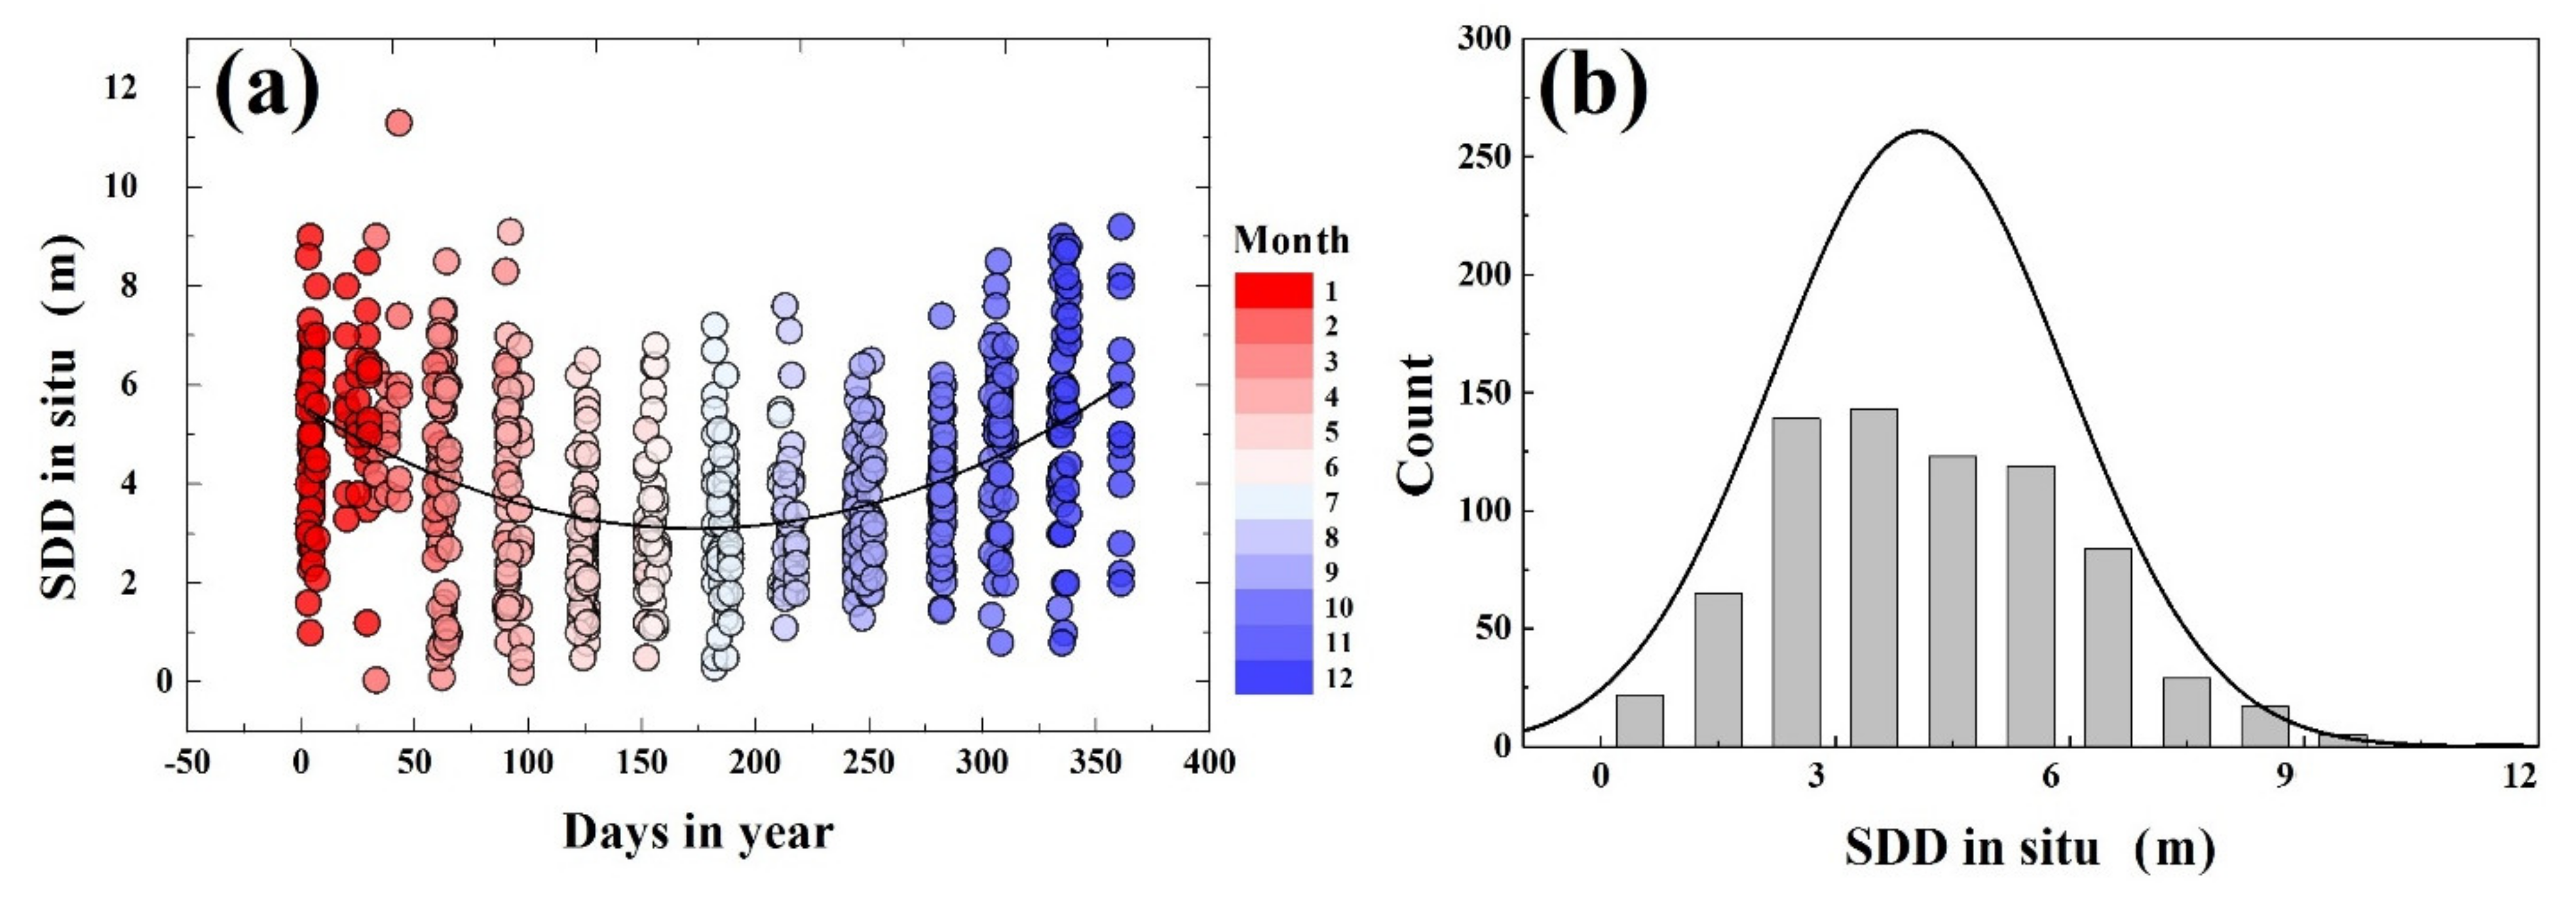
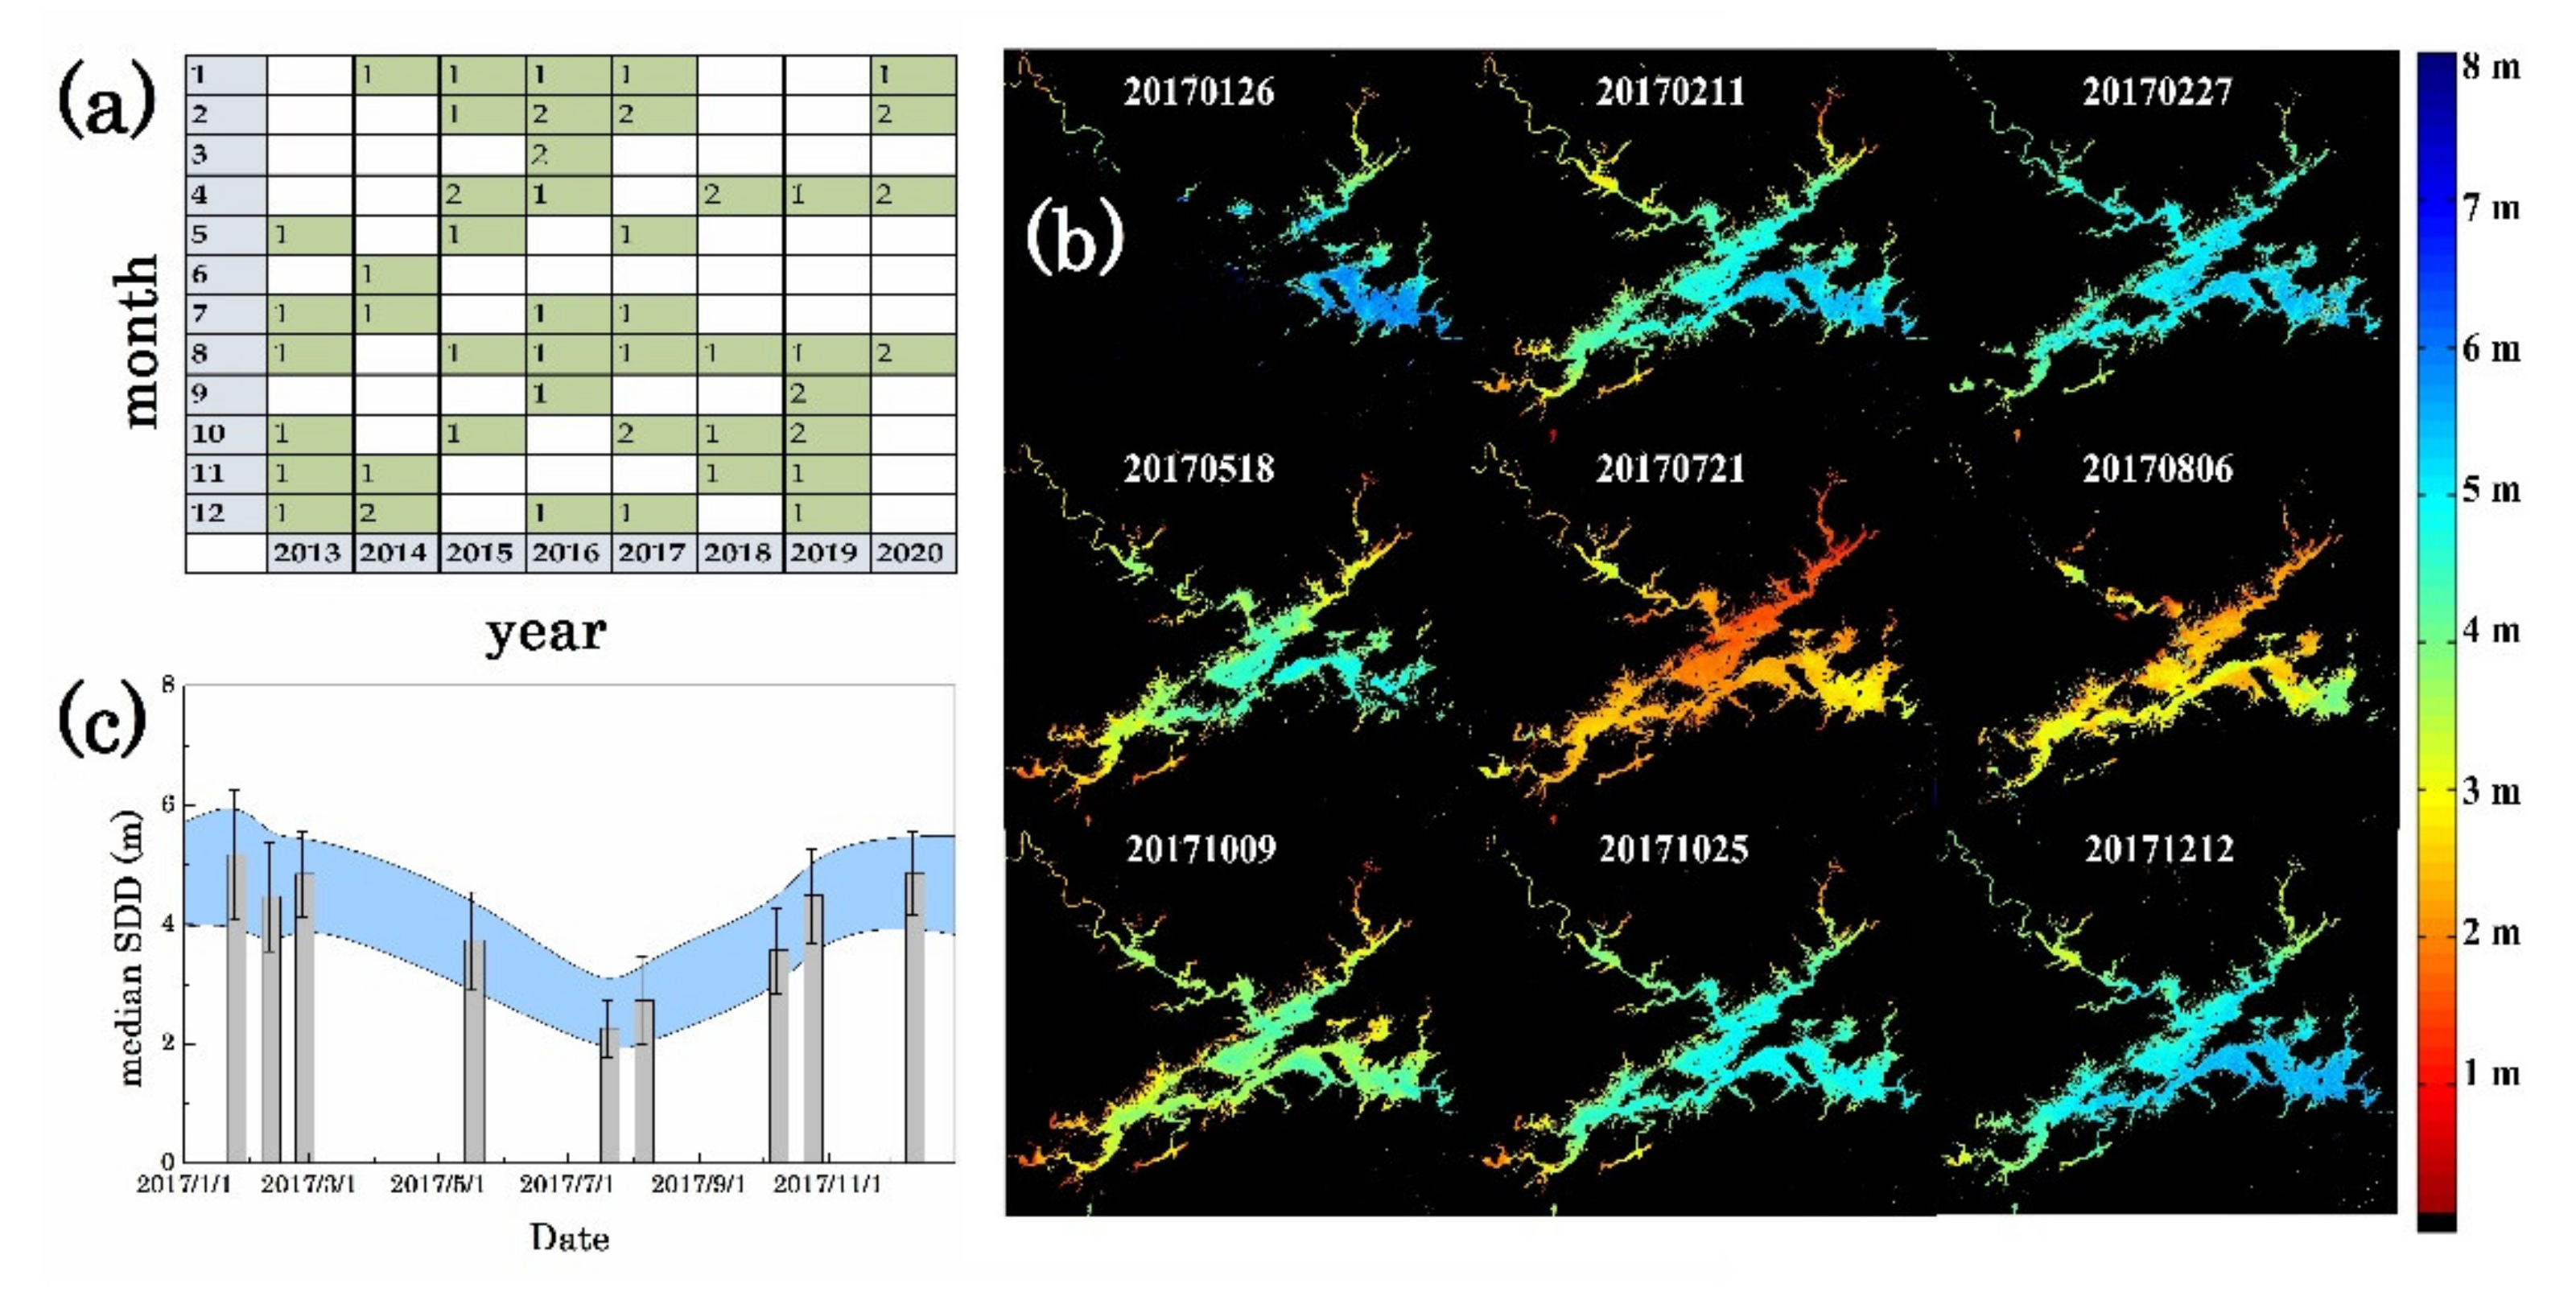
3.2.1. Intra-Annual Variability

Affected by the weather, from January 2013 to August 2020, OLI had 58 sets (Figure 6a) of valid water mass satellite image data in the Qiandao Lake area. The observation results in 2017, which covered four seasons, were selected to analyze the intra-annual changes of SDD in the Qiandao Lake.
As shown in Figure 6b, SDD in this region showed significant seasonal changes, with values mainly varied within the range of 0–8 m. The spatial distribution of SDD varied by season. In summer, the lowest SDD could occur in the central lake region with values of about 1.5 m. While in other seasons, SDD was low (within 4 m) in the inflow river areas (e.g., in the Xin’an River), and the high values were mainly concentrated in the central lake and southeast region near the dam (up to 13 m). In terms of intra-annual variability (Figure 6c), SDD reached the peak in boreal spring and winter, with a median value of about 5 m. SDD gradually decreased to about 4 m from March to May. After entering the rainy season in June, the median SDD was only about 2.5 m In July. As the rainfall weakened, SDD increased to about 3 m in August. Entering October, SDD continued to rise to about 5 m and remained a high value until December.

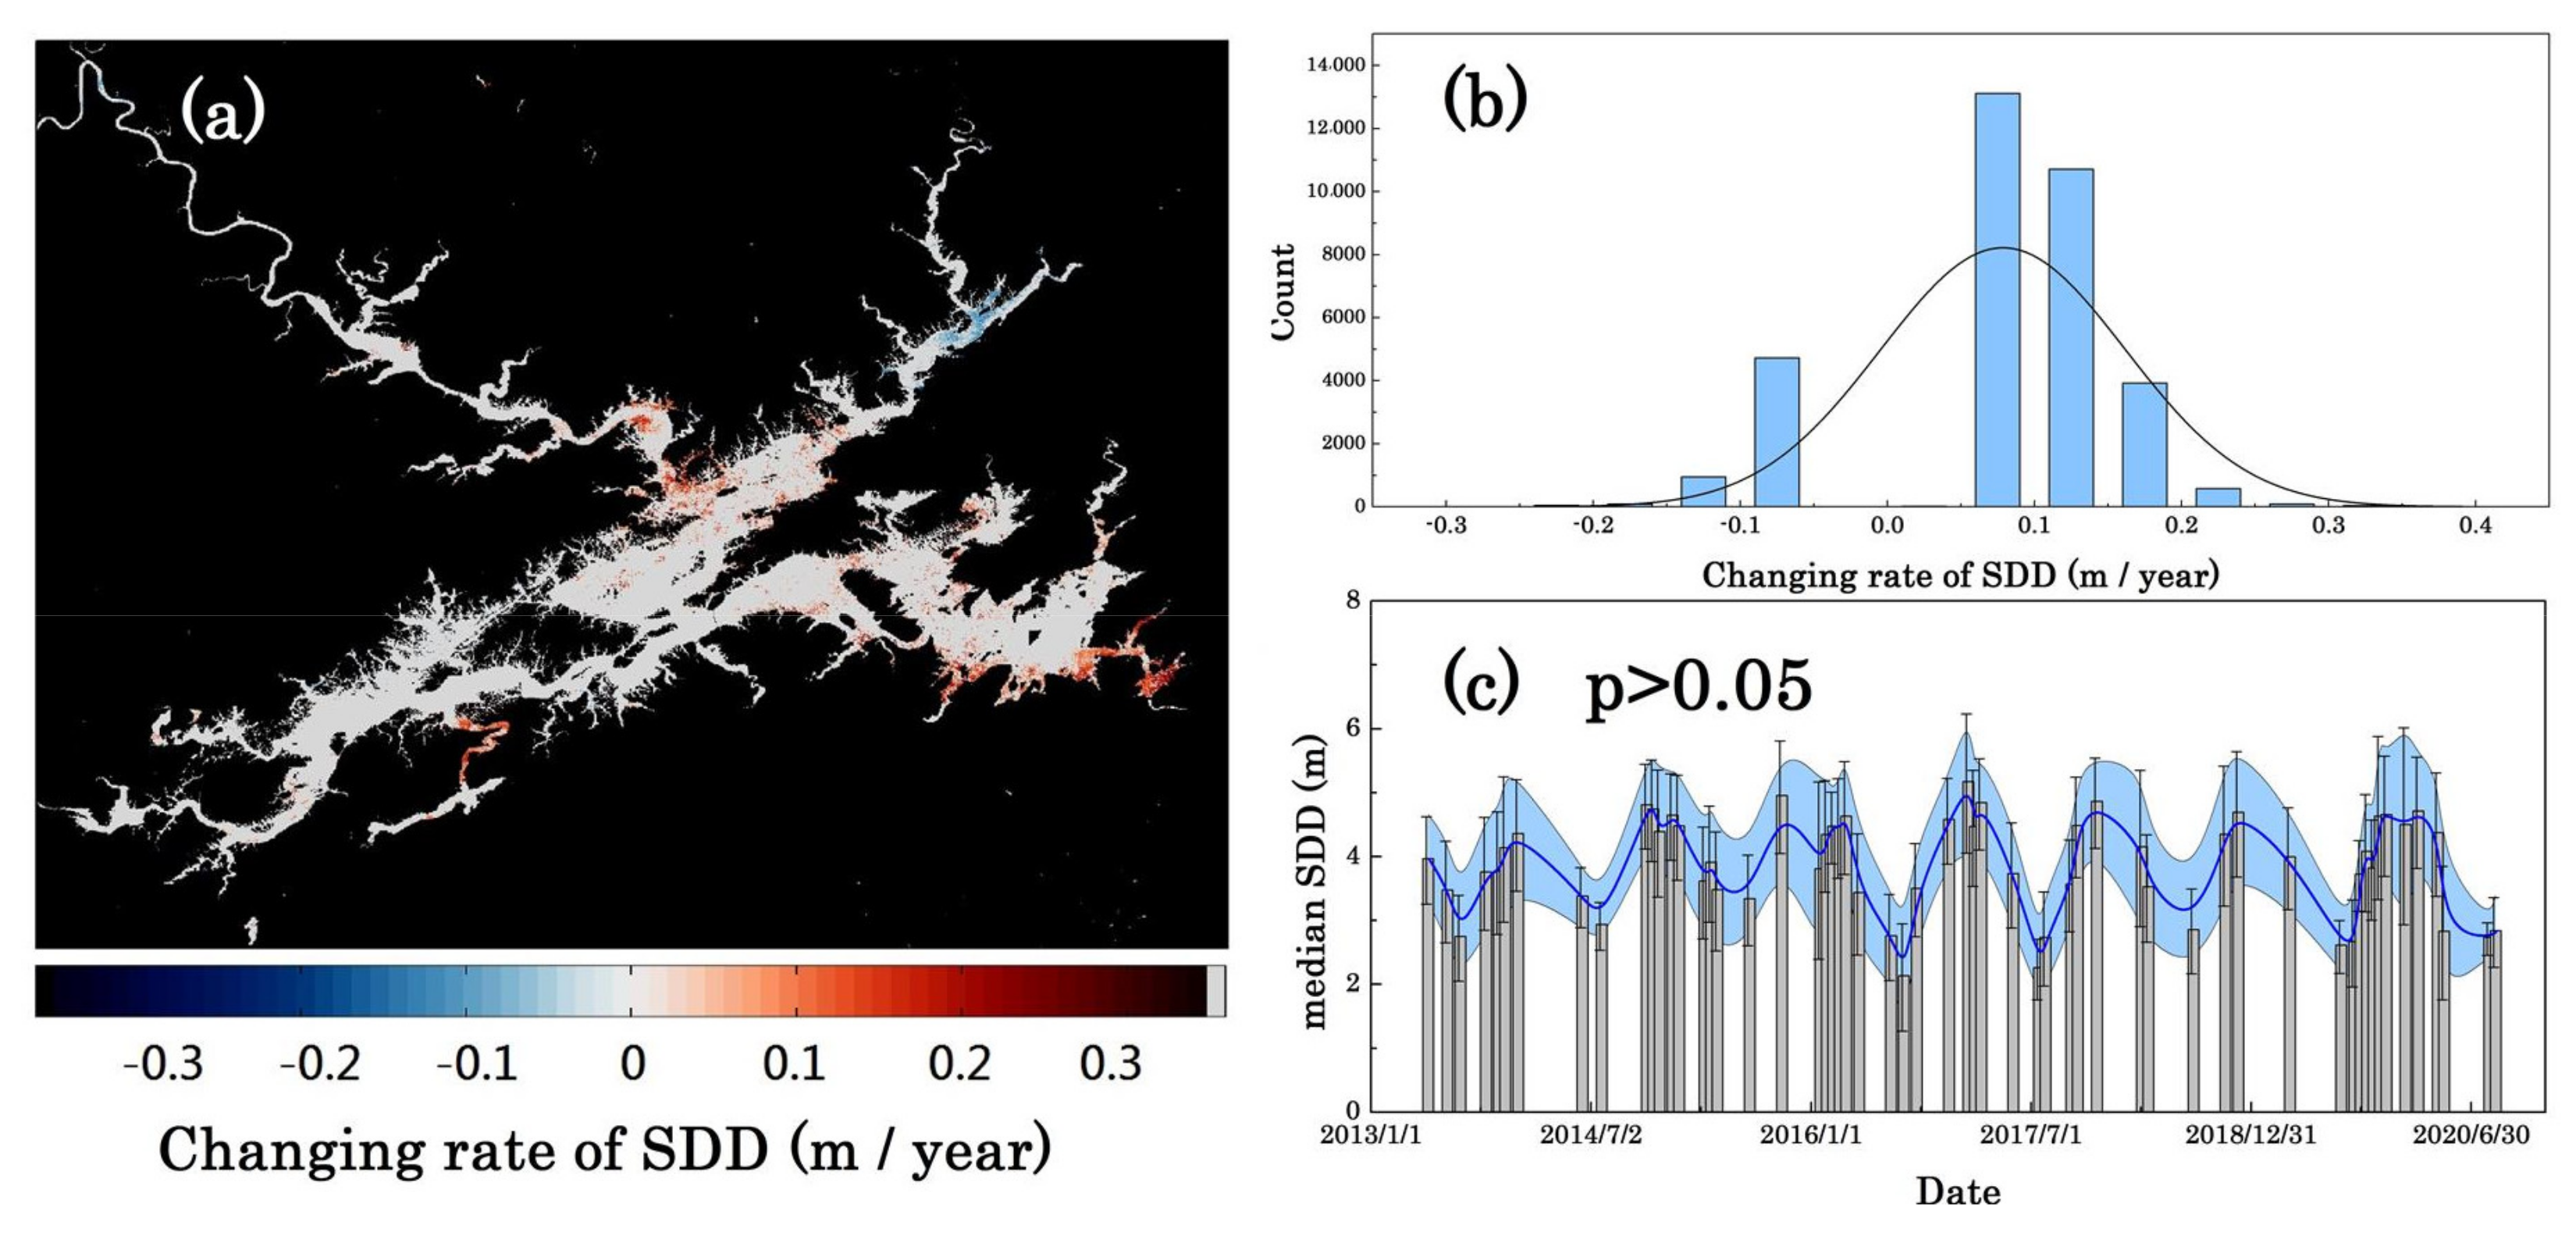
3.2.2. Inter-Annual Variability

To reduce the impact of seasonal changes, we applied the anomalies data to calculate the SDD inter-annual variability. Anomalies were calculated by subtracting the climatological monthly average value during 2013–2020 from the valid satellite-derived SDD products. Using anomalies data, the change rate at each pixel was calculated by fitting a least-squares linear regression and calculating the corresponding p-value. Only when the fitting result was significant at the 0.05 level (p-value smaller than 0.05), the linear fitting slope was accepted as a statistical rate. As shown in Figure 7a, from 2013 to 2020, about 5.32% of the area in the Qiandao Lake showed significant changes in SDD. Spatially, SDD showed an opposite change trend: SDD decreased in the northeast area (around the HTD station); while in other areas: e.g., the region where the Xin’an River merged into the central lake and areas around the dam in the southeast, SDD increased significantly.
Figure 7b shows the statistical histogram distribution of SDD long-term change rates. The descending rates of SDD generally varied between −0.05 and −0.15 m/year, with the average change value was about −0.09 m/year. In the ascent areas of SDD, the change rates were concentrated in 0.05–0.25 m/year, with an average value of about 0.11 m/year. Besides, it was worth noting that, when treating the Qiandao Lake as a whole, SDD did not change significantly during the period 2013–2020 (Figure 7c), further indicating the necessity of high spatial resolution monitoring for SDD variability in this region.

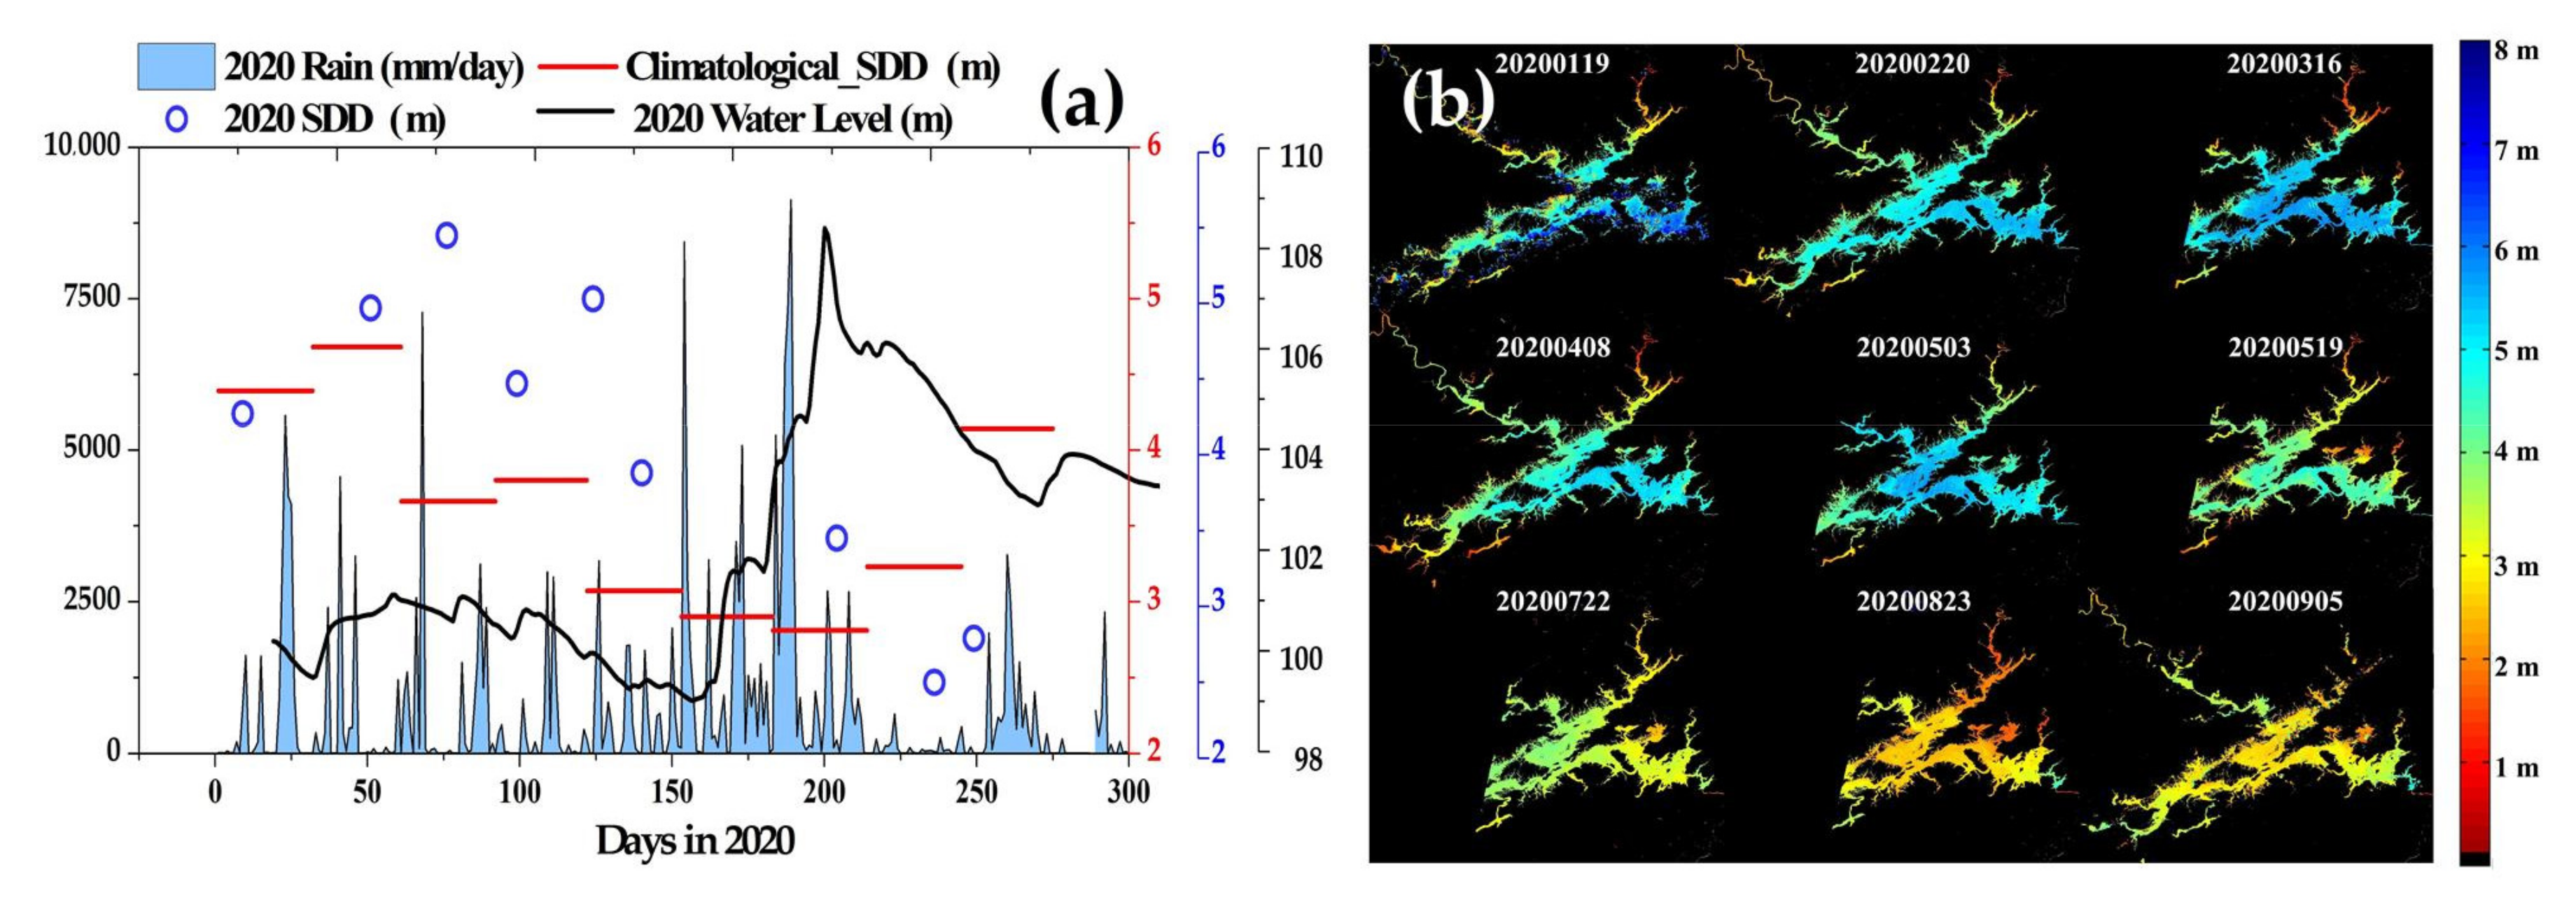
3.3. SDD Changes under Heavy Rainfall Event in 2020

From May to mid-July in 2020, the Qiandao Lake and its catchment region had suffered multiple heavy rainfall processes (Figure 8a), caused the lake water level to rise rapidly (reached the historic highest value in July, 108.4 m). For the safety of the reservoir, since 6 July 2020, nine sluices were opened for the first time. Regarding the SDD, it was larger than the climatological values between January and July in 2020. After the heavy rainfall and artificial water release events, the SDD in August 2020 became lower than the climatological value. Spatiotemporal change of SDD in different periods in 2020 could reveal more information (Figure 8b). From January to May, SDD was relatively high, maintained at a level larger than 4.5 m. As the rainfall increased in May, SDD dropped to about 4 m by May 19, with low SDD appeared in the surrounding bays. After the heavy rainfall and flood discharge events, SDD on July 22 dropped to within 2–3 m. It was worth noting that, mainly due to the enhancement of horizontal movement caused by the artificial water release, low SDD was concentrated in waters around the dam. Entering August, contrary to the spatial distribution in July, SDD in the region near the dam increased significantly (5 m), while in the central lake it declined to about 2 m. In September, the SDD distribution was similar to that in August, but the value had slightly increased by about 0.5 m. Overall, satellite-derived results indicated that summer heavy rainfall would reduce the SDD in the Qiandao Lake. Meanwhile, a time delay might exist between the heavy rainfall and the change of SDD: while the heavy rainfall reached a peak in July, the SDD declined to the lowest in August.

4. Discussion

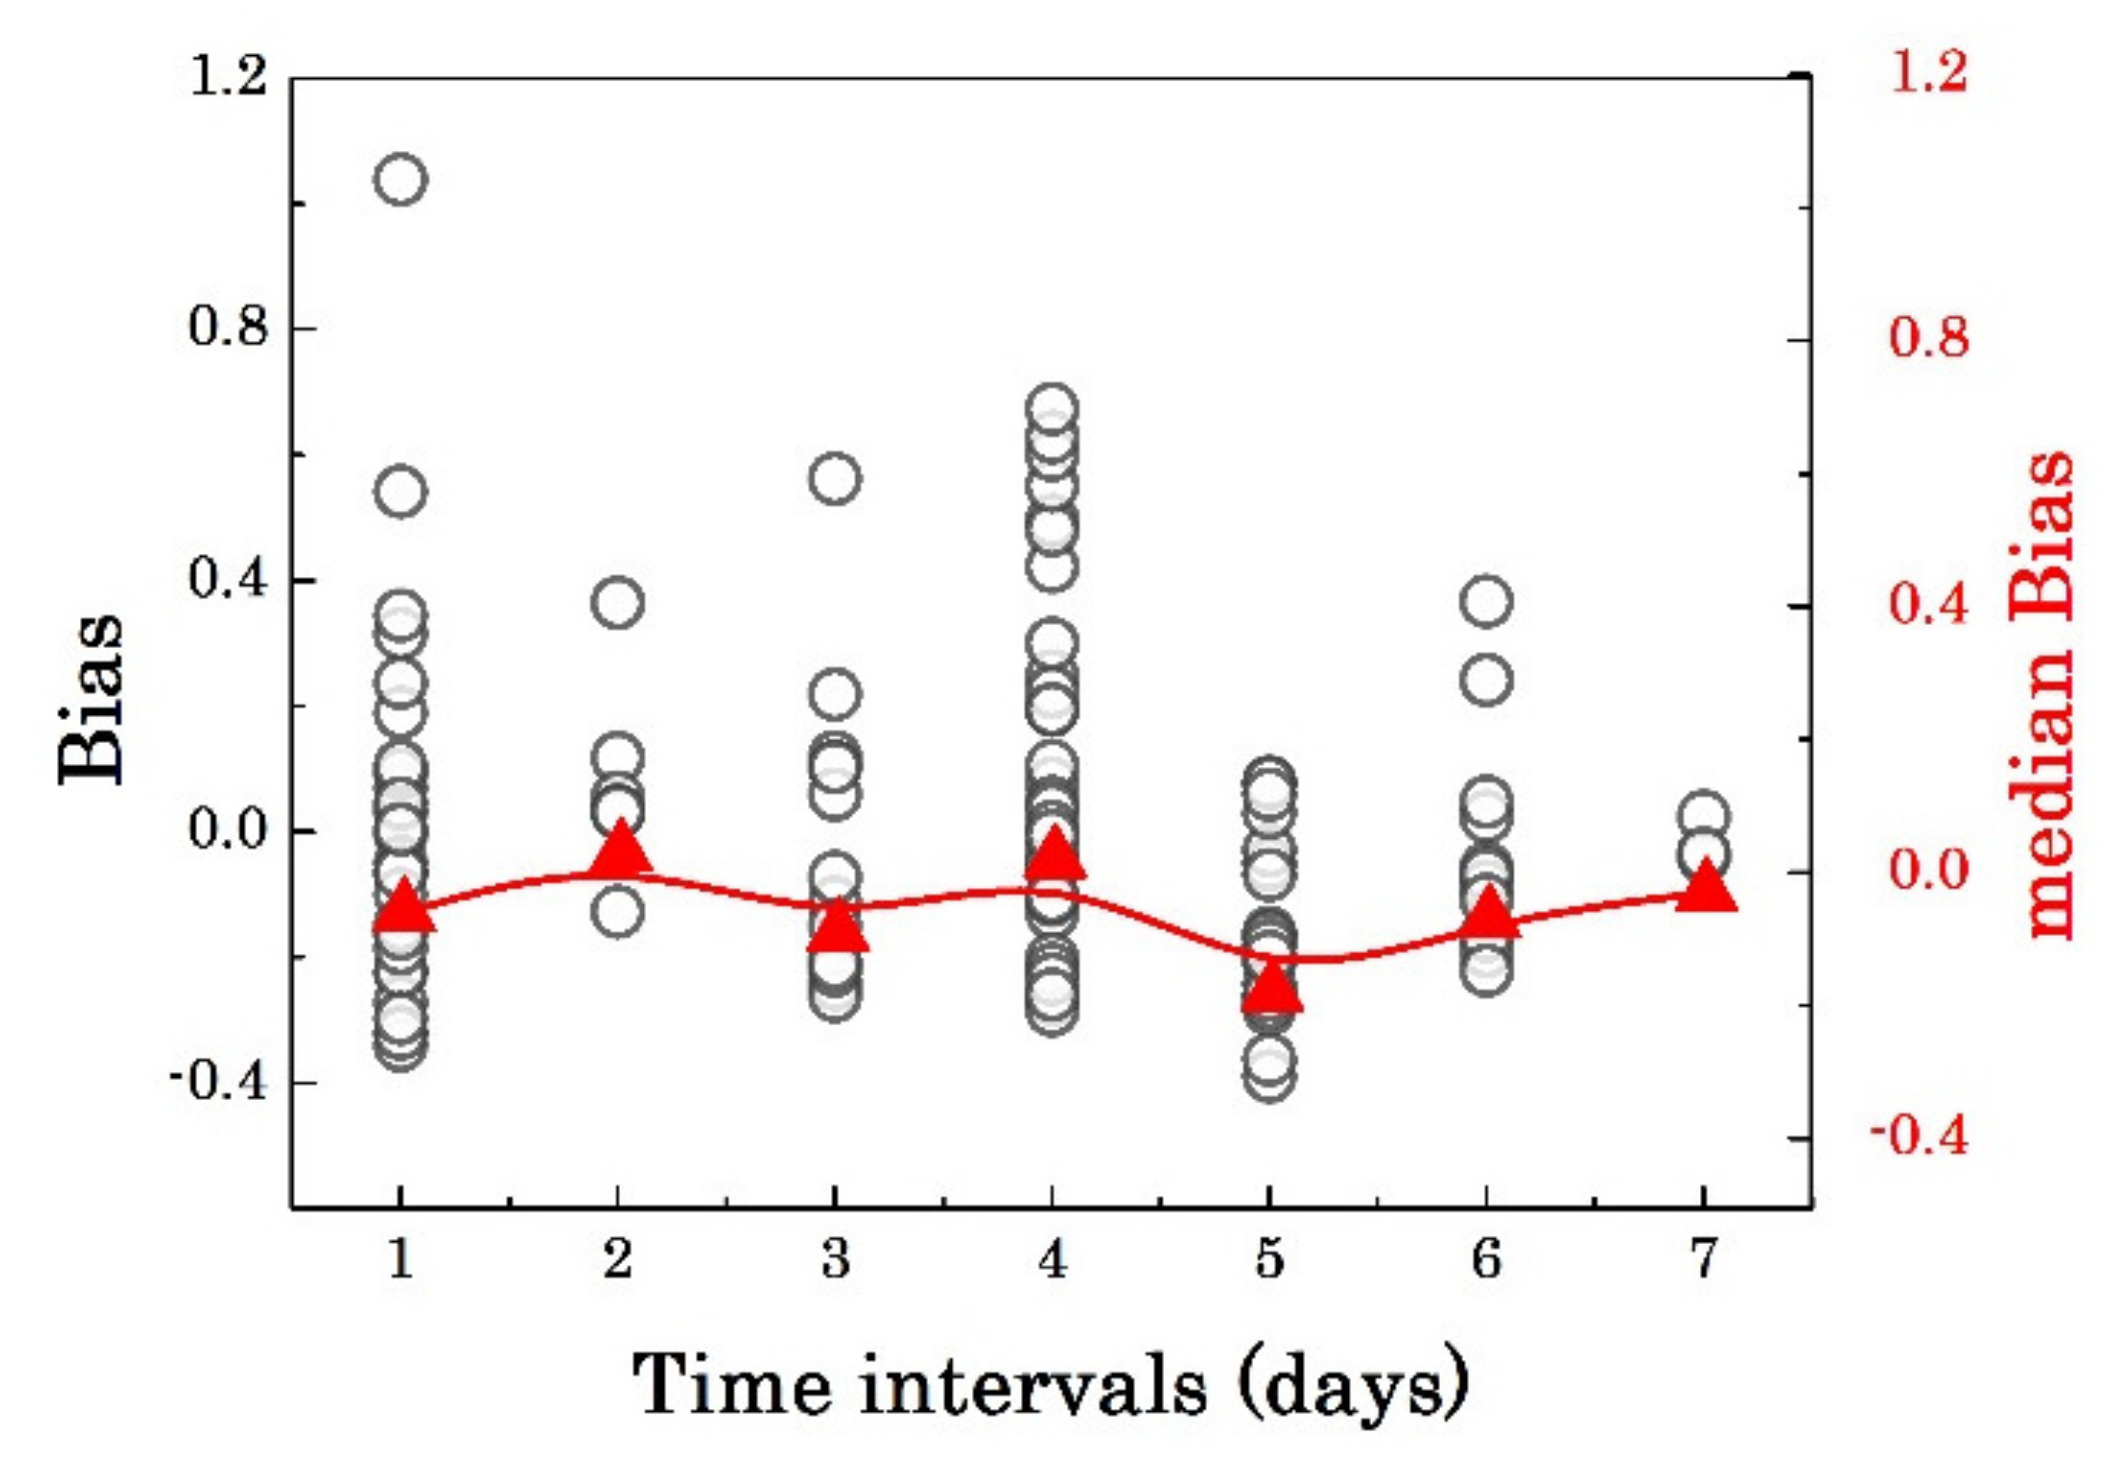
4.1. Algorithm Uncertainty

The uncertainty of satellite algorithms usually comes from the following three aspects: (1) the mismatch between satellite and in situ data, (2) the algorithm structure and (3) the accuracy of satellite products inputted into the algorithm [32,33]. Inevitably uncertainty would be induced through the matching process between satellite-derived and field observations [42]. For ocean color sensors, it was generally required that the time and space interval should be within ±3 h and 9 km [37]. For Landsat-based SDD algorithms, under the condition that the spatial interval was limited to one pixel (30 m), Kloiber, et al. [43] found the algorithm performed best (reached the maximum r2) when setting the time interval within 1 day. Meanwhile, the results of Kloiber, et al. [43] also highlighted the necessity of obtaining sufficient representative data to enhance the stability of the algorithm and considered a time interval of 7 days was acceptable. For all the 114 matchups data pairs during 2013–2019, the bias and median bias between satellite-derived and field SDD result at different time intervals were shown in Figure 9. In general, the bias values remained stable within ±7 days interval, indicating the matching strategy we used (30 m, ±7 days) would have a limited impact on the algorithm uncertainty. Besides, continuous field observations are needed to better analyze the stability of the optical characteristics of the water in the study area.
Concerning algorithm structures, according to recent review work by Gholizadeh, et al. [39], previous abundant investigations have demonstrated reliable empirical relationships between Rrs data and water quality. Change with water composition, SDD has been quantified using single visual bands ([39] and references therein), various band ratios [15,24,44], and different band regressions [34,45]. Recently, based on the empirical (regression-based) methods, research also tried to retrieve in-water constituents (hence SDD) by examining novel spectral features [46]. Besides, while machine learning techniques have been used in river water quality modeling [38], they have been adopted for remote sensing of lake SDD [47]. At present, mainly two types of SDD algorithms have been achieved. As empirical algorithms used single/multiple-factors regression or machine learning to relate SDD to optical properties (e.g., the diffuse attenuation coefficient and reflectance) or water optically active constituents [15,24,34], the semi-analytic algorithm based on the theory equation determined SDD by the independent and apparent optical properties of water [14,17,48]. Regarding empirical approaches, the algorithm uncertainty depended on the representativeness (e.g., spatiotemporal distribution and accuracy) of the field samples [15,34]. For semi-analytic approaches, the accuracy of input data rather than the structure governed the algorithm uncertainty [14,17,42]. In Qiandao Lake, as complex water optically active constituents regulate the light field, we have used multi-bands rather than a single typical band to characterize the change of SDD, which could enhance the algorithm robustness and decrease the RMSE [49]. Meanwhile, unlike empirical algorithms usually performed for a single sensor, theory-equation-based approaches relied on direct observation of distinct optical signatures of water, had barely requirements on the sensor’s passing time [48], and were more suitable in assessing long-term changes of SDD [17]. Therefore, although abundant results have shown that different approaches could perform with similar accuracy [14,15,17,34], theory-equation-based approaches would aid ongoing research in this region [48,49].
Regarding algorithm input satellite data, the uncertainty is closely related to the sensor stability and the atmospheric correction process. According to Mishra, et al. [50], the performance of the OLI sensor was stable, the observation deviation of remote sensing reflectance at the top of the atmosphere in each band was generally within ±3%. After atmospheric correction, using the AERONET-OC field dataset for comparison, the uncertainty of OLI observed remote sensing reflectance was about 30% in the open ocean, while in the near-shore areas with high turbidity, the uncertainty was high (greater than 50%) [51]. Besides, Wang, et al. [52] found that under highly turbid or eutrophication conditions, the uncertainty of the FLAASH method corrected OLI reflectance could be about 64% and 153% at the 482 nm and 443 nm, respectively. Therefore, improving the accuracy of atmospheric correction could help reduce the uncertainty of the SDD algorithm proposed in this research. For water atmospheric correction algorithms, UV-based approaches were recommended in high turbidity areas [53]. Concerning land atmospheric correction algorithms, the uncertainty depended on the initial condition settings (e.g., aerosol, visibility, water vapor content, etc.), using satellite-derived dynamic meteorological data instead of the fixed values in the model could improve the correction accuracy [52]. Acknowledging the uncertainty mentioned above, improved availability of in situ observations bearing information on water optical characters in this region is required.

4.2. Long-Term SDD Changes

Notable effects of natural and human factors on long-term changes of inland lakes’ environment have been recognized [54,55]. In general, climate change and human factors could regulate the lake environment (hence the SDD) by combination processes and mechanisms [4], e.g., directly affect the water temperature [6], stratification [56], and light intensity [57], or ultimate control of the ability to generate terrestrial materials input through affecting vegetation coverage [15], runoff [58], and nutrients discharge [54,56] in the catchment. Recently, research has found that climate change has led to a significant SDD increase in lakes on the Tibetan Plateau that are less disturbed by human activities [59]. Remote sensed Forel-Ule index for global inland waters further revealed that not only lakes on the Tibetan Plateau, but also large reservoirs in other cold regions (e.g., northern Europe, northern North America, and of South America plateaus) have become clearer during 2000–2018 [60]. Clarity in lakes with intensive human activities showed variety changing trends [60]. For lakes with areas larger than 10 km2 in China, satellite-derived estimations have witnessed a rapid SDD decline (decreased by more than 50%) in the Eastern Plain Lake zone and Northeast Plain Lake zone from 1985–1990 to 2005–2010 period when economic activity was rapidly increasing in those regions [57]. Along with agriculture activities in the basin region, the turbidity of the Lake Tana Ethiopia has indicated an increasing trend from 1999–2014 [61]. For the largest lake in Europe (Lake Ladoga), SDD was also reported to decline from 1905 to 2003 [62]. On the other hand, through environmental improvement, human activities could also improve lake SDD. For many natural lakes in the Middle and Lower Yangtze River basin, partially explained by the increased temperature boosted vegetation growth in the sub-basins and the construction of the Three Gorges Dam, the turbidity in those regions declined (hence transparency increased) from 2000 to 2014 [63]. As climate change induced enhanced water supply accounted for the main part of lake clarity increase in western China [23], catchment vegetation restoration increased transparency in most of eastern China lakes during 2000–2018 [15]. In the U.S., as the government has implemented major strategies to reduce water pollution, SDD has increased by an average of 0.005 m/year from 1984 to 2020 [64].
Acknowledging the response of the lake environment to climate change and human factors varied by regions or water body types (Table 3 and references therein), localized information was needed for the reasoning of the SDD dynamics in a specific lake [63,65]. Unlike the situation in shallow lakes, the environment at the upper water layer and the catchment, rather than the sediment re-suspension, dominated the SDD variability in the Qiandao Lake [25,66,67]. In the context of continuous regional climate warming [33], the water environment in the Qiandao Lake had changed oppositely between 1988–2013 and 2013–2017 [25,67], suggesting a significant impact of human factors on the SDD variability in this region. Based on field observations, Wu, et al. [25] reported that partly due to excessive river input nutrients induced phytoplankton biomass increase, SDD at the DB and HTD stations decreased significantly with a linear slope of 7.9 cm/year during 1988–2013. After 2013, under the continuous artificial improvement of the catchment environment, our research has shown that SDD in 4.42 % area of the Qiandao Lake increased significantly (p < 0.05). As SDD around the HTD station continued to decrease, it was improved to rise in regions around the DB station (Figure 7a). Meanwhile, satellite-based monitoring had revealed an overall trophic state index decrease (but not significant) in the Qiandao Lake from 2013 to 2017 [67], suggesting an improvement of water quality (hence increase of SDD) in this region. As artificial ecological restoration gradually stabilizes, the impact of natural factors (long-term climate changes [55] and extreme weather events [68]) on the lake water quality might become more important. The regulation mechanism of SDD long-term changes in the Qiandao Lake should be a main content of the following researches. Coupled field and satellite dynamic observations of different water compositions and catchment changes are urgently needed.

4.3. Impact of Heavy Rainfall on SDD Changes in the Qiandao Lake

Previous reports have revealed that heavy rainfall events would aggravate land erosion and increase runoff [32,72], thereby regulate the lake SDD. For Qiandao Lake, Zhang, et al. [32] found heavy rainfall events would increase the suspended matter concentration, hence reduce the SDD, and as the water diffusing, the largest area of turbidity zone mainly occurred within 2–3 days after rainfall. Besides, heavy rainfall could also affect SDD by influencing phytoplankton growth [65]. However, unlike the rapid increase in terrestrial materials, the growth of phytoplankton requires a stricter environment, e.g., stable hydrodynamic environment, sufficient nutrients, and appropriate light and temperature [73,74,75]. In the open ocean, the rapid increase of surface phytoplankton often occurred within 1–2 weeks after the typhoon passing, with a stable water environment and sufficient nutrients [76,77]. Concerning Qiandao Lake, Liu, et al. [31] reported that by reducing the surface water temperature and increasing the intensity of physical disturbances, heavy rainfall would completely disappear the surface mixed layer, thereby inhibit the phytoplankton growth. As the hydrodynamic environment change taking a period to stabilize, heavy rainfall events would have a continuous impact on SDD after rainfall. Supplementing monitoring data on the dynamic changes of water composition would provide more information on the regulation of SDD by heavy rainfall events, which should be concerned in the following research.

5. Conclusions

As the largest reservoir in eastern China, Qiandao Lake has been subject to increasing anthropogenic disturbance with the growing activities in the catchment. It is essential to enhance the water environment variability monitoring to support sustainable ecological conservation and environmental management in this region. Transparency is one of the fundamental parameters of water environment, however, after artificial environment improvement in the catchment region, changes of Qiandao Lake transparency in the past decade remain poorly quantified. In this study, utilizing abundant field observations, we firstly established a satellite Secchi disk depth (SDD) algorithm suitable for the Qiandao Lake. Then, we constructed longtime-series SDD products in this region from 2013 to 2020 for analysis. Satellite-derived results revealed that SDD in the Qiandao Lake mainly changed between 0-8 m, reached the peak in boreal spring and winter, while remained low in the boreal summer. For long-term change, quantitative analysis results showed that although the median SDD remained stable during 2013–2020, about 5.32% area of the Qiandao Lake showed significant changes of SDD in this period. Besides, the findings presented here suggested that heavy rainfall would have a continuous impact on the Qiandao Lake SDD. Improved availability of coupled field and satellite observations bearing information on water optical and compositions are required, to provide more details about the regulation of SDD in this region under the context of environmental changes.

Author Contributions

Conceptualization, T.L., Y.B., F.C. and H.S.; Data curation, M.L.; Formal analysis, T.L. and F.G.; Funding acquisition, F.C. and H.S.; Investigation, M.L.; Methodology, T.L. and X.H.; Resources, F.C. and H.S.; Software, B.Z.; Supervision, F.C. and H.S.; Validation, T.L. and M.L.; Visualization, B.Z.; Writing—original draft, T.L.; Writing—review & editing, Y.B. and X.H. All authors have read and agreed to the published version of the manuscript.

Funding

This research was funded by the National Key Research and Development Program of China, grant number 2017YFB0503900-4-2; the National Natural Science Foundation of China, grant number 42006165; the China Postdoctoral Science Foundation, grant number 2020M671832; the Zhejiang Talent Program, grant number LR18D060001; the Zhejiang Provincial Natural Science Foundation of China, grant number 2017R52001; and the Key Special Project for Introduced Talents Team of Southern Marine Science and Engineering Guangdong Laboratory (Guangzhou), grant number GML2019ZD0602; the National Science Basic Research Foundation of Shaanxi Province, grant number 2019JQ-929.

Data Availability Statement

3rd Party Data. Restrictions apply to the availability of these data. Data were obtained from the Hangzhou Institute of Environmental Protection Science and are available from the authors with the permission of the Hangzhou Institute of Environmental Protection Science.

Acknowledgments

Landsat 8 product is courtesy of the U.S. Geological Survey. We thank SOED/SIO/MNR satellite ground station, satellite data processing & sharing center, and marine satellite data online analysis platform (SatCO2) for their help with data collection and processing. We truly appreciate Difeng Wang and anonymous reviewers for their suggestions on manuscript writing and improving the quality of the manuscript.

Conflicts of Interest

The authors declare no conflict of interest.

References

  1. Assessment, M.E. Ecosystems and Human Well-Being: Synthesis, 1st ed.; Island Press: Washington, DC, USA, 2005; pp. 40–150. [Google Scholar]
  2. Williamson, C.E.; Saros, J.E. What Do Lakes and Reservoirs Tell Us About Climate Change?: Proceedings of the Chapman Conference on Lakes as Sentinels, Integrators, and Regulators of Climate Change, Incline Village, Nevada, USA, 8–10 September 2008. EOS Trans. Am. Geophys. Union 2008, 89, 546. [Google Scholar] [CrossRef] [Green Version]
  3. Tranvik, L.J.; Downing, J.A.; Cotner, J.B.; Loiselle, S.A.; Striegl, R.G.; Ballatore, T.J.; Dillon, P.; Finlay, K.; Fortino, K.; Knoll, L.B.; et al. Lakes and Reservoirs as Regulators of Carbon Cycling and Climate. Limnol. Oceanogr. 2009, 54, 2298–2314. [Google Scholar] [CrossRef] [Green Version]
  4. Blenckner, T. Climate Change Effects on Lakes. In Encyclopedia of Lakes and Reservoirs; Bengtsson, L., Herschy, R.W., Fairbridge, R.W., Eds.; Springer: Dordrecht, The Netherlands, 2012; pp. 165–167. [Google Scholar]
  5. Williamson, C.E.; Saros, J.E.; Vincent, W.F.; Smol, J.P. Lakes and Reservoirs as Sentinels, Integrators, and Regulators of Climate Change. Limnol. Oceanogr. 2009, 54, 2273–2282. [Google Scholar] [CrossRef]
  6. Woolway, R.I.; Weyhenmeyer, G.A.; Schmid, M.; Dokulil, M.T.; de Eyto, E.; Maberly, S.C.; May, L.; Merchant, C.J. Substantial Increase in Minimum Lake Surface Temperatures under Climate Change. Clim. Chang. 2019, 155, 81–94. [Google Scholar] [CrossRef] [Green Version]
  7. Schneider, P.; Hook, S.J.; Radocinski, R.G.; Corlett, G.K.; Hulley, G.C.; Schladow, S.G.; Steissberg, T.E. Satellite Observations Indicate Rapid Warming Trend for Lakes in California and Nevada. Geophys. Res. Lett. 2009, 36, 1–6. [Google Scholar] [CrossRef]
  8. Austin, J.A.; Colman, S.M. Lake Superior Summer Water Temperatures are Increasing more Rapidly than Regional Air Temperatures: A positive Ice-albedo Feedback. Geophys. Res. Lett. 2007, 34, 1–5. [Google Scholar] [CrossRef] [Green Version]
  9. Shi, K.; Zhang, Y.; Zhou, Y.; Liu, X.; Zhu, G.; Qin, B.; Gao, G. Long-Term MODIS Observations of Cyanobacterial Dynamics in Lake Taihu: Responses to Nutrient Enrichment and Meteorological Factors. Sci. Rep. 2017, 7, 40326. [Google Scholar] [CrossRef] [Green Version]
  10. Shi, K.; Zhang, Y.; Zhu, G.; Qin, B.; Pan, D. Deteriorating Water Clarity in Shallow Waters: Evidence from Long Term MODIS and In-situ Observations. Int. J. Appl. Earth Obs. Geoinf. 2018, 68, 287–297. [Google Scholar] [CrossRef]
  11. Zhang, Y.; Jeppesen, E.; Liu, X.; Qin, B.; Shi, K.; Zhou, Y.; Thomaz, S.M.; Deng, J. Global Loss of Aquatic Vegetation in Lakes. Earth-Sci. Rev. 2017, 173, 259–265. [Google Scholar] [CrossRef]
  12. Wetzel, R.G. 5-LIGHT IN INLAND WATERS. In Limnology, 3rd ed.; Wetzel, R.G., Ed.; Academic Press: San Diego, CA, USA, 2001; pp. 49–69. [Google Scholar]
  13. Mobley, C.D.; Preisendorfer, R.W. Light and Water: Radiative Transfer in Natural Waters; Academic Press: Cambridge, MA, USA, 1994. [Google Scholar]
  14. Lee, Z.; Shang, S.; Hu, C.; Du, K.; Weidemann, A.; Hou, W.; Lin, J.; Lin, G. Secchi Disk Depth: A new Theory and Mechanistic Model for Underwater Visibility. Remote Sens. Environ. 2015, 169, 139–149. [Google Scholar] [CrossRef] [Green Version]
  15. Liu, D.; Duan, H.; Loiselle, S.; Hu, C.; Zhang, G.; Li, J.; Yang, H.; Thompson, J.R.; Cao, Z.; Shen, M.; et al. Observations of Water Transparency in China’s Lakes from Space. Int. J. Appl. Earth Obs. Geoinf. 2020, 92, 102187. [Google Scholar] [CrossRef]
  16. Lewis, M.R.; Kuring, N.; Yentsch, C. Global Patterns of Ocean Transparency: Implications for the New Production of the Open Ocean. J. Geophys. Res. Ocean. 1988, 93, 6847–6856. [Google Scholar] [CrossRef]
  17. He, X.; Pan, D.; Bai, Y.; Wang, T.; Chen, C.-T.A.; Zhu, Q.; Hao, Z.; Gong, F. Recent Changes of Global Ocean Transparency Observed by SeaWiFS. Cont. Shelf Res. 2017, 143, 159–166. [Google Scholar] [CrossRef]
  18. Tyler, J.E. The Secchi Disc. Limnol. Oceanogr. 1968, 13, 1–6. [Google Scholar] [CrossRef]
  19. Wernand, M.R. On the History of the Secchi Disc. J. Eur. Opt. Soc. Rapid Publ. 2010, 5, 10013s. [Google Scholar] [CrossRef] [Green Version]
  20. Pitarch, J. A Review of Secchi’s Contribution to Marine Optics and the Foundation of Secchi Disk Science. Oceanography 2020, 33, 26–37. [Google Scholar] [CrossRef]
  21. Erlandsson, C.P.; Stigebrandt, A. Increased Utility of the Secchi Disk to Assess Eutrophication in Coastal Waters with Freshwater Run-off. J. Mar. Syst. 2006, 60, 19–29. [Google Scholar] [CrossRef]
  22. Boyce, D.G.; Lewis, M.; Worm, B. Integrating Global Chlorophyll Data from 1890 to 2010. Limnol. Oceanogr. Methods 2012, 10, 840–852. [Google Scholar] [CrossRef]
  23. Wang, S.; Li, J.; Zhang, B.; Lee, Z.; Spyrakos, E.; Feng, L.; Liu, C.; Zhao, H.; Wu, Y.; Zhu, L.; et al. Changes of Water Clarity in Large Lakes and Reservoirs across China Observed from Long-term MODIS. Remote Sens. Environ. 2020, 247, 111949. [Google Scholar] [CrossRef]
  24. Song, K.; Liu, G.; Wang, Q.; Wen, Z.; Lyu, L.; Du, Y.; Sha, L.; Fang, C. Quantification of Lake Clarity in China using Landsat OLI Imagery data. Remote Sens. Environ. 2020, 243, 111800. [Google Scholar] [CrossRef]
  25. Wu, Z.; Zhang, Y.; Zhou, Y.; Liu, M.; Shi, K.; Yu, Z. Seasonal-Spatial Distribution and Long-Term Variation of Transparency in Xin’anjiang Reservoir: Implications for Reservoir Management. Int. J. Environ. Res. Public Health 2015, 12, 9492–9507. [Google Scholar] [CrossRef]
  26. Wang, Y.; Liu, Q.; Feng, Q.; Gong, J.; Hu, Z.; Hu, M. Inversion of Chlorophyll-a Concentration Based on Satellite Remote Sensing in Qiandao Lake. Acta Laser Biol. Sin. 2015, 24, 441–447. [Google Scholar] [CrossRef]
  27. Yang, M.; Hu, Z.; Liu, Q.; Ren, L.; Chen, L.; Li, P. Evaluation of Water Quality by Two Trophic State Indices in Lake Qiandaohu during 2007–2011. J. Shanghai Ocean Univ. 2013, 22, 240–245. [Google Scholar] [CrossRef]
  28. Xu, P.; Mao, F.; Jin, P.; Cheng, Q. Spatial-temporal Variations of Chlorophyll-a in Qiandao Lake using GF1_WFV Data. China Environ. Sci. 2020, 40, 4580–4588. [Google Scholar]
  29. Zhang, Y.; Zhang, Y.; Zha, Y.; Shi, K.; Zhou, Y.; Wang, M. Remote Sensing Estimation of Total Suspended Matter Concentration in Xin’anjiang Reservoir Using Landsat 8 Data. Environ. Sci. 2015, 36, 56–63. [Google Scholar] [CrossRef]
  30. Carlson, R.E. A Trophic State Index for Lakes. Limnol. Oceanogr. 1977, 22, 361–369. [Google Scholar] [CrossRef] [Green Version]
  31. Liu, M.; Zhang, Y.; Shi, K.; Zhang, Y.; Zhou, Y.; Zhu, M.; Zhu, G.; Wu, Z.; Liu, M. Effects of Rainfall on Thermal Stratification and Dissolved Oxygen in a Deep Drinking Water Reservoir. Hydrol. Process. 2020, 34, 3387–3399. [Google Scholar] [CrossRef]
  32. Zhang, Y.; Shi, K.; Zhang, Y.; Moreno-Madriñán, M.J.; Zhu, G.; Zhou, Y.; Li, Y. River Plume Monitoring in a Deep Valley Reservoir using HJ-1 A/B Images. J. Hydrol. 2020, 587, 125031. [Google Scholar] [CrossRef]
  33. Zhang, Y.; Wu, Z.; Liu, M.; He, J.; Shi, K.; Wang, M.; Yu, Z. Thermal Structure and Response to Long-term Climatic Changes in Lake Qiandaohu, a Deep Subtropical Reservoir in China. Limnol. Oceanogr. 2014, 59, 1193–1202. [Google Scholar] [CrossRef]
  34. Zhang, Y.; Zhang, Y.; Shi, K.; Zhou, Y.; Li, N. Remote Sensing Estimation of Water Clarity for Various Lakes in China. Water Res. 2021, 192, 116844. [Google Scholar] [CrossRef]
  35. Mueller, J.L.; Fargion, G.S.; McClain, C.R.; Pegau, S.; Zanefeld, J.; Mitchell, B.G.; Kahru, M.; Wieland, J.; Stramska, M. Inherent Optical Properties: Instruments, Characterizations, Field Measurements and Data Analysis Protocols. In Ocean Optics Protocols for Satellite Ocean Color Sensor Validation; NASA, Ed.; Goddard Space Flight Space Center: Greenbelt, MD, USA, 2003; Volume IV, pp. 1–84. [Google Scholar]
  36. Cooley, T.; Anderson, G.; Felde, G.W.; Hoke, M.; Ratkowski, A.J.; Chetwynd, J.; Gardner, J.; Adler-Golden, S.; Matthew, M.; Berk, A.; et al. FLAASH, a MODTRAN4-based Atmospheric Correction Algorithm, its Application and Validation. IEEE Int. Geosci. Remote. Sens. Symp. 2002, 3, 1414–1418. [Google Scholar] [CrossRef]
  37. Bailey, S.W.; Werdell, P.J. A Multi-sensor Approach for the On-orbit Validation of Ocean Color Satellite Data Products. Remote Sens. Environ. 2006, 102, 12–23. [Google Scholar] [CrossRef]
  38. Khullar, S.; Singh, N. Machine Learning Techniques in River Water Quality Modelling: A Research Travelogue. Water Supply 2020, 21, 1–13. [Google Scholar] [CrossRef]
  39. Gholizadeh, M.H.; Melesse, A.M.; Reddi, L. A Comprehensive Review on Water Quality Parameters Estimation Using Remote Sensing Techniques. Sensors 2016, 16, 1298. [Google Scholar] [CrossRef] [PubMed] [Green Version]
  40. Lee, Z.; Carder, K.L.; Arnone, R.A. Deriving Inherent Optical Properties from Water Color: A Multiband Quasi-analytical Algorithm for Optically Deep Waters. Appl. Opt. 2002, 41, 5755–5772. [Google Scholar] [CrossRef]
  41. Werdell, P.J.; McKinna, L.I.W.; Boss, E.; Ackleson, S.G.; Craig, S.E.; Gregg, W.W.; Lee, Z.; Maritorena, S.; Roesler, C.S.; Rousseaux, C.S.; et al. An Overview of Approaches and Challenges for Retrieving Marine Inherent Optical Properties from Ocean Color Remote Sensing. Prog. Oceanogr. 2018, 160, 186–212. [Google Scholar] [CrossRef]
  42. Doron, M.; Babin, M.; Hembise, O.; Mangin, A.; Garnesson, P. Ocean Transparency from Space: Validation of Algorithms Estimating Secchi Depth using MERIS, MODIS and SeaWiFS Data. Remote Sens. Environ. 2011, 115, 2986–3001. [Google Scholar] [CrossRef]
  43. Kloiber, S.M.; Brezonik, P.L.; Olmanson, L.G.; Bauer, M.E. A Procedure for Regional Lake Water Clarity Assessment using Landsat Multispectral Data. Remote Sens. Environ. 2002, 82, 38–47. [Google Scholar] [CrossRef]
  44. Deutsch, E.S.; Cardille, J.A.; Koll-Egyed, T.; Fortin, M.-J. Landsat 8 Lake Water Clarity Empirical Algorithms: Large-Scale Calibration and Validation Using Government and Citizen Science Data from across Canada. Remote Sens. 2021, 13, 1257. [Google Scholar] [CrossRef]
  45. Olmanson, L.G.; Bauer, M.E.; Brezonik, P.L. A 20-year Landsat Water Clarity Census of Minnesota’s 10,000 lakes. Remote Sens. Environ. 2008, 112, 4086–4097. [Google Scholar] [CrossRef]
  46. Niroumand-Jadidi, M.; Bovolo, F.; Bruzzone, L. Novel Spectra-Derived Features for Empirical Retrieval of Water Quality Parameters: Demonstrations for OLI, MSI, and OLCI Sensors. IEEE Trans. Geosci. Remote 2019, 57, 10285–10300. [Google Scholar] [CrossRef]
  47. Rubin, H.J.; Lutz, D.A.; Steele, B.G.; Cottingham, K.L.; Weathers, K.C.; Ducey, M.J.; Palace, M.; Johnson, K.M.; Chipman, J.W. Remote Sensing of Lake Water Clarity: Performance and Transferability of Both Historical Algorithms and Machine Learning. Remote Sens. 2021, 13, 1434. [Google Scholar] [CrossRef]
  48. Lee, Z.; Shang, S.; Du, K.; Wei, J. Resolving the Long-standing Puzzles about the Observed Secchi Depth Relationships. Limnol. Oceanogr. 2018, 63, 2321–2336. [Google Scholar] [CrossRef]
  49. Alikas, K.; Kratzer, S. Improved Retrieval of Secchi Depth for Optically-complex Waters using Remote Sensing Data. Ecol. Indic. 2017, 77, 218–227. [Google Scholar] [CrossRef]
  50. Mishra, N.; Haque, M.O.; Leigh, L.; Aaron, D.; Helder, D.; Markham, B. Radiometric Cross Calibration of Landsat 8 Operational Land Imager (OLI) and Landsat 7 Enhanced Thematic Mapper Plus (ETM+). Remote Sens. 2014, 6, 12619–12638. [Google Scholar] [CrossRef] [Green Version]
  51. Xu, Y.; Feng, L.; Zhao, D.; Lu, J. Assessment of Landsat Atmospheric Correction Methods for Water Color Applications using Global AERONET-OC Data. Int. J. Appl. Earth Obs. Geoinf. 2020, 93, 102192. [Google Scholar] [CrossRef]
  52. Wang, D.; Ma, R.; Xue, K.; Loiselle, S. The Assessment of Landsat-8 OLI Atmospheric Correction Algorithms for Inland Waters. Remote Sens. 2019, 11, 169. [Google Scholar] [CrossRef] [Green Version]
  53. He, X.; Bai, Y.; Pan, D.; Tang, J.; Wang, D. Atmospheric Correction of Satellite Ocean Color Imagery using the Ultraviolet Wavelength for Highly Turbid Waters. Opt. Express 2012, 20, 20754–20770. [Google Scholar] [CrossRef]
  54. Liu, D.; Duan, H.; Yu, S.; Shen, M.; Xue, K. Human-induced Eutrophication Dominates the Bio-optical Compositions of Suspended Particles in Shallow Lakes: Implications for Remote Sensing. Sci. Total Environ. 2019, 667, 112–123. [Google Scholar] [CrossRef]
  55. Pachauri, R.K.; Allen, M.R.; Barros, V.R.; Broome, J.; Cramer, W.; Christ, R.; Church, J.A.; Clarke, L.; Dahe, Q.D.; Dasqupta, P.; et al. Climate Change 2014 Synthesis Report. Contribution of Working Groups I, II, and III to the Fifth Assessment Report of the Intergovernmental Panel on Climate Change; IPCC: Geneva, Switzerland, 2014. [Google Scholar]
  56. Qin, B.; Zhang, Y.; Zhu, G.; Gong, Z.; Deng, J.; Hamilton, D.P.; Gao, G.; Shi, K.; Zhou, J.; Shao, K.; et al. Are Nitrogen-to-phosphorus Ratios of Chinese Lakes Actually Increasing? Proc. Natl. Acad. Sci. USA 2020, 117, 21000–21002. [Google Scholar] [CrossRef]
  57. Zhang, Y.; Qin, B.; Shi, K.; Zhang, Y.; Deng, J.; Wild, M.; Li, L.; Zhou, Y.; Yao, X.; Liu, M.; et al. Radiation Dimming and Decreasing Water Clarity Fuel Underwater Darkening in Lakes. Sci. Bull. 2020, 65, 1675–1684. [Google Scholar] [CrossRef]
  58. Zhu, J.; Song, C.; Wang, J.; Ke, L. China’s Inland Water Dynamics: The Significance of Water Body Types. Proc. Natl. Acad. Sci. USA 2020, 117, 13876–13878. [Google Scholar] [CrossRef] [PubMed]
  59. Liu, C.; Zhu, L.; Li, J.; Wang, J.; Ju, J.; Qiao, B.; Ma, Q.; Wang, S. The Increasing Water Clarity of Tibetan Lakes over Last 20 Years according to MODIS Data. Remote Sens. Environ. 2021, 253, 112199. [Google Scholar] [CrossRef]
  60. Wang, S.; Li, J.; Zhang, W.; Cao, C.; Zhang, F.; Shen, Q.; Zhang, X.; Zhang, B. A Dataset of Remote-sensed Forel-Ule Index for Global Inland Waters during 2000–2018. Sci. Data 2021, 8, 26. [Google Scholar] [CrossRef]
  61. Moges, M.A.; Schmitter, P.; Tilahun, S.A.; Ayana, E.K.; Ketema, A.A.; Nigussie, T.E.; Steenhuis, T.S. Water Quality Assessment by Measuring and Using Landsat 7 ETM+ Images for the Current and Previous Trend Perspective: Lake Tana Ethiopia. J. Water Resour. Prot. 2017, 9, 1564–1585. [Google Scholar] [CrossRef] [Green Version]
  62. Naumenko, M.A. Seasonality and Trends in the Secchi Disk Transparency of Lake Ladoga. Hydrobiologia 2008, 599, 59–65. [Google Scholar] [CrossRef]
  63. Hou, X.; Feng, L.; Duan, H.; Chen, X.; Sun, D.; Shi, K. Fifteen-year Monitoring of the Turbidity Dynamics in Large Lakes and Reservoirs in the Middle and Lower Basin of the Yangtze River, China. Remote Sens. Environ. 2017, 190, 107–121. [Google Scholar] [CrossRef]
  64. Topp, S.N.; Pavelsky, T.M.; Stanley, E.H.; Yang, X.; Griffin, C.G.; Ross, M.R.V. Multi-decadal Improvement in US Lake Water Clarity. Environ. Res. Lett. 2021, 16, 055025. [Google Scholar] [CrossRef]
  65. Guan, Q.; Feng, L.; Hou, X.; Schurgers, G.; Zheng, Y.; Tang, J. Eutrophication Changes in Fifty Large Lakes on the Yangtze Plain of China Derived from MERIS and OLCI observations. Remote Sens. Environ. 2020, 246, 111890. [Google Scholar] [CrossRef]
  66. Zhou, Y.; Liu, M.; Zhou, L.; Jang, K.-S.; Xu, H.; Shi, K.; Zhu, G.; Liu, M.; Deng, J.; Zhang, Y.; et al. Rainstorm Events Shift the Molecular Composition and Export of Dissolved Organic Matter in a Large Drinking Water Reservoir in China: High frequency buoys and field observations. Water Res. 2020, 187, 116471. [Google Scholar] [CrossRef]
  67. Shi, K.; Zhang, Y.; Song, K.; Liu, M.; Zhou, Y.; Zhang, Y.; Li, Y.; Zhu, G.; Qin, B. A Semi-analytical Approach for Remote Sensing of Trophic State in Inland Waters: Bio-optical Mechanism and Application. Remote Sens. Environ. 2019, 232, 111349. [Google Scholar] [CrossRef]
  68. Dai, J.; Wu, S.; Sha, H.; Wu, X.; Yang, Q.; Lv, X.; Zhu, S.; Xue, W.; Wang, F.; Chen, D. Lacustrine Micro-ecosystem Responses to the Inflow Discharge Gradient of Water Diversion from Yangtze River to Lake Taihu. Environ. Geochem. Health 2020, 42, 1021–1032. [Google Scholar] [CrossRef]
  69. McCullough, I.M.; Loftin, C.S.; Sader, S.A. Landsat Imagery Reveals Declining Clarity of Maine’s Lakes during 1995–2010. Freshw. Sci. 2013, 32, 741–752. [Google Scholar] [CrossRef]
  70. Peckham, S.D.; Lillesand, T.M. Detection of Spatial and Temporal Trends in Wisconsin Lake Water Clarity Using Landsat-derived Estimates of Secchi Depth. Lake Reserv. Manag. 2006, 22, 331–341. [Google Scholar] [CrossRef] [Green Version]
  71. Li, Y.; Shi, K.; Zhang, Y.; Zhu, G.; Zhang, Y.; Wu, Z.; Liu, M.; Guo, Y.; Li, N. Analysis of Water Clarity Decrease in Xin’anjiang Reservoir, China, from 30-Year Landsat TM, ETM+, and OLI Observations. J. Hydrol. 2020, 590, 125476. [Google Scholar] [CrossRef]
  72. White, J.R.; Fulweiler, R.W.; Li, C.Y.; Bargu, S.; Walker, N.D.; Twilley, R.R.; Green, S.E. Mississippi River Flood of 2008: Observations of a Large Freshwater Diversion on Physical, Chemical, and Biological Characteristics of a Shallow Estuarine Lake. Environ. Sci. Technol. 2009, 43, 5599–5604. [Google Scholar] [CrossRef] [PubMed]
  73. Dai, M.; Zhai, W.; Cai, W.; Callahan, J.; Huang, B.; Shang, S.; Huang, T.; Li, X.; Lu, Z.; Chen, W. Effects of An Estuarine Plume-associated Bloom on the Carbonate System in the Lower Reaches of the Pearl River Estuary and the Coastal Zone of the Northern South China Sea. Cont. Shelf Res. 2008, 28, 1416–1423. [Google Scholar] [CrossRef]
  74. Fu, D.; Pan, D.; Wang, D.; Zhang, Y.; Ding, Y.; Liu, D. The Analysis of Phytoplankton Blooms off the Yangtze River Estuary in the Spring of 2007. Aquat. Ecosyst. Health Manag. 2014, 17, 221–232. [Google Scholar] [CrossRef]
  75. Behrenfeld, M.J.; Boss, E.S. Student’s Tutorial on Bloom Hypotheses in the Context of Phytoplankton Annual Cycles. Glob. Chang. Biol. 2018, 24, 55–77. [Google Scholar] [CrossRef]
  76. Chen, X.; Pan, D.; Xianqiang, H.E.; Bai, Y.; Wang, D. Upper Ocean Responses to Category 5 Typhoon Megi in the Western North Pacific. Acta Oceanol. Sin. 2012, 31, 51–58. [Google Scholar] [CrossRef]
  77. Zhao, H.; Tang, D.; Wang, Y. Comparison of Phytoplankton Blooms Triggered by Two Typhoons with Different Intensities and Translation Speeds in the South China Sea. Mar. Ecol. Prog. Ser. 2008, 365, 57–65. [Google Scholar] [CrossRef] [Green Version]
Figure 1. (a) Locations of the Qiandao Lake and in situ sampling stations. (b) Catchment region of the Qiandao Lake. Note: The lake catchment extents were identified using the WWF HydroSHEDS dataset (www.hydrosheds.org (accessed on 2 March 2021)) through the ArcGIS tool.
Remotesensing 13 02570 g001
Figure 2. Monthly (a) and histogram (b) distributions of in situ SDD measurements during 2013–2019.
Remotesensing 13 02570 g002
Figure 3. Histogram distribution of the modeling (a) and validation (b) SDD dataset.
Remotesensing 13 02570 g003
Figure 4. Remote sensing reflectance (Rrs) dynamics at typical stations in the Qiandao Lake. The left column shows the result on March 28 and the right column is the result on April 29. (a,b) are false-color composite images. (c,d) are Rrs spectral curves.
Remotesensing 13 02570 g004
Figure 5. Comparing SDDRS and SDDin situ based on the modeling (a,d) and validation (b,e) dataset, respectively. (c,f) were sensitivity analysis results on the selection of validation samples. The first row showed the results for the stepwise method and the second row displayed the results for the SVM approach.
Remotesensing 13 02570 g005
Figure 6. (a) Valid OLI images from January 2013 to August 2020; (b) Spatial and (c) median SDD variability in 2017.
Remotesensing 13 02570 g006
Figure 7. Variability of SDD in the Qiandao Lake during 2013–2020. (a) Areas with significant SDD change rates; (b) Histogram distribution of the significant SDD change rates; (c) Median SDD variability for the whole Qiandao Lake.
Remotesensing 13 02570 g007
Figure 8. (a) Changes in SDD, water level, and total rainfall in the catchment area of the Qiandao Lake in 2020; (b) Spatiotemporal changes of satellite-derived SDD in the Qiandao Lake in 2020.
Remotesensing 13 02570 g008
Figure 9. Bias (black circles) and median Bias (red triangles) between satellite-derived and field SDD results at different time intervals.
Remotesensing 13 02570 g009
Table 1. Details about in situ SDD (Secchi disk depth) measurement stations.
StationsLatitudeLongitudeNumber of Measurements
JK29.72°N118.72°E81
XJS29.62°N118.94°E82
STD29.50°N118.97°E82
DB29.51°N119.21°E82
MTJ29.47°N118.75°E82
HTD29.71°N119.12°E77
WPLC29.67°N118.83°E40
LSCK29.56°N119.05°E23
MS29.51°N119.15°E23
MZY29.50°N119.18°E23
BMF29.42°N118.63°E51
PLSC29.61°N119.03°E33
Table 2. Detailed settings about the multispectral bands of the OLI sensor.
Band IDBand TypeBandwidth (nm)Main Uses in Watercolor Research
Band 1Coastal/Aerosol433–453Coastal water and aerosol monitoring
Band 2Blue450–515Suspended materials monitoring
Band 3Green525–600
Band 4Red630–680
Band 5Near-infrared845–885Atmospheric correction
Band 6Shortwave infrared1560–1660
Band 7Shortwave infrared2100–2300
Band 8Panchromatic500–680Water boundary recognition
Band 9Cirrus1360–1390Cirrus monitoring
Table 3. SDD changing rates of lakes in different regions.
Lake LocationSDD Changing RatesReferences
Tibetan Plateau, China0.033 m/year between 2000 and 2019.Liu, et al. [59]
Lake Ladoga, Europe−0.02 m/year during 1905–2003.Naumenko [62]
Minnesota, USARemained stable over the period 1985–2005.Olmanson, et al. [45]
Maine, USA−0.04 m/year during 1995–2010.McCullough, et al. [69]
Wisconsin, USA0.04 m/year during 1980–2000.Peckham and Lillesand [70]
USA0.005 m/year from 1984 to 2020.Topp, et al. [64]
Qiandao Lake−0.006 m/year during 1986–2016.Li, et al. [71]
−0.08 m/year during 1988–2013.Wu, et al. [25]
0.9% area changed −0.09 m/year
4.42% area changed 0.11 m/year during 2013–2020.
This research
Publisher’s Note: MDPI stays neutral with regard to jurisdictional claims in published maps and institutional affiliations.

