Article

Applicability of Susceptibility Model for Rock and Loess Earthquake Landslides in the Eastern Tibetan Plateau

1
Aerospace Information Research Institute, Chinese Academy of Sciences, Beijing 100094, China
2
University of Chinese Academy of Sciences, Beijing 100049, China
3
Jiuzhaigou Administration Bureau, Aba 623400, China
*
Author to whom correspondence should be addressed.
Remote Sens. 2021, 13(13), 2546; https://doi.org/10.3390/rs13132546
Submission received: 14 May 2021 / Revised: 23 June 2021 / Accepted: 24 June 2021 / Published: 29 June 2021

Abstract

:
It is crucial to explore a suitable landslide susceptibility model with an excellent prediction capability for rapid evaluation and disaster relief in seismic regions with different lithological features. In this study, we selected two typical seismic events, the Jiuzhaigou and Minxian earthquakes, which occurred in the Alpine karst and loess regions, respectively. Eight influencing factors and five models were chosen to calculate the susceptibility of landslide, including the information (I) model, certainty factor (CF) model, logistic regression (LR) model, I + LR coupling model, and CF + LR coupling model. Then, the accuracy and the landslide susceptibility distribution of these models were assessed by the area under curve (AUC) and distribution criteria. Finally, the model with high accuracy and good applicability for the rock landslide or loess landslide regions was optimized. Our results showed that the accuracy of the coupling model is higher than that of the single models. Except for the LR model, the landslide susceptibility distribution for the above-mentioned models is consistent with universal cognition. The coupling models are generally better than their single models. Among them, the I + LR model can obtain the best comprehensive results for assessing the distribution and accuracy of both rock and loess landslide susceptibility, which is helpful for disaster relief and policy-making, and it can also provide useful scientific data for post-seismic reconstruction and restoration.

Graphical Abstract

1. Introduction

Landslides are the main secondary disaster induced by seismic activities. According to the lithology of landslide material, landslides can be divided into rock landslides and soil landslides [1]. Many large seismic events occurred in the eastern and northeastern margin of Tibet Plateau, such as the Haiyuan Ms 8.5 earthquake on 16 December 1920 [2], the Diexi Ms 7.5 earthquake on 25 August 1933 [3], the Wenchuan Ms 8.0 earthquake on 12 May 2008 [4], the Lushan Ms 7.0 earthquake on 20 April 2013 [5], the Minxian Ms 6.6 earthquake on 22 July 2013 [6], the Ludian Ms 6.5 earthquake on 3 August 2014 [7], and Jiuzhaigou Ms 7.0 earthquake on 8 August 2017 [8] (Figure 1). Usually, the topography with deep-incised valleys and high mountains developed in these high seismic risk regions (Figure 1c) can easily induce a series of coseismic landslides. The rock and loess landslides have developed in the eastern and northeastern parts of the Tibet Plateau, respectively. The earthquake-induced landslides not only threaten the safety of humans and property but also pose great safety risks to the reconstruction of the disaster area. Thus, it is important to explore and choose a model with excellent prediction capability and suitable for quickly assessing earthquake-induced landslide susceptibility in different lithology regions.
At present, landslide susceptibility methods can be divided into qualitative and quantitative analyses [9,10]. The qualitative methods mainly rely on expert experiences to estimate susceptibility [11]. In contrast, the quantitative methods are more objective because they mainly rely on data rather than expert experiences [12]. The Newmark method [13], which is one of the quantitative methods, needs to obtain clear geotechnical physical mechanics and ground motion parameters. However, it is difficult to obtain these parameters in a large area, and sometimes there are errors between the obtained parameters and the true values. So, it is hard to use the Newmark model to calculate regional landslide susceptibility in many cases [14,15]. The statistical models are indirect quantitative methods with high accuracy that have been used in a large number of studies. Previous studies show that these methods are effective in landslide susceptibility calculation [16]. The common statistical models include the frequency ratio (FR) model [17], information (I) model [18], certainty factor (CF) model [19], support vector machine (SVM) [20], weight of evidence method [21], and logistic regression (LR) model [22]. The LR model has been widely used in the study of earthquake landslide susceptibility because of its simple calculation and clear physical meaning, such as in the Wenchuan earthquake [23], the Yushu earthquake [24], and so on.
However, these statistical models still have some limitations. The SVM model needs to choose the appropriate kernel function. Some methods, such as FR, I, CF, and weight of evidence models, do not consider the differences of influencing factors and add each influence factor layer with the same weight for landslide susceptibility. Other methods, such as the LR model, can not solve the quantitative problem of each influencing factor. Hence, it is difficult to objectively and accurately calculate susceptibility to landslides on a consistent basis [25]. Coupling these single models can solve the problems of quantification and weight of influencing factors, complement their respective advantages, optimize the susceptibility model, improve accuracy, and enhance rationality; model coupling is one of the hotspots of current landslide susceptibility model research [26,27,28,29].
Moreover, due to differences in regional geological environments, different landslide susceptibility calculation models still have problems in the application process. Therefore, before calculating landslide susceptibility, it is necessary to couple these single models and select a model with high accuracy and strong applicability [30]. To select a rapid susceptibility model suitable for different lithology landslides, the Jiuzhaigou earthquake area and the Minxian earthquake area were selected as the study areas. In this study, the I, CF, LR, I + LR, and CF + LR models were used to calculate landslide susceptibility, respectively. Then, these models were assessed by the AUC value and distribution criteria. The best method with a more reasonable distribution and higher accuracy suitable for rock landslides and loess landslides could be selected. That method could quickly evaluate landslide susceptibility, helping disaster relief and reconstruction in earthquake-stricken areas. This study will provide a reference for landslide susceptibility calculations in areas with similar geological environments in the future.

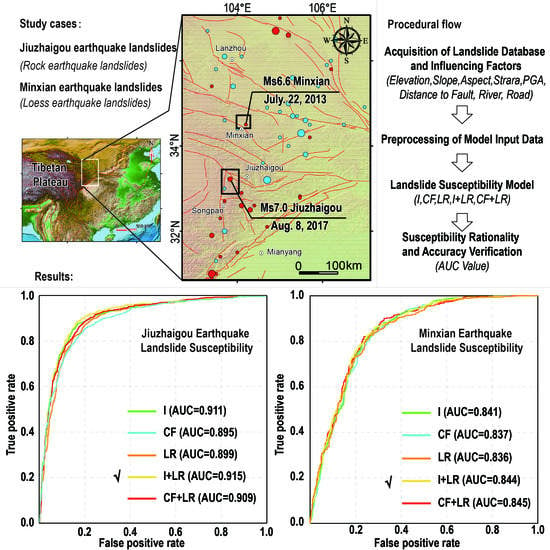
2. Background of Study Area

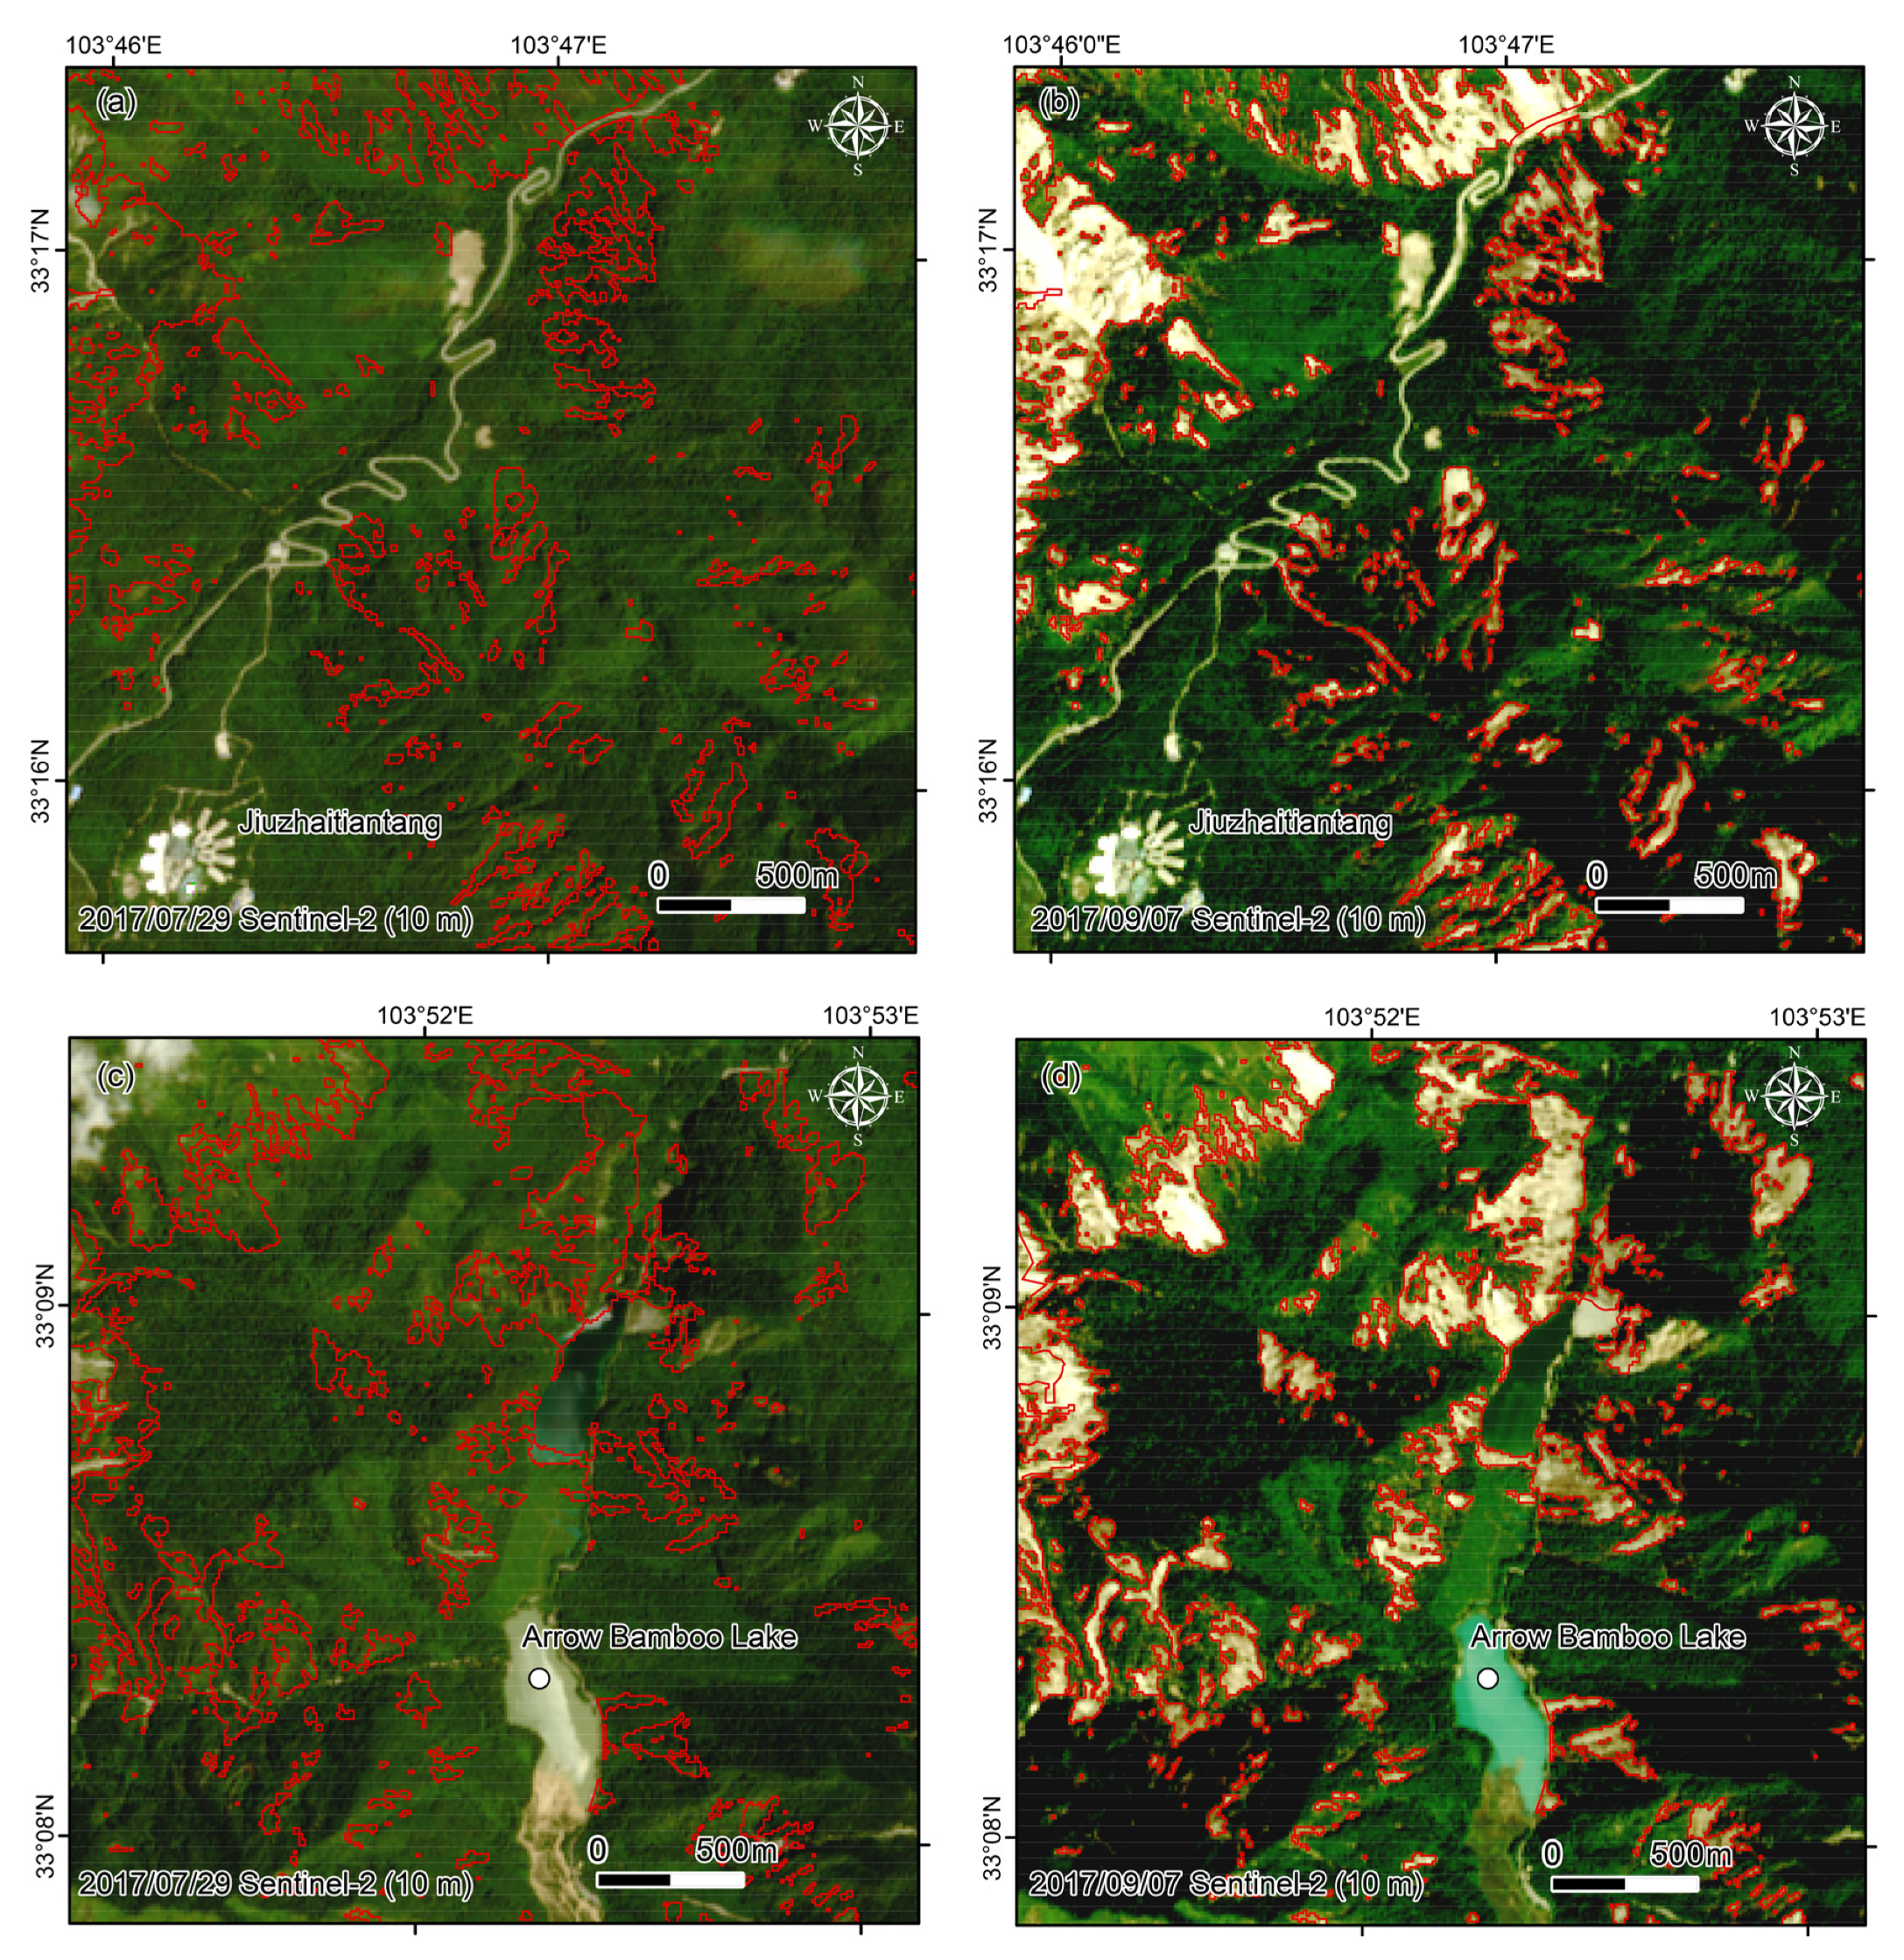
2.1. Jiuzhaigou Earthquake

Jiuzhaigou is located in the eastern Tibetan Plateau. It is a topographic transition zone from the Tibetan Plateau to the Sichuan Basin (Figure 1). The main faults include the Minjiang fault, the Tazang fault, and the northwestern segment of the Huya fault in the Jiuzhaigou area. This region features deep-incised valleys and high mountains [31,32]. The maximum peak is over 4700 m a.s.l. and the minimum elevation is about 1160 m a.s.l. in the river valley. The slope gradient is higher than 30° [8]. Carbonate rocks are widely distributed in this area. There are a large number of folds and faults. Neotectonic movements are strong, and a large number of joints exist in the rocks. The rocks are relatively broken [33].
The outcrops of Devonian to Triassic sedimentary rocks (Lueyang Formation, Yiwa Formation, Minhe Group, Gahai Formation, Longtan Formation, Changxing Formation) are well developed in the Jiuzhaigou area (Table 1, Figure 6f). The most representative sedimentary rocks are the thick sequence of deep marine deposits, including limestone, flysch complex, and sandstone. The lithologic characteristics of Devonian strata are stratiform limestone and massive dolomite; the lithologic characteristic of Carboniferous stratum is layered and dense massive limestone (Figure 3e); the lithologic characteristics of Permian strata are composed of siliceous limestone and sandy limestone; Triassic lithologic characteristics are mainly composed of limestone (Figure 3d) and sandstone, and Quaternary loose deposits are distributed along the river valleys (Table 1) [32,34].
On 8 August 2017, a Ms 7.0 earthquake occurred in Jiuzhaigou County, Aba Autonomous Prefecture, Sichuan Province, China (33.20°N, 103.82°E). The area affected by the Jiuzhaigou earthquake was more than 4000 km2. The seismogenic fault of the earthquake was a previously unknown blind fault, the Xiongmaohai-Shangsizhai fault, which is likely the northwestern extension of the Huya fault [35]. This earthquake triggered thousands of rock landslides [8,36,37].

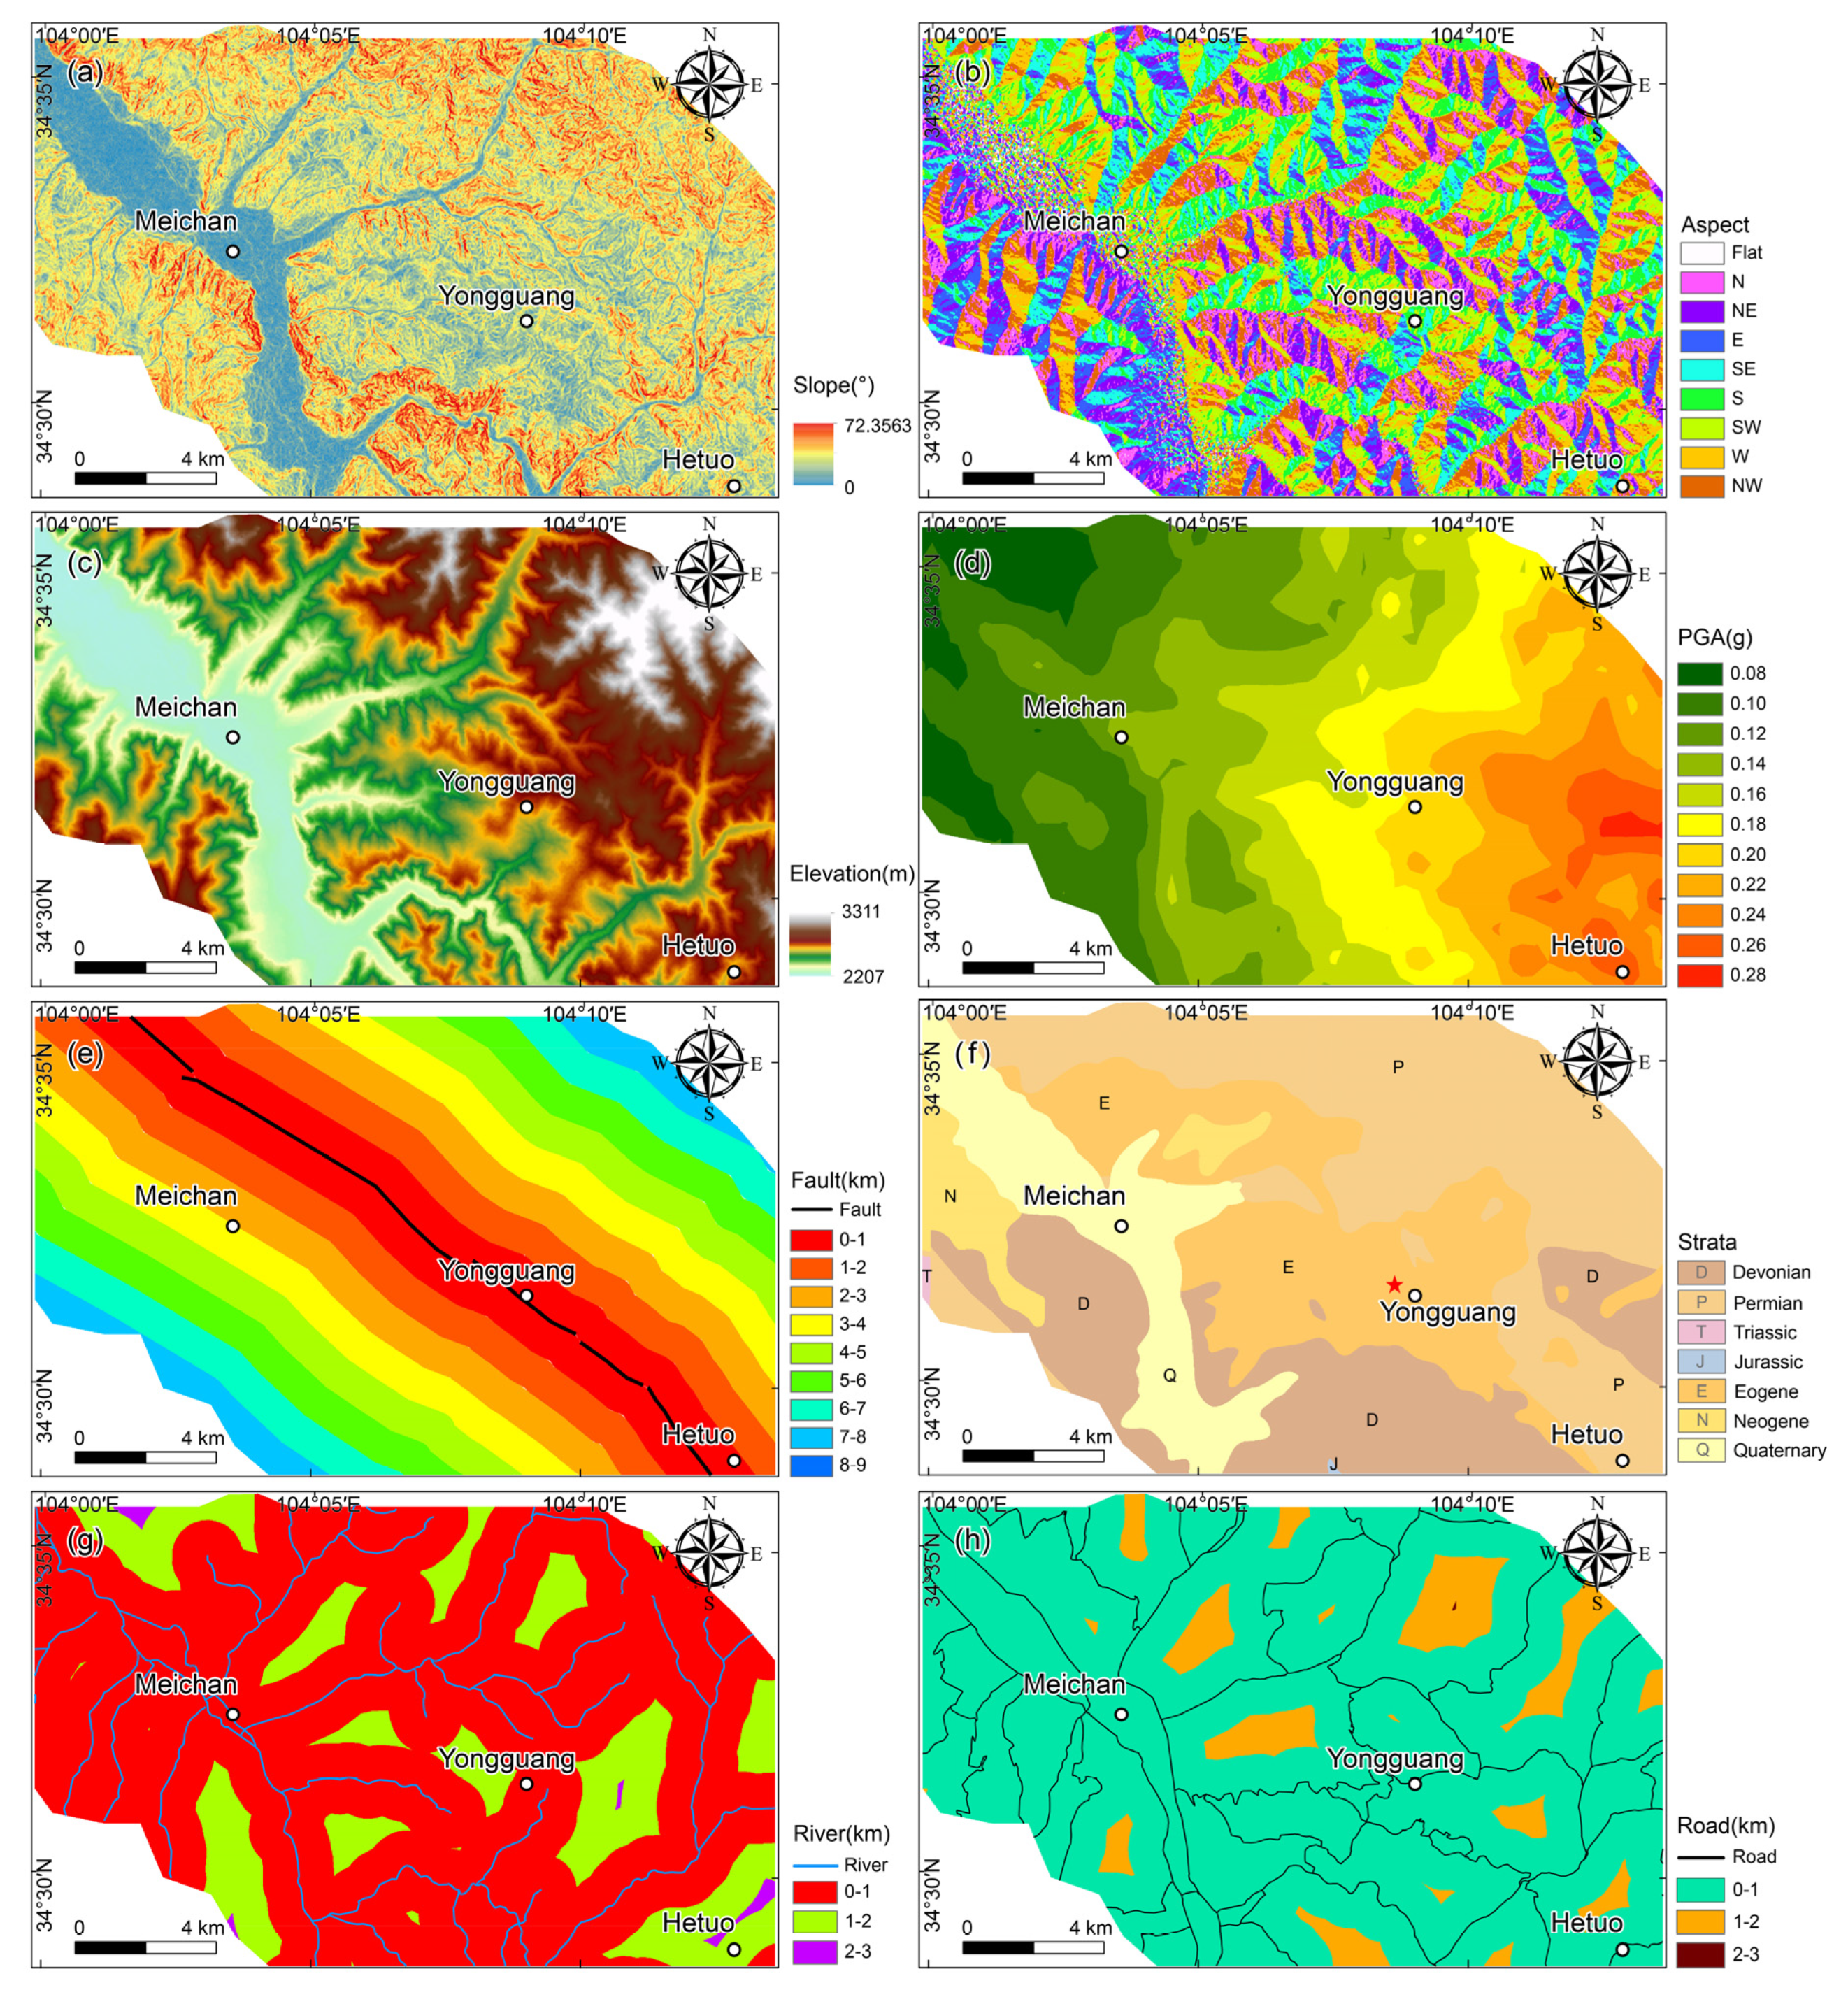
2.2. Minxian Earthquake

Minxian county is located on the transition zone between the Tibetan Plateau and Loess Plateau (Figure 1). The main fault is the Hetuo fault, which is a secondary fault of the Lintan-Tanchang fault zone in the Minxian area [38]. The study area is of plateau mountainous landforms. The mountain area accounts for nearly 90% of the study area. Its elevation is mostly in the range of 2190–3360 m. The slope gradient ranges from 0° to 72.3563°, 19.37° on average [39].
In the study area, the exposed strata from the surface to bottom are mainly covered by late Pleistocene Malan loess (Q3), middle Pleistocene Lishi loess (Q2), loess-like silt, weathered sandstone, and other loose sediments [40]. Field investigation showed that the loess is thicker than 10 m [41]. The structure of the Malan loess is weak and loose, and the vertical joints are well developed.
Landslides are mainly distributed in the area where the underlying lithology is tertiary red sandstones and siltstones (Guyuan Formation, Gansu Group) (Table 2, Figure 7f) [42]. The boundary between the overlying loess and the underlying tertiary red beds is the zone, which is easy to slip [6,41]. Moreover, the structure of loess under the influence of the earthquake can easily cause loess landslides, collapses, and subsidence [43].
On 22 July 2013, a Ms 6.6 earthquake occurred at the junction area of Min County and Zhang County in Dingxi City, Gansu Province, China (34.50°N, 104.20°E). The earthquake triggered a large number of loess landslides [6,38].

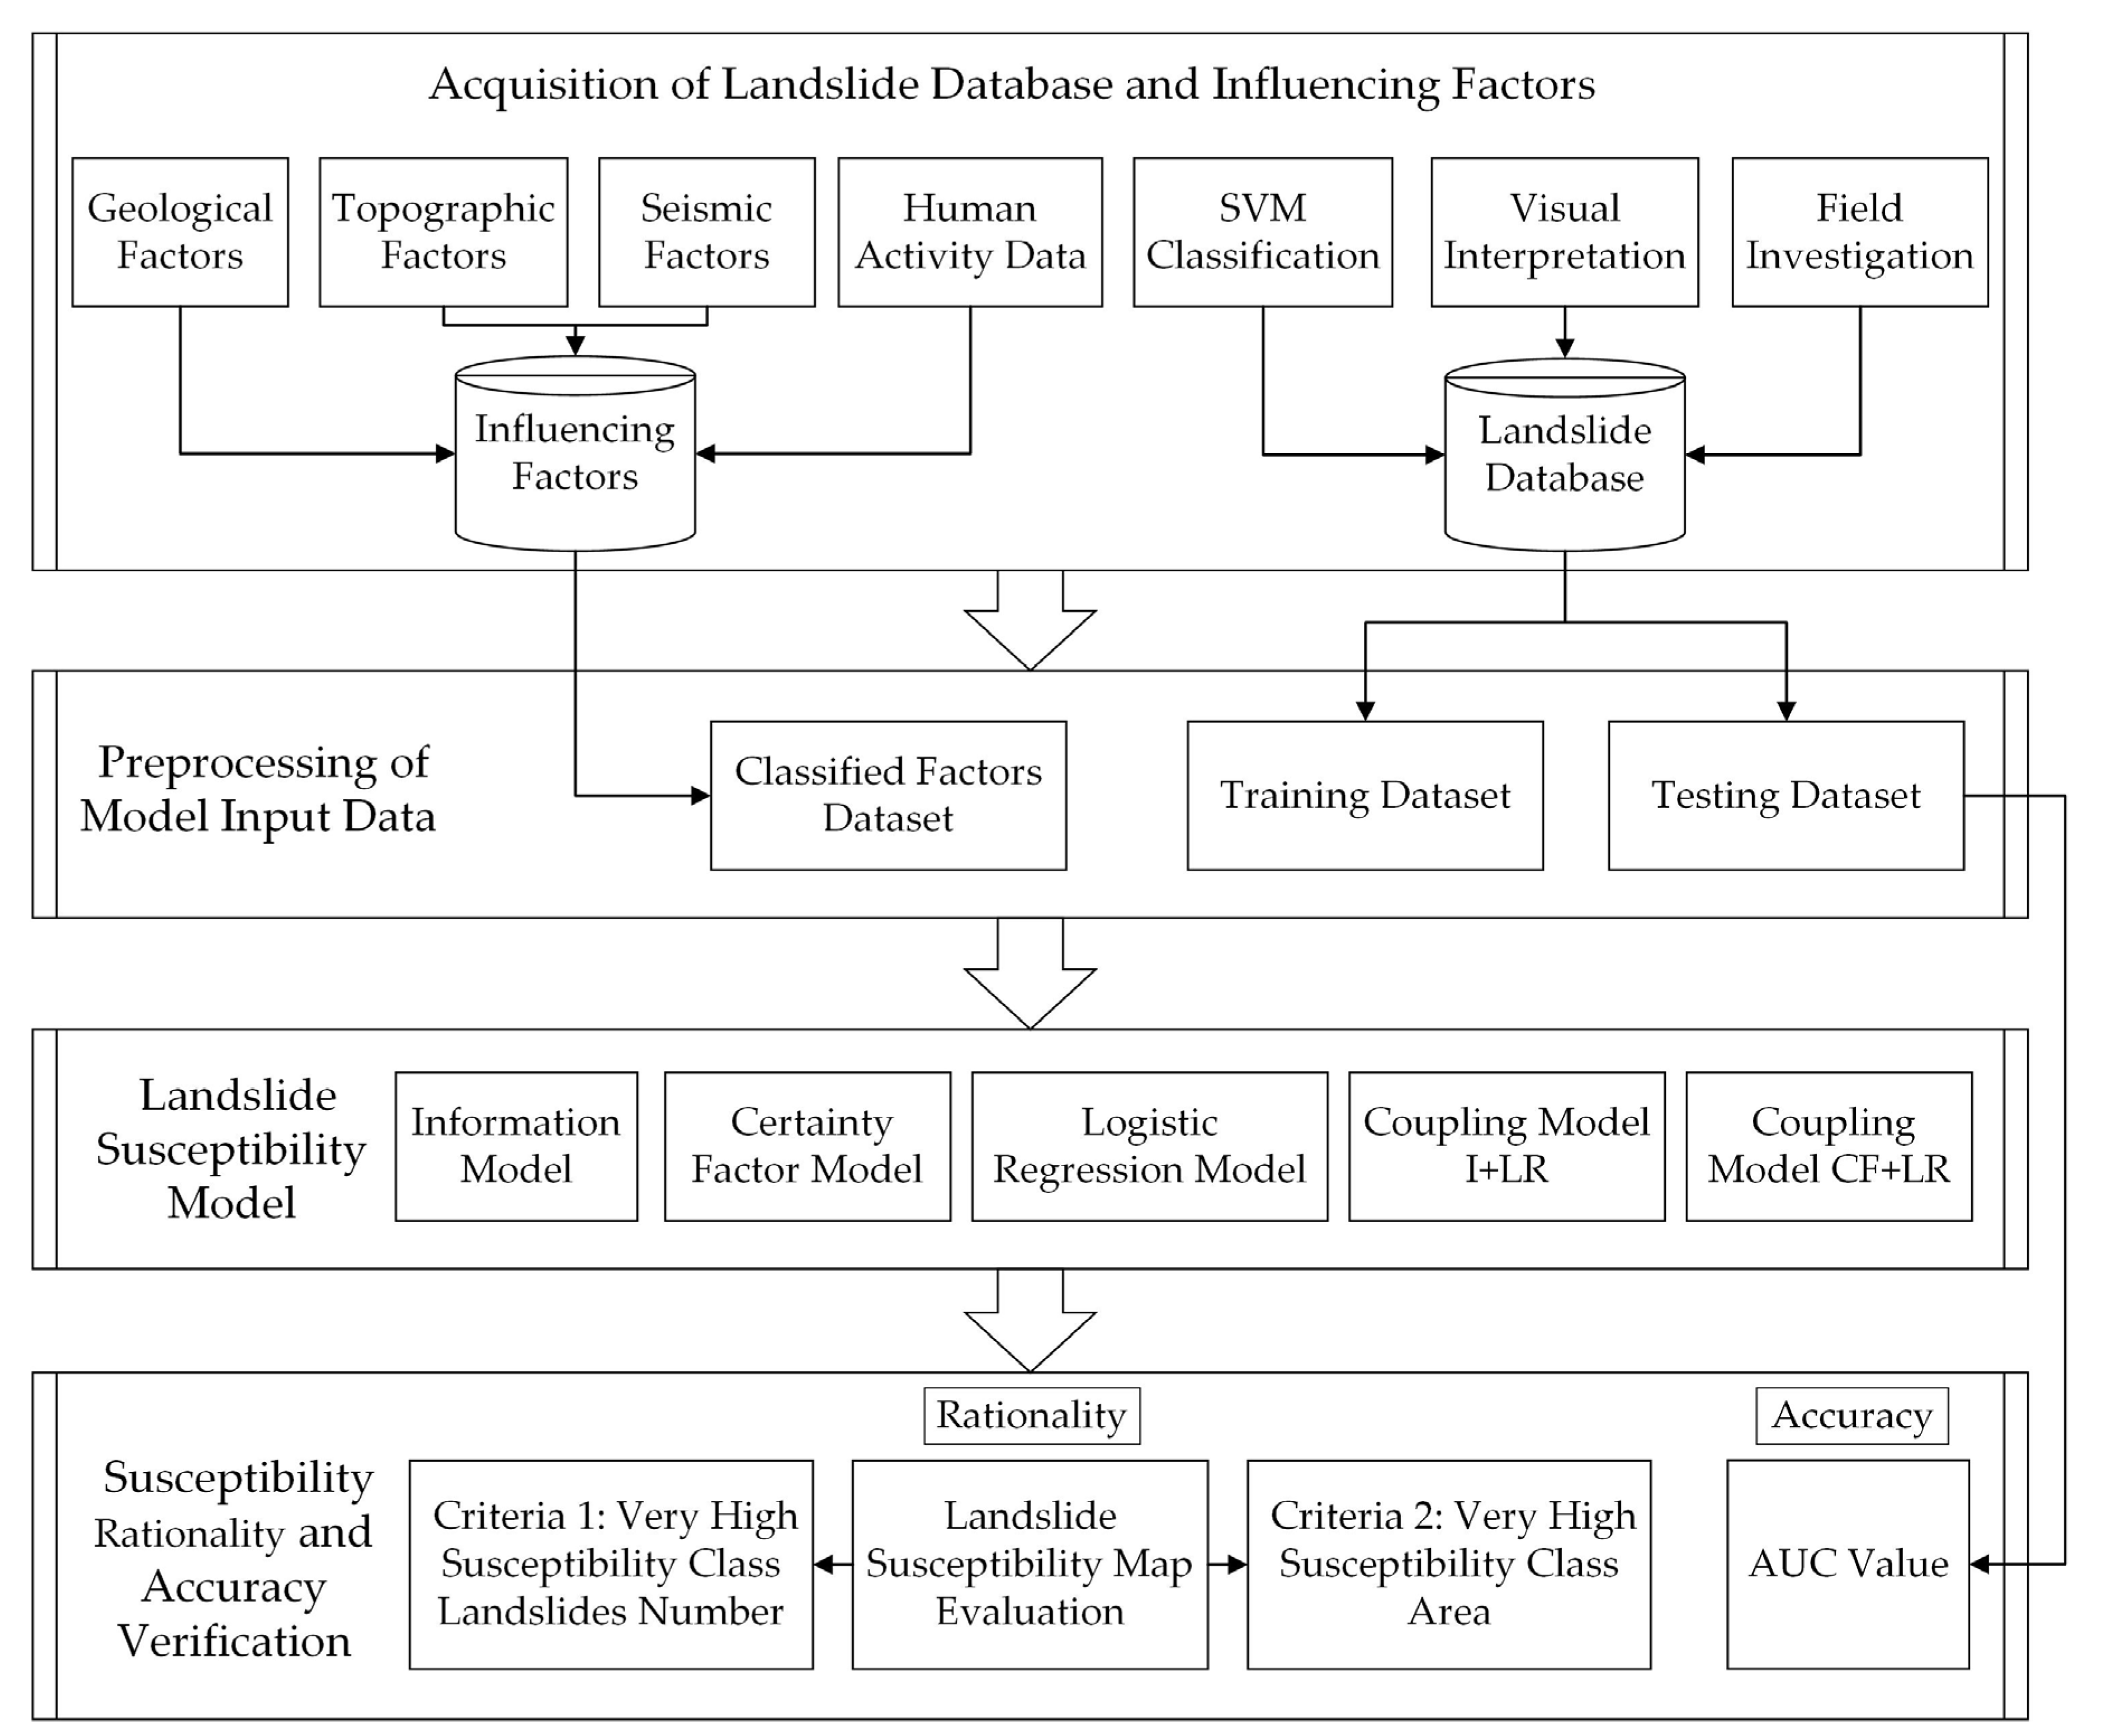
3. Material and Method

The steps of landslide susceptibility calculation are listed as follows (Figure 2): (1) Establish the landslide databases and select the influencing factors of landslide susceptibility; (2) establish the training dataset and testing dataset of landslide susceptibility model, and preprocess the factors influencing landslides; (3) calculate the landslide susceptibility by the selected landslide susceptibility model; and (4) assess the landslide susceptibility model by the AUC value and distribution criteria. The rationality of the landslides susceptibility distribution of each model is analyzed, and the accuracy of the model is verified by receiver operating characteristic curves (ROC).

3.1. Acquisition of Landslide Database and Influencing Factors

For the Jiuzhaigou earthquake landslide database, we used the database established by Guo et al. (Figure 3) [32]. They integrated space-air-ground monitoring technology to extract landslides (Figure 4). Firstly, support vector machine (SVM) classification was used to preliminarily identify the bare land (exposed ground without plants, snow, or water) within 2055 km2 of the Jiuzhaigou area by Sentinel-2 (10 m) and Unmanned Aerial Vehicle (UAV) remote sensing images (1 m and 0.16 m). Then, visual interpretation was used to verify that the bare land represented the landslide results or not, and eliminate false detection areas. For key areas or uncertain areas, field investigations were carried out to verify the results. A total of 4456 landslides in September 2017 were extracted. The total area of the landslides was 13.7 km2 [32].
For the Minxian earthquake landslide database, we used the open landslide database established by Xu et al. [44] and published on the USGS website (https://www.sciencebase.gov, accessed on 8 May 2021) (Figure 5). They identified landslides from the visual interpretation of remote sensing images and by selected field verification. The pre-earthquake remote sensing images include “Systeme Probatoire d’Observation de la Terre” (SPOT)-4, SPOT-5, Thailand earth observation satellite (THEOS), and Google Earth images. The post-earthquake images were the Pleiades images (0.5 m and 2 m) on 23 July 2014. The Minxian landslide database covers the whole landslide area of Minxian County. The total number of landslides was 2330. The total area of the landslides was 0.76 km2.
For the influencing factors, seismic factors, topographic factors, geological factors, and human activity data were selected for landslide susceptibility calculations in previous studies (Figure 6 and Figure 7) [14,35,45,46,47]. They included peak ground acceleration (PGA), slope, aspect, elevation, strata, distance from fault, river, and road. Among them, terrain data such as slope, aspect, and elevation were obtained by ALOS DEM (12.5 m). The existing tools of ArcGIS were used to extract topographic parameters. Spatial Analyst Tools-Surface-Slope tool was used for slope extraction. Spatial Analyst Tools-Surface-Aspect tool was used for aspect extraction. Strata and fault data were from the 1:200,000 geological map (http://dcc.ngac.org.cn/geologicalData, accessed on 8 May 2021). Seismic data such as PGA were provided by the USGS website (http://earthquake.usgshakemap.gov, accessed on 8 May 2021). The data on human activities such as roads and rivers came from the national data of roads and rivers (http://www.gscloud.cn/sources, accessed on 8 May 2021).

3.2. Preprocessing of Model Input Data

For Jiuzhaigou landslide susceptibility calculation, 3000 landslide training samples and 1000 landslide testing samples were randomly selected from the 4456 landslide points as positive samples of the model. In the non-landslide area, 4456 non-sliding points were randomly selected from outside the landslide area. A total of 3000 training samples and 1000 testing samples were randomly selected from the 4456 non-sliding points as negative samples of the model. Finally, we obtained the training dataset containing 6000 training samples and the testing dataset containing 2000 testing samples.
For Minxian landslide susceptibility calculation, 1650 landslide training samples and 550 landslide testing samples were randomly selected from the Minxian earthquake landslides database. A total of 2330 non-sliding samples were randomly selected in non-landslide areas, and 1650 training samples and 550 testing samples were randomly selected from non-sliding samples. Finally, we obtained the training dataset containing 3300 training samples and the testing dataset containing 1100 testing samples.
For influencing factors, all samples were converted into raster form with a grid cell size of 12.5 m × 12.5 m, which was used to calculate the area and extract the attribute values of sample points by ArcGIS tools in the next step. Then, this study classified the selected factors (Figure 6 and Figure 7). For example, the aspect was divided into nine categories: flat, east, southeast, north, northeast, west, northwest, south, and southeast (Figure 6b and Figure 7b). Finally, we calculated the area and the landslide area density of each category. The specific formula is as follows [34]:
P = N i j A i j
where P is the landslide area density; i is the factor (slope, aspect, elevation, PGA, fault, strata, river, and road); j is a subset of i ; N i j is the landslide area of the category “ j ” in the factor “ i ”; A i j is the area of the category “ j ” in the factor “ i ”.

3.3. Landslide Susceptibility Model

The influencing factors of the training dataset and the testing dataset, which were classified and calculated in Section 3.2, will be used in the following susceptibility model.

3.3.1. Information Model (I)

In the information model, the landslide probability is represented by the decrease of entropy in the landslide prediction process. The average reduction of uncertainty caused by the combination of the factors is equal to the entropy change of the landslide system. The information model considers that the landslide probability is related to the quantity and quality of information obtained in the process of prediction, which is measured by the information value. The greater the information value, the greater the landslide possibility [48]. The specific formula is as follows [49]:
I ( X j , H ) = l o g N j N S j S
where I ( X j ,     H ) is the information value of the category “ j ” in the factor “ X ” contributed to the landslide event H ; N j is the landslide area in the category “ j ”; N is the total area of landslides in the whole study area; S j is the area of the category “ j ”; S is the total area of the whole study area. The larger the information value, the more likely a landslide is to occur. Conversely, the smaller the information value, the less likely a landslide is to occur.

3.3.2. Certainty Factor Model (CF)

The CF model is a probability function. It was first proposed by Shortliffe and Buchanan [50] to analyze the susceptibility of various factors affecting the occurrence of an event. Lan et al. applied the CF method to evaluate the landslide susceptibility [19]. The formula is listed as follows:
C F = { P j P s P s ( 1 P j ) , P j < P s P j P s P j ( 1 P s ) , P j P s
where P j is the conditional probability of landslide occurrence in category “ j ”; P s is the prior probability of landslide occurrence in the whole study area; P j is the landslide area density of the category “ j ”; P s is the landslide area density of the total landslide. The range of C F is [−1, 1]. When C F > 0, the larger C F is, the more likely the slope will slide; when C F < 0, the smaller C F is, the less likely the slope will slide; when C F   = 0, it indicates that the probability of the slope sliding may not be determined.

3.3.3. Logistic Regression Model (LR)

The LR model predicts the probability of events by establishing a regression relationship between a dependent variable and multiple independent variables. It does not need to meet the assumption that the error distribution tends to be the normal distribution, nor does it need to meet the condition that the independent variables conform to the normal distribution. It can be used to predict the probability of dependent variables with binomial characteristics. So, it is more suitable for the landslide susceptibility assessment [34,51]. In analysis, the dependent variable Y is a binary variable that represents whether there is a landslide. The value “1” and value “0” of Y indicate the occurrence and non-occurrence of a landslide, respectively. Z is the intermediate parameter, varying from −∞ to +∞. There are n independent variables ( x 1 , x 2 ,   x 3 ,…, x n ) in an LR model. Influenced by n factors, the conditional probability of a landslide is P   =   P   ( Y = 1 | x 1 ,   x 2 ,   x 3 ,…, x n ). Then the model can be expressed as [52,53]:
Z = a 0 + a 1 x 1 + a 2 x 2 + a n x n
P = e x p ( z ) 1 + e x p ( z )
where Z is the linear combination; x i ( i = 1, 2, 3,…, n) is an independent factor; a 0 is the regression constant; a i is the coefficient that measures the contribution of independent factor x i ( i   = 1, 2, 3,…, n); P is the prediction value of landslide probability.

3.3.4. Coupling Model I + LR

In the I + LR coupling model, the I values calculated by the formula (2) substitute for the x i of formula (4). The data of the training dataset are imported into SPSS 25 software to calculate the constant and regression coefficients of the logistic regression. The constant and regression coefficients are substituted into formula (5), and then P is obtained.

3.3.5. Coupling Model CF + LR

In the CF + LR coupling model, the CF values calculated by the formula (3) substitute for x i of the formula (4). The data of the training dataset are imported into SPSS 25 software to calculate the constant and regression coefficient of the logistic regression. The constant and regression coefficients are substituted into formula (5), and then P is obtained.

3.4. Rationality and Accuracy Verification of Susceptibility Results

In this study, the Raster Calculator tool of ArcGIS was used to obtain the landslide susceptibility distribution map. Then the landslide susceptibility of the Jiuzhaigou earthquake and Minxian earthquake were both divided into five susceptibility classes using Jenks natural breaks optimization: very low, low, moderate, high, and very high. The Jenks natural breaks optimization follows the law of data, which can make the classification more objective. Many studies have shown that this classification method is more reasonable [17,34].
In each susceptibility class, the percentage of landslides number, the percentage of the susceptibility classification area, and the landslide number density (LND) were counted and calculated. We analyzed the rationality of the landslide susceptibility distribution by two criteria in each model. For the susceptibility distribution map, we evaluated the result of the susceptibility distribution map by: (1) Landslides should locate in the areas with high susceptibility as much as possible; (2) The areas with very high susceptibility in the distribution map should be as small as possible [54].
Additionally, this study quantitatively evaluated the accuracy of the landslide susceptibility model by the ROC curve. The ROC curve is regarded as an effective method to evaluate the prediction ability of models [55]. The abscissa of the curve is the specificity or the false positive rate (FPR), which is the probability that the non-landslide is judged as a landslide by the model; the ordinate is the sensitivity or the true positive rate (TPR), which is the probability that the landslide is judged as a landslide. The area under curve (AUC) is a quantitative index of the ROC curve to evaluate the model. The AUC value ranges from 0.5 to 1. The closer the AUC value is to 1, the better the prediction effect of the model is. If AUC = 0.5, the prediction result of the model is random; if AUC is at 0.5–0.7, the accuracy of the model is low; if AUC is at 0.7–0.9, the accuracy of the model is high; if AUC > 0.9, the accuracy of the model is very high [56]. In this study, the data of the testing dataset and model prediction results were input into SPSS 25 software, and the ROC curves and AUC values of each model were output.

4. Results

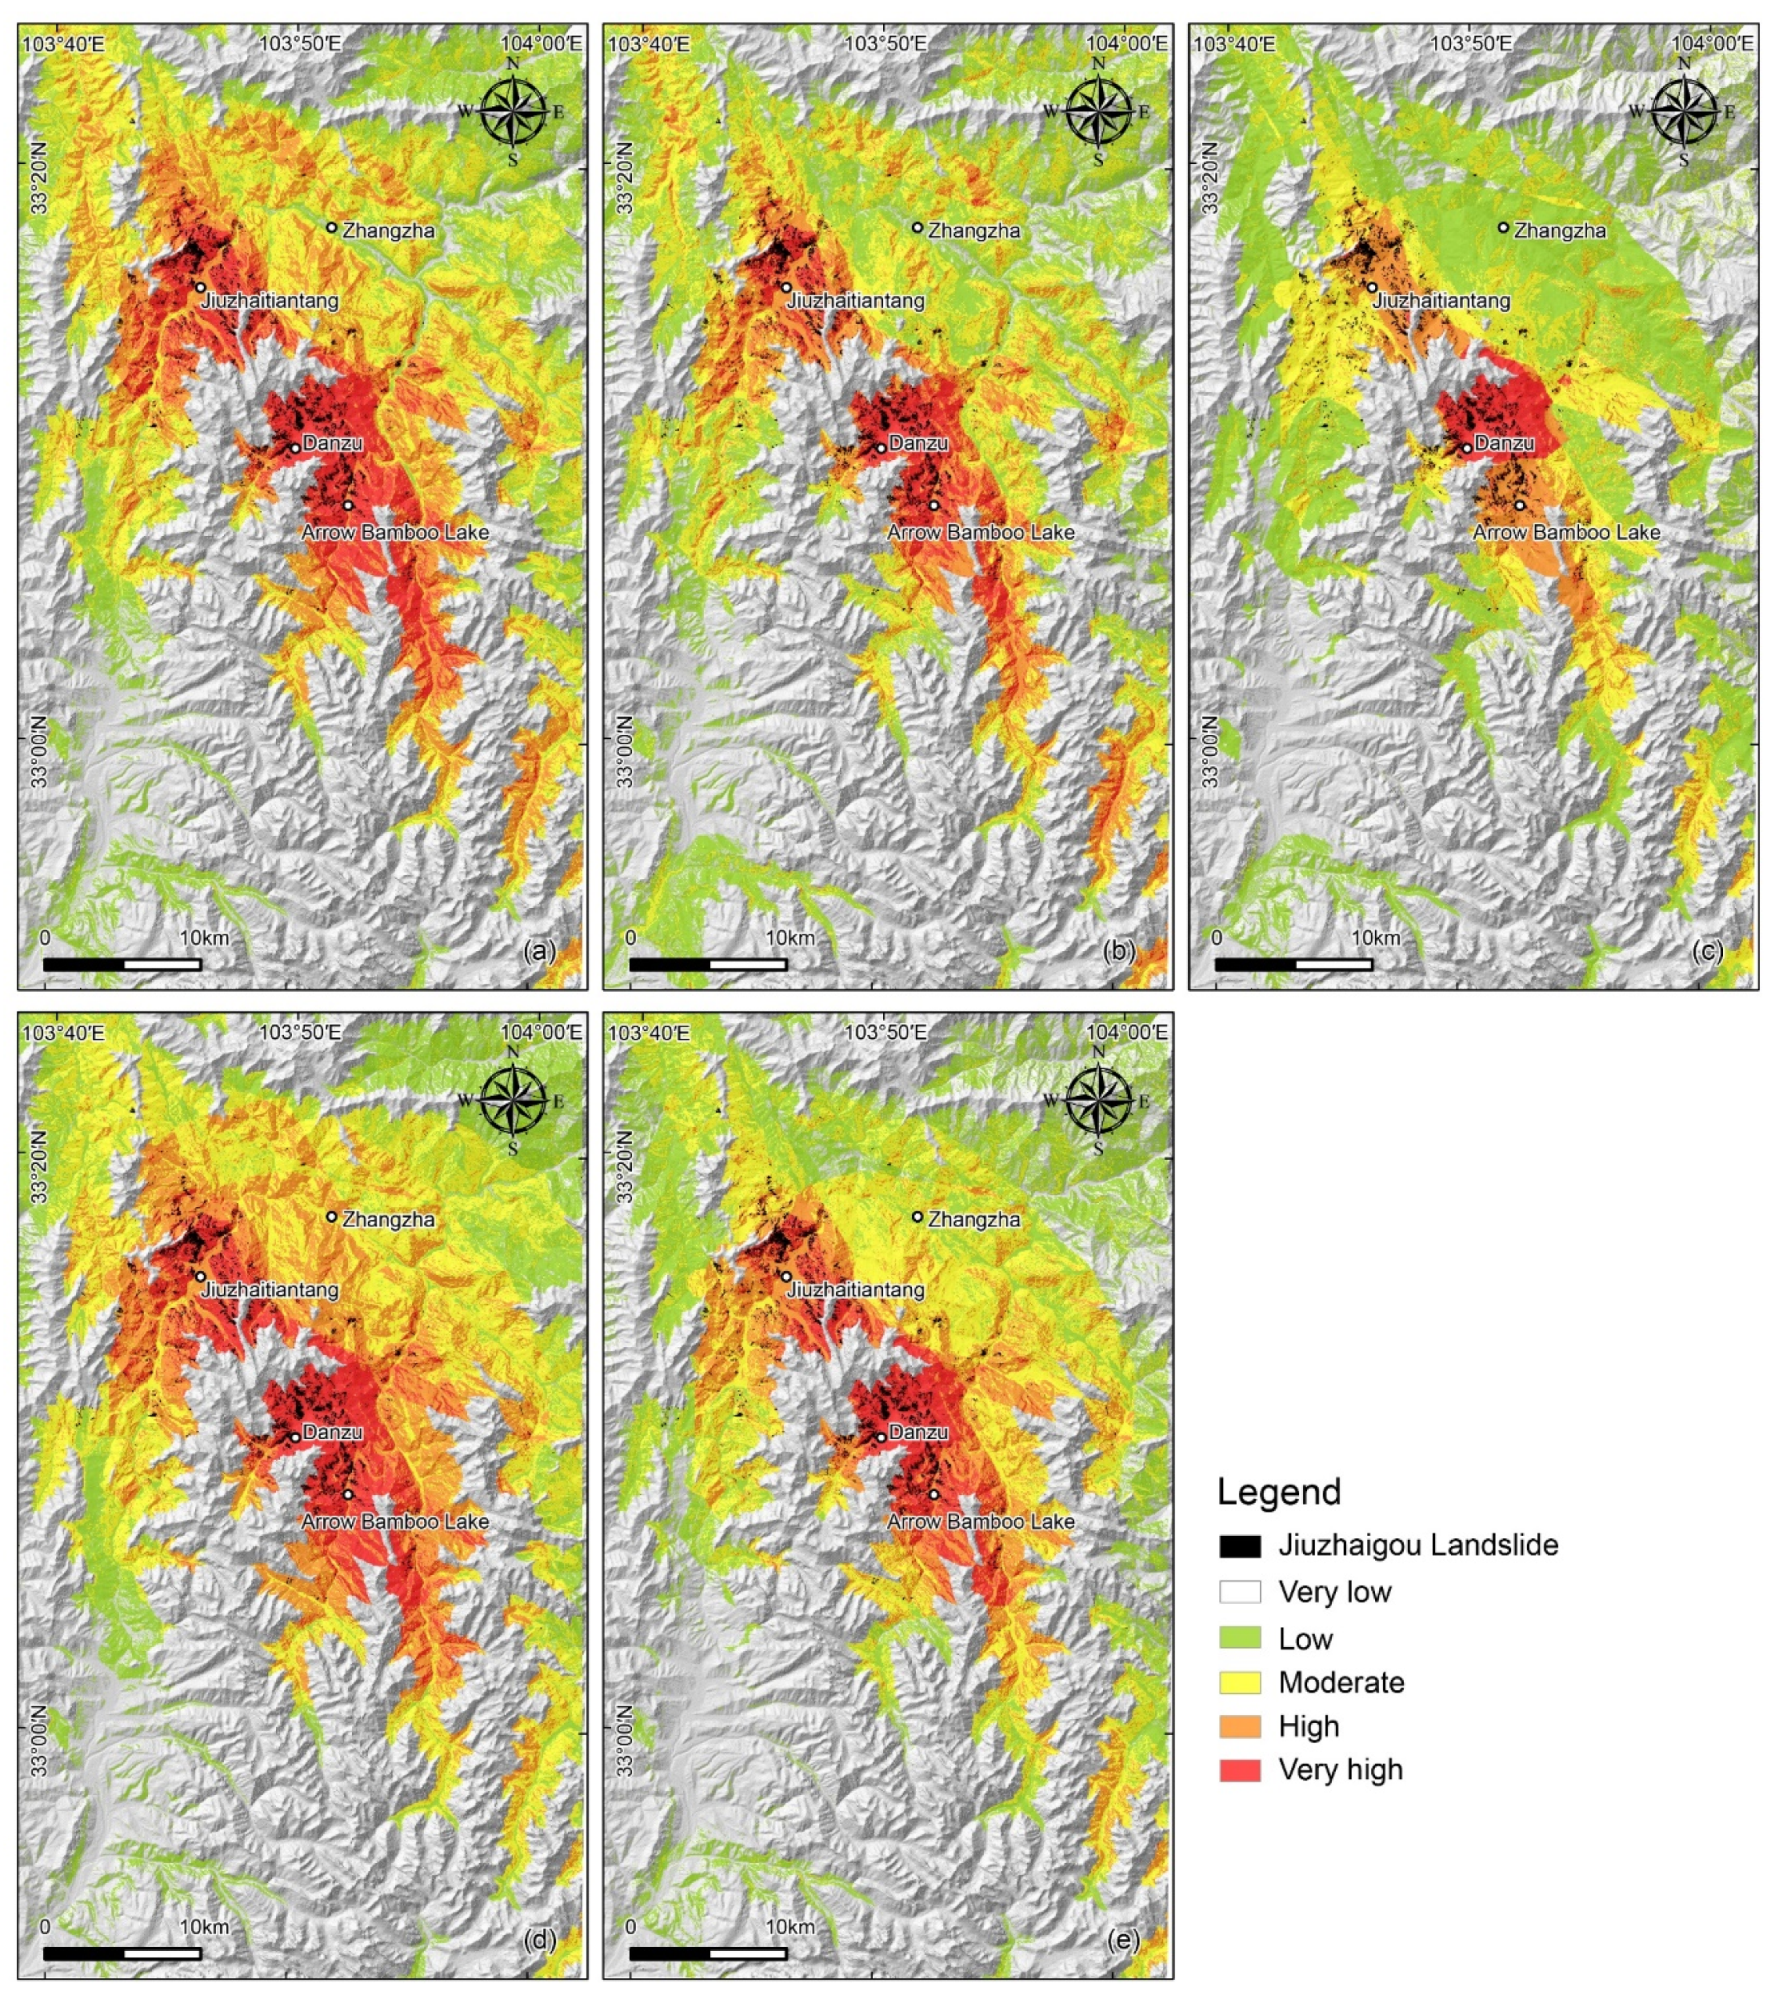
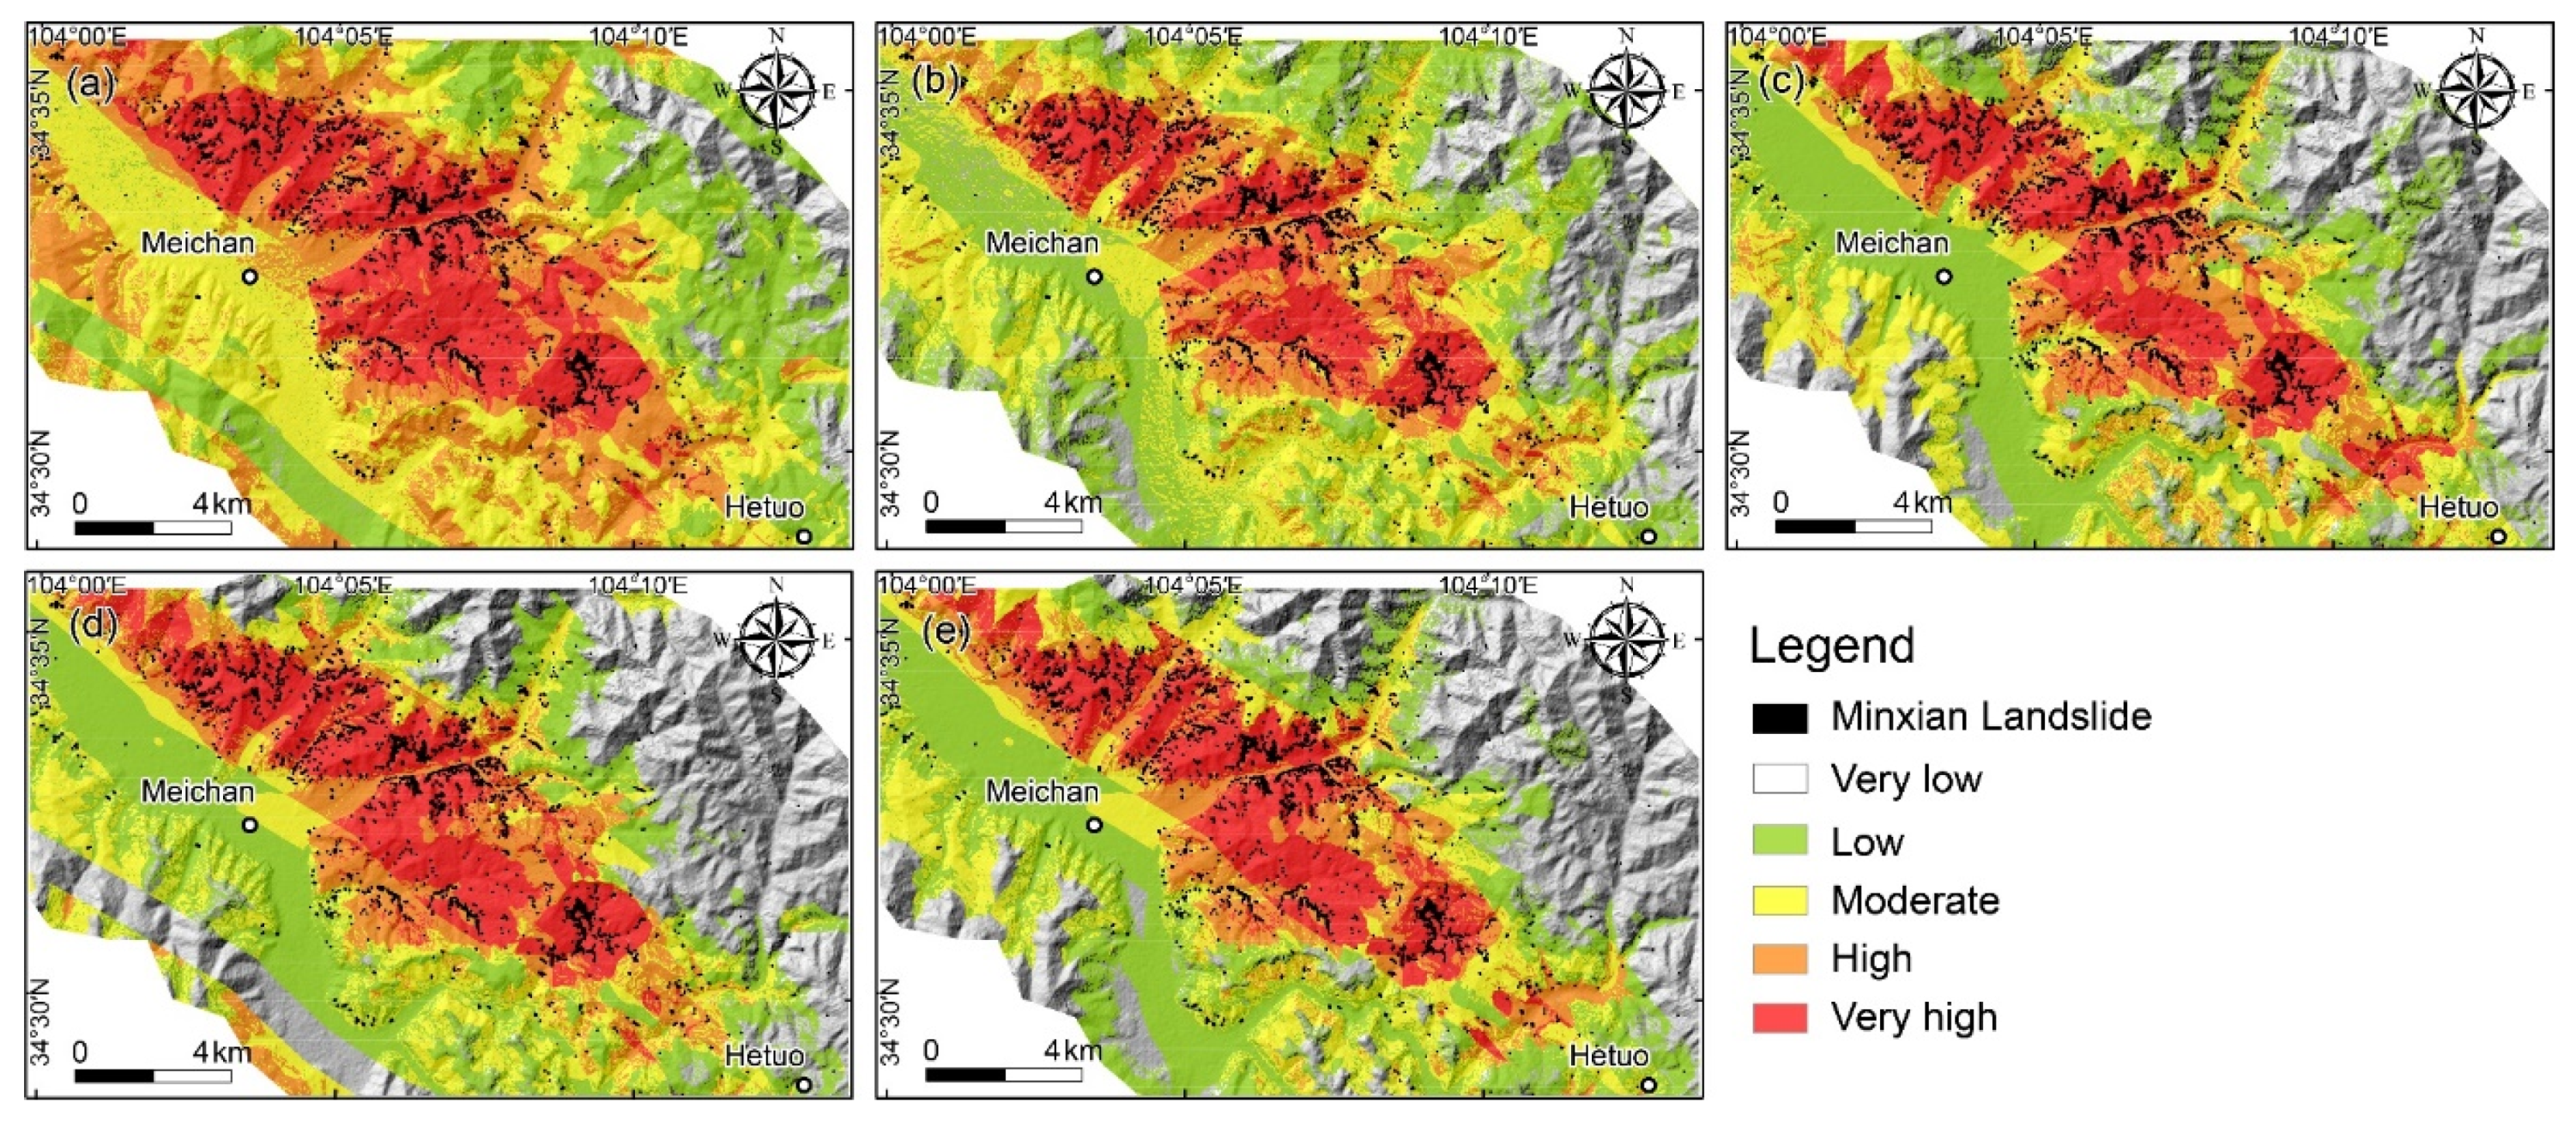
4.1. Distribution Maps of Landslide Susceptibility

The landslide susceptibility maps of Jiuzhaigou (I, CF, LR, I + LR, and CF + LR) show the following (Figure 8): (1) Except for the LR model, the percentages of landslide points in the very high susceptibility area were the largest, which were 74.02%, 56.01%, 73.27%, and 57.28%, respectively. Except for the LR model, the percentage of landslide points decrease with the decrease of susceptibility, which was consistent with the evaluation criteria in each model. (2) The area proportions of the very high susceptibility class in each model were small, but the area proportions of moderate, low, and very low susceptibility classes were large, which also met the evaluation criteria. (3) The LNDs of the very high susceptibility area were the largest, which were 21.94/km2, 26.47/km2, 26.64/km2, 22.73/km2, and 27.26/km2. The LNDs of the coupling model were increased compared to their single models and the LR model. The LND decreased with the decrease of susceptibility in each model, which was consistent with the universal cognition (Table 3).
The landslide susceptibility maps of Minxian (I, CF, LR, I + LR, and CF + LR) show the following (Figure 9): (1) The percentages of landslide points in the very high susceptibility area were the largest, which were 64.72%, 45.41%, 53.52%, 60.73%, and 58.97%, respectively. The percentage of landslide points decreased with the decrease of susceptibility, which was consistent with the evaluation criteria in each model. (2) The area proportions of the very high susceptibility class in each model were small, but the area proportions of moderate, low, and very low susceptibility classes were large, which also met the evaluation criteria. (3) The LND in the very high susceptibility area were the largest, which were 32.96/km2, 36.48/km2, 36.31/km2, 37.56/km2, and 39.35/km2. The LND of the coupling model was increased, compared to their single models and the LR model. The LND decreased with the decrease of susceptibility in each model, which was consistent with the universal cognition (Table 4).

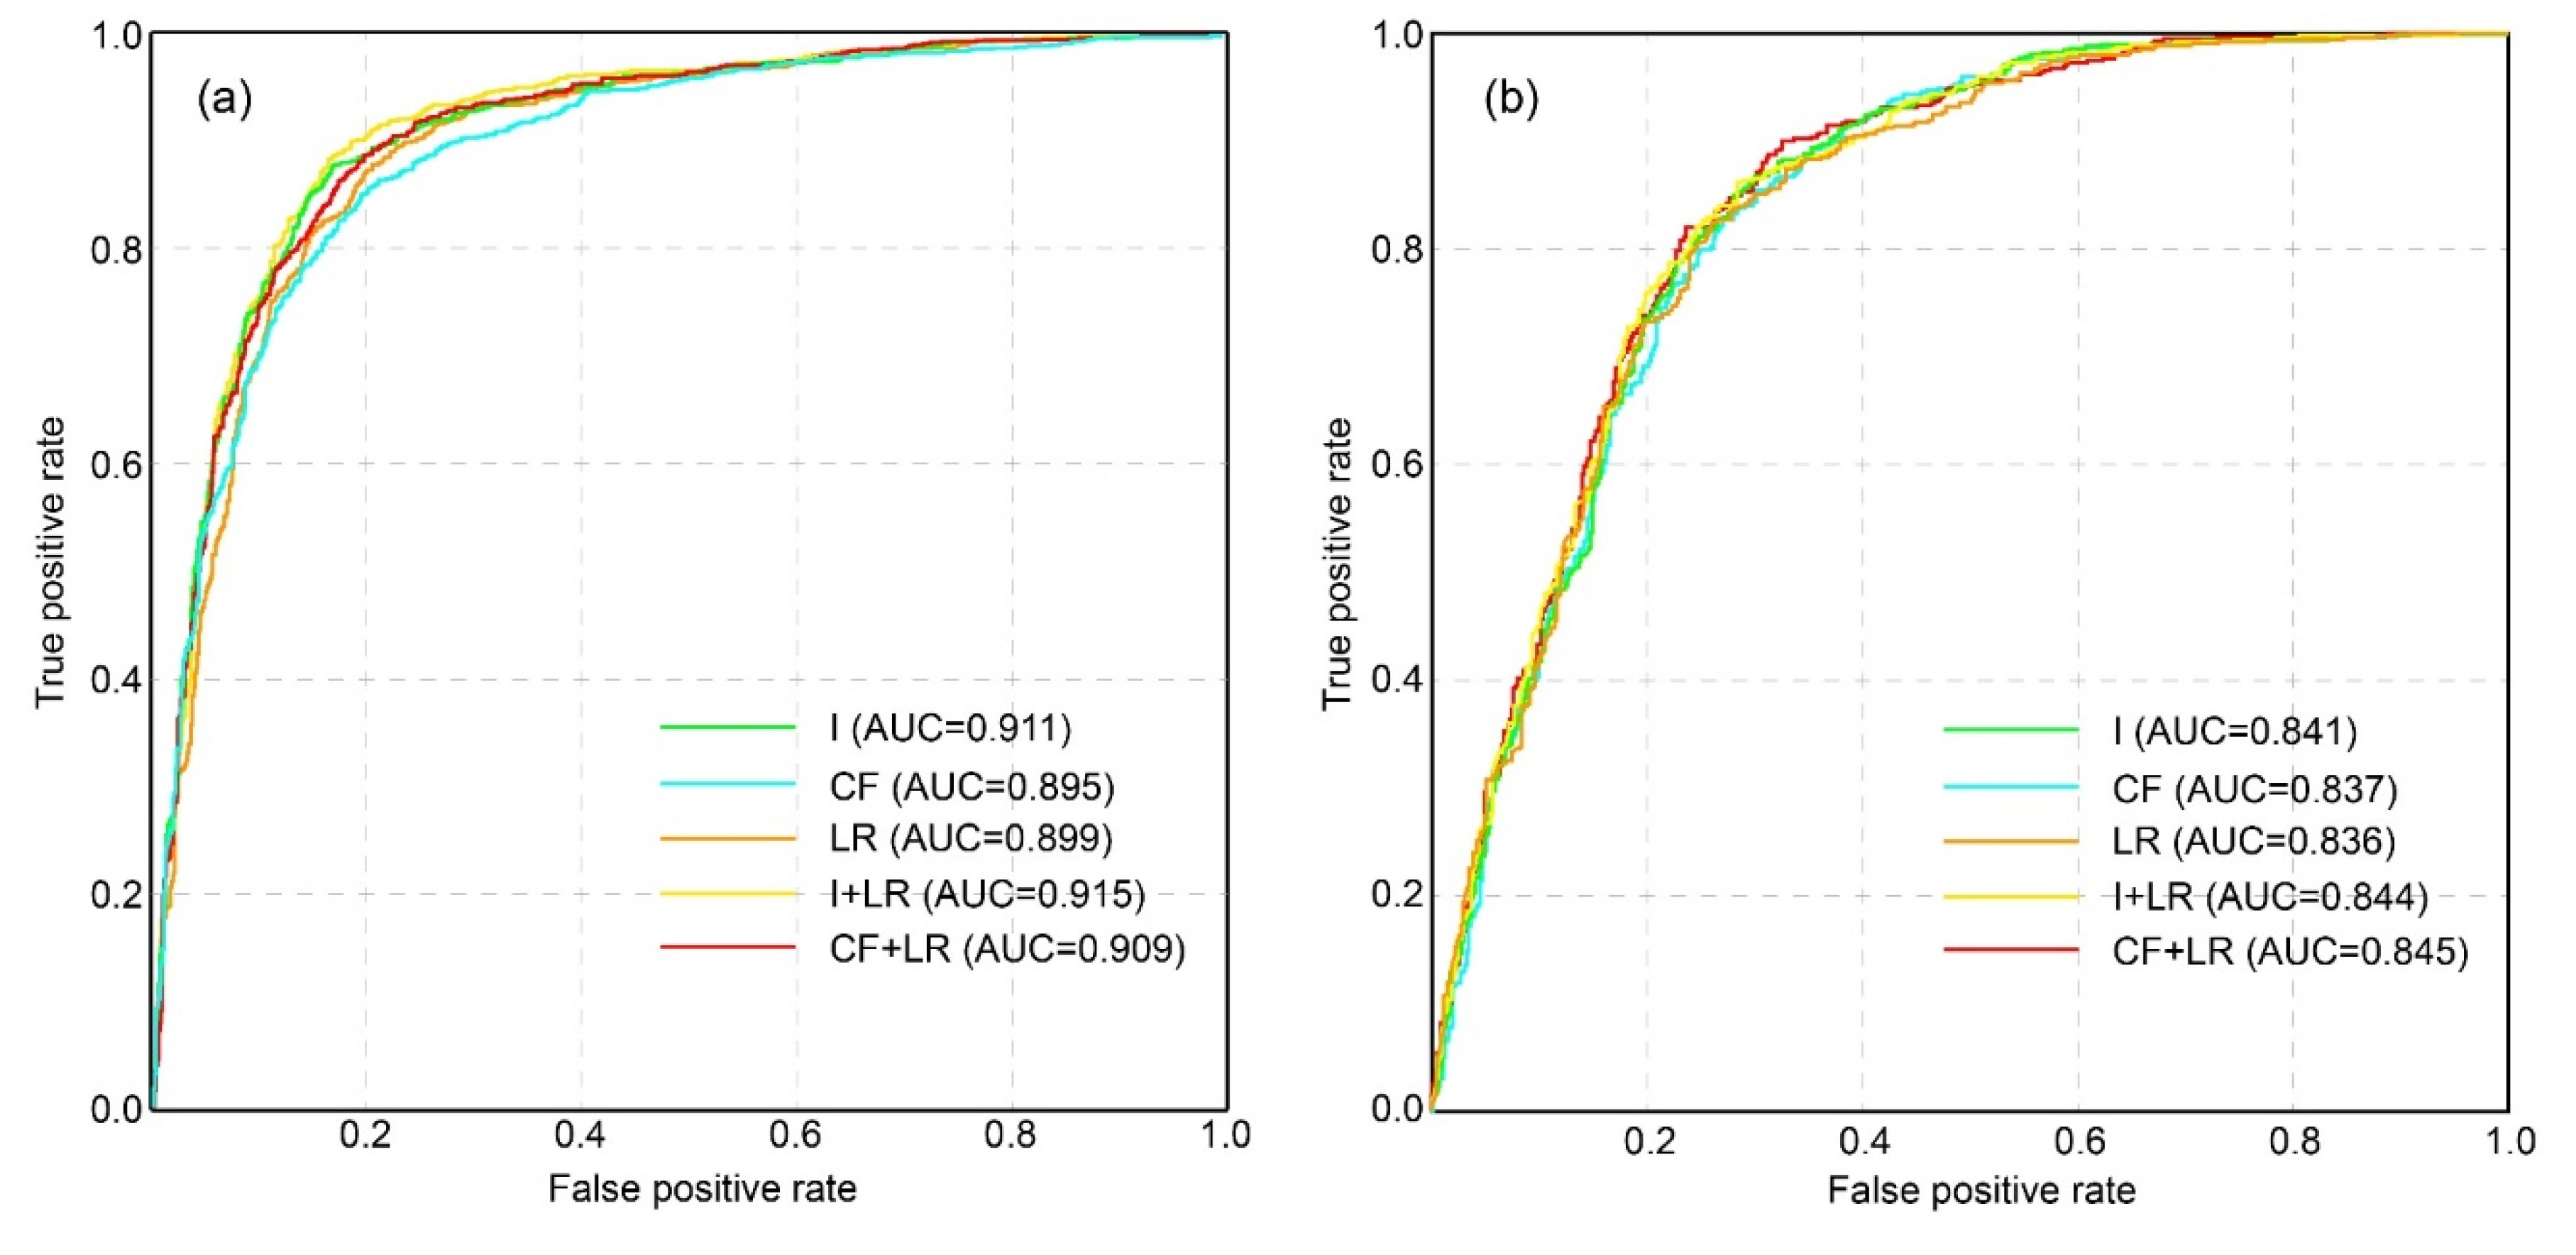
4.2. Accuracy of Landslide Susceptibility Models

For the ROC curves of the Jiuzhaigou earthquake landslide (Figure 10), the AUC values of I, CF, LR, I + LR, and CF + LR models were 0.911, 0.895, 0.899, 0.915, and 0.909, respectively. The prediction accuracy of the I, I + LR, and CF + LR models were higher. For the ROC curves of the Minxian earthquake landslide, the AUC values of I, CF, LR, I + LR, and CF + LR models were 0.841, 0.837, 0.836, 0.844, and 0.845, respectively. The prediction accuracy of the I, I + LR, and CF + LR models were also higher. In single models, the prediction accuracy of the I model was the highest. In the accuracy improvement, the prediction accuracy of the coupling model was generally higher than that of the single models. Overall, the comprehensive effect of the I + LR model was the best.

5. Discussion

The fault, slope, and lithologic characteristics play important roles in the spatial distribution and susceptibility of landslides. The Jiuzhaigou landslides were mainly distributed in areas of limestone and dolomite. Most landslides were concentrated within 2 km from the fault (NW) (Figure 6e) [8,14,32]. The landslides were mainly distributed on the slopes of 30°−55°. The Minxian landslides were concentrated in an elongated region, with a 5 km width, parallel with the fault strike (NWW) (Figure 7e). The underlying sedimentary rocks were mainly conglomerate and sandstone. Most of the landslides were distributed on the slopes of 5°−25°.
For landslide susceptibility calculation, the previous studies suggest that I and CF models do not consider the differences of influencing factors on landslide susceptibility. It is unreasonable to add each influence factor layer with the same weight. The LR model can not solve the quantitative problem of each influencing factor, which is sometimes called the multi-source data combination problem. The quality of data quantitative results is directly related to the reliability of the results. So, it is difficult to objectively and quantitatively calculate landslide susceptibility with the I, CF, and LR models [28,57].
For evaluation of the model, the AUC value is used to evaluate the accuracy of the landslide susceptibility model. However, it is unable to evaluate whether the susceptibility distribution is reasonable. The model must be evaluated not only from the accuracy but also from the rationality of the susceptibility distribution. The evaluation criteria proposed by Tolga are consistent with universal cognition. So, the model should be evaluated from the AUC value and the distribution criteria.
For the I + LR and CF + LR models, the I model and CF model quantify the influence of each factor grade on landslides into a unified I value or CF value. They not only can contribute to the combination of subsequent influencing factors but also can specifically represent the susceptibility of landslides relative to the whole study area in the classification of each factor. Then, the I or CF values of influencing factors in the training dataset are put into the LR model to obtain the regression coefficients, which are the weights of the influencing factors. They consider the differences of influencing factors on landslide susceptibility.
The coupling models are affected by the single models that make them up. However, the coupling models are generally better than their single models. In the calculation process of the coupling models, the I and CF values of each factor grade are imported into the LR model rather than their original data. For example, the values of the slope or the distance to the fault are replaced by their I or CF values. The calculation formula for I and CF is simple and easy to implement, which makes the implementation of the coupling model very simple.
The coupling model in this study reasonably integrates the advantages of different models, solves the problems of quantification and weight (combination) of multi-source influencing factors for landslide susceptibility, and reasonably describes the complex nonlinear relationship between natural phenomena. Overall, the coupling models not only have higher accuracy than their single models, but fit the rules proposed by Tolga for landslide susceptibility evaluation. They can objectively and accurately evaluate the susceptibility of earthquakes and landslides in rock and loess areas.

6. Conclusions

In this study, the rock landslide and loess landslide related to the 2017 Jiuzhaigou earthquake and the 2013 Minxian earthquake, which have different lithologies, respectively, were chosen as the study targets. Eight influencing factors, including PGA, slope, aspect, elevation, stratum, distance from the fault, river, and road, were employed to calculate landslide susceptibility by the I, CF, LR, I + LR, and CF + LR models. The models were evaluated by the AUC value and the distribution criteria to choose the best one. The main results and conclusions obtained from this research were as follows:
(1)
The Jiuzhaigou landslides were mainly distributed in areas of limestone and dolomite. The Minxian landslides were mainly distributed in the area where the underlying bedrocks are conglomerate and sandstone.
(2)
The influencing factors adopted to calculate the susceptibility of rock landslides or loess landslides were reasonable, and the high AUC value suggested that they are suitable for the universal model.
(3)
For the distribution of susceptibility, most models fit the rules proposed by Tolga [56], except for the LR model. The landslide susceptibility distribution map calculated from the coupling models was more reasonable than that derived from their single models.
(4)
For prediction accuracy, the coupling models were generally more accurate than their single models. The prediction accuracy of the I + LR model was high in both rock and loess areas, which have high or moderate ground motion parameters.
In general, the comprehensive effect of the I + LR model was the best one. The coupling models had excellent prediction capability and strong robustness, and not only showed higher accuracy but also fit the rules proposed by Tolga for landslide susceptibility. They could objectively, accurately, and quickly calculate susceptibility to earthquake landslides in both rock and loess areas.

Author Contributions

Conceptualization, X.G. and B.F.; methodology, X.G., Q.C. and W.Z.; writing—original draft preparation, X.G.; writing review and editing, B.F., J.D. and P.S. All authors have read and agreed to the published version of the manuscript.

Funding

This work was supported by the Second Tibetan Plateau Scientific Expedition and Research Program (STEP 2019QZKK0901) and Integrated Space-Air-Ground of Jiuzhai Valley World Natural Heritage Site (Grant No. E0H20501).

Data Availability Statement

Data sharing not applicable.

Acknowledgments

The authors are grateful for the helpful discussion on software use and experimental procedures with Weiheng Zhang of the Institute of Geology, China Earthquake Administration. We would like to thank the editor and reviewers for their valuable input and their helpful comments and suggestions to significantly improve the quality of this manuscript.

Conflicts of Interest

The authors declare no conflict of interest. The funders had no role in the design of the study; in the collection, analyses, or interpretation of data; in the writing of the manuscript; or in the decision to publish the results.

References

  1. Liu, G.R.; Yan, E.C.; Lian, C. Discussion on Classification of Landslides. J. Eng. Geol. 2002, 10, 339–342, (In Chinese with English abstract). [Google Scholar]
  2. Xu, Y.R.; Liuzeng, J.; Allen, M.B.; Zhang, W.H.; Du, P. Landslides of the 1920 Haiyuan earthquake, northern China. Landslides 2020, 18, 935–953. [Google Scholar] [CrossRef]
  3. Hong, Q. South segment of Minjiang fault and Diexi earthquake in 1933. Earthq. Res. China 2000, 15, 333–338. [Google Scholar]
  4. Yin, Y.P.; Wang, F.W.; Sun, P. Landslide hazards triggered by the 2008 Wenchuan earthquake, Sichuan, China. Landslides 2009, 6, 139–152. [Google Scholar] [CrossRef]
  5. Chen, X.L.; Yu, L.; Wang, M.M.; Li, J.Y. Brief communication: Landslides triggered by the Ms 7.0 Lushan earthquake. Chin. Nat. Hazards Earth Syst. Sci. 2013, 1, 3891–3918. [Google Scholar] [CrossRef]
  6. Zheng, W.J.; Min, W.; He, W.G.; Ren, Z.K.; Liu, X.W.; Wang, A.G.; Xu, C.; Li, F. Distribution of the Related Disaster and the Causative Tectonic of the Minxian-Zhangxian Ms 6.6 Earthquake on July 22, 2013, Gansu, China. Seismol. Geol. 2013, 35, 604–615. [Google Scholar] [CrossRef]
  7. Chen, X.L.; Liu, C.G.; Wang, M.M.; Zhou, Q. Causes of unusual distribution of coseismic landslides triggered by the Mw 6.1 2014 Ludian, Yunnan, China earthquake. J. Asian Earth Sci. 2018, 159, 17–23. [Google Scholar] [CrossRef]
  8. Fan, X.M.; Scaringi, G.; Xu, Q.; Zhang, W.W.; Dai, L.X.; Li, Y.S.; Pei, X.J.; Yang, Q.; Huang, R.Q. Coseismic Landslides Triggered by the 8th August 2017 MS 7.0 Jiuzhaigou Earthquake (Sichuan, China): Factors Controlling Their Spatial Distribution and Implications for the Seismogenic Blind Fault identification. Landslides 2018, 15, 967–983. [Google Scholar] [CrossRef]
  9. Guzzetti, E.; Carrara, A.; Cardinali, M.; Reichenbach, P. Landslide hazard evaluation: A review of current techniques and their application in a multi-scale study, Central Italy. Geomorphology 1999, 31, 181–216. [Google Scholar] [CrossRef]
  10. Cao, J.; Zhang, Z.; Wang, C.; Liu, J.; Zhang, L. Susceptibility assessment of landslides triggered by earthquakes in the Western Sichuan Plateau. Catena 2019, 175, 63–76. [Google Scholar] [CrossRef]
  11. Dai, F.C.; Lee, C.F.; Li, J.; Xu, Z.W. Assessment of landslide susceptibility on the natural terrain of Lantau Island, Hong Kong. Environ. Geol. 2001, 40, 381–391. [Google Scholar] [CrossRef]
  12. Shao, X.Y.; Ma, S.Y.; Xu, C.; Zhang, P.F.; Wen, B.Y.; Tian, Y.Y.; Zhou, Q.; Cui, Y. Planet image-based inventorying and machine learning-based susceptibility mapping for the landslides triggered by the 2018 Mw6.6 Tomakomai, Japan earthquake. Remote Sens. 2019, 11, 978. [Google Scholar] [CrossRef] [Green Version]
  13. Caccavale, M.; Matano, F.; Sacchi, M. An integrated approach to earthquake-induced landslide hazard zoning based on probabilistic seismic scenario for Phlegrean Islands (Ischia, Procida and Vivara), Italy. Geomorphology 2017, 295, 235–259. [Google Scholar] [CrossRef]
  14. Ma, S.Y.; Xu, C.; Tian, Y.Y.; Xu, X.W. Application of logistic regression model for hazard assessment of earthquake-triggered landslides: A case study of 2017 Jiuzhaigou (China) Ms7.0 event. Seismol. Geol. 2019, 41, 162–177. [Google Scholar] [CrossRef]
  15. Dreyfus, D.K.; Rathje, E.M.; Jibson, R.W. The influence of different simplified sliding-block models and input parameters on regional predictions of seismic landslides triggered by the Northridge earthquake. Eng. Geol. 2013, 163, 41–54. [Google Scholar] [CrossRef]
  16. Chen, G. Landslide Susceptibility Analysis in the Middle Reach of Bailong River Basin Based on Statistical Models and In-Situ Experiment. Ph.D. Thesis, Lanzhou University, Lanzhou, China, 9 December 2019. (In Chinese with English Abstract). [Google Scholar]
  17. Aditian, A.T.; Kubota, T.; Shinohara, Y. Comparison of GIS-based landslide susceptibility models using frequency ratio, logistic regression, and artificial neural network in a tertiary region of Ambon, Indonesia. Geomorphology 2018, 318, 101–111. [Google Scholar] [CrossRef]
  18. Yin, K.L.; Yan, T.Z. Statistical Prediction models for slope instability of metamorphosed rocks. In Proceedings of the 5th International Symposium on Landslides, Lausanne, Switzerland, 10–15 July 1988; Balkema: Rotterdam, The Netherlands, 1988; pp. 1269–1272. [Google Scholar]
  19. Lan, H.X.; Wu, F.Q.; Zhou, C.H.; Wang, S.J. Analysis on susceptibility of gis based landslide triggering factors in Yunnan Xiaojiang watershed. Chin. J. Rock Mech. Eng 2002, 21, 1500–1506, (In Chinese with English Abstract). [Google Scholar]
  20. Tien Bui, D.; Shahabi, H.; Shirzadi, A.; Chapi, K.; Alizadeh, M.; Chen, W.; Mohammadi, A.; Ahmad, B.; Panahi, M.; Hong, H. Landslide Detection and Susceptibility Mapping by AIRSAR Data Using Support Vector Machine and Index of Entropy Models in Cameron Highlands, Malaysia. Remote Sens. 2018, 10, 1527. [Google Scholar] [CrossRef] [Green Version]
  21. Ilia, I.; Tsangaratos, P. Applying weight of evidence method and sensitivity analysis to produce a landslide susceptibility map. Landslides 2016, 13, 379–397. [Google Scholar] [CrossRef]
  22. Ayalew, L.; Yamagishi, H. The application of GIS-based logistic regression for landslide susceptibility mapping in the Kakuda-Yahiko Mountains, Central Japan. Geomorphology 2005, 65, 15–31. [Google Scholar] [CrossRef]
  23. Xu, C.; Xu, X.W.; Dai, F.C.; Wu, Z.D.; He, H.L.; Shi, F.; Wu, X.Y.; Xu, S.N. Application of an incomplete landslide inventory, logistic regression model and its validation for landslide susceptibility mapping related to the May 12, 2008, Wenchuan earthquake of China. Nat. Hazards 2013, 68, 883–900. [Google Scholar] [CrossRef]
  24. Xu, C.; Xu, X.W. Logistic regression model and its validation for hazard mapping of landslides triggered by Yushu earthquake. J. Eng. Geol. 2012, 20. [Google Scholar] [CrossRef]
  25. Luo, L.G.; Pei, X.J.; Huang, R.Q.; Pei, Z.; Zhu, L. Landslide susceptibility assessment by GIS based on certainty factor and logistic regression model in Jiuzhaigou scenic area. J. Eng. Geol. 2020, 1–11. [Google Scholar] [CrossRef]
  26. Fan, Z.Y.; Gou, X.F.; Qin, M.Y.; Fan, Q.; Yu, J.L.; Zhao, J.J. Information and Logistic Regression Models based Coupling Analysis for Susceptibility of Geological Hazards. J. Eng. Geol. 2018, 26, 340–347. [Google Scholar] [CrossRef]
  27. Guo, Z.Z.; Yin, K.L.; Huang, F.M.; Fu, S.; Zhang, W. Evaluation of landslide susceptibility based on landslide classification and weighted frequency ratio model. Chin. J. Rock Mech. Eng. 2019, 38, 287–300. [Google Scholar] [CrossRef]
  28. Yang, G.; Xu, P.H.; Cao, C.; Zhang, W.; Lan, Z.G.; Chen, J.Q.; Dong, X.J. Assessment of Regional Landslide Susceptibility Based on Combined Model of Certainty Factor Method. J. Eng. Geol. 2019, 27, 1153–1163. [Google Scholar] [CrossRef]
  29. Pham, B.T.; Nguyen, T.T.; Qi, C.C.; Phong, T.V.; Dou, J.; Ho, L.S.; Le, H.V.; Prakash, I. Coupling RBF-based Neural Network with Ensemble Learning Techniques for Landslide Susceptibility Mapping. Catena 2020, 195. [Google Scholar] [CrossRef]
  30. Su, Q.M. Research on Spatial Distribution Characteristics of Geologic Disaster and Landslide Susceptibility Assessment in Huoxi Coalfield. Ph.D. Thesis, Taiyuan University of Technology, Taiyuan, China, 13 June 2017. (In Chinese with English Abstract). [Google Scholar]
  31. Guo, J.Q.; Peng, D.; Cao, J.; Yang, J.Y. Geomorphology and quaternary geology in Jiuzhai Valley. Acta Geol. Sichuan 2000, 20, 183–192, (In Chinese with English abstract). [Google Scholar]
  32. Guo, X.Y.; Fu, B.H.; Du, J.; Shi, P.L.; Li, J.X.; Li, Z.; Du, J.X.; Chen, Q.Y.; Fu, H. Monitoring and Assessment for the Susceptibility of Landslide Changes After the 2017 Ms 7.0 Jiuzhaigou Earthquake Using the Remote Sensing Technology. Front. Earth. Sci. 2021, 9, 633117. [Google Scholar] [CrossRef]
  33. Wu, W.Y.; Wang, X.Q.; Deng, F. Compilation and Spatial Analysis of Co-seismic Landslide Inventory by Using High-resolution Remote Sensing Images in Earthquake Emergency Response-An Example of the Jiuzhaigou Ms 7.0 Earthquake on August 8, 2017. Technol. Earthq. Disaster Prev. 2017, 12, 815–825, (In Chinese with English Abstract). [Google Scholar]
  34. Dai, L.X.; Xu, Q.; Fan, X.M.; Chang, M.; Yang, Q.; Yang, F.; Ren, J. A preliminary study on spatial distribution patterns of landslides triggered by Jiuzhaigou earthquake in Sichuan on August 8th, 2017, and their susceptibility assessment. J. Eng. Geol. 2017. [Google Scholar] [CrossRef]
  35. Fan, X.M.; Yunus, A.P.; Scaringi, G.; Catani, F.; Subramanian, S.S.; Xu, Q.; Huang, R.Q. Rapidly evolving controls of landslides after a strong earthquake and implications for hazard assessments. Geophys. Res. Lett. 2020. [Google Scholar] [CrossRef]
  36. Wu, C.H.; Cui, P.; Li, Y.S.; Irasema, A.A.; Huang, C.; Yi, S.J. Seismogenic fault and topography control on the spatial patterns of landslides triggered by the 2017 Jiuzhaigou earthquake. J. Mt. Sci. 2018, 015, 793–807. [Google Scholar] [CrossRef]
  37. Dong, X.J.; Xu, Q.; She, J.X.; Li, W.L.; Liu, F.; Zou, X.X. Preliminary study on interpretation of geological hazards in Jiuzhaigou based on multi-source remote sensing data. Geomat. Inf. Sci. Wuhan Univ. 2020, 45, 432–441. [Google Scholar] [CrossRef]
  38. He, W.G.; Zheng, W.J.; Wang, A.G.; Liu, X.W.; Zhang, B.; Liu, F.B.; Pang, W. New Activities of Lintan-Dang Fault and its Relation to Minxian-Zhangxian Ms 6.6 Earthquake. China Earthq. Eng. J. 2013, 35, 751–760. [Google Scholar] [CrossRef]
  39. Tian, Y.Y.; Xu, C.; Xu, X.W.; Chen, J. Detailed inventory mapping and spatial analyses to landslides induced by the 2013 Ms 6.6 Minxian earthquake of China. J. Earth Sci. 2016, 27, 1016–1026. [Google Scholar] [CrossRef]
  40. Wu, Z.J.; Sun, J.J.; Chen, Y.J.; Wang, Q.; Zhao, W.C. Analysis of disaster causing mechanism of loess landslides induced by the Minxian-Zhangxian Ms 6.6 earthquake, China. Jpn. Geotech. Soc. Spec. Publ. 2015, 1, 40–45. [Google Scholar] [CrossRef] [Green Version]
  41. Zheng, W.J.; Yuan, D.Y.; He, W.G.; Min, W.; Ren, Z.K.; Liu, X.W.; Wang, A.G.; Xu, C.; Ge, W.P.; Li, F. Geometric pattern and active tectonics in Southeastern Gansu province: Discussion on seismogenic mechanism of the Minxian-Zhangxian Ms 6.6 earthquake on 22 July 2013. Chin. J. Geophys. 2013. [Google Scholar] [CrossRef]
  42. Liu, S.P. Spatio-Temporal Evolution of Northeastern Tibetan Plateau: Integrated Provenance Study of the Guide, Lanzhou and Wushan-Tianshui Basins. Ph.D. Thesis, Lanzhou University, Lanzhou, China, 2015. (In Chinese with English Abstract). [Google Scholar]
  43. Zhuang, Y.; Xing, A.G.; Cheng, Q.G.; Li, D.S.; Xu, C.; Zhao, C. Characteristics and numerical modeling of a catastrophic loess flow slide triggered by the 2013 Minxian-Zhangxian earthquake in Yongguang village, Minxian, Gansu, China. Bull. Eng. Geol. Environ. 2019, 79. [Google Scholar] [CrossRef]
  44. Xu, C.; Xu, X.W.; Shyu, J.B.H.; Zheng, W.J.; Min, W. Landslides triggered by the 22 July 2013 Minxian-Zhangxian, China, Mw 5.9 earthquake: Inventory compiling and spatial distribution analysis. J. Asian Earth Sci. 2014, 92, 125–142. [Google Scholar] [CrossRef]
  45. Huang, R.Q.; Li, W.L. Research on development and distribution rules of geohazards induced by Wenchuan earthquake on 12th May 2008. Chin. J. Rock Mech. Eng. 2008, 27, 2585–2592. [Google Scholar] [CrossRef]
  46. Keefer, D.K. Statistical analysis of an earthquake-induced landslide distribution-the 1989 Loma Prieta, California event. Eng. Geol. 2000, 58, 231–249. [Google Scholar] [CrossRef]
  47. Talaei, R. Landslide Susceptibility Zonation Mapping Using Logistic Regression and its Validation in Hashtchin Region, Northwest of Iran. J. Geol. Soc. India. 2014, 84, 68–86. [Google Scholar] [CrossRef]
  48. Yin, K.L. Risk Analysis of Landslide Disaster; Science Press: Beijing, China, 2013; pp. 32–34. (In Chinese) [Google Scholar]
  49. Ba, Q.Q.; Chen, Y.M.; Deng, S.S.; Wu, Q.J.; Yang, J.X.; Zhang, J.Y. An improved information value model based on gray clustering for landslide susceptibility mapping. ISPRS Int. J. Geo-Inf. 2017, 6, 18. [Google Scholar] [CrossRef]
  50. Shortliffe, E.H.; Buchanan B, G. A model of inexact reasoning in medicine. Math. Biosci. 1987, 23, 351–379. [Google Scholar] [CrossRef]
  51. Tang, C.; Ma, G.C. Small regional geohazards susceptibility mapping based on geomorphic unit. Sci. Geogr. Sin. 2015, 35, 91–98, (In Chinese with English Abstract). [Google Scholar]
  52. Conoscenti, C.; Angileri, S.; Cappadonia, C.; Rotigliano, E.; Agnesi, V.; Maerker, M. Gully erosion susceptibility assessment by means of GIS-based logistic regression: A case of Sicily (Italy). Geomorphology 2014, 204, 399–411. [Google Scholar] [CrossRef] [Green Version]
  53. Mathew, J.; Jha, V.K.; Rawat, G.S. Landslide susceptibility zonation mapping and its validation in part of Garhwal lesser Himalaya, India, using binary logistic regression analysis and receiver operating characteristic curve method. Landslides 2009, 6, 17–26. [Google Scholar] [CrossRef]
  54. Tolga, C.; Hakan, A.N.; Candan, G.; Harun, S.; Tamer, Y.D. Susceptibility assessments of shallow earthflows triggered by heavy rainfall at three catchments by logistic regression analyses. Geomorphology 2005, 72. [Google Scholar] [CrossRef]
  55. Swets, J.A. Measuring the accuracy of diagnostic systems. Science 1988, 240, 1285–1293. [Google Scholar] [CrossRef] [Green Version]
  56. Fawcett, T. An introduction to ROC analysis. Pattern Recognit. Lett. 2005, 27, 861–874. [Google Scholar] [CrossRef]
  57. Tian, Q.; Zhang, B.; Guo, J.F.; Liu, H.Z.; Chang, Z.L.; Li, Y.J.; Huang, F.M. Landslide susceptibility assessment based on the coupling model of information value and logistic regression. Sci. Technol. Eng. 2020, 20, 8460–8468, (In Chinese with English Abstract). [Google Scholar]
Figure 1. (a) The map shows the location of the figure (b,c) in China; (b) Active tectonics and large seismic events in the eastern Tibetan Plateau; (c) Seismic ground motion parameters zonation map. LMSF: Longmenshan Fault; EKLF: East Kunlun Fault; WQLF: West Qinling Fault; TWF: Tongwei Fault; HYF: Haiyuan Fault; LPSF: Liupanshan Fault; LTTCF: Lintan-Tanchang Fault.
Remotesensing 13 02546 g001
Figure 2. Procedural flow chart of this study.
Remotesensing 13 02546 g002
Figure 3. Inventory map of the earthquake-induced landslide in Jiuzhaigou. (a) Landslide map (The background is Sentinel-2 image (RGB)); (b,c) Landslide map of Jiuzhaitiantang and Panda Lake; (d) Outcrop of massive limestone developed near Mirror Cliff; (e) Outcrop of thick massive limestone observed near Five-Flower Lake.
Remotesensing 13 02546 g003
Figure 4. Interpretation examples of landslides related to the 8 August 2017 Jiuzhaigou Ms 7.0 earthquake from Sentinel-2 (10 m) and UAV (1 m) images. (a,b) Jiuzhaitiantang area before and after the 2017 Jiuzhaigou earthquake; (c,d) Arrow Bamboo Lake area before and after the 2017 Jiuzhaigou earthquake.
Remotesensing 13 02546 g004
Figure 5. Inventory map of the earthquake-induced landslide in Minxian. (a) Landslide map; (b) Landslides around Wendou; (c) Typical outcrops developed near the Yongguang village: the tertiary red beds covered by thick loess.
Remotesensing 13 02546 g005
Figure 6. Influencing factors in Jiuzhaigou. (a) Slope; (b) Aspect; (c) Elevation; (d) PGA; (e) Fault (The black line is the seismogenic fault—Xiongmaohai-Shangsizhai fault [34,35]); (f) Strata (Blue star near Mirror Cliff: outcrop in Figure 3d; Red star near Five-Flower Lake: outcrop in Figure 3e); (g) River; (h) Road.
Remotesensing 13 02546 g006
Figure 7. Influencing factors in Minxian. (a) Slope; (b) Aspect; (c) Elevation; (d) PGA; (e) Fault (The black line is the Hetuo fault [38]); (f) Strata (Red star near Yongguang village: outcrop in Figure 5c); (g) River; (h) Road.
Remotesensing 13 02546 g007
Figure 8. Distribution map of earthquake landslide susceptibility in Jiuzhaigou area. (a) Information model; (b) CF model; (c) LR model; (d) I + LR model; (e) CF + LR model.
Remotesensing 13 02546 g008
Figure 9. Distribution map of earthquake landslide susceptibility in Minxian area. (a) Information model; (b) CF model; (c) LR model; (d) I + LR model; (e) CF + LR model.
Remotesensing 13 02546 g009
Figure 10. ROC curve. (a) Jiuzhaigou earthquake landslide susceptibility; (b) Minxian earthquake landslide susceptibility.
Remotesensing 13 02546 g010
Table 1. Descriptions of lithologic characteristics and strata in the Jiuzhaigou area [8].
No.StrataLithology
DDevonianBiolithite with argillaceous limestone, layered dolomite
CCarboniferousCompacted limestone with dolomite and argillite
PPermianShale, limestone, and dolomite
TTriassicLimestone, slate, sandstone
QQuaternarySand and gravel
Table 2. Descriptions of lithologic characteristics and strata in the Minxian area [39].
No.StrataLithology
DDevonianSilty slate, powder sandstone, slate
PPermianCarbon-containing slate, slate, sandstone, conglomerate
TTriassicThick sandstone, slate, and a small amount of limestone
JJurassicConglomerate, carbonaceous shale clip coal, or oil shale
EEogeneSandstone, conglomerate
NNeogeneSandstone, conglomerate, siltstone and sandy argillite
QQuaternarySand and gravel
Table 3. Statistics of Jiuzhaigou landslide susceptibility.
SusceptibilityPercentage of Landslide Points/(%)Percentage of Classification Area /(%)LND/km2
ICFLRI + LRCF + LRICFLRI + LRCF + LRICFLRI + LRCF + LR
Very low0.661.081.670.431.1314.2818.6530.1913.5624.210.150.200.190.110.16
Low1.873.645.491.542.7523.2230.7336.7422.6527.560.270.400.500.230.34
Moderate4.639.8723.434.067.3929.5127.1221.1931.1826.310.531.233.730.440.95
High18.8229.4045.0320.7031.4521.6116.368.7921.7314.832.946.0617.283.217.16
Very high74.0256.0124.3873.2757.2811.387.143.0910.887.0921.9426.4726.6422.7327.26
Table 4. Statistics of Minxian landslide susceptibility.
SusceptibilityPercentage of Landslide Points/(%)Percentage of Classification Area /(%)LND/km2
ICFLRI + LRCF + LRICFLRI + LRCF + LRICFLRI + LRCF + LR
Very low0.170.731.841.161.806.2717.7827.0728.7528.990.260.390.650.380.59
Low0.993.697.386.096.3920.4628.4226.1824.8727.380.461.232.682.332.22
Moderate6.1815.3210.569.2310.8229.3626.9819.6017.8518.052.005.395.124.925.70
High27.9434.8526.7022.7922.0225.2815.0213.1413.1511.3310.4922.0119.3216.4818.48
Very high64.7245.4153.5260.7358.9718.6311.8014.0115.3814.2532.9636.4836.3137.5639.35
Publisher’s Note: MDPI stays neutral with regard to jurisdictional claims in published maps and institutional affiliations.

