1. Introduction
Field surveys in the Brazilian tropical forests (e.g., Atlantic forest) are laborious work. The high understory density, presence of lianas and vines, and aerial roots existent in this environment result in difficulties for the measurement of tree variables and a walk through the forest. Estimating variables that describe the forest structure, the tree species diversity, and richness are challenging tasks, because the Brazilian Atlantic forest is a very rich biome in plant species, with approximately 14,000 vascular plant species, of which approximately 8000 are classified as endemic [
1]. Additionally, measuring the canopy area and tree heights is troublesome because of the variation in tree height and overlapping of tree crowns. Due to these restrictions, tree height is usually estimated with the naked eye [
2]. These data are often used as inputs for regression models to estimate biomass, volume, growth, and yield, but uncertainties in the field variables measurement propagate to the estimates through regression models [
3,
4].
Data from airborne laser scanner (ALS) have been widely used in forestry applications, due to their ability to penetrate through small openings (e.g., gaps between branches and leaves) in the forest canopy and collect three-dimensional information of vegetation and terrain [
5,
6,
7]. ALS is based on light detection and ranging (LiDAR) technology, and with the resulting three-dimensional point cloud, it is possible to better understand the arrangement of the forest canopy, allowing the accurate estimation of structural parameters of the forest [
8]. The information acquired by ALS is very valuable for forest inventory and modeling, especially for dense, complex forests that are not safe and/or easy to access.
It is possible to extract several metrics from the ALS point cloud. This includes descriptive statistics, percentiles, and distribution measures of heights, intensity, and laser pulse returns, providing a summary of the forest canopy structure. LiDAR metrics are usually used as predictors in regression models for the estimation of forest biophysical variables [
9,
10,
11]. Multiple linear regression is commonly used for modeling forest variables from LiDAR metrics due to its simplicity and clarity when interpreting the resulting model [
12].
However, multiple linear regression requires the basic assumptions of classical statistics, which can be difficult to achieve when dealing with the modeling of biological data [
13]. As a result, the use of computational techniques, such as machine learning, has been increased, including modeling forest inventory variables with LiDAR metrics as predictors. Machine learning techniques can model complex relationships between dependent and independent variables (i.e., a large number of LiDAR metrics) without requiring linear assumptions about the data distribution [
13,
14]. Therefore, machine learning techniques are suitable for predicting complex non-linear relationships. Additionally, interaction effects are modeled automatically which makes these methods very powerful and promising compared to multiple linear regression to estimate forest parameters from LiDAR data [
13,
15].
The use of LiDAR metrics to estimate forest variables using machine learning techniques has been used in forest plantations in Brazil. The estimate of total, commercial, and pulp volume of a
Pinus taeda plantation was performed by Silva et al. [
16] using LiDAR metrics as input data for the random forest (RF) algorithm. The results obtained indicated a low bias prediction (average of −0.2%) and the average of the root-mean-square error (RMSE) was 8.1%. The authors concluded the use of RF to determine different types of volumes in homogeneous forests presents highly accurate estimates. In
Eucalyptus spp. plantations, Görgens et al. [
17] estimated volume per stand comparing multiple linear regression with artificial neural network (ANN), RF, and support vector machine (SVM) regression methods. The results obtained reached high accuracy, with R² close to 0.90 and with bias tending to zero. Among the tested machine learning methods, RF was slightly better than the other methods and its results were similar to the results obtained with multiple linear regression. The assessment of ANN, k nearest neighbors, and RF for modeling trunk shape and volume in black wattle plantation, [
18] showed that ANN and RF presented the best results, with RMSE of 8% and 8.4%, respectively, against the RMSE of 9.15% for the polynomial model. The authors concluded that the machine learning techniques are appropriate for forest modeling, however, their use should be cautious because of the greater possibility of overtraining and overfitting.
Regarding native Brazilian forests, the combination of LiDAR metrics and machine learning techniques is mainly focused on the Amazonian forest to estimate the aboveground biomass. In low-intensity logging areas, [
19] estimated the aboveground biomass (AGB) stock by comparing multiple linear regression with some machine learning approaches. Linear regression was the most appropriate method for the case study, with an RMSE of 19.7%, slightly better than the methods of RF, ANN, and SVM with a RMSE of 22.8% for the three methods. However, the results demonstrate the potential for predicting AGB when a non-parametric method is required mainly in tropical forests, due to its great diversity and heterogeneity.
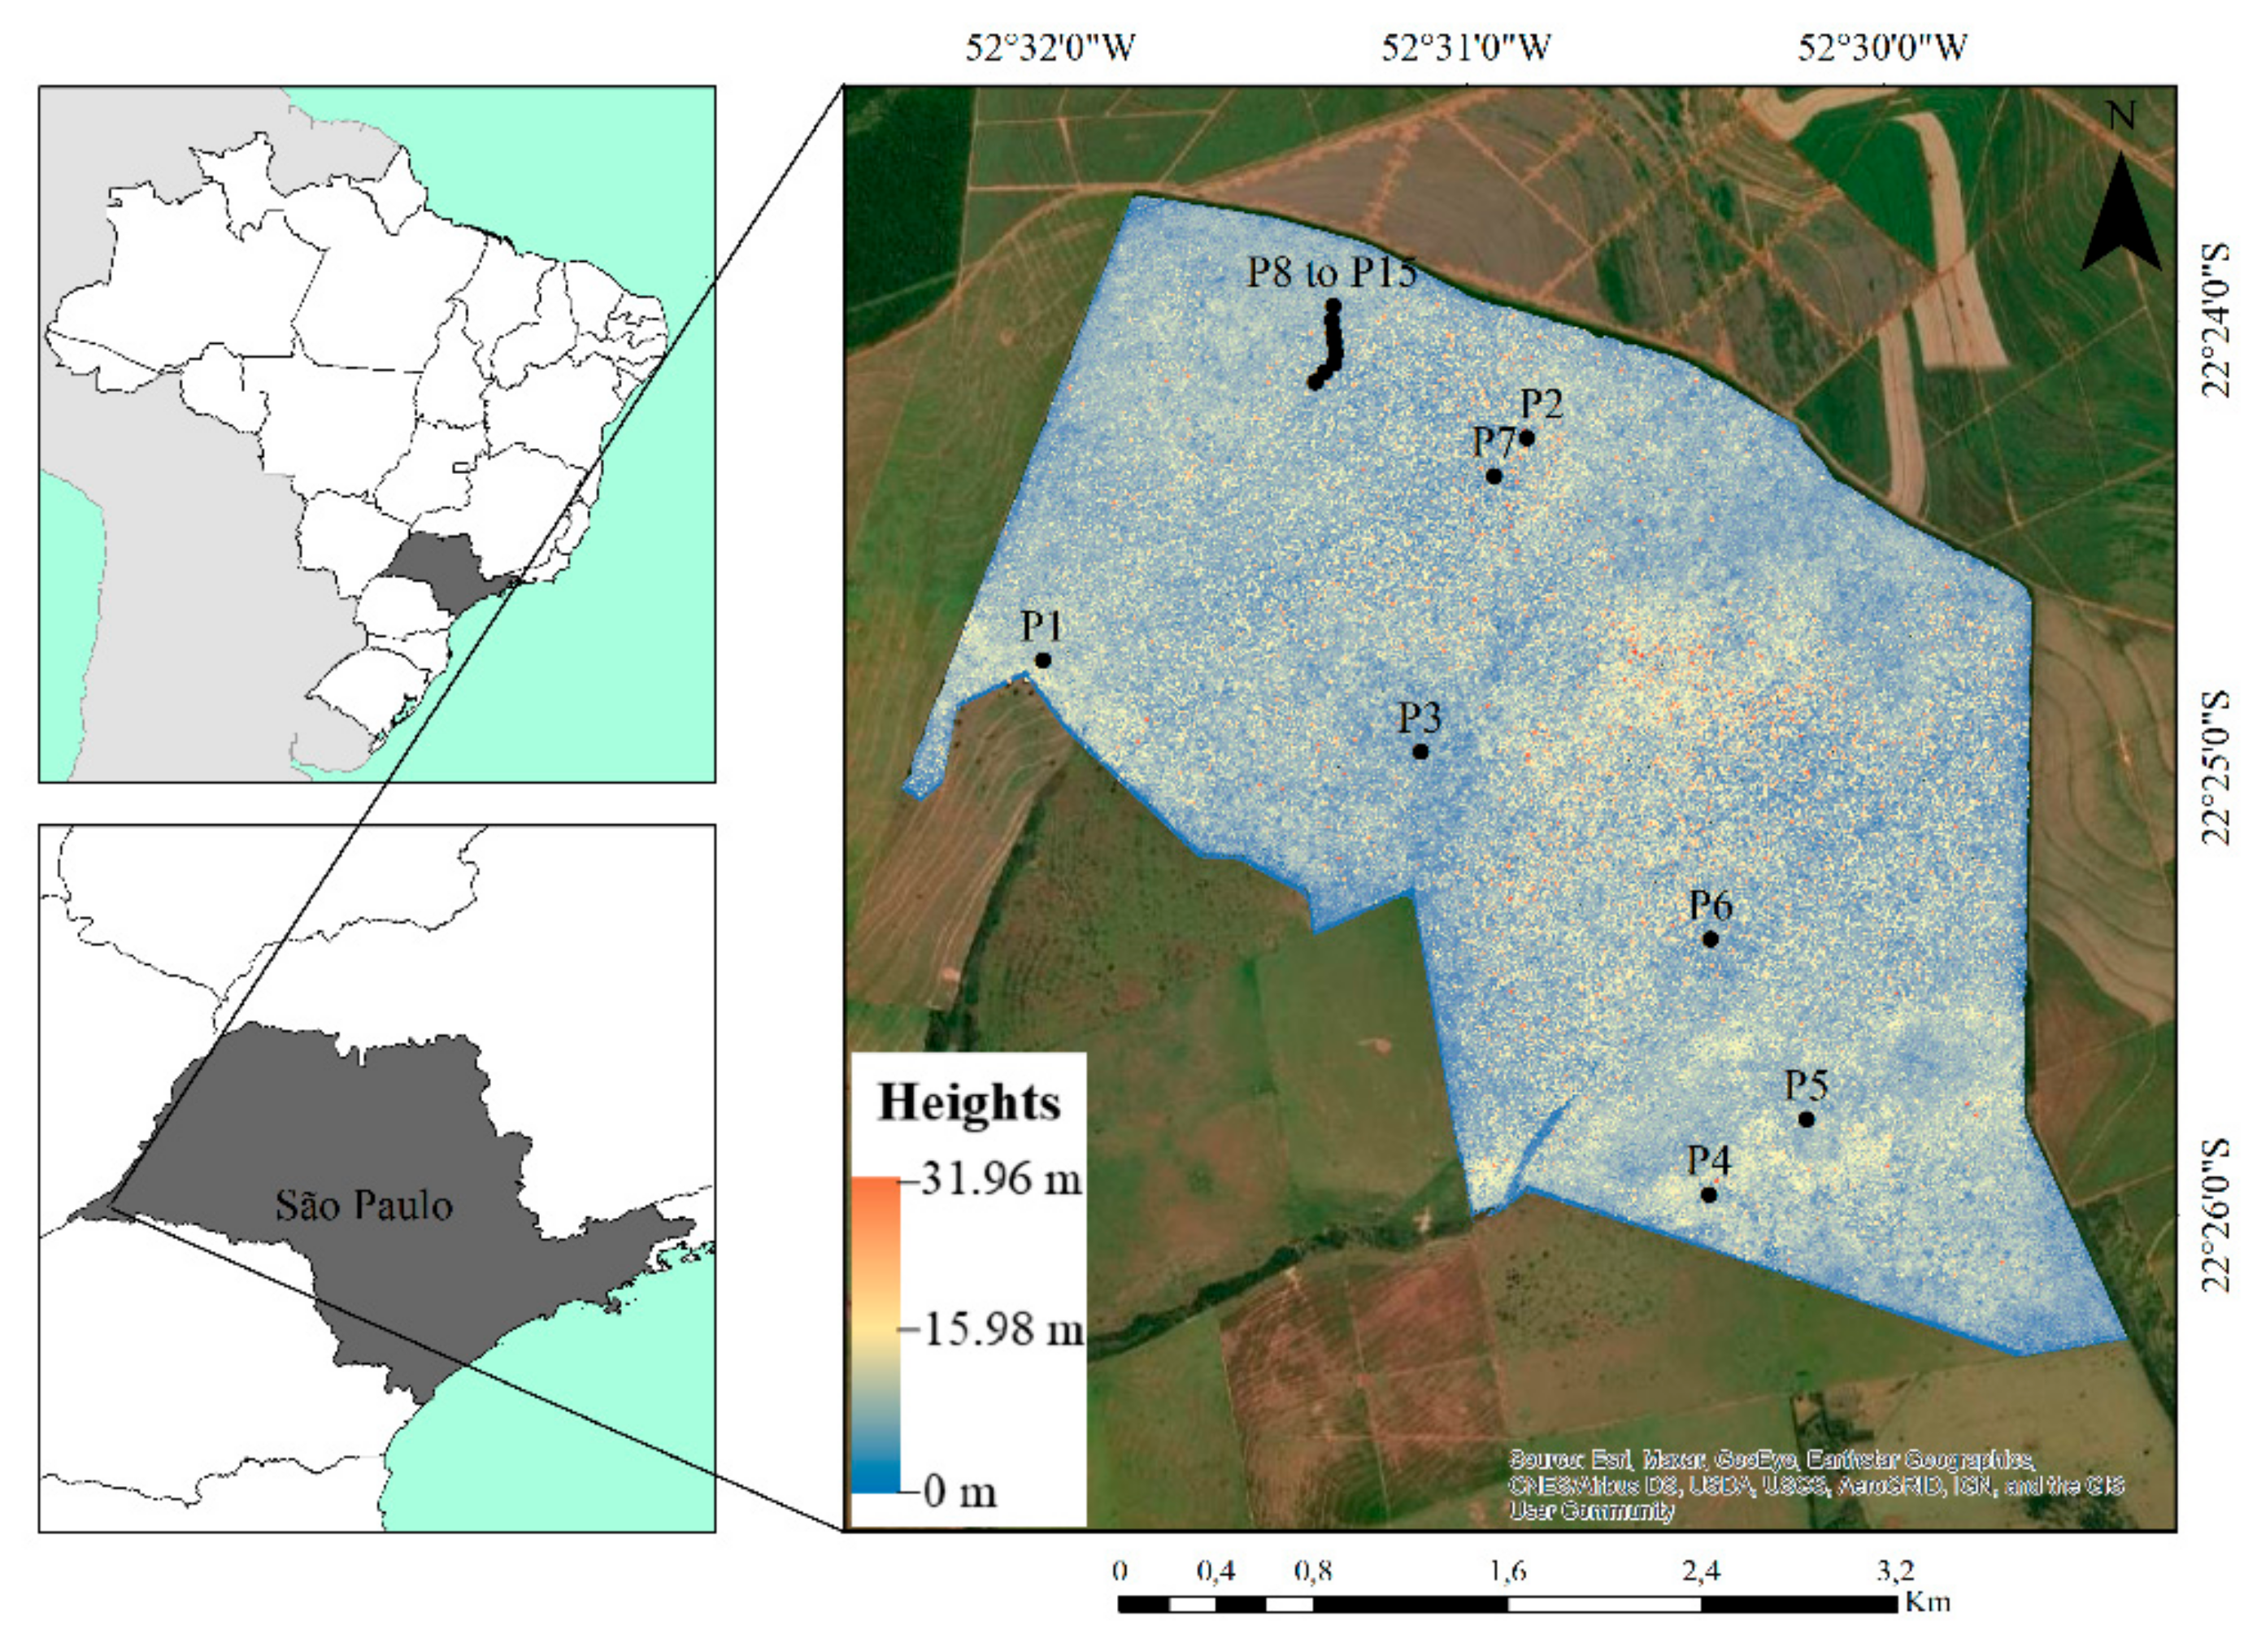
Nevertheless, there are other biomes in Brazil with high richness and species diversity such as the Atlantic Forest. This is the second-largest rainforest in America, which occurs mainly along the coast, extending far inland in some areas of south and southeastern Brazil [
20], whose composition, structure, and diversity remain mostly unknown. Due to the occupation of the national territory that mainly occurs along the coast and other anthropogenic activities (e.g., logging, disordered urban growth, agricultural encroachment, and industrialization), the Atlantic Forest is the most degraded biome in Brazil. It is approximated that only 11.6% of its original cover still remains, and these are very fragmented [
21,
22,
23]. However, this biome is a biodiversity hotspot because it has already lost more than 75% of its original cover, with very high fragmentation, the remaining forest fragments of this biome have a high species endemism [
24,
25].
The semideciduous seasonal forest, also known as inland Atlantic Forest because of the inland location, is one of the phytophysiognomies and associated ecosystems defining and forming the Atlantic forest, as described by [
26]. Despite the importance of this native forest, it is often neglected, resulting in a lack of information about its composition, structure, and diversity [
27].
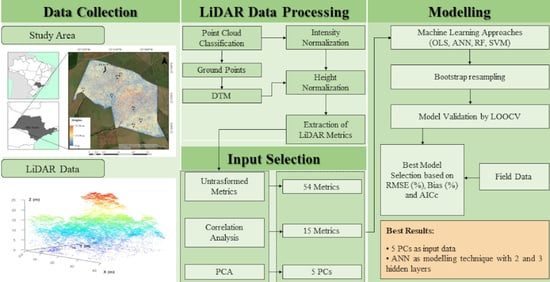
The lack of studies using LiDAR metrics in the Brazilian Atlantic Forest and their potential for estimating variables describing the forest structure was the motivation for this work. The main objective is to compare four machine learning approaches (ANN, ordinary least-squares multiple regression (OLS), RF, and SVM) with different numbers of LiDAR metrics as input data, to estimate seven stand and diversity variables: mean diameter at breast height (MDBH), quadratic mean diameter (QMD), basal area (BA), density (DEN), number of tree species (NTS), Shannon–Waver diversity index (H’), and Simpson diversity index (D). An area-based approach was considered more applicable than individual tree-based techniques due to the difficulty of extracting individual trees in the tropical forest [
28,
29].
An extensive experimental assessment was made, combining the three input types of LiDAR metrics with the different regression methods tested with different architectures, to estimate the stand and diversity forest variables cited. The results obtained in this study may contribute to finding the best combination of a selection of metrics to deal with and a machine learning technique to estimate forest variables in an inland Atlantic Forest.
4. Discussion
Many combinations of input data have been tested with various regression techniques for estimating variables. This section critically discusses those with the most significant impact on the results, both positive and negative, based on the criteria established for choosing the regression technique.
According to [
20,
24,
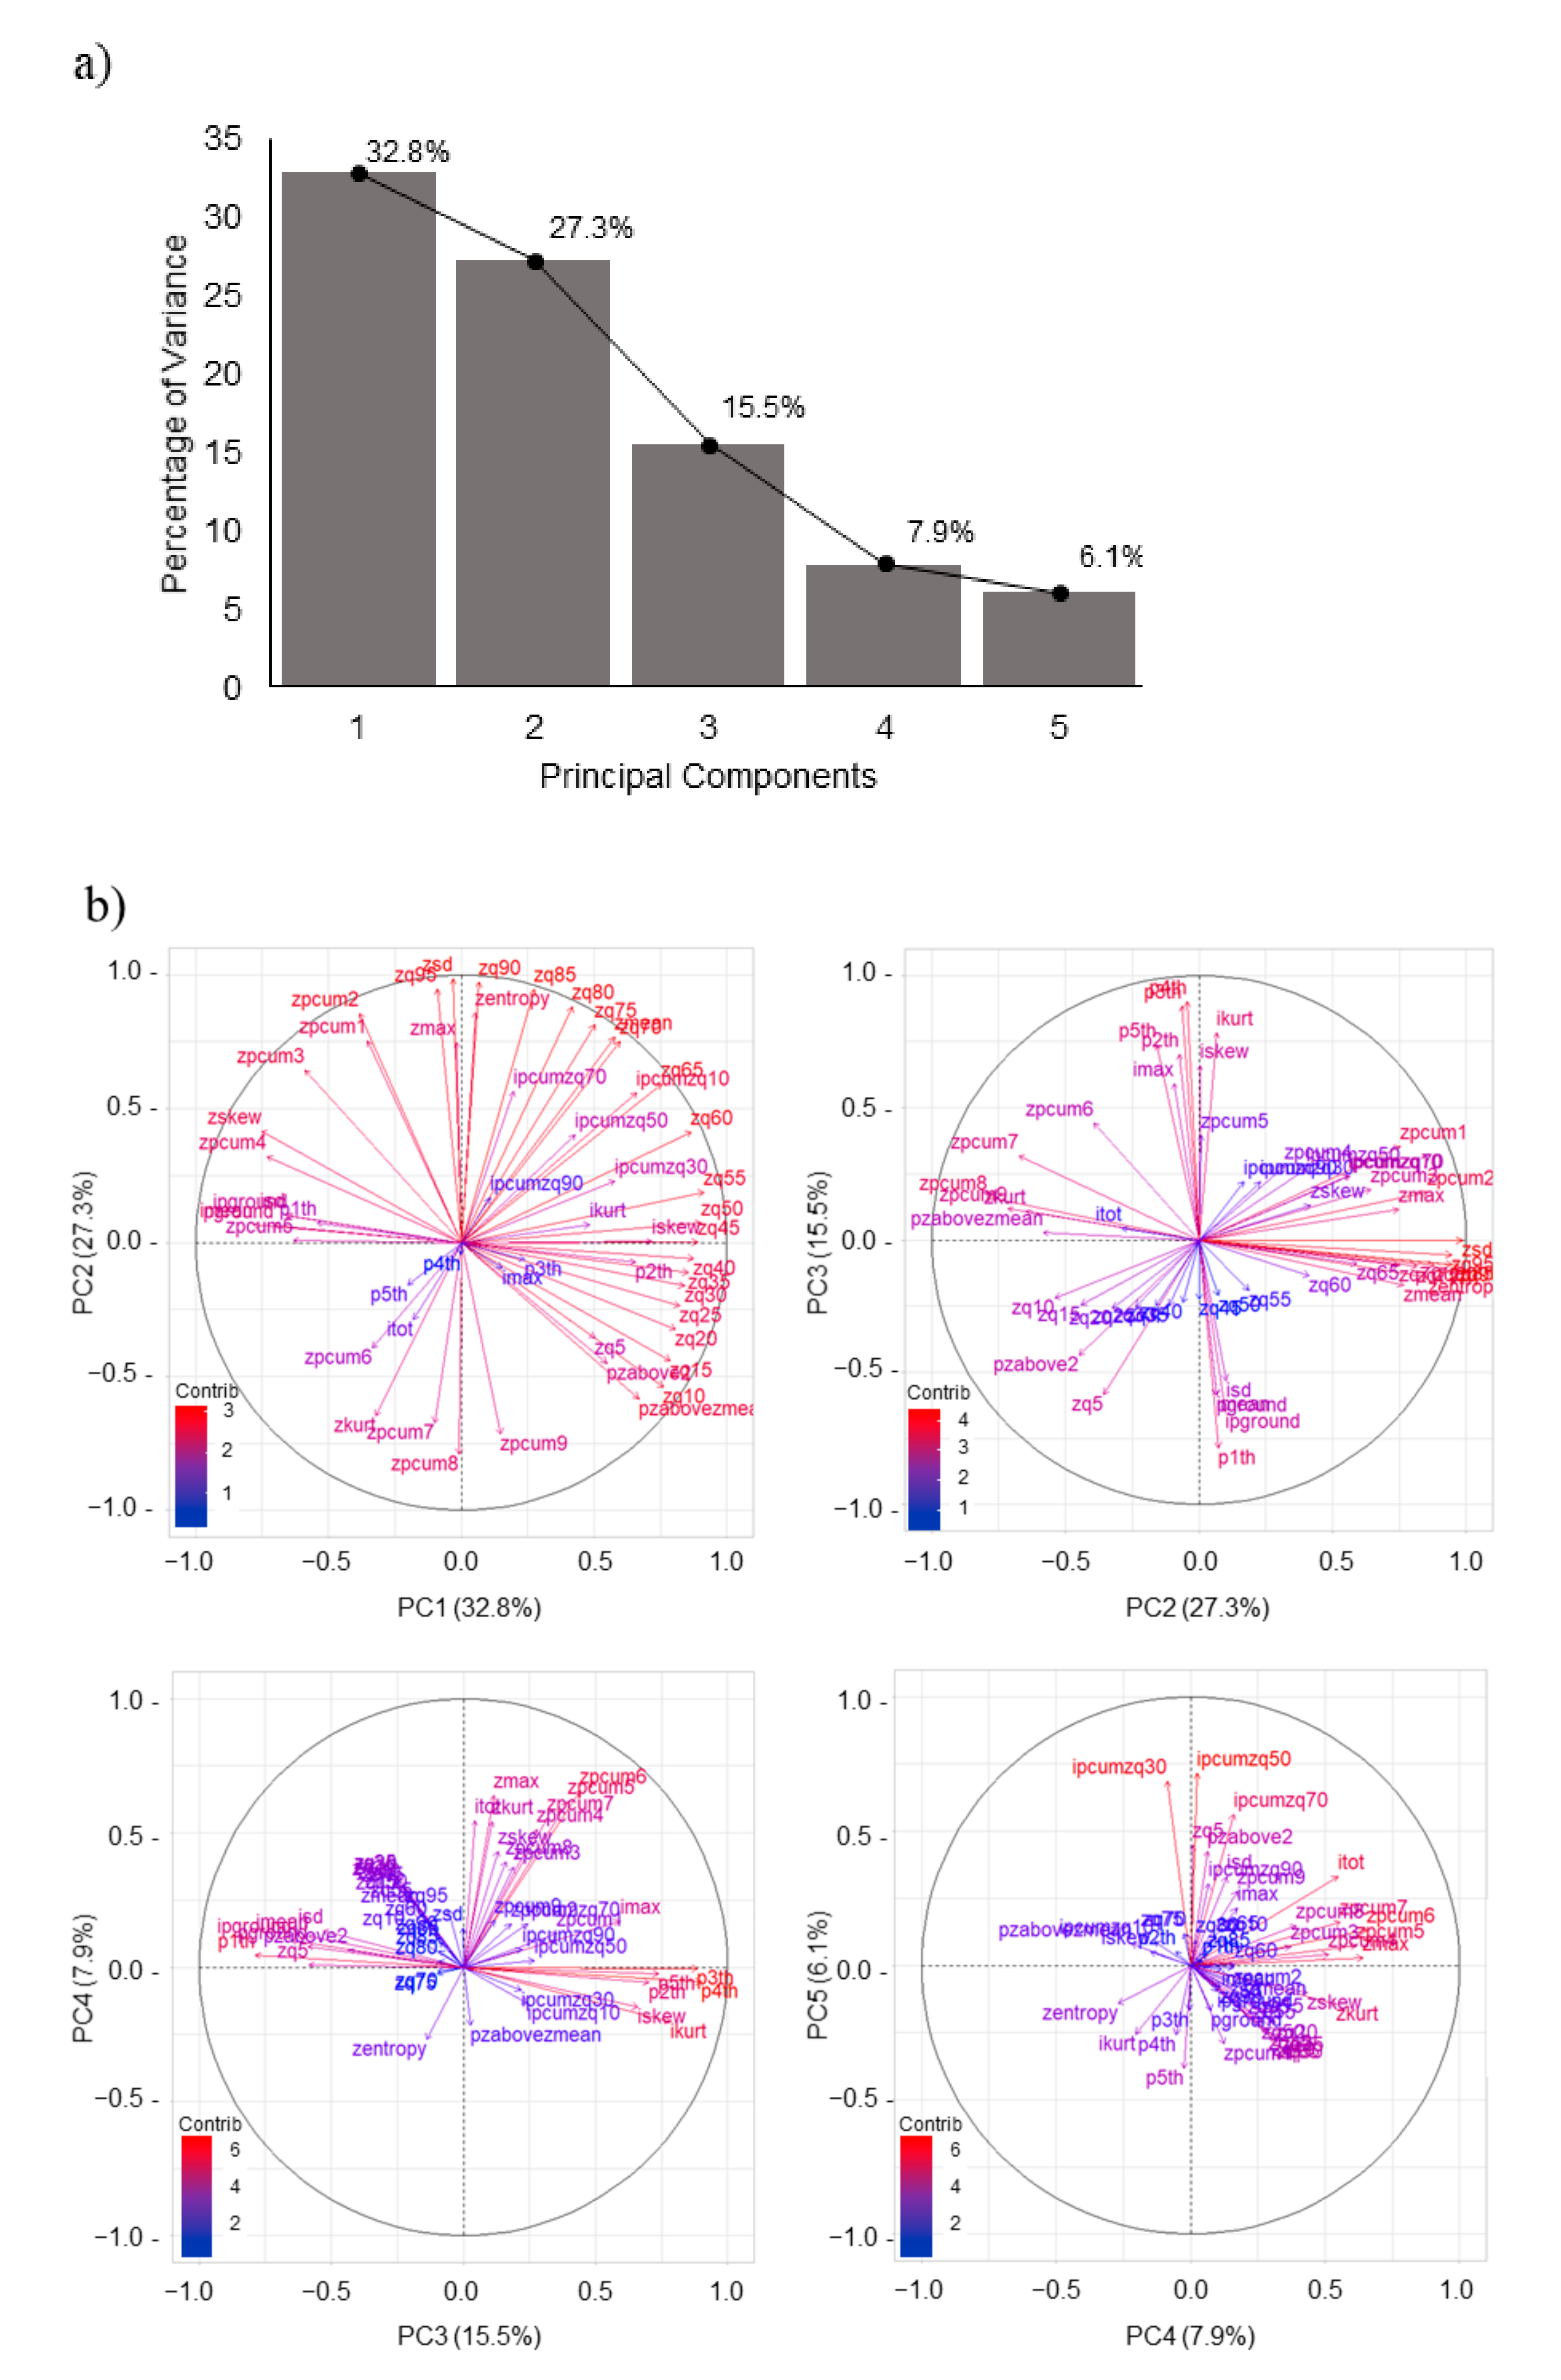
80], before using LiDAR metrics to build models, a pre-selection and/or transformation of these metrics is necessary to obtain better relations with the variable to be estimated. However, in this process, the selected metrics may not have physical meaning and may differ entirely according to the forest to be studied. This was confirmed in our study, in which the best results were obtained using a previous reduction of dimensionality by the PCA. Some methods, such as RF, also serve to select variables, which could also be tested to verify the consistency of the results obtained in this study [
7].
The use of ANNs for the estimation of forest variables has been growing, and several studies have been developed in Brazilian forests using this technique as an alternative to OLS. Many of these studies are mainly concerned with estimating variables such as height, volume, the shape of the trunk and tapering, and prognosis of yield and production in forests of
Eucalyptus spp,
Pinus spp, and
Tectona grandis, as listed by [
81], in Black Wattle plantations [
18], in native forests for prediction of the diametric distribution [
82], [
83] and biomass [
28], both in the Amazon Forest and in the Atlantic Forest biome, aimed at estimating surviving individuals and mortality within the forest [
84].
Most of these studies worked with a high sample size and the configuration of the networks for the estimation of the variables had only one hidden layer. This configuration was possibly adopted because the forests, were equian (trees with the age) and homogeneous, with low variance between individuals, thus requiring the adjustment of less complex networks. However, even in studies with native forests, there is a trend to use only one hidden layer with a variable number of neurons within that layer.
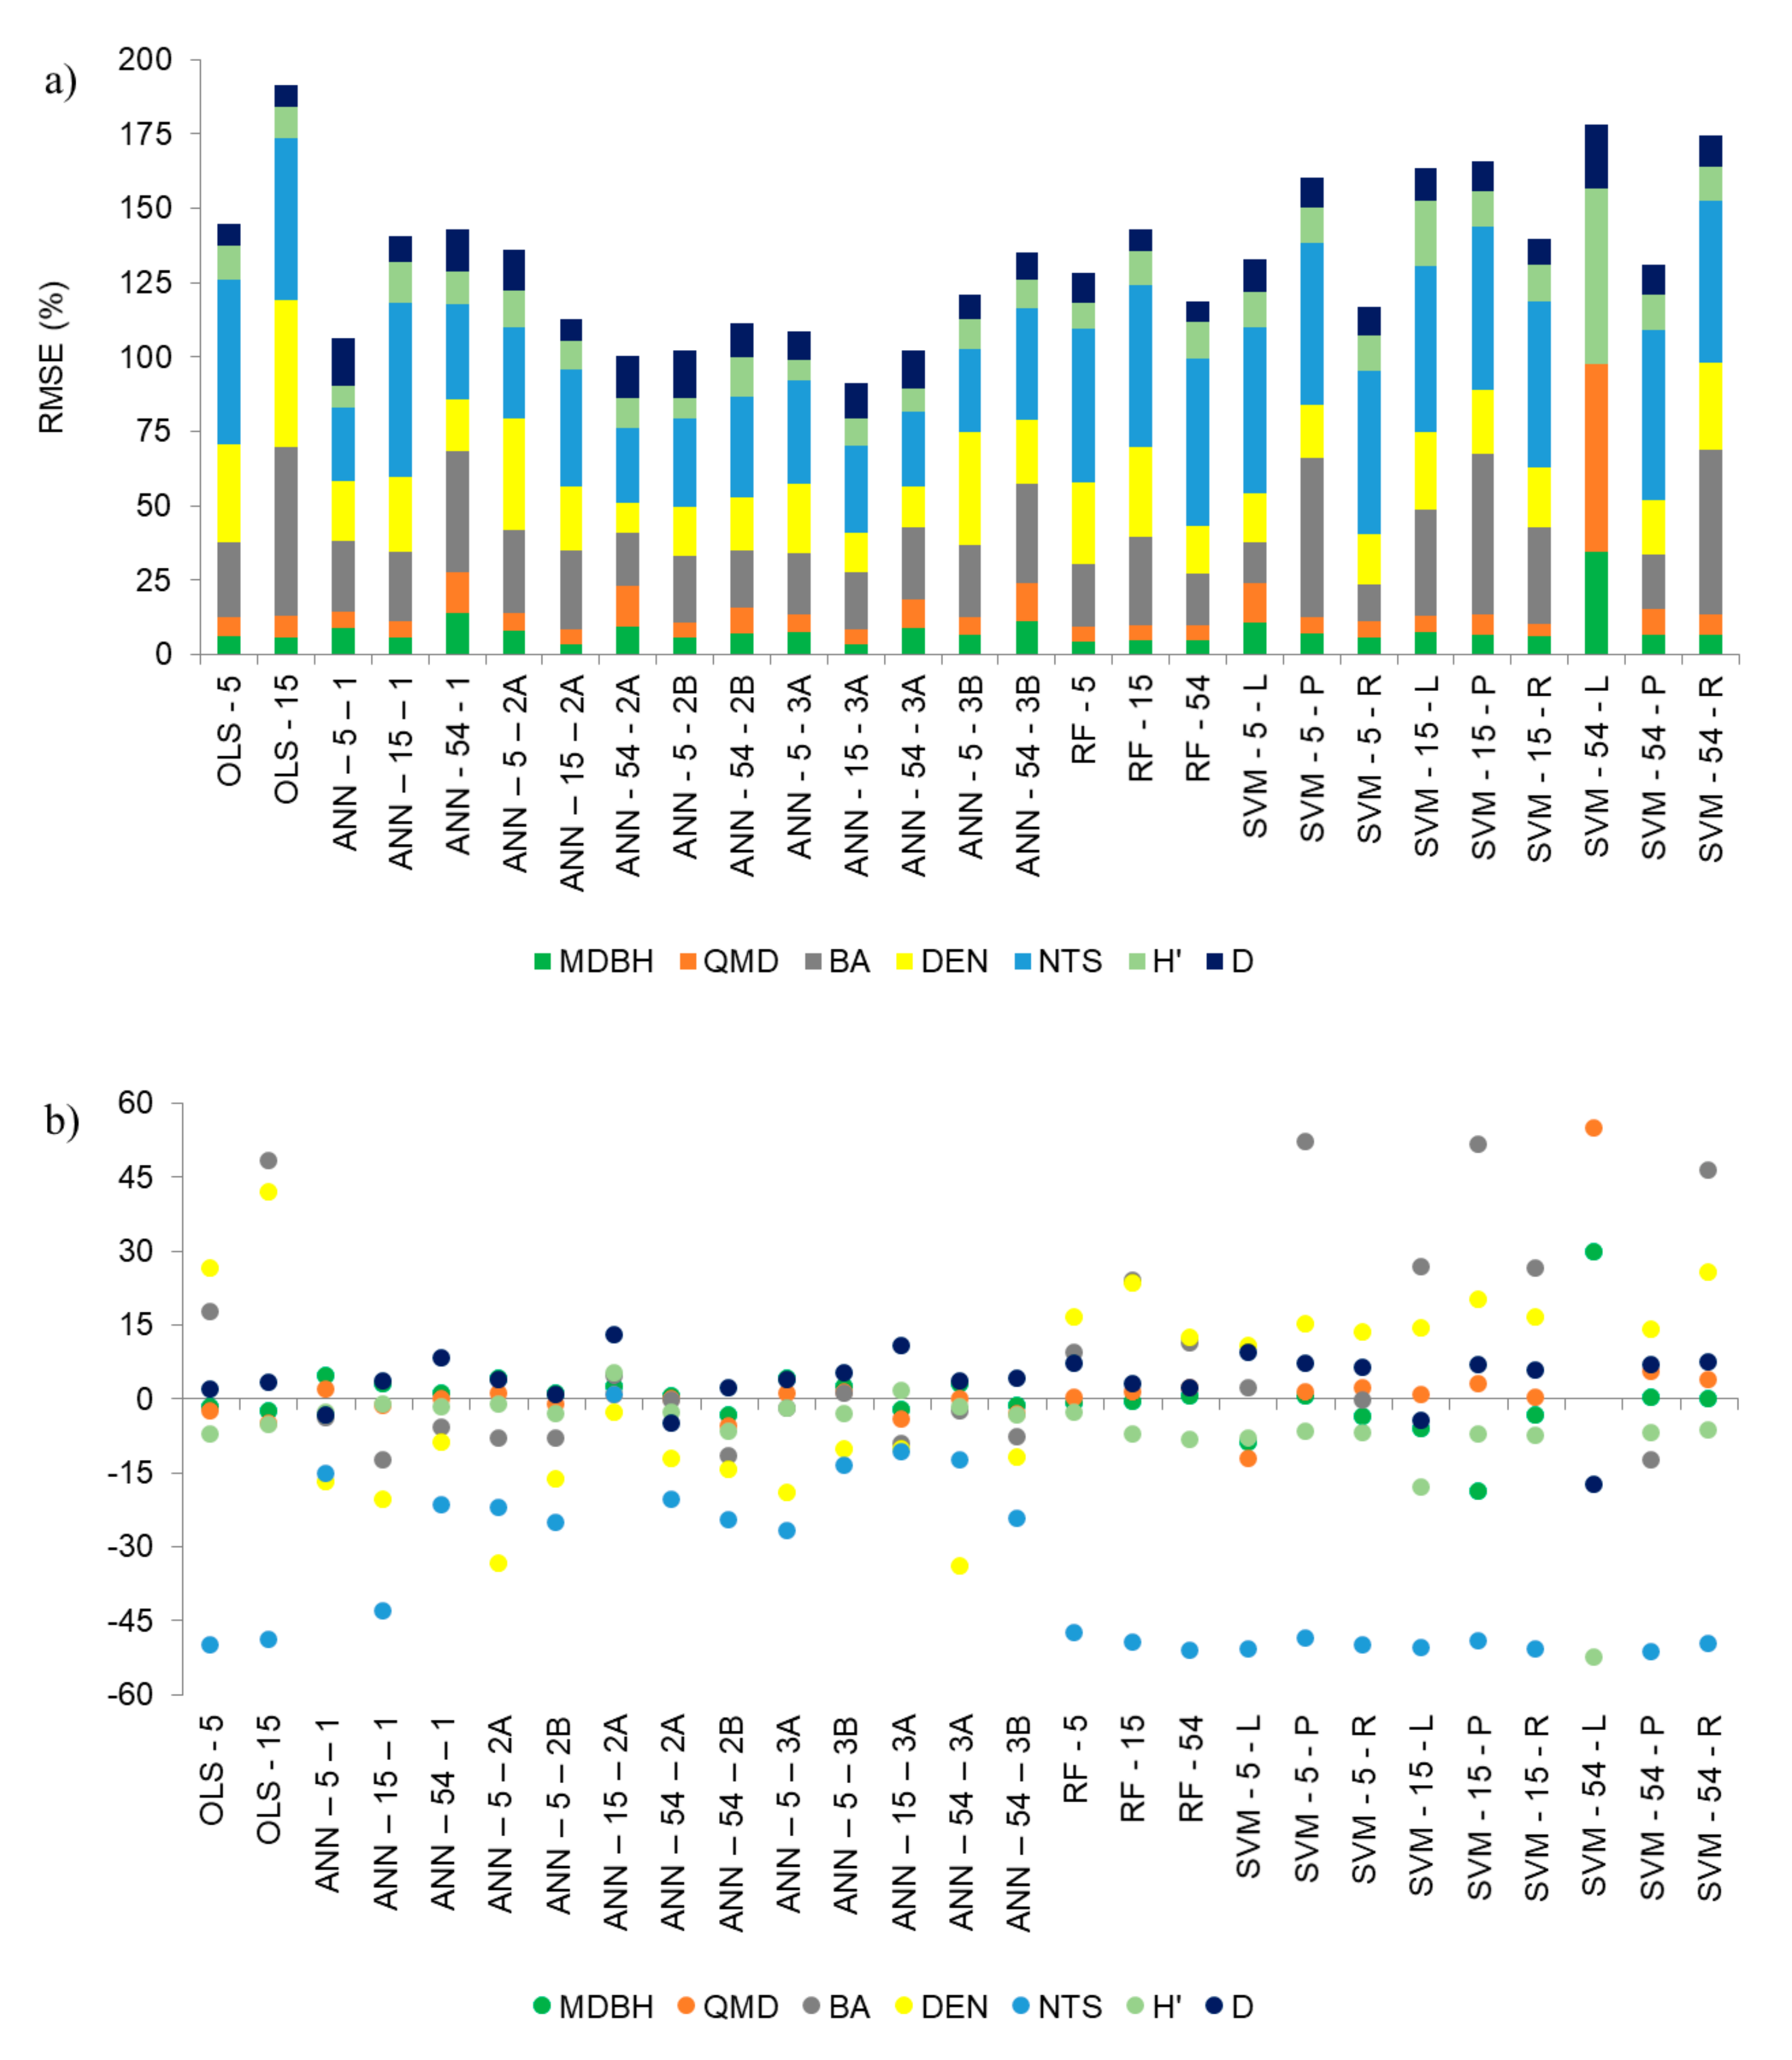
In our study, ANNs with only one hidden layer, with the 54 metrics or 15 uncorrelated LiDAR metrics, presented the highest RMSE% for the studied variables (on average 20%), compared with the other networks (
Figure 5a) and underestimated five of the seven variables (
Figure 5b). Silva et al. [
16] estimated the volume in clonal plantations of
Eucalyptus spp. using several machine learning techniques with LiDAR metrics. They also assessed the different impacts of sample size on estimates, concluding that the sample size influences RMSE (%) and bias (%). The larger the sample size, the lower the values of the percentages are up to a certain level, where the sample size no longer influences them. Among the methods tested, the ANNs were the most susceptible to outliers. Tropical forests are more complex environments than planted forests, due to the great heterogeneity and diversity, requiring architectures with two hidden layers instead of one. This is aligned with [
85], who also stated that the processing capacity of a neural network is related to its connectivity; i.e., in more complex jobs, as the demand for hidden layers increases, the number of neurons in the first hidden layer increases as well. However, with the rise of the number of hidden layers, the chance of convergence to a local minima increases, resulting in overfitting [
86], especially when using a neural network with great learning capacity using few samples, in which the neural networks memorize the training data but lose the ability to generalize [
87].
For this study case, the best neural network was the one with two and three hidden layers. In addition, careful selection of input metrics is important when using the ANN technique, since metrics that are unrelated to variables to be estimated can have a negative influence on the predictive power of the model [
88], [
89]. Thus, the use of LiDAR metrics transformed by the PCAs was effective in the use of ANN, being the most appropriate method in the estimates in this study.
When working with a multilayer perceptrons neural network, usually one hidden layer is sufficient to estimate variables [
86]. In complex problems, where discontinuous data modeling is required, two hidden layers can well represent complex functions, with better fitting [
62,
86]. However, it is not usual to use more than two hidden layers to estimate variables, due to the risk of overfitting [
86].
OLS and RF were the methods presenting an intermediate performance in the estimation of forest variables, according to the criteria used in this study, for the selection of the most appropriate regression technique. The RMSE (%) bars in
Figure 5a are higher with OLS, using uncorrelated LiDAR metrics, than with OLS using PCAs. However, these techniques showed large bias, especially for the BA, DEN, and NTS variables. The transformations of the independent variables in the OLS, such as logarithm, square root, square, or cube, can improve estimates using this regression method, especially when the assumptions of classical statistics are not met [
71]. However, these transformations do not guarantee unbiased estimates, and when returned to the original scale, a bias is introduced, requiring an appropriate adjustment to avoid introducing a large bias in the estimates [
89,
90]. The transformation of PCs may have introduced bias in the estimation by OLS (
Figure 5b), but this has not been quantified. The estimate by the RF method, on the other hand, had similar behaviors, both according to RMSE (%) of the variables and to the bias. Some issues can influence the estimates with the RF [
28]: the number of built decision trees, the number of variables randomly sampled as candidates at each split, and the number of training samples. According to the same authors, the amount of training data is an important issue when using RF, and was confirmed by [
16], who concluded that from 30% of the sample size, the method tends to improve and stabilize the RMSE (%) and bias. As the number of training data in this study was low, they may have negatively influenced the estimates with the RF.
Comparing all
kernels for the SVM regression method, the linear model produced the least accurate estimates, mainly with the input of 54 LiDAR metrics. This may indicate that the training patterns are not linearly separable, presenting the largest RMSE (%) values and underestimating five of the seven estimated variables (
Figure 5). In a forest located in the French Alps, the SVM technique was assessed with both a linear and a radial
kernel, to estimate some forest parameters [
91]. The mathematical combination of some metrics, as well as the use of PCA, to reduce the dimensionality of the data, were effective when using the linear
kernel. In
Figure 5a, the use of PCAs significantly improved the estimate with SVM–L and SVM-R, but in our case, even removing the most correlated variables, a less accurate result was obtained with the radial
kernel. In addition, the same authors commented that the presence of outliers and the risk of overfitting in the SVM models can reduce the estimates by this method. In the estimate of the volume in commercial plantations of
Eucalyptus spp., [
13,
17] used SVM with the radial base function
kernel. Both authors mentioned the great estimation power of the SVM, but compared to the other methods, it presented slightly higher RMSE (%) values. This behavior was also observed in this study, in which there was a small difference between the polynomial and radial
kernel for the average value of RMSE (%) in the estimates, and was more evidenced with the use of PCs as inputs (22.9% for SVM–5–P and 16.7% for SVM–5–R; 23.7% and 19.9% for SVM–15–P and SVM–15–R, respectively; and for SVM–54–P, 18.7% and 24.9% for SVM–54–R), but the values were slightly higher than those found for the RF (
Figure 5a), for example.
The previous analysis was focused on the comparison of machine learning techniques for estimating forest variables. The following discussions will emphasize the comparison of the estimated variables. To the best of our knowledge, there are no studies estimating stand and diversity variables for native Brazilian Atlantic forests, and there are very few related to tropical forests, most of them focusing on biomass estimation. Thus, our comparisons were made with studies that estimated the same stand and diversity variables but for native forests in other countries.
Table 5 shows the RMSE (%) values obtained for each variable and the respective regression method that provided the best estimate. The MDBH was the variable estimated with higher accuracy (RMSE of 5.6%). Our results were better than those presented at [
91] whose RMSE value was 14.6% and at [
82] whose RMSE was 33%. In the aforementioned studies, greater variability of MDBH was observed among survey plots, which may have resulted in higher RMSE values. In addition, our best result was achieved using the PCs with the ANN, while in those studies, multiple linear regressions using raw LiDAR metrics were performed. A similar observation was done about the results obtained for the QMD variable. The stepwise method was used by [
90] to select the metrics that would feed the multiple linear regression model, and they estimated the QMD with a deviation from 12.5% to 14%. Other authors [
92] also used multiple linear regression, and achieved deviations of 15.4% and 30.5% for the QMD, while our best result had a deviation (i.e., RMSE) of 5.2%.
Vincent et al. [
93] estimated the forest variables QMD, BA, and DEN in a tropical forest in French Guiana, using simple and multiple linear regression with LiDAR metrics and stand variables as inputs in various forest sites, such as mature, explored, and secondary forests. Adjusting general and specific equations by site, the regression by forest site showed lower RMSE values for BA and DEN (7.9% and 9.1%, respectively). For the QMD, the regression for the whole area better estimated this variable, with an RMSE of 4.9%, while DEN presented slight variations compared to that found in this study, in the best case (16.5%), BA already presented greater errors. Some authors [
80,
82,
90,
91,
92] have studied natural boreal and temperate forests, reporting the difficulty in determining these variables using LiDAR metrics. They achieved RMSE ranges for BA between 18 and 46.8% and for DEN between 18.4 and 128.6%.
The relationships of the basal area with density within the forest structure are very complex, varying according to spacing and the stage of forest development, among others. This results in patterns that are more difficult to interpret and consequently estimate. Thus, there is a set of assumptions and site-specific considerations that must be made before estimating these highly variable variables [
17]. This confirms the results of [
93], who improved the estimates by separating the forest into smaller sites. The same analogy for the variable NTS can be done, which varies greatly in different types and stages of forest development, especially for a tropical forest. In a natural forest in southern England, [
82] estimated NTS using LiDAR metrics and individual tree crown metrics as inputs in multiple linear regression. As a result, the RMSE (%) in that study was 25%, while our result was 27.6%. This means that, regardless of the forest typology, the variables BA, DEN, and NTS are difficult to estimate with LiDAR metrics.
Diversity indexes give more valuable data than the number of species since they provide information on the diversity and floristic composition of the forest. Due to the high variability within the site and the leaf-off and leaf-on conditions of the trees, [
46] estimated the Shannon–Waver and Simpson indexes with an RMSE of 37 and 24%, respectively, while these indexes were estimated in this study, respectively, with a RMSE of 10 and 8.4%.
Considering all issues, such as heterogeneous tropical forest, low field sample size, and the criteria used to select the best results (lowest value of RMSE (%), bias (%) close to zero, and low value of AICc) a neural network with complex architecture (two and three hidden layers) may overfit sampled data. As stated by [
86], the use of one hidden layer is usually enough to solve problems using ANNs, however, an erroneous configuration of neurons inside the hidden layer can also cause overfitting. Thus, for future studies, it would be recommended to test ANN with one hidden layer, but varying the number of neurons, as it was done by [
82,
83,
84,
85].
5. Conclusions
The results obtained in this work demonstrated that it is feasible to use LiDAR metrics to estimate forest variables in a tropical forest with a particular focus on the Atlantic Forest of Brazil, using LiDAR metrics with different machine learning approaches.
Methods to reduce the data dimensionality or selection of variables were of particular importance to achieve the results presented, mainly using the principal component analysis (PCA). In this case, the combination of metrics of elevation, intensity, and pulse returns allowed the relevant information in these metrics to be contained on principal components (PCs).
Considering the adopted criteria for choosing the best modeling technique, principal components (PCs) as new variables for artificial neural networks (ANNs) achieved the best results. ANNs with two hidden layers better estimated the mean diameter at breast height (MDBH), quadratic mean diameter (QMD), basal area (BA), and density (DEN) variables. Three hidden layers were the best ANNs for a number of tree species (NTS) variables, Shannon–Weaver (H’) and Simpson (D) diversity indexes.
For ANN, the predictor variables with the greatest contribution to the estimation of forest variables, were the fifth PC, for the MDBH; the second PC for QMD and BA; the fourth PC for DEN; the first PC for NTS, and the third PC for the H’and D indices.
While ANN was the most suitable regression technique for estimating the studied variables, support vector machine (SVM) with linear kernel, using 54 LiDAR metrics as input data, presented the worst performance, with the highest RMSE values (%) and more biased estimates.
It is important to note that it is a pioneering study to estimate the population and diversity variables of this type of tropical forest, and the results presented can be improved later with more samples of field data and different areas for later validation. Nevertheless, these findings can be applied in the management and preservation of these endangered forest remnants with LiDAR data.


 ,
, 


