Article

Retrieval of High Temporal Resolution Aerosol Optical Depth Using the GOCI Remote Sensing Data

Key Laboratory of Virtual Geographic Environment of Ministry of Education, Jiangsu Center for Collaborative Innovation in Geographical Information Resource Development and Application, College of Geographic Science, Nanjing Normal University, Nanjing 210023, China
*
Author to whom correspondence should be addressed.
Remote Sens. 2021, 13(12), 2376; https://doi.org/10.3390/rs13122376
Submission received: 17 May 2021 / Revised: 11 June 2021 / Accepted: 12 June 2021 / Published: 18 June 2021

Abstract

:
High temporal resolution aerosol optical depth (AOD) products are very important for the studies of atmospheric environment and climate change. Geostationary Ocean Color Imager (GOCI) is a suitable data source for AOD retrieval, as it can monitor hourly aerosol changes and make up for the low temporal resolution deficiency of polar orbiting satellite. In this study, we proposed an algorithm for retrieving high temporal resolution AOD using GOCI data and then applied the algorithm in the Yangtze River Delta, a typical region suffering severe air pollution issues. Based on Moderate-resolution Imaging Spectroradiometer (MODIS) surface reflectance determined by MODIS V5.2 algorithm and MODIS Bidirectional Reflectance Distribution Function (BRDF) data, after spectral conversion between MODIS and GOCI, the GOCI surface reflectance at different solar angles were obtained and used to retrieve AOD. Five indicators including correlation coefficient (R), significant level of the correlation (p value), mean absolute error (MAE), mean relative error (MRE) and root mean square error (RMSE) were employed to analyze the errors between the Aerosol Robotic Network (AERONET) observed AOD and the GOCI retrieved AOD. The results showed that the GOCI AOD retrieved by the continental aerosol look-up table was consistent with the AERONET AOD (R > 0.7, p ≤ 0.05). The highest R value of Taihu Station and Xuzhou CUMT Station are both 0.84 (8:30 a.m.); the minimum RMSE at Taihu and Xuzhou-CUMT stations were 0.2077 (11:30 a.m.) and 0.1937 (10:30 a.m.), respectively. Moreover, the results suggested that the greater the solar angle of the GOCI sensor, the higher the AOD retrieval accuracy, while the retrieved AOD at noon exhibited the largest error as assessed by MAE and MRE. We concluded that the inaccurate estimation of surface reflectance was the root cause of the retrieval errors. This study has implications in providing a deep understanding of the effects of solar angle changes on retrieving AOD using GOCI.

1. Introduction

Atmospheric aerosol is the general term for solid and liquid particles suspended in the atmosphere, mainly come from natural sources such as fine ash and dust lifted by the wind, salt particles, volcanic eruption and from human activities the burning of fossil and non-fossil fuels, transportation, and industrial dust [1]. Atmospheric aerosols have an important impact on the radiation budget of the earth climate system and threaten human health [2,3,4]. Aerosol optical depth (AOD) is the most basic optical characteristic of aerosols, and thus it is a key indicator for evaluating aerosol radiative forcing [5]. Sun photometers can obtain detailed aerosol optical parameters and then the AOD can be estimated, but due to the large variability of the chemical composition and life cycle of atmospheric aerosols, ground stations are not enough to accurately observe and evaluate the spatial distribution characteristics of atmospheric aerosols on a large spatial scale such as regional or global scale. The method of retrieving AOD products using satellite remote sensing provides supports for investigating the climate effects of aerosols and monitoring regional air pollution.
Since the mid-1970s, researchers began to use remote sensing data to retrieve the ocean aerosol optical thickness. More new satellite sensors have been put into use after the 21st century, making the data sources of aerosol remote sensing monitoring and retrieval more abundant. For example, Lee et al. [6] use a look-up table (LUT) separation technology to retrieve the AOD using the Geostationary Ocean Color Imager (GOCI), and the results show that this method can obtain the results of daily monitoring of atmospheric aerosol load, it is very useful for environmental regulatory agencies. Based on the characteristics of GF-1 remote sensing data, Zhang et al. [7] studied the method and data processing procedure of AOD retrieval by using dark targets and dark blue algorithms, and the results show that the uncertainty of GF-1 retrieval is mainly affected by cloud pollution, high surface reflectance and assumed aerosol model. Fan et al. [8] proposed an AOD retrieval method based on the HJ-1 A/B charge coupled device (CCD) visible light band and found that the AOD retrieved from the HJ-1 A/B CCD data presented the same spatial patterns and trends with the AOD products in Moderate Resolution Imaging Spectroradiometer (MODIS). Bilal et al. [9] used the minimum reflectance technique for Landsat 8 images with a resolution of 30 m to construct a ground reflectance database and combined it with the simplified aerosol retrieval algorithm (SARA) to retrieve AOD. Olivier et al. [10] considered the differences between different sensors and used Landsat 5 and Landsat 7 data to fit the empirical relationship between the reflectance of the shortwave infrared band and the red and blue bands, and they also considered the applicability of the surface type and only selected pixels with NDVI greater than 0.2 to build the model. Carrer et al. [11] found that the AERUS-GEO products had advantages in monitoring specific aerosol activities (such as volcanic eruptions) in both spatial and temporal resolution. The optimal interpolation Spinning Enhanced Visible and Infrared Imager (SEVIRI) AOD near-real-time (NRT) algorithm can obtain the possibility of AOD mapping with high time resolution (15 min), but there are requirements for ground observation AOD values, which makes it impossible to achieve AOD retrieval in areas without ground observation points [12]. Zhang et al. [13] used GOCI data to determine the surface reflectance using the minimum reflectance technique, and then retrieved the AOD in northern China, and the validation results showed that GOCI data was suitable for aerosol retrieval on land. Choi et al. [14] used the minimum reflectance technique to calculate the land surface reflectance, and then retrieved the AOD, fine particle ratio, single scattering albedo and angstrom exponent with 6 km × 6 km spatial resolution. Choi et al. [15] also improved the cloud mask and the method of determining the reflectance of the ground surface to further improve the accuracy of the retrieval.
The sources of aerosols and air pollution are complex in actual situations. Satellite observation data once or twice a day cannot provide comprehensive information for monitoring the air pollution changes within one day, and high temporal resolution aerosol monitoring can timely obtain the information of atmospheric particles, which can help with the monitor of air pollution changes. The GOCI is stationary relative to the monitoring area. It scans the area 8 times a day from 8:30 a.m. to 15:30 p.m. Beijing time, and 8 images with a time interval of 1 h can be achieved [6]. It can be sustained in a high time frequent manner, and observing rapid changes in the land, ocean and atmosphere have broad application prospects in remote sensing of water bodies and atmospheric aerosols. The previous research only proposed possible errors in the GOCI AOD obtained every hour [16] and did not thoroughly analyze the root cause of the errors that occur with the change of the sun’s angle every hour of the day.
Therefore, this study intends to use GOCI data to develop the AOD retrieval process and validate it with ground observations and then analyze the reasons of causing the errors. Section 2 introduces the data and processing operations used in this study and elaborates the retrieval algorithm and process in detail. Section 3 applies the results to the more polluted Yangtze River Delta region. Section 4 compares the results of the retrieval with the ground AERONET data and analyzes the causes of errors.

2. Materials and Methods

2.1. GOCI Data

On 26 June 2010, South Korea launched the world’s first geostationary ocean color satellite onboard Imager (GOCI), which is mounted on the Communication, Ocean and Meteorological Satellite (COMS) [6]. It contains eight bands, the first, second and third bands are all blue bands (Table 1). GOCI sensor is mainly used to continuously detect ocean water color at high time and frequency from a stationary remote sensing platform, and to study the changing processes of the ocean, land, and atmosphere. The GOCI satellite is centered on 130 ° E longitude and 36 ° N latitude to observe the earth, with a spatial resolution of 500 m and a fixed coverage area of 2500 km × 2500 km. It scans the area 8 times every day from 8:30 a.m. to 15:30 p.m. Beijing time, and obtain 8 images with a time interval of 1 h. The data can be achieved from http://kosc.kiost.ac.kr/gociSearch/list.nm?menuCd=50&lang=en&url=gociSearch (accessed on 20 April 2021) [16,17,18].
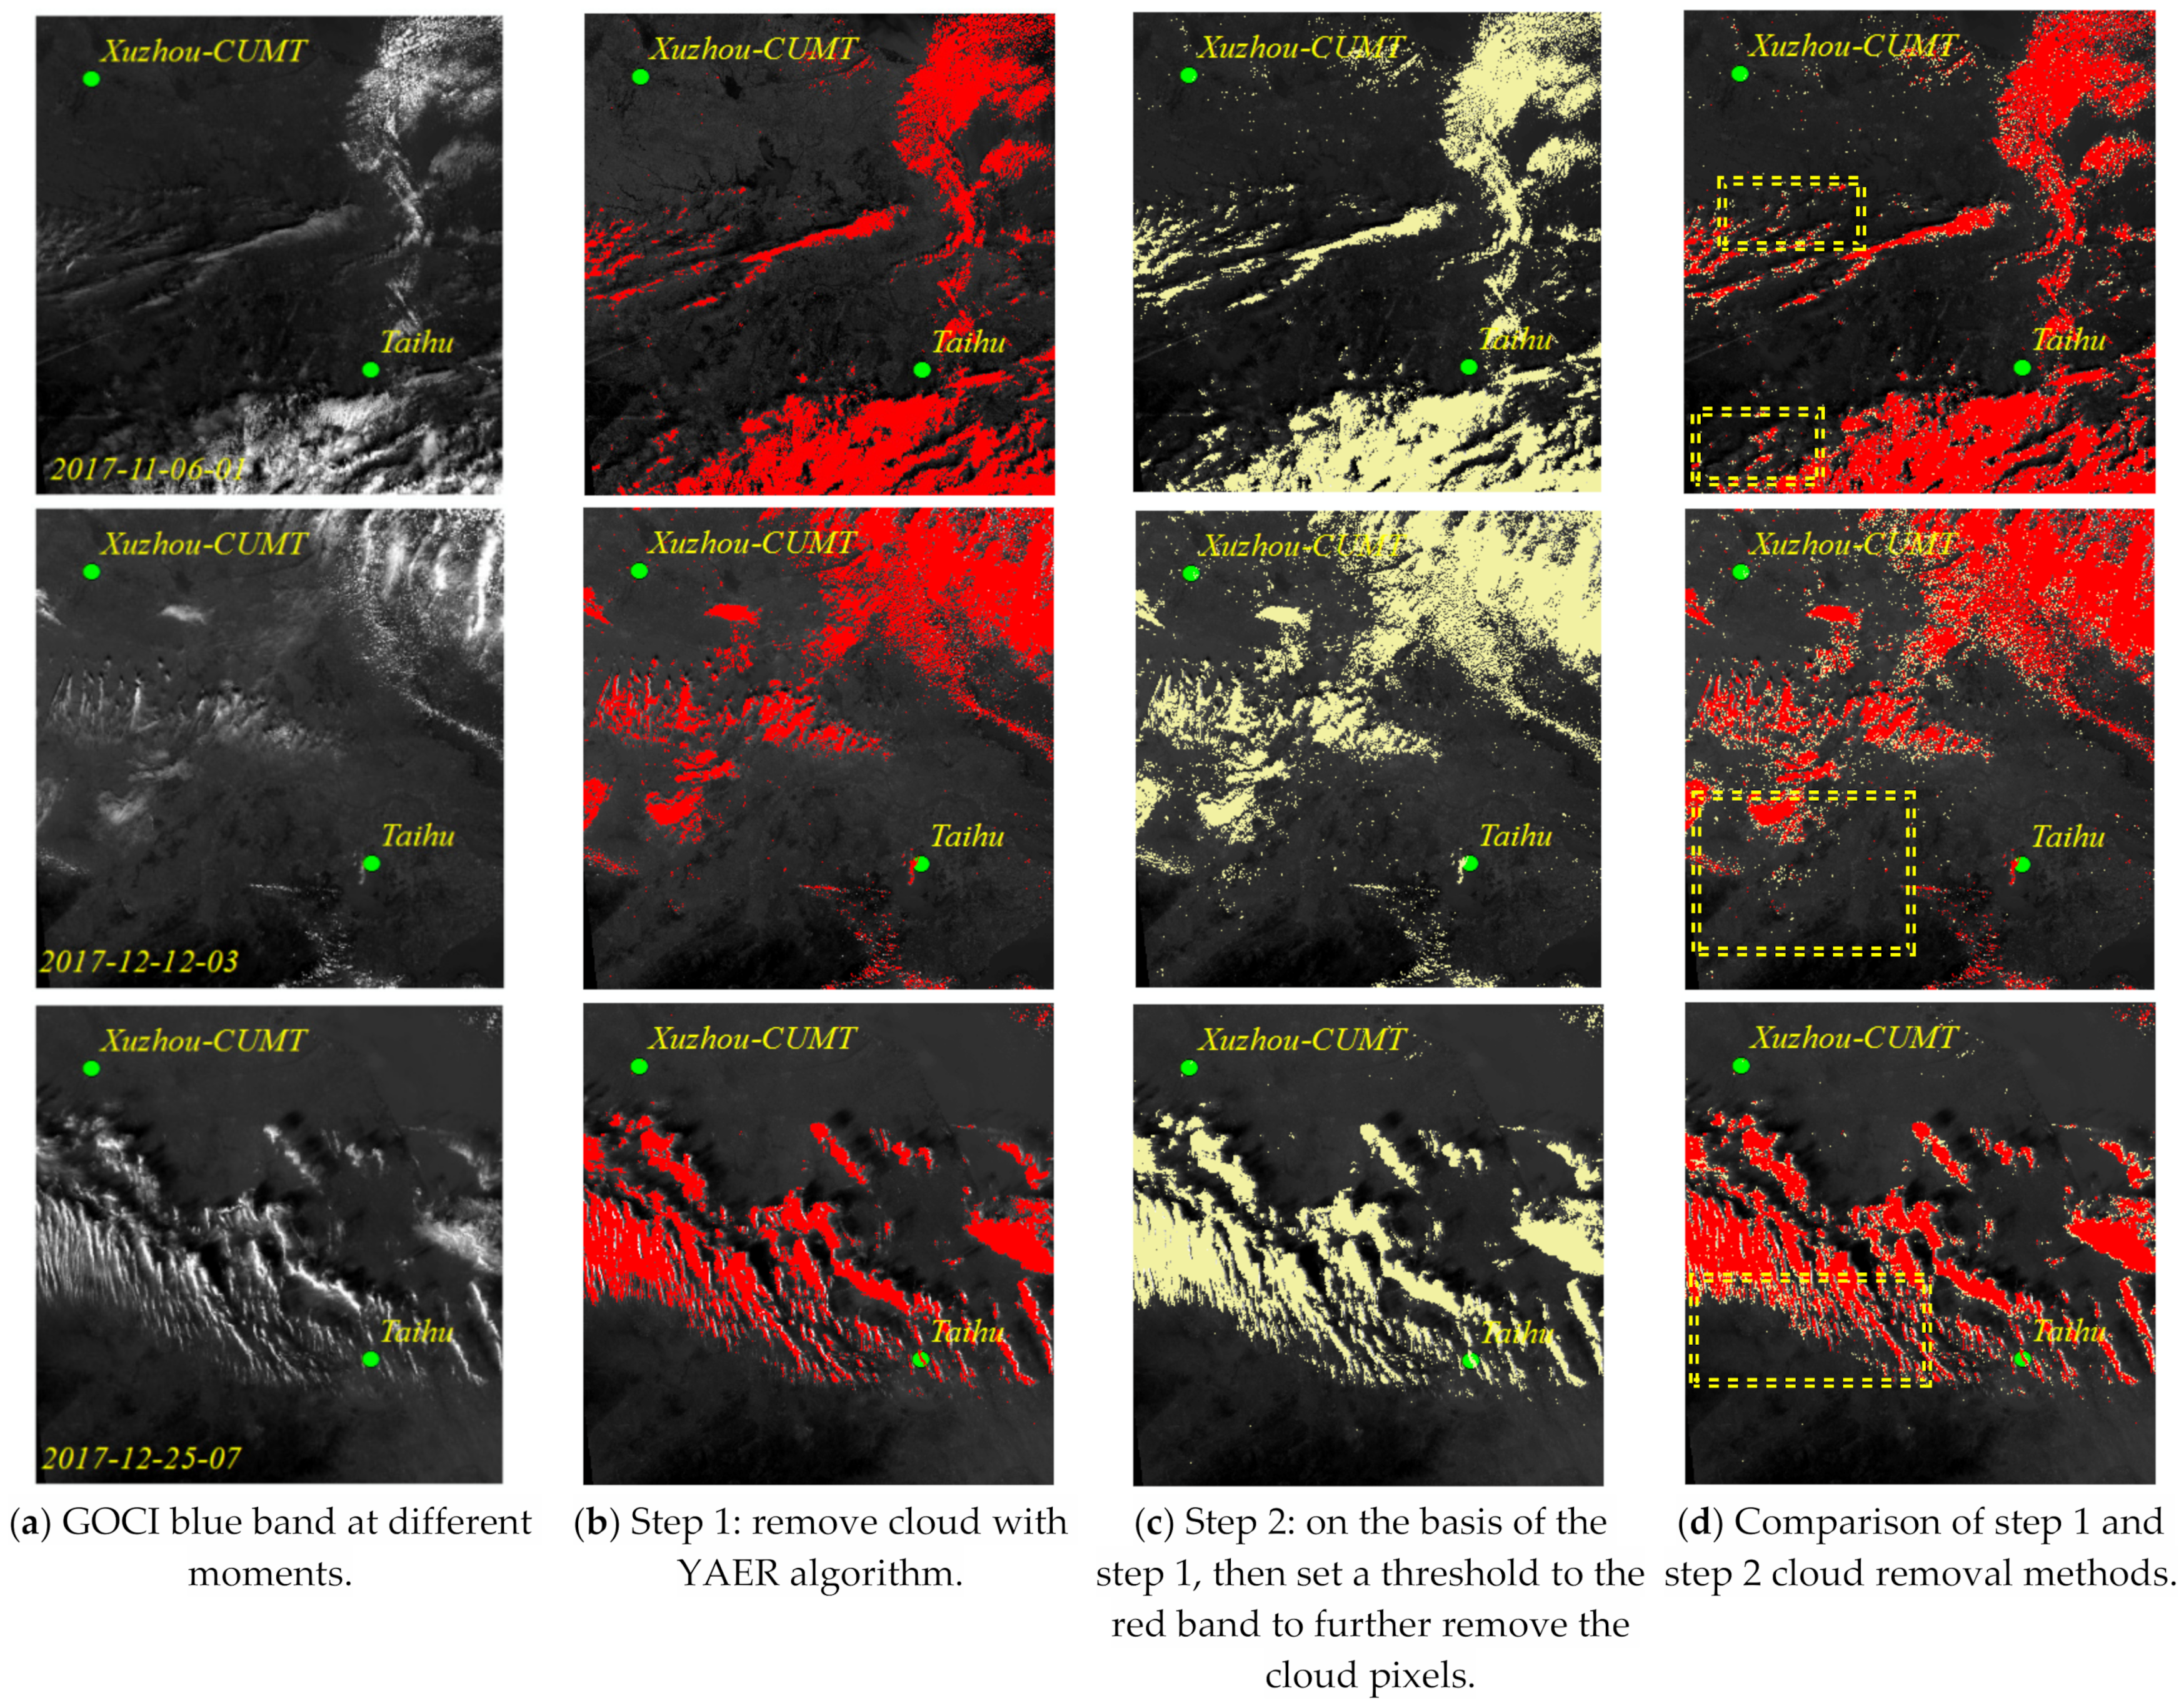
To exclude the influence of cloud pixels on aerosol retrieval, this study selected GOCI L1B data for a total of 498 days with less cloud cover from 2017 to 2018. We used the GOCI Data Processing System (GDPS) software to crop and correct the Rayleigh scattering of the image, and we used interactive data language (IDL) to convert the data to Universal Transverse Mercator (UTM) projection, and then the data obtained included solar zenith angle, solar azimuth angle, satellite view zenith angle, satellite view azimuth angle, and apparent reflectance data of eight bands. The land cloud mask method of the Yonsei aerosol retrieval (YAER) algorithm is used to remove the cloud of GOCI data. Specifically, the standard deviation of 3 × 3 window pixels in the third band of GOCI and the apparent reflection in the first band of GOCI are used to identify cloud pixels by setting a threshold [14], then, the red band apparent reflectance is used to set a threshold to further remove the cloud pixels, the pixels with the red band apparent reflectance greater than 0.25 are regarded as cloud pixels. Finally, we utilized GOCI B3 blue band data for AOD retrieval. This study uses the Normalized Difference Vegetation Index (NDVI) to identify water pixels. When NDVI < 0, we judge that the pixel is water and remove the data of the pixel.

2.2. MODIS L1B/MODIS BRDF Data

The Moderate resolution Imaging Spectroradiometer (MODIS) is the main optical remote sensing equipment mounted on the Earth Orbit Observation (LEO) Terra and Aqua satellites, with 36 spectral channels distributed in the electromagnetic spectrum range of 0.4~14 μm [19,20]. MODIS data has obvious features of wide band range, fast data update frequency, and free reception in the world [21]. The data used in this study is MODIS L1B data from 2017 to 2018, which is from NASA data center (https://ladsweb.modaps.eosdis.nasa.gov (accessed on 10 September 2020)). We selected MODIS L1B level data including radiation data (MOD02/MYD02) and geolocation data (MOD03/MYD03). The MOD02/MYD02 data are reflectance and emissivity data that have not undergone atmospheric correction but contain geographic coordinate information. The preprocessing of MODIS L1B includes geometric correction and clipping of reflectance and angle data. We used MODIS L1B data and based on the MODIS v5.2 algorithm theory to calculate the MODIS surface reflectance in Section 2.4.2.
MODIS BRDF/albedo, a land level 3 standard data product, was also used in this study. MODIS BRDF products have the characteristics of high time resolution, high spatial resolution, full spectrum coverage, and global imaging [22,23,24]. The core data set of the product is MCD43A1, which implements the RossThick-LiSparseR semi-empirical BRDF model (RTLSR), and provides information on MODIS 1-7 bands and the other three bands. The BRDF model parameter product used in this study is MCD43A1, which stores the 3 parameters of the RTLSR model obtained from 16-day high-quality surface reflection data retrieval [2,25,26]. The nominal spatial resolution of MCD43A1 products is 500 m. MCD43A1 C6 is produced daily, every 16 days is a cycle, and provides daily data of global surface albedo. The daily data is estimated by assigning a certain weight to the observed value of the 9th day in the 16-day retrieval cycle.

2.3. AERONET AOD Products

Global Aerosol Robotic Network (AERONET) is a global aerosol optical characteristics monitoring network established by NASA [8,27,28]. AERONET observation parameters include AOD, single scattering albedo, birefringence index, and scattering phase function, etc., by measuring the radiance of different bands, different directions, and different times, the solar photometer can obtain the AOD of the whole atmosphere layer. AERONET data have been commonly used in the verification of global aerosol transport and aerosol retrieval results [4,29,30]. The number of samples of data available at AERONET 2.0 level is very limited, and thus to ensure enough verification data, this study uses AERONET 1.5 level data (AERONET version 3) to verify the retrieval results [31,32]. Two stations in Taihu and Xuzhou-CUMT were used to verify our retrieved AOD in this study (Table 2). The AOD provided by the Second Simulation of the Satellite Signal in the Solar Spectrum (6S) is the data at the band of 550 nm, but the data released by AERONET does not have 550 nm AOD data. Therefore, the AOD data of other bands (440 nm, 870 nm, 1020 nm) provided by AERONET are used to fit the AERONET AOD value of 550 nm through Equation (1), which is used to verify the AOD retrieved from remote sensing:
τ ( λ ) = β λ α
where α is the size of the particles and β is the atmospheric turbidity coeffcient.

2.4. Framework of the AOD Retrieval Algorithm

2.4.1. Theoretical Basis

The retrieval of aerosol over land by remote sensing uses the apparent reflectance ρTOA of land observed by upper atmospheric satellite [33]. ρTOA is expressed as:
ρ T O A = π L λ E S U N λ cos θ s
where Lλ is the radiance at the top of the atmosphere, ESUNλ is the solar irradiance at the top of the atmosphere, and θs is the solar zenith angle.
Assuming that the surface of the Earth is Lambertian, the atmosphere changes uniformly in the vertical direction, the reflectance of the satellite to the top of the atmosphere is as shown in Equation (3) [33,34,35]:
ρ T O A ( θ s , θ v , ϕ ) = ρ o ( θ s , θ v , ϕ ) + T ( θ s ) T ( θ v ) ρ s ( θ s , θ v , ϕ ) 1 ρ s ( θ s , θ v , ϕ ) S
where θs and θν are the solar zenith angle and satellite view zenith angle, respectively. Φ = ϕsϕν is the relative azimuth angle, ϕs and ϕν are the solar azimuth angle and satellite view azimuth angle, respectively, ρTOA is the reflectance of the satellite to the top of the atmosphere, ρo is the equivalent reflectance of the atmosphere, ρs is the surface reflectance, T(θs) and T(θν) are the downward atmospheric transmittance and the upward atmospheric transmittance, respectively. S is the downward hemispherical reflectance of the bottom of the atmosphere. The method of solving AOD is based on the radiative transfer equation, and the atmospheric correction is also based on this theory. AOD retrieval is the inverse process of atmospheric correction. Therefore, in order to retrieve AOD, it is necessary to use the surface reflectance as a known quantity. The overall flow chart of GOCI AOD retrieval is shown in Figure 1.

2.4.2. Determination of Surface Reflectance

Separating the surface reflectance and atmospheric reflectance from the apparent reflectance is one of the key and difficult problems in aerosol retrieval, because in most cases, aerosol and other signals are relatively weak compared to the surface signal. The study by Kaufman et al. [5] showed that in aerosol retrieval, an error of 0.01 in the surface reflectance will lead to an error of 0.1 in the retrieval result, so accurate estimation of the surface reflectance is an important basis for aerosol retrieval.
The GOCI sensor lacks the mid-infrared 2.12 μm channel and cannot directly calculate the surface reflectance of the red and blue channels. Therefore, this study uses the linear kernel-driven BRDF model to simulate and calculate the surface bidirectional reflectance under the observation geometric angles of the MODIS and GOCI corresponding bands. Combined with the ground reflectance determined by the MODIS V5.2 algorithm, the MODIS reflectance under the geometric angle of GOCI observation is determined by calculation [36,37], the Equation is as follows:
ρ ( θ s , θ v , ϕ ) G O C I = ρ ( θ s , θ v , ϕ ) M O D I S × B R D F ( θ s , θ v , ϕ ) G O C I B R D F ( θ s , θ v , ϕ ) M O D I S
where BRDF(θs,θν,ϕ)GOCI and BRDF(θs,θν,ϕ)MODIS are the BRDF data obtained from GOCI and MODIS perspectives, respectively. θs, θν and ϕ are the solar zenith angle, satellite view zenith angle and relative azimuth angle, respectively. ρ(θs,θν,ϕ)GOCI is the surface reflectance of MODIS under GOCI observation geometry. ρ(θs,θν,ϕ)MODIS is the surface reflectance of MODIS obtained by the MODIS v5.2 algorithm.
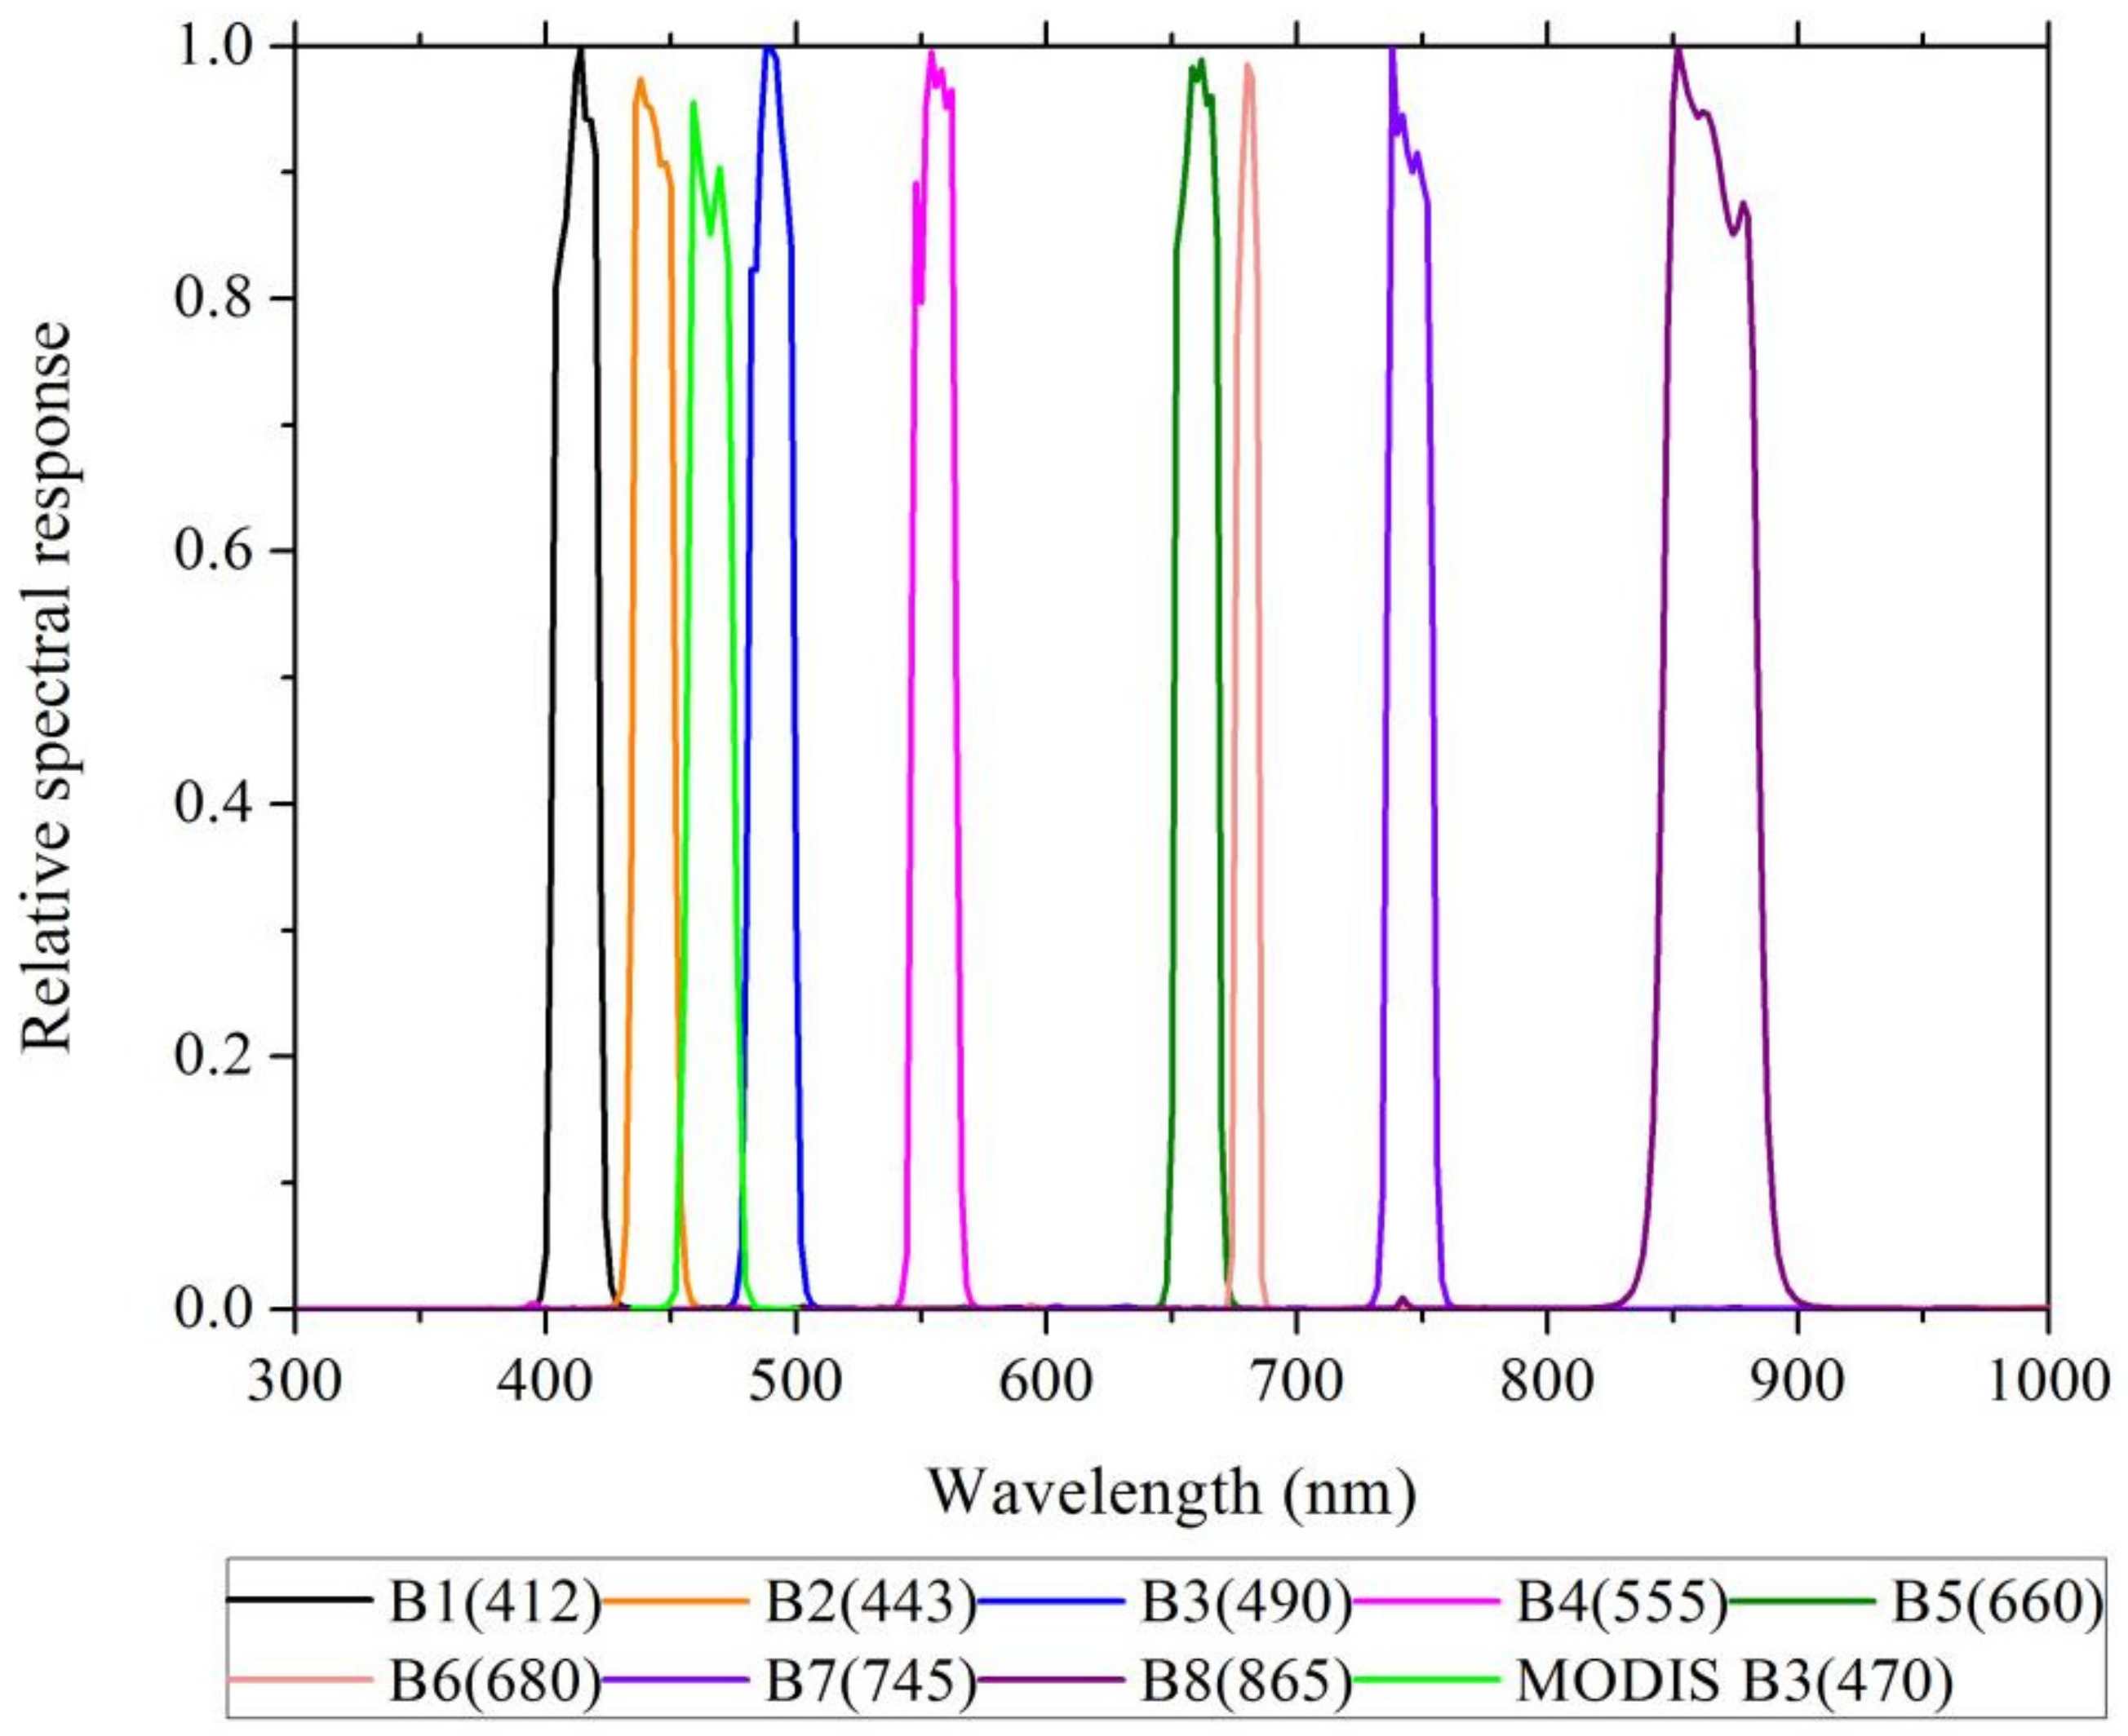
In this study, the GOCI blue band is used for the retrieval of AOD. The GOCI sensor B1, B2 and B3 bands are all blue bands (the spectral response function is shown in Figure 2). The study selects the GOCI B3 band to match the MODIS corresponding blue band. To the differences in the spectral response function and wavelength range of the GOCI and MODIS sensors, the next step is to convert the MODIS surface reflectance to GOCI surface reflectance, and reduce the error caused by directly using the surface reflectance determined by MODIS data as the true surface reflectance of GOCI.
Using the spectral database that comes with the ENVI software, the spectral data of 26 typical features are selected, and the convolution operation is performed using Equation (5) to obtain the surface reflectance of different features in the MODIS and GOCI blue bands:
R = λ 1 λ 2 S ( λ ) R ( λ ) d λ λ 1 λ 2 S ( λ ) d λ = i = 0 n 1 S ( λ i ) R ( λ i ) Δ λ i = 0 n 1 S ( λ i ) Δ λ
where λ1 and λ2 are the upper and lower limits of the integrated wavelength, respectively. S(λi) is the band response value of the sensor when the wavelength is λ1, and Ri) is the surface reflectance of the corresponding band.
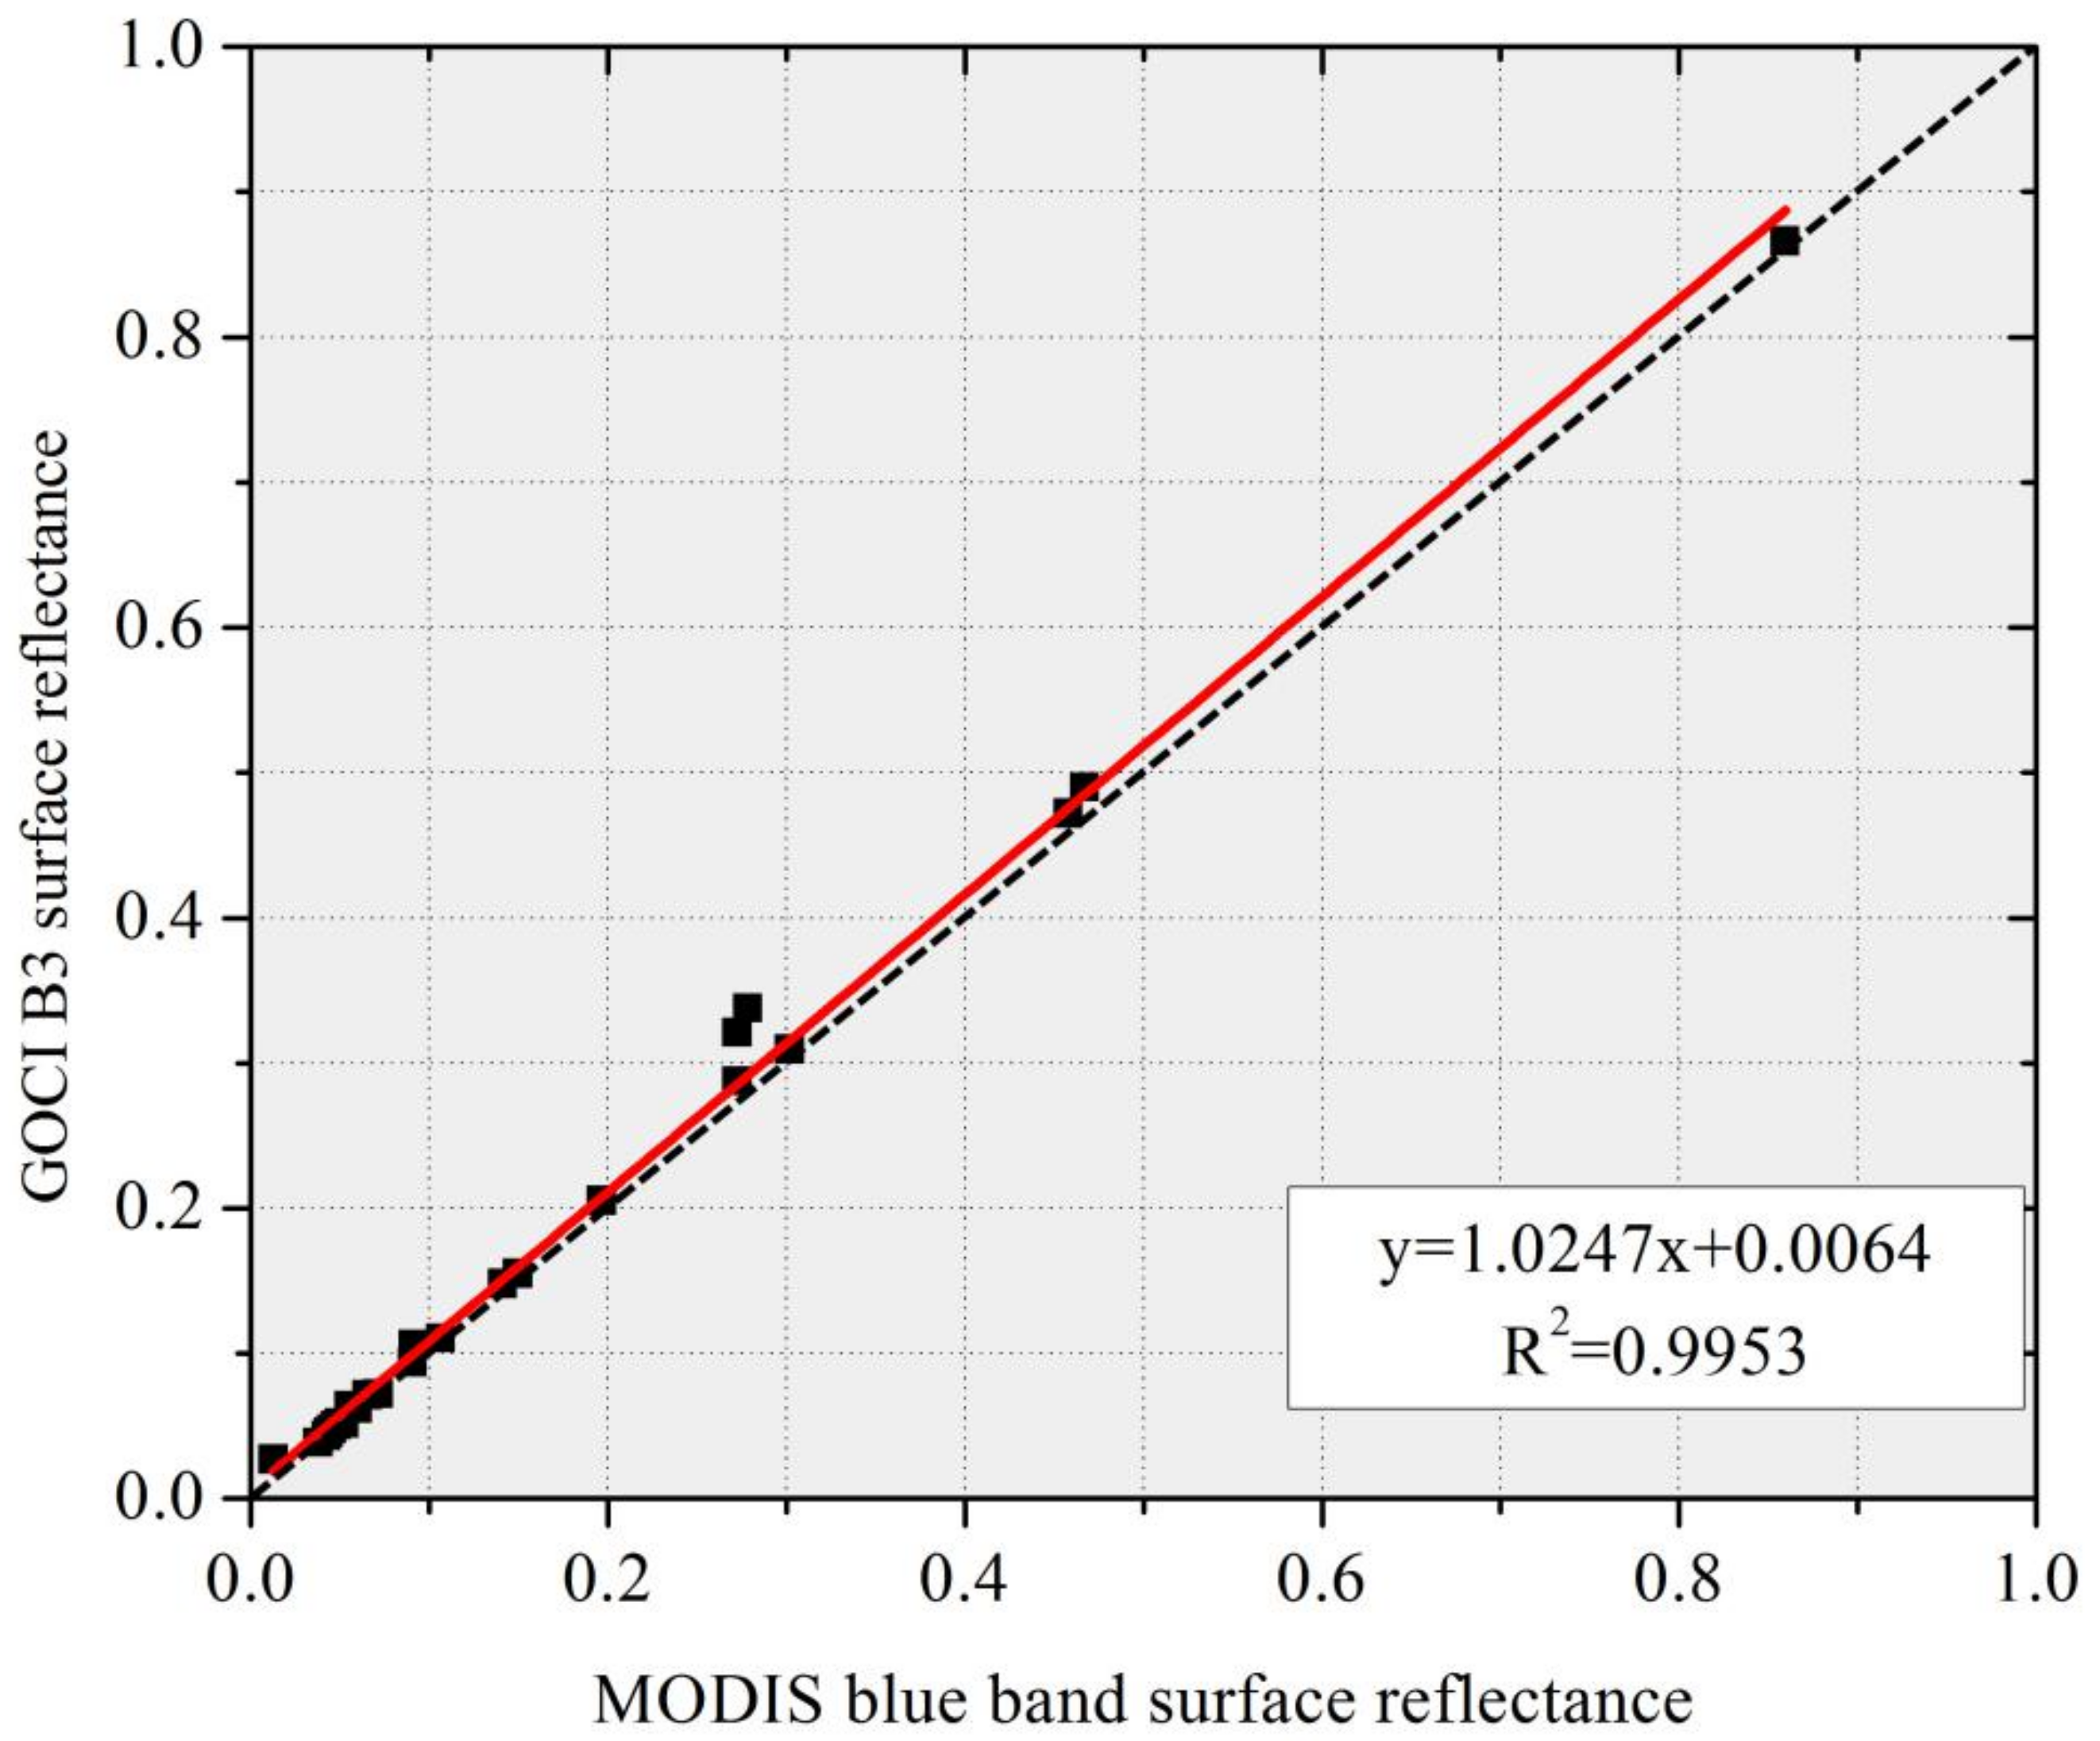
Using the band response function of GOCI and MODIS sensors in the blue band, linear regression analysis is performed on the ground object spectrum data (Figure 3). It can be seen that there is a certain difference in reflectance between MODIS and GOCI sensors in the blue band. In general, the surface reflectance of GOCI is greater than that of MODIS. The conversion model is shown in Equation (6), and the fit is above 99%.
ρ G O C I = ρ M O D I S × 1.0247 + 0.0064

2.4.3. Aerosol Lookup Table

To quickly and conveniently use the radiation transfer equation to calculate AOD, the study constructed a blue-band look-up table based on the GOCI spectral response function and the 6S in different atmospheric models, aerosol types, climate and other parameter conditions (Table 3). The mid-latitude summer atmospheric model and the mid-latitude winter atmospheric model are selected respectively, and aerosol type is continental aerosol. The results show that the continental aerosol can widely describe the aerosol status in the study area [38,39,40].

3. The Study Area

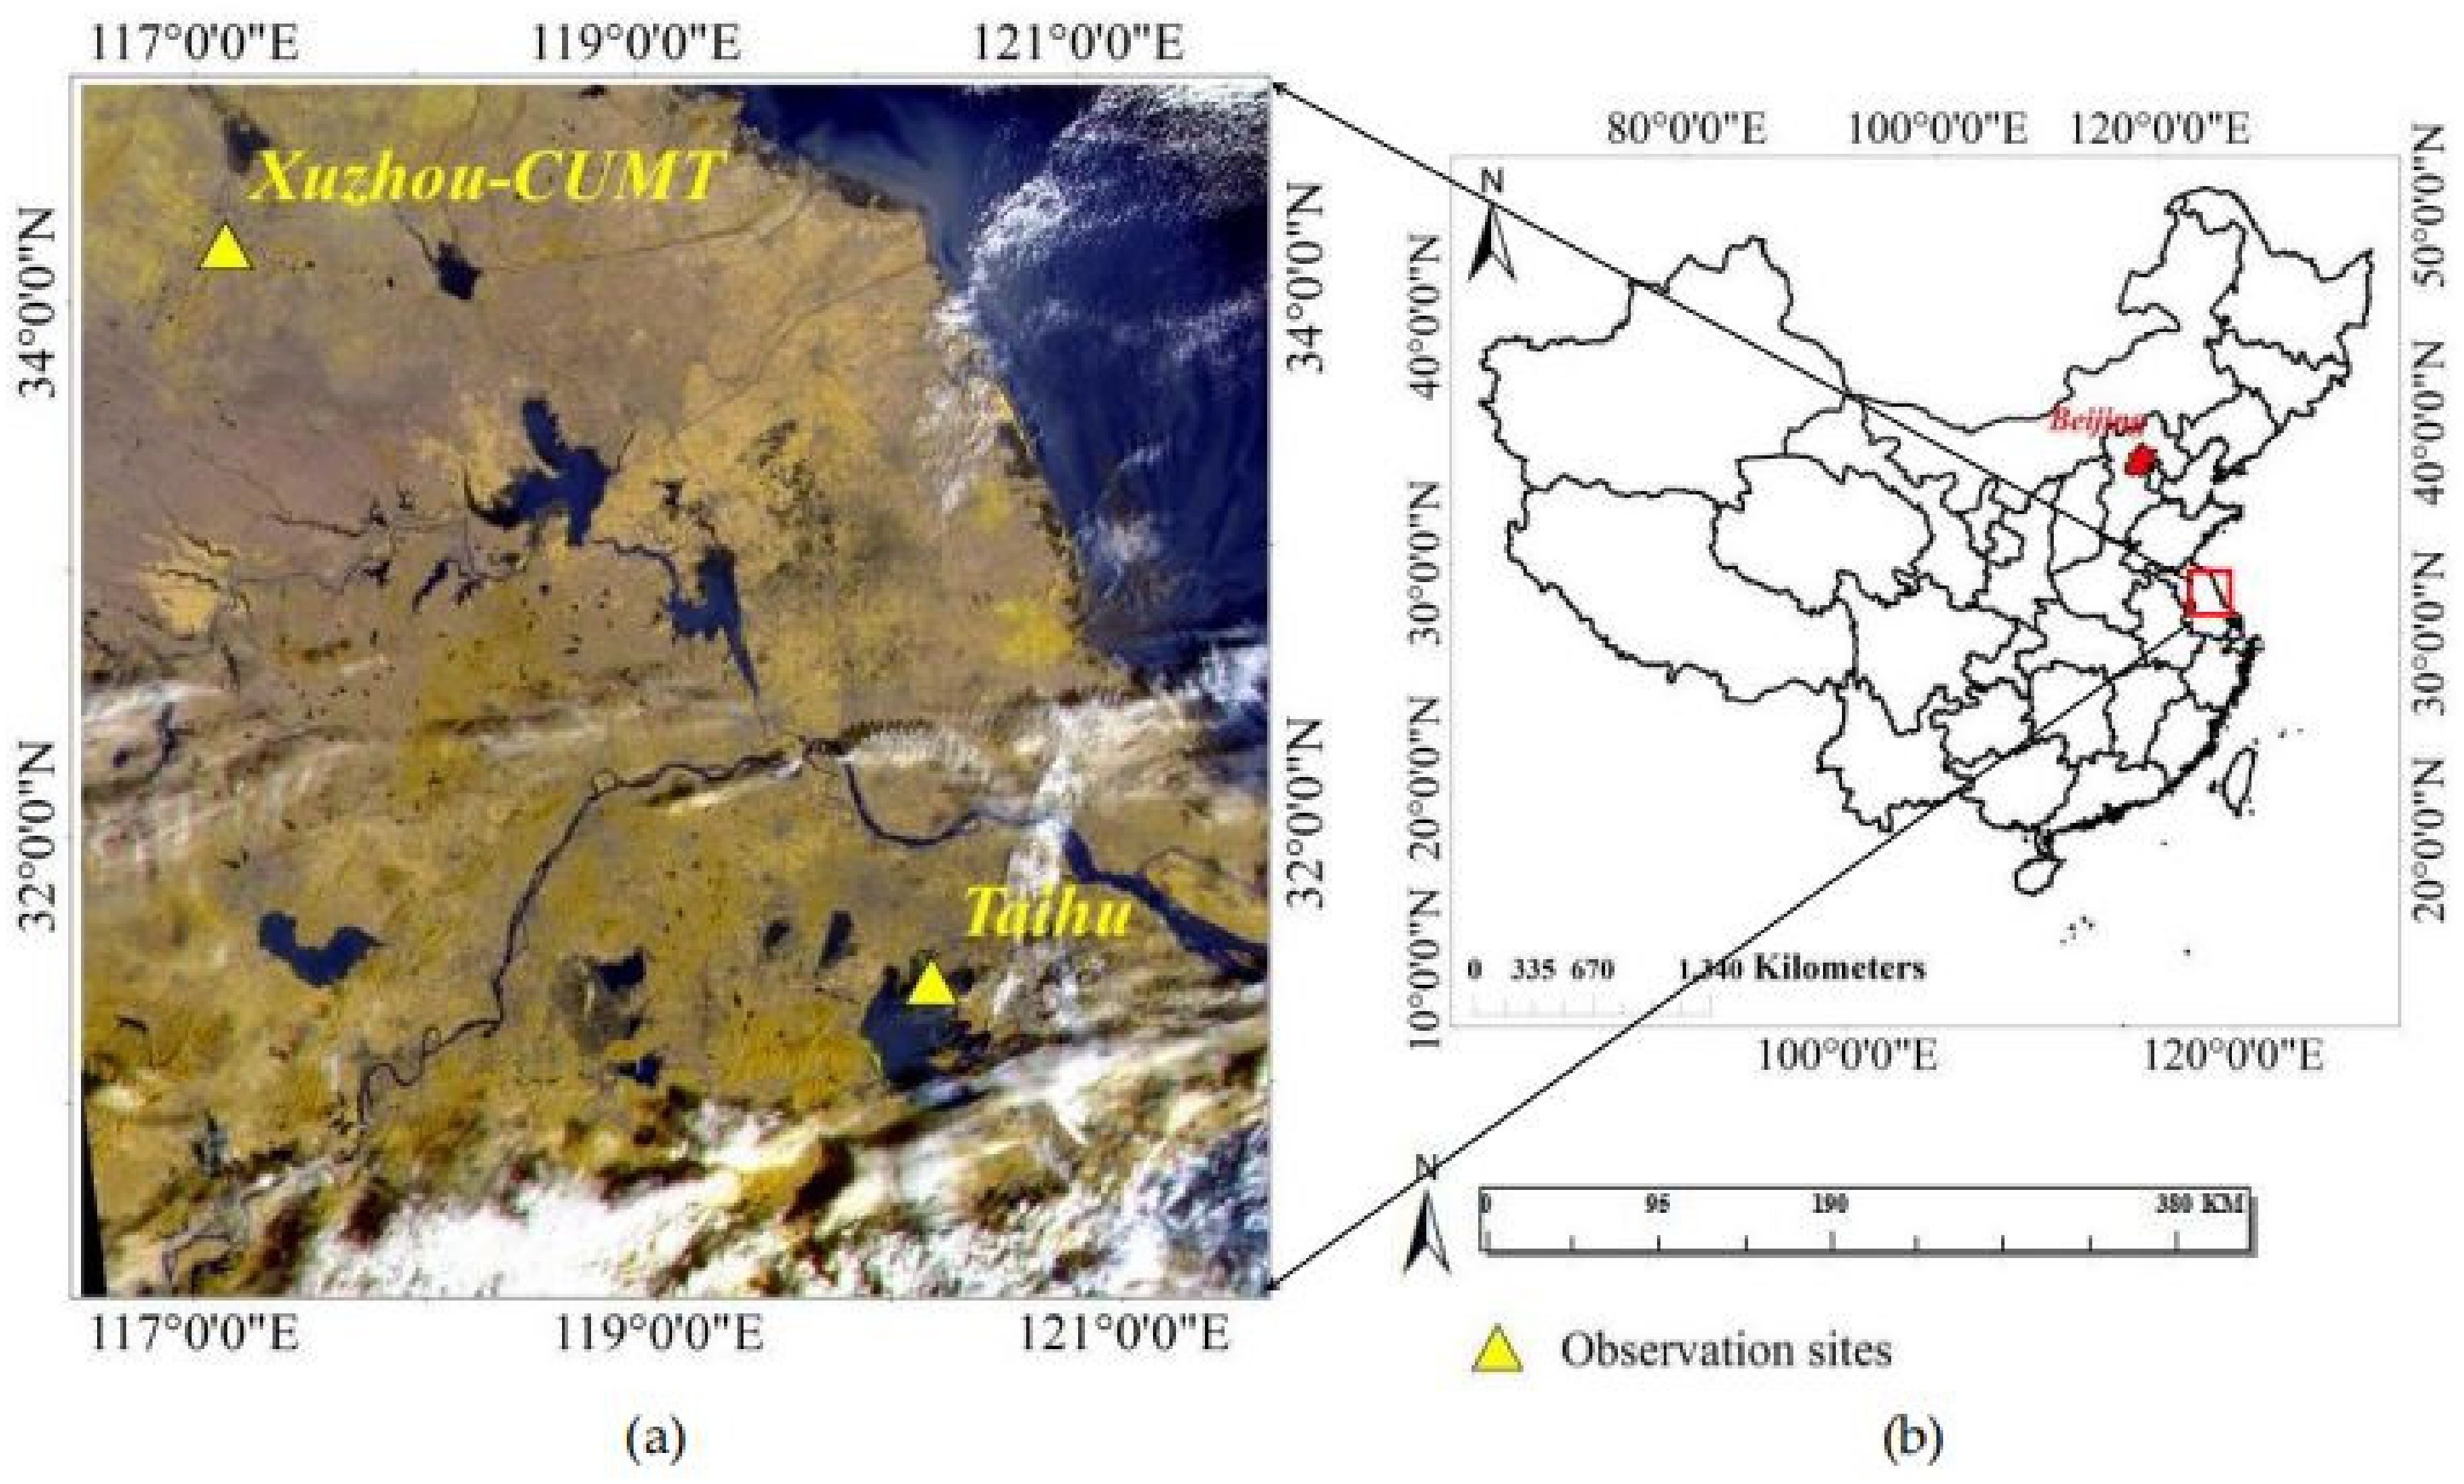
The Yangtze River Delta is located in the eastern coastal region of China and near the mouth of the Yangtze River (Figure 4). It is the junction of the lower reaches of the Yangtze River in China and the eastern coastal area. It faces by the Yellow Sea and the East China Sea to the east and faces Japan and South Korea across the sea. In the west is the plain of the middle and lower reaches of the Yangtze River, in the northwest is the hinterland of the North China Plain, and in the southwest is the hills of the south of the Yangtze River. The northern part of the area is mainly flat Yangtze River Delta with dense river networks, and the southern part belongs to the northern edge of the southeast hills (Zhejiang and Fujian hills). The social and economic development of the Yangtze River Delta region is rapid, but it also has strong industrialization characteristics of high energy consumption and high pollution emissions [36,41]. The air pollution caused by the rapid industrialization and urbanization in the Yangtze River Delta has become a serious social problem, and also makes the region one of the regions with serious air pollution in China. Therefore, considering the optical properties of aerosols in this region can provide scientific reference and effective support for regional aerosol pollution control methods.

4. Results and Discussion

4.1. Validation of Satellite Retrieved AOD with Ground Observations

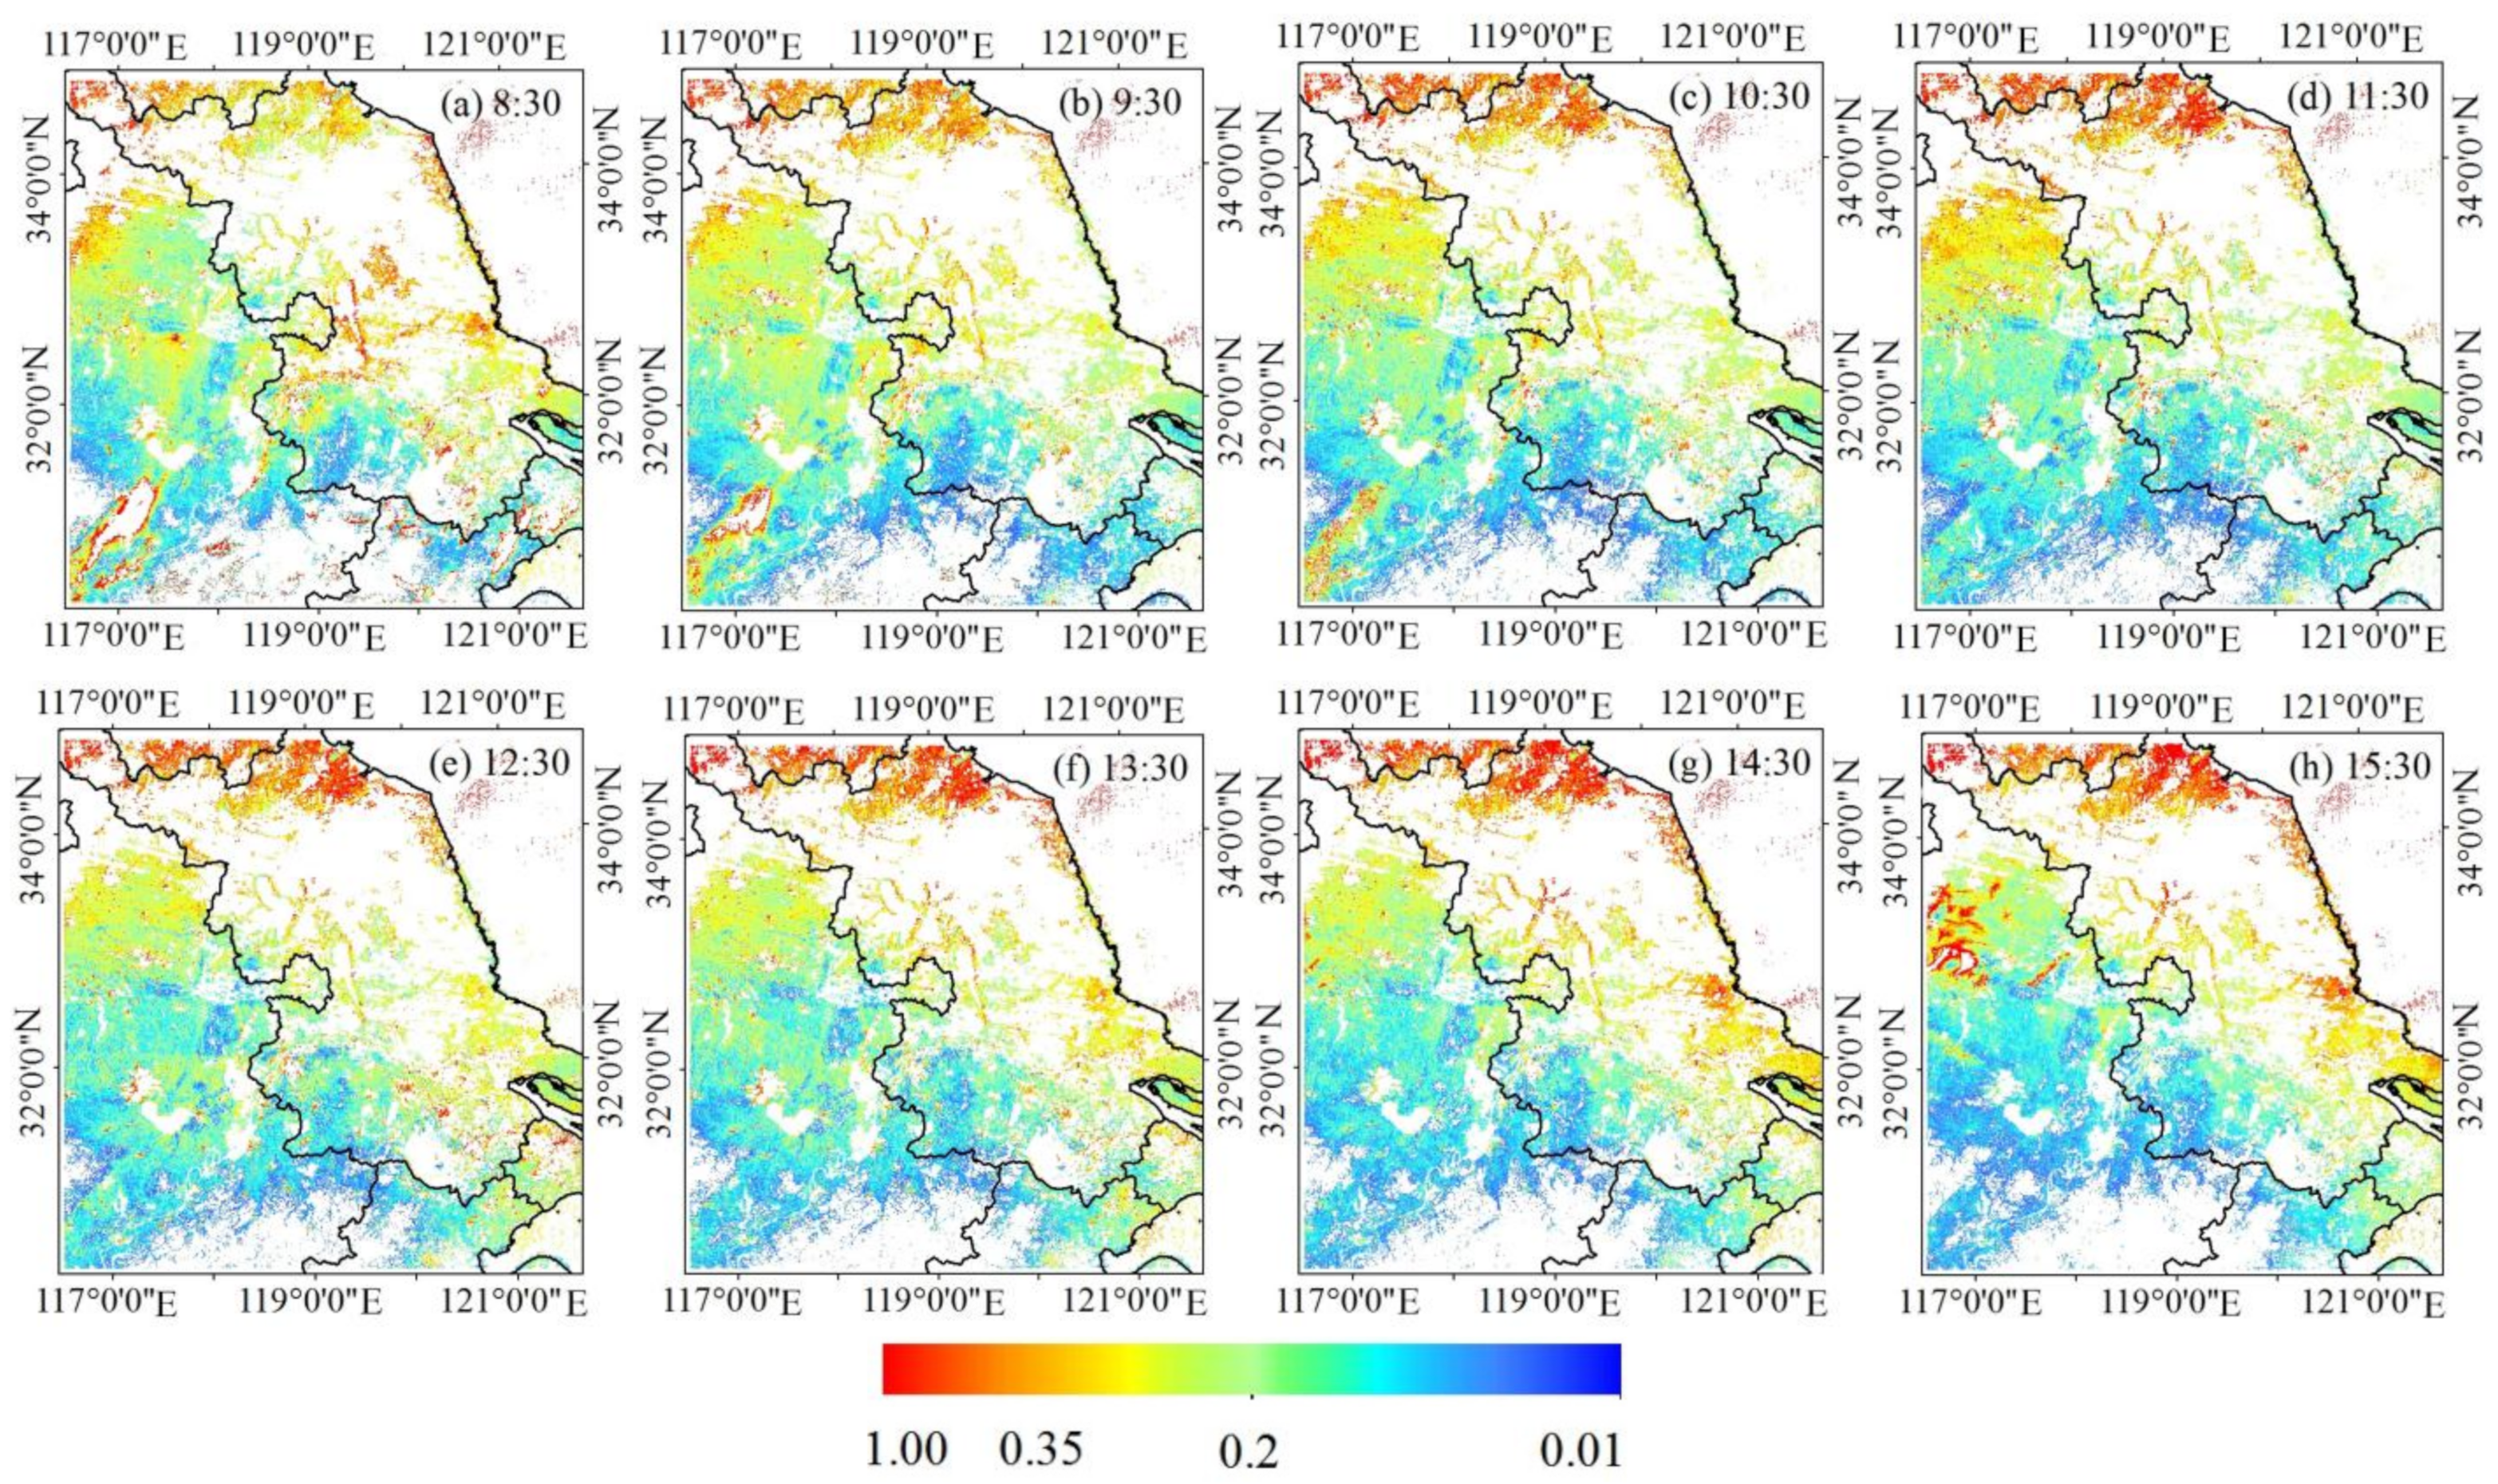
The study used GOCI geostationary satellite remote sensing data retrieval to obtain aerosol AOD values in the Yangtze River Delta from 2017 to 2018. The study selected AOD images retrieved at 8 moments in the Yangtze River Delta region on 23 February 2018, and analyzed the spatial characteristics (Figure 5). The study area showed the characteristics of aerosol concentration higher in the north and lower in the south.
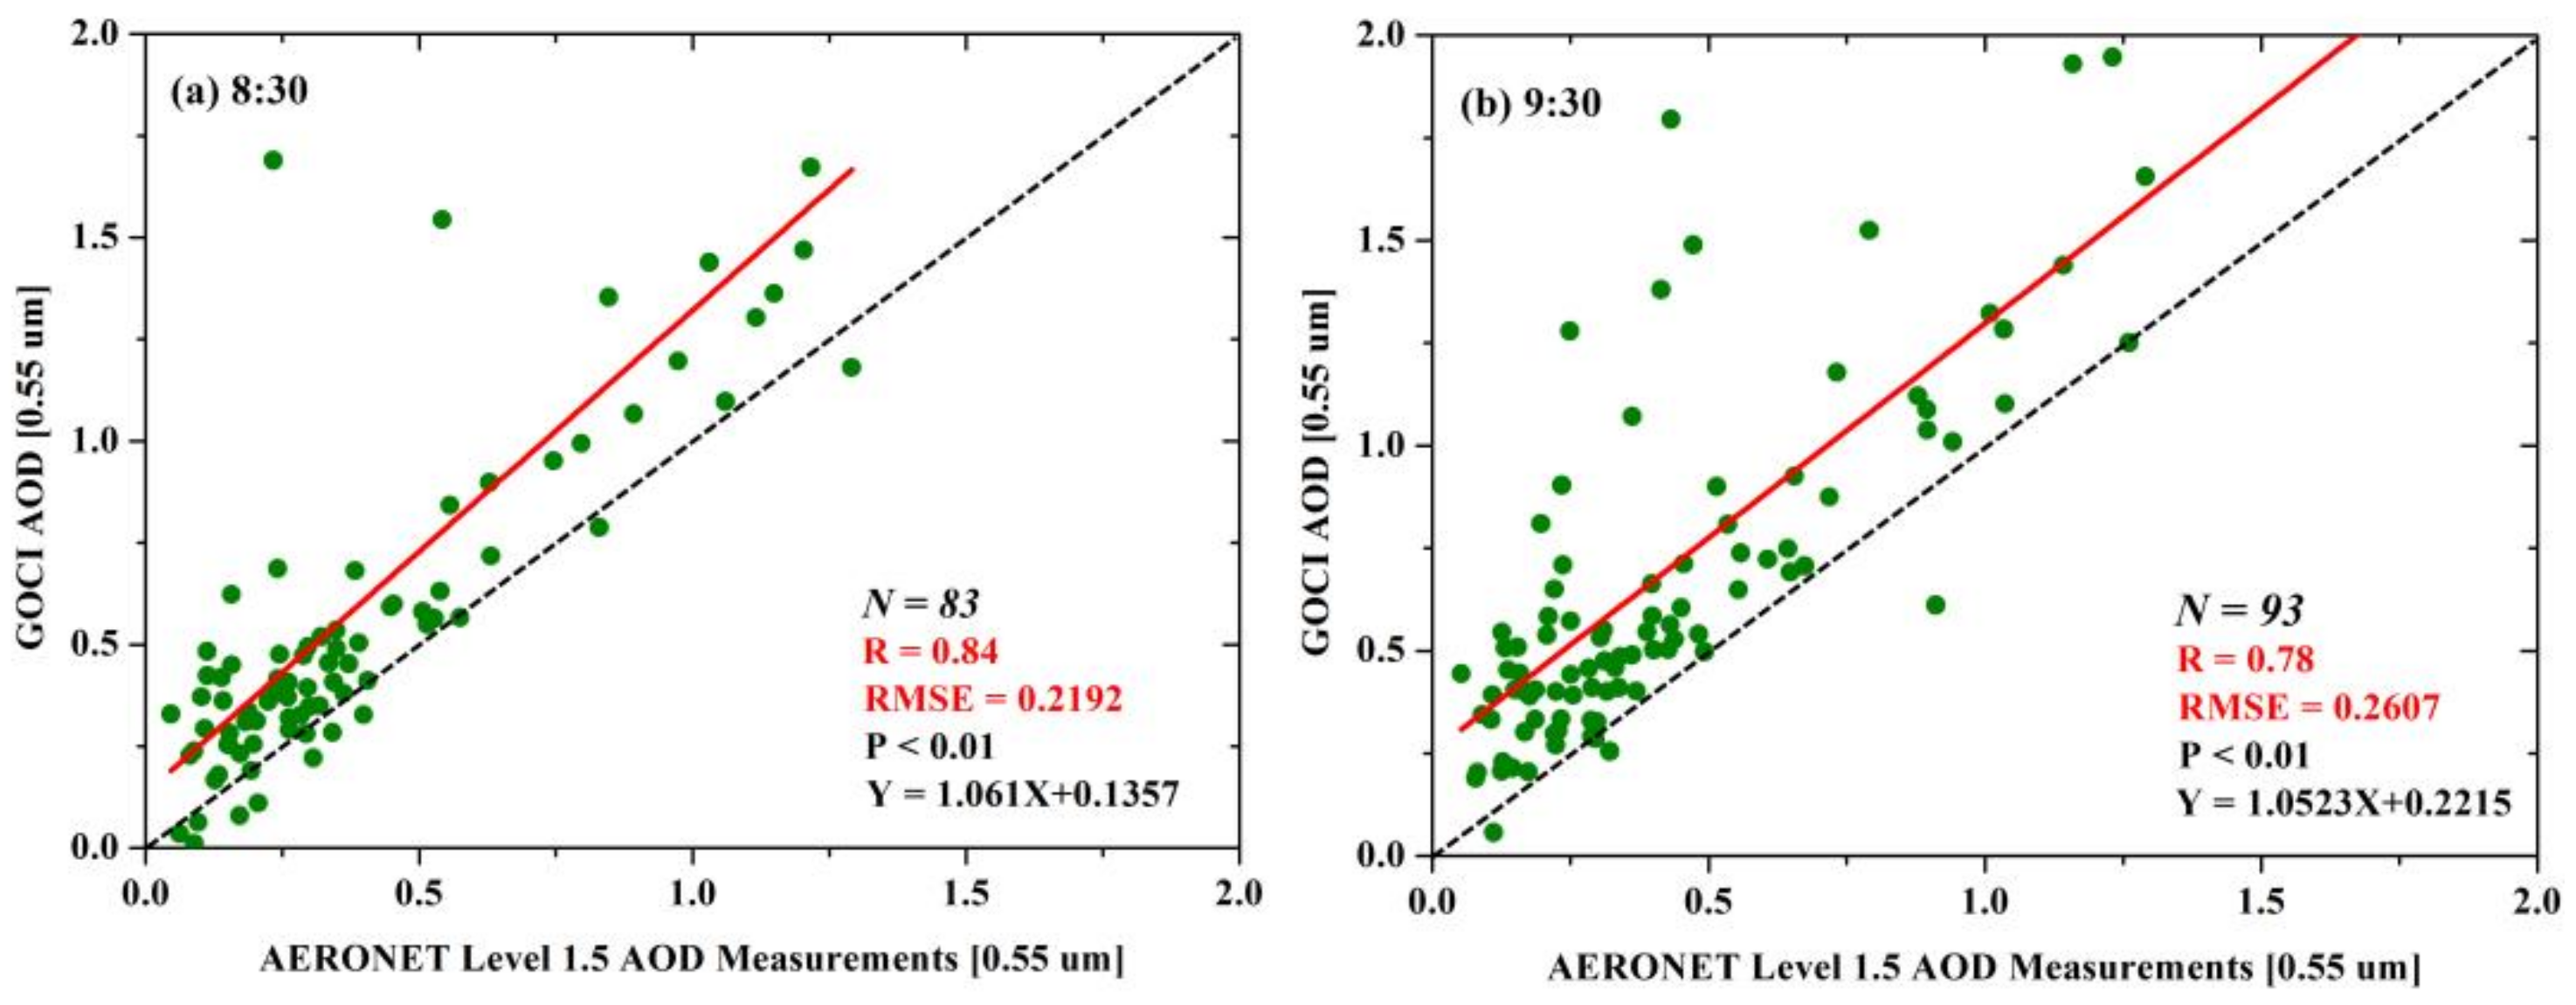
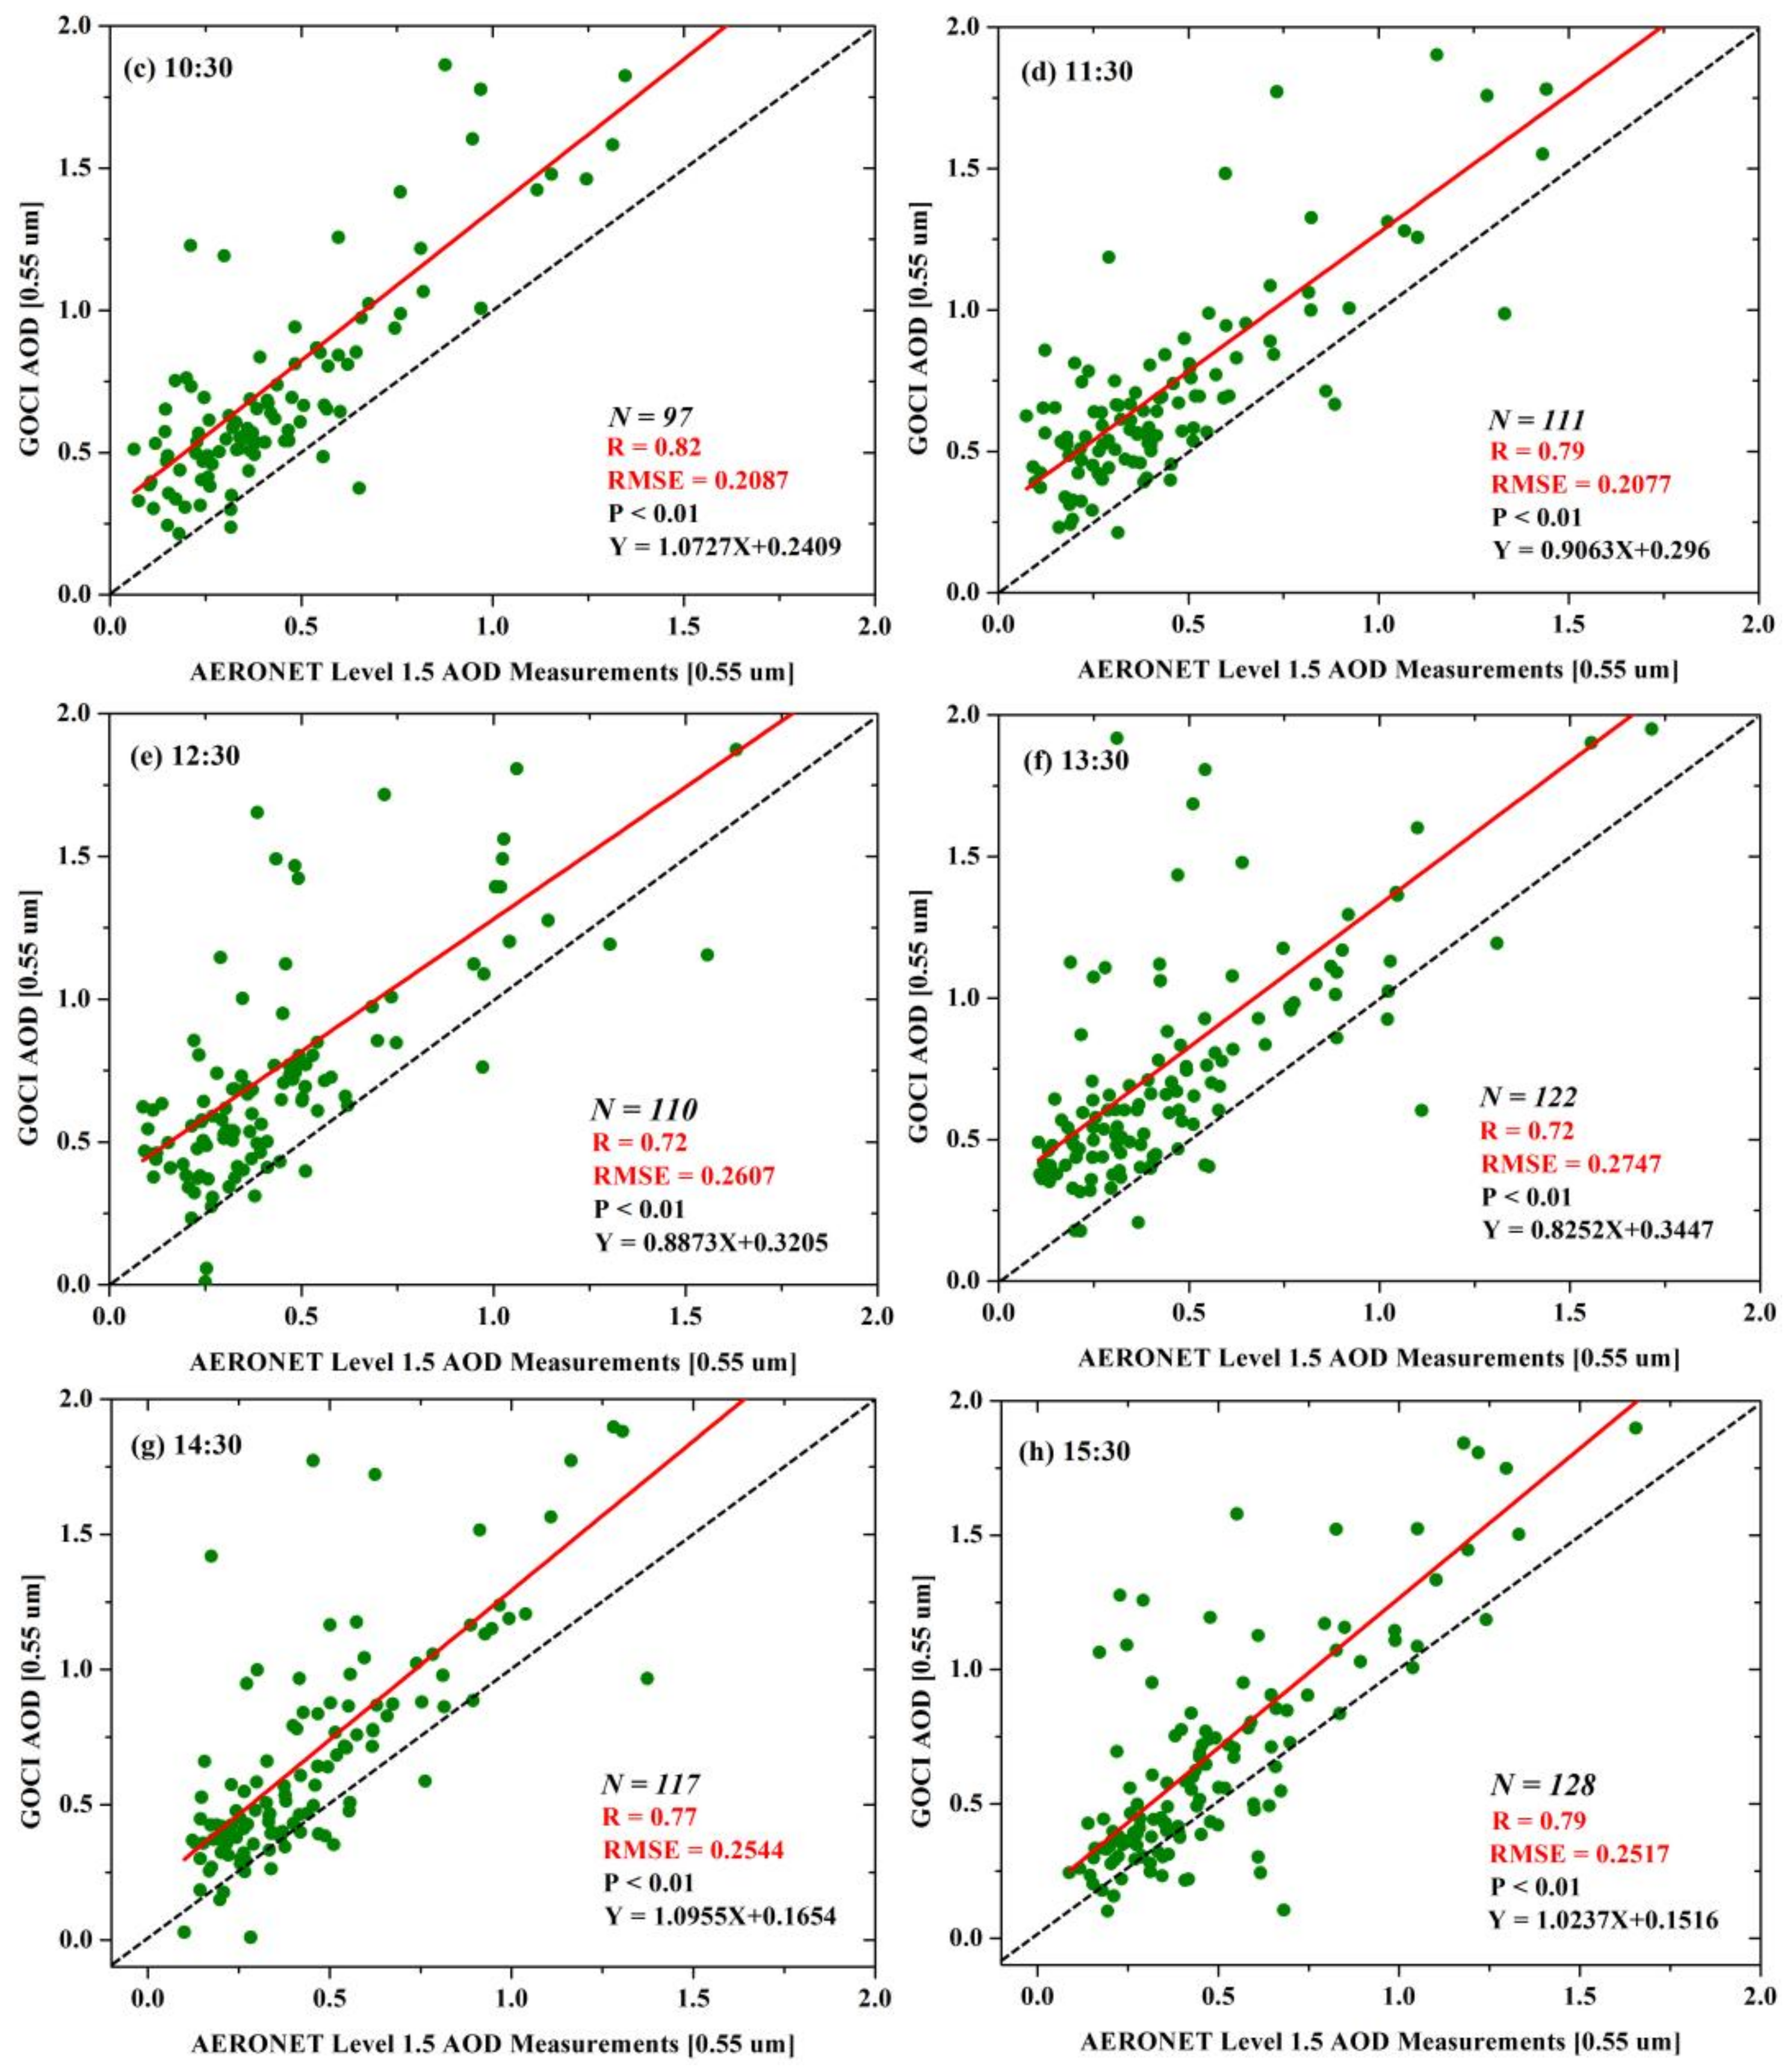
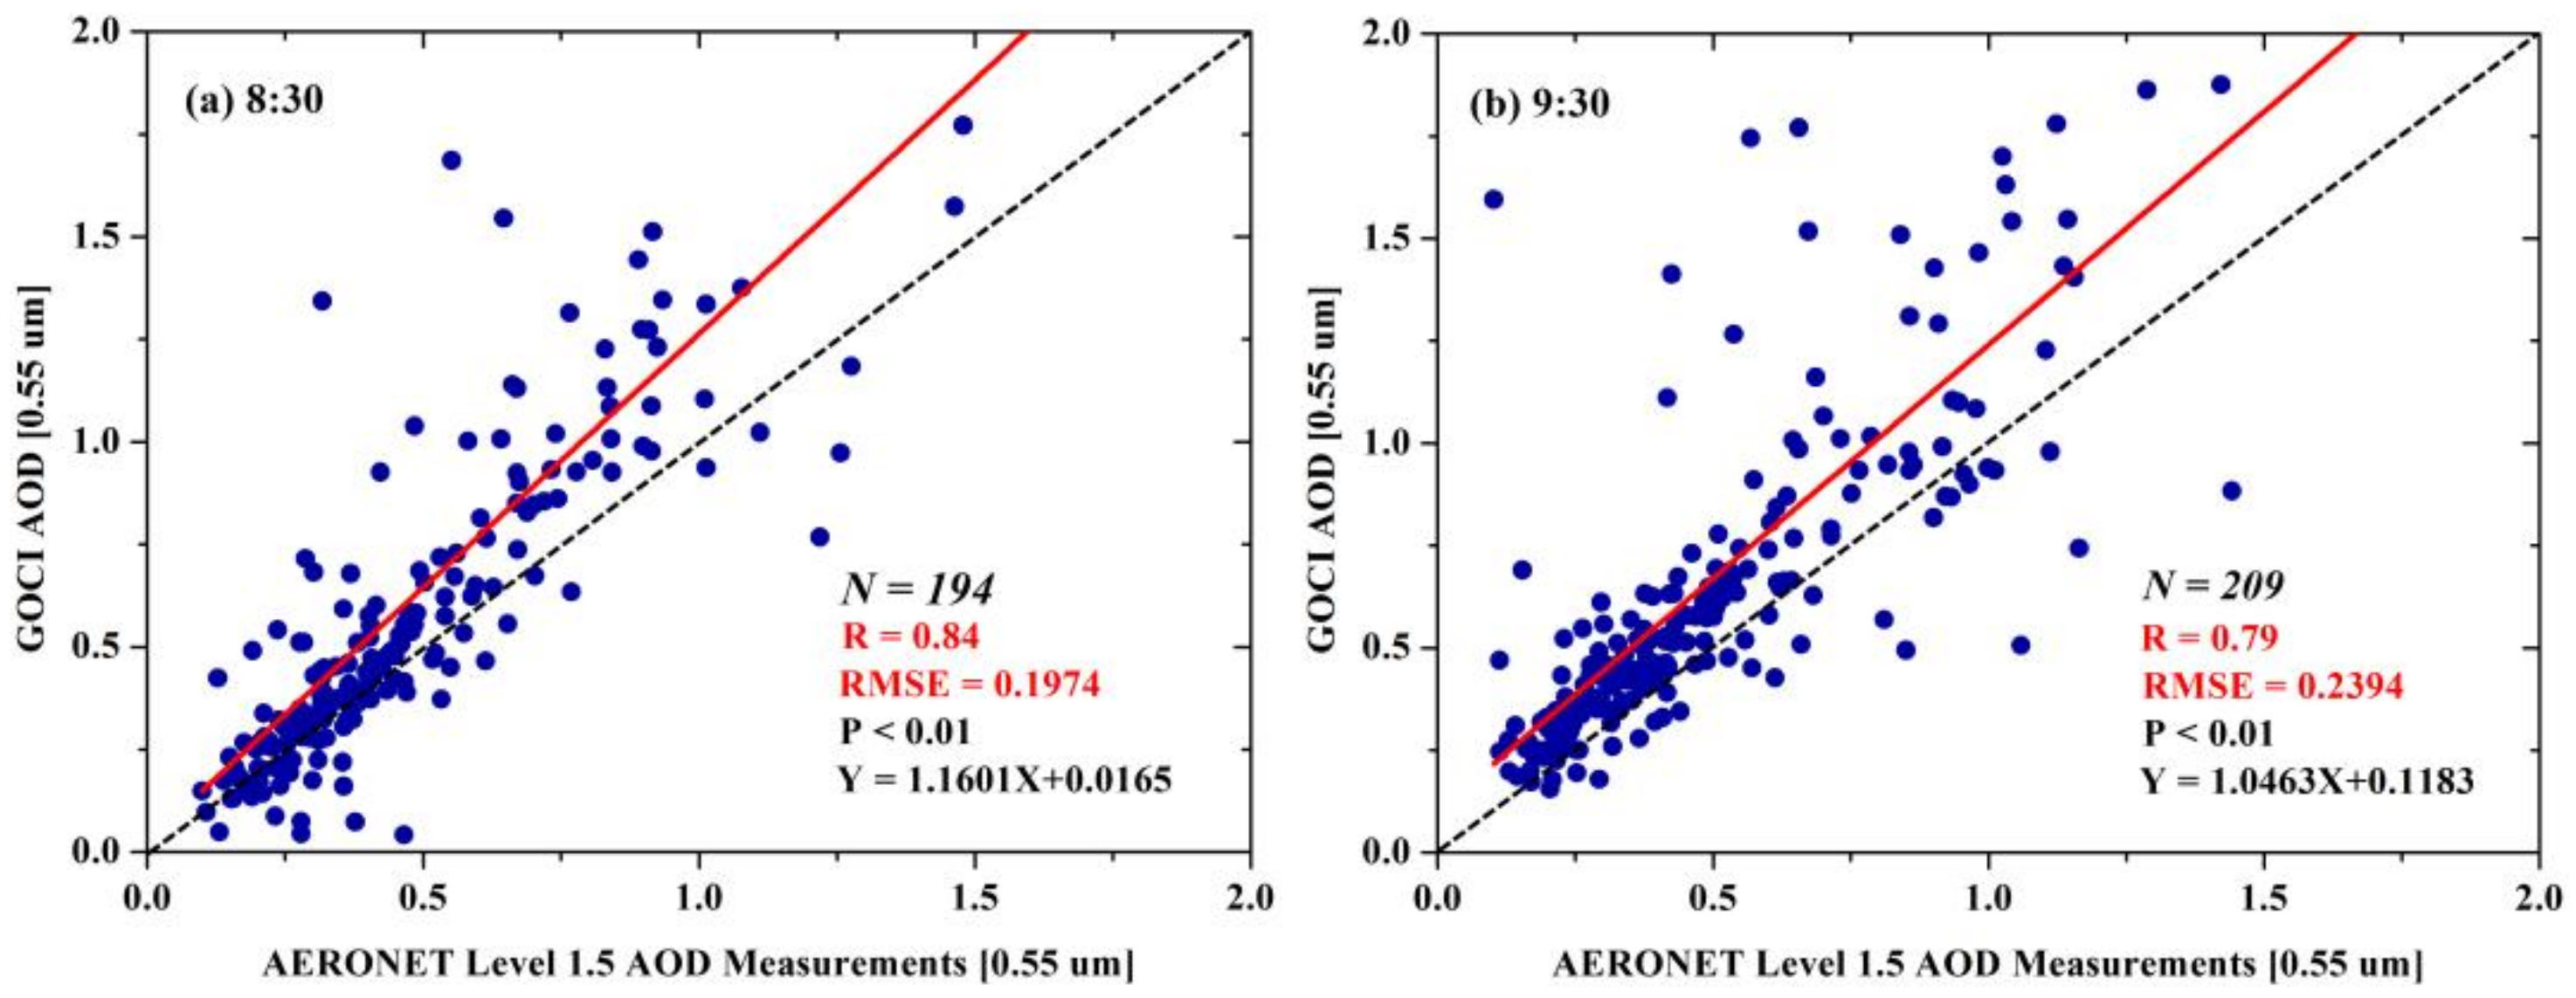
To further quantitatively verify the retrieved GOCI AOD, the study used AERONET 1.5 AOD data to compare and analyze the retrieved GOCI AOD (Figure 6 and Figure 7). To reduce the influence of data error, noise and spatial difference, we took the geographical location of AERONET ground-based station as the center and used the average of 25 pixels (2.5 km × 2.5 km) effective value around the station from the 550 nm AOD retrieved by GOCI to perform the comparison and verification. The correlation between the AERONET observed AOD and the retrieved GOCI AOD was analyzed.
It can be seen from the verification results (Figure 6 and Figure 7) that when continental aerosols are used, there is a good consistency with the ground observation data, and R value are all above 0.7. Most of the scattered points are above the 1:1 line, indicating that the retrieved GOCI AOD is generally larger than the AERONET AOD. At the Taihu station, the R value at (a) and (c) are above 0.8. Among them, (a) has the largest correlation (R = 0.84) and (e), (f) has the smallest correlation (R = 0.72). At the Xuzhou-CUMT station, (a) has the largest correlation (R = 0.84).
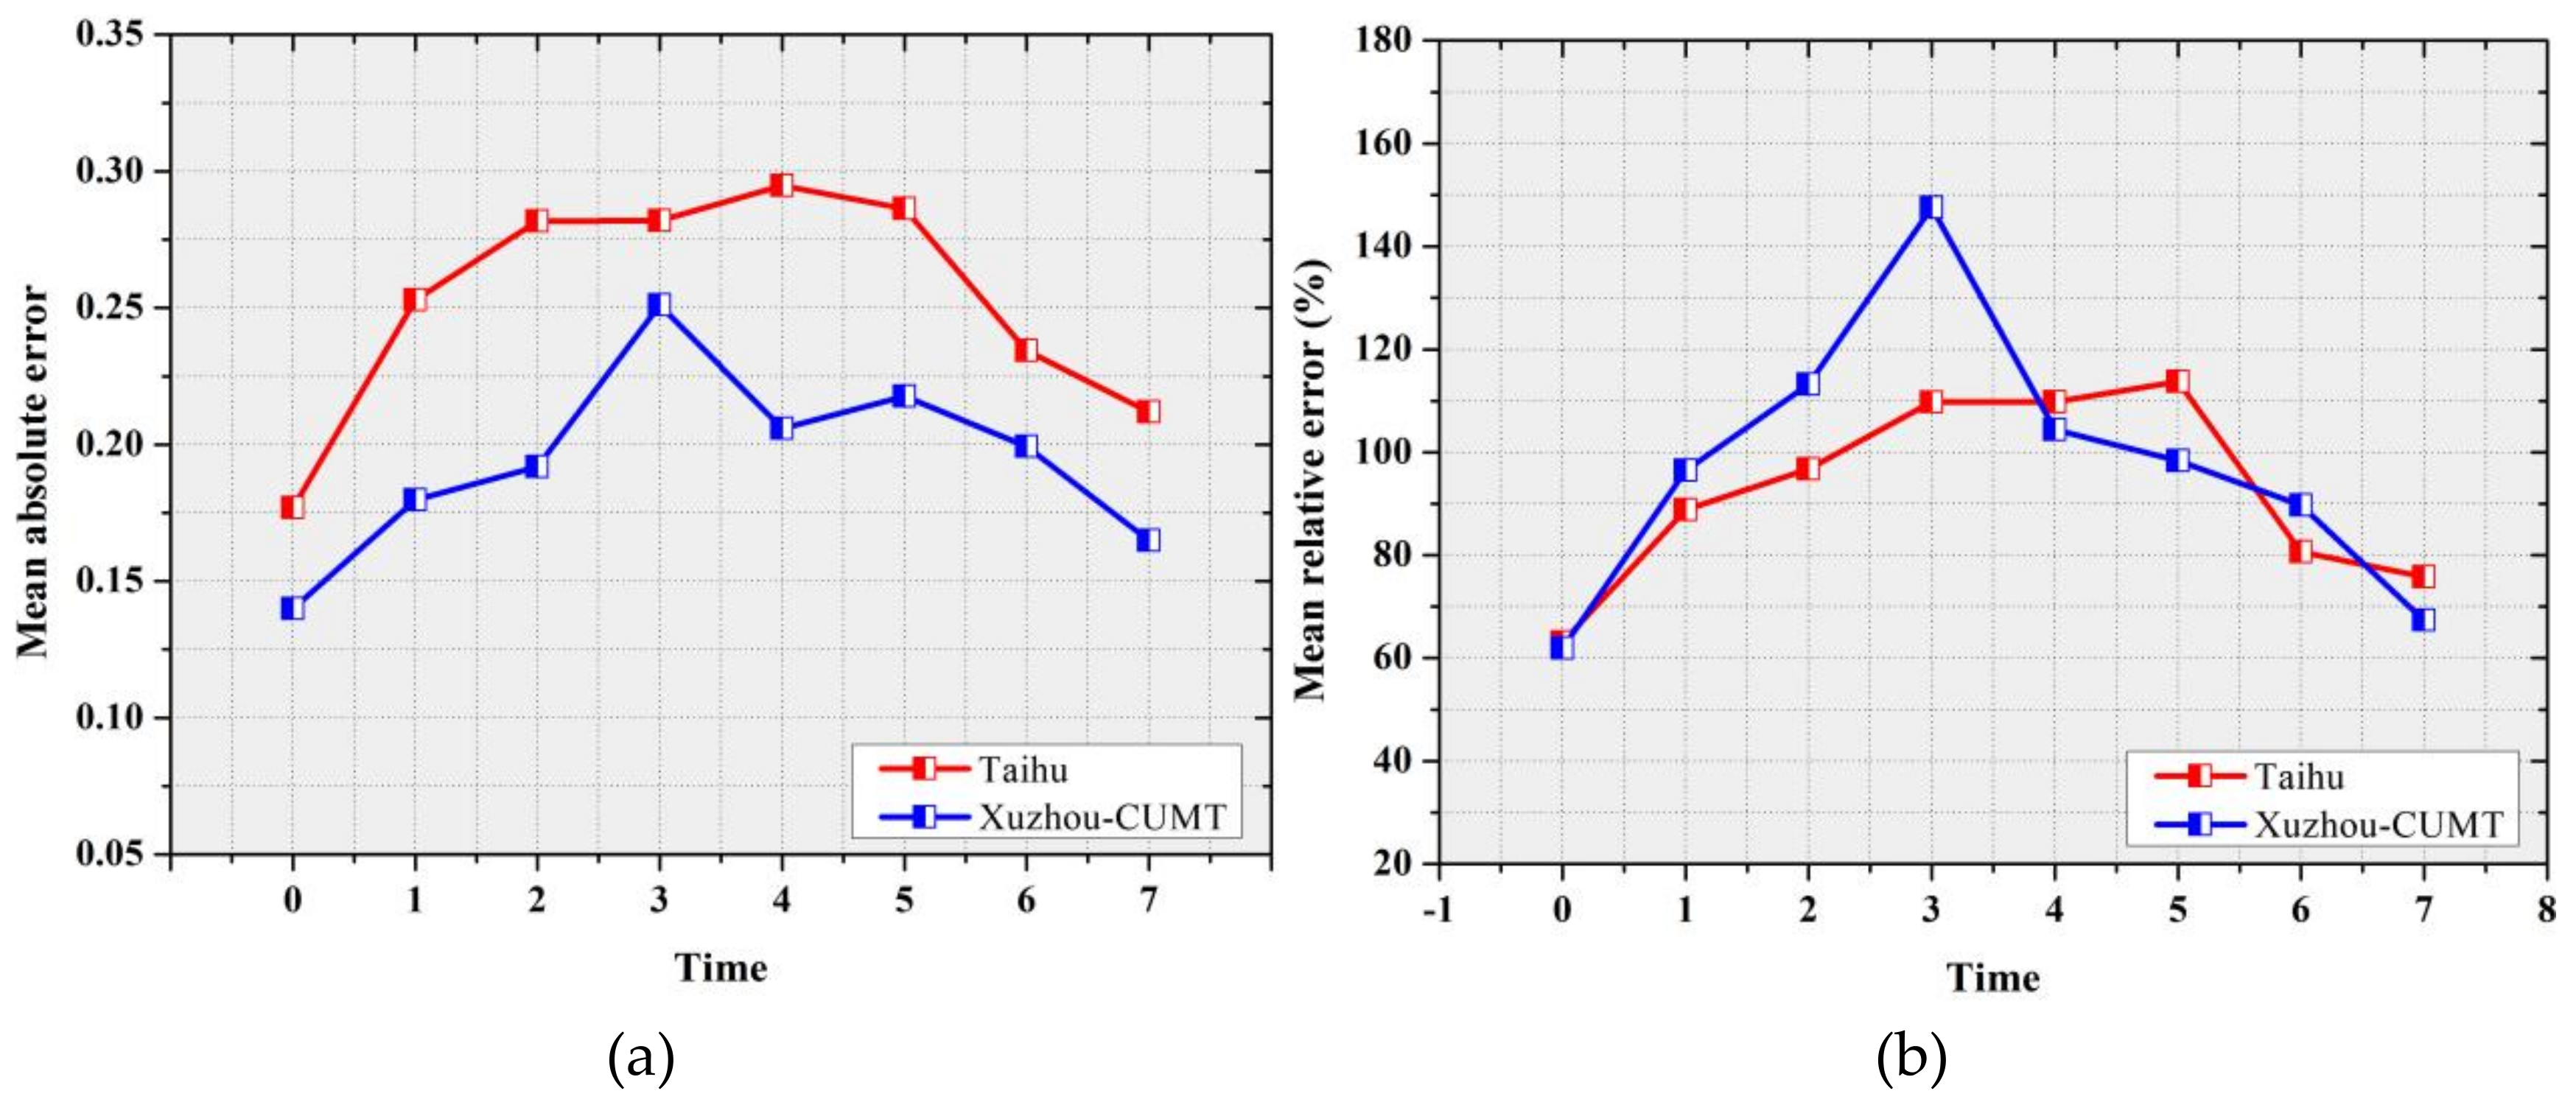
The AOD retrieved by satellite was compared with the observation data of Taihu and Xuzhou-CUMT stations, and the MAE and MRE of GOCI AOD at Taihu and Xuzhou-CUMT were calculated respectively (Figure 8). It can be seen that the AOD retrieved at noon has a larger error, the mean absolute error and mean relative error of the morning and afternoon are small, and the AOD retrieved in the morning is more accurate.
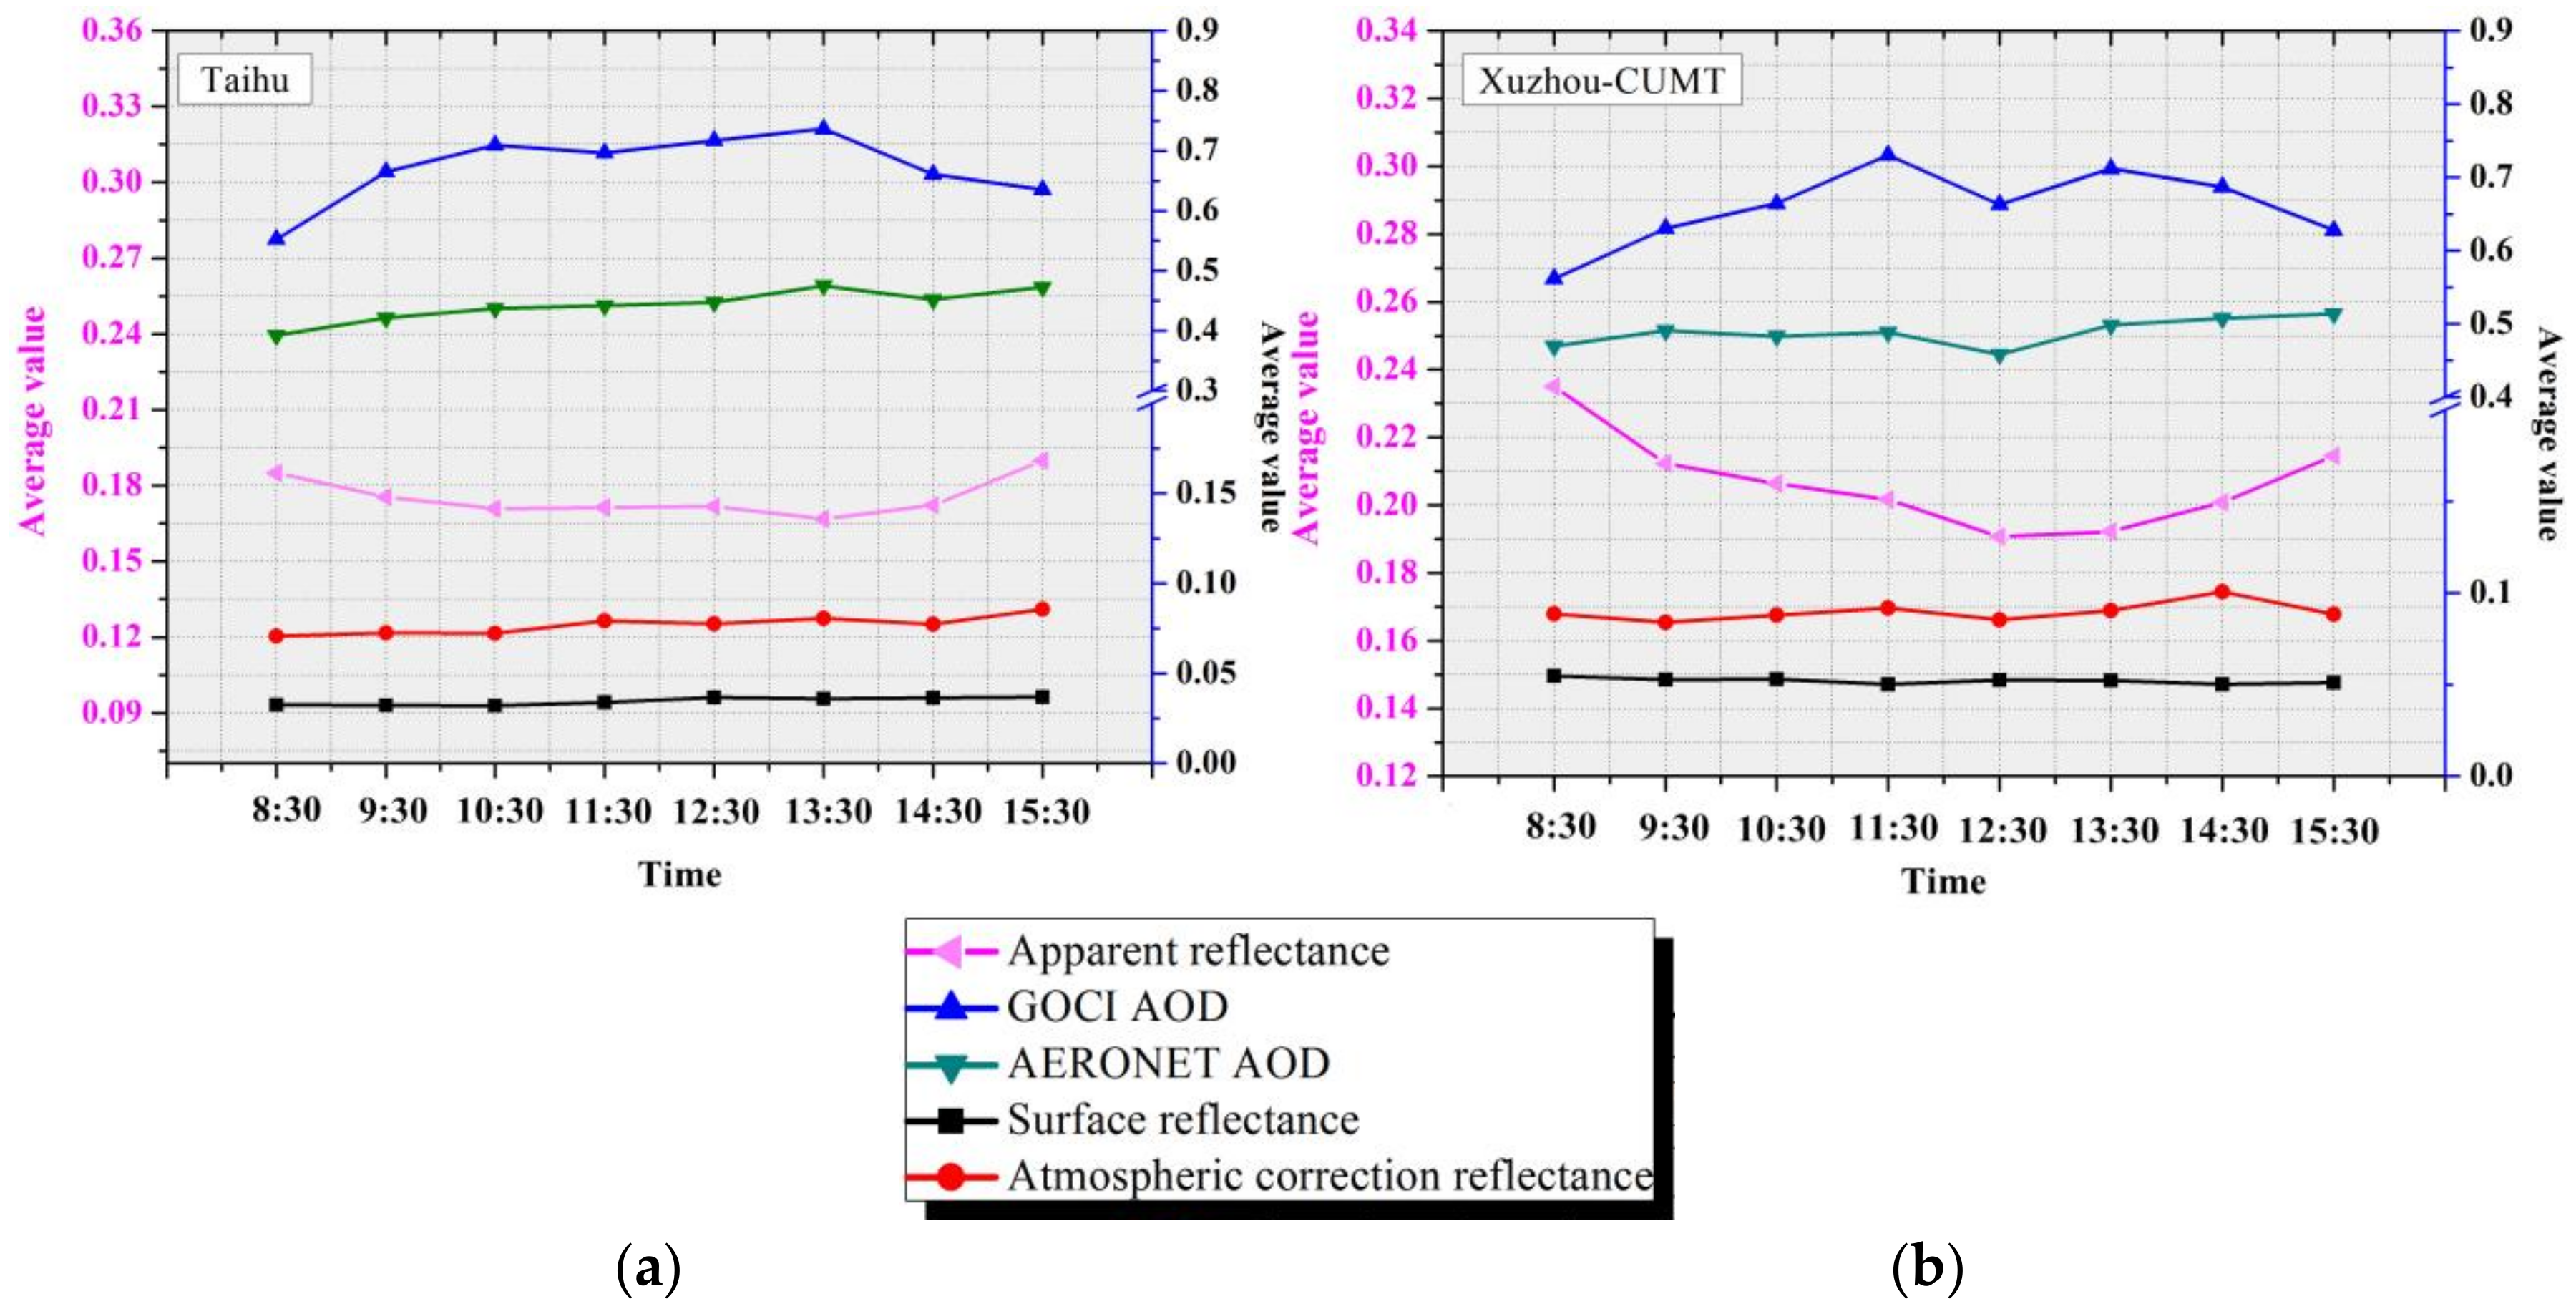
To analyze the reasons for the different AOD errors retrieved under GOCI’s 8 solar angles, the GOCI surface reflectance, apparent reflectance, and the average values of GOCI AOD and AERONET AOD at Taihu and Xuzhou-CUMT stations were calculated. Using the average of the apparent reflectance and AERONET AOD, and atmospheric correction reflectance is obtained by 6S (Figure 9). It can be seen that the GOCI surface reflectance value determined in Section 2.4.2 is lower than the surface reflectance value obtained by atmospheric correction, which makes the AOD retrieved by remote sensing higher than the AERONET AOD. The deviation between the surface reflectance of GOCI in the morning and the surface reflectance value obtained by atmospheric correction is relatively small (Table 4). Therefore, the AOD retrieved in the morning is closer to the AERONET AOD. At 10:30 a.m., 11:30 a.m., 12:30 p.m. and 13:30 p.m., the retrieval errors are relatively large.

4.2. Sensitivity Analysis of the AOD Retrieval to Surface Reflectance Deviation and Sun Angle Change

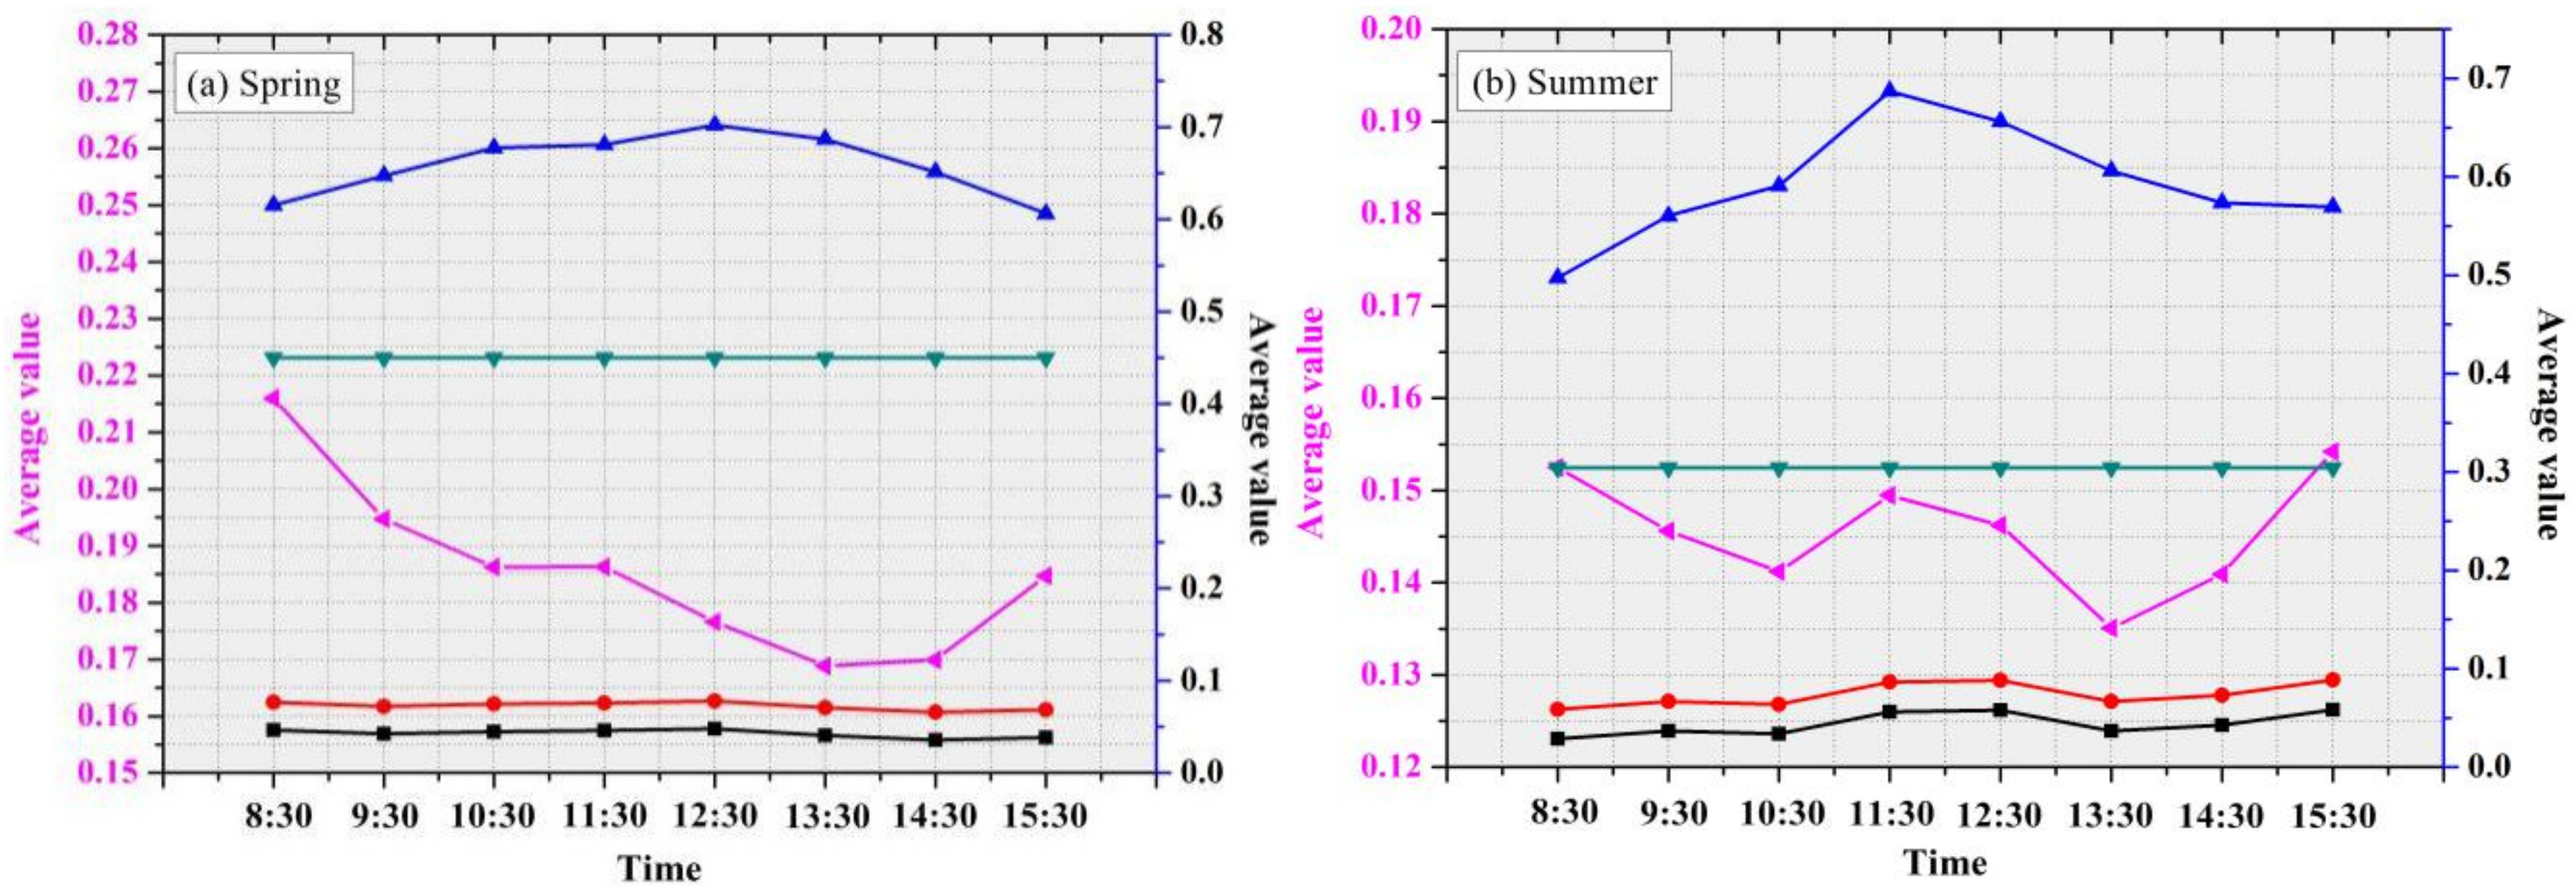
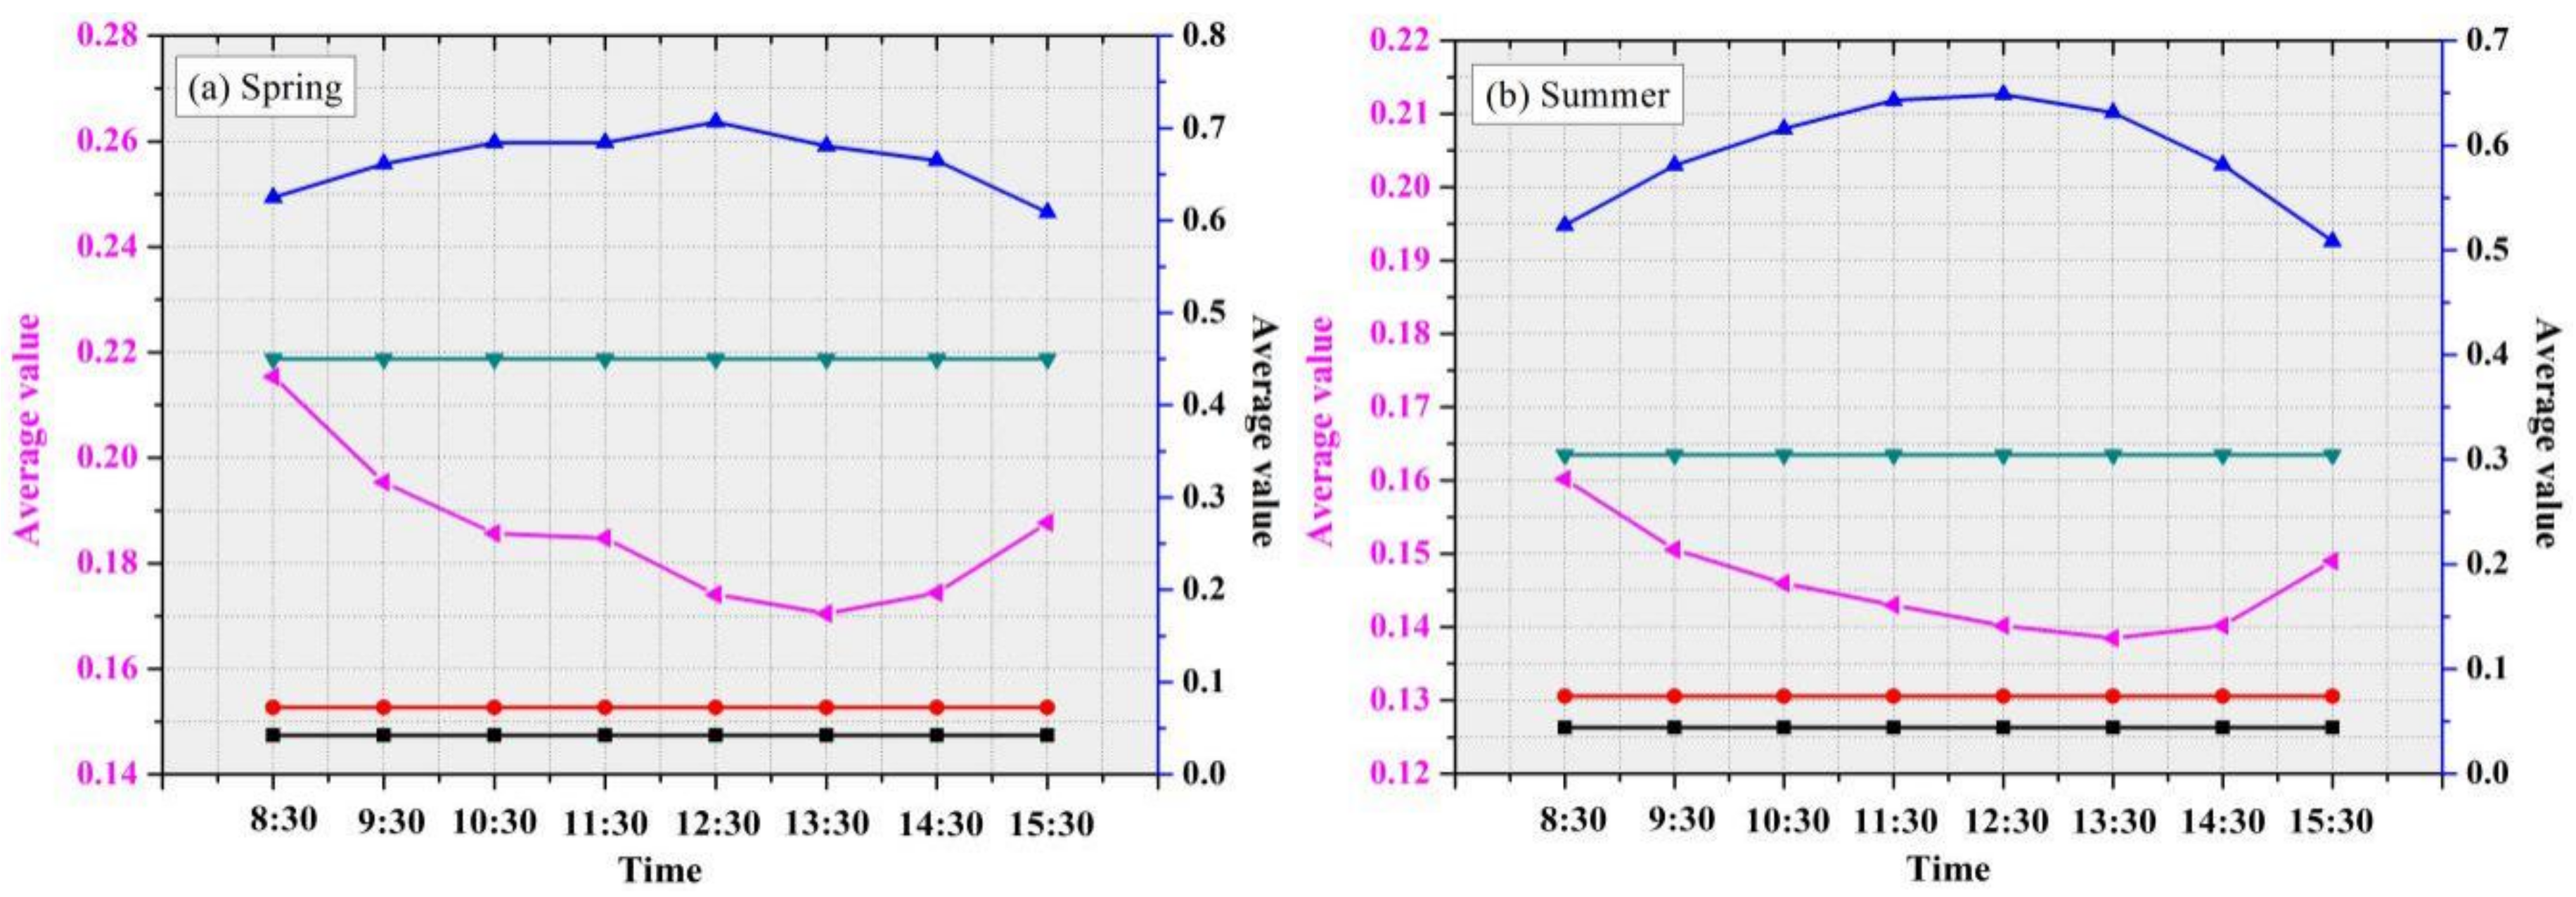
To analyze the influence of GOCI surface reflectance deviation on the retrieval of AOD errors under different solar angles, this study select GOCI image data of 25 pixels (2.5 km × 2.5 km) around the corresponding locations of Taihu and Xuzhou-CUMT stations for simulation experiments. Due to seasonal changes in the angle of the solar, the GOCI image data of 9 days in each of the four seasons of spring, summer, autumn and winter at two stations are select, and atmospheric correction is used to obtain the average GOCI surface reflectance and AERONET AOD. Then, the 6S is used to simulate the apparent reflectance of the four seasons. When the atmospheric correction for the 8 moments of the surface reflectance decreases by 0.03, the simulated apparent reflectance is used to retrieve the GOCI AOD (Figure 10). When the atmospheric correction reflectance decreases to the same value in eight time periods, the retrieve AOD values at different times in the four seasons are different, and are no longer the same value (average value of AERONET AOD) (Figure 10).
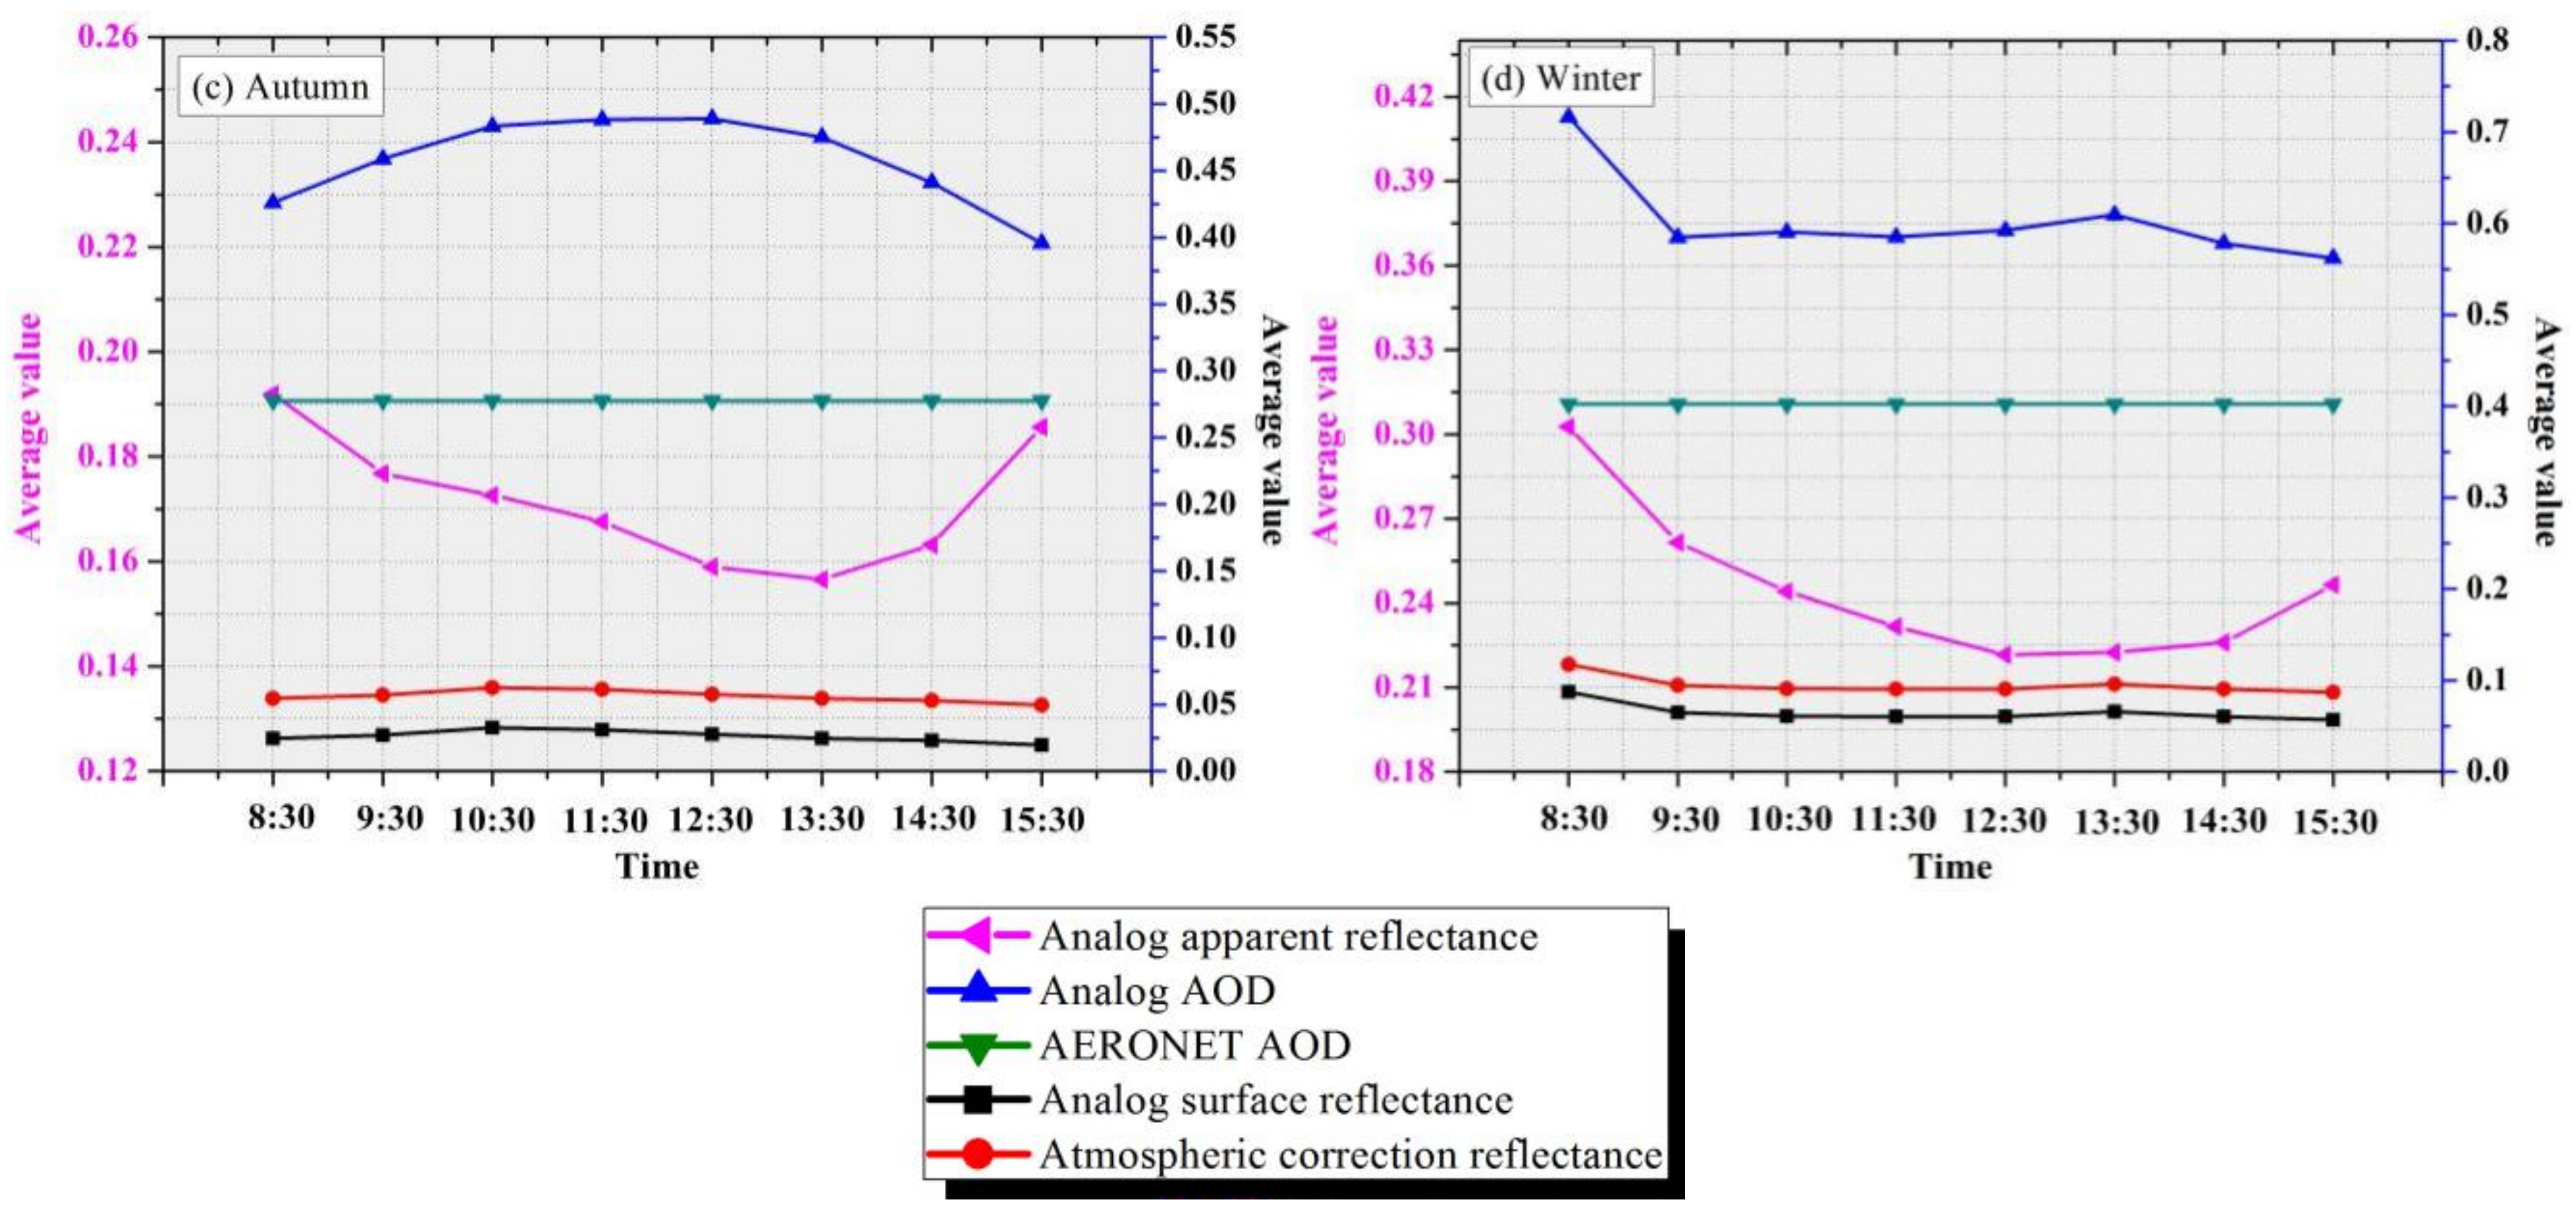
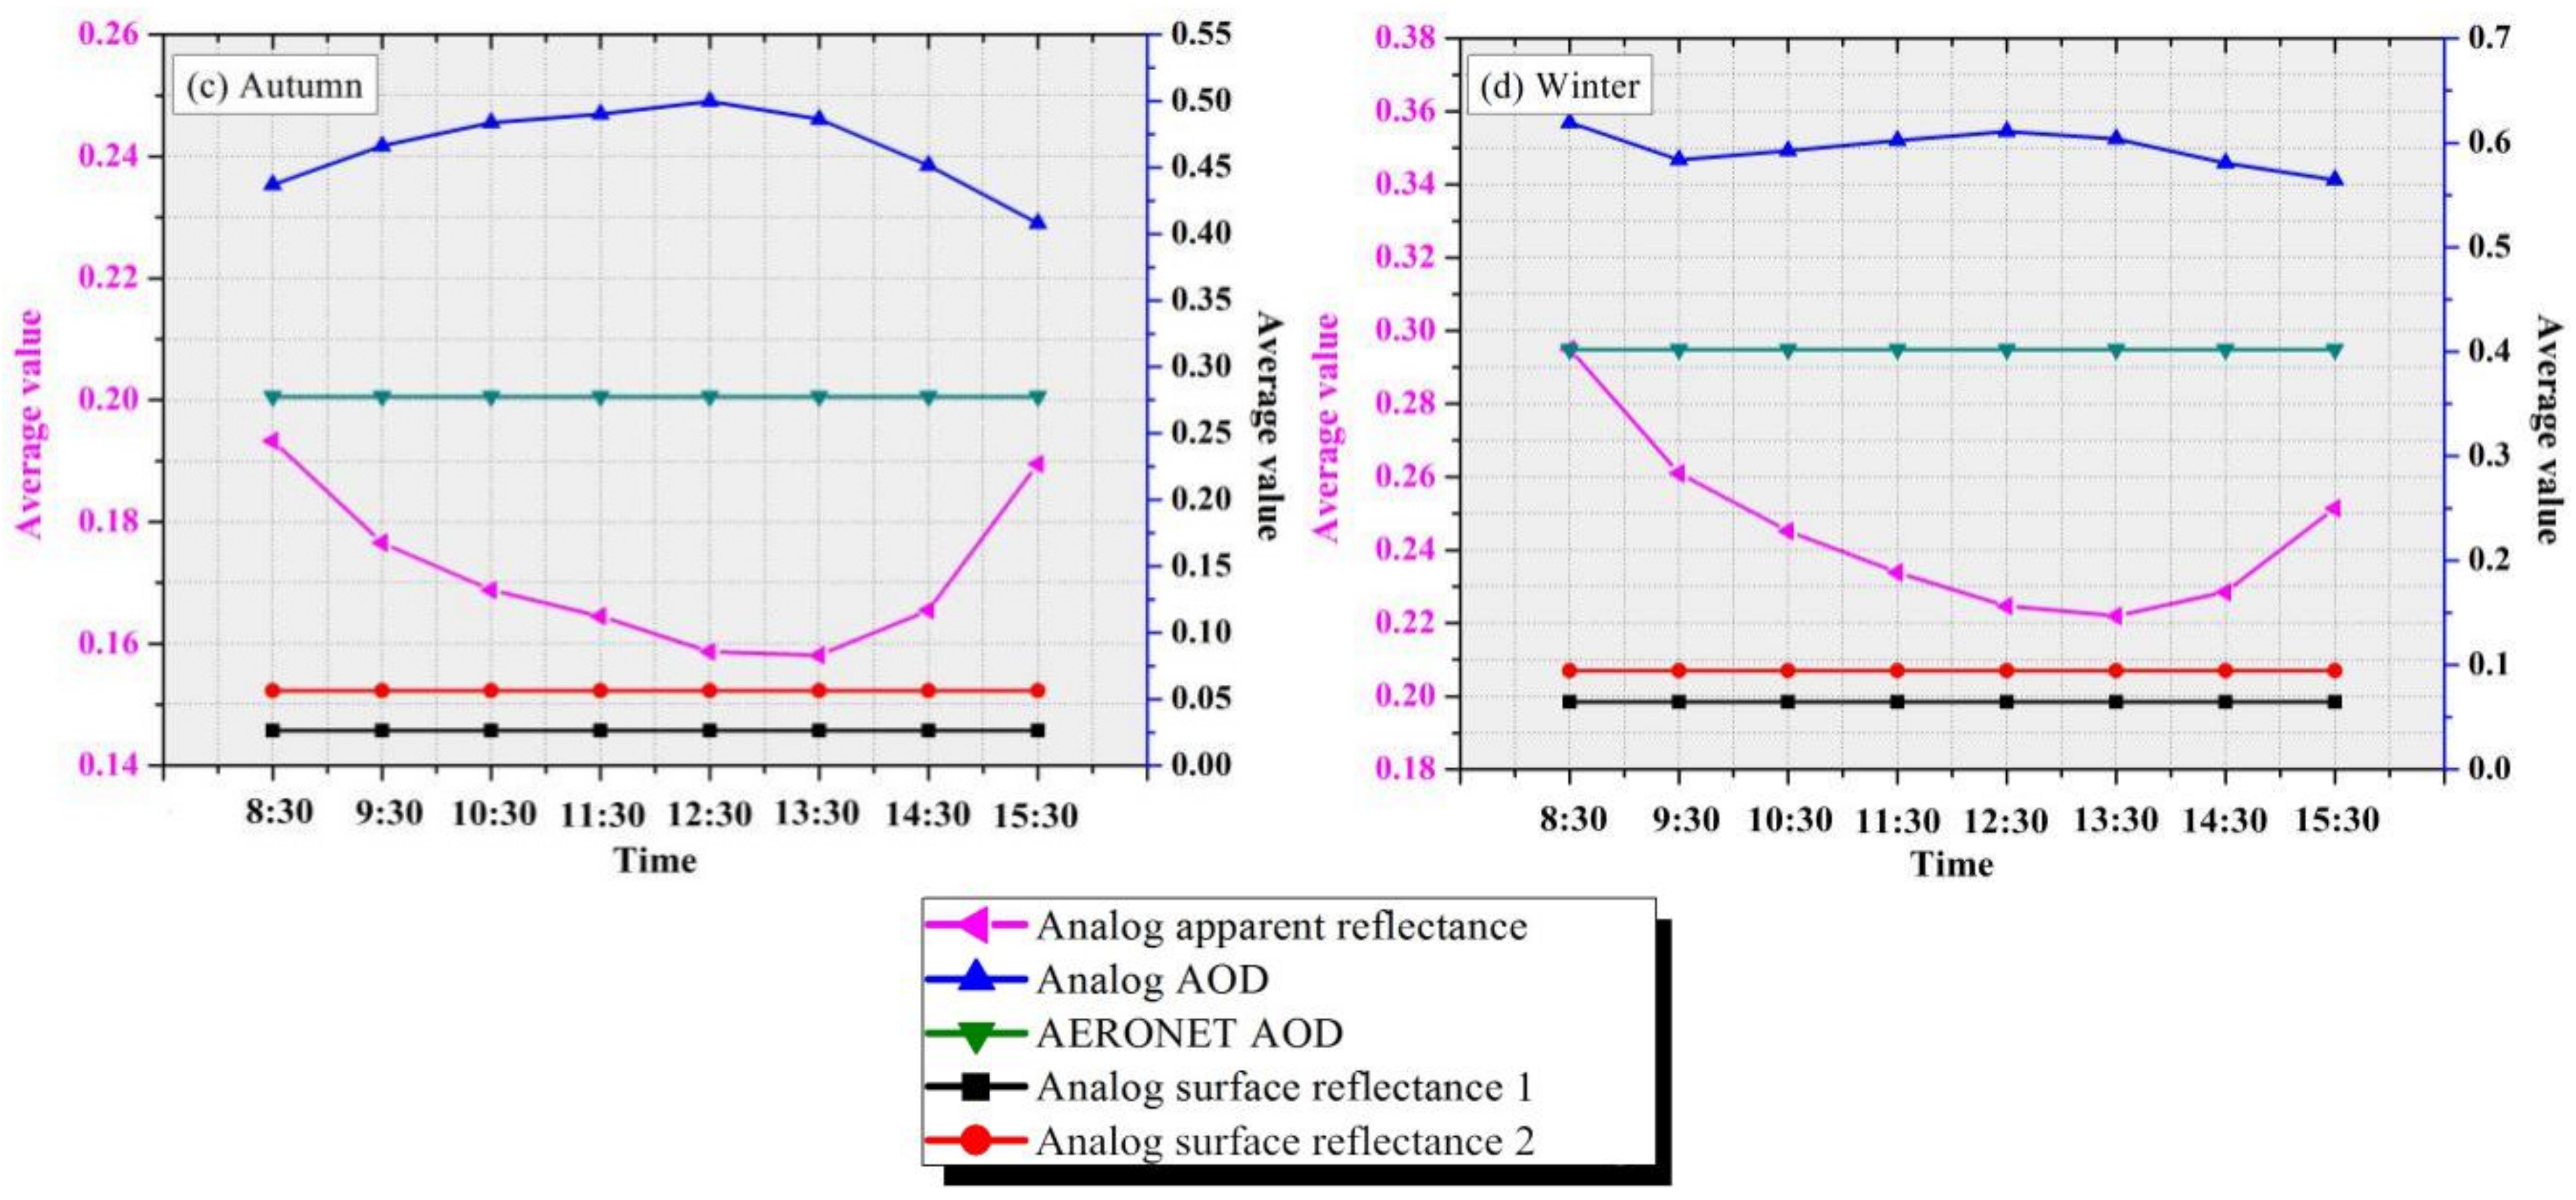
To clarify the influence of the difference of the sun angle on the AOD error retrieval, similarly, using Figure 10 Taihu and Xuzhou-CUMT two stations each season 9 days GOCI image data, and the surface reflectance with the same value in 8 time periods is used to eliminate the influence of surface reflectance on the retireval of AOD. Combined with the average value of AERONET AOD in Figure 10, the apparent reflectance of the four seasons is simulated by the 6S. When the surface reflectance of the same value at 8 moments is reduced by 0.03, the simulated apparent reflectance is used to retrieve the GOCI AOD (Figure 11).
With the change of angle, the simulated AOD changes in spring, summer and autumn are higher at noon, and smaller in the morning and afternoon (Figure 11). The simulated AOD error in winter is the largest at 8:30 a.m., which may be caused by the residual cloud after GOCI cloud removal. Residual cloud is also one of the reasons for the high AOD retrieval value over land [42]. By comparing Figure 9 and Figure 10, it can be seen that the final simulated AOD change trend is the same. Therefore, the root cause of the difference between the GOCI AOD and AERONET AOD values retrieved at different times in the four seasons in Figure 11 is the inaccurate determination of the surface reflectance. In the case of the same surface reflectance deviation, the larger the solar angle (morning and afternoon), the closer it is to AERONET AOD.
From the above analysis, it can be seen that there is still a certain error between the GOCI AOD retrievals and the ground-based observation value, and this error may be caused by the following three aspects:
(1)
The impact of residual clouds. The residual cloud after GOCI cloud removal may cause GOCI AOD to be higher. Kaufman et al. [41] found that the presence of cirrus clouds over the ocean can cause the MODIS AOD to be higher by 0.015 ± 0.003, suggesting that residual clouds may also be one of the reasons for the higher GOCI AOD over land (Figure 12).
(2)
The influence of surface reflectance. It can be seen from the Equation (4) that the surface reflectance of GOCI is obviously affected by the MODIS surface reflectance determined by the V5.2 algorithm. Moreover, the surface types of different underlying layers may also affect the effect of our algorithm, which mainly affects the surface reflectance, and this topic could be our further study in future.
(3)
Influence from different aerosol types. The aerosol types are constantly changing in different regions and at various time periods. The determination of regional aerosol types can improve the accuracy of AOD retrieval, while this study assumes one single continental aerosol type, and this may be one of the sources of AOD retrieval errors.
Figure 12. Cloud removal results of GOCI data.
Remotesensing 13 02376 g012aRemotesensing 13 02376 g012b

5. Conclusions

This study proposes an algorithm of high-resolution AOD retrieval using GOCI data, and applies it to the AOD retrieval in Yangtze River Delta. Based on the MODIS data and the Ross-Li model, we obtained the surface reflectance of the GOCI data, which solved the problem that the GOCI sensor could not determine the surface reflectance due to the lack of mid-infrared channels, and then realized the AOD retrieval. The errors of retrieving GOCI AOD at different times are determined by comparing with AERONET ground observed AOD. Moreover, we analyzed the causes of the errors in retrieving GOCI AOD. The main conclusions are summarized as follows:
(1)
The algorithm proposed in this study for retrieving AOD using GOCI data is feasible and it can be used to retrieve AOD with high temporal resolution. Using Taihu and Xuzhou-CUMT stations for verification, it can be seen that R can reach 0.84 (8:30 a.m.), and the minimum RMSE is 0.2077 (11:30 a.m.) and 0.1937 (10:30 a.m.), respectively.
(2)
By comparing the estimated surface reflectance of GOCI with the atmospheric corrected reflectance, it is shown that the uncertainty of estimating surface reflectance is the root cause of the errors in retrieving AOD using GOCI data.
(3)
The greater the solar angle of the GOCI sensor, i.e., in the morning and afternoon, the retrieved AOD are more accurate, while the retrieved AOD at noon has the largest error, and thus the GOCI data at noon is unfavorable for retrieving AOD.

Author Contributions

Writing—original draft preparation, L.C.; data curation, Y.F.; writing—review and editing, R.W. and Y.Z.; validation, P.F. and J.H. All authors have read and agreed to the published version of the manuscript.

Funding

This research was funded by the National Natural Science Foundation of China, grant number 41671428 and the China Postdoctoral Science Foundation, grant number 2020M681656.

Acknowledgments

This work was supported by the National Natural Science Foundation of China (No. 41671428) and the China Postdoctoral Science Foundation (2020M681656). We thank the AERONET, MODIS and GOCI groups for sharing their data. Finally, we sincerely thank the anonymous reviewers for their helpful comments.

Conflicts of Interest

The authors declare no conflict of interest.

References

  1. Viana, M.; Pey, J.; Querol, X.; Alastuey, A.; Leeuw, F.D.; Luekewille, A. Natural sources of atmospheric aerosols influencing air quality across europe. Sci. Total Environ. 2014, 472, 825–833. [Google Scholar] [CrossRef]
  2. Strahler, A.H.; Muller, J.; Lucht, W.; Schaaf, C.; Tsang, T.; Gao, F.; Barnsley, M.J. MODIS BRDF/albedo product: Algorithm theoretical basis document version 5.0. MODIS Doc. 1999, 23, 42–47. [Google Scholar]
  3. Keywood, M.; Cope, M.; Meyer, C.P.M.; Iinuma, Y.; Emmerson, K. When smoke comes to town: The impact of biomass burning smoke on air quality. Atmos. Environ. 2015, 121, 13–21. [Google Scholar] [CrossRef]
  4. Crippa, P.; Sullivan, R.C.; Thota, A.; Pryor, S.C. Evaluating the skill of high-resolution wrf-chem simulations in describing drivers of aerosol direct climate forcing on the regional scale. Atmos. Chem. Phys. 2016, 16, 397–416. [Google Scholar] [CrossRef] [Green Version]
  5. Kaufman, Y.J.; Tanré, D.; Gordon, H.R.; Nakajima, T.; Lenoble, J.; Frouin, R.; Teillet, P.M. Passive remote sensing of tropospheric aerosol and atmospheric correction for the aerosol effect. J. Geophys. Res. Atmos. 1997, 102, 16815–16830. [Google Scholar] [CrossRef] [Green Version]
  6. Lee, K.H.; Ryu, J.H.; Ahn, J.H.; Kim, Y.J. First Retrieval of Data regarding Spatial Distribution of Asian Dust Aerosol from the Geostationary Ocean Color Imager. Ocean Sci. J. 2012, 47, 465–472. [Google Scholar] [CrossRef]
  7. Zhang, L.; Xu, S.; Wang, L.; Cai, K.; Ge, Q. Retrieval and Validation of Aerosol Optical Depth by using the GF-1 Remote Sensing Data. IOP Conf. Ser. 2017, 68, 23–25. [Google Scholar] [CrossRef] [Green Version]
  8. Fan, X.; Qu, Y. Retrieval of High Spatial Resolution Aerosol Optical Depth from HJ-1 A/B CCD Data. Remote Sens. 2019, 11, 832. [Google Scholar] [CrossRef] [Green Version]
  9. Bilal, M.; Qiu, Z. Aerosol Retrievals over Bright Urban Surfaces Using Landsat 8 Images. In Proceedings of the IGARSS 2018—2018 IEEE International Geoscience and Remote Sensing Symposium, Valencia, Spain, 22–27 July 2018; pp. 7560–7563. [Google Scholar]
  10. Hagolle, O.; Huc, M.; Villa Pascual, D.; Dedieu, G. A multi-temporal and multi-spectral method to estimate aerosol optical thickness over land, for the atmospheric correction of formosat-2, landsat, venμs and sentinel-2 images. Remote Sens. 2015, 7, 2668–2691. [Google Scholar] [CrossRef] [Green Version]
  11. Carrer, D.; Ceamanos, X.; Six, B.; Roujean, J.-L. Aerus-geo: A newly available satellite-derived aerosol optical depth product over europe and africa. Geophys. Res. Lett. 2014, 41, 7731–7738. [Google Scholar] [CrossRef]
  12. Zawadzka-manko, O.; Stachlewska, I.S.; Markowicz, K.M. Near-real-time application of seviri aerosol optical depth algorithm. Remote Sens. 2020, 12, 1481. [Google Scholar] [CrossRef]
  13. Zhang, Y.; Li, Z.; Zhang, Y.; Hou, W.; Xu, H.; Chen, C.; Ma, Y. High temporal resolution aerosol retrieval using Geostationary Ocean Color Imager: Application and initial validation. J. Appl. Remote Sens. 2014, 8, 83612. [Google Scholar] [CrossRef]
  14. Choi, M.; Kim, J.; Lee, J.; Kim, M.; Park, Y.J.; Jeong, U.; Kim, W.; Hong, H.; Holben, B.; Eck, T.F.; et al. GOCI Yonsei Aerosol Retrieval (YAER) algorithm and validation during the DRAGON-NE Asia 2012 campaign. Atmos. Meas. Tech. 2016, 9, 1377–1398. [Google Scholar] [CrossRef] [Green Version]
  15. Choi, M.; Kim, J.; Lee, J.; Kim, M.; Park, Y.-J.; Holben, B.; Eck, T.F.; Li, Z.; Song, C.H. GOCI Yonsei aerosol retrieval version 2 products: An improved algorithm and error analysis with uncertainty estimation from 5-year validation over East Asia. Atmos. Meas. Tech. 2018, 11, 385–408. [Google Scholar] [CrossRef] [Green Version]
  16. Son, Y.B.; Choi, B.-J.; Kim, Y.H.; Park, Y.-G. Tracing floating green algae blooms in the yellow sea and the East China Sea using goci satellite data and lagrangian transport simulations. Remote Sens. Environ. 2015, 156, 21–33. [Google Scholar] [CrossRef]
  17. Choi, J.-K.; Park, Y.J.; Ahn, J.H.; Lim, H.-S.; Eom, J.; Ryu, J.-H. The world’s first geostationary ocean color observation satellite, for the monitoring of temporal variability in coastal water turbidity. J. Geophys. Res. Oceans. 2012, 117, 9004. [Google Scholar] [CrossRef]
  18. Xu, J.-W.; Martin, R.V.; Van Donkelaar, A.; Kim, J.; Choi, M.; Zhang, Q.; Geng, G.; Liu, Y.; Ma, Z.; Huang, L.; et al. Estimating ground-level pm2.5 in eastern china using aerosol optical depth determined from the goci satellite instrument. Atmos. Chem. Phys. 2015, 15, 13133–13144. [Google Scholar] [CrossRef] [Green Version]
  19. Wongsai, N.; Wongsai, S.; Lim, A.; McNeil, D.; Huete, A.R. Impacts of spatial heterogeneity patterns on long-term trends of moderate resolution imaging spectroradiometer (modis) land surface temperature time series. J. Appl. Remote Sens. 2020, 14, 1. [Google Scholar] [CrossRef]
  20. Hong, G.; Yang, P.; Gao, B.-C.; Baum, B.A.; Hu, Y.X.; King, M.D.; Platnick, S. High cloud properties from three years of modis terra and aqua collection-4 data over the tropics. J. Appl. Meteorol. Clim. 2007, 46, 1840–1856. [Google Scholar] [CrossRef]
  21. Bandaru, V.; West, T.O.; Ricciuto, D.M.; Izaurralde, R.C. Estimating crop net primary production using national inventory data and modis-derived parameters. ISPRS J. Photogramm. 2013, 80, 61–71. [Google Scholar] [CrossRef]
  22. Gao, B.; Jia, L.; Wang, T. Derivation of land surface albedo at high resolution by combining hj-1a/b reflectance observations with modis brdf products. Remote Sens. 2014, 6, 8966–8985. [Google Scholar] [CrossRef] [Green Version]
  23. You, D.; Wen, J.; Xiao, Q.; Liu, Q.; Liu, Q.; Tang, Y. Development of a high resolution brdf/albedo product by fusing airborne casi reflectance with modis daily reflectance in the oasis area of the heihe river basin, china. Remote Sens. 2015, 7, 6784–6807. [Google Scholar] [CrossRef] [Green Version]
  24. Rengarajan, R.; Goodenough, A.A.; Schott, J.R. Simulating the directional, spectral and textural properties of a large-scale scene at high resolution using a MODIS BRDF product. SPIE Remote Sens. Int. Soc. Optics Photonics. 2016, 10000, 100000Y. [Google Scholar] [CrossRef]
  25. Zhu, G.; Ju, W.; Chen, J.M.; Gong, P.; Zhu, J. Foliage clumping index over china’s landmass retrieval from the modis brdf parameters product. IEEE Trans. Geosci. Remote 2012, 50, 2122–2137. [Google Scholar] [CrossRef]
  26. Bhandari, S.; Phinn, S.; Gill, T. Assessing viewing and illumination geometry effects on the modis vegetation index (mod13q1) time series: Implications for monitoring phenology and disturbances in forest communities in Queensland, Australia. Int. J. Remote Sens. 2011, 32, 7513–7538. [Google Scholar] [CrossRef]
  27. Holben, B.; Eck, T.; Slutsker, I.; Tanré, D.; Buis, J.; Setzer, A.; Vermote, E.; Reagan, J.; Kaufman, Y.; Nakajima, T.; et al. Aeronet—A federated instrument network and data archive for aerosol characterization. Remote Sens. Environ. 1998, 66, 1–16. [Google Scholar] [CrossRef]
  28. Dubovik, O.; Smirnov, A.; Holben, B.N.; King, M.; Kaufman, Y.J.; Eck, T.F.; Slutsker, I. Accuracy assessments of aerosol optical properties retrieved from aerosol robotic network (aeronet) sun and sky radiance measurements. J. Geophys. Res. Atmos. 2000, 105, 9791–9806. [Google Scholar] [CrossRef] [Green Version]
  29. Mateos, D.; Antón, M.; Toledano, C.; Cachorro, V.E.; Arboledas, L.A.; Sorribas, M.; Costa, M.J.; Baldasano, J.M. Aerosol radiative effects in the ultraviolet, visible, and near-infrared spectral ranges using long-term aerosol data series over the iberian peninsula. Atmos. Chem. Phys. 2014, 14, 13497–13514. [Google Scholar] [CrossRef] [Green Version]
  30. Lee, Y.H.; Adams, P.J. Evaluation of aerosol distributions in the giss-tomas global aerosol microphysics model with remote sensing observations. Atmos. Chem. Phys. 2010, 9, 2129–2144. [Google Scholar] [CrossRef] [Green Version]
  31. Torres, B.; Toledano, C.; Berjón, A.; Fuertes, D.; Molina, V.; González, R.; Canini, M.; Cachorro, V.E.; Goloub, P.; Podvin, T.; et al. Measurements on pointing error and field of view of cimel-318 sun photometers in the scope of aeronet. Atmos. Meas. Tech. 2013, 6, 3013–3057. [Google Scholar] [CrossRef] [Green Version]
  32. Volkova, K.A.; Poberovsky, A.V.; Timofeev, Y.M.; Ionov, D.V.; Slutsker, I. Aerosol optical characteristics retrieved from cimel sun photometer measurements (aeronet) near st. petersburg. Atmos. Oceanic Opt. 2018, 31, 635–641. [Google Scholar] [CrossRef]
  33. Kaufman, Y.J.; Tanré, D.; Remer, L.A.; Vermote, E.F.; Chu, A.; Holben, B.N. Operational remote sensing of tropospheric aerosol over land from EOS moderate resolution imaging spectroradiometer. J. Geophys. Res. Atmos. 1997, 102, 17051–17067. [Google Scholar] [CrossRef]
  34. Lu, S.; Xue, Y.; Yang, X.H.; Leys, J.; Guang, J.; Che, Y.H.; Fan, C. Joint Retrieval of Aerosol Optical Depth and Surface Reflflectance Over Land Using Geostationary Satellite Data. IEEE Trans. Geosci. Remote Sens. 2019, 57, 1489–1501. [Google Scholar]
  35. Gao, L.; Chen, L.; Li, J.; Li, C.; Zhu, L. An improved dark target method for aerosol optical depth retrieval over China from Himawari-8. Atmos. Res. 2021, 250, 105399. [Google Scholar] [CrossRef]
  36. Chen, L.; Wang, R.; Wei, G.; Han, J.; Zha, Y. A surface reflectance correction model to improve the retrieval of MISR aerosol optical depth. Adv. Space Res. 2021, 67, 858–867. [Google Scholar] [CrossRef]
  37. He, J.; Zha, Y.; Zhang, J.; Gao, J.; Wang, Q. Synergetic retrieval of terrestrial aod from modis images of twin satellites terra and aqua. Adv. Space Res. 2014, 53, 1337–1346. [Google Scholar] [CrossRef]
  38. Holben, B.; Vermote, E.; Kaufman, Y.; Tanre, D.; Kalb, V. Aerosol retrieval over land from AVHRR data-application for atmospheric correction. IEEE Trans. Geosci. Electron. 1992, 30, 212–222. [Google Scholar] [CrossRef]
  39. He, J.; Zha, Y.; Zhang, J.; Gao, J.; Li, Y.; Chen, X. Retrieval of aerosol optical thickness from HJ-1 CCD data based on MODIS-derived surface reflectance. Int. J. Remote Sens. 2015, 36, 882–898. [Google Scholar] [CrossRef]
  40. Wang, Z.T.; Li, Q.; Wang, Q.; Li, S.S.; Xu, Y.J. HJ-1 terrestrial aerosol data retrieval using deep blue algorithm. J. Remote Sens. 2012, 16, 596–610. [Google Scholar]
  41. Qi, X.M.; Ding, A.J.; Nie, W.; Petäjä, T.; Kerminen, V.-M.; Herrmann, E.; Xie, Y.N.; Zheng, L.F.; Manninen, H.E.; Aalto, P.P.; et al. Aerosol size distribution and new particle formation in the western yangtze river delta of china: 2 years of measurements at the sorpes station. Atmos. Chem. Phys. 2015, 15, 12445–12464. [Google Scholar] [CrossRef] [Green Version]
  42. Kaufman, Y.J.; Remer, L.A.; Tanre, D.; Li, R.-R.; Kleidman, R.; Mattoo, S.; Levy, R.C.; Eck, T.; Holben, B.; Ichoku, C.; et al. A critical examination of the residual cloud contamination and diurnal sampling effects on modis estimates of aerosol over ocean. IEEE Trans. Geosci. Electron. 2005, 43, 2886–2897. [Google Scholar] [CrossRef]
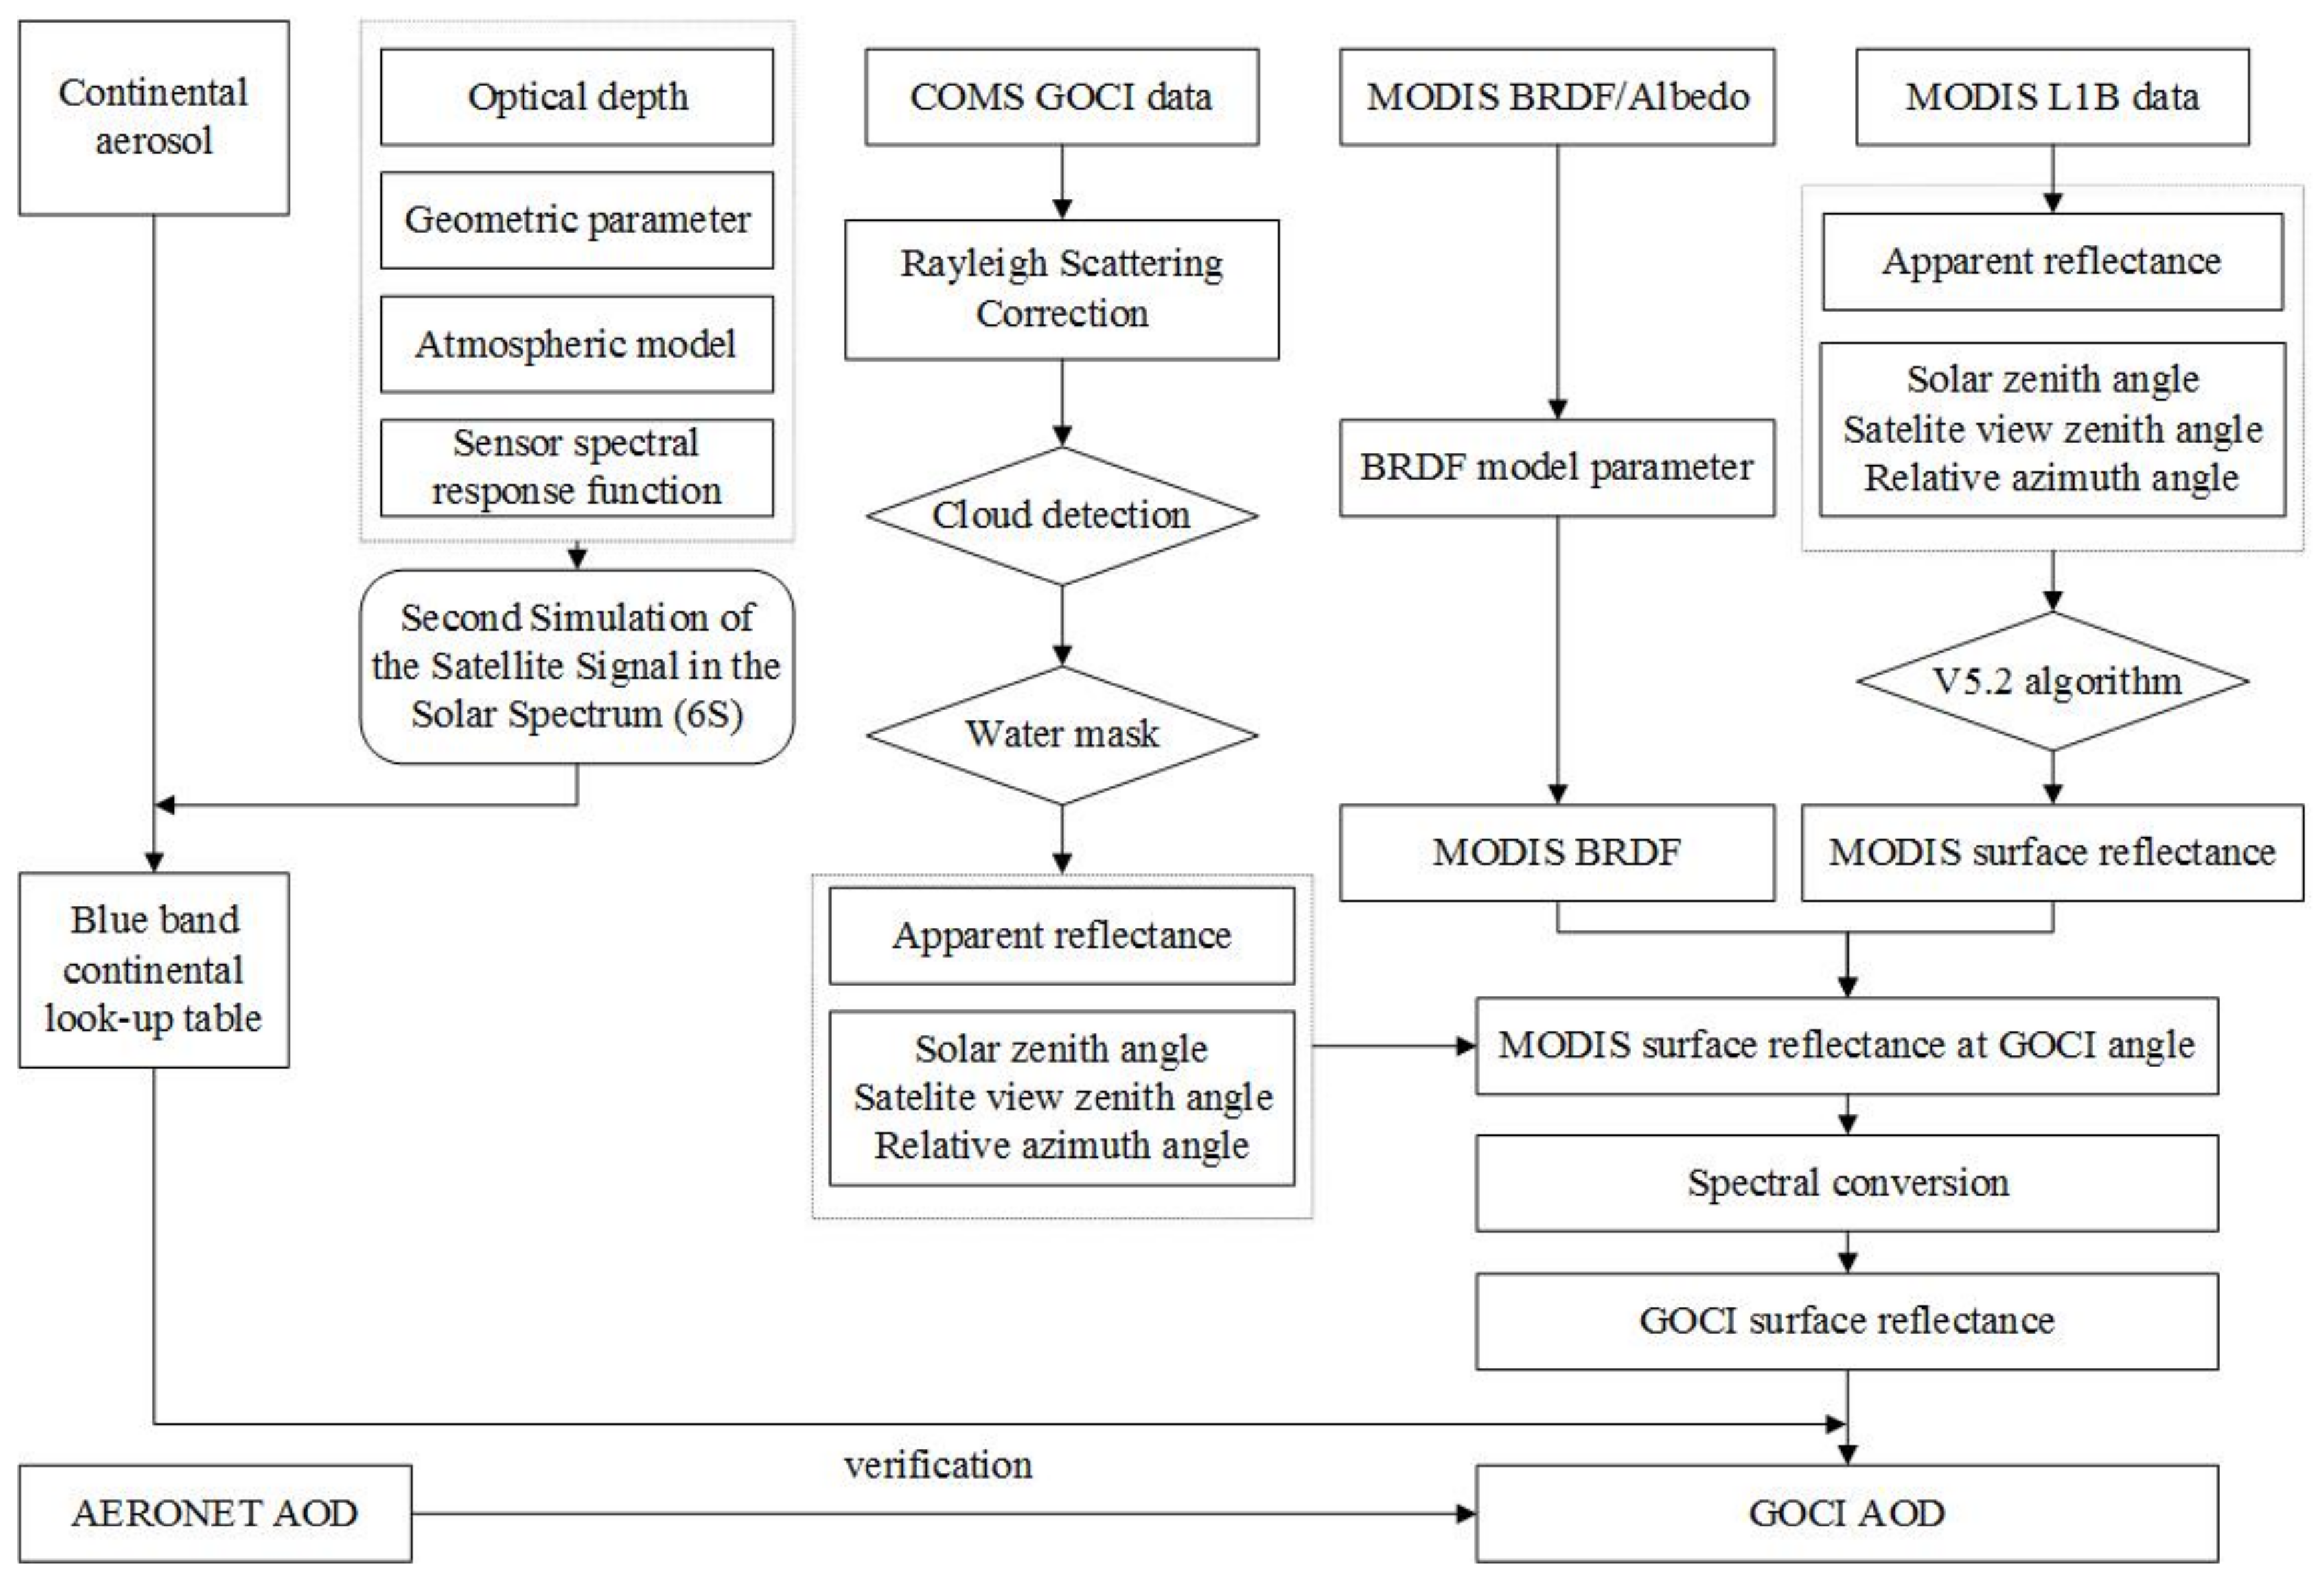
Figure 1. Flow chart of the AOD retrieval algorithm from GOCI data.
Remotesensing 13 02376 g001
Figure 2. GOCI spectral response function (B1–B8) and MODIS blue band spectral response function.
Remotesensing 13 02376 g002
Figure 3. The linear regression analysis of MODIS and GOCI B3 blue band surface reflectance.
Remotesensing 13 02376 g003
Figure 4. Remote sensing image of the study area (The study selected images taken at 8:30 a.m. on 6 November 2017, and the color image is a composite image of GOCI bands 8, 7 and 6); (a) GOCI remote sensing image, (b) The location of the study area in China.
Remotesensing 13 02376 g004
Figure 5. GOCI AOD retrieval results at 550 nm on 23 February 2018. ((ah) are the results of image retrieval with an interval of 8:30 a.m.–15:30 p.m., respectively).
Remotesensing 13 02376 g005
Figure 6. Comparison between AOD retrieved from GOCI images and Taihu station measurements (The upper left corner indicates the sensor observation time, N is the number. (ah) are the verification results of 8:30 a.m.–15:30 p.m., respectively).
Remotesensing 13 02376 g006aRemotesensing 13 02376 g006b
Figure 7. Comparison between AOD retrieved from GOCI images and Xuzhou-CUMT station measurements (The upper left corner indicates the sensor observation time, N is the number. (ah) are the verification results of 8:30 a.m.–15:30 p.m., respectively).
Remotesensing 13 02376 g007aRemotesensing 13 02376 g007b
Figure 8. Mean absolute error and mean relative error at eight moments; (a) is mean absolute error at eight moments, (b) is mean relative error at eight moments.
Remotesensing 13 02376 g008
Figure 9. The influence of geometric conditions on retrieval of GOCI AOD (The ordinate of the apparent reflectance is the value on the left, and the ordinate of the other four curves are the value on the right); (a) Taihu, (b) Xuzhou-CUMT.
Remotesensing 13 02376 g009
Figure 10. The influence of surface changes in four seasons on the retrieval of GOCI AOD. (The value of apparent reflectance is shown on the left ordinate, and the ordinate of the remaining four curves are the right value).
Remotesensing 13 02376 g010aRemotesensing 13 02376 g010b
Figure 11. The influence of the four seasons on the retrieval of GOCI AOD. The ordinate of the apparent reflectance is the value on the left, and the ordinate of the other four curves are the value on the right).
Remotesensing 13 02376 g011aRemotesensing 13 02376 g011b
Table 1. Characteristics of the spectral bands on GOCI [16].
Band.Center Band
(nm)
Band Width
(nm)
TypesPrimary Use
B141220Visible lightYellow substance and turbidity
B244320Visible lightMaximum chlorophyll absorption
B349020Visible lightVisible chlorophyll and other pigments
B455520Visible lightTurbidity
B566020Visible lightFluorescence signal and suspended sediment
B668010Visible lightAtmospheric correction and fluorescence signal
B774520Near infraredAtmospheric correction and fluorescence signal baseline
B886540Near infraredAerosol optical depth and water vapor volume
Table 2. Summary of AERONET stations.
StationLongitude/LatitudeSelected Observation Time
Taihu120.215 ° E/31.421 ° N2017–2018
Xuzhou-CUMT117.142 ° E/34.217 ° N2017–2018
Table 3. Input parameters of 6S model.
IDParameter NameInput Parameters
1Solar zenith angleAccording to the actual angle range of the image, the step size is set to 1°
2Satellite view zenith angle39, 40, 41, 42, 43
3Relative azimuth angleAccording to the actual angle range of the image, the step size is set to 1°
4AOD0.01, 0.1, 0.2, 0.3, 0.4, 0.5, 0.6, 0.7, 0.8, 0.9, 1.0, 1.1, 1.2, 1.3,1.4, 1.5, 1.95
5Atmospheric modelMid-latitude summer and mid-latitude winter
6Aerosol typeContinental
Table 4. Comparison of ground reflectance and AOD with atmospheric correction reflectance and AERONET AOD.
StationTimeSurface ReflectanceAtmospheric Correction ReflectanceSurface Reflectance DifferenceGOCI AODAERONET AODAOD Difference
Taihu8:300.032520.070650.038130.552230.392540.15969
9:300.032460.072600.040140.664770.421200.24357
10:300.032230.072220.039990.709660.437030.27262
11:300.033990.079140.045150.696650.442100.25455
12:300.036700.077500.040800.717210.447140.27007
13:300.035920.080630.044710.736670.475070.26160
14:300.036460.077430.040970.660740.452180.20856
15:300.036820.085570.048750.635340.472570.16277
Xuzhou-
CUMT
8:300.054640.088590.033950.561620.469610.09201
9:300.052580.084070.031490.630160.491000.13915
10:300.052830.087850.035020.664320.483090.18122
11:300.050150.091770.041620.730210.488620.24159
12:300.052550.085420.032870.662870.458480.20439
13:300.052130.090280.038140.711730.498070.21366
14:300.050090.100630.050540.687050.507610.17944
15:300.051010.088410.037400.627720.513540.11418
Publisher’s Note: MDPI stays neutral with regard to jurisdictional claims in published maps and institutional affiliations.