Technical Note

The Links between Canopy Solar-Induced Chlorophyll Fluorescence and Gross Primary Production Responses to Meteorological Factors in the Growing Season in Deciduous Broadleaf Forest

1
Key Laboratory of Tree Breeding and Cultivation of State Forestry Administration, Research Institute of Forestry, Chinese Academy of Forestry, Beijing 100091, China
2
Collaborative Innovation Center of Sustainable Forestry in Southern China, Nanjing Forestry University, Nanjing 210037, China
3
Institute of Desertification Studies, Chinese Academy of Forestry, Beijing 100091, China
*
Author to whom correspondence should be addressed.
Remote Sens. 2021, 13(12), 2363; https://doi.org/10.3390/rs13122363
Submission received: 26 April 2021 / Revised: 4 June 2021 / Accepted: 12 June 2021 / Published: 17 June 2021
(This article belongs to the Section Forest Remote Sensing)

Abstract

:
Solar-induced chlorophyll fluorescence (SIF) is a hopeful indicator, which along with remote sensing, is used to measure the photosynthetic efficiency and gross primary production (GPP) of vegetation in regional terrestrial ecosystems. Studies have found a significant linear correlation between SIF and GPP in a variety of ecosystems. However, this relationship has mainly been established using SIF and GPP data derived from satellite remote sensing and continuous ground-based observations, respectively, which are difficult to accurately match. To overcome this, some studies have begun to use tower-based automatic observation instruments to study the changes of near-surface SIF and GPP. This study conducts continuous simultaneous observation of SIF, carbon flux, and meteorological factors on the forest canopy of a cork oak plantation during the growing season to explore how meteorological factors impact on canopy SIF and its relationship with GPP. This research found that the canopy SIF has obvious diurnal and day-to-day variations during the growing season but overall is relatively stable. Furthermore, SIF is greatly affected by incident radiation in different weather conditions and can change daily. Meteorological factors have a major role in the relationship between SIF and GPP; overall, the relationship shows a significant linear regression on the 30 min scale, but weakens when aggregating to the diurnal scale. Photosynthetically active radiation (PAR) drives SIF on a daily basis and changes the relationship between SIF and GPP on a seasonal timescale. As PAR increases, the daily slopes of the linear regressions between SIF and GPP decrease. On the 30 min timescale, both SIF and GPP increase with PAR until it reaches 1250 μmol·m−2·s−1; subsequently, SIF continues to increase while GPP decreases and they show opposite trends. Soil moisture and vapor pressure deficit influence SIF and GPP, respectively. Our findings demonstrate that meteorological factors affect the relationship between SIF and GPP, thereby enhancing the understanding of the mechanistic link between chlorophyll fluorescence and photosynthesis.

Graphical Abstract

1. Introduction

Photosynthesis is one of the most important physiological activities in the existence of plant life; it is the source of all biological energy and is an important promoter of terrestrial ecosystem circulation [1,2]. Therefore, the research of photosynthesis is essential for understanding the energy flow of terrestrial ecosystems [3]. With the development of techniques for measuring photosynthesis, great progress has been made in photosynthetic measurements at the leaf and even the crop canopy scale [4]. However, measuring the photosynthetic capacity of tall trees and forests at the canopy scale presents technological challenges due to the limitations of canopy uniformity and inhomogeneous landscapes. With the deepening of plant physiology research, it has been discovered that chlorophyll fluorescence (ChlF), a co-product of plant photosynthesis, has potential for reflecting the photosynthetic capacity and photosynthetic status of plants.
Light energy absorbed by chlorophyll pigments in photosystem II (PSII) in leaves dissipates by three main pathways: photochemistry (photochemical quenching, PQ), non-radioactively as heat (non-photochemical quenching, NPQ), and re-emitted as fluorescence [5]. It is the theoretical foundation of a unique relationship between ChlF and photochemistry efficiency as long as the NPQ is considered constant during the growing season while the pigment pool only varies slightly. The amount of ChlF changes with the ratio of absorbed light energy available for photosynthesis; hence, it can be used as a proxy of GPP on the canopy scale and beyond. As a form of light, ChlF can be captured by a hyperspectral resolution spectrometer [6,7,8]. SIF captured on the plant canopy scale in the natural state through instruments mixed with a reflectance signal can be retrieved based on the Fraunhofer lines discriminator (FLD) method [9,10] and is used for estimating GPP of terrestrial ecosystems, which provides favorable conditions for studying the spatial–temporal variation characteristics of GPP. An increasing number of studies have begun to explore and use chlorophyll fluorescence as a probe to reveal the physiological state of plants [11].
The emission spectrum of chlorophyll fluorescence is continuous within the wavelength range of 650–800 nm, with two emission peaks of red light and near-infrared light at 688 nm and 740 nm, respectively, of which the peak of red light is higher. However, the emission spectra of ChlF overlaps with the absorption spectra of chlorophyll, part of the red fluorescence (FR) can be reabsorbed by leaves or canopy, varying greatly depending on the canopy structure [5,12,13]. The ratio of FR being reabsorbed can reach up to 90% [14,15,16]. Near-surface SIF obtained at the top of the canopy depends on the re-absorption and scattering process of the canopy, this action varying by leaf optical properties, direction, leaf area index, and canopy structure [12,17]. When using canopy SIF to estimate GPP, the influence of the leaf and canopy structure on SIF signal also needs to be considered [5]. The SIF signal at 760 nm is less affected by canopy re-absorption and can be separated from the reflectance signal based on the FLD principle [12,13], so it is widely used [18].
For certain plant functions, SIF and GPP have an indirect relationship through the absorbed PAR (APAR) [19]; the relationship between SIF and GPP is affected by factors such as canopy structure [17,20], vegetation biochemical parameters [21], and sampling time [22]. SIF is driven by APAR and can be used to estimate GPP well in ecosystems where vegetation productivity is mainly determined by chlorophyll content [23]. Previous studies have shown that SIF is sensitive to changes in the photochemical processes in the leaves [24], canopy [8,25,26], and ecosystem scale [12,23,27]. On seasonal or inter-annual scales, model simulation and field measurement results testify that a clear linear relationship exists between SIF and GPP [12,23,28,29]. However, with increasing attention in the literature, nonlinear relationships between SIF and GPP have been revealed [30,31,32,33], which have provided evidence for fluorescence and photosynthesis divergence at smaller spatiotemporal scales [34]. ChlF contains lots of information related to photosynthesis regarding the light utility efficiency and is closely related to plant vitality and biological yield. This means it is directly related to photosynthesis on the physiological level. SIF and GPP compete for absorbed light photons and an increase in the photosynthetic rate will reduce the ChlF. However, fluorescence is not only a “photon competitor”; when the incident light is too high, fluorescence acts as a “protector” that can emit excess light photons to protect the photosynthesis system from damage. The sensitivity of the relationship may change during the day and season with changes in light conditions, as well as varying by species. Despite there being empirical evidence that SIF has novel information about photosynthesis dynamics compared with previous remote sensing data [11,23,35], the mechanism link between SIF and GPP is still unclear.
The coupling mechanism process of SIF and GPP on a seasonal scale also needs further study since the accuracy of GPP estimates by SIF is influenced by the multiple meteorological factors [36]. Airborne platforms and satellite remote sensing obtain instantaneous data of SIF on discrete days [34,37]. SIF and GPP show daily variations with changes in incident radiation and the temporal and spatial distribution of SIF is more indicative than its absolute value [38] for estimating GPP. The connection between SIF and GPP is very complex and is difficult to explain by only analyzing satellite instantaneous fluorescence and daily average GPP [39]. Therefore, automatic and continuous ground observation data is necessary for exploring the dynamic changes between SIF and GPP [8,25,40]. However, most current research focus on croplands [17,23] or grasslands [41], and there is a lack of research on forest ecosystems with more complex canopy structures and longer growth cycles [8]. Therefore, the feasibility of the linear relationship and its applicability to different time scales and plant functions needs to be verified and more research on forest ecosystems is needed to confirm the use of continuous ground-based SIF observations combined with tower-based GPP data to explore the links between SIF and GPP.
We combine tower-based carbon flux and continuous ground far-red SIF data with meteorological data taken at a cork oak plantation at the Xiaolangdi station in Henan province, China, between June and November 2019, to explore the temporal change characteristics of SIF and its relationship with GPP under different weather conditions. The aim is to reveal the effects of changes in meteorological factors, such as radiation, on SIF and GPP and provide a theoretical basis to support the use of SIF to estimate ecosystem productivity. The major objectives of this study are as follows: (1) to explore the temporal distribution characteristics of SIF in the canopy of cork oak plantation, (2) to determine the relationship between canopy SIF and GPP on different time scales, and (3) to understand the impact of meteorological factors on the relationship between canopy SIF and GPP.

2. Materials and Methods

2.1. Overview of the Study Area

The sample plot for this study was at the Yellow River Xiaolangdi Forest Ecosystem Positioning Research Station of the State Forestry Administration (35°01′ N, 112°28′ E, average altitude of 410 m). The station is located in Jiyuan City, Henan Province, in the middle of the Yellow River Basin [42]. The experimental area has typical sub-tropical monsoon climate characteristics, with rain and heat in the same season and abundant water and heat resources in summer. The annual mean temperature is 12.4–14.3 °C, the annual total sunshine duration is 2367.7 h, and the annual mean precipitation is about 642 mm. Affected by the monsoon climate, the four seasons have distinct climates variations; the seasonal distribution of precipitation is uneven, the mean precipitation from June to August (438.0 mm) accounting for 68.3% of the entire year. The main tree species in the study area are cork oak (Quercus variabilis var. variabilis), arborvitae (Platycladus orientalis), and locust (Robinia pseudoacacia), with cork oak accounting for more than 80% of the forest area, and the forest age is 47 years. The required observations were completed simultaneously from June to September 2019, the average leaf area index (LAI) for the study period was 3.96, which declined slightly in mid-to-late September due to leaf curling caused by autumn drought.

2.2. Flux Data and Meteorological Observation

An open-path eddy covariance (OPEC) system was installed on the platform at a height of 36 m on a flux tower to measure CO2 flux [43,44]. The CO2 exchange rate through turbulence between canopy and the atmosphere was measured by the system. The whole system was made up of a three-dimensional sonic anemometer (CSAT3, Campbell Scientific Inc., Logan, UT, USA) and a fast response infrared gas analyzer (IRGA, Model LI-7500A, Li-Cor Inc., Lincoln, NE, USA). The raw EC data were collected at a frequency of 10 Hz and stored in a datalogger (Li-7550, Li-Cor Inc., Lincoln, NE, USA). Then the raw data were processed into 30 min timescale to acquire the net ecosystem exchange (NEE) of CO2. GPP can be calculated from the NEE using the equation
NEE = Re − GPP
where Re is the respiration of the ecosystem during the day, calculated as an exponential function of air temperature (Ta) using the relationship developed from NEE at night, and measured by the flux tower and the corresponding temperature observations [45]. Therefore, GPP can be partitioned from the daytime NEE [46].
The meteorological gradient observation system included a 7-layer anemometer (Model WindSonic, Gill Inc., Hampshire, UK and a 7-layer HMP155 temperature and humidity sensor (Vaisala, Vantaa, Finland) (installation heights are 5, 8, 11, 14, 18, 26 and 32 m, respectively). In addition, at a height of 17 m, a CNR-1 net pyranometer (Kipp and Zonen, Delft, The Netherlands), and a Li-190SB point light quantum meter (Li-Cor Inc., Lincoln, NE, USA), and a rain gauge (Model TE525MM, Campbell Scientific Inc., Logan, UT, USA)) were installed. The soil temperature and moisture probe (METER Group, Inc., Pullman, WA, USA) was installed at a soil depth of 5, 10 and 20 cm. The above instrument was connected to a CR1000 datalogger (Campbell Sci., Logan, UT, USA), the raw data was collected every 15 s and mean or accumulated data were output every half hour [42].
The vapor pressure deficit (VPD) is a parameter that characterizes the degree of air dryness and was calculated according to Equation (2)
V P D = 0.611 × e 17.27 × T a 237.3 + T a × ( 1 R H 100 )

2.3. Observation of Canopy Solar-Induced Chlorophyll Fluorescence

The SIF observation was conducted by a Top-of-Canopy spectrometer (AutoSIF-1, Bergsun Inc., Beijing, China), which was an automatic long-term system fixed on the stationary ground-based platform 10–12 m above the closed canopy. The observation system adopts a single high-resolution spectrometer (QE65 Pro, Ocean Optics Inc., Dunedin, FL, USA) with a sampling interval of 0.155 nm, spectral resolution of 0.31 nm, SNR of 1000:1 and a spectral range of 650–800 nm. A vertically upward CC-3 cosine corrector (Ocean Optics Inc., Dunedin, FL, USA) was installed at the end of upward fiber used to collect the downward solar irradiance spectrum, and a bare fiber (Ocean Optics Inc., Dunedin, FL, USA) with VAZ = 25° inclined downward was used to measure the upward canopy radiance reflection spectrum. In order to minimum the measurements errors caused by meteorological conditions (such as clouds), the measurement adopts a “sandwich” mode [21], in which the spectrometer first collects solar radiation, then quickly switches the shutter to measure canopy radiation, and finally switches to measure solar radiation, with all measurements recorded at the same time. Before each data acquisition, the instrument optimizes the integration time automatically according to the light intensity at that time. Therefore, the period of each measurement depends on the light conditions at the time, and it will be shorter at midday than at sunrise or sunset [47]. During the growing season, the canopy solar-induced chlorophyll fluorescence is continuously monitored, and the instrument is calibrated regularly.
The retrieval of SIF signal are generally based on the principle of FLD. We applied the spectral fitting method (SFM) approach to gain the SIF signals [48] in this study; the SFM method assumes that both the reflectance and fluorescence as a function of wavelength are in accordance with Taylor polynomials. Three bands of spectral data were needed, including one in the absorption band and two on both sides of the absorption band [49]. All original SIF signals were resampled into 30 min intervals by Python 3.7.6 (Python Software Foundation, Beaverton, OR, USA). Research have demonstrated that SIF in the red band may involve more PSII-related information. However, due to the more complex impacts of canopy structure and direction, and angle of observation instrument on red SIF than on far-red SIF [5], we only considered the relationship between canopy far-red SIF and GPP in this study for the purpose of minimizing the influence of re-scatting and the re-absorption on SIF signals.

2.4. Data Processing

2.4.1. Definition of Weather Conditions

Previous studies have pointed out that the relationship between chlorophyll fluorescence and photosynthesis differs between sunny and cloudy weather conditions; we intended to compare the fluorescence–photosynthetic relationship in the two conditions. We adopted the clearness index (CI) during the study period to distinguish the weather conditions [50]. CI was defined at the ratio of the radiation received on the ground to the theoretical radiation on the top of atmosphere at the same time. Weather conditions were differentiated using CI, calculated as
R0 = S0 × (1 + 0.033 × cos (2π × DOY/365)) × cos (SZA)
CI = Rg/R0
where S0 represents the solar constant (1367 W/m2), DOY is day of year, SZA indicates the solar zenith angle, Rg is the solar radiation received on the surface of the region, R0 represents the theoretical radiation at the top of the atmosphere [21]. We applied the ratio threshold of 0.5 to distinguish sunny and cloudy days in this research [21]. When the daily mean CI is greater than 0.5, the day is defined as sunny and cloudy days are otherwise.

2.4.2. Data Processing and Analysis

The raw data obtained by the data collector needed to be filtered before use. In the process of CO2 flux observation, weather factors such as rainfall or instrument failure would cause missing or abnormal observation data. The data needed to be screened and abnormal values removed. Night-time flux data with frictional wind speed less than 0.15 m·s−1 and data with a variance of more than 3σ from the monthly average were excluded. Linear interpolation was used for missing data within 2 h of a known point [51,52].
Since the installation height of AutoSIF-1 is close to the tree canopy, the impact of cloud and other weather conditions on the data is negligible. It is considered that the quality of the data obtained under weather conditions other than rainy days is reliable and can be used. Since PAR is the biggest driver of plant photosynthesis and fluorescence emission and is only a factor between sunrise and sunset, data outside this range was deleted. Data influenced by human factors or equipment failure that led to days with missing data were deleted. Due to the rapid changes in weather conditions, the data may have outliers of less than 0 or extra-large (within the μ ± 3σ, where μ and σ are the average and standard deviation, respectively), and these data were discarded. Overall, during the 122 day study period, a total of 85 days (including 45 sunny days and 40 cloudy days) of data can be used.

3. Results

3.1. The Dynamic of SIF, GPP, and Meteorological Factors during the Growing Season

The growth of cork oak plantations starts from March and basically stops in mid-November. The canopy closes at the end of May and stays stable from June to September. We conducted our research during this stable time period. During the growing season, SIF showed conspicuous diurnal and day to day variations (Figure 1). The diurnal pattern of SIF changes with meteorological factors mostly due to the incoming radiation under different weather conditions (Figure 1 and Figure 2). However, the overall trend was relatively stable across the whole season. The trend of SIF was relatively consistent with PAR, which is the dominant driving factor of seasonal changes. At the early stage of the growing season, compared with GPP, SIF fluctuated more. GPP was relatively stable at the early stage of the growing season, and varied drastically in the later stage (Figure 1). During the growing season, the daily mean Ta, PAR, VPD, and soil moisture (SM) varied from 15.62–32.2 °C, 19.2–641.16 μmol·m−2·s−1, 0–2.209 KPa, and 11.71–27.84%, respectively. The maximum 30 min mean values were 40.22 °C, 1883 μmol·m−2·s−1, 4.13 KPa, and 39.08%, respectively, while the minimum SM was 11.59%. Comparing the meteorological factors in the growing season, VPD and PAR had a relatively consistent trend. Meteorological factors all showed obvious daily fluctuations in the growing season except for SM, which showed a small diurnal variation (Figure 1). SM only increased significantly after rain and then gradually decreased with time. SM varied more by season than by day. NDVI fluctuated greatly in the early growth phase, stayed relatively stable in the middle phase, and slowly decreased in the later phase. Some of its changes were consistent with SM, and were due to meteorological fluctuations caused by rain. Compared to NDVI, SIF fluctuated more drastically during the growing season and can better track the daily changes in productivity.
In order to observe the diurnal characteristics of SIF, diurnal patterns were plotted for 3 days that were under different weather conditions (Figure 2). For these 3 consecutive days, deviation caused by canopy structure and leaf chlorophyll content were negligible. However, SIF presented an obvious diurnal pattern, increasing steadily in the morning and decreasing in the afternoon on sunny days, reaching a maximum at approximately 12:30, along with incoming radiation that reached its maximum around noon, which means that PAR may be the main driving factor of SIF change. The rate of change in the afternoon was greater than that in the morning. SIF on cloudy and rainy days exhibited gradual variation of PAR at the diurnal timescale and showed a hysteretic phenomenon with PAR, which was not found on sunny days. SIF on the cloudy and rainy day reached its maximum at approximately 12:00 and 16:00, respectively, consistent with changes in PAR. The time interval of each measurement was different because light intensity affected the integration time.

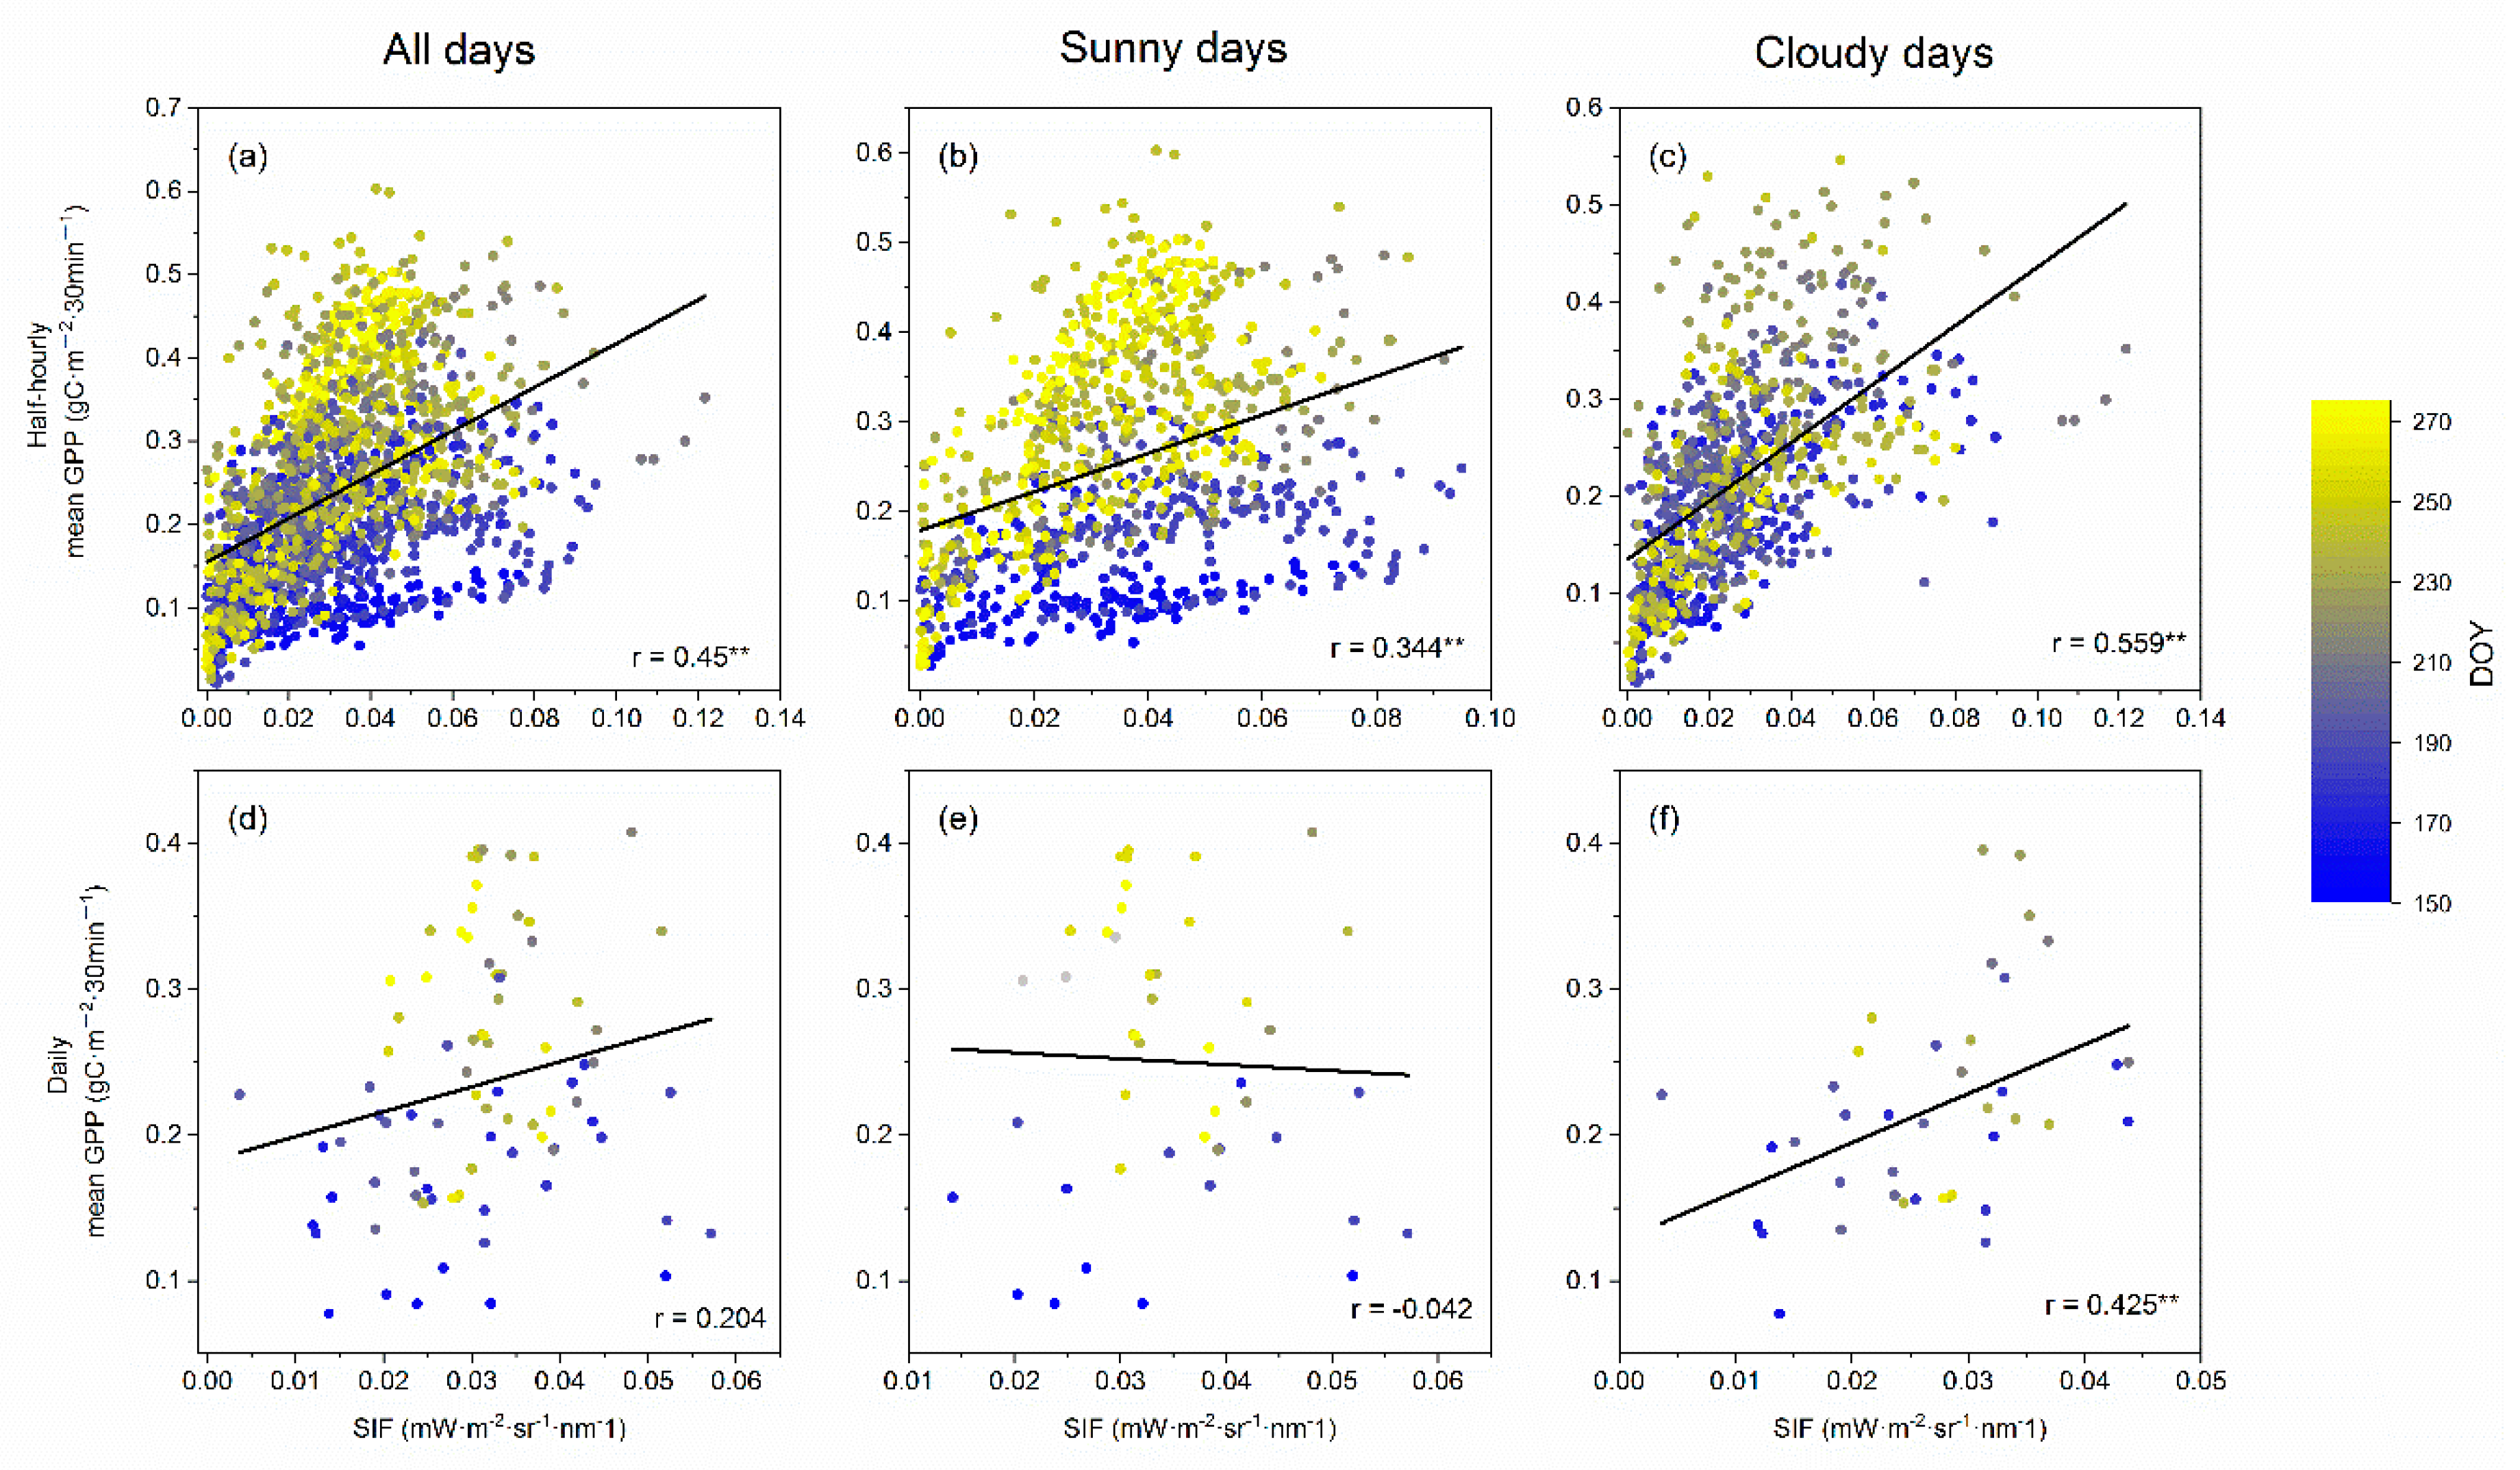
3.2. The Relationship between Canopy SIF and GPP in Multi-Timescales

The relationship between SIF and GPP in 30 min and daily scales showed that they had a positive correlation under different weather conditions (Figure 3). On the 30 min scale, SIF and GPP had a significant correlation for all days, but the correlation coefficient decreased slightly by 0.106 on sunny days, and increased slightly by 0.109 on cloudy days. On sunny days, the slope between SIF and GPP also changed with the change of DOY and had obvious stratification due to DOY, while this phenomenon was not obvious and points were evenly distributed in all stages of the growing season on cloudy days. The points on cloudy days were more concentrated, so the correlation coefficient was higher than for sunny days, increasing by 0.215 for the 30 min scale. In addition, incoming radiation also impacted on the slope of the linear regression of SIF and GPP, impacts that were larger for cloudy conditions than for sunny days in the 30 min scale.
The correlation between SIF and GPP deteriorates when aggregating the 30 min averages to daily averages. Among them, the correlation coefficient decreased significantly under all day and sunny conditions, and there was no significant correlation between SIF and GPP on the daily scale under both conditions. Although the linear correlation between SIF and GPP was weak on sunny days in the growing season, from a single-day scale analysis, the two had a strong linear relationship, and the fitting coefficients were mostly above 0.5 (Figure 4). As the values were aggregated, some linear relationship details on the diurnal scale became obscured. SIF and GPP on cloudy days had a significant correlation, however, with the correlation coefficient decreased by 0.134 compared to the 30 min scale. On the daily scale, we can still see the stratification in slopes caused by DOY under sunny conditions and points more concentrated in cloudy days.

3.3. How do Meteorological Factors Contribute to the Relationships?

Meteorological factors like radiation, SM, and VPD impacted the photosynthetic center and affected the distribution of absorbed light energy by leaves. While PAR was the most critical factor affecting SIF and GPP at different time scales (highest Pearson’s correlation coefficient of 0.872 for SIF at the 30 min scale), VPD and SM also had significant positive correlations with SIF on the 30 min timescale (Table 1). On the daily scale, PAR was positively related to SIF and negatively to GPP, most of the negative correlation was due to the growth rhythm, the significantly lower GPP was observed in early June at the same PAR level (Figure 1 and Figure S1). It was also the only meteorological factor that affected both SIF and GPP on the daily scale. Consequently, we drew a conclusion that the seasonal variations of SIF and GPP were primarily driven by the change in PAR that accounted for most of the variations in SIF and GPP. VPD only had a positive correlation with SIF on the 30 min timescale and no correlation on the daily scale. On the daily scale, VPD and GPP had a significant negative correlation (Table 1). SM had an obvious diurnal variation trend on the seasonal scale, but had a smaller diurnal variation during non-rainy days (Figure 1). SM had a significant correlation with SIF on both the 30 min and the daily scale, and the correlation increased with the aggregation. However, it had no correlation with GPP on either time scale. On the 30 min scale, the difference in meteorological factors affecting SIF and GPP was mainly reflected in the correlation between changes in VPD and SM with SIF, but there was no such relationship with GPP. On the daily scale, the meteorological factors affecting SIF and GPP were quite different. The relationship between PAR with SIF and GPP shows the opposite pattern. Besides PAR, VPD was the main factor that affected GPP while SM had a great impact and a significant positive correlation with SIF on the daily scale.
Therefore, we analyzed the influence of meteorological factors on the slope of linear regression between SIF and GPP on a single day to understand why the relationship deteriorated with aggregation. The impact of PAR on SIF and GPP was not only reflected in its significant correlation with both of them, but also in its impact on the slope of SIF and GPP in data from all days. In all sunny day data, PAR had a significant linear correlation with the daily slope (Figure 4). With the increase of PAR on the daily scale, the slope between the SIF and GPP gradually decreased, and R2 was 0.629, indicating that PAR can explain 62.9% of the variations in the slope between SIF and GPP. The variation of PAR on a seasonal scale may be considered as the reason for the dispersion of SIF and GPP points on sunny days. Therefore, the correlation weakened with aggregation.
We analyzed the relationship between different meteorological factors and SIF and GPP on a 30 min timescale. With an increase in PAR, both SIF and GPP showed different trends. When PAR was lower than 1250 μmol·m−2·s−1, both SIF and GPP increased with an increase in PAR, and GPP reached a maximum of 0.316 g C·m−2·30 min−1 when PAR was 1250 μmol·m−2·s−1. When PAR exceeded 1250 μmol·m−2·s−1, the relationship between GPP and PAR showed an opposite trend, and decreased significantly with an increase in PAR. Meanwhile SIF and PAR showed a significant increase of 96.95% in the slope (PAR < 1250 μmol·m−2·s−1, K = 3.24; PAR > 1250 μmol·m−2·s−1, K = 6.39; Figure 5). With an increase in PAR, GPP had an obvious photo-inhibition phenomenon accompanied by a significant increase in SIF production. In consideration of the influence of VPD on GPP and SM on SIF on the daily scale (Table 1), we fitted the two sets of data on the 30 min timescale (Figure 5). With the increase of VDP, GPP showed a downward trend and there was a significant correlation between VPD and GPP which was not found in SIF (Figure 5, Table 1). With the increase of SM, SIF showed an upward trend and was significantly correlated with SM.

4. Discussion

Previous studies have reported that at smaller spatiotemporal scales, the linear relationship between SIF and GPP did not apply to certain plant functions. Therefore, we intended to use continuous ground observation data to analyze the applicability of the linear relationship in a cork oak plantation canopy. In this study, we collected continuously ground-observed canopy SIF, GPP, and meteorological data in the growing season from June to September in 2019, during which divergences in canopy structure and chlorophyll content are negligible. Furthermore, the change patterns in SIF, relationship with GPP, and the influence of environmental factors during different timescales were elucidated.

4.1. The Change Pattern of SIF in Growing Season

In previous studies, the SIF data based on satellites and UAV platforms only had the instantaneous data when the sensor crossed and not consequent on a daily scale and beyond. There is a lack of understanding of SIF variations on a smaller timescale. This research is based on the continuous ground observation data during the growing season and has a more detailed understanding of the change pattern in SIF of the cork oak canopy under different weather conditions. During the study period, the canopy SIF showed different diurnal patterns but showed an accordant trend for incident radiation during sunny and cloudy days. PAR was the main driver of the change of SIF under different sky conditions [53]. This result is consistent with research conducted on a rice paddy, which found that when compared with GPP, SIF has a stronger correlation with absorbed light [19]. Our results show that SIF and GPP fluctuated greatly seasonally and were significantly affected by environmental conditions. Therefore, fluorescence measurements performed only on sunny days will overestimate the seasonal mean SIF, especially in seasons with abundant cloudy and rainy days. The change of SIF on the seasonal scale is consistent with the change of PAR, we concluded that SIF is not only driven by incident radiation on the daily scale, but also affected by this factor on the seasonal scale, as found in previous studies [54,55]. The key reason contributing to the variation of SIF related to absorbed light lies in the distribution ratio of light energy, which is affected by the leaf biochemical components and the intensity of incident radiation in the environment. SIF is an important dissipation pathway for absorbed light and also a protective pathway for the photoreaction center when absorbed light is excessive [5]. Therefore, SIF continues to increase with the increase of PAR during the growing season and no midday depression or saturation in SIF were found in this study.
Despite PAR being the prominent factor in SIF variations, there is a slight discrepancy in the response of SIF to PAR in the morning and afternoon. The regression fit between SIF and PAR had different slopes in the morning and afternoon, the apparent SIFyield (SIF/PAR) in the morning is higher than in the afternoon under the same light levels, which was consistent with previous studies on maize [21] and wheat [56]. This may be due to the fact that the canopy escape coefficient is higher in the afternoon when PAR is at the same level, which is influenced by canopy structure, tree species, and moisture status [49].

4.2. The SIF–GPP Relationship on Different Timescales

A significant defect of the integration of satellite SIF data with ground-based GPP data is that the compatibility of temporal resolution and the more complex correlations between SIF and GPP on smaller timescales may be ignored. Ground simultaneous observation can make up for the defect. Our research found that SIF and GPP have different correlations with different time scales which is partly different from the results of previous studies. On the 30 min timescale, we found a good linear correlation between SIF and GPP and on cloudy days the correlation coefficient was larger and the points more concentrated. SIF and GPP linear regression was larger on cloudy days that exhibit a higher proportion of diffuse PAR, which is consistent with findings for maize [21], rice paddy [19], and mixed broad-leaved forest [49]. Middle and lower parts of the canopy can receive more radiation under cloudy conditions [5,47], enabling the middle and lower canopy to participate in SIF emission and photosynthesis. However, the influence of measurement techniques must be taken into account in that tower-based spectrometers will predominantly receive the SIF signal that was emitted from the top canopy leaves and escaped from the inside canopy [57,58], meanwhile, GPP divided from EC measurements comes from a larger area, and the carbon released by the internal leaves will eventually escape from the canopy [59]. The inconsistency of the footprints may be the cause of some unsatisfactory results, especially on sunny days. The SIF tower was built in the upwind direction of the EC system tower to minimize this source of error. Besides, a more efficient use of diffuse PAR resulted in the rise of GPP on cloudy days [50]. This may explain the increase in apparent SIFyield on cloudy days.
In addition, this study has inconsistent results with previous studies [21,47] and possible explanations are given in the following analysis. We found that with the aggregation of timescales, the correlation of SIF-GPP deteriorated. The 30 min datasets capture the important correlations on the daily scale, with details removed only when examining daily mean SIF and GPP. We found GPP/SIF was also driven by PAR on the seasonal scale, the correlation deterioration between SIF and GPP from the daily to the seasonal scale was due to the seasonal fluctuation of PAR. We also found that the correlation between SIF and GPP on sunny days exhibited contrast correlation under different PAR conditions. On the 30 min timescale, SIF and GPP both increased with an increase of PAR up to 1250 μmol·m−2·s−1, then GPP decreased with the increase of PAR, which is the opposite to SIF. This is mainly due to the fact that the high radiation is usually accompanied by high temperature during the midday/afternoon period, which may cause the plant photosynthesis “depression” in noon and afternoon, where NPQ is not affected by instantaneous stress and SIF increases with PAR, presenting the nonlinear relationship between SIF and GPP [31]. In the subsequent analysis, we find that the change of the relationship mainly depends on the magnitude of PAR, similar results were reported in a previous study [30]. In many studies, APAR is considered to be the main factor driving GPP/SIF changes [60,61]. Our research further confirms the key role of APAR in affecting the SIF–GPP relationship. In addition to APAR, although we tried to avoid the difference caused by the growth rhythm, the growth rate in early June was still significantly lower than other phases, which might be due to the early drought in spring at the study site [42] instead of low precipitation in June, and this indirectly led to the unusual negative correlation between GPP and PAR on the daily scale. We also found that another part of the reason for the weakening of the correlation is that SIF and GPP have different responses to different meteorological factors. SM and VPD had different influences on SIF and GPP on the daily scale, instead, SIF–GPP are mainly driven by PAR and have a significantly positive correlation with PAR on the 30 min timescale, so their linear correlation on the 30 min timescale was weakened with aggregation. SM is the most directly absorbed water by plant roots, which has a decisive effect on the physiological state of plants [62]. This has a strong influence on SIF on the seasonal scale, reflected in a significant positive correlation with SIF, which is consistent with a previous study in the Great Plains [63]. SIF is very sensitive in monitoring vegetation drought [60,64], especially early soil drought [5], and is an important indicator of plant stress and physiological status [62]. With an increase in SM, GPP also shows an upward trend, but there was no significant correlation. As the total photosynthetic production of the vegetation canopy, GPP has a relatively sensitive response to VPD [33,65], and there was an obvious negative correlation on the seasonal scale. This can be largely explained that with the increase of VPD and the intensification of the air drought stress, the stomata closed to reduce the loss of water [66] and caused a significant decrease in gas exchange rate [59], which affected the response of GPP to PAR. VPD also has a slight impact on the seasonal variation of SIF, but the impact is not significant. As SM and VPD have different impacts on SIF and GPP, respectively, they lead to a weakening of the relationship of SIF–GPP on a seasonal scale.

5. Conclusions

In this study, we explored the conditions required for the availability of a linear empirical model of SIF to estimate GPP in the canopy of cork oak during the growing season to provide support for applying satellite SIF on regional GPP estimation in different plant function types. The study found that SIF and GPP have good linear relationships, which change with the magnitude of PAR. When PAR is low, the correlations are positive and when PAR is high, GPP decreases with an increase in PAR, resulting in a negative correlation with SIF. Therefore, the magnitude of synchronized PAR should be taken into consideration. The confidence margin of the empirical linear relationship of SIF and GPP can be determined based on its response to PAR from ground-based observations for certain function types when using remote sensing SIF to estimate GPP, especially for the satellite SIF signal obtained around noon. In analyzing the productivity of deciduous broadleaf forests in the future, it is more meaningful to accumulate long-term daily observations and analyze the relationship between GPP and PAR according to growth phrase and climate, and then further combine water indicators to analyze their relationship with plant growth. Since this study only discussed the relationship between SIF and GPP in the growing season of cork oak, further studies will be conducted in other growing months, especially the early and late stages of growth to inquire into the mechanism links between SIF and GPP for broad-leaved forests.

Supplementary Materials

The following are available online at https://www.mdpi.com/article/10.3390/rs13122363/s1, Figure S1: The relationship between GPP and PAR on the daily scale, with the colour bar on the right representing DOY.

Author Contributions

Conceptualization, J.Z. and F.W.; Methodology, X.C. and Y.Z.; Software, X.C. and M.H.; Validation, H.H.; Writing—original draft preparation, X.C.; Writing—review and editing, J.Z., F.W. and H.H.; Visualization, X.C.; Supervision: J.Z. and F.W.; funding acquisition, J.Z. All authors have read and agreed to the published version of the manuscript.

Funding

This research was funded by the Fundamental Research Funds of the Central Public Welfare Scientific Research Institutes (CAFYBB2020QD002-2) and National Nonprofit In-stitute Research Grant of the Chinese Academy of Forestry (CAFYBB2018ZA001).

Acknowledgments

We thank Lu Xiaoliang from the Northwest A & F University for advising. We thank Yongsheng Qiao and Guangguang Li from Nanshan Forest Farm, Jiyuan City for contributing to field measurements. We thank Ning Zheng, Yongbin Huang, Guangyao Shi and Linqi Liu for helping to run the spectrometer systems and eddy covariance systems. We also appreciate editors and three anonymous reviewers for their constructive suggestions and comments that improved the manuscript.

Conflicts of Interest

The authors declare no conflict of interest.

References

  1. Potter, C.S.; Randerson, J.T.; Field, C.B.; Matson, P.A.; Vitousek, P.M.; Mooney, H.A.; Klooster, S.A. Terrestrial ecosystem production: A process model based on global satellite and surface data. Glob. Biogeochem. Cycles 1993, 7, 811–841. [Google Scholar] [CrossRef]
  2. Xiao, X.; Zhang, Q.; Braswell, B.; Urbanski, S.; Boles, S.; Wofsy, S.; Moore, B.; Ojima, D. Modeling gross primary production of temperate deciduous broadleaf forest using satellite images and climate data. Remote Sens. Environ. 2004, 91, 256–270. [Google Scholar] [CrossRef]
  3. Hember, R.A.; Coops, N.C.; Black, T.A.; Guy, R.D. Simulating gross primary production across a chronosequence of coastal Douglas-fir forest stands with a production efficiency model. Agric. For. Meteorol. 2010, 150, 238–253. [Google Scholar] [CrossRef]
  4. Gnyp, M.L.; Bareth, G.; Li, F.; Lenz-Wiedemann, V.; Koppe, W.; Miao, Y.; Hennig, S.D.; Jia, L.; Laudien, R.; Chen, X.; et al. Development and implementation of a multiscale biomass model using hyperspectral vegetation indices for winter wheat in the North China Plain. Int. J. Appl. Earth Obs. Geoinf. 2014, 33, 232–242. [Google Scholar] [CrossRef]
  5. Porcar-Castell, A.; Tyystjärvi, E.; Atherton, J.; van der Tol, C.; Flexas, J.; Pfündel, E.E.; Moreno, J.; Frankenberg, C.; Berry, J.A. Linking chlorophyll a fluorescence to photosynthesis for remote sensing applications: Mechanisms and challenges. J. Exp. Bot. 2014, 65, 4065–4095. [Google Scholar] [CrossRef] [PubMed]
  6. Vargas, J.Q.; Bendig, J.; Mac Arthur, A.; Burkart, A.; Julitta, T.; Maseyk, K.; Thomas, R.; Siegmann, B.; Rossini, M.; Celesti, M.; et al. Unmanned Aerial Systems (UAS)-Based Methods for Solar Induced Chlorophyll Fluorescence (SIF) Retrieval with Non-Imaging Spectrometers: State of the Art. Remote Sens. 2020, 12, 1624. [Google Scholar] [CrossRef]
  7. Qiu, R.; Han, G.; Ma, X.; Xu, H.; Shi, T.; Zhang, M. A Comparison of OCO-2 SIF, MODIS GPP, and GOSIF Data from Gross Primary Production (GPP) Estimation and Seasonal Cycles in North America. Remote Sens. 2020, 12, 258. [Google Scholar] [CrossRef] [Green Version]
  8. Yang, X.; Tang, J.; Mustard, J.F.; Lee, J.-E.; Rossini, M.; Joiner, J.; Munger, J.W.; Kornfeld, A.; Richardson, A.D. Solar-induced chlorophyll fluorescence that correlates with canopy photosynthesis on diurnal and seasonal scales in a temperate deciduous forest. Geophys. Res. Lett. 2015, 42, 2977–2987. [Google Scholar] [CrossRef]
  9. Alonso, L.; Gómez-Chova, L.; Vila-Frances, J.; Amoros-Lopez, J.; Guanter, L.; Calpe, J.; Moreno, J. Improved Fraunhofer Line Discrimination Method for Vegetation Fluorescence Quantification. IEEE Geosci. Remote Sens. Lett. 2008, 5, 620–624. [Google Scholar] [CrossRef]
  10. Cogliati, S.; Verhoef, W.; Kraft, S.; Sabater, N.; Alonso, L.; Vicent, J.; Moreno, J.; Drusch, M.; Colombo, R. Retrieval of sun-induced fluorescence using advanced spectral fitting methods. Remote Sens. Environ. 2015, 169, 344–357. [Google Scholar] [CrossRef]
  11. Frankenberg, C.; Fisher, J.; Worden, J.; Badgley, G.; Saatchi, S.S.; Lee, J.-E.; Toon, G.C.; Butz, A.; Jung, M.; Kuze, A.; et al. New global observations of the terrestrial carbon cycle from GOSAT: Patterns of plant fluorescence with gross primary productivity. Geophys. Res. Lett. 2011, 38. [Google Scholar] [CrossRef] [Green Version]
  12. Damm, A.; Guanter, L.; Paul-Limoges, E.; van der Tol, C.; Hueni, A.; Buchmann, N.; Eugster, W.; Ammann, C.; Schaepman, M. Far-red sun-induced chlorophyll fluorescence shows ecosystem-specific relationships to gross primary production: An assessment based on observational and modeling approaches. Remote Sens. Environ. 2015, 166, 91–105. [Google Scholar] [CrossRef]
  13. Yang, P.; van der Tol, C. Linking canopy scattering of far-red sun-induced chlorophyll fluorescence with reflectance. Remote Sens. Environ. 2018, 209, 456–467. [Google Scholar] [CrossRef]
  14. Goulas, Y.; Fournier, A.; Daumard, F.; Champagne, S.; Ounis, A.; Marloie, O.; Moya, I. Gross Primary Production of a Wheat Canopy Relates Stronger to Far Red Than to Red Solar-Induced Chlorophyll Fluorescence. Remote Sens. 2017, 9, 97. [Google Scholar] [CrossRef] [Green Version]
  15. Liu, L.; Liu, X.; Hu, J.; Guan, L. Assessing the wavelength-dependent ability of solar-induced chlorophyll fluorescence to estimate the GPP of winter wheat at the canopy level. Int. J. Remote Sens. 2017, 38, 4396–4417. [Google Scholar] [CrossRef]
  16. Liu, Z.; Lu, X.; An, S.; Heskel, M.; Yang, H.; Tang, J. Advantage of multi-band solar-induced chlorophyll fluorescence to derive canopy photosynthesis in a temperate forest. Agric. For. Meteorol. 2019, 279, 107691. [Google Scholar] [CrossRef]
  17. Dechant, B.; Ryu, Y.; Badgley, G.; Zeng, Y.; Berry, J.A.; Zhang, Y.; Goulas, Y.; Li, Z.; Zhang, Q.; Kang, M.; et al. Canopy structure explains the relationship between photosynthesis and sun-induced chlorophyll fluorescence in crops. Remote Sens. Environ. 2020, 241, 17. [Google Scholar] [CrossRef] [Green Version]
  18. Tagliabue, G.; Panigada, C.; Dechant, B.; Baret, F.; Cogliati, S.; Colombo, R.; Migliavacca, M.; Rademske, P.; Schickling, A.; Schüttemeyer, D.; et al. Exploring the spatial relationship between airborne-derived red and far-red sun-induced fluorescence and process-based GPP estimates in a forest ecosystem. Remote Sens. Environ. 2019, 231, 111272. [Google Scholar] [CrossRef]
  19. Yang, K.; Ryu, Y.; Dechant, B.; Berry, J.A.; Hwang, Y.; Jiang, C.; Kang, M.; Kim, J.; Kimm, H.; Kornfeld, A.; et al. Sun-induced chlorophyll fluorescence is more strongly related to absorbed light than to photosynthesis at half-hourly resolution in a rice paddy. Remote Sens. Environ. 2018, 216, 658–673. [Google Scholar] [CrossRef]
  20. Zhang, Z.; Zhang, Y.; Porcar-Castell, A.; Joiner, J.; Guanter, L.; Yang, X.; Migliavacca, M.; Ju, W.; Sun, Z.; Chen, S.; et al. Reduction of structural impacts and distinction of photosynthetic pathways in a global estimation of GPP from space-borne solar-induced chlorophyll fluorescence. Remote Sens. Environ. 2020, 240, 111722. [Google Scholar] [CrossRef]
  21. Li, Z.; Zhang, Q.; Li, J.; Yang, X.; Wu, Y.; Zhang, Z.; Wang, S.; Wang, H.; Zhang, Y. Solar-induced chlorophyll fluorescence and its link to canopy photosynthesis in maize from continuous ground measurements. Remote Sens. Environ. 2020, 236, 111420. [Google Scholar] [CrossRef]
  22. Zhang, Z.; Zhang, Y.; Joiner, J.; Migliavacca, M. Angle matters: Bidirectional effects impact the slope of relationship between gross primary productivity and sun-induced chlorophyll fluorescence from Orbiting Carbon Observatory-2 across biomes. Glob. Chang. Biol. 2018, 24, 5017–5020. [Google Scholar] [CrossRef] [Green Version]
  23. Guanter, L.; Zhang, Y.; Jung, M.; Joiner, J.; Voigt, M.; Berry, J.A.; Frankenberg, C.; Huete, A.R.; Zarco-Tejada, P.; Lee, J.-E.; et al. Global and time-resolved monitoring of crop photosynthesis with chlorophyll fluorescence. Proc. Natl. Acad. Sci. USA 2014, 111, E1327–E1333. [Google Scholar] [CrossRef] [PubMed] [Green Version]
  24. Li, J.; Zhang, Y.; Gu, L.; Li, Z.; Li, J.; Zhang, Q.; Zhang, Z.; Song, L. Seasonal variations in the relationships between sun-induced chlorophyll fluorescence and photosynthetic capacity from leaf to canopy in a rice paddy. J. Exp. Bot. 2020, 71, 7179. [Google Scholar] [CrossRef]
  25. Cheng, Y.-B.; Middleton, E.M.; Zhang, Q.; Huemmrich, K.F.; Campbell, P.K.E.; Corp, L.A.; Cook, B.D.; Kustas, W.P.; Daughtry, C.S. Integrating Solar Induced Fluorescence and the Photochemical Reflectance Index for Estimating Gross Primary Production in a Cornfield. Remote Sens. 2013, 5, 6857–6879. [Google Scholar] [CrossRef] [Green Version]
  26. Perez-Priego, O.; Guan, J.; Rossini, M.; Fava, F.; Wutzler, T.; Moreno, G.; Carvalhais, N.; Carrara, A.; Kolle, O.; Julitta, T.; et al. Sun-induced chlorophyll fluorescence and photochemical reflectance index improve remote-sensing gross primary production estimates under varying nutrient availability in a typical Mediterranean savanna ecosystem. Biogeosciences 2015, 12, 6351–6367. [Google Scholar] [CrossRef] [Green Version]
  27. Guanter, L.; Frankenberg, C.; Dudhia, A.; Lewis, P.; Gómez-Dans, J.; Kuze, A.; Suto, H.; Grainger, R. Retrieval and global assessment of terrestrial chlorophyll fluorescence from GOSAT space measurements. Remote Sens. Environ. 2012, 121, 236–251. [Google Scholar] [CrossRef]
  28. Du, S.; Liu, L.; Liu, X.; Hu, J. Response of Canopy Solar-Induced Chlorophyll Fluorescence to the Absorbed Photosynthetically Active Radiation Absorbed by Chlorophyll. Remote Sens. 2017, 9, 911. [Google Scholar] [CrossRef] [Green Version]
  29. Zhang, Y.; Guanter, L.; Berry, J.A.; van der Tol, C.; Yang, X.; Tang, J.; Zhang, F. Model-based analysis of the relationship between sun-induced chlorophyll fluorescence and gross primary production for remote sensing applications. Remote Sens. Environ. 2016, 187, 145–155. [Google Scholar] [CrossRef] [Green Version]
  30. Liu, L.; Zhao, W.; Shen, Q.; Wu, J.; Teng, Y.; Yang, J.; Han, X.; Tian, F. Nonlinear Relationship Between the Yield of Solar-Induced Chlorophyll Fluorescence and Photosynthetic Efficiency in Senescent Crops. Remote Sens. 2020, 12, 1518. [Google Scholar] [CrossRef]
  31. Maguire, A.J.; Eitel, J.U.H.; Griffin, K.L.; Magney, T.S.; Long, R.A.; Vierling, L.A.; Schmiege, S.C.; Jennewein, J.S.; Weygint, W.A.; Boelman, N.T.; et al. On the Functional Relationship Between Fluorescence and Photochemical Yields in Complex Evergreen Needleleaf Canopies. Geophys. Res. Lett. 2020, 47. [Google Scholar] [CrossRef]
  32. He, L.; Magney, T.; Dutta, D.; Yin, Y.; Köhler, P.; Grossmann, K.; Stutz, J.; Dold, C.; Hatfield, J.; Guan, K.; et al. From the Ground to Space: Using Solar-Induced Chlorophyll Fluorescence to Estimate Crop Productivity. Geophys. Res. Lett. 2020, 47. [Google Scholar] [CrossRef]
  33. Marrs, J.K.; Reblin, J.S.; Logan, B.A.; Allen, D.W.; Reinmann, A.B.; Bombard, D.M.; Tabachnik, D.; Hutyra, L.R. Solar-Induced Fluorescence Does Not Track Photosynthetic Carbon Assimilation Following Induced Stomatal Closure. Geophys. Res. Lett. 2020, 47. [Google Scholar] [CrossRef]
  34. Magney, T.S.; Bowling, D.R.; Logan, B.; Grossmann, K.; Stutz, J.; Blanken, P.D.; Burns, S.P.; Cheng, R.; Garcia, M.A.; Kӧhler, P.; et al. Mechanistic evidence for tracking the seasonality of photosynthesis with solar-induced fluorescence. Proc. Natl. Acad. Sci. USA 2019, 116, 11640–11645. [Google Scholar] [CrossRef] [Green Version]
  35. Joiner, J.; Yoshida, Y.; Vasilkov, A.P.; Schaefer, K.; Jung, M.; Guanter, L.; Zhang, Y.; Garrity, S.; Middleton, E.M.; Huemmrich, K.F.; et al. The seasonal cycle of satellite chlorophyll fluorescence observations and its relationship to vegetation phenology and eco-system atmosphere carbon exchange. Remote Sens. Environ. 2014, 152, 375–391. [Google Scholar] [CrossRef] [Green Version]
  36. Lin, X.; Chen, B.; Zhang, H.; Wang, F.; Chen, J.; Guo, L.; Kong, Y. Effects of the Temporal Aggregation and Meteorological Conditions on the Parameter Robustness of OCO-2 SIF-Based and LUE-Based GPP Models for Croplands. Remote Sens. 2019, 11, 1328. [Google Scholar] [CrossRef] [Green Version]
  37. Zhang, Y.; Guanter, L.; Berry, J.A.; Joiner, J.; van der Tol, C.; Huete, A.; Gitelson, A.; Voigt, M.; Köhler, P. Estimation of vegetation photosynthetic capacity from space-based measurements of chlorophyll fluorescence for terrestrial biosphere models. Glob. Chang. Biol. 2014, 20, 3727–3742. [Google Scholar] [CrossRef] [PubMed] [Green Version]
  38. Köhler, P.; Guanter, L.; Joiner, J. A linear method for the retrieval of sun-induced chlorophyll fluorescence from GOME-2 and SCIAMACHY data. Atmos. Meas. Tech. 2015, 8, 2589–2608. [Google Scholar] [CrossRef] [Green Version]
  39. Zhang, Y.; Xiao, X.; Zhang, Y.; Wolf, S.; Zhou, S.; Joiner, J.; Guanter, L.; Verma, M.; Sun, Y.; Yang, X.; et al. On the relationship between sub-daily instantaneous and daily total gross primary production: Implications for inter-preting satellite-based SIF retrievals. Remote Sens. Environ. 2018, 205, 276–289. [Google Scholar] [CrossRef] [Green Version]
  40. Damm, A.; Elbers, J.; Erler, A.; Gioli, B.; Hamdi, K.; Hutjes, R.; Kosvancova, M.; Meroni, M.; Miglietta, F.; Moersch, A.; et al. Remote sensing of sun-induced fluorescence to improve modeling of diurnal courses of gross primary production (GPP). Glob. Chang. Biol. 2010, 16, 171–186. [Google Scholar] [CrossRef]
  41. Verma, M.; Schimel, D.; Evans, B.; Frankenberg, C.; Beringer, J.; Drewry, D.T.; Magney, T.; Marang, I.; Hutley, L.; Moore, C.; et al. Effect of environmental conditions on the relationship between solar-induced fluorescence and gross primary productivity at an OzFlux grassland site. J. Geophys. Res. Biogeosci. 2017, 122, 716–733. [Google Scholar] [CrossRef] [Green Version]
  42. Tong, X.; Meng, P.; Zhang, J.; Li, J.; Zheng, N.; Huang, H. Ecosystem carbon exchange over a warm-temperate mixed plantation in the lithoid hilly area of the North China. Atmos. Environ. 2012, 49, 257–267. [Google Scholar] [CrossRef]
  43. Tramontana, G.; Ichii, K.; Camps-Valls, G.; Tomelleri, E.; Papale, D. Uncertainty analysis of gross primary production upscaling using Random Forests, remote sensing and eddy covariance data. Remote Sens. Environ. 2015, 168, 360–373. [Google Scholar] [CrossRef]
  44. Jing-Xin, X.U.; You-Fei, Z.; Bo-Ru, M.; Hui, Z.; Zhong-Fang, C.; Ji-Qing, H.; Yue, Y. Characteristics and partitioning of ozone dry deposition measured by eddy-covariance technology in a winter wheat field. Chin. J. Plant Ecol. 2017, 41, 670–682. [Google Scholar] [CrossRef]
  45. Reichstein, M.; Falge, E.; Baldocchi, D.; Papale, D.; Aubinet, M.; Berbigier, P.; Bernhofer, C.; Buchmann, N.; Gilmanov, T.; Granier, A.; et al. On the separation of net ecosystem exchange into assimilation and ecosystem respiration: Review and improved algorithm. Glob. Chang. Biol. 2005, 11, 1424–1439. [Google Scholar] [CrossRef]
  46. Jia, X.; Zha, T.; Gong, J.; Zhang, Y.; Wu, B.; Qin, S.; Peltola, H. Multi-scale dynamics and environmental controls on net ecosystem CO2 exchange over a temperate semiarid shrubland. Agric. For. Meteorol. 2018, 259, 250–259. [Google Scholar] [CrossRef]
  47. Chen, J.; Liu, X.; Du, S.; Ma, Y.; Liu, L. Integrating SIF and Clearness Index to Improve Maize GPP Estimation Using Continuous Tower-Based Observations. Sensors 2020, 20, 2493. [Google Scholar] [CrossRef]
  48. Meroni, M.; Busetto, L.; Colombo, R.; Guanter, L.; Moreno, J.; Verhoef, W. Performance of Spectral Fitting Methods for vegetation fluorescence quantification. Remote Sens. Environ. 2010, 114, 363–374. [Google Scholar] [CrossRef]
  49. Lu, X.; Liu, Z.; Zhao, F.; Tang, J. Comparison of total emitted solar-induced chlorophyll fluorescence (SIF) and top-of-canopy (TOC) SIF in estimating photo-synthesis. Remote Sens. Environ. 2020, 251, 112083. [Google Scholar] [CrossRef]
  50. Gu, L.; Fuentes, J.D.; Shugart, H.H.; Staebler, R.M.; Black, T.A. Responses of net ecosystem exchanges of carbon dioxide to changes in cloudiness: Results from two North American deciduous forests. J. Geophys. Res. Atmos. 1999, 104, 31421–31434. [Google Scholar] [CrossRef]
  51. Barr, A.; Richardson, A.; Hollinger, D.; Papale, D.; Arain, M.; Black, T.; Bohrer, G.; Dragoni, D.; Fischer, M.; Gu, L.; et al. Use of change-point detection for friction-velocity threshold evaluation in eddy-covariance studies. Agric. For. Meteorol. 2013, 171–172, 31–45. [Google Scholar] [CrossRef] [Green Version]
  52. Jia, X.; Zha, T.; Gong, J.; Wang, B.; Zhang, Y.; Wu, B.; Qin, S.; Peltola, H. Carbon and water exchange over a temperate semi-arid shrubland during three years of contrasting precipitation and soil moisture patterns. Agric. For. Meteorol. 2016, 228–229, 120–129. [Google Scholar] [CrossRef]
  53. Miao, G.; Guan, K.; Yang, X.; Bernacchi, C.; Berry, J.A.; DeLucia, E.H.; Wu, J.; Moore, C.; Meacham, K.; Cai, Y.; et al. Sun-Induced Chlorophyll Fluorescence, Photosynthesis, and Light Use Efficiency of a Soybean Field from Seasonally Continuous Measurements. J. Geophys. Res. Biogeosci. 2018, 123, 610–623. [Google Scholar] [CrossRef]
  54. Cogliati, S.; Rossini, M.; Julitta, T.; Meroni, M.; Schickling, A.; Burkart, A.; Pinto, F.; Rascher, U.; Colombo, R. Continuous and long-term measurements of reflectance and sun-induced chlorophyll fluorescence by using novel automated field spectroscopy systems. Remote Sens. Environ. 2015, 164, 270–281. [Google Scholar] [CrossRef]
  55. Liu, L.; Zhao, W.; Wu, J.; Liu, S.; Teng, Y.; Yang, J.; Han, X. The Impacts of Growth and Environmental Parameters on Solar-Induced Chlorophyll Fluorescence at Seasonal and Diurnal Scales. Remote Sens. 2019, 11, 2002. [Google Scholar] [CrossRef] [Green Version]
  56. Wieneke, S.; Burkart, A.; Cendrero-Mateo, M.; Julitta, T.; Rossini, M.; Schickling, A.; Schmidt, M.; Rascher, U. Linking photosynthesis and sun-induced fluorescence at sub-daily to seasonal scales. Remote Sens. Environ. 2018, 219, 247–258. [Google Scholar] [CrossRef]
  57. Sun, G.; Wang, X.; Niu, Z.; Chen, F. Development of a canopy Solar-induced chlorophyll fluorescence measurement instrument. IOP Conf. Ser. Earth Environ. Sci. 2014, 18. [Google Scholar] [CrossRef] [Green Version]
  58. Bandopadhyay, S.; Rastogi, A.; Juszczak, R. Review of Top-of-Canopy Sun-Induced Fluorescence (SIF) Studies from Ground, UAV, Airborne to Spaceborne Observations. Sensors 2020, 20, 1144. [Google Scholar] [CrossRef] [PubMed] [Green Version]
  59. Paul-Limoges, E.; Damm, A.; Hueni, A.; Liebisch, F.; Eugster, W.; Schaepman, M.E.; Buchmann, N. Effect of environmental conditions on sun-induced fluorescence in a mixed forest and a cropland. Remote Sens. Environ. 2018, 219, 310–323. [Google Scholar] [CrossRef]
  60. Chen, A.; Mao, J.; Ricciuto, D.; Xiao, J.; Frankenberg, C.; Li, X.; Thornton, P.E.; Gu, L.; Knapp, A.K. Moisture availability mediates the relationship between terrestrial gross primary production and solar-induced chlorophyll fluorescence: Insights from global-scale variations. Glob. Chang. Biol. 2020, 27, 1144–1156. [Google Scholar] [CrossRef] [PubMed]
  61. Li, X.; Xiao, J.; He, B.; Arain, M.A.; Beringer, J.; Desai, A.; Emmel, C.; Hollinger, D.Y.; Krasnova, A.; Mammarella, I.; et al. Solar-induced chlorophyll fluorescence is strongly correlated with terrestrial photosynthesis for a wide variety of biomes: First global analysis based on OCO-2 and flux tower observations. Glob. Chang. Biol. 2018, 24, 3990–4008. [Google Scholar] [CrossRef] [PubMed]
  62. Liu, L.; Gudmundsson, L.; Hauser, M.; Qin, D.; Li, S.; Seneviratne, S.I. Soil moisture dominates dryness stress on ecosystem production globally. Nat. Commun. 2020, 11, 1–9. [Google Scholar] [CrossRef]
  63. Wang, S.; Huang, C.; Zhang, L.; Lin, Y.; Cen, Y.; Wu, T. Monitoring and Assessing the 2012 Drought in the Great Plains: Analyzing Satellite-Retrieved Solar-Induced Chlorophyll Fluorescence, Drought Indices, and Gross Primary Production. Remote Sens. 2016, 8, 61. [Google Scholar] [CrossRef] [Green Version]
  64. Yoshida, Y.; Joiner, J.; Tucker, C.; Berry, J.; Lee, J.-E.; Walker, G.; Reichle, R.; Koster, R.; Lyapustin, A.; Wang, Y. The 2010 Russian drought impact on satellite measurements of solar-induced chlorophyll fluorescence: Insights from modeling and comparisons with parameters derived from satellite reflectances. Remote Sens. Environ. 2015, 166, 163–177. [Google Scholar] [CrossRef]
  65. Jiao, W.; Chang, Q.; Wang, L. The Sensitivity of Satellite Solar-Induced Chlorophyll Fluorescence to Meteorological Drought. Earth’s Futur. 2019, 7, 558–573. [Google Scholar] [CrossRef] [Green Version]
  66. Ding, J.; Yang, T.; Zhao, Y.; Liu, D.; Wang, X.; Yao, Y.; Peng, S.; Wang, T.; Piao, S. Increasingly Important Role of Atmospheric Aridity on Tibetan Alpine Grasslands. Geophys. Res. Lett. 2018, 45, 2852–2859. [Google Scholar] [CrossRef]
Figure 1. Seasonal patterns of SIF (a), GPP (b), PAR (c), VPD and SM at 20 cm depth (d), and NDVI (e) derived from Auto-SIF1 system measurements. Dots and shade represent daily means values and standard deviations that were calculated from all 30 min data in the day, respectively.
Remotesensing 13 02363 g001
Figure 2. Diurnal variations in canopy solar-induced fluorescence under different sky conditions in 2019. DOY represents the day of the year. (a), (b) and (c) represent SIF on a sunny, cloudy, and rainy day (DOY 188, DOY 190, and DOY 191), sunny day (a) and cloudy day (b) were divided by clearness index. The gray line represents PAR in 30 min scale in the same day.
Remotesensing 13 02363 g002
Figure 3. Relationships between SIF and GPP at 30 min (ac) and daily (df) timescales, (a) and (d) for all days, (b) and (e) for sunny days, (c) and (f) for cloudy days. The black straight line represents the linear regression lines for 30 min and daily data, respectively. R represents the Pearson correlation coefficient. The color scale represents the day of year (DOY). ** for p < 0.01.
Remotesensing 13 02363 g003
Figure 4. Relationships between the daily slopes of the linear regressions between SIF and GPP symbolized by GPP/SIF in 30 min timescale and daily mean PAR. The black line is linear regression, K and R2 represent the slope and coefficient of determination of linear regression, respectively. The color bar on the right on behalf of the R2 of the linear regressions in every single day. All data are for sunny days only.
Remotesensing 13 02363 g004
Figure 5. The response of SIF-GPP to different meteorological factors in the 30 min timescale, (a), (b) and (c) represent PAR, VPD and SM, respectively. The solid line and dashed line represent the linear fit between SIF and GPP with meteorological factors, respectively. K and R2 represent the fitting slope and regression coefficients, respectively. All data are for sunny days.
Remotesensing 13 02363 g005
Table 1. Correlations between canopy SIF and GPP with meteorological factors like PAR, VPD, and SM based on 30 min and daily data observed in oak canopy. The whole analyses were based on data on sunny days. ** for p < 0.01.
VariablesPearson’s Correlation Coefficient
SIFGPP
30 minDay30 minDay
PAR0.872 **0.544 **0.627 **−0.495 **
VPD0.203 **−0.237−0.043−0.498 **
SM0.202 **0.577 **0.009−0.03
Publisher’s Note: MDPI stays neutral with regard to jurisdictional claims in published maps and institutional affiliations.

