Communication

Long-Term Observations of Microwave Brightness Temperatures over a Metropolitan Area: Comparison of Radiometric Data and Spectra Simulated with the Use of Radiosonde Measurements

by
Mikhail V. Belikovich
*,
Mikhail Yu. Kulikov
,
Dmitry S. Makarov
,
Natalya K. Skalyga
,
Vitaly G. Ryskin
,
Alexander A. Shvetsov
,
Alexander A. Krasil’nikov
,
Svetlana O. Dementyeva
,
Evgeny A. Serov
and
Alexander M. Feigin
Institute of Applied Physics of the Russian Academy of Sciences, 46 Ulyanov Str., 603950 Nizhny Novgorod, Russia
*
Author to whom correspondence should be addressed.
Remote Sens. 2021, 13(11), 2061; https://doi.org/10.3390/rs13112061
Submission received: 9 April 2021 / Revised: 19 May 2021 / Accepted: 21 May 2021 / Published: 24 May 2021
(This article belongs to the Section Atmospheric Remote Sensing)

Abstract

:
Ground-based microwave radiometers are increasingly used in operational meteorology and nowcasting. These instruments continuously measure the spectra of downwelling atmospheric radiation in the range 20–60 GHz used for the retrieval of tropospheric temperature and water vapor profiles. Spectroscopic uncertainty is an important part of the retrieval error budget, as it leads to systematic bias. In this study, we analyze the difference between observed and simulated microwave spectra obtained from more than four years of microwave and radiosonde observations over Nizhny Novgorod (56.2° N, 44° E). We focus on zenith-measured and elevation-scanning data in clear-sky conditions. The simulated spectra are calculated by a radiative transfer model with the use of radiosonde profiles and different absorption models, corresponding to the latest spectroscopy research. In the case of zenith-measurements, we found a systematic bias (up to ~2 K) of simulated spectra at 51–54 GHz. The sign of bias depends on the absorption model. A thorough investigation of the error budget points to a spectroscopic nature of the observed differences. The dependence of the results on the elevation angle and absorption model can be explained by the basic properties of radiative transfer and by cloud contamination at elevation angles.

Graphical Abstract

1. Introduction

Today, the improvement of weather forecasting and the increasing predictability of high-impact weather remain the most pressing problems, especially in a changing climate. To address these problems, the new weather forecast models require detailed initial data on three-dimensional spatial distributions of tropospheric characteristics (in particular, temperature, water vapor, and wind) with a relatively high (up to 0.5–1 km) resolution, especially in the low troposphere where satellite data are not suitable. Recently, it became apparent [1,2] that the problem of obtaining such data can be solved by a fairly dense observational network, equipped with cost-effective means to provide continuous measurements of vertical profiles of the thermodynamic characteristics. From the point of view of data quality, the radiosonde data are most applicable. However, radiosounding is performed quite rarely (usually twice a day), and each launch uses consumables, which are then lost and pollute the environment. One of the most promising candidates to feed the weather forecast models is passive microwave remote sensing.
For the last ~2 decades, ground-based microwave radiometers (GBMRs) [3,4,5,6,7] and their data have been tested for many purposes of operational meteorology and nowcasting, for example, in airports and for meteorological support of major international events [8,9,10]. These devices measure the spectra of the downwelling atmospheric radiation (brightness temperatures) in the range from 20 to 60 GHz. The profiles of temperature and water vapor density in the altitude range of 0–10 km are retrieved with high spatial (up to several tens of meters) and temporal (several minutes) resolution. The important features of GBMRs include: (1) passive mode of operation with relatively low power consumption, i.e., they can be located, in principle, everywhere; (2) automatic continuous measurements and profiles retrieval without human participation; (3) automatic calibration of received signals with the use of internal electrically-controlled references (see, for example, [11]); (4) no constant use of consumables and no regular maintenance, except for periodical (approximately twice a year), absolute calibration using liquid nitrogen; (5) a relatively good data quality under nearly all weather conditions. Typically, retrieval procedures are based on a radiative transfer model with the use of linear/quadratic regression or neural network. Another common approach is to use retrieval based on the optimal estimation method [12] and a priori information from weather forecast models.
In some studies [13,14,15,16,17], the convective instability indices obtained from microwave data were compared with the values of these characteristics from radiosonde data. The analysis of specific events led to the conclusion that microwave indices and some primary microwave data (in particular, the standard deviation of brightness temperature at 22 GHz) could be considered as a useful tool for ultra-short-term forecasting of thunderstorms, showers, wind shear and others. Another research [18] assessed the thunderstorm prediction skills over a metropolis for different radiosonde and microwave indices and revealed the better effectiveness of microwave data.
There were a few attempts to assimilate microwave data into numerical weather forecast models. In particular, Martinet et al. [19] showed that assimilating primary microwave data (brightness temperatures spectra) through a 1D-Var procedure into the French convective scale model AROME (the Application of Research to Operations at Mesoscale) improved the temperature forecasts at the altitudes of the boundary layer. Moreover, Caumont et al. [20] assimilated the microwave temperature and humidity data obtained from the GBMRs network into a convective-scale model. The impact was found to be weak for almost all the analyzed characteristics except precipitation in specific cases. The authors concluded that a denser GBMRs network and removing errors in the retrieved humidity and temperature data improve the impact.
The error budget of atmospheric temperature measurements by GBMR includes radiometric and spectroscopic errors. These errors are of high practical significance as they lead to systematic errors in the retrievals. The statistics of the differences between observations (GBMRs spectra) and the corresponding simulations is the commonly used method to evaluate the joint radiometric and spectroscopic error [6,19,21,22,23,24]. The simulated spectra are calculated by the radiative transfer model with the use of the temperature and humidity profiles taken from radiosonde measurements or numerical weather forecast models. Several case studies used this approach by analyzing data from different locations. Almost in all cases, the pronounced bias (up to several K at ~52 GHz) at zenith observations was found. The uncertainties of simulated brightness temperatures in the range from 20 to 60 GHz due to all known uncertainties of spectroscopic parameters for different atmospheric climatology conditions were quantified in the paper [25]. The calculated uncertainty covariance matrix shows that the total uncertainty has strong frequency dependence and reaches a maximum (~3 K) at ~51–52 GHz.
In this work, we use the same approach to analyze the data obtained during long-term simultaneous microwave and radiosonde observations over a metropolitan area. In our simulations, we employ different absorption models that correspond to the latest spectroscopic research.
The paper has the following structure. Section 2 contains a description of the observation setup and the radiative transfer model used in simulation. The difference between the absorptions models used in the simulations is explained in separate subsection. The results, i.e., the difference between measured and simulated data, are described in Section 3. Section 4 contains the detailed analysis of the error budget of the results, as well as the explanation of certain features observed in the results. The conclusion section ends the manuscript.

2. Materials and Methods

2.1. Observations

We employ the data of commercially available microwave profiler HATPRO-G3 (Humidity and Temperature Profiler) by RPG-Radiometer Physics GmbH (Gesellschaft mit beschränkter Haftung) Werner-von-Siemens-Str. 4 53340 Meckenheim Germany [26]. The device started its operation in the autumn of 2013. It was regularly calibrated and well maintained until the end of 2018. The instrument is lodged at the balcony of the last floor of IAPRAS (Institute of Applied Physics of the Russian Academy of Sciences) main building (~180 m above the sea level), which is located in the center of the metropolis of Nizhny Novgorod, Russia. The instrument continuously measures the spectra of the brightness temperature at 22–32 GHz (7 channels with a width of 0.23 GHz) and 51–60 GHz (7 channels with a width of 0.23–2 GHz) spectral bands. The stated accuracy [27] of the measurements is 0.1 K in the 22–32 GHz band and 0.2 K in the 51–60 GHz band while the absolute accuracy is 0.5 K. It provides zenith-measured spectra with a sampling rate up to 1 s. Every 20 min, the device performs an elevation scan. The resulting elevation angles in the scan are 90.0, 42.0, 30.0, 19.2, 10.2, and 5.4°.The software provides the retrieval via linear and quadratic [27] regression models which were made by the Radiometer Physics GmbH using preexisting statistic of radiosonde profiles, cloud models and radiative transfer calculations. The retrieval provides a wide range of atmospheric characteristics including temperature profile, humidity profile, boundary layer height, and liquid water path (LWP).
The nearest aerological station (“Nizhny Novgorod”, No.27459) is 7 km away from the HATPRO site and launches radiosondes twice a day (00:00 and 12:00 UTC). Typically, the profiles are measured by radiosondes AK2-02m [28] with an uncertainty of 1 K in temperature and 7–15% in water vapor density. The vertical resolution varies from 200 to 700 m depending on the altitude and launch.
Using the data described we have created a dataset of simultaneous measurements. For zenith measurements, the microwave data are averaged over 12-min intervals (6 min before and after a radiosonde launch). For scanning measurements, we pick the closest scan to the ascension.

2.2. Radiative Transfer Model

Our goal is to simulate the microwave spectra of self-radiation of the atmosphere with the use of temperature and humidity profiles taken from radiosonde measurements. For that, we employ a simple model that calculates frequency dependent brightness temperatures of the atmospheric thermal emission:
T b ( ν , θ ) = T b 0 exp ( τ ( z , ν , θ ) ) + z 0 z α ( ν , z ) sin θ T ( z ) exp ( τ ( z , ν , θ ) ) d z
where Tb(ν,θ) is the brightness temperature at frequency ν and elevation angle θ, Tb0 is the effective brightness temperature of cosmic background radiation, T(z) is the physical temperature at height z, z is the upper boundary of the atmosphere, α is the frequency-dependent absorption coefficient, and τ is the opacity. The opacity is defined as
τ ( z , ν , θ ) = z 0 z α ( ν , z ) sin θ d z
Model (1) describes the pencil-beam solution of the radiative transfer equation without scattering in the Rayleigh–Jeans approximation (/kT << 1). It is worth mentioning that the use of “effective” Tb0, (1) is correct to the first order in /kT rather than zero (see part 1.2.4 [29]). The effective background radiation Tb0 is defined as:
T b 0 = h ν 2 k ( exp ( h ν / k T 0 ) + 1 exp ( h ν / k T 0 ) 1 )
where T0 = 2.725 K is the temperature of the cosmic microwave background radiation.
The absorption coefficient α is determined by the atmospheric characteristics, namely temperature, pressure and composition. In the context of the simulations, we consider absorption only by O2, N2, and H2O (vapor). As the mixing ratios of O2 and N2 are constant up to 80 km, for our analysis α is a function of temperature (T), pressure (P) and absolute humidity (w). To calculate α we use the modifications of the microwave propagation model [30,31,32], which will be described later in Section 2.3. The model allows calculating of liquid water (in clouds) absorption, but we lack cloud data to simulate the cloud influence with sufficient precision. Thus, we limit ourselves to clear sky simulations as in the previous works [6,19,21,22,23,24].
Note that HATPRO measurements are determined mostly by the troposphere state but higher layers of the atmosphere should also be taken into account, when the simulation accuracy one wants to achieve is higher. Our preliminary calculations of Equation (1) with radiosonde profiles reaching 25 km showed that the impact of the atmosphere above 15 km is still large enough (up to 1 K in brightness temperature) but has little variance (<0.15 K). The impact of the atmosphere between 10–15 km is larger (~4 K) but most importantly, it has a much higher variance (1.2 K). Unfortunately, the relative amount of radiosonde profiles reaching the specific altitude decreases with an increase of this altitude. Thus, to achieve high precision of simulated brightness temperature spectra, we consider only radiosonde profiles that reach up to 15 km. Each profile is smoothly merged with a corresponding profile at 15-80 km taken from the empiric atmospheric model NRLMSISE-00 [33]. The merging is done using a cosine function with a 3 km half period. Numerical integration in (1) is done using the trapezoid rule with fixed partitioning. There are 1840 steps in the partitioning grid with the steps increasing with altitude to provide high accuracy (<0.01 K) in calculations needed for the stability of numerical derivatives and error budget estimations.

2.3. Absorption Models

We use three modifications of the microwave propagation model (MPM) by Rosenkranz and Liebe [31]. The first of them is the default version provided in [32]. The model is widely known [30,31,32] and used in radiation transfer modeling and retrieval. We refer to this version ([32]) as to MPM1. In this version, the resulting absorption coefficient is a sum of absorption coefficients for water vapor, nitrogen and oxygen. The versions differ only by the molecular oxygen absorption. To explain the difference some intricacies of the MPM need to be explained first. In remote sensing applications, MPM is often utilized only as a reference (precise) model and rarely used directly in retrieval because it is rather expensive computationally, but from the spectroscopic perspective the model has a fair share of approximations.
The microwave oxygen spectrum is formed by a large number of the spectral lines corresponding to the so-called “fine structure transitions”. Most of these lines are observed in the 40–80 GHz range. Under tropospheric conditions, the lines form an irregularly shaped band with maximum absorption near 60 GHz. The main feature of the oxygen absorption in this band is the strong influence of the collisional coupling (or line mixing) effect [34]. The shape of the band depends on the collisional-relaxation operator matrix W. The size of the matrix is equal to the number of the transitions taken into account, the diagonal elements contain pressure broadening (real part) and pressure shifting (imaginary part) of the corresponding spectral line. Off-diagonal elements show the “strength” of the coupling between the respective lines. The elements of the matrix W can be calculated ab initio [35], through analytically derived collisional cross sections or basic rates [36], or derived by numerical methods from the observed absorption profiles as it was done for the MPM [37,38,39], in these cases, a priori experimentally measured line parameters are used. A more thorough explanation of this is far beyond the scope of the paper but it could be found in the paper [40]. The exact expression for the absorption coefficient [36,41] includes inversion of the matrix expression where the only non-diagonal term is PW (the discussed matrix W multiplied by the gas pressure P). If there is no collisional coupling between the lines, W is diagonal and the spectra turns into a sum of Van Vleck—Weisskopf shapes [42,43]. When collisional coupling takes place, i.e., when off-diagonal W elements are nonzero, the resulting absorption profile can be significantly different.
Matrix inversion can be treated by using a perturbation approach. As a result, it allows us to use convenient and easy to compute analytical expressions for the absorption coefficient. These analytical expressions are used in the corresponding ill posed problem of the estimation of the W elements (or rather the values derived from them, so called mixing-coefficients which are used in the absorption calculations directly). In MPM1 [32] the perturbation up to the first order is assumed. The first-order terms are responsible for the major part of the collisional coupling effect on the 60 GHz band shape, which is near 18% of the maximum absorption in surface level conditions.
In [40], corrections up to the second-order were given. Even at 1000 mBar pressure, the magnitude of the contribution of the second order terms is only 1–2% of the maximum absorption. In [44], the second order coefficients were obtained. This was done by the modified Twomey-Tikhonov method (ill-posed problem treatment), previously used only for the first-order coefficients [37]. Note two important features of mixing coefficients:
  • They are a self-consistent set (i.e., one cannot just change only first- or only second-order coefficients as they are all calculated from the relaxation matrix).
  • They are strongly connected with the primary parameters such as lines’ broadening coefficients and central frequencies, which are measured independently [31,45].
The most precise and up-to-date values of the first- and second-order coefficients together with their dependences on temperature are given in [46]. This version we will denote as MPM2. Besides the mixing coefficients defining the shape of the band, the question of the band intensity value was also raised in the study [46]. According to the analysis of the measurements data for the oxygen line at 118 GHz, the band intensity should be scaled to a factor of 1.00433. So, we denote the model with the oxygen absorption coefficient scaled this way as MPM2a.
At the current stage of the development, the models MPM2 and MPM2a are up 40 times more computationally expensive than MPM1. This is probably due to lack of optimization. That is why auxiliary computations (see Discussion section) are made using MPM1. The code of the models was altered to enhance the precision of the operations, i.e., 4-byte representation of floats was changed to 8byte.

2.4. Data Filtering

As was noted, we consider only those pairs of simultaneous microwave and radiosonde measurements when radiosonde profiles reach 15 km. We also apply a routine quality control, sanity and rain checks to microwave data. To distinguish clear-sky cases we use microwave data. First, we filter out the cases with retrieved LWP values more than 25 g/m2. Second, we reject the cases when the standard deviation of brightness temperature in the 31.4 GHz channel exceeds 0.5 K [47]. As a result, only 664 cases satisfy the clear sky criteria out of total 2235. After the simulation, we post-process the difference between the simulated and measured brightness temperatures. Following [24], in order to remove outliers (e.g., possible obstructions, undetected radome problems) we filter out the cases when this difference is larger than three standard deviations with respect to the mean difference. As a result of the post-processing, the dataset consists of 642 cases.

3. Results

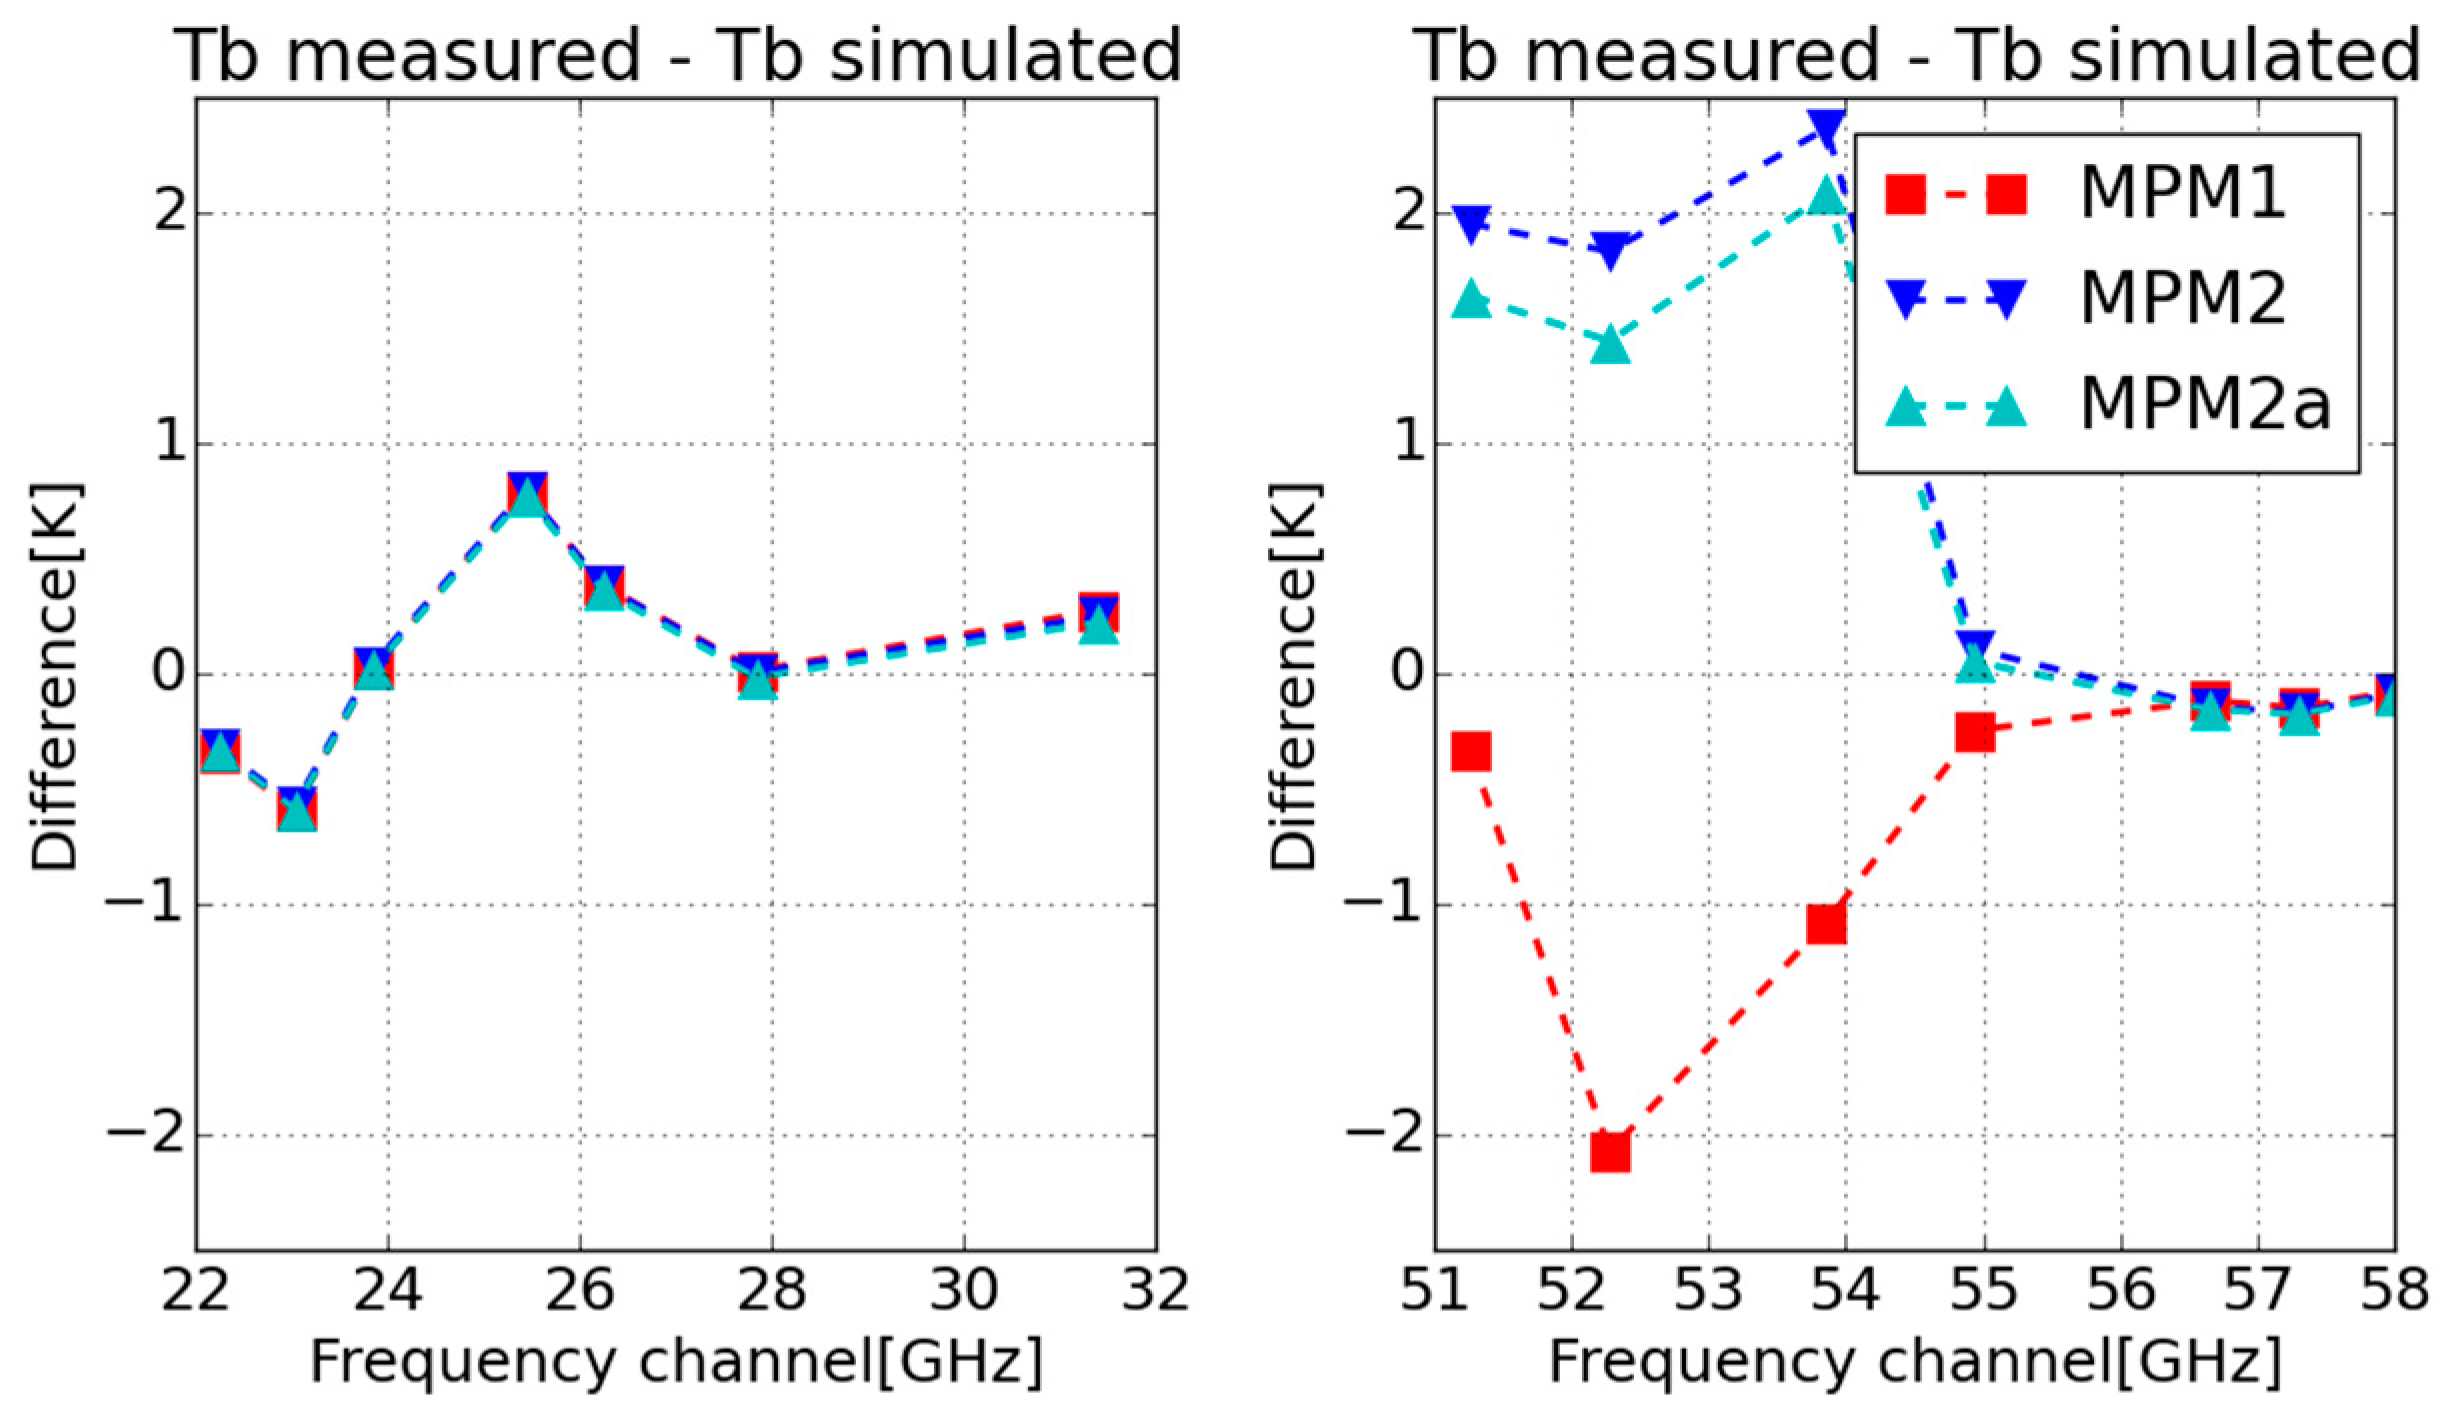
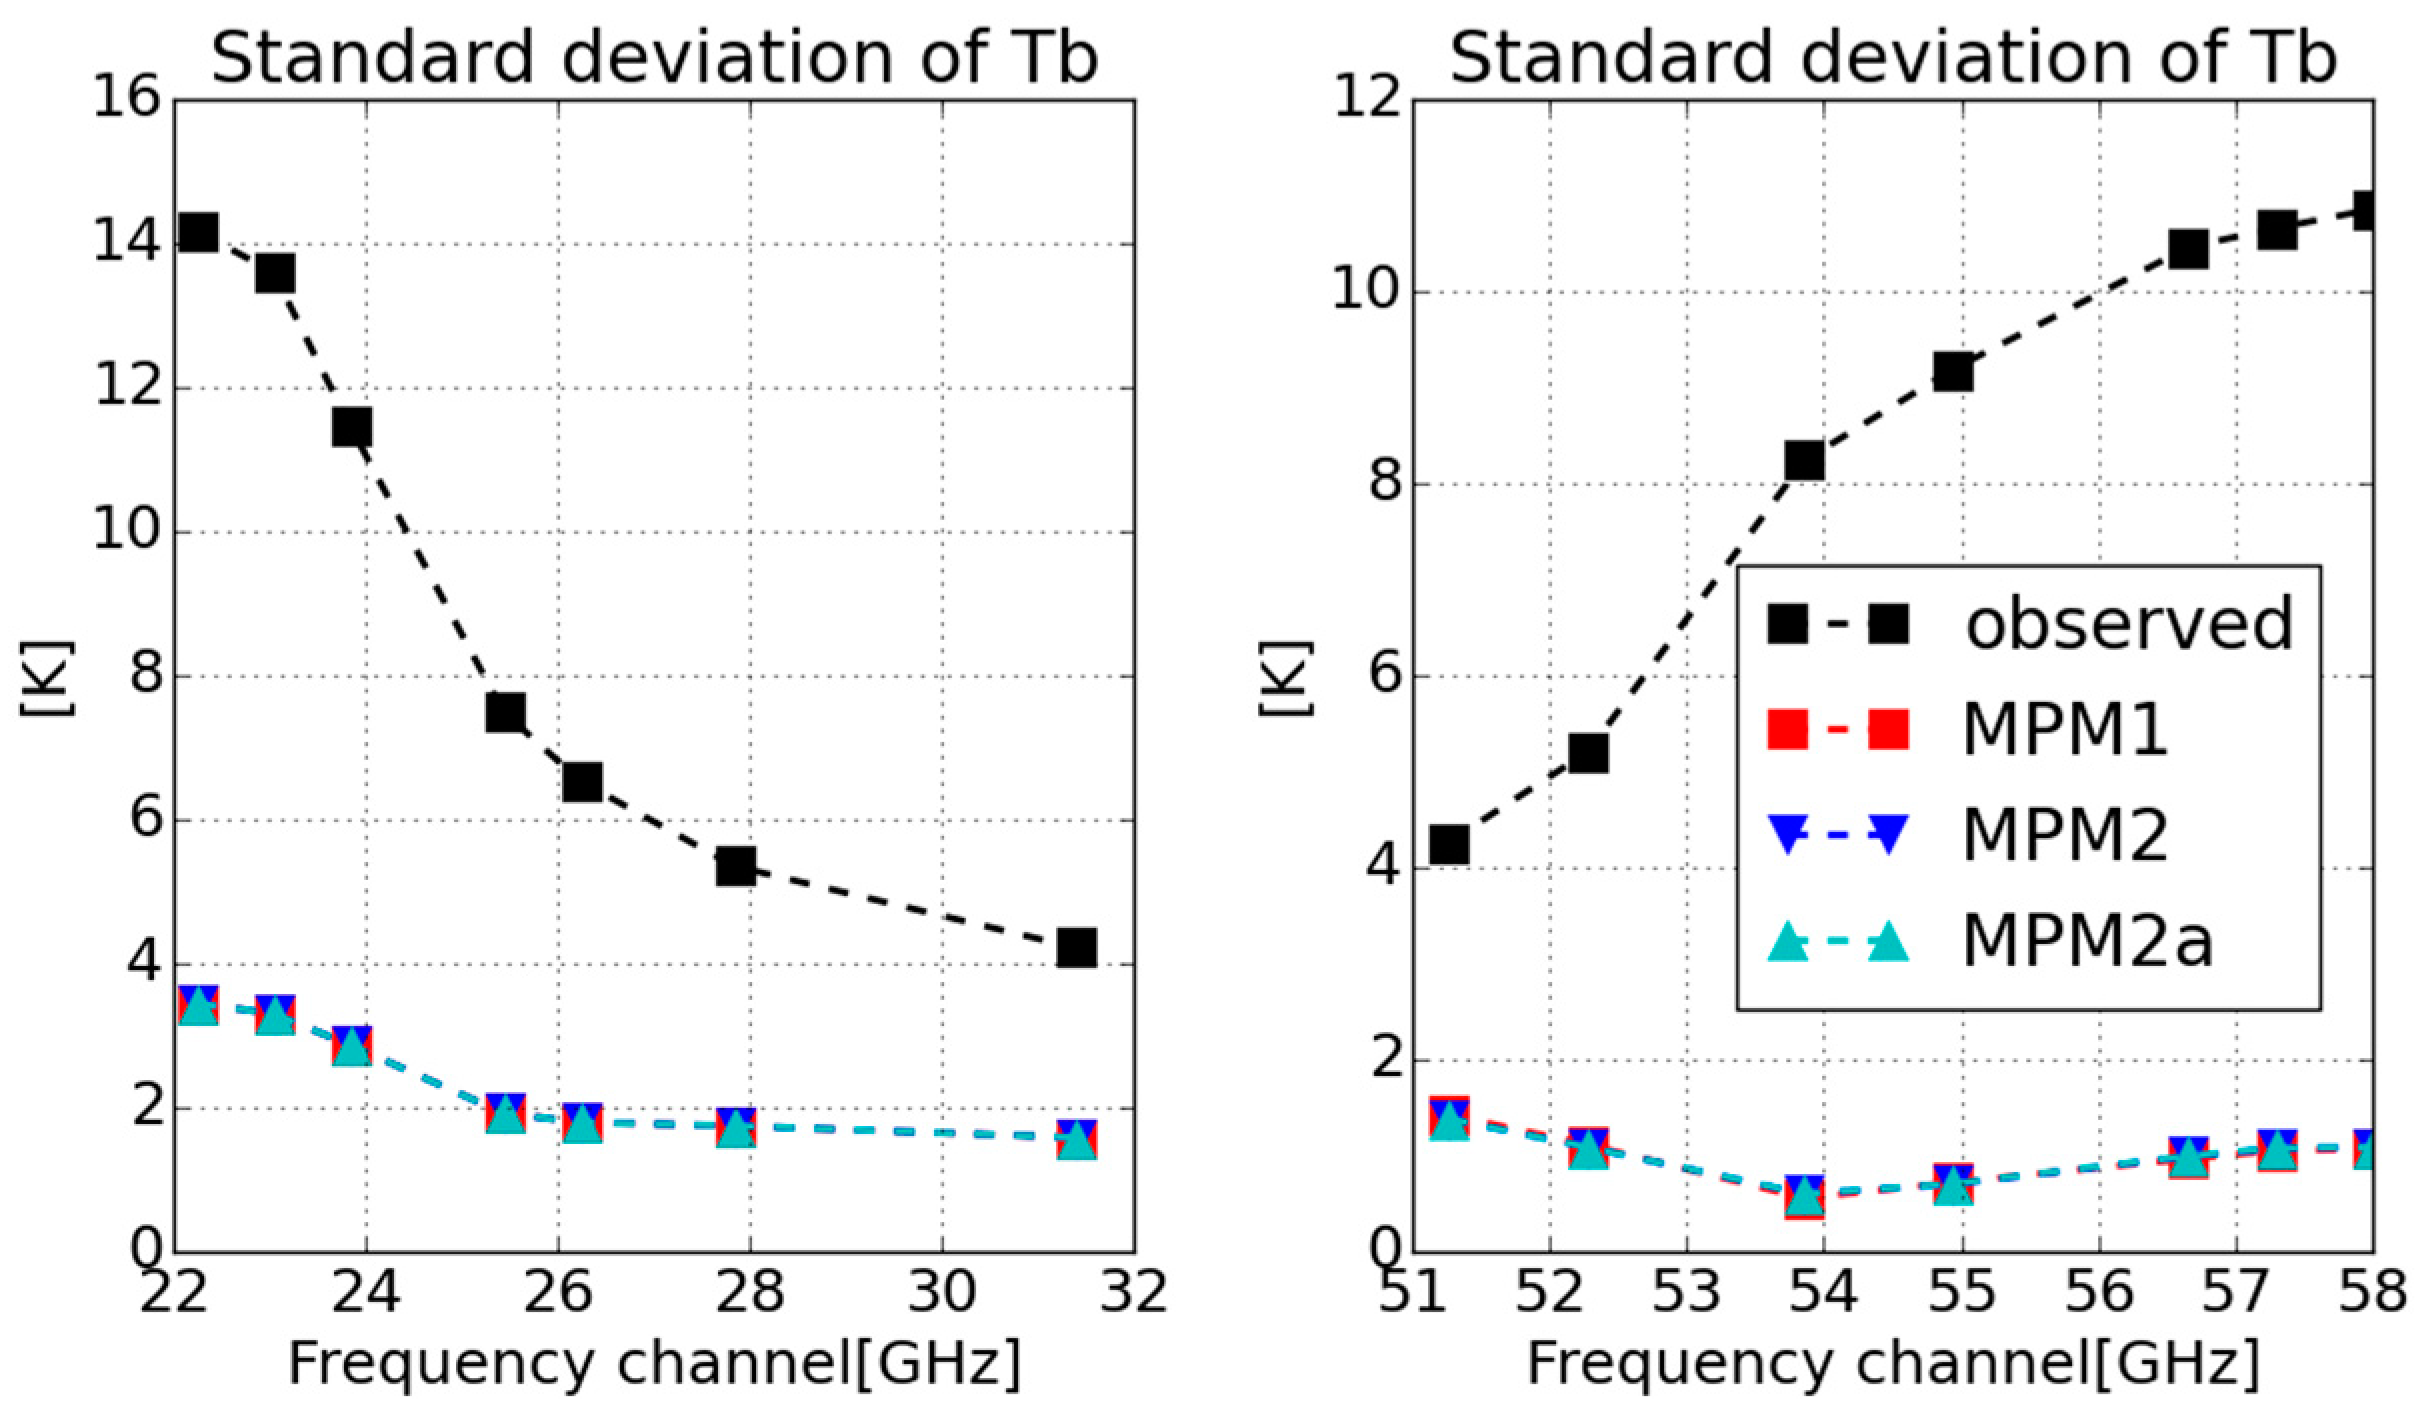
The main result of the presented work is the database of simulated and observed spectra. The scatter plot of the database is shown in Figure 1. It compares the measured brightness temperatures with the simulation results. The MPM2 results are not presented in the plot as they are close to the MPM2a results. Figure 2 demonstrates the mean differences between the spectra observed (at zenith measurements) and the simulated spectra corresponding to different absorption models. The standard deviation (SD) of each difference is plotted in Figure 3. Note that the SDs for different models are almost indistinguishable on the scale of the graph.
From Figure 2 one can see little difference between the models in the 22–32 GHz band because they differ only in oxygen absorption, whereas water vapor absorption is dominant in this band. At these frequencies, the mean difference (MD) varies in the range (−0.6 K, +0.8 K). Being opaque, the channels at 55–58 GHz show low values |MD| < 0.2 K for all models (see Discussion). The main difference between the models can be seen in the first 3 channels on the slope of the oxygen line (51.26, 52.28, and 53.86 GHz). These channels represent the less opaque part of the band. The absolute values of mean differences in these channels (in Figure 2) are higher than the corresponding standard deviations of the differences (in Figure 3) for all the models. Thus, we can conclude that the MPM1 simulations overestimate Tb, while MPM2 and MPM2a underestimate it. Note also that the SD values of the differences for all the models are significantly less (at least by 3 times) than the standard deviation of the measured brightness temperature shown in Figure 3. This shows that the simulation is viable. The SDs of the differences in Figure 3 are caused by the random error in the atmospheric profile. The nature of the error includes the objective difference (due to 7 km distance between the sites) between the profiles measured by the microwave instrument and the radiosonde and the uncertainty in radiosonde measurements.
Following [24] we calculated the excess kurtosis and skewness [48] for the difference between the measured and simulated Tb. Those are the fourth and the third standardized moments correspondingly, which quantify if a random variable distribution is close to normal distribution. For a normal distribution, both values are 0. Table 1 lists kurtosis and skewness for the Tb difference at zenith measurements. We do not specify the model here, as the difference between the models is less than 0.01 for any value. According to the criteria in [24], if the kurtosis and skewness are within the [−1, +1] interval, one can consider the distribution of the variable to be a fair approximation of the normal distribution. All the channels in Table 1 satisfy this criterion.
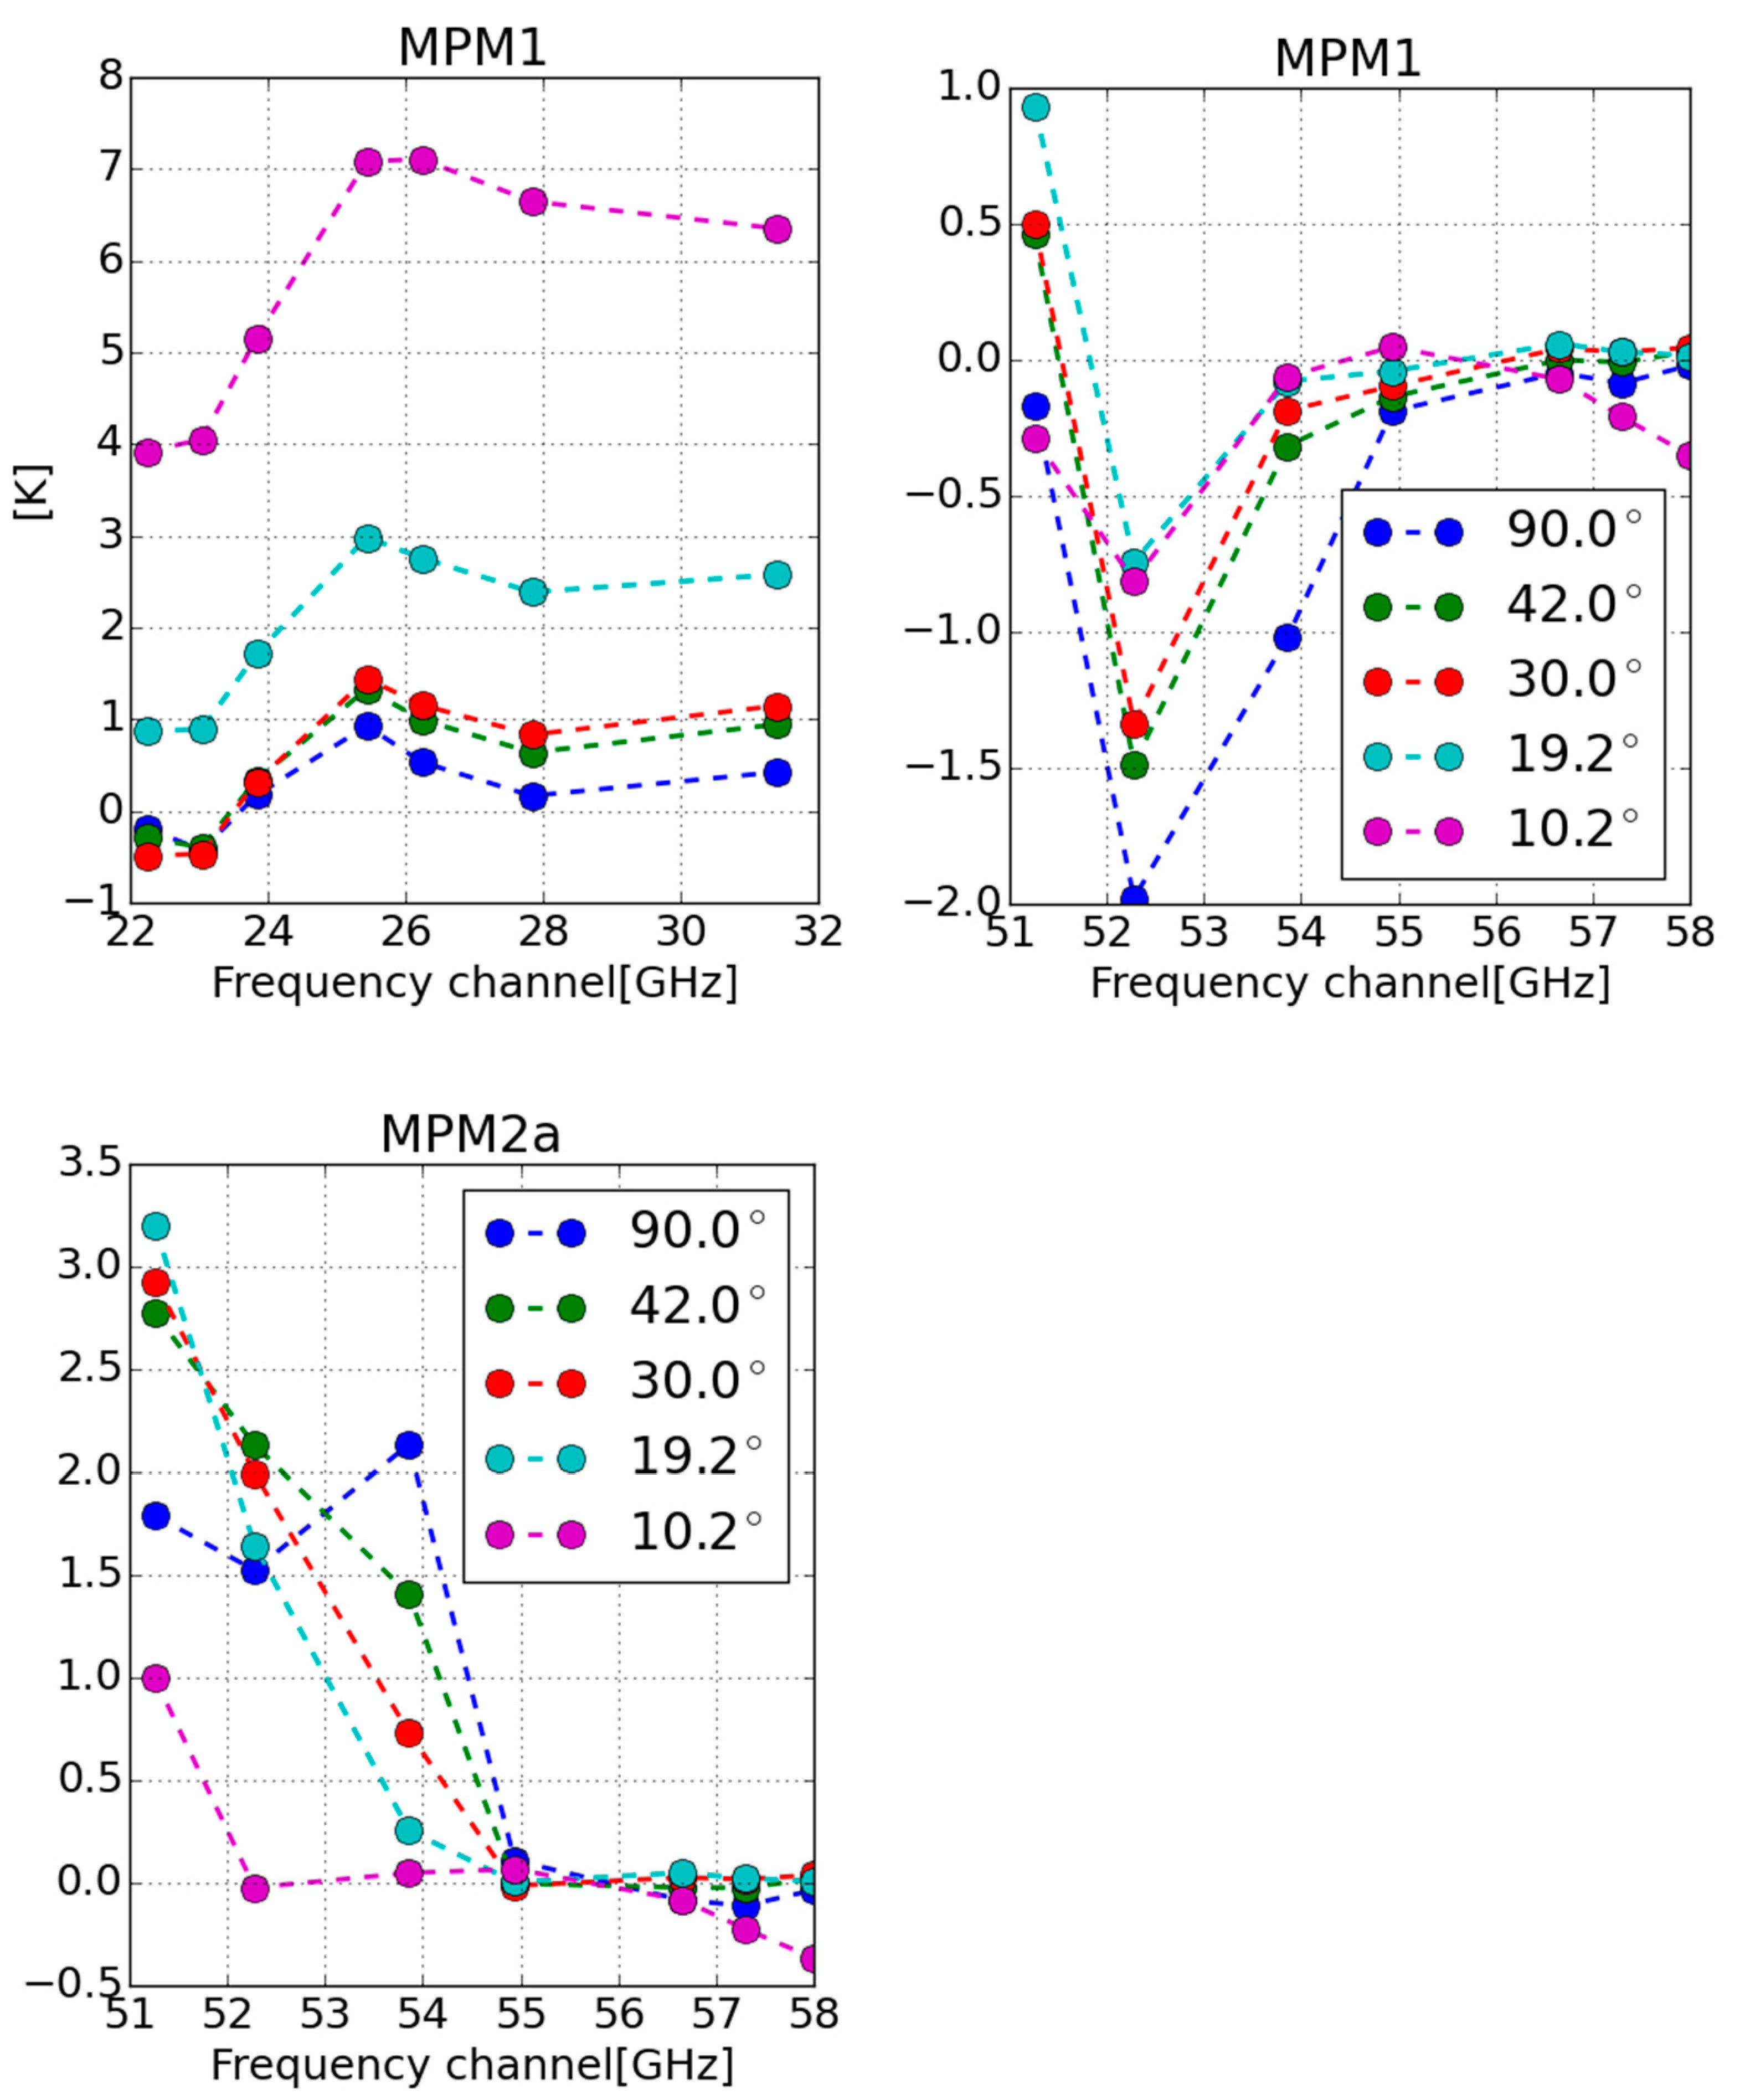
Figure 4 shows the MD values in scanning results for all but the lowest elevation angle (5.4°). This angle was excluded as we suspect a contamination of the beam (some anomalies in the 2016 data) of the device at this angle. The results for MPM2 are not shown as they are very similar to the MPM2a results. The scanning data for zenith direction (blue markers in Figure 4) is almost the same as the zenith measured data (Figure 2). This demonstrates constancy between two modes of measurements. With the decrease of the elevation angle, the 22–32 GHz band becomes more underestimated. The same tendency can be observed in the 51–60 GHz band but the behavior is more complex. In particular, opaque channels are influenced much less. The absolute value of MD in the 53.86 GHz channel decreases with angle while the sign of the value doesn’t change. For the MPM1 results, the decrease in the angle leads to lower overestimation although the 51.26 GHz channel becomes underestimated at low angles. The MPM2a results do not show a clear tendency concerning angle change.
The SD of the Tb differences in scanning results is shown in Figure 5. Apparently, there is no difference between the MPM1 and the MPM2a results. In the 22–32 GHz band, the decrease of the elevation angle leads to an increase in the standard deviation. For the 51–60 GHz band the same tendency can be observed for all the channels except the first two but the relative increase is smaller. Overall, it is clear that the simulation of the elevation scanning is a challenge for the simulation.

4. Discussion

The above results are straightforward but raise some questions: What causes the observed MDs at 51–54 GHz? Are they due to spectroscopic error or other factors? Thus, before discussing the results, we consider the error budget and give the corresponding estimates.
First, there may be a systematic bias between the temperature profiles above HATPRO and radiosonde profiles due to, for example, the distance (7 km) between the HATPRO site and the aerological station. Nevertheless, the possible changes in the profile cannot cause the disturbance of Tb at 51–60 GHz in the form shown in Figure 2. To demonstrate this in a more formal manner one should consider the linearized model (1) for the channels in the 51–60 GHz band. Here, we will limit ourselves to the analysis of simulations using the MPM1 model. To consider (1) as a function, we parametrize the temperature profile as a piecewise-linear function on an altitude grid, so that the values at the knots determine the profile. We make use of the HATPRO retrieval grid with an addition of 5 more knots (one knot per km up to 15 km). Thus, we have 44 knots in the grid. It is important to note that the number of knots is not high (i.e., less than 100) to simplify the demonstration. We linearize the model (1) near the mean atmospheric profile. The resulting derivatives form a 7 × 44 matrix K (7 channels and 44 grid knots). The singular value decomposition of that matrix K = UΣVT where U (7 × 7) and V (44 × 44) are orthogonal matrixes, and Σ is a rectangular diagonal matrix (7 × 44) with singular values at main diagonal. The columns of U are left-singular vectors while the columns of V are right-singular vectors. The decomposition helps us to see how and which disturbances in the spectra (left-singular vectors) are caused by the disturbances in the profile (right-singular vectors) [49]. The singular values of K are listed in Table 2. One can see that the smallest value is more than 103 times smaller than the largest one. Let’s consider the observed spectral difference in the basis consisting of left-singular vectors of K. The left-singular vectors corresponding to small singular values are the spectral distortions the temperature profile cannot produce (in a practical sense). One can see (Table 2) that the projection onto the directions corresponding to the smallest singular values is significant.
So, to produce such a projection (0.39 K) on the left-singular vector, the projection on the corresponding right-singular vector should be 0.39/1.60 × 10−4 = 2437.5 °C. Using the properties of orthogonal transformations, we can conclude that such a projection means at least 2437.5 °C/ 44 = 367.4 °C deviation in temperature at some altitude level. Which is far beyond possible uncertainties in the temperature profiles. Thus, a possible bias between the temperature profiles above HATPRO and radiosonde profiles cannot cause the disturbance of Tb at 51–58 GHz in the form shown in Figure 2.
Second, let us consider the model defects that are primarily caused by the approximations in (1). Below, we investigate the influence of bandwidth and beamwidth on Tb simulations. The topic in general is well covered in [49]. The work makes the estimates of the influences depending on elevation angle, bandwidth and channel’s central frequency. However, the figures in the paper are aimed to represent the extreme values, while the HATPRO configuration values lie in the “green” area, so it is hard to determine exact values. Therefore, below make estimates for the special case of the HATPRO measurements. The estimation is performed using the MPM1 model as enables relatively fast simulations (using 20 core workstation). We assume the estimations for the other propagation models are roughly the same, as the relative difference between the models is small.
The half power beamwidth (HPBW) of the HATPRO antenna system is 3.7° for 22–32 GHz and 2.2° for 51–60 GHz (see [27]). The finite antenna resolution should be taken into account for simulations at very low elevation angles [50]. To assess the influence of the beam width in our simulations, we estimate the difference between the pencil beam model (1) and the model taking the beamwidth into consideration as:
T b ( ν , θ ) T b ( ν , θ ) ψ ( θ ) d θ 2 T b θ 2 Δ θ 2 16 ln 2
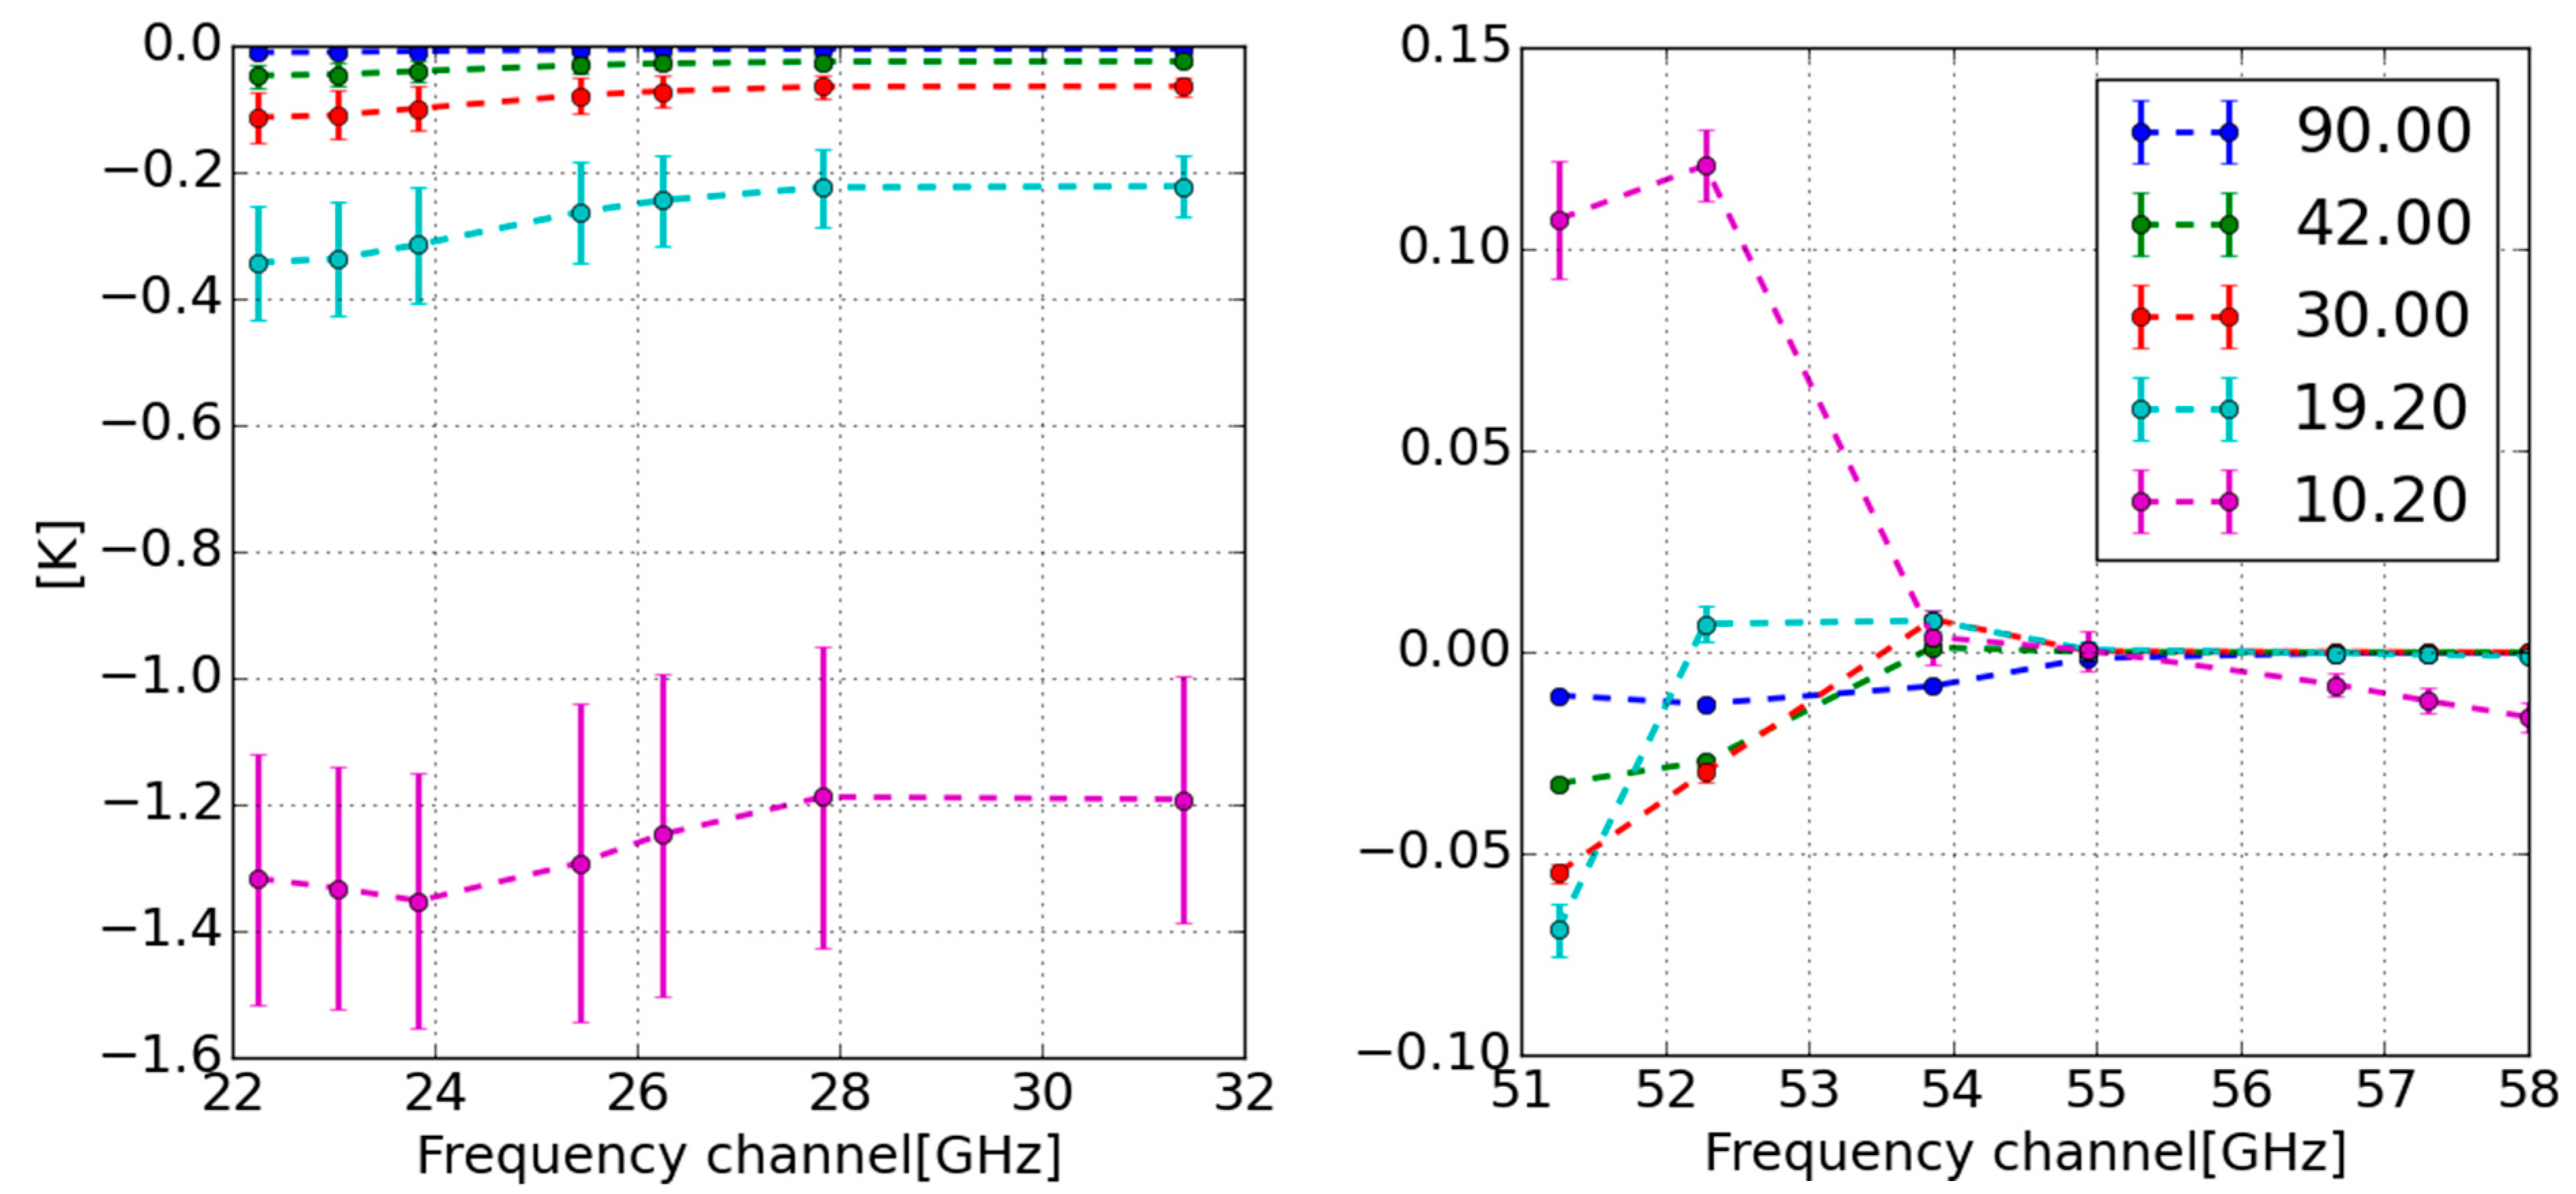
where 2 T b θ 2 is the second derivative of (1) with respect to the elevation angle (obtained numerically) and Δθ is antenna’s HPBW. In the derivation of (4) we consider the integral of Tb with antenna gain function ψ while Tb is approximated via a 2th Taylor polynomial. The gain function is assumed to be Gaussian with the variance Δθ/ 8 ln 2 . Figure 6 shows the mean and standard deviation of the estimate (4) for the angles used in the current work. The model defect causes noticeable underestimation (up to 1.4 K) of the results in Figure 4 in the 22–32 GHz band at 10.2° elevation angle while at 19.2° the underestimation is less than 0.4 K. Nevertheless, it doesn’t change the overall picture. As for the 51–60 GHz band simulations, the pencil beam calculations are accurate up to 0.12 K for all angles.
The influence of receiver bandwidth is estimated by a straightforward numerical integration. Without information about the precise filter shape of the channels we consider them to be rectangular. Our calculations show that the accuracy of monochromatic simulation is 0.15 K due to the HATRPO design. The latter is especially relevant for the 51–60 GHz band due to the presence of multiple narrow absorption peaks in the band. Figure 7 depicts mean and standard deviation of the difference (defined following [49]) between the monochromatic and the model with the bandwidth taken into account.
Thus, the error budget estimated above cannot explain the results shown in Figure 1. The main reason of MDs at 51–54 GHz seems to be due to the spectroscopic error.
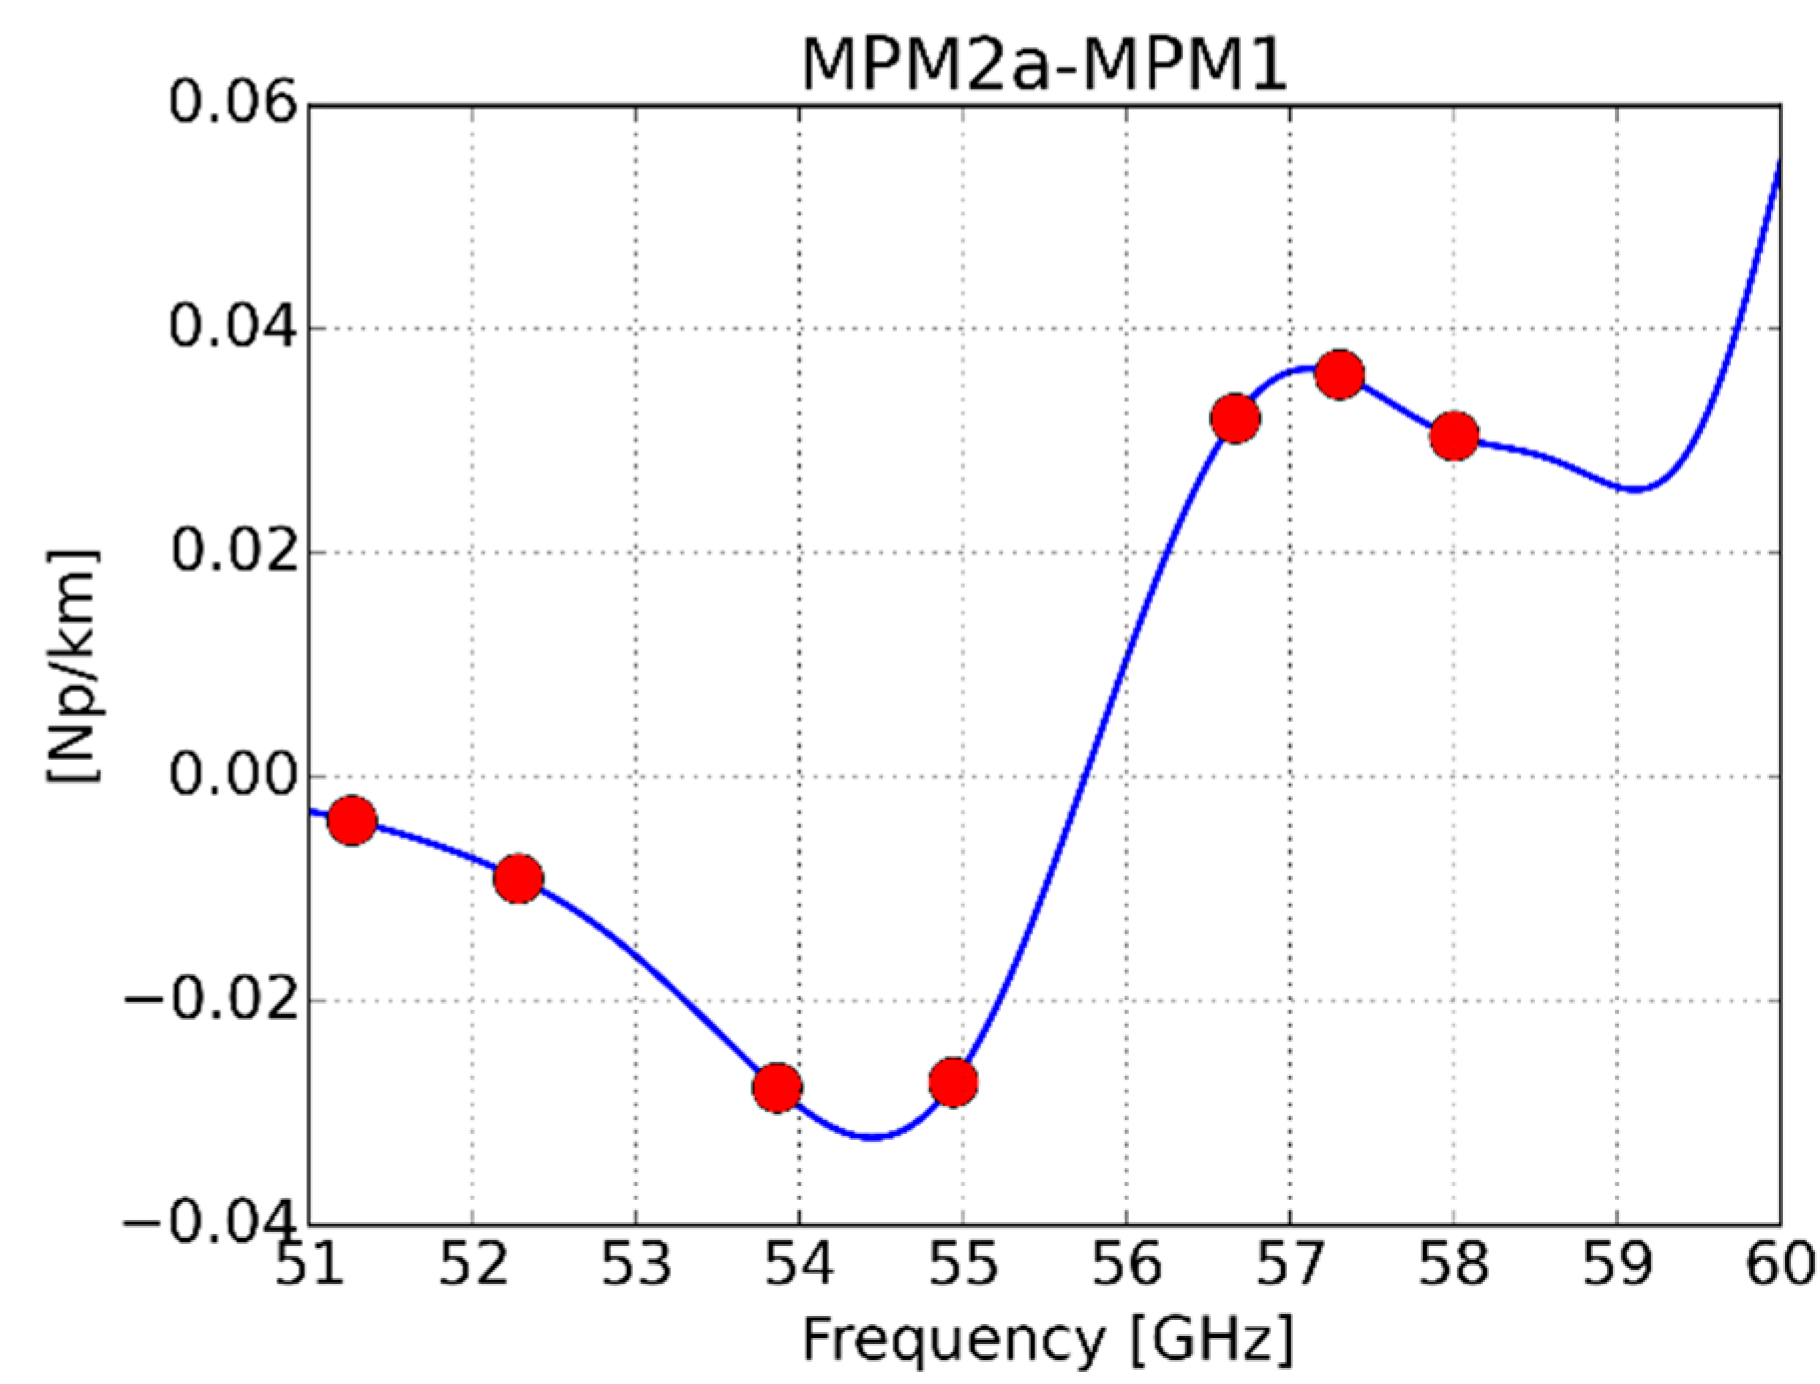
Figure 2 and Figure 4 have channels with small MDs in the 51–60 GHz band. This, however, does not mean that the mismatch of the absorption coefficient in these channels is small compared to the other channels. The difference in absorption coefficients between MPM2a and MPM1 models at 1000 mBar is demonstrated in Figure 8. The absorption difference is even larger for the 56–60 GHz channels. These channels are opaque, which means that the value of opacity (2) at the upper boundary z is high. The behavior of the opaque channels is governed by the fundamental properties of (1). There exists a mathematical fact following from basic properties of integration:
z 0 z α sin θ T ( z ) exp ( τ ( z , θ ) ) d z = T * z 0 z α sin θ exp ( τ ( z , θ ) ) d z = = T [ 1 exp ( τ ( z , θ ) ) ]
where T* is a value in the temperature profile, i.e., T* = T(z*), while z* belongs to the [z0, z] interval. For the opaque channel, the exponent in the right-hand side of (5) is almost zero. Thus, for the channel, (1) is equivalent to the weighted average of the atmospheric profile. The largest contribution to the integral in the second term in (1) is made by the atmospheric layer, for which the opacity (2) is low. Therefore, Tb in the opaque channel is average of the near surface layer. The characteristic height of this layer corresponds to the altitude with high enough opacity.
Note that for opaque channels, the change in absorption manifests itself in Tb only if there is altitude dependence in the temperature profile, which is always the case in troposphere. The more opaque (the thinner the layer) the channel, the less sensitive it is to a change in absorption. The small (relative) mismatch in absorption causes small relative changes in the effective height of the layer. However, the fact that the layer is thin makes the change in Tb even smaller, as the change of the temperature in the layer with a change in altitude is small. This can be illustrated by a purely artificial example where the absorption is constant and temperature steadily declines with altitude. In this case, (1) takes the form:
0 z α ( T s g z ) exp ( α z ) d z T s g α ,
where Ts is the surface temperature, and g is the rate of temperature decline. In (6) all exponents with opacity at the z level are neglected. A small change in the absorption coefficient Δα will lead to −Δα∙g2 change in the brightness temperature. Thus, a more opaque case (a greater α) demonstrates a smaller change in Tb.
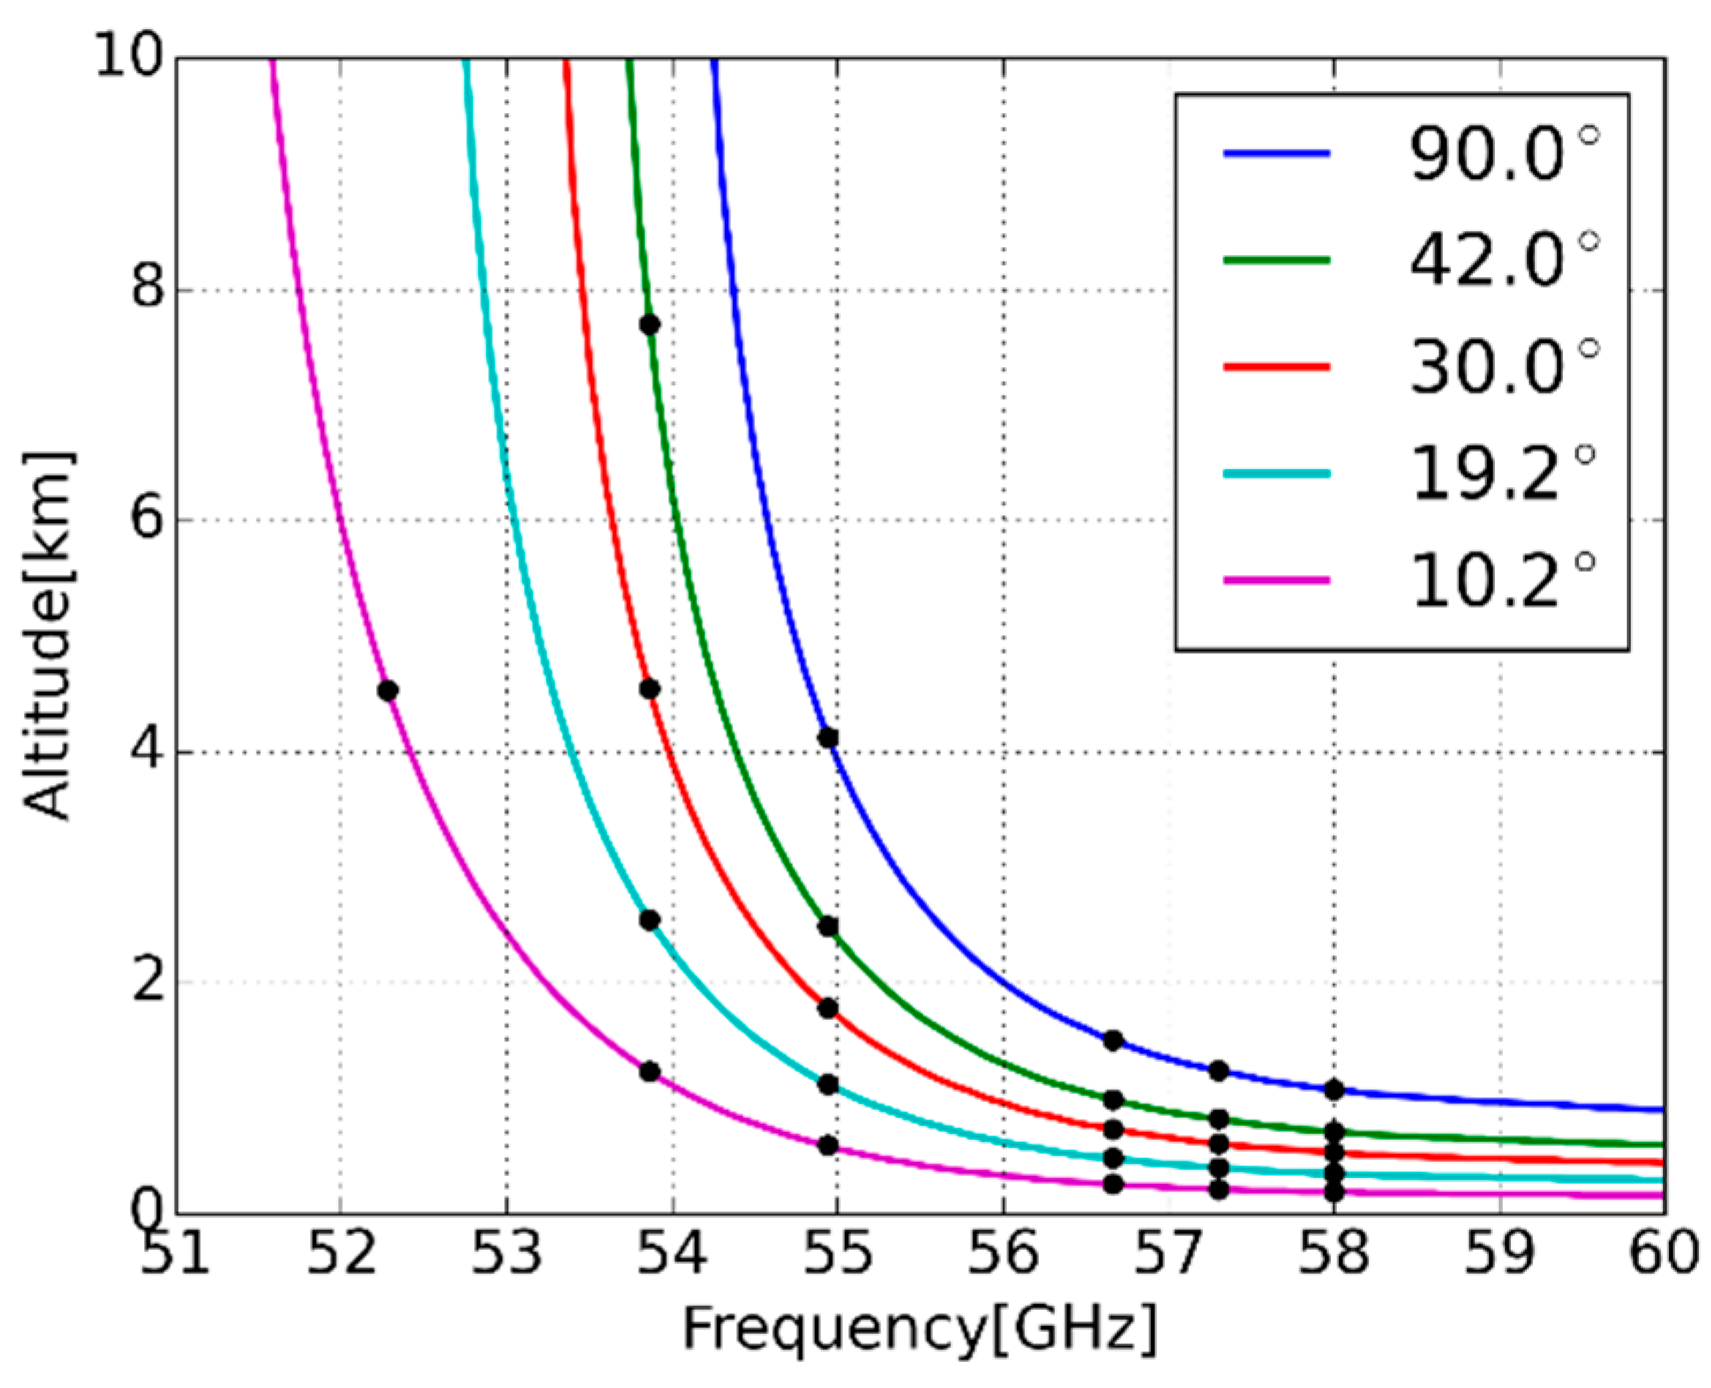
Let us discuss the results presented in Figure 4 and Figure 5. At lower elevation angles, some channels are opaque. To refrain from speculation, we estimated the altitude at which the opacity reaches 3 depending on frequency (see Figure 9). This opacity value means that the atmospheric signal coming from above this altitude, is attenuated approximately 20 times when it reaches the receiver. The estimation is made with the MPM1 model using average atmospheric profiles for clear-sky cases. The estimate shows that the channels 54–60 GHz are opaque regardless of the elevation angle. These channels demonstrate lower MDs in Figure 2 and Figure 4. The channel at 53.86 GHz is opaque for all angles except 90°. The channel at 52.28 GHz is opaque only at 10°. Note the significant decrease in the SD of the difference in this channel at 10° in Figure 5. When the absorption increases with the decrease of the angle, the absolute value of MD gradually decreases. This can be observed in the 52.28 GHz and 53.86 GHz channels.
The results presented in Figure 2 and Figure 4 are impacted by systematic error in atmosphere profiles. It is reasonable to expect that the error is the most pronounced in near surface layers. The MD in the most opaque channel (58 GHz) should point to this error. However, the MD in this channel is less than 0.3 K, which is below the stated absolute radiometric accuracy of HATPRO [27]. So, we can conclude that the systematic error in temperature does not exceed 0.3 K at least at lower altitudes, although the SD of the difference in opaque channels shown in Figure 5 is up to 1.5 K. This indicates random error in temperature that is localized at lower altitudes. The SD increases with the decrease of the angle as the effective layer becomes thinner and the error affects the simulations more.
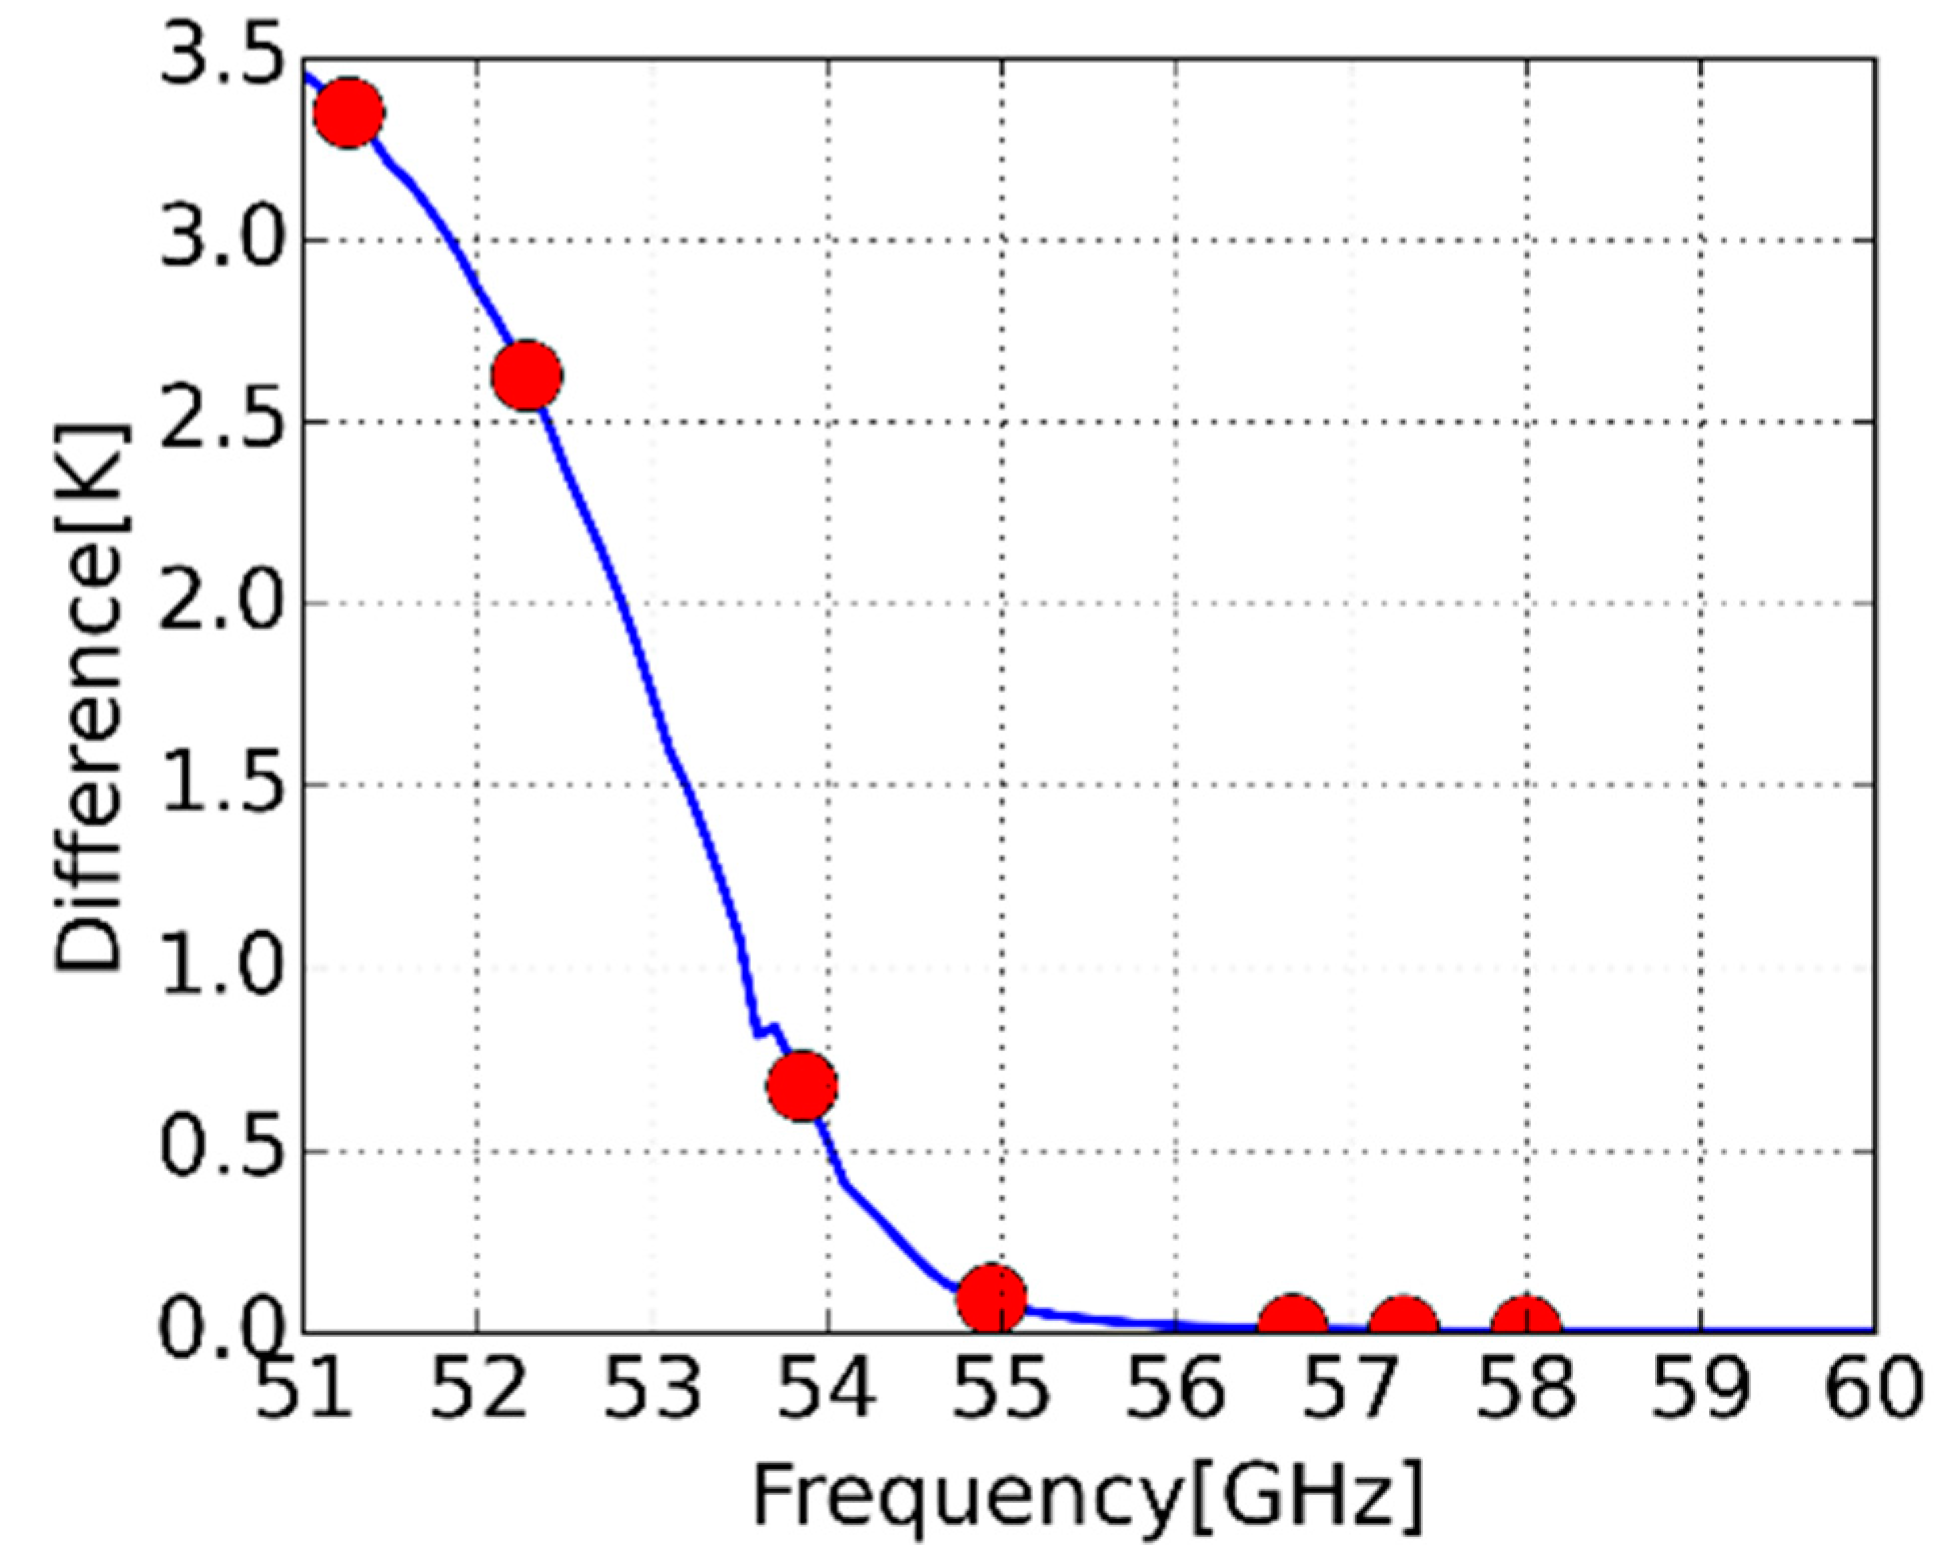
It is apparent from Figure 4 that the mismatch in the absorption profile changes with the angle. Namely the MDs in the 51.26 and 52.28 GHz channels seem to shift towards underestimation (“upwards” in Figure 4). This can be explained by cloud contamination. Unfortunately, we are unable to detect cloudy conditions during the angle-scanning mode. The contamination is hard to characterize. The number of cloud cases may not increase with the decrease of the elevation angle. However, it is likely to shift the MDs only in the direction of underestimation. The effect simulating cloud contamination in the 51–60 GHz band is shown in Figure 10. The cloud was simulated as a layer with certain LWC (liquid water content) that corresponds to 50 g/m2 LWP. The contamination is most likely the cause of the increase of MDs with an angle decrease in the 22–32 GHz band as the presence of a cloud also brings humidity, which may be absent in radiosonde data.
We can conclude that due to possible cloud contamination the results presented in Figure 4 and Figure 5 are less valuable in terms of representing spectroscopic error. Moreover, at lower elevation angles, the channels are more opaque, hence they are less sensitive to the mismatch in absorption model. However, these results further demonstrate the validity of the simulation, as the behavior observed falls within the expectations.

5. Conclusions

Thus, we have analyzed the difference between the observed and the simulated microwave spectra obtained from more than 4 years of microwave and radiosonde observations over Nizhny Novgorod (56.2° N, 44° E). In the case of zenith-measurements in clear-sky conditions, we found a systematic bias (up to ~2 K) of the simulated spectra at 51–54 GHz frequency band. The sign of the bias depends on the absorption model. A thorough investigation of the error budget points to a spectroscopic nature of the observed differences. It is important to understand that possible spectroscopic error is not localized in the 51–54 GHz band, we are only capable to see its manifestation in this band.
The scanning results proved to be less valuable for investigation of the spectroscopic error for two reasons. First, with the decrease of the elevation angle, more channels become opaque, which makes them less sensitive to the manifestation of spectroscopic error. Second, there is possible cloud contamination in this data, as we cannot control the presence of clouds in scanning data.
The obtained results demonstrate that there is no systematic difference more than 0.3 K between the radiosonde measurements and the real temperature profile on the line of sight of the HATPRO, at least at low altitudes.

Author Contributions

Conceptualization, M.V.B. and M.Y.K.; methodology, M.V.B. and M.Y.K.; software, M.V.B., N.K.S. and D.S.M.; validation, M.V.B. and M.Y.K.; formal analysis, M.Y.K. and S.O.D.; investigation, M.V.B., M.Y.K., N.K.S., D.S.M., S.O.D., E.A.S. and A.M.F.; resources, V.G.R., A.A.S. and A.A.K.; data curation M.V.B.; writing—original draft preparation, M.V.B., M.Y.K. and D.S.M.; writing—review and editing, S.O.D. and A.M.F.; visualization, S.O.D.; supervision, A.M.F.; project administration, E.A.S. and M.Y.K.; funding acquisition, E.A.S. and M.Y.K. All authors have read and agreed to the published version of the manuscript.

Funding

This work was supported by the Russian Science Foundation (18-72-10113). Microwave data were obtained within the framework of the state assignment No.0035-2019-0008.

Institutional Review Board Statement

Not applicable.

Informed Consent Statement

Not applicable.

Data Availability Statement

The data presented in this study are available on request from the corresponding author.

Acknowledgments

The authors would like to thank Mikhail Yu. Tretyakov for his participation in the discussion and useful suggestions. The authors are grateful to two anonymous reviewers for constructive recommendations and improving suggestions.

Conflicts of Interest

The authors declare no conflict of interest. The funders had no role in the design of the study; in the collection, analyses, or interpretation of data; in the writing of the manuscript, or in the decision to publish the results.

References

  1. National Research Council. Observing Weather and Climate from the Ground Up: A Nationwide Network of Networks; The National Academies Press: Washington, DC, USA, 2009; 250p. [Google Scholar] [CrossRef]
  2. National Research Council. When Weather Matters: Science and Services to Meet Critical Societal Needs; The National Academies Press: Washington, DC, USA, 2010; 198p. [Google Scholar] [CrossRef]
  3. Troitsky, A.V.; Gajkovich, K.P.; Gromov, V.D.; Kadygrov, E.N.; Kosov, A.S. Thermal sounding of the atmospheric boundary layer in the oxygen absorption band center at 60 GHz. IEEE Trans. Geosci. Remote Sens. 1993, 31, 116–120. [Google Scholar] [CrossRef]
  4. Ware, R.; Carpenter, R.; Güldner, J.; Liljegren, J.; Nehrkorn, T.; Solheim, F.; Vandenberghe, F. A multichannel radiometric profiler of temperature, humidity, and cloud liquid. Radio Sci. 2003, 38, 8079. [Google Scholar] [CrossRef] [Green Version]
  5. Rose, T.; Crewell, S.; Löhnert, U.; Simmer, C. A network suitable microwave radiometer for operational monitoring of the cloudy atmosphere. Atmos. Res. 2005, 75, 183–200. [Google Scholar] [CrossRef]
  6. Navas-Guzmán, F.; Kämpfer, N.; Haefele, A. Validation of brightness and physical temperature from two scanning microwave radiometers in the 60 GHz O2 band using radiosonde measurements. Atmos. Meas. Tech. 2016, 9, 4587–4600. [Google Scholar] [CrossRef] [Green Version]
  7. Shvetsov, A.A.; Ryskin, V.G.; Kulikov, M.Y.; Kukin, L.M.; Fedoseev, L.I.; Schitov, A.M.; Feigin, A.M. Ground-based microwave spectroradiometer for thermal sounding of the troposphere. Instrum. Exp. Tech. 2016, 59, 433–436. [Google Scholar] [CrossRef]
  8. Shvetsov, A.A.; Belikovich, M.V.; Krasilnikov, A.A.; Kulikov, M.Y.; Kukin, L.M.; Ryskin, V.G.; Bolshakov, O.S.; Lesnov, I.V.; Shitov, A.M.; Feigin, A.M.; et al. A 5-mm Wavelength-Range Spectroradiometer for Studying the Atmosphere and Underlying Surface. Instrum. Exp. Tech. 2020, 63, 885–889. [Google Scholar] [CrossRef]
  9. Güldner, J. A model-based approach to adjust microwave observations for operational applications: Results of a campaign at Munich Airport in winter 2011/2012. Atmos. Meas. Tech. 2013, 6, 2879–2891. [Google Scholar] [CrossRef]
  10. Cimini, D.; Rizi, V.; Di Girolamo, P.; Marzano, F.S.; Macke, A.; Pappalardo, G.; Richter, A. Overview: Tropospheric profiling: State of the art and future challenges—Introduction to the AMT special issue. Atmos. Meas. Tech. 2014, 7, 2981–2986. [Google Scholar] [CrossRef]
  11. Rodgers, C.D. Inverse Methods for Atmospheric Sounding: Theory and Practice; World Scientific: Singapore, 2000; p. 240. [Google Scholar]
  12. Ware, R.; Cimini, D.; Campos, E.; Giuliani, G.; Albers, S.; Nelson, M.; Koch, S.E.; Joe, P.; Cober, S. Thermodynamic and liquid profiling during the 2010 Winter Olympics. Atmos. Res. 2013, 132–133, 278–290. [Google Scholar] [CrossRef]
  13. Chan, P.W. Performance and application of a multiwavelength, ground-based microwave radiometer in intense convective weather. Meteorol. Z. 2009, 18, 253–265. [Google Scholar] [CrossRef]
  14. Chan, P.W.; Hon, K.K. Application of ground-based, multichannel microwave radiometer in the nowcasting of intense convective weather through instability indices of the atmosphere. Meteorol. Z. 2011, 20, 431–440. [Google Scholar] [CrossRef]
  15. Madhulatha, A.; Rajeevan, M.; Venkat Ratnam, M.; Bhate, J.; Naidu, C.V. Nowcasting severe convective activity over southeast India using ground-based microwave radiometer observations. J. Geophys. Res. Atmos. 2013, 118, 1–13. [Google Scholar] [CrossRef] [Green Version]
  16. Venkat Ratnam, M.; Durga Santhi, Y.; Rajeevan, M.; Vijaya Bhaskara Rao, S. Diurnal variability of stability indices observed using radiosonde observations over a tropical station: Comparison with microwave radiometer measurements. Atmos. Res. 2013, 124, 21–33. [Google Scholar] [CrossRef]
  17. Cimini, D.; Nelson, M.; Güldner, J.; Ware, R. Forecast indices from a ground-based microwave radiometer for operational meteorology. Atmos. Meas. Tech. 2015, 8, 315–333. [Google Scholar] [CrossRef] [Green Version]
  18. Kulikov, M.Y.; Belikovich, M.V.; Skalyga, N.K.; Shatalina, M.V.; Dementyeva, S.O.; Ryskin, V.G.; Shvetsov, A.A.; Krasil’nikov, A.A.; Serov, E.A.; Feigin, A.M. Skills of Thunderstorm Prediction by Convective Indices over a Metropolitan Area: Comparison of Microwave and Radiosonde Data. Remote Sens. 2020, 12, 604. [Google Scholar] [CrossRef] [Green Version]
  19. Martinet, P.; Dabas, A.; Donier, J.-M.; Douffet, T.; Garrouste, O.; Guillot, R. 1D-Var Temperature retrievals from Microwave Radiometer and convective scale Model. Tellus A Dyn. Meteorol. Oceanogr. 2015, 67, 27925. [Google Scholar] [CrossRef] [Green Version]
  20. Caumont, O.; Cimini, D.; Löhnert, U.; Alados-Arboledas, L.; Bleisch, R.; Buffa, F.; Ferrario, M.E.; Haefele, A.; Huet, T.; Madonna, F.; et al. Assimilation of humidity and temperature observations retrieved from ground-based microwave radiometers into a convective-scale NWP model. Q. J. R. Meteorol. Soc. 2016, 142, 2692–2704. [Google Scholar] [CrossRef] [Green Version]
  21. Liljegren, J.C.; Boukabara, S.A.; Cady-Pereira, K.; Clough, S.A. The effect of the half-width of the 22 GHz water vapor line on retrievals of temperature and water vapor profiles with a twelve-channel microwave radiometer. IEEE Trans. Geosci. Remote Sens. 2005, 43, 1102–1108. [Google Scholar] [CrossRef]
  22. Hewison, T.J.; Cimini, D.; Martin, L.; Gaffard, C.; Nash, J. Validating clear air absorption model using ground-based microwave radiometers and vice-versa. Meteorol. Z. 2006, 15, 27–36. [Google Scholar] [CrossRef] [Green Version]
  23. Martinet, P.; Cimini, D.; De Angelis, F.; Canut, G.; Unger, V.; Guillot, R.; Tzanos, D.; Paci, A. Combining ground-based microwave radiometer and the AROME convective scale model through 1DVAR retrievals in complex terrain: An Alpine valley case study. Atmos. Meas. Tech. 2017, 10, 3385–3402. [Google Scholar] [CrossRef] [Green Version]
  24. De Angelis, F.; Cimini, D.; Löhnert, U.; Caumont, O.; Haefele, A.; Pospichal, B.; Martinet, P.; Navas-Guzmán, F.; Klein-Baltink, H.; Dupont, J.-C.; et al. Long-term observations minus background monitoring of ground-based brightness temperatures from a microwave radiometer network. Atmos. Meas. Tech. 2017, 10, 3947–3961. [Google Scholar] [CrossRef] [Green Version]
  25. Cimini, D.; Rosenkranz, P.W.; Tretyakov, M.Y.; Koshelev, M.A.; Romano, F. Uncertainty of atmospheric microwave absorption model: Impact on ground-based radiometer simulations and retrievals. Atmos. Chem. Phys. 2018, 18, 15231–15259. [Google Scholar] [CrossRef] [Green Version]
  26. Instrument Operation and Software Guide. Available online: http://www.radiometer-physics.de/download/PDF/Radiometers/HATPRO/RPG_MWR_STD_Software_Manual%20G5.pdf (accessed on 31 March 2021).
  27. Technical Instrument Manual. Available online: http://www.radiometer-physics.de//downloadftp/pub/PDF/Radiometers/General_documents/Manuals/2015/RPG_MWR_STD_Technical_Manual_2015.pdf (accessed on 31 March 2021).
  28. OOO «Aэpoпpибop» (PLC “Aeropribor”). Available online: http://zondr.ru/development-product/10-ak-2.html (accessed on 1 May 2021).
  29. Rosenkranz, P.W. Absorption of microwaves by atmospheric gases. In Atmospheric Remote Sensing by Microwave Radiometry; Janssen, M.A., Ed.; John Wiley & Sons: New York, NY, USA, 1993; pp. 37–90. [Google Scholar]
  30. Liebe, H.J.; Rosenkranz, P.W.; Hufford, G.A. Atmospheric 60-GHz oxygen spectrum: New laboratory measurement and line parameters. J. Quant. Spectrosc. Rad. Transf. 1992, 48, 629–643. [Google Scholar] [CrossRef]
  31. Tretyakov, M.Y.; Koshelev, M.A.; Dorovskikh, V.V.; Makarov, D.S.; Rosenkranz, P.W. 60-GHz oxygen band: Precise broadening and central frequencies of fine structure lines, absolute absorption profile at atmospheric pressure, revision of mixing coefficients. J. Molec. Spectrosc. 2005, 231, 1–14. [Google Scholar] [CrossRef]
  32. Rosenkranz, P.W. Line-by-Line Microwave Radiative Transfer (Non-Scattering), Remote Sens. Code Library. Available online: http://cetemps.aquila.infn.it/mwrnet/lblmrt_ns.html (accessed on 8 April 2021).
  33. Picone, J.M.; Hedin, A.E.; Drob, D.P.; Aikin, A.C. NRLMSISE-00 empirical model of the atmosphere: Statistical comparisons and scientific issues. J. Geophys. Res. 2002, 107, 1468. [Google Scholar] [CrossRef]
  34. Rosenkranz, P.W. Shape of the 5 mm oxygen band in the atmosphere. IEEE Trans Antennas Propag. 1975, 23, 498–506. [Google Scholar] [CrossRef]
  35. Lam, K.S. Application of pressure broadening theory to the calculation of atmospheric oxygen and water vapor microwave absorption. J. Quant. Spectrosc. Rad. Transfer. 1977, 17, 351–383. [Google Scholar] [CrossRef]
  36. Makarov, D.S.; Tretyakov, M.Y.; Boulet, C. Line mixing in the 60-GHz atmospheric oxygen band: Comparison of the MPM and ECS model. J. Quant. Spectrosc. Rad. Transf. 2013, 124, 1–10. [Google Scholar] [CrossRef]
  37. Rosenkranz, P.W. Interference coefficients for overlapping oxygen lines in air. J. Quant. Spectrosc. Rad. Transf. 1988, 39, 281–297. [Google Scholar] [CrossRef]
  38. Twomey, S. On the numerical solution of Fredholm integral equations of the first kind by the inversion of the linear system produced by quadrature. J. Assoc. Comput. Mach. 1963, 10, 97–101. [Google Scholar] [CrossRef]
  39. Tikhonov, A.N. On the solution of incorrectly stated problems and a method of regularization. Dokl. Akad. Nauk. SSSR 1963, 151, 501–504. [Google Scholar]
  40. Gordon, R.G. Semiclassical theory of spectra and relaxation in molecular gases. J. Chem. Phys. 1966, 45, 1649–1655. [Google Scholar] [CrossRef]
  41. Smith, E.W. Absorption and dispersion in the O2 microwave spectrum at atmospheric pressures. J. Chem. Phys. 1981, 74, 6658–6673. [Google Scholar] [CrossRef] [Green Version]
  42. Van Vleck, J.H.; Weisskopf, V.F. On the shape of collision-broadened lines. Rev. Mod. Phys. 1945, 17, 227–236. [Google Scholar] [CrossRef]
  43. Van Vleck, J.H. The Absorption of Microwaves by Oxygen. Phys. Rev. 1947, 71, 413–424. [Google Scholar] [CrossRef]
  44. Makarov, D.S.; Tretyakov, M.Y.; Rosenkranz, P.W. 60-Ghz oxygen band: Precise experimental profiles and extended absorption modeling in a wide temperature range. J. Quant. Spectrosc. Rad. Transf. 2011, 112, 1420–1428. [Google Scholar] [CrossRef]
  45. Koshelev, M.A.; Vilkov, I.N.; Tretyakov, M.Y. Collisional broadening of oxygen fine structure lines: The impact of temperature. J. Quant. Spectrosc. Rad. Transf. 2016, 169, 91–95. [Google Scholar] [CrossRef]
  46. Makarov, D.S.; Tretyakov, M.Y.; Rosenkranz, P.W. Revision of the 60-GHz atmospheric oxygen absorption band models for practical use. J. Quant. Spectrosc. Rad. Transf. 2020, 243, 106798. [Google Scholar] [CrossRef]
  47. Turner, D.D.; Clough, S.A.; Liljegren, J.C.; Clothiaux, E.E.; Cady-Pereira, K.E.; Gaustad, K.L. Retrieving Liquid Water Path and Precipitable Water Vapor From the Atmospheric Radiation Measurement (ARM) Microwave Radiometers. IEEE Trans. Geosci. Remote Sens. 2007, 45, 3680–3690. [Google Scholar] [CrossRef]
  48. Moors, J.J.A. The meaning of kurtosis: Darlington reexamined. Am. Stat. 1986, 40, 283–284. [Google Scholar] [CrossRef]
  49. Jolliffe, I.T. Principal Component Analysis, 2nd ed.; Springer Series in Statistics; Springer: New York, NY, USA, 2002; p. 497. [Google Scholar]
  50. Meunier, V.; Löhnert, U.; Kollias, P.; Crewell, S. Biases caused by the instrument bandwidth and beam width on simulated brightness temperature measurements from scanning microwave radiometers. Atmos. Meas. Tech. 2013, 6, 1171–1187. [Google Scholar] [CrossRef] [Green Version]
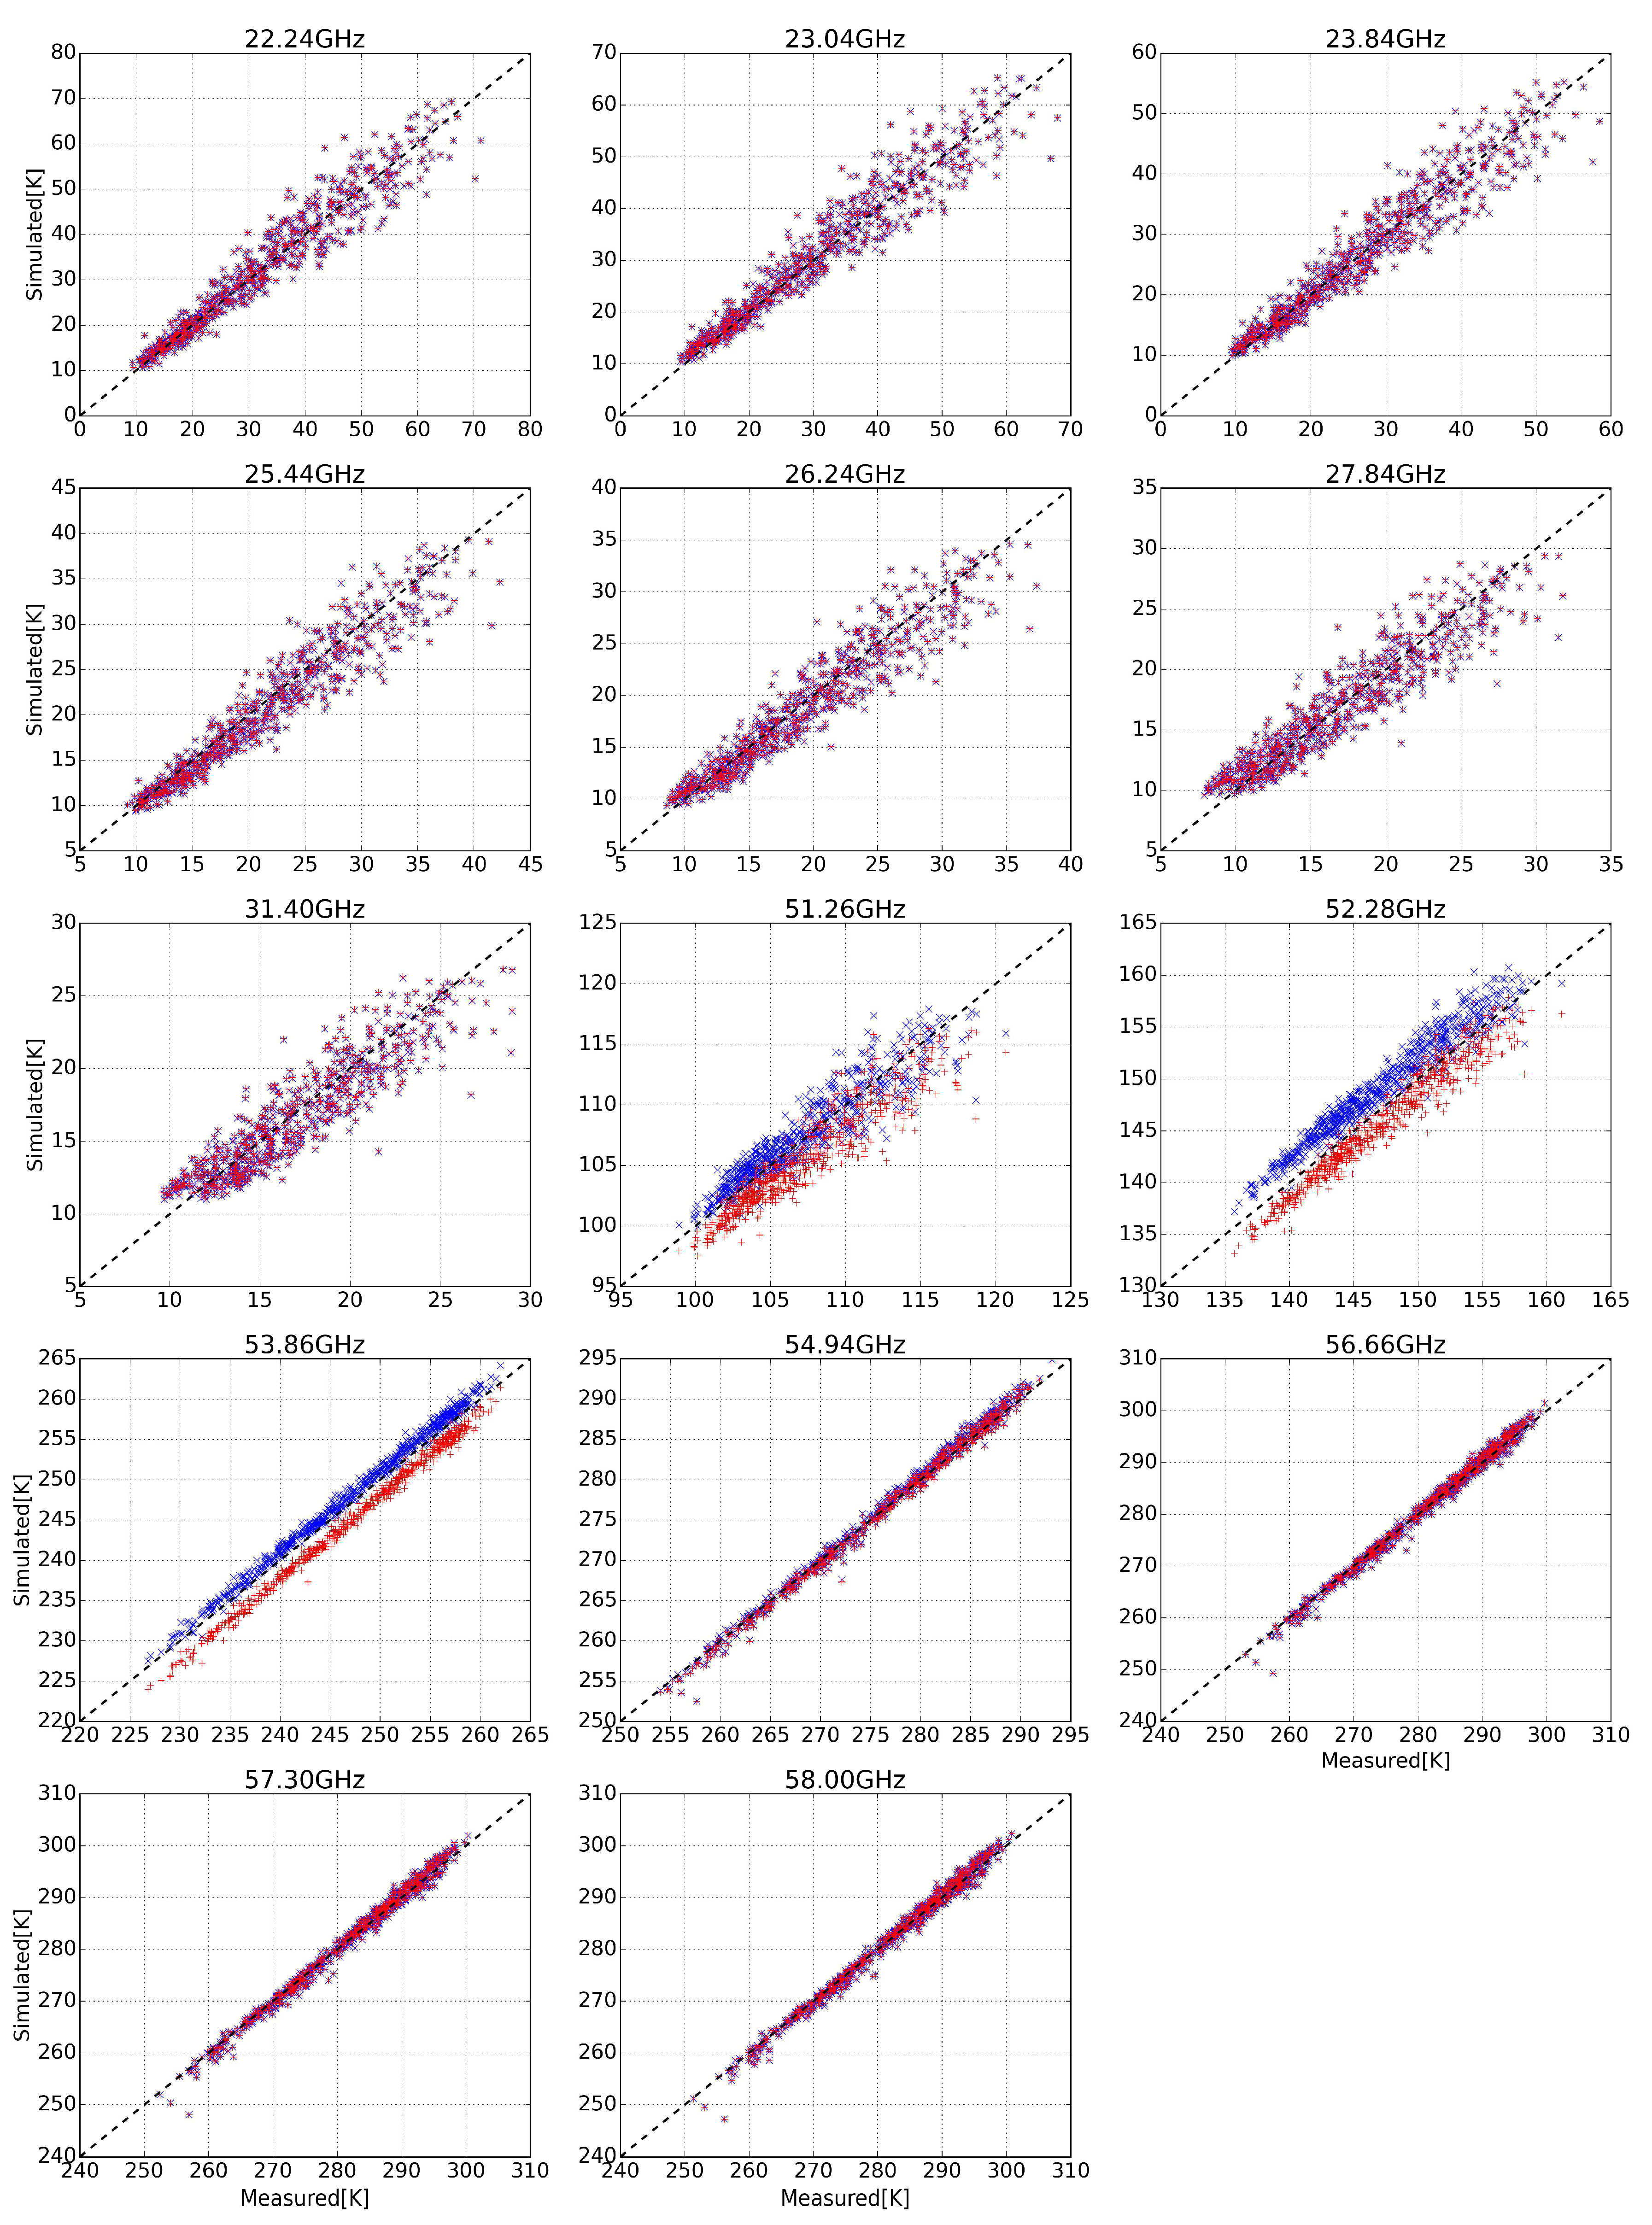
Figure 1. The scatter plot of measured and simulated brightness temperature. Each marker represents one clear sky case. Blue x-markers correspond to MPM1 simulations, while red +-markers depict MPM2a simulations.
Remotesensing 13 02061 g001
Figure 2. The mean difference between measured and simulated brightness temperature in clear sky conditions. The simulations use different absorption models (MPM1, MPM2, MPM2a).
Remotesensing 13 02061 g002
Figure 3. The corresponding standard deviation of the difference between measured and simulated spectra. Standard deviation of measured brightness temperature in clear-sky cases (black squares).
Remotesensing 13 02061 g003
Figure 4. The mean difference between measured and simulated brightness for elevation scanning data (in clear sky conditions). The simulations use different absorption models.
Remotesensing 13 02061 g004
Figure 5. Standard deviation of the difference between measured and simulated spectra for elevation scanning data (in clear sky conditions). The simulations use different absorption models.
Remotesensing 13 02061 g005
Figure 6. Means and standard deviations of estimation (4) for different elevation angles in clear-sky conditions. The estimation made using MPM1 absorption model.
Remotesensing 13 02061 g006
Figure 7. Means and standard deviations of the difference (defined following [50]) between monochromatic and the model taking the bandwidth into consideration for clear-sky conditions. The estimation was made using MPM1 absorption model. The stars depict the placement of HATPRO channels. The star is placed on the curve corresponding to the channel width.
Remotesensing 13 02061 g007
Figure 8. The difference in absorption coefficients between MPM2a and MPM1 models at 1000 mBar. Red dots indicate the frequencies of HATPRO channels.
Remotesensing 13 02061 g008
Figure 9. The altitude that correspond to τ = 3 versus on the frequency and elevation angle. Black dots indicate the frequency of HATPRO channels.
Remotesensing 13 02061 g009
Figure 10. The difference between simulation with cloud and without it. Red circles indicate the frequencies of HATPRO channels.
Remotesensing 13 02061 g010
Table 1. Kurtosis and skewness for the Tb difference at zenith measurements.
Channel (GHz)22.2423.0423.8425.4426.2427.8431.4
Kurtosis0.620.70.590.550.35−0.15−0.41
Skewness−0.15−0.13−0.21−0.15−0.22−0.10.07
Channel (GHz)51.2652.2853.8654.9456.6657.358
Kurtosis0.390.22−0.060.120.230.210.29
Skewness−0.29−0.050.1−0.01−0.17−0.21−0.26
Table 2. Singular values of K in descending order and the corresponding components of MPM1 spectral difference in left-singular vector basis.
Index1234567
Singular values [K/°C]0.430.140.040.014.41 × 10−36.87 × 10−41.6 × 10−4
MPM1 difference in the basis of left-singular vectors [K]0.63−1.21−0.86−0.087−1.610.580.39
Publisher’s Note: MDPI stays neutral with regard to jurisdictional claims in published maps and institutional affiliations.