Technical Note

A Gaussian Mixture Model to Separate Birds and Insects in Single-Polarization Weather Radar Data

Swiss Ornithological Institute, 6204 Sempach, Switzerland
*
Author to whom correspondence should be addressed.
Remote Sens. 2021, 13(10), 1989; https://doi.org/10.3390/rs13101989
Submission received: 10 March 2021 / Revised: 15 May 2021 / Accepted: 17 May 2021 / Published: 19 May 2021
(This article belongs to the Special Issue Monitoring Bird Movements by Remote Sensing)

Abstract

:
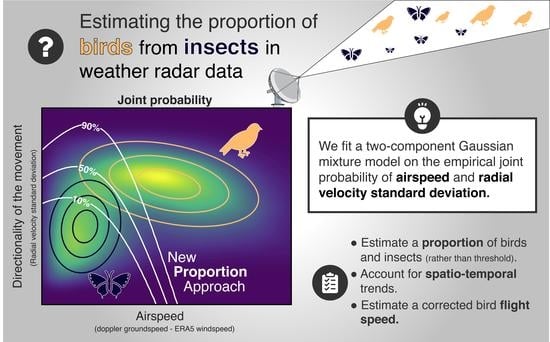
Recent and archived data from weather radar networks are extensively used for the quantification of continent-wide bird migration patterns. While the process of discriminating birds from weather signals is well established, insect contamination is still a problem. We present a simple method combining two Doppler radar products within a Gaussian mixture model to estimate the proportions of birds and insects within a single measurement volume, as well as the density and speed of birds and insects. This method can be applied to any existing archives of vertical bird profiles, such as the European Network for the Radar surveillance of Animal Movement repository, with no need to recalculate the huge amount of original polar volume data, which often are not available.

Graphical Abstract

1. Introduction

Weather radar data are increasingly being used for quantifying the flow of nocturnal bird migration [1,2,3]. In the past, the reflectivity from birds in the air and mean radial velocity has been used to quantify bird biomass [4] before algorithms were developed to extract bird data automatically [5,6,7,8]. These algorithms distinguish between bio-scatterers and precipitation but perform less well in distinguishing between the two main bio-scatterers, birds and insects. To date, these algorithms have mainly been applied to nightly weather radar data during spring and autumn migrations, when birds by far outweigh insects [9,10,11]. Nonetheless, on some nights, large insect masses can also migrate and interfere with, or even mask, bird signals [12,13]. Consequently, classifying and distinguishing insects and birds remains a major challenge [14]. With the progressive replacement of single-polarization weather radar by dual-polarization systems, this classification could be improved considerably [13,15,16]. However, today almost all archived weather radar data consist of single-polarization weather radar data [17,18]. Additionally, the weather radar data publicly available in Europe to ecologists consist only of vertical profiles of bird migration intensities derived from single-polarization weather radar data.
To date, insects are usually filtered using a threshold on the standard deviation of radial velocity and/or an additional threshold on absolute [7,11,19,20,21,22,23,24,25,26]. Here, we combine these features within a Gaussian mixture model to estimate the proportions of birds and insects and their density and speed within a single measurement.

2. Data

2.1. Weather Radar Data

We used the vertical profile time series of reflectivity (cm2/km3), ground speed (m/s), direction (°), and standard deviation of the radial velocity (m/s) generated with the vol2bird software [6,7] from single-polarization polar volumes archived in a publicly accessible repository from the European Network for the Radar surveillance of Animal Movement [18]. We used data from 37 weather radars in France, Germany, the Netherlands, and Belgium operating between 13 February 2018 and 1 January 2019. Each radar provides spatial and temporal data points, with a vertical resolution of 200 m (0–5000 m a.s.l.) and a temporal resolution of 5 min. As we were primarily interested in quantifying nocturnal bird migration, the analysis was limited to night-time, as defined by the local sunrise and sunset at each radar location.

2.2. Data Cleaning

The vertical profiles of reflectivity were manually cleaned using a MATLAB graphical user interface program, which consisted of removing vertical profiles contaminated by precipitation and eliminating altitude bins contaminated by ground scattering (detailed in Appendix A of Nussbaumer et al. [26]). The ground speed values were only kept where reflectivity values were available, thus removing erroneous speeds. While high-reflectivity weather events (i.e., rain) were easily removed during this procedure, slow-moving weather events with low reflectivity (i.e., snow, mist) were difficult to identify visually and therefore were still present at this stage.

2.3. Airspeed

Airspeed was computed by taking the ground speed obtained from weather radar and subtracting the wind speed provided by the ERA5 reanalysis product [27]. The original wind speed data (0.25° × 0.25° × (various pressure level) × 1 h) were linearly interpolated at the location of each data point (radar location, altitude bins of 200 m, 15 min resolution). Pressure levels were converted to altitudes with the standard barometric formula, resulting in a similar resolution of the data points (250 m below 2000 m and 550 m above). The horizontal resolution (0.25° × 0.25° ≈ 18 km × 28 km) of the reanalysis roughly matched the scanning range of the weather radar (25 km). However, the temporal downscaling from 1 h to 15 min can be expected to produce smoother windspeeds. The resulting dataset used in this study consisted of 6.8 million data points.

3. Methodology

The proportion of birds and insects in the sampled volume was estimated by comparing the measured airspeed and standard deviation of the radial velocity to the typical signature produced by birds and insects (Figure 1). This method contrasts with previous approaches that applied fixed thresholds in the standard deviation of the radial velocity (e.g. >2m/s) and/or airspeed (e.g., >5m/s).
First, the typical signature of birds and insects was derived by fitting a two-component Gaussian mixture model to all airspeed and radial velocity standard deviation data points (i.e., one component represents birds and the other insects) (Section 3.1). Realizing that relevant insect-like signals were present during winter, we separated them into either insect- or weather-related signals (e.g., snowfall) based on the timing of their presence (Section 3.2). Then, the fitted model was used to determine the proportion of birds and insects for all data points (Section 3.3). Finally, the bird density (Section 3.4) and the speed of the birds (Section 3.5) were also corrected according to the proportion of birds estimated.

3.1. Model Fitting

The model for estimating the proportion of birds and insects was fitted in two steps.
In the first step, we derived the parameters of the distribution of airspeed and standard deviation of the radial velocity of birds and insects (Figure 1), with a mixture of Gaussian model classification. Assuming that birds and insects fly in a similar manner everywhere, all data points (i.e., all radars, all altitudes, all times) were used to compute the empirical probability density function of airspeed and the standard deviation of radial velocity from the Kernel smoothing function (ksdensity in MATLAB). Then, a two-component Gaussian mixture model was fitted on the empirical probability density function with an expectation-maximization algorithm (fitgmdist on MATLAB). We extracted the location (mean) and shape (covariance) parameters from the two Gaussian components (one for the bird and one for the non-bird).
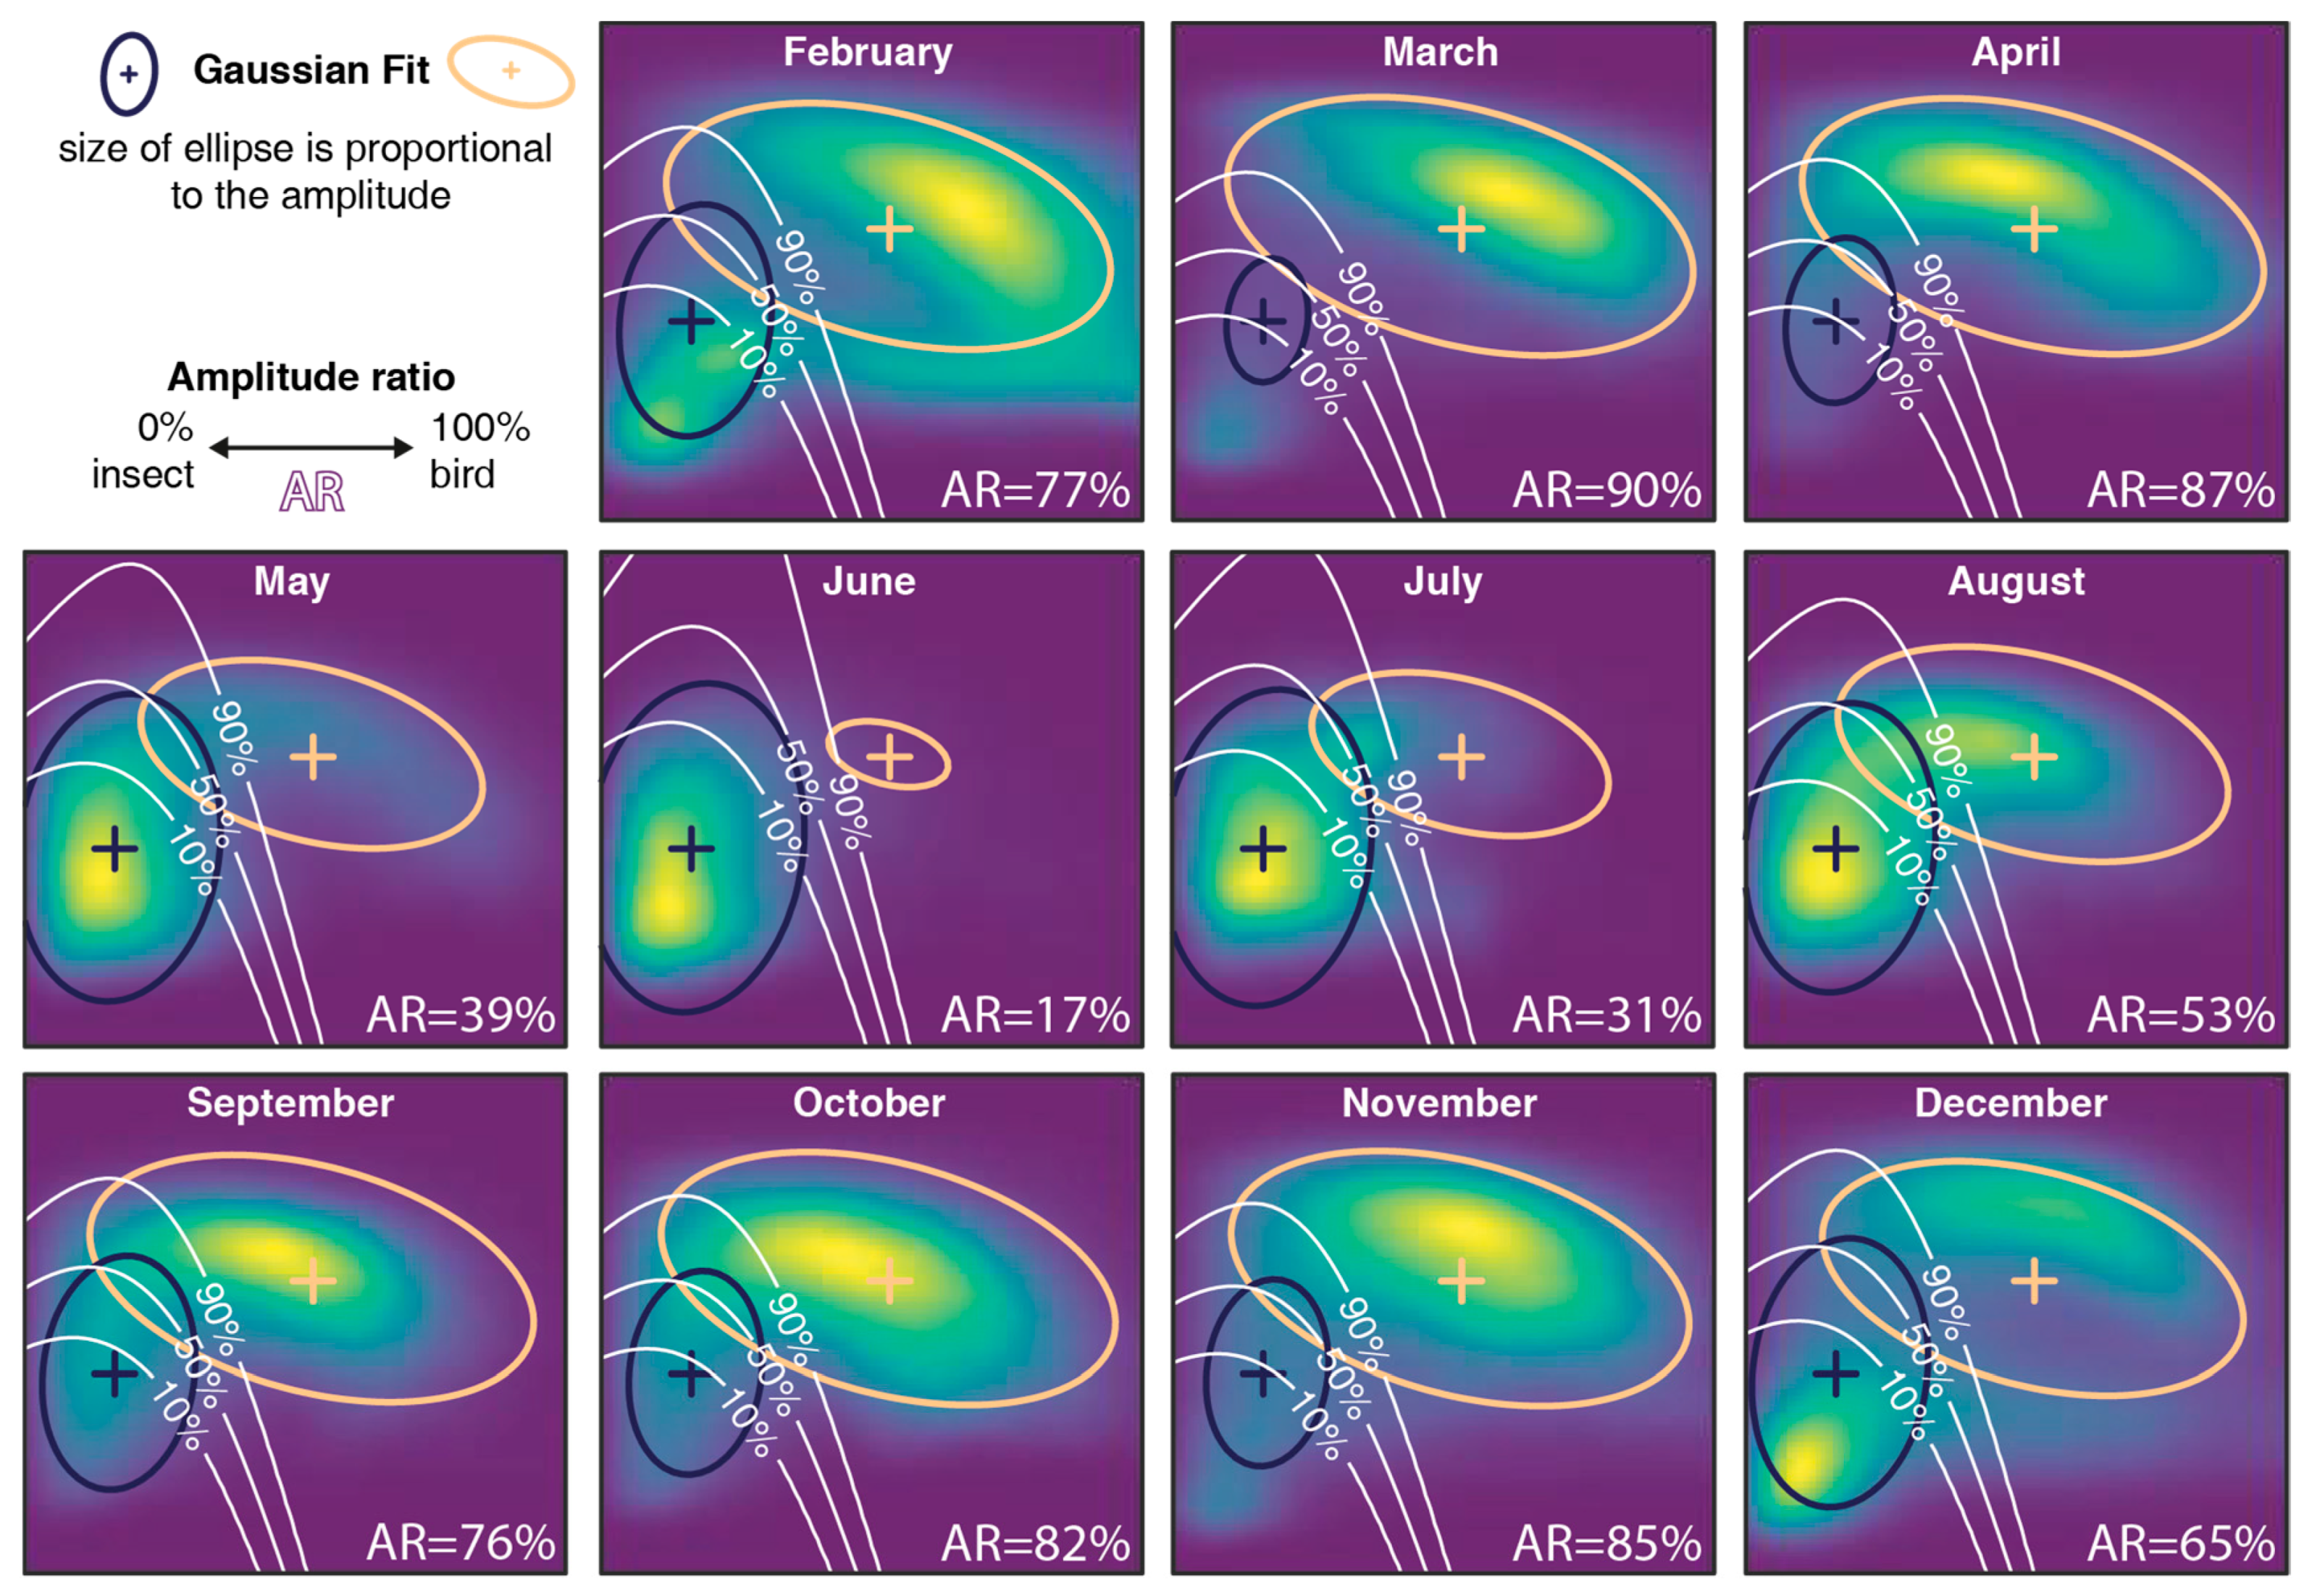
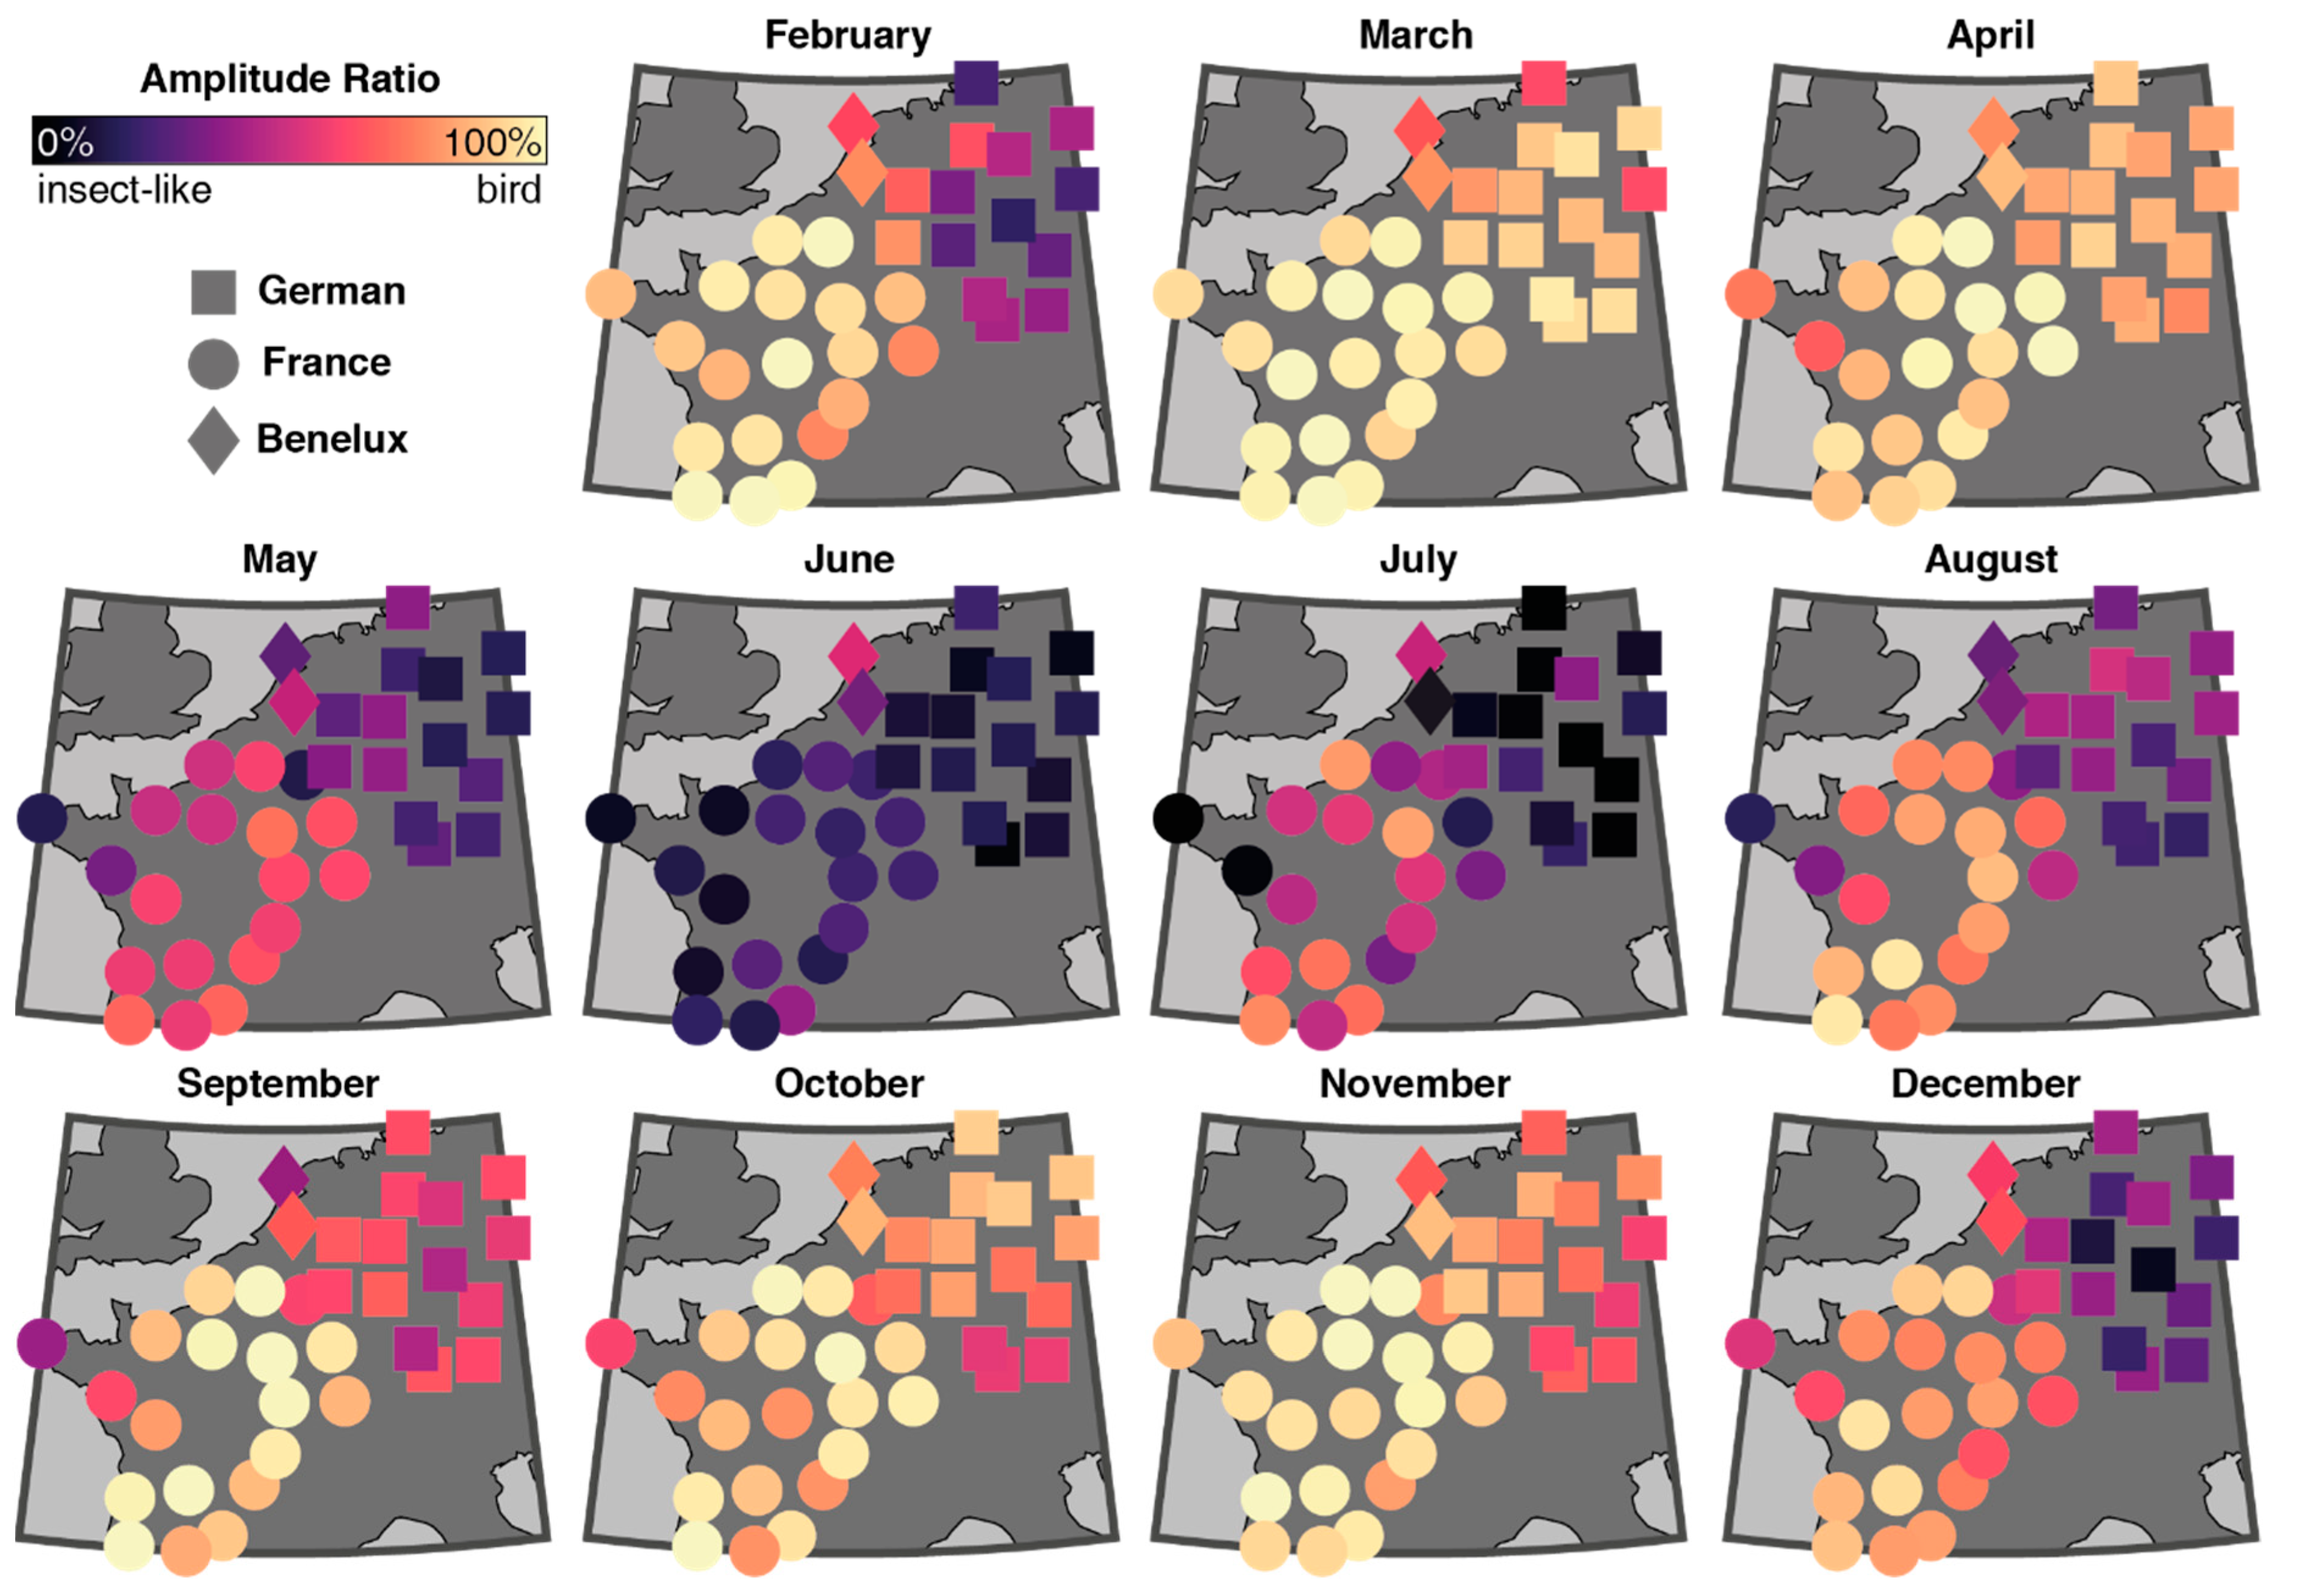
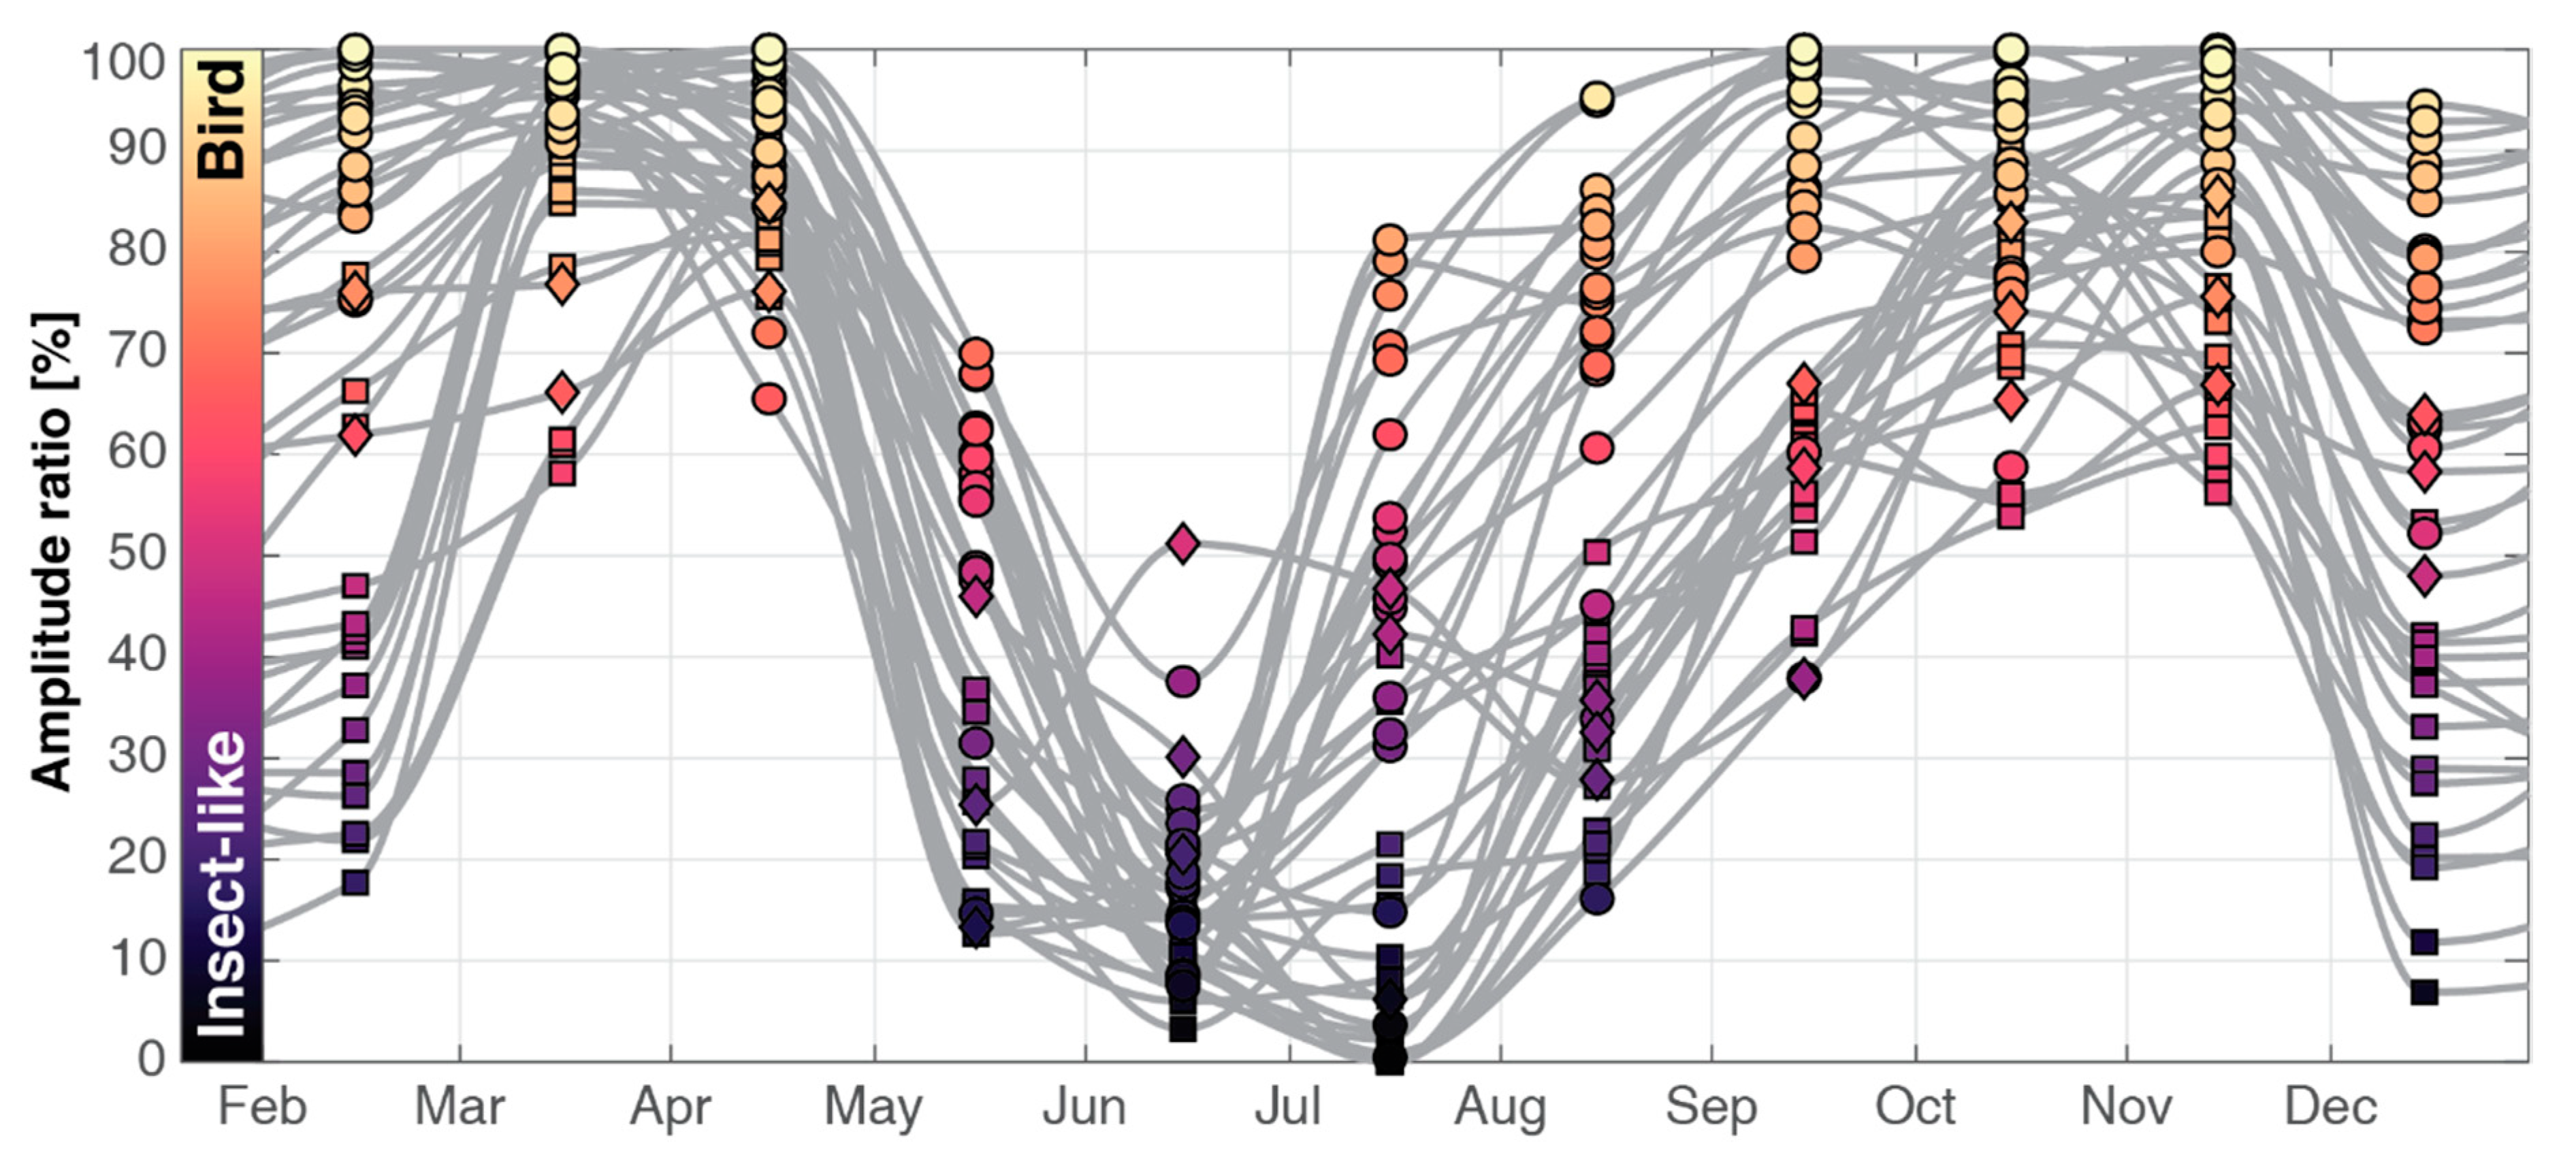
In the second step, we accounted for spatial and temporal variation in the presence of birds and insects (Figure 2 and Figure 3). The empirical probability density function for each month and each radar was built separately (see Supplementary Material Figure S1). The amplitudes of the two Gaussian components were fitted for each empirical probability density function while keeping the location and shape parameters estimated in the first step. Since the empirical probability distribution function is normalized, the sum of the two Gaussian amplitudes is one. Therefore, a single parameter was fitted (the amplitude ratio), which ranges from 0 (only insects) to 1 (only birds) (Figure 3). Finally, to smoothen the transitions from one month to the next, we temporally interpolated the amplitude ratios of each radar with a shape-preserving piecewise cubic interpolation (pchip on MATLAB) (Figure 4).

3.2. Separation of Insects and Weather

While rain is easily recognized due to its high reflectivity signal and therefore correctly removed in the initial cleaning step, slow-moving weather events with low reflectivity, such as snow and mist (low airspeed and low radial velocity standard deviation) are harder to identify and remove from the dataset (see winter insect-like signal from Germany in Figure 2 and Figure 3). Nevertheless, because snow and mist generally occur in winter [28] and insects mainly occur in summer [29], their corresponding signals can be separated based on their temporal occurrence.
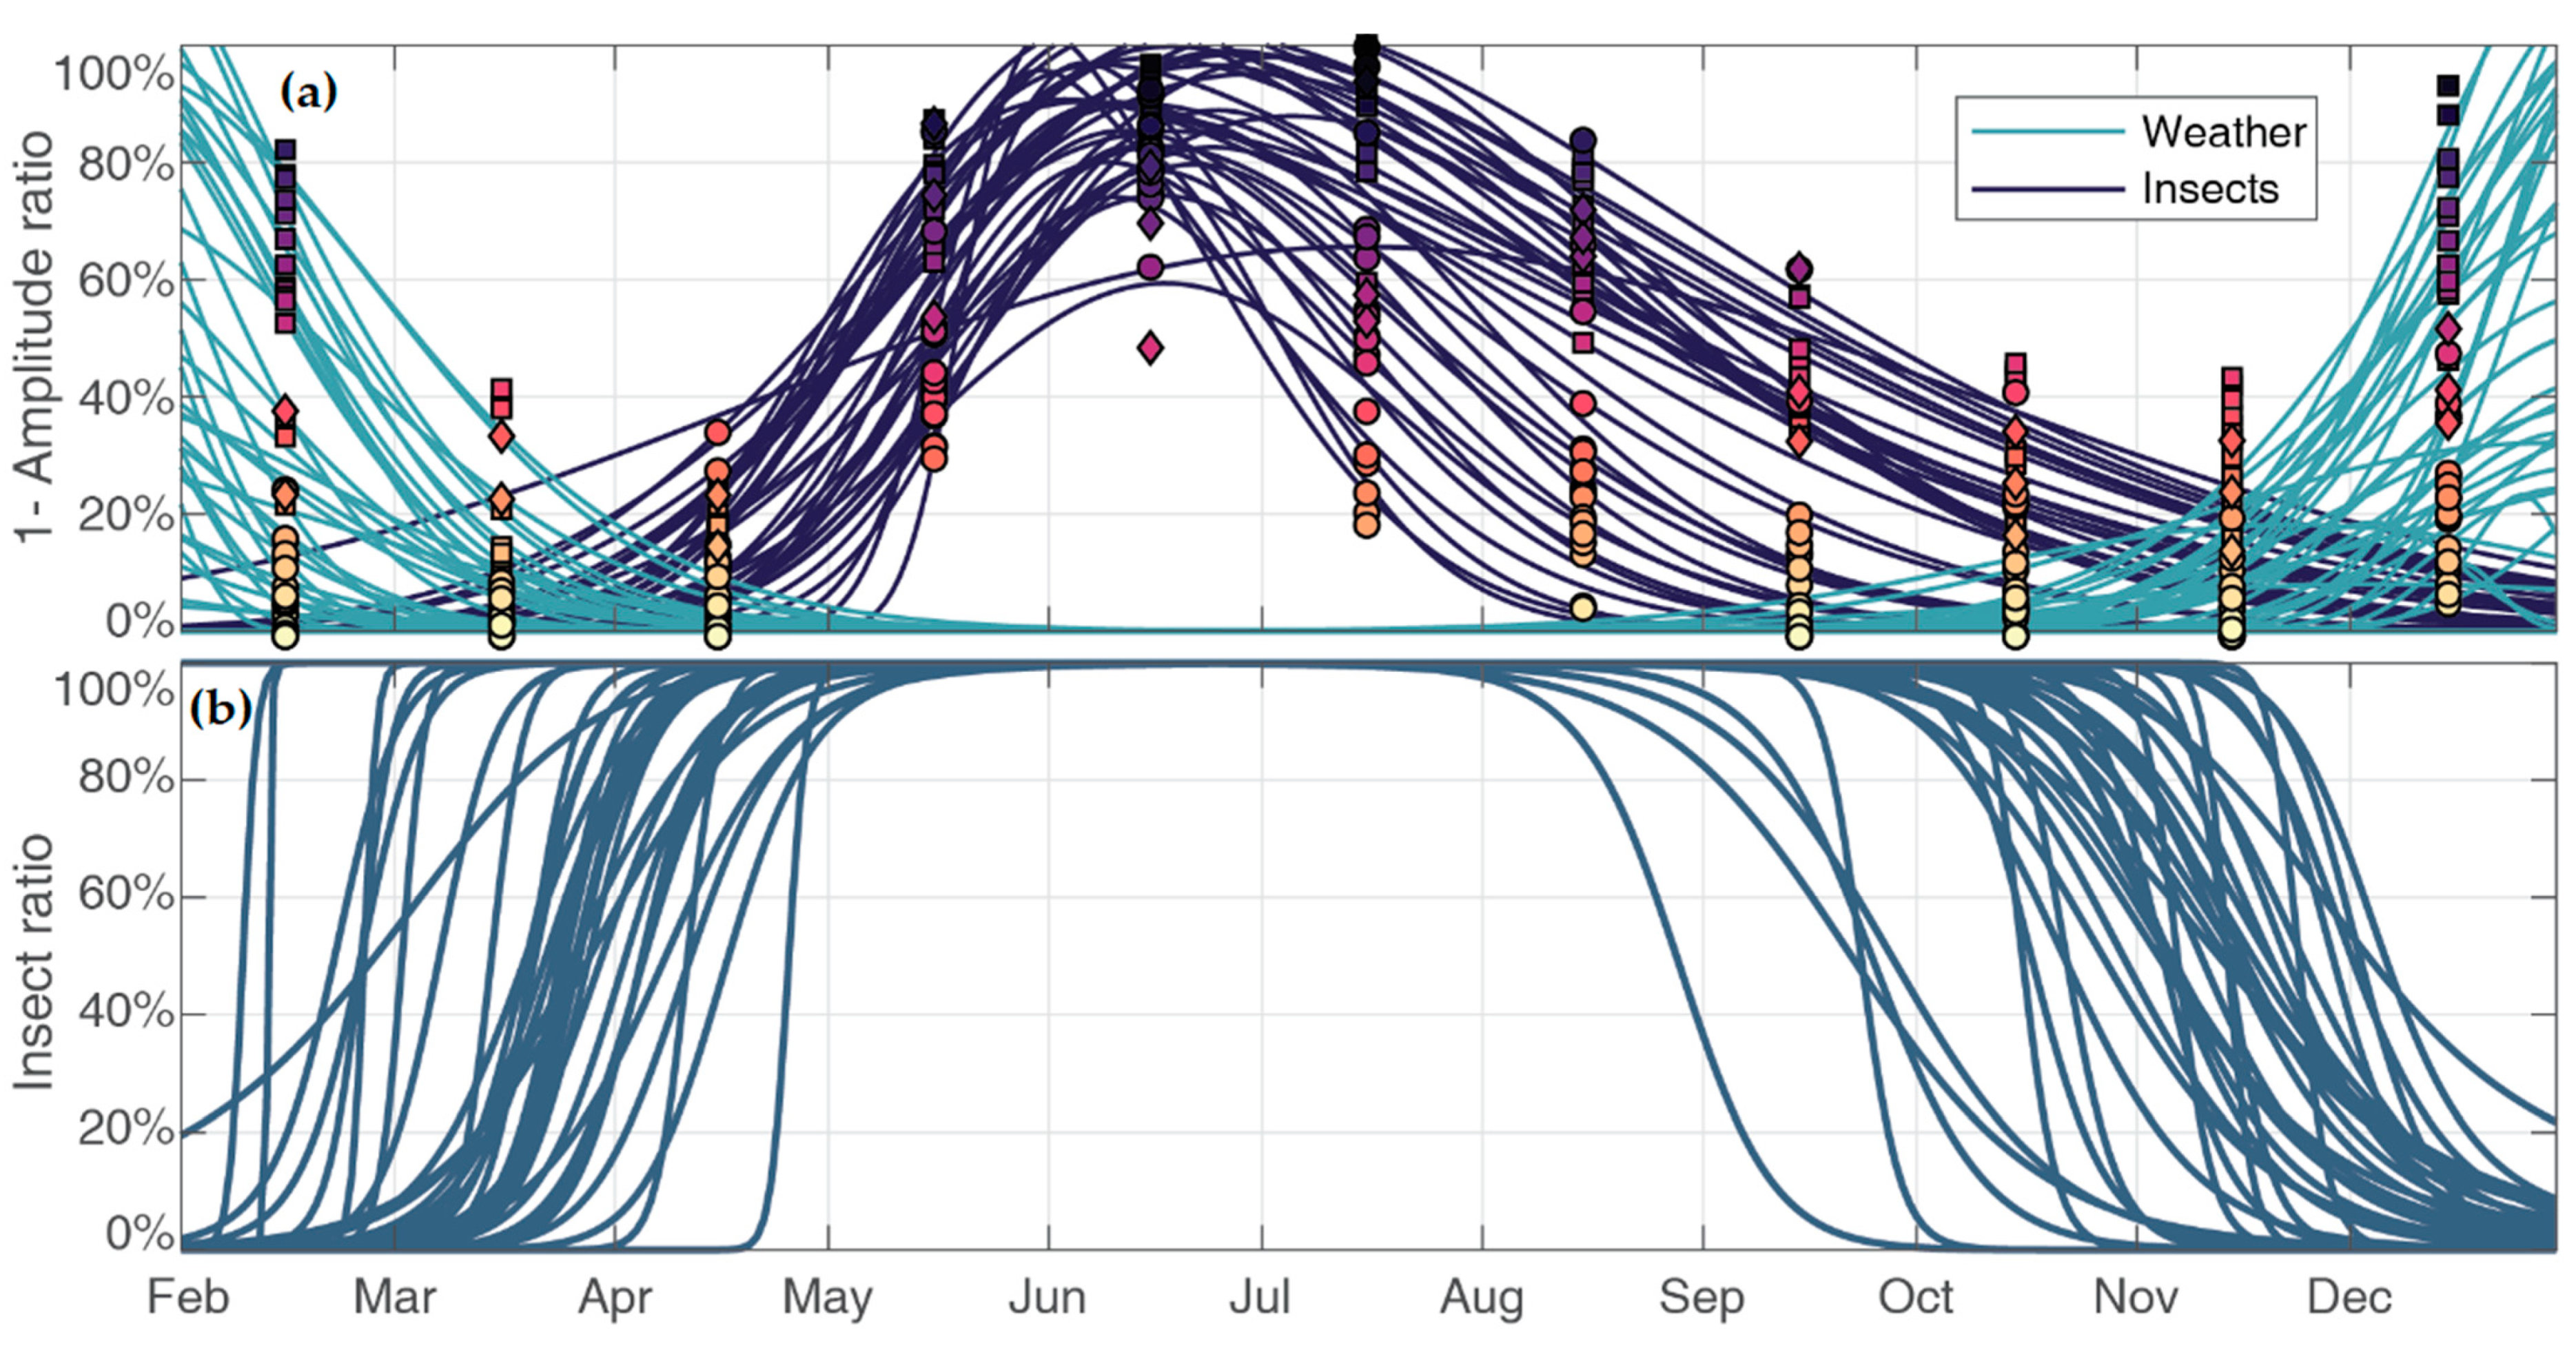
For each radar, the complement of the amplitude ratio (i.e., 1-amplitude ratio) was fitted with the sum of two skewed normal density functions over time, one matching insects (peaking in summer) and the other weather (peaking in winter, Figure 5a). The insect ratio was finally determined as the ratio of the insect normal density function over the sum of the normal density functions (Figure 5b).

3.3. Estimating the Proportion of Birds and Insects

The procedure to estimate the proportion of birds, insects, and remaining weather signal for each data point is as follows. For each data point, the amplitude ratio was computed from the interpolation in Figure 4 based on radar and time of year. Then the two Gaussian distributions were built using both the amplitude ratio and the means and covariances estimated in Figure 1. Next, the probabilities of the bird and non-bird Gaussian probability density functions were determined using the known value of airspeed and radial velocity standard deviation at the data point. Finally, the proportion of birds for that particular data point was estimated by normalizing the probability of birds with the sum of the probabilities of birds and non-birds.
The proportion of insects was determined by multiplying the proportion of non-birds (i.e., 1-proportion of birds) with the insect ratio determined in Figure 5b.

3.4. Bird Density Correction

After quantifying the relative proportion of birds, insects, and weather (in percentage of reflectivity), the bird and insect reflectivity was estimated by multiplying the original values of reflectivity according to their respective proportion. Bird reflectivity was then converted to bird density, assuming a radar cross-section of 11 cm2 [6].

3.5. Ground and Air Speed Correction

We propose here a method to correct the ground speed calculated by vol2bird from the contamination of insect movements according to the proportion of birds estimated in Section 3.3.
This problem was formalized with Bayes’ Theorem, where the prior distributions of bird and insect airspeeds are taken from the Gaussian fits of Figure 1 as a normal distribution,
B ~ N ( μ B , σ B )
and
I ~ N ( μ I , σ I )
The airspeed obtained from the weather radar is considered as a mixture of bird airspeed and insect airspeed, weighted according to the proportion of birds α and insects 1 α , as determined in Section 3.3. Its distribution is therefore also normal, with parameters which can be determined using:
X = α B + ( 1 α ) I ~ N ( μ X , σ X ) ~ N ( α μ B + ( 1 α ) μ I , α 2 σ B 2 + ( 1 a ) 2 σ I 2 ) .
In Bayes’ Theorem framework, the corrected airspeed for birds is the probability of bird airspeed conditional to the measured airspeed, shown as:
P ( B X ) = P ( B ) P ( X B ) P ( X ) f N ( b μ B , σ B ) f N ( x α b + ( 1 α ) μ I , σ I ) ,
where f N is the normal probability distribution function, x is the known measured airspeed, and b is the unknown bird airspeed.
Each airspeed data point was corrected as follows. For each data point, the probability distribution of the birds’ airspeed b , of Equation (4), was built based on the known proportion of birds α and the original airspeed x . The corrected airspeed of birds was then sampled randomly according to the probability density function. Finally, the bird ground speed was determined by re-adding the wind speed to the corrected airspeed. The insect ground speed was computed using the sampled bird airspeed and Equation (3).
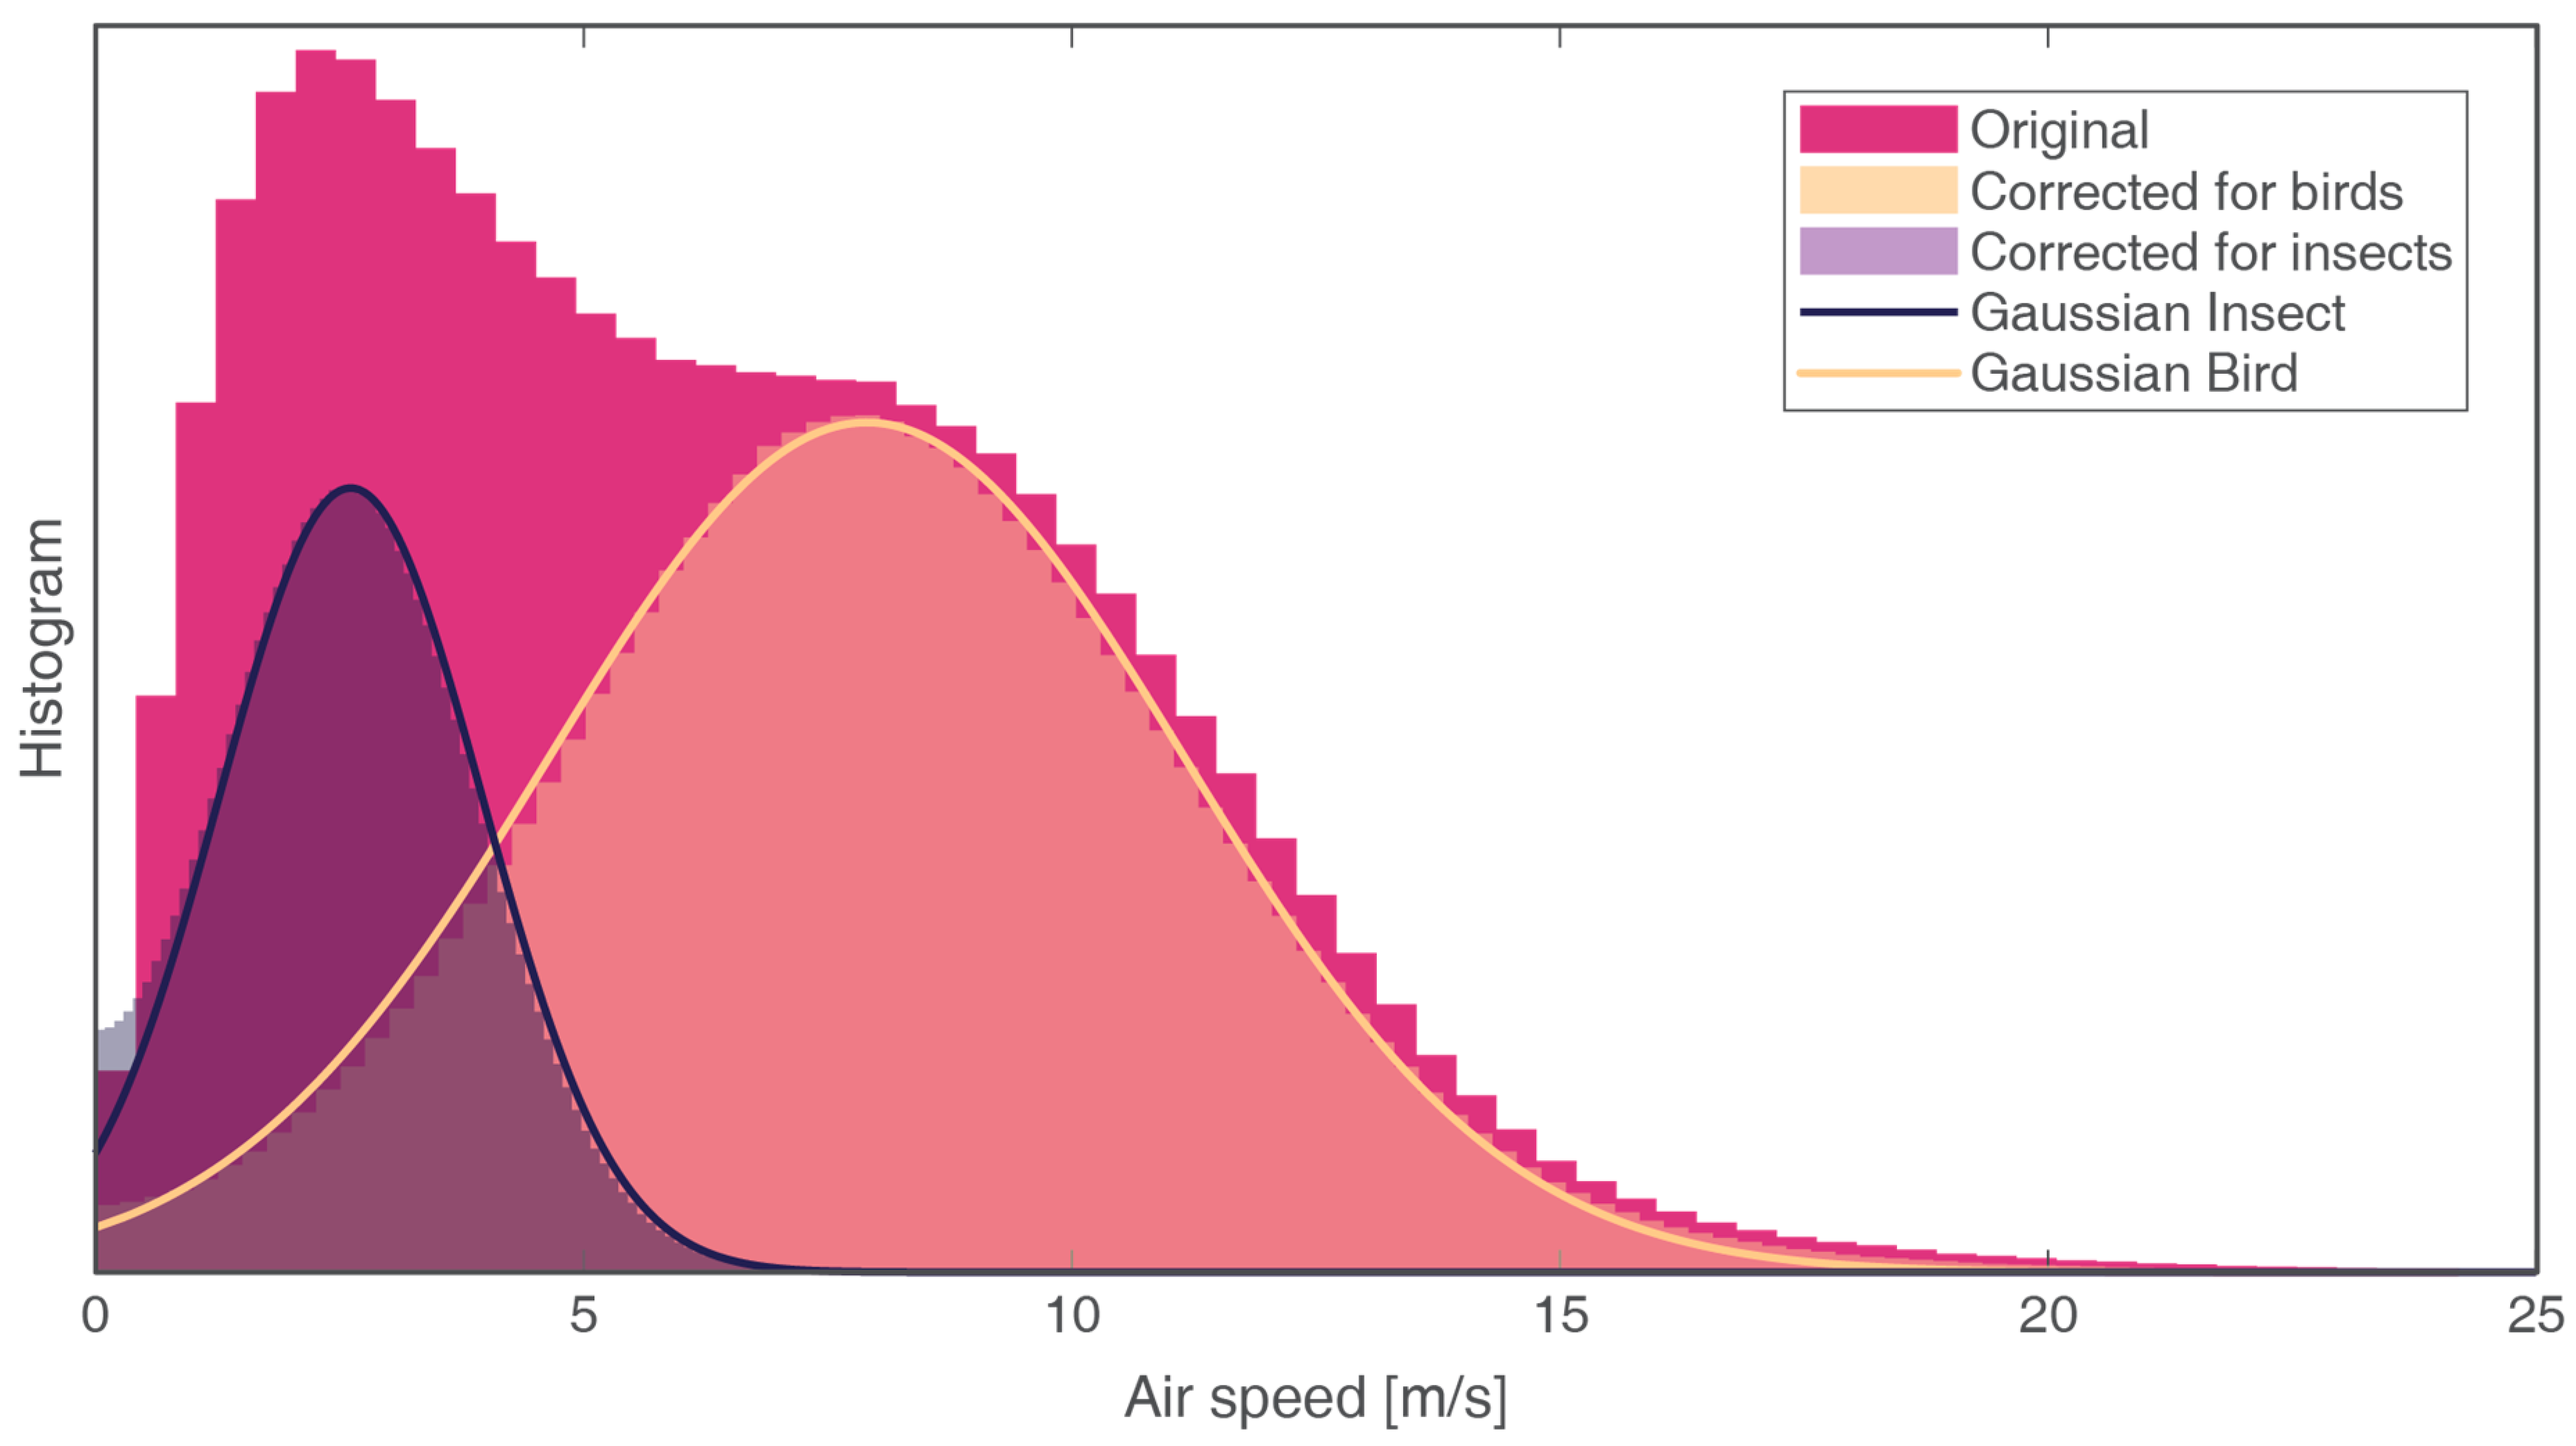
Figure 6 compares the original airspeed data with the corrected airspeeds for insects and birds. The histograms of the corrected airspeed perfectly reproduce the fitted distribution of insect and bird airspeed by construction. Based on the airspeed distribution, a threshold of 4.8 m/s would lead to the best classification of insects and birds. The traditional 5 m/s threshold would misclassify 19% of bird samples and 4% of insect samples.

4. Results

The results of the Gaussian mixture model fit are:
N B = ( [ 8.0 4.1 ] , [ 11.6 1.2 1.2 0.9 ] )
and
N I = ( [ 2.6 2.8 ] , [ 1.8 0.2 0.16 1.1 ] )
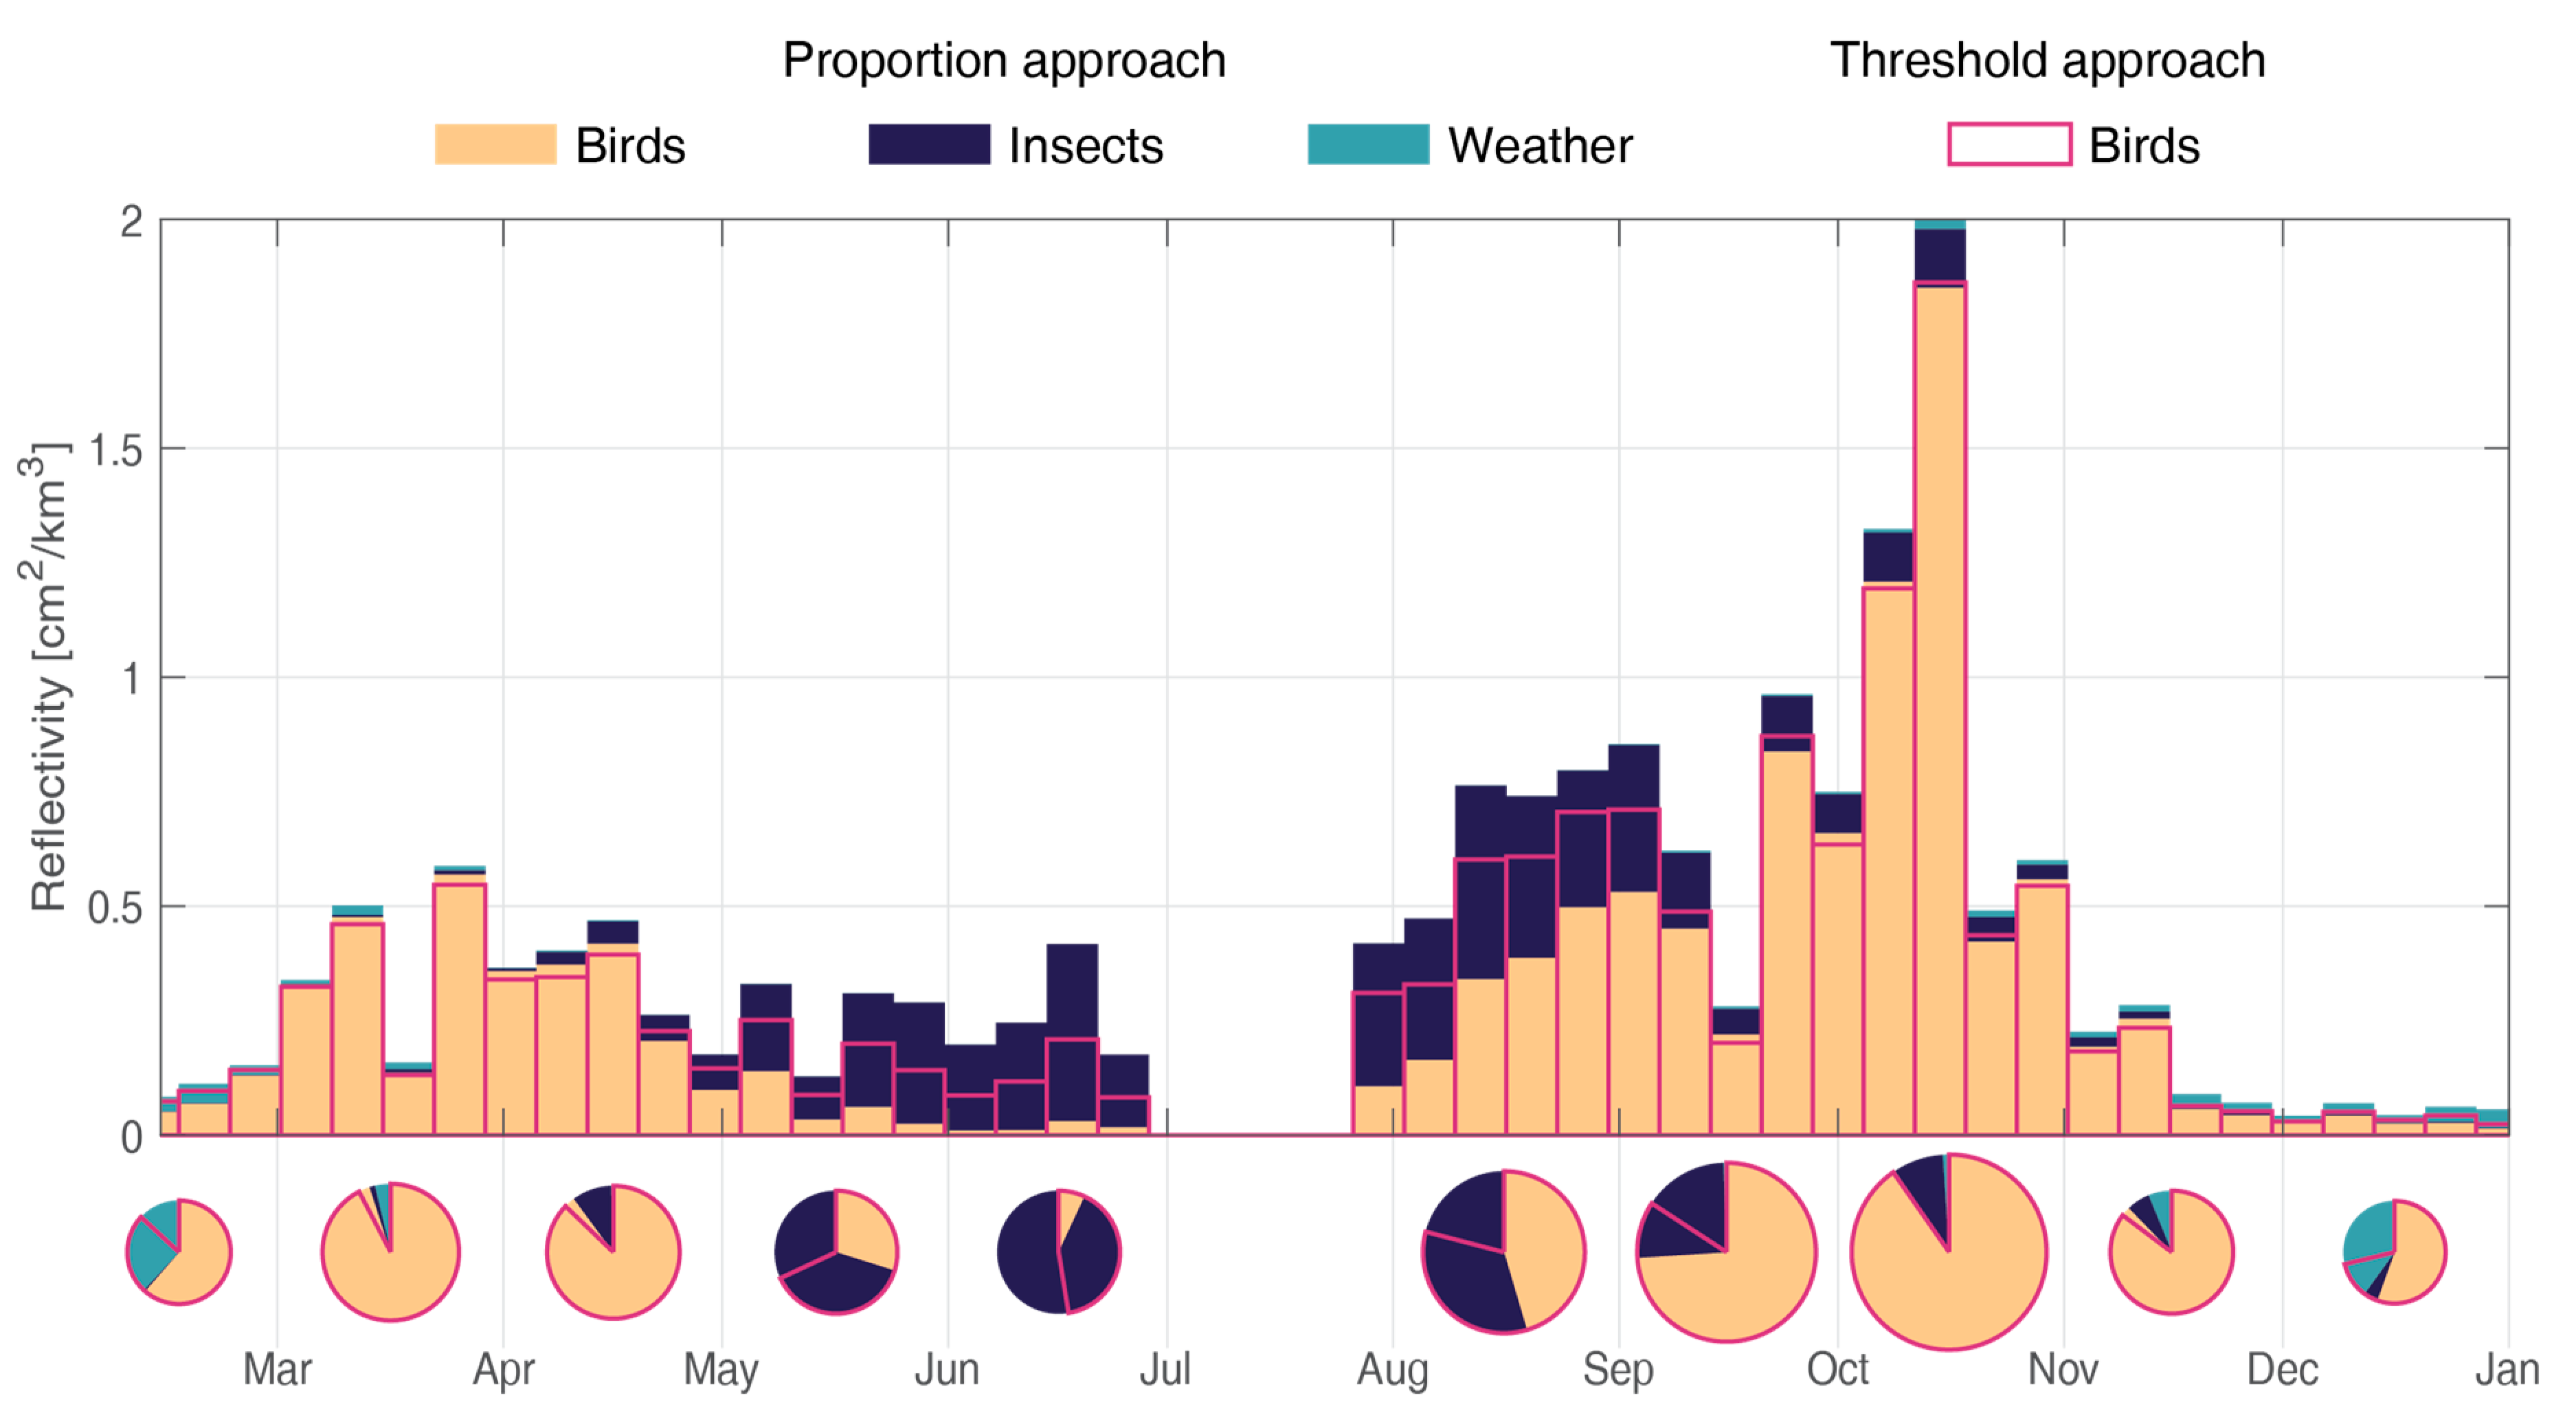
The resulting corrected dataset is available at https://zenodo.org/record/4587338 [30] accessed on 19 May 2021. Figure 7 illustrates the weekly mean reflectivity and reflectivity traffic rate (RTR) averaged over all radars for birds, insects, and weather-related signals. Weather-related signals account for a small yet significant proportion of the reflectivity in the winter months (December–January).In contrast, insects contribute significantly to the reflectivity from May to mid-September, with, e.g., more than 90% of the reflectivity attributed to insects in June alone.
In comparison, the traditional threshold approach eliminates data points with an airspeed smaller than 5 m/s and a radial velocity standard deviation lower than 2 m/s. The bird reflectivity resulting from this threshold approach (black line in Figure 7) is similar to the proportion approach during the bird migration period (March–May, and mid-Sept–mid-Oct), showing that the known threshold from the literature is well calibrated to the airspeed data. Yet, during summer (mid-May to September), the reflectivity derived from the threshold approach is higher than the one derived from the proportion approach (Figure 1). Data points with an airspeed just below 5 m/s but with high radial velocity standard deviation (~5 m/s) are discarded by the threshold method, while the new approach considers it likely that they are birds.
RTR (reflectivity × speed) (see Supplementary Material Figure S2) assesses the biomass movement (i.e., dynamic instead of static). Due to their lower flight speeds, insects have a smaller proportion in RTR than in reflectivity. However, due to the speed correction, the RTR of birds increases slightly compared to the threshold approach when insects are present (e.g., August–September).

5. Discussion

The method presented in this study exhibits several improvements for separating birds and insects in weather radar signals.
Firstly, in contrast to the previous threshold methods, this approach considers the velocities derived from the radial doppler-speeds as an average resulting from the movements of all objects (including birds and insects) within the scanning range of the radar. Consequently, we suggest estimating the proportion of birds rather than whether insects are present or not.
Secondly, this approach takes advantage of combining both the average airspeed and the variation in airspeed within a single data point to improve the differentiation between birds and insects. Indeed, birds flying with a low mean airspeed (e.g., 3–5 m/s) typically have a high standard deviation in radial velocity (see the skewed orientation of the bird Gaussian contours in Figure 1). This deviation is mainly caused by birds flying in different directions, which results in speeds with low average but high variability. Thus, only if we jointly consider both variables can we achieve better separation.
Finally, a major strength of the method is its capacity to account for the spatio-temporal variation in birds, insects, and low-reflectivity weather events. This is particularly useful when accounting for the presence of snow, which mainly occurs in the north (e.g., Germany) during winter (Figure 3). Finally, the method can also estimate the airspeed of birds by accounting for the contribution of insects to the average airspeed.
Our methodology makes some simplifying assumptions.
Firstly, we calculated the location (mean) and shape (covariance) of the empirical probability density function for the entire dataset, assuming that birds and insects fly with the same distribution of airspeed and standard deviation of radial velocity throughout the year. However, birds typically fly slower and with a more uniform radial velocity (i.e., lower standard deviation) in warmer months (e.g., April, September) than in colder months (i.e., early spring and late autumn) (Figure 2). Indeed, these observations are consistent with the fact that smaller birds (e.g., warblers) with slower optimal airspeeds dominate the long-distance migrations, while larger birds (e.g., thrushes) dominate the short-distance migrations [31]. The variable bird airspeed could be accounted for in future refinements of our methodology with a Gaussian mean function over time.
Secondly, airspeed and the standard deviation of radial velocity are assumed to follow a Gaussian distribution. Despite the imperfect match (Figure 1), Gaussian probability density functions were deemed sufficient for the separation here, although other distributions could be used in the future to improve the distribution fit (with caution, given the increased complexity and likely minimal benefit).
Lastly, we did not consider potential changes in the airspeed distribution (and amplitude) with altitude, as the quality of weather radar at low heights is still questionable [32]. Nevertheless, future improvements could incorporate the information of altitude for separation (see Supplementary Material Figure S3).

6. Conclusions

In this study, we presented a novel method to separate birds and insects in weather radar signals based on the differences between birds and insects in airspeed and standard deviation of radial velocity. This method can be applied to existing single-polarization weather radar data [18] without the need to recalculate a huge amount of original polar volume data. Future work could include the validation of this approach using polarimetric data or a tracking radar.

Supplementary Materials

The following are available online at www.mdpi.com/xxx/s1,Figure S1: Figures for each radar of the monthly empirical and fitted joint probability distribution of airspeed and radial velocity standard deviation. Figure S2: Altitudinal empirical and fitted joint probability distribution of airspeed and radial velocity standard deviation. Figure S3: Weekly mean of reflectivity traffic rate attributed to birds, insects, and weather signal averaged over the 37 radars.

Author Contributions

Conceptualization, R.N., F.L. and B.S.; methodology, R.N.; writing—original draft preparation, R.N. and F.L.; writing—review and editing, B.S. and S.B.; supervision, F.L. All authors have read and agreed to the published version of the manuscript.

Funding

We acknowledge the European Operational Program for Exchange of Weather Radar Information (EUMETNET/OPERA) for providing access to European radar data, facilitated through a research-only license agreement between EUMETNET/OPERA members and ENRAM (European Network for Radar surveillance of Animal Movements). This project was funded through the 2017-2018 Belmont Forum and BiodivERsA joint call for research proposals, under the BiodivScen ERA-Net COFUND program, and with the funding organizations Swiss National Science Foundation (SNF 31BD30_184120), Belgian Federal Science Policy Office (BelSPO BR/185/A1/GloBAM-BE), Netherlands Organisation for Scientific Research (NWO E10008), Academy of Finland (aka 326315), and National Science Foundation (NSF 1927743).

Institutional Review Board Statement

Not applicable.

Informed Consent Statement

Not applicable.

Data Availability Statements

The raw data were downloaded from the ENRAM repository https://enram.github.io/data-repository/ (ENRAM 2020). The MATLAB code used is publicly available on Github (https://rafnuss-postdoc.github.io/BMM/2018/LiveScript/Insect_removal.html; accessed on 19 May 2021) (Supplementary Material: Html S1). The processed data resulting from the methodology are available at https://zenodo.org/record/4587338 (Nussbaumer 2020; accessed on 19 May 2021).

Acknowledgments

We thanks Mathieu Gravey, Lionel Benoit, and Grégoire Mariéthoz for useful discussions on the methodology and help with the numerical implementation.

Conflicts of Interest

The authors declare no conflict of interest.

References

  1. Gauthreaux, S.A. Weather Radar Quantification of Bird Migration. BioScience 1970, 20, 17–20. [Google Scholar] [CrossRef]
  2. Chilson, P.B.; Stepanian, P.M.; Kelly, J.F. Radar aeroecology. In Aeroecology; Springer International Publishing: Cham, Switzerland, 2017; pp. 277–309. [Google Scholar]
  3. Jacobsen, E.; Lakshmanan, V. Inferring the state of the aerosphere from weather radar. In Aeroecology; Springer International Publishing: Cham, Switzerland, 2017; pp. 311–343. [Google Scholar]
  4. Gauthreaux, S.A.; Belser, C.G. Displays of Bird Movements on the WSR-88D: Patterns and Quantification. Weather Forecast. 1998, 13, 453–464. [Google Scholar] [CrossRef]
  5. Sheldon, D.; Winner, J.K.; Bhambhani, P.; Bernstein, G. Darkecology/Wsrlib: Version 0.2.0. 2019. Available online: https://zenodo.org/record/3352264 (accessed on 19 May 2021).
  6. Dokter, A.M.; Liechti, F.; Stark, H.; Delobbe, L.; Tabary, P.; Holleman, I. Bird Migration Flight Altitudes Studied by a Network of Operational Weather Radars. J. R. Soc. Interface 2010, 8, 30–43. [Google Scholar] [CrossRef] [PubMed] [Green Version]
  7. Dokter, A.M.; Desmet, P.; Spaaks, J.H.; Van Hoey, S.; Veen, L.; Verlinden, L.; Nilsson, C.; Haase, G.; Leijnse, H.; Farnsworth, A.; et al. BioRad: Biological Analysis and Visualization of Weather Radar Data. Ecography 2019, 42, 852–860. [Google Scholar] [CrossRef] [Green Version]
  8. Lin, T.-Y.; Winner, K.; Bernstein, G.; Mittal, A.; Dokter, A.M.; Horton, K.G.; Nilsson, C.; van Doren, B.M.; Farnsworth, A.; La Sorte, F.A.; et al. MistNet: Measuring Historical Bird Migration in the US Using Archived Weather Radar Data and Convolutional Neural Networks. Methods Ecol. Evol. 2019, 10, 1908–1922. [Google Scholar] [CrossRef]
  9. Van Doren, B.M.; Horton, K.G. A Continental System for Forecasting Bird Migration. Science 2018, 361, 1115–1118. [Google Scholar] [CrossRef]
  10. Dokter, A.M.; Farnsworth, A.; Fink, D.; Ruiz-Gutierrez, V.; Hochachka, W.M.; La Sorte, F.A.; Robinson, O.J.; Rosenberg, K.V.; Kelling, S. Seasonal Abundance and Survival of North America’s Migratory Avifauna Determined by Weather Radar. Nat. Ecol. Evol. 2018, 2, 1603–1609. [Google Scholar] [CrossRef]
  11. Nilsson, C.; Dokter, A.M.; Verlinden, L.; Shamoun-Baranes, J.; Schmid, B.; Desmet, P.; Bauer, S.; Chapman, J.; Alves, J.A.; Stepanian, P.M.; et al. Revealing Patterns of Nocturnal Migration Using the European Weather Radar Network. Ecography 2019, 42, 876–886. [Google Scholar] [CrossRef] [Green Version]
  12. Westbrook, J.; Eyster, R. Doppler Weather Radar Detects Emigratory Flights of Noctuids during a Major Pest Outbreak. Remote Sens. Appl. Soc. Environ. 2017, 8, 64–70. [Google Scholar] [CrossRef]
  13. Leskinen, M.; Markkula, I.; Koistinen, J.; Pylkkö, P.; Ooperi, S.; Siljamo, P.; Ojanen, H.; Raiskio, S.; Tiilikkala, K. Pest Insect Immigration Warning by an Atmospheric Dispersion Model, Weather Radars and Traps. J. Appl. Entomol. 2011, 135, 55–67. [Google Scholar] [CrossRef] [Green Version]
  14. Bauer, S.; Chapman, J.W.; Reynolds, D.R.; Alves, J.A.; Dokter, A.M.; Menz, M.M.H.; Sapir, N.; Ciach, M.; Pettersson, L.B.; Kelly, J.F.; et al. From Agricultural Benefits to Aviation Safety: Realizing the Potential of Continent-Wide Radar Networks. BioScience 2017, 67, 912–918. [Google Scholar] [CrossRef]
  15. Bachmann, S.; Zrnic, D. Spectral Polarimetry for Identifying and Separating Mixed Biological Scatterers. In Proceedings of the 11th Conference on Mesoscale Processes and the 32nd Conference on Radar Meteorology, Albuquerque, NM, USA, 24–29 October 2005; pp. 295–300. [Google Scholar]
  16. Stepanian, P.M.; Horton, K.G.; Melnikov, V.M.; Zrnić, D.S.; Gauthreaux, S.A. Dual-Polarization Radar Products for Biological Applications. Ecosphere 2016, 7, e01539. [Google Scholar] [CrossRef]
  17. Istok, M.J.; Fresch, M.; Jing, Z.; Smith, S.; Murnan, R.; Ryzhkov, A.; Krause, J.; Jain, M.; Schlatter, P.; Ferree, J.; et al. WSR-88D Dual Polarization Initial Operational Capabilities. In Proceedings of the 25th Conference on Interactive Information and Processing Systems for Meteorology Oceanography, and Hydrology, Phoenix, AZ, USA, 11–15 January 2009. [Google Scholar]
  18. European Network for the Radar Surveillance of Animal Movement (ENRAM). ENRAM Data Repository for Vertical Profiles of Birds. 2020. Available online: https://enram.github.io/data-repository/ (accessed on 23 April 2019).
  19. La Sorte, F.A.; Hochachka, W.M.; Farnsworth, A.; Sheldon, D.; van Doren, B.M.; Fink, D.; Kelling, S. Seasonal Changes in the Altitudinal Distribution of Nocturnally Migrating Birds during Autumn Migration. R. Soc. Open Sci. 2015, 2, 150347. [Google Scholar] [CrossRef] [PubMed] [Green Version]
  20. Horton, K.G.; Shriver, W.G.; Buler, J.J. A Comparison of Traffic Estimates of Nocturnal Flying Animals Using Radar, Thermal Imaging, and Acoustic Recording. Ecol. Appl. 2015, 25, 390–401. [Google Scholar] [CrossRef] [PubMed]
  21. Farnsworth, A.; van Doren, B.M.; Hochachka, W.M.; Sheldon, D.; Winner, K.; Irvine, J.; Geevarghese, J.; Kelling, A.S. A Characterization of Autumn Nocturnal Migration Detected by Weather Surveillance Radars in the Northeastern USA. Ecol. Appl. 2016, 26, 752–770. [Google Scholar] [CrossRef] [PubMed]
  22. Cohen, E.B.; Horton, K.G.; Marra, P.P.; Clipp, H.L.; Farnsworth, A.; Smolinsky, J.A.; Sheldon, D.; Buler, J.J. A Place to Land: Spatiotemporal Drivers of Stopover Habitat Use by Migrating Birds. Ecol. Lett. 2020, 24, 38–49. [Google Scholar] [CrossRef]
  23. Horton, K.G.; Van Doren, B.M.; Stepanian, P.M.; Farnsworth, A.; Kelly, J.F. Seasonal Differences in Landbird Migration Strategies. Auk 2016, 133, 761–769. [Google Scholar] [CrossRef]
  24. Horton, K.G.; Nilsson, C.; Van Doren, B.M.; La Sorte, F.A.; Dokter, A.M.; Farnsworth, A. Bright Lights in the Big Cities: Migratory Birds’ Exposure to Artificial Light. Front. Ecol. Environ. 2019, 17, 209–214. [Google Scholar] [CrossRef]
  25. Horton, K.G.; La Sorte, F.A.; Sheldon, D.; Lin, T.-Y.; Winner, K.; Bernstein, G.; Maji, S.; Hochachka, W.M.; Farnsworth, A. Phenology of Nocturnal Avian Migration Has Shifted at the Continental Scale. Nat. Clim. Chang. 2020, 10, 63–68. [Google Scholar] [CrossRef]
  26. Nussbaumer, R.; Benoit, L.; Mariethoz, G.; Liechti, F.; Bauer, S.; Schmid, B. A Geostatistical Approach to Estimate High Resolution Nocturnal Bird Migration Densities from a Weather Radar Network. Remote Sens. 2019, 11, 2233. [Google Scholar] [CrossRef] [Green Version]
  27. Hersbach, H.; Bell, B.; Berrisford, P.; Biavati, G.; Horányi, A.; Sabater, J.M.; Nicolas, J.; Peubey, C.; Radu, R.; Rozum, I.; et al. ERA5 Hourly Data on Pressure Levels from 1979 to Present. Copernicus Climate Change Service (C3S) Climate Data Store (CDS). 2018. Available online: https://cds.climate.copernicus.eu/cdsapp#!/dataset/reanalysis-era5-single-levels?tab=overview (accessed on 11 September 2020).
  28. Hůnová, I.; Brabec, M.; Malý, M.; Valeriánová, A. Long-Term Trends in Fog Occurrence in the Czech Republic, Central Europe. Sci. Total Environ. 2020, 711, 135018. [Google Scholar] [CrossRef] [PubMed]
  29. Wolda, H. Insect Seasonality: Why? Annu. Rev. Ecol. Syst. 1988, 19, 1–18. [Google Scholar] [CrossRef]
  30. Nussbaumer, R. Vertical Profiles Time Series of Bird Density and Flight Speed Vector (01.01.2018–01.01.2019). 2020. Available online: https://zenodo.org/record/4587338 (accessed on 1 October 2020).
  31. Bruderer, B.; Boldt, A. Flight Characteristics of Birds: I. Radar Measurements of Speeds. Ibis 2001, 143, 178–204. [Google Scholar] [CrossRef]
  32. Nilsson, C.; Dokter, A.M.; Schmid, B.; Scacco, M.; Verlinden, L.; Bäckman, J.; Haase, G.; Dell’Omo, G.; Chapman, J.W.; Leijnse, H.; et al. Field Validation of Radar Systems for Monitoring Bird Migration. J. Appl. Ecol. 2018, 55, 1–13. [Google Scholar] [CrossRef]
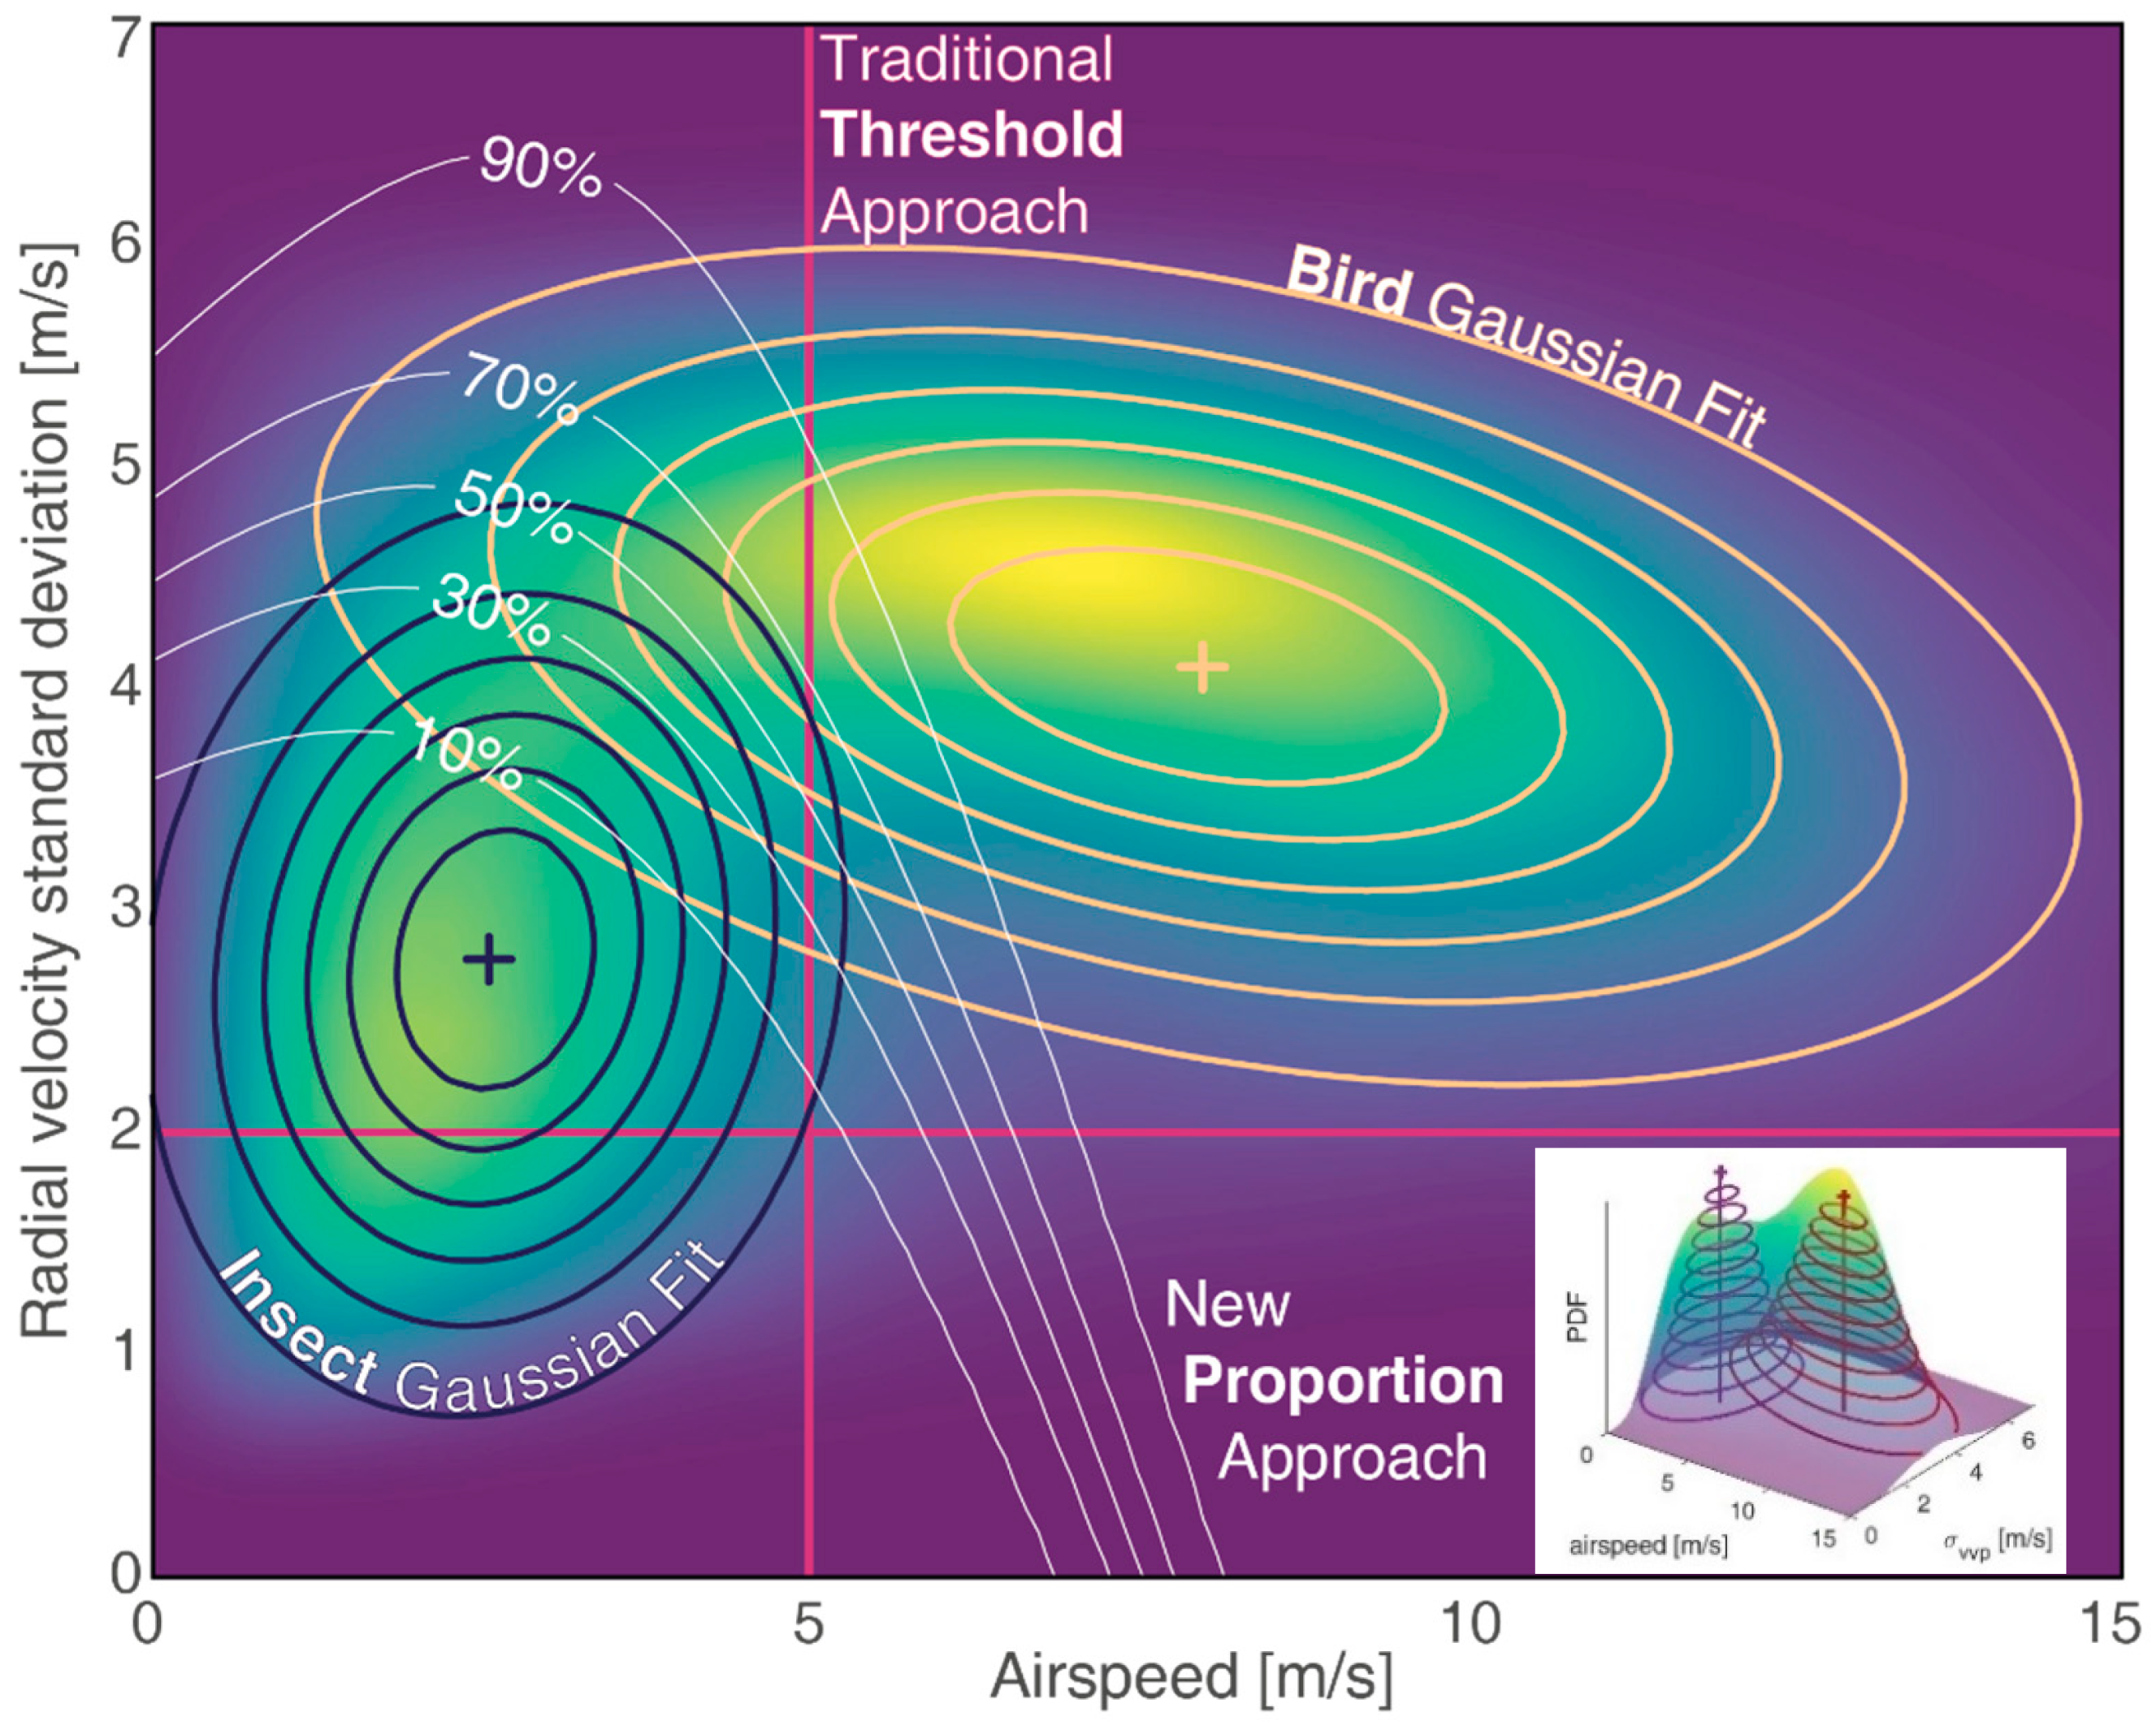
Figure 1. Joint probability distribution of airspeed and radial velocity standard deviation. The empirical probability density function (surface in color scale) shows two peaks: the one on the top-right, corresponds to birds and the one on the bottom-left corresponds to insects. The two Gaussian distributions fitted to the data are shown in contour lines (red and purple).
Remotesensing 13 01989 g001
Figure 2. Monthly joint probability density function of airspeed and radial velocity standard deviation for the empirical (color-scaled surface) and fitted Gaussian distributions of birds (red lines) and insects (purple lines). The white contour line depicts the mapping of the proportion of birds and insects resulting from the fitted model. The x- and y-axis unit and range are the same as those in Figure 1, but the color-scale is normalized each month.
Remotesensing 13 01989 g002
Figure 3. Amplitude ratio fitted for each radar and each month. In addition to the main seasonal trend (already visible in Figure 2), a smaller effect appears mainly during winter in the northern radars (mainly, but not only German), where slow-moving weather events (e.g., snow or mist) are picked up as insects by the radars.
Remotesensing 13 01989 g003
Figure 4. Seasonal variation in amplitude ratio for each radar. The monthly amplitude ratios of each radar (circle for France, square for German, and diamond for Benelux) were temporally interpolated (grey lines).
Remotesensing 13 01989 g004
Figure 5. The insect-like signal (i.e., 1-amplitude ratio) is separated into insect and weather. (a) The sum of two skew-normal density functions representing insects (black) and weather (grey) is fitted for each radar (circle for France, square for German, and diamond for Benelux). (b) The proportion of insects in the original insect-like signal is estimated from the fitted density distribution functions of Figure 5a.
Remotesensing 13 01989 g005
Figure 6. Histogram of airspeed for all data points before correction (yellow), corrected for insect (purple), and corrected for bird (red). The Gaussian fit of birds and non-birds from Figure 1 is shown as a line. The histogram before correction shows two modes corresponding to insects and birds. After correction, the airspeed of birds and insects reproduces the Gaussian fit.
Remotesensing 13 01989 g006
Figure 7. Weekly mean of reflectivity attributed to birds, insects, and weather signals averaged over the 37 radars. The traditional threshold method (‘bird threshold’) is shown as a black line for comparison. The pie charts illustrate the monthly distribution of reflectivity.
Remotesensing 13 01989 g007
Publisher’s Note: MDPI stays neutral with regard to jurisdictional claims in published maps and institutional affiliations.