Article

Reconstruction of Complex Roof Semantic Structures from 3D Point Clouds Using Local Convexity and Consistency

1
School of Geomatics and Urban Spatial Informatics, Beijing University of Civil Engineering and Architecture, Beijing 100044, China
2
Beijing Key Laboratory for Architectural Heritage Fine Reconstruction & Health Monitoring, Beijing University of Civil Engineering and Architecture, Beijing 102616, China
*
Author to whom correspondence should be addressed.
Remote Sens. 2021, 13(10), 1946; https://doi.org/10.3390/rs13101946
Submission received: 20 March 2021 / Revised: 8 May 2021 / Accepted: 10 May 2021 / Published: 17 May 2021
(This article belongs to the Special Issue Techniques and Applications of UAV-Based Photogrammetric 3D Mapping)

Abstract

:
Three-dimensional (3D) building models are closely related to human activities in urban environments. Due to the variations in building styles and complexity in roof structures, automatically reconstructing 3D buildings with semantics and topology information still faces big challenges. In this paper, we present an automated modeling approach that can semantically decompose and reconstruct the complex building light detection and ranging (LiDAR) point clouds into simple parametric structures, and each generated structure is an unambiguous roof semantic unit without overlapping planar primitive. The proposed method starts by extracting roof planes using a multi-label energy minimization solution, followed by constructing a roof connection graph associated with proximity, similarity, and consistency attributes. Furthermore, a progressive decomposition and reconstruction algorithm is introduced to generate explicit semantic subparts and hierarchical representation of an isolated building. The proposed approach is performed on two various datasets and compared with the state-of-the-art reconstruction techniques. The experimental modeling results, including the assessment using the International Society for Photogrammetry and Remote Sensing (ISPRS) benchmark LiDAR datasets, demonstrate that the proposed modeling method can efficiently decompose complex building models into interpretable semantic structures.

Graphical Abstract

1. Introduction

Buildings are the most prominent features in an urban environment. Due to its vast application demands, such as solar radiation estimation [1], visibility analysis [2], and disaster management [3]. The three-dimensional (3D) reconstruction and modeling have received intensive attention in city planning, geomatics, architectonics, computer vision, photogrammetry, and remote sensing. The rapid data acquisition technology from the optical image and light detection and ranging (LiDAR) can produce increasingly dense and reliable point clouds, making it possible to automatically reconstruct 3D building models in a large area. During past decades, various 3D modeling approaches in interactive [4] or automatic [5,6] have been proposed to reconstruct 3D building models using the satellite and aerial optical images [7,8,9], LiDAR [5,10], and combined images and LiDAR [11,12], resulting in full 3D or 2.5D building models at the scale of a city [13,14] and an individual building [4,15]. Even though much progress has been made to produce building models better and faster, the reliable and automatic reconstruction of detailed building models remains a challenging issue [16,17]. In particular, the reconstructed purely geometric model is usually a combination of planar patches or a set of polygons, which is difficult for many disciplines such as urban planning and land management to further semantically interpret and edit the types and structures of buildings.
In this work, we present a novel unsupervised approach to reconstruct the point clouds into semantic structures (e.g., dormer, hipped roof), purely using the geometric constraints. Departing from previous studies, our approach can directly recognize and interpret meaningful roof semantic subparts and their hierarchical topology for a compound 3D building, which can be further used to enrich the building model library or construct public training data for supervised learning. The main contributions of this work are twofold:
(1) a progressive grouping algorithm is applied to automatically decompose compound buildings into subparts, thereby generating a structured unit block without any independent overlapping elements,
(2) a hierarchical topology tree model is introduced, as well as a roof connection graph and its decomposed subgraphs, to simplify the complexity of the building reconstruction.
The remainder of this paper is organized as follows. An overview of the related unsupervised and supervised approaches for building reconstruction is introduced in Section 2. The detailed reconstruction steps are described in the next Section 3. Experimental results and discussions are presented in Section 4 and Section 5, respectively. Conclusions including future work are summarized in Section 6.

2. State-of-the-Art Methods

Over the past few decades, the issue of 3D building reconstruction has received considerable attention probably due to the advancement of photogrammetry and active sensors, producing a wealth of research work on this broad topic. Among these huge varieties of reconstruction methods, we can distinguish two categories for building modeling, unsupervised and supervised methods, which is the first time for such a summary as we know. In this section, the most related literature on 3D building reconstruction using ALS point clouds is discussed.

2.1. Unsupervised Methods

Unsupervised building reconstruction has been studied extensively in the fields of city planning, geomatics, architectonics, computer vision, photogrammetry, and remote sensing. These 3D building modeling approaches can be divided into data-driven and model-driven methods. A comparison on the data-driven and model-driven approaches can be found in Haala and Kada [18]. Interested readers are referred to some review literature [17,19]. Due to insufficient input data and complex building types, 3D building reconstruction remains an open problem even if only simple flat roof surfaces are considered [5]. Thus, hybrid-driven methods are gradually being concerned, which integrate additional information from both data- and model-driven methods.
For data-driven approaches, also called non-parametric or bottom-up approaches, it assumes that a building is a polyhedral model, which can be directly modeled by geometric information such as the intersection and regularization. It usually starts with the extraction of roof planar patches by region growing [20,21], feature clustering [22,23], model fitting [24,25], and global energy optimization [26,27,28,29], and then assembling these extracted roof planes to form a polygon building model. To improve the shape of the reconstructed 3D models, some regularization rules, such as parallel and perpendicular are often applied, resulting in a compact 3D building polygonal model with roof ridges and boundaries. These data-driven methods [13,30,31,32] have succeeded in the reconstruction of simple Manhattan-like objects but are unstable in the presence of noisy or incomplete point clouds. In order to sufficiently utilize the prior knowledge for building reconstruction, Zhou and Neumann [32] improved the quality of roof models by discovering the global regularities of the similarities between roof planar patches and roof boundaries, which can significantly reduce the complexity of 3D reconstructions. Poullis [33] developed a complete framework to automatically reconstruct urban building models from point clouds by combining a hierarchical statistical analysis of the data geometric properties and a fast energy minimization process for the boundary extraction and refinement. To generate more detailed roof models, Dehbi et al. [34] propose a novel method for roof reconstruction using active sampling, and it is limited to only dormer types. The main advantage is that it can reconstruct a polyhedral building with complex shapes, while the main drawback is the sensitivity to the incompleteness of the point cloud caused by occlusions, shadows, etc. Besides, the generated models from line segments and planar patches are usually purely geometric models, and the semantics of the roof structures are always missed.
The model-driven methods [35,36,37,38,39], known as top-down or parametric methods, start from predefined parametric 3D roof structures and then fit a building model that is best-fitted the input point cloud, resulting in some simple roof blocks in the early stage. Kada and McKinley [40] decomposed the LiDAR point cloud data into multiple objects and then combined them into a whole model. It performs well for automatic reconstruction on a large scale. In addition, 3D building roof structures can be fitted and recognized from the Reversible Jump Markov Chain Monte Carlo algorithm [41] and EM-based Gaussian mixture technique [42]. Moreover, constructive solid geometry (CSG) [43,44,45,46] primitives are always introduced in the process of model-driven building reconstruction, which can produce complete 3D building models through Boolean operators (union, intersection, and subtraction). The predefined CSG components organized by semantic information and shape parameters are suitable for 3D roof reconstruction for buildings with fixed styles. However, it is difficult for us to automatically decompose a complex building into predefined CSG primitives, thus, a semi-automatic process is usually adopted using the external ground plans or building footprints [44,46,47]. To deal with more complex buildings, Wang [46] proposed a novel method to reconstruct a compound building with semantic structures using roof local symmetries. The model-driven approaches can robustly reconstruct building models with simple roof styles by utilizing prior knowledge like parallel and symmetry, generating watertight building models. However, roof primitives or structures in the true world reveal a huge diversity, thus, it will fail when a searched roof cannot be described by any of the predefined primitive [34,48,49].
The hybrid-driven 3D reconstruction approaches [10,34,48,50], combining the conventional data- and model-driven strategies, aim to recognize building roof structures or search the best-fitted roof primitives from a predefined roof library. These hybrid-based algorithms can benefit from the roof topology graphs (RTG), which is a graph reflecting neighboring relations between extracted roof planes. Once the RTG is obtained, the searching and fitting process is performed in the topological space. The first RTG-based reconstruction can be found in Verma et al. [51], where the normal vector is added as an attribute of RTG. However, the scope of its application has been significantly reduced because the predefined roof primitive types are simple and fixed. Oude Elberink and Vosselman [52] expanded the parametric roof primitives’ library and added more connected attributes such as convexity and concavity for building reconstruction. Similar works by Perera and Maas [50] and Xiong et al. [53] were proposed to distinguish the roof elements and interpret building structures by the improvements in reliability and availability of RTG. The circle graph analysis [5] by minimal-close circles and outer-most circles are more adaptive than previous modeling methods. This sub-graph matched approach is easily prone to errors if mismatches of a sub-graph. In order to avoid multiple searching and matching of the same roof element, Rychard and Borkowski [10] propose a novel building reconstruction method to generate interpretable roof semantic blocks using a new roof structure library. Instead of using the roof topology graph, Xu et al. [54] developed a hierarchical topology tree (HRTT) model expressed by roof planar topological connections on plane–plane, plane–model, and model–model to reconstruct 3D building models. It can produce more accurate building models and can obviously improve the topological quality. However, an inherent problem of hybrid reconstruction is that it can be easily suffered error-prone in itself (e.g., incomplete roof planes extraction) or mismatches of roof sub-graphs. It is difficult to describe various building styles in the human world using limited roof primitives from a predefined RTG library. Moreover, they cannot interpret the semantic structures and maintain a valid topology of the building.

2.2. Supervised Methods

Supervised 3D building reconstruction approaches have gradually attracted widespread attention, especially the emergence of convolutional neural networks (CNN). Similar to the two-dimensional image semantic labeling methods, it assigns the most probable label to each 3D element (e.g., point, planes, roof subparts) using a labeling model learned from a huge number of training data. These labeled semantic features can be classified by a machine learning-based method [55,56]. The random forest [13] and support vector machines [55] are often used to identify the main building components, such as floors, ceilings, and roofs, which can be further assembled into a semantically enriched 3D model. However, the inputs for these methods are the encoded training features derived from local (e.g., surface area, orientation) and contextual (e.g., coplanarity, parallelism) information, which needs to be designed by hand. Recently, the emerging deep learning techniques have reached human-level performance in the domain of computer vision and natural language processing and have gradually been introduced to building reconstruction. Wichmann et al. [57] developed and released an available training dataset named RoofN3D, which can be used to train CNN for different 3D building reconstruction tasks. Axelsson et al. [58] have presented a deep convolutional neural network to automatically classify roof types into ridges and flat roofs, which can further support the generation of a nationwide 3D landscape model. It cannot interpret large buildings with small meaningful subparts automatically. Zhang and Zhang [59] introduced a deep-learning-based approach to successfully reconstruct urban building mesh models at level of detail 2 (LOD2) according to the CityGML specification but cannot interpret the building structures and roof topology. In addition, Yu et al. [60] developed a new fully automatic 3D building reconstruction approach that can generate the LOD1 building models in a large area but cannot generate complicated building structures. Although various supervised solutions have been proposed in recent years to reconstruct buildings with simple roof types, they are still hindered by the lack of public training data, especially the semantic subparts of complex buildings.

3. Methodology

The framework of the proposed complex building reconstruction approach from 3D point clouds, as shown in Figure 1, encompasses four key components, data preprocessing (Section 3.1), roof plane extraction and semantic labeling (Section 3.2), building semantic decomposition (Section 3.3), and generation of building models (Section 3.4).

3.1. Data Preprocessing

During data preprocessing, regions of building blocks are first detected from 3D point clouds. Taking the original point cloud as input, terrain points are firstly separated from non-terrain points using filter approaches like the adaptive TIN [61], cloth simulation filter (CSF) [62], and two-step adaptive extraction [63]. To obtain building and vegetation point clouds, a height threshold (1.5 m–2.5 m) processing was used to identify the high-rise points from the non-terrain points, then the obtained high-rise points can be further used to extract building point cloud using a top-down extraction approach [64]. Moreover, the extraction of building point cloud will benefit from the corresponding image data, as points can be projected back on imagery and cleaned using the normalized difference vegetation index (NDVI) threshold (0.1–0.15). With the extracted building point cloud, a Euclidean clustering method is applied to group the into individual clusters, and the clusters with small area (3–5 m2) are removed as tree clusters. The threshold of a small area is determined by the point density and the minimum number of points per cluster; e.g., if the point density of the point cloud is 4 points/m2, and a cluster with 12 points indicate an area of approximate 3 m2. After the aforementioned process, these segmented individual buildings can be subsequently reconstructed. It should be emphasized that these parameters (height, NDVI, area threshold) are selected empirically, and the details for these operations and parameters are beyond the scope of this paper.

3.2. Roof Plane Extraction and Semantic Labeling

This is a preliminary step for building reconstruction; we first segment the roof point clouds into individual planes by minimizing a global energy function, and then tag its semantics as roof or attachment (e.g., dormer, gable, hipper, chimney). Roof plane segmentation from point clouds is crucial to 3D building reconstruction and is still challenging due to noisy, incomplete, and outlier-ridden data. To achieve accurate and reliable roof planes, a multi-label optimization model [65] was applied, as presented in Equation (1).
E ( L ) = p D ( p , L p ) d a t a cos t + ( p , q ) T i n E d g e w p q · δ ( p , q ) s m o o t h cos t + L i L | ξ L | l a b e l cos t
The introduced model can transform the plane extraction problem into the best matching issue by balancing different energy costs on geometric data errors (data cos t), spatial smooth coherence (smooth cos t), and the number of planes (label cos t). The objective of this optimization framework is to assign every point (Data) to the most suitable plane (Label). To get the initial candidate labels for the energy model, the input point cloud will be firstly over-segmented into a set of patches by the Voxel Cloud Connectivity Segmentation (VCCS) algorithm [66] or our previous work [27], where each patch represents a local surface with centroid c, curvature f, and normal vector n. The initial candidate labels can be generated using centroids and normal vectors of surface patches, which are selected from all segmented patches or some patches with small curvature f. In addition, an operation by randomly sampling a subset of patches centroids c is done to enrich the potential candidate labels.
The first data cost term in Equation (1), a geometric error measurement is calculated as the quadratic perpendicular distance between a point to a potential label Lp. The second term in (1) is the smoothness between the neighbored point pairs, and the neighborhood can be achieved from triangulated irregular networks (TIN) or k-nearest neighbors (KNN). The indicator function δ(·) for the adjacent points is selected as Potts model [67], and is set to 1 if a pair of points (p, q) belong to the same label, otherwise, it is 0. Intuitively, a pair of points that are closer together are more likely to be on the same plane, thereby the weight function ωpq can be set as an inverse function of the distance between adjacent points (p, q) located on a TIN edge.
ω p q = exp ( p q )
The label cost item is a penalty for the number of input potential labels. In order to compactly represent the input scene, it is encouraged to use fewer labels. The proposed label model can be written by
| ζ L | = exp ( | L i | )
where |Li| is the numbers of inlier points on the plane with index i. The proposed global energy optimization is an iterative process along with the framework of Propose Expand and Re-estimate Labels (“PEaRL”) [68] and terminates only if the energy is no more decreased, resulting in a set of labels for the input point cloud. The final planes can be achieved by fitting the points with the same label index.
Similar to the work of Pu and Vosselman [69], the plane semantic features can be further inferred from the knowledge rules (Area, Orientation, Position) into roof or attachment (e.g., dormer, gable, hipper, chimney). It should be mentioned that the plane semantics are optional for the next decomposition process, and the semantics of roof planes can be also classified by the supervised method [70].

3.3. Semantic Decomposition of Compound Building

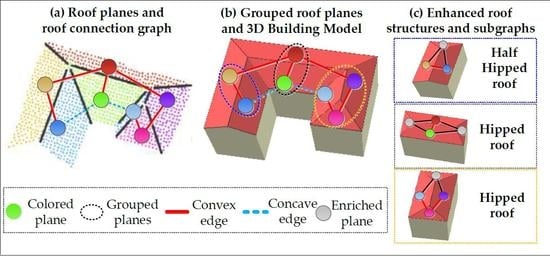
The semantic decomposition is to generate building subparts using a progressive decomposition and grouping algorithm. For each complex building, a roof connection graph is firstly constructed using the extracted planar primitives, and then a decomposing and grouping operation on the roof connection graph will be performed to generate sub-graphs, which are potential roof semantic structures (e.g., dormer, gable, hipper, chimney).

3.3.1. Hierarchy Tree Representation of Complex Buildings

A general assumption of the proposed modeling algorithm is that a compound building roof can be represented by various simple and meaningful subparts. Although the styles of buildings are diverse, the basic units (subparts) are similar: a subpart (structure) is a visual-pleased box composed of two or more parametric plane primitives with semantic features.
B u i l d i n g = i S u b p a r t i S u b p a r t = j { P l a n e j } P l a n e j = { G e o D a t a ; S e m a n t i c s } o r { G e o D a t a ; }
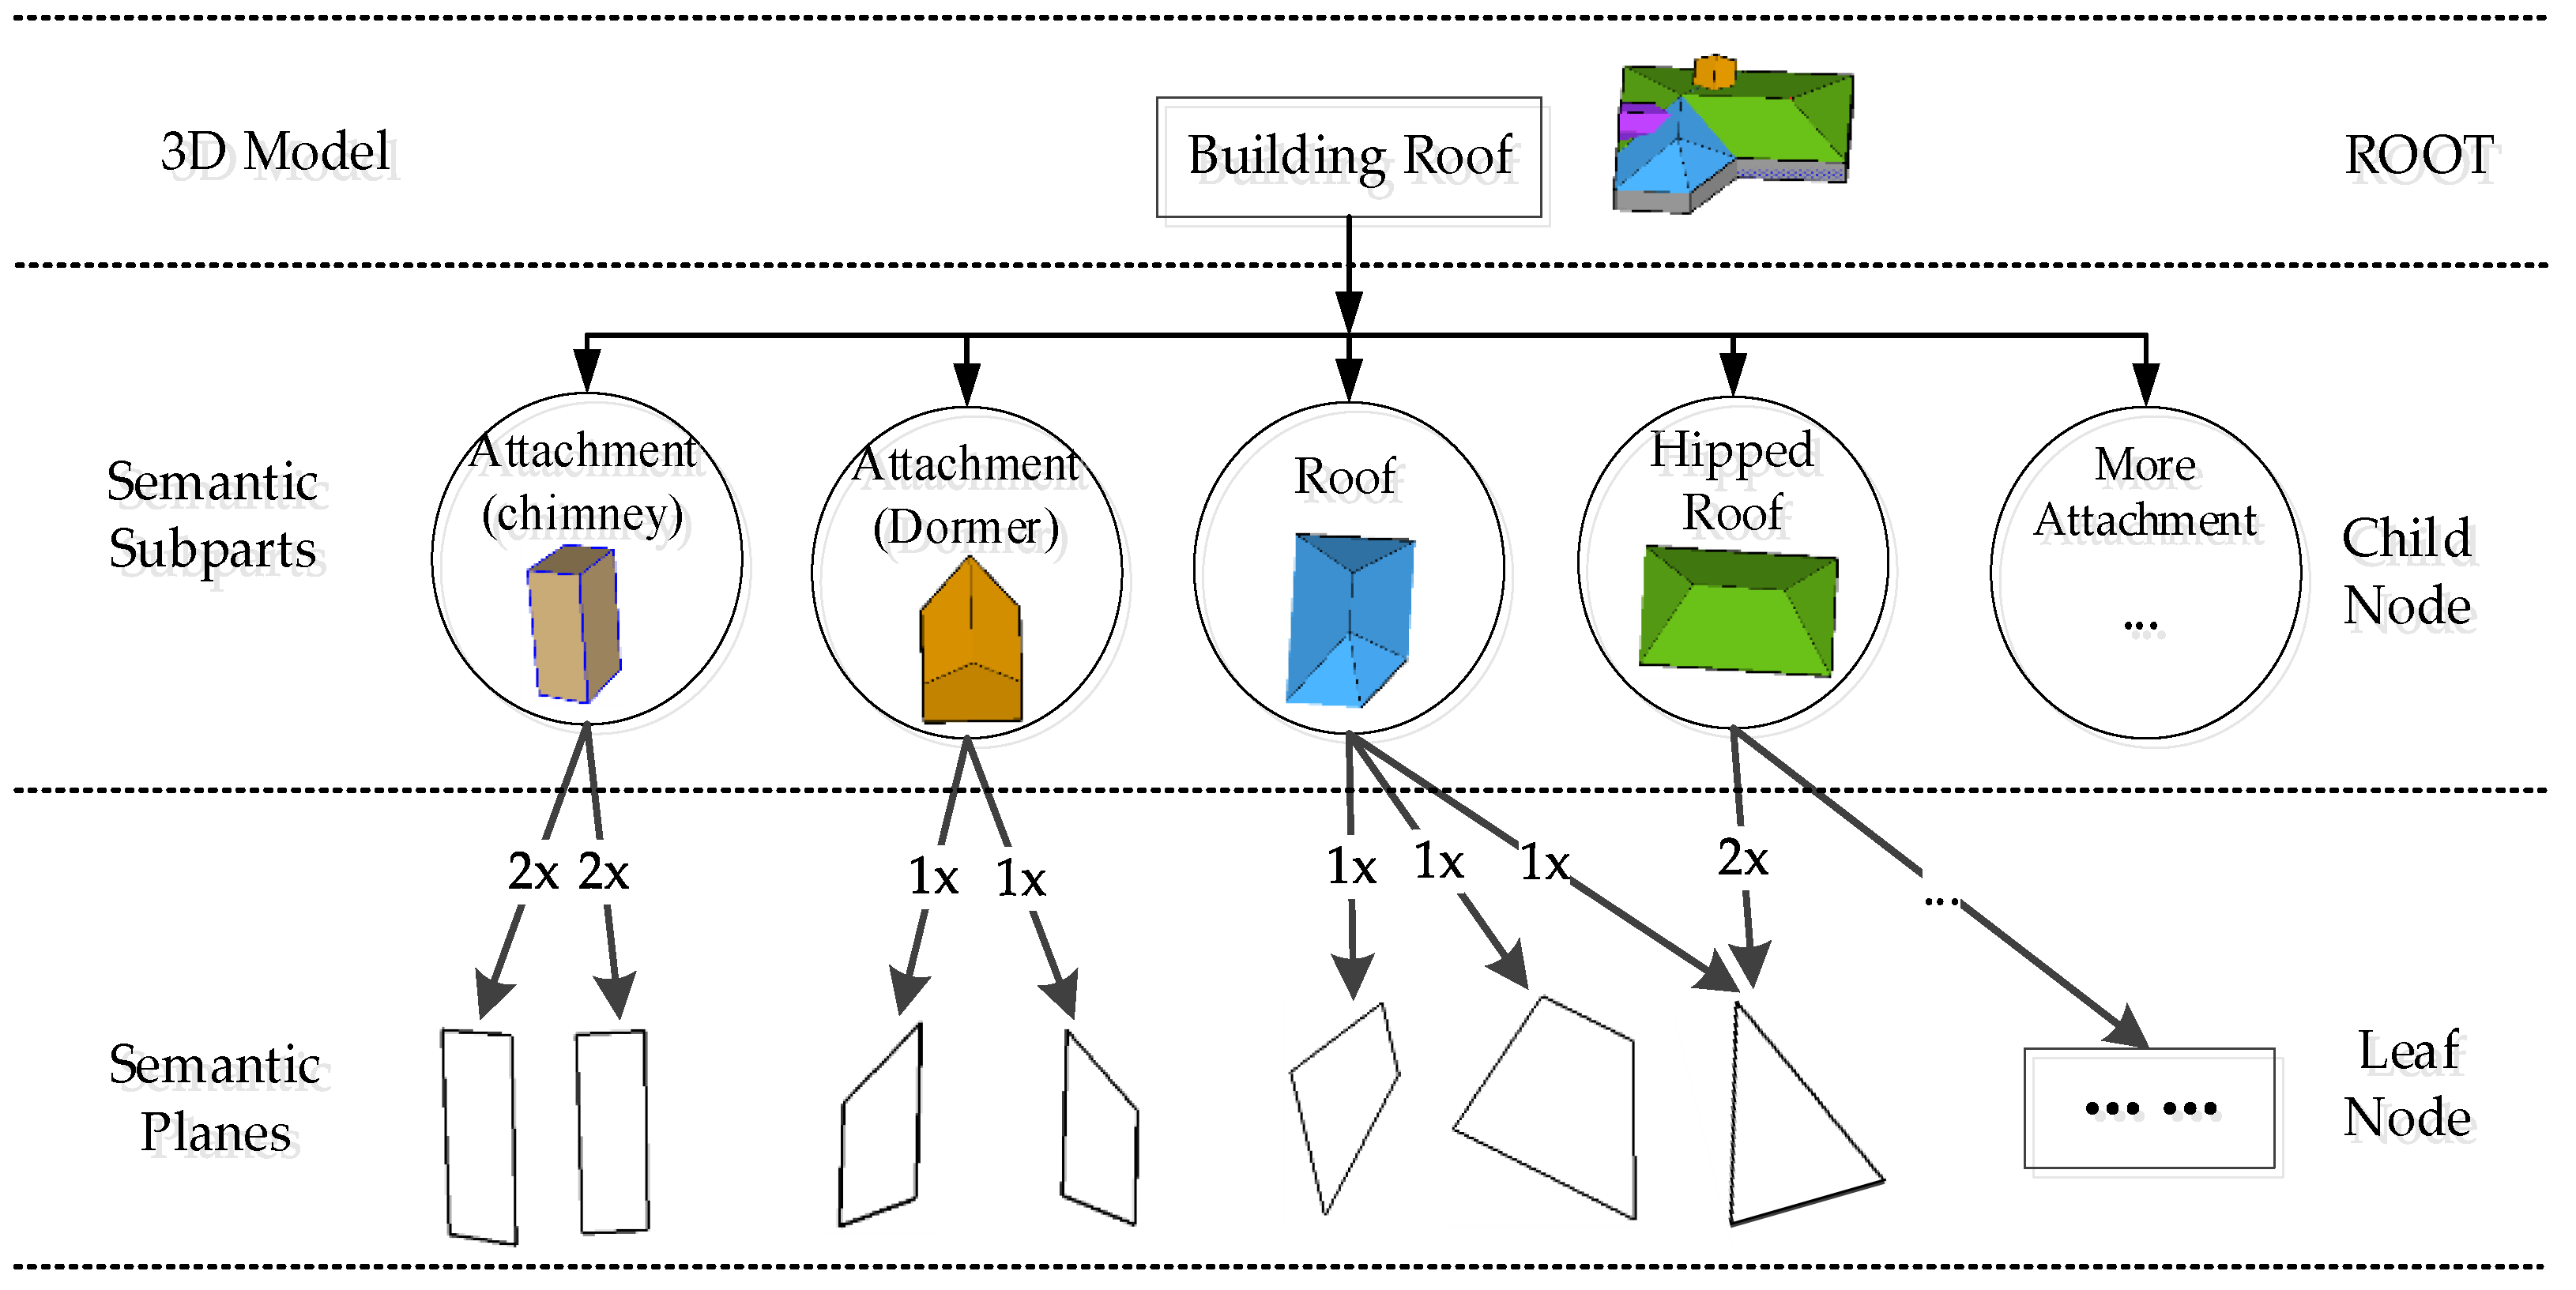
It should be noted that the plane semantics can be allowed to be empty ∅. Moreover, a general hierarchical-tree-based representation for a complex building was introduced, shown in Figure 2.
The root of the hierarchical tree, illustrated in Figure 2, is a 3D building model organized by roof semantic subparts, and the planar primitives and roof subparts are treated as leaf nodes and child nodes, respectively. For example, the roof attachment named vertical chimney in the second row is two pairs of parallel planes, while a dormer is a combination of two adjacent planes.

3.3.2. Construction of the Roof Connection Graph

To generate a reasonable decomposition and grouping for roof subparts extraction, the roof connection graph C, a weighted undirected connected graph, is obtained by the extracted roof planes in the Section 3.1. The vectices (V) in C are roof planar primitives, and an edge E between the two vertices represents spatial connectivity. In addition, local geometric convexity and consistency will be calculated for each edge.
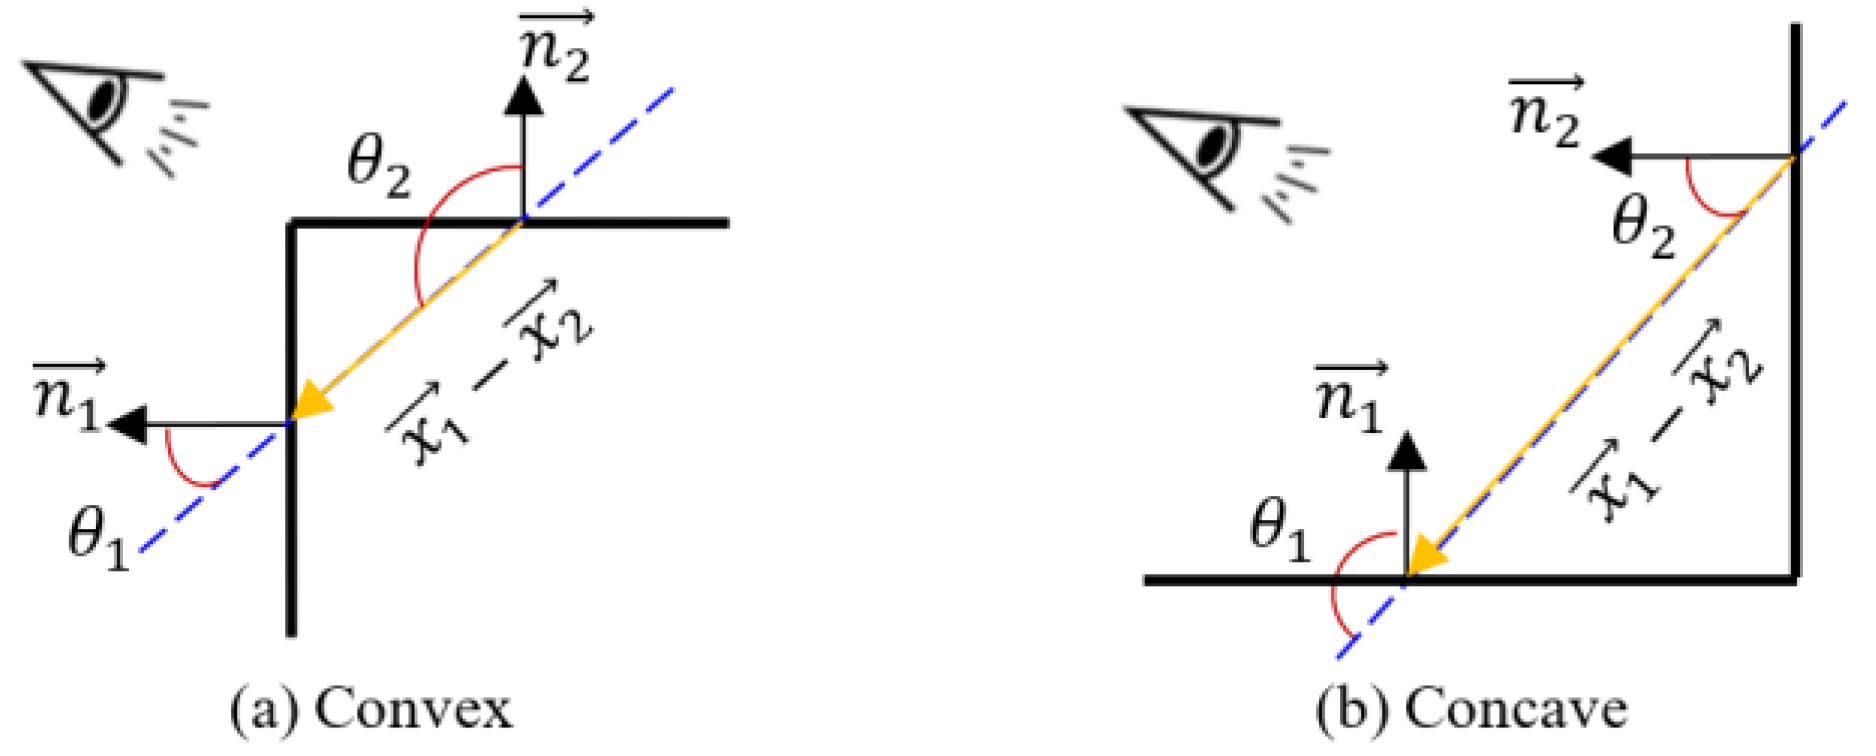
The Euclidian distance FDist between adjacent planar primitives is firstly set as an attribute of the edge E. The psychophysical studies [71,72,73] suggest that the transition between convex and concave parts might be indicative of the separation between objects and/or their parts. In other words, concave-convex features are the cues for the decomposition objects into semantic subparts. Thus, edges in C are equipped with 3D concave or convex attributes to ensure the reliability and efficiency of building roof decomposition, and the local convexity Fcon for adjacent planes is calculated by:
F c o n = { T r u e F C o n v e x θ 1 < θ 2 n 1 · d > n 2 · d F a l s e F C o n c a v e θ 1 > θ 2 n 1 · d < n 2 · d
where n 1 , n 2 and x 1 , x 2 are normals and centroids of adjacent planes, respectively. The angle (θ) of the normals to the vector d = x 1 x 2 joining the centroids can be calculated using the dot product. For a convex connection, the angle θ 1 is smaller than θ 2 , while for concave, the opposite is true. The convexity/concavity are shown in Figure 3.
The FDist and FCon can be directly marked as attributes for each edge E and stored in roof connection graph C, that is C = {V, E}, E = [FDist, FCon]. Finally, the generated graph C will be the foundation for the next progressive decomposition and grouping operation.

3.3.3. Progressive Decomposition for Subparts Extraction

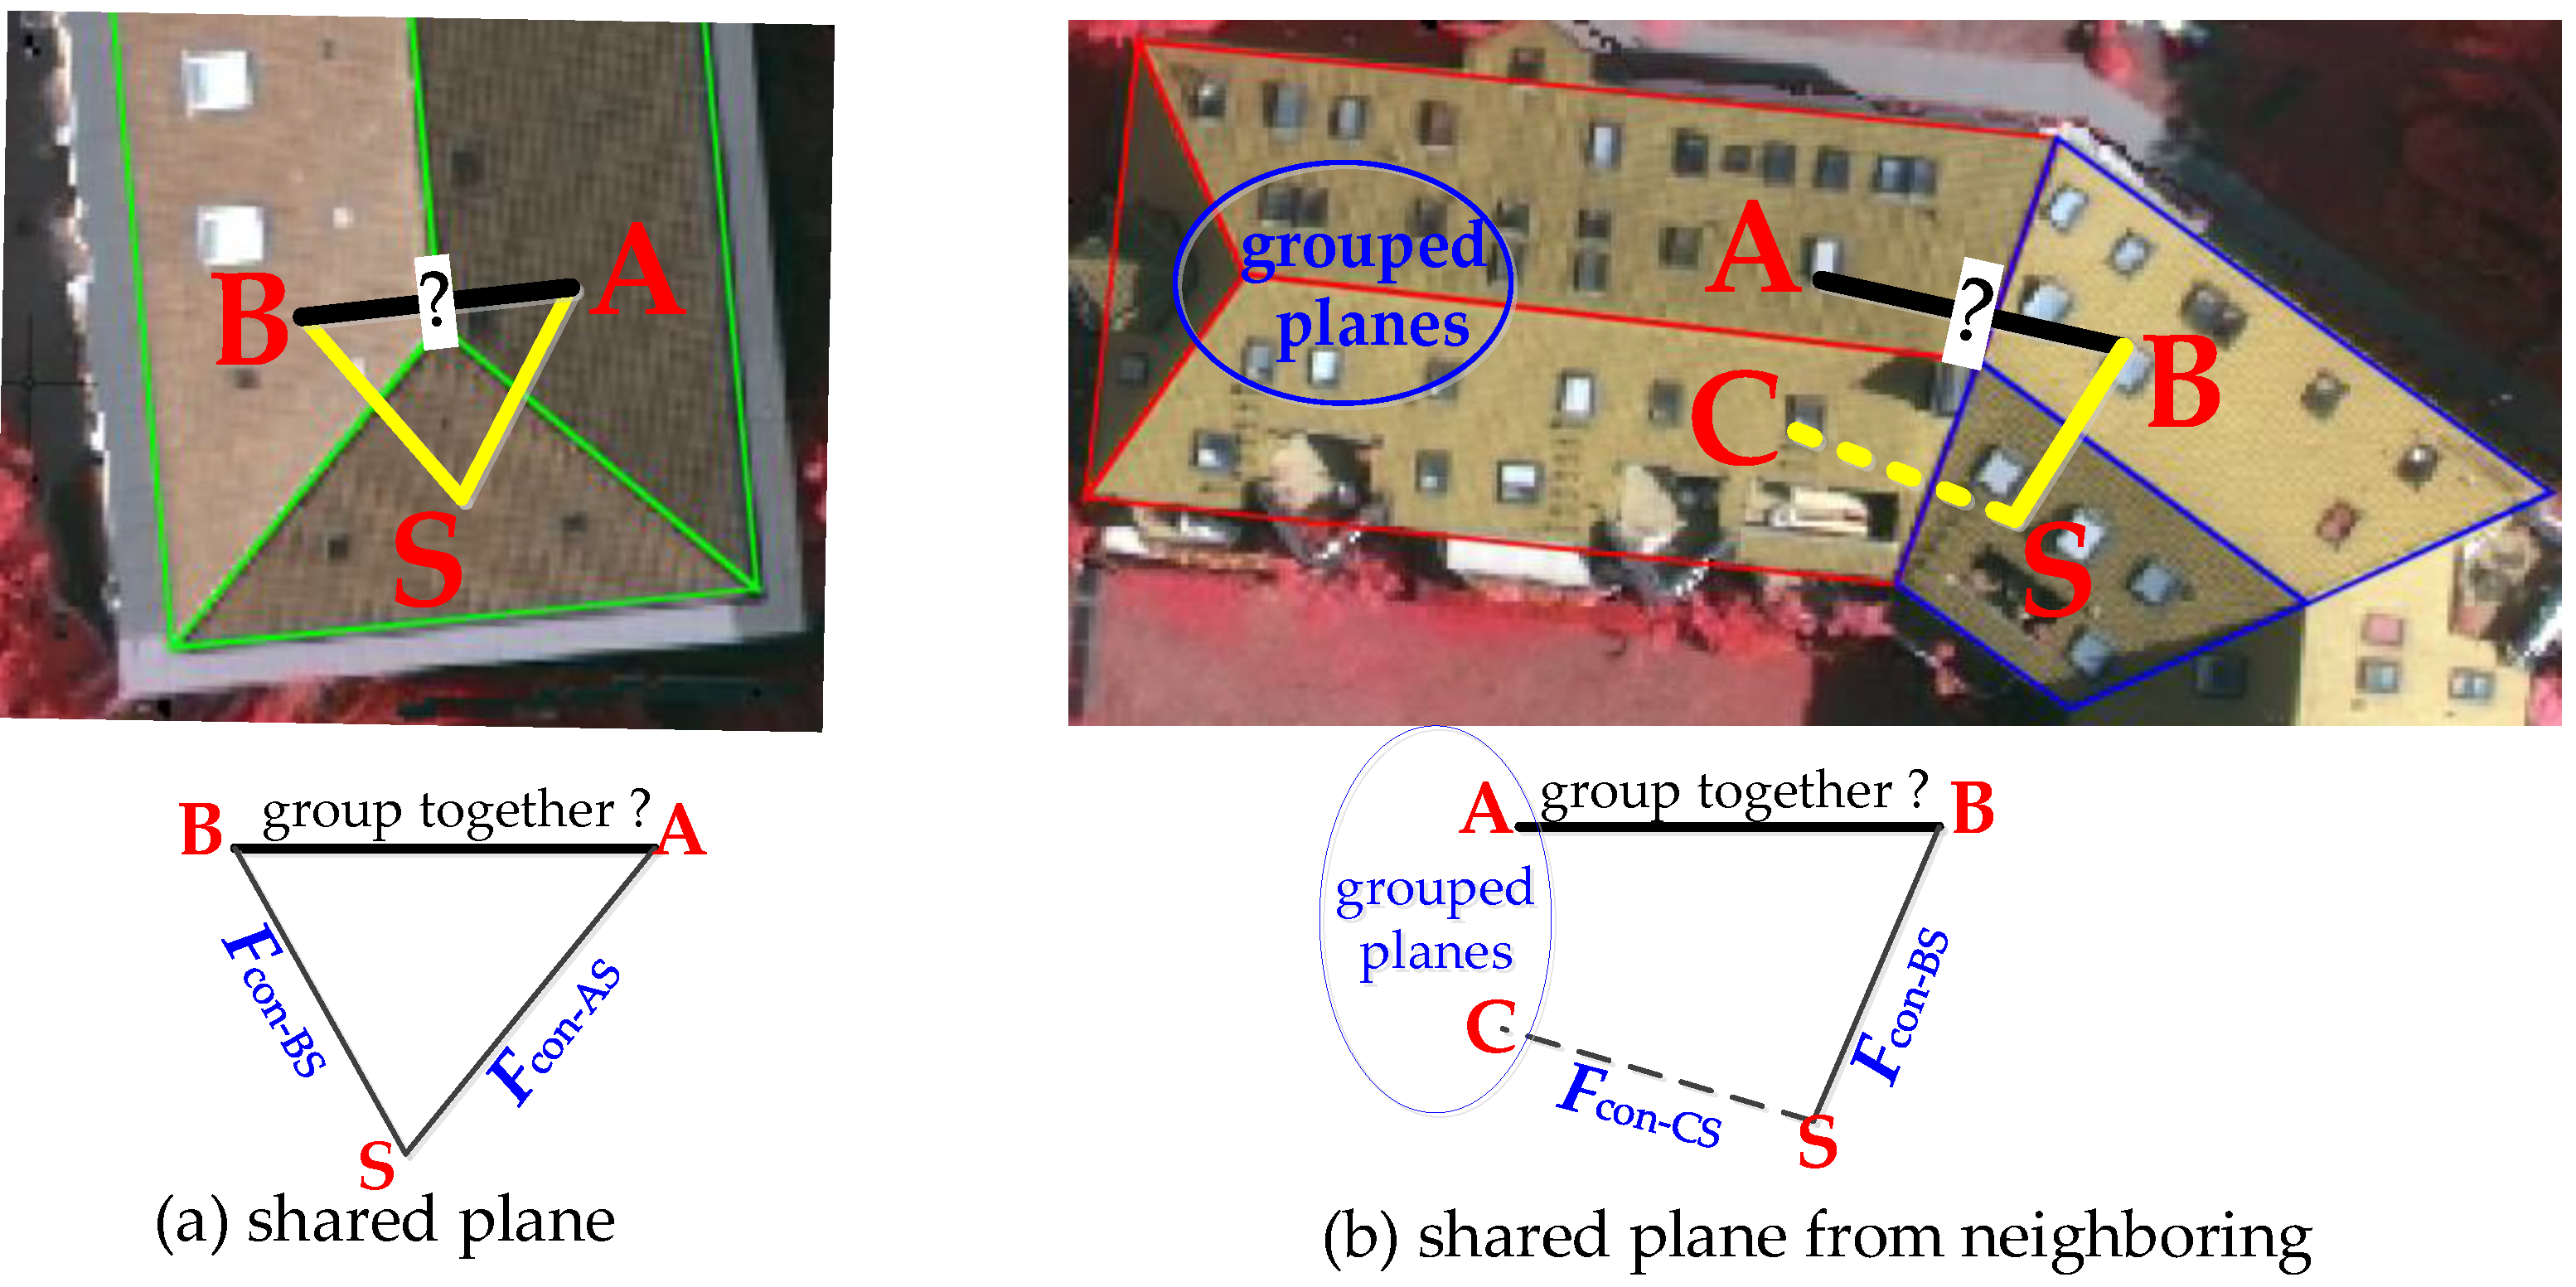
The commonly used methods for roof subparts extraction are usually accomplished by searching and matching the sub-graph element from a predefined library, and it is usually hampered by some significant problems, such as the completeness of the library, the ambiguous definition, and errored sub-graph recognition. When observing objects, we will attempt to group similar elements, recognize patterns, and simplify complex images as we look at objects. To achieve the sub-convex building subparts, visual perception constraints (e.g., proximity, similarity, consistency) derived from the Gestalt Principles are applied [71,72,73]. The predefined Euclidian distance FDist and local convexity FCon are the proximity and similarity constraints, respectively. The proximity constraint is straightforward, that is, the planes that are close to each other are more likely to be treated as one group. While the local convexity represents adjacent primitives sharing visual features (such as shape, convexity, and concavity) can group into a perceptive group. Therefore, the consistency constraint FCC (shown in Figure 4), preferences to establish a sub-convex box, is introduced to represent continuous concavity/convexity during the progressive decomposition processing.
As presented in Figure 4, it indicated that adjacent plane A and B can be grouped only if it satisfies: (1) the edge between plane A and B is labeled as convex, (2) the similarity FCon between plane pairs (A-S, B-S) or (C-S, B-S) should be exactly the same, where S is a shared plane and C is the neighbor of planes A and B that need to be grouped. The consistency constraint criterion FCC is then defined as:
F C C = { true F C o n A S = F C o n B S ( a ) true F C o n A B = c o n v e x & ( F C o n C S = F C o n B S ) ( b ) false otherwise
To achieve the roof subparts, a progressive iterative decomposition of the roof connection graph is introduced, as illustrated in Algorithm 1.
Algorithm 1. Progressive Decomposition
Input: a roof connection graph G and roof planar primitives PS = [Lp]
Output: roof subparts [GSub] and an initial building hierarchical tree T
1:   While PS ≠ ∅ do
2:        Find a planar primitive Lp0 with the largest area from PS
3:        Create an empty roof plane set GSub and initial it with plane Lp0
4:        Generate GSub by the iteratively decomposing G using (FDist, FCon, FCC)
5:        Update the nodes of building hierarchical tree T from GSub
6:        For LpiGSub do
7:           remove plane Lpi from PS
8:           update the nodes and edges of G
9:        End For
10:   End While
The extraction of building subparts as well as the hierarchical tree is carried out in a progressive manner, which aims to search and find the best set of roof planar primitives that are potential to the same sub-convex box. The detailed iteration of the decomposition and grouping to generate a building roof structure is elaborated in the following:
(1) Start from a planar primitive Lp0, which has the largest geometric area, and initial the current group GSub = [Lp0];
(2) Create a candidate plane set Gcandidate that all primitives are connected to the last added element of GSub, which means that there exists an edge in G. If the candidate set Gcandidate is empty or all candidate elements are grouped, the current grouping loop ends;
(3) Calculate the convexity FCon and consistency FCC for each element in Gcandidate, and remove the ones that cannot meet these constraints;
(4) Sort the remaining candidate primitives in Gcandidate according to principles of the closest connected distance FDist and the same semantics, and the candidate element with the minimum FDist will be grouped into GSub. If the set Gcandidate is empty, the decomposition will terminate;
(5) Go to step (2).
When a building roof subpart is grouped according to the aforementioned decomposition steps, the nodes of the building hierarchical tree will be generated, and the information of the grouped primitives will be simultaneously updated from G. Moreover, this iterative decomposition will be terminated when all input roof planes are grouped. Once the decomposition from G is finished, sub-graphs of different building parts can be obtained, as shown in Figure 5.

3.4. Generation of 3D Building Models

Due to the limit of acquisition devices and scene occlusions, these subparts cannot be correctly interpreted or identified as unambiguous building structures. Thus, a refinement step will be introduced for each grouped subpart using the constraints of symmetry and closure to produce a visually pleasing 3D model in the final. As each primitive connected to its adjacent planes ought to be convex, thus, the closure is that the projected primitives should be connected in sequence and made a closed loop. The local symmetry is used to fulfill the missing or extend ghost primitive based on the architecture aesthetics. As shown in Figure 6, it is performed on whether the normal vector projections of adjacent planes are parallel to each other.
For any pair of adjacent primitives in Figure 6, we firstly project its normal vectors ( n 1 , n 2 ) onto the ground plane, and then an analysis is performed on whether the projected normal vectors ( n p 1 , n p 2 ) are mutually parallel with respect to its intersection: if mutually parallel the adjacent planes are symmetric. Moreover, the details of enhancing these decomposed building subparts are elaborated as follows:
(1) For any extracted subpart, we firstly extract its corresponding sub-node and inlier leaf nodes in Figure 5d.
(2) Calculate the local symmetry indicators of adjacent primitives and perform it.
(3) A closed hull loop detection, stitching together the projected primitives in sequence, will be performed based on closure perception laws. Moreover, an add and union primitive operation will be carried out.
Subpart labeled as the roof: Check the outer border ring of the primitives projected to the ground plane, and if the loop is a concave hull, which means that there exists an incomplete closed loop, a “extend ghost” primitive will be accomplished by searching a connected plane from the roof connection graph or stitching the vertexes of the nearest primitives along the loop. Especially, if the newly added “extend ghost” primitive is parallel to its adjacent, a plane union operation will be performed.
Subpart labeled as dormer: We usually handle the missing vertical primitive along with the boundary loop, where the projected plane is perpendicular to the normal vector.
Subpart labeled as chimney: There exist two types of chimney: column and cone. The missed primitives will be fulfilled along the boundary, and the projection plane is the ground plane. The difference between them is that the fixed source vertex is the same for a cone part.
(4) A similar regularization process [74] is applied to the refined building subparts to produce a 3D geometric vector boundary, and the changed information in the hierarchical tree will be synchronously updated.

4. Experimental Results

4.1. Description of the Datasets

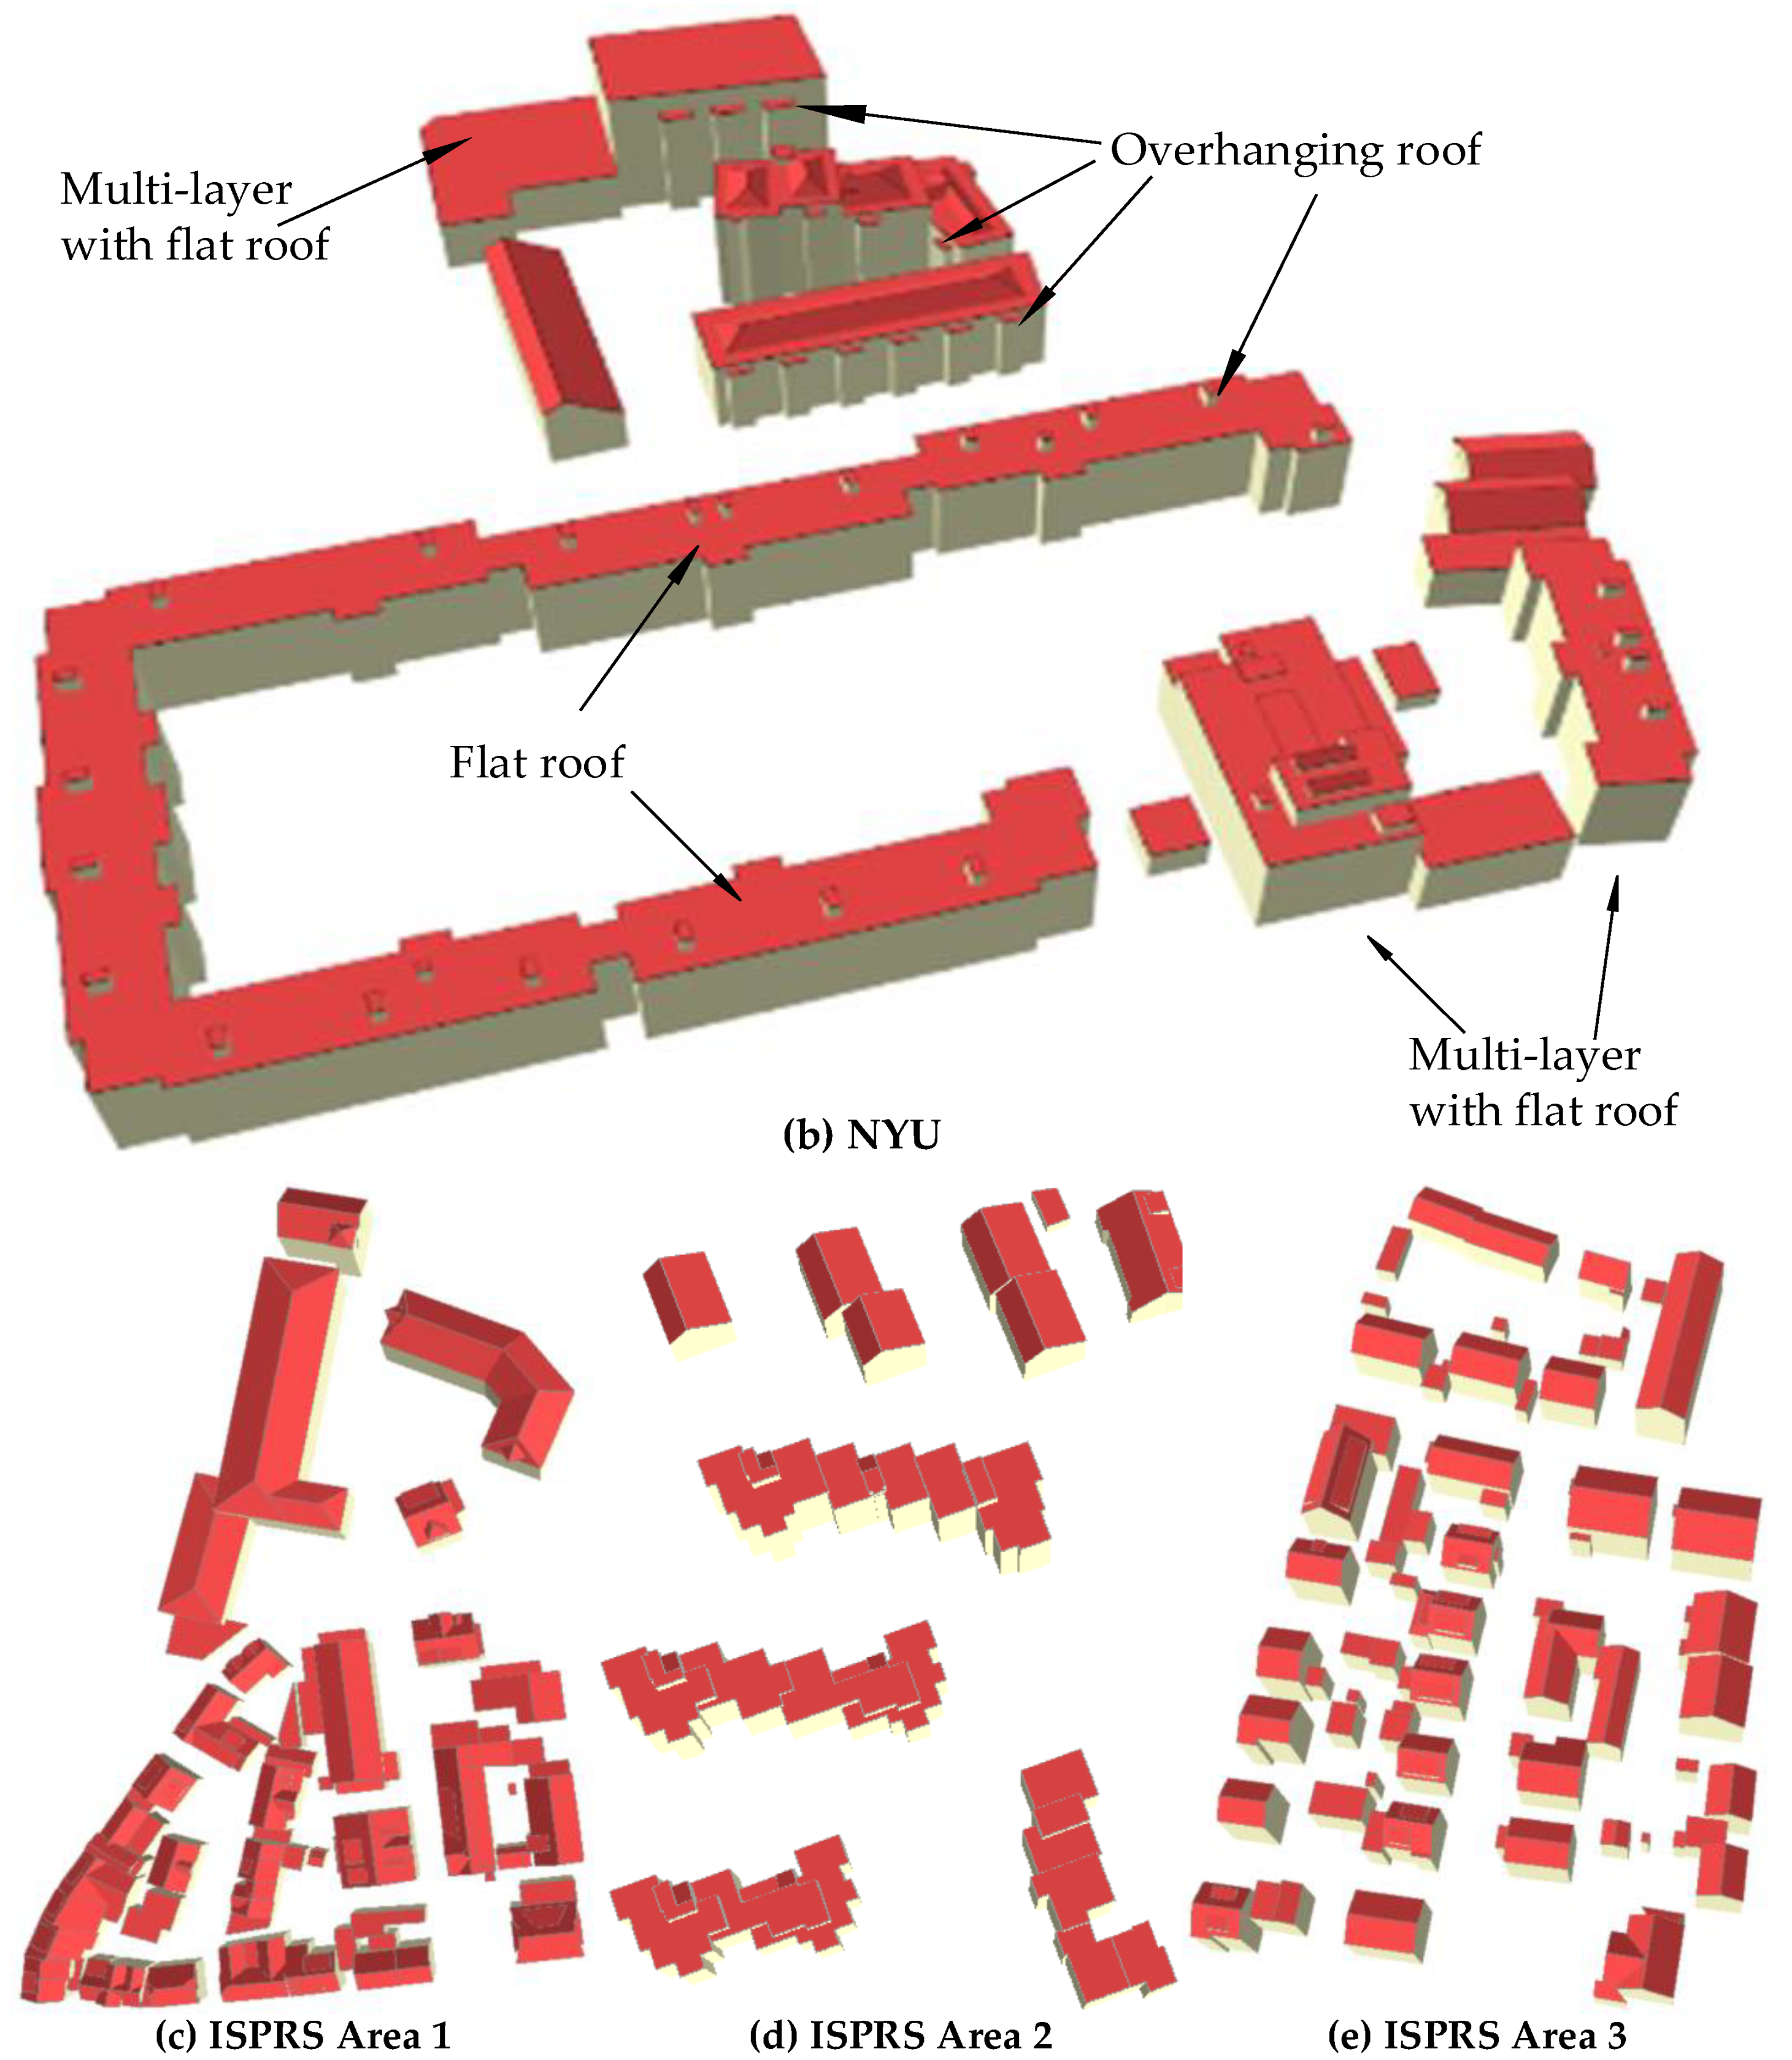
The proposed approach has been implemented with the computational geometry algorithms library (CGAL) [75] and the point cloud library (PCL) [66], and mainly tested on datasets with different point densities and urban characteristics. An overview of the tested datasets is shown in Figure 7. The first dataset is the Guangdong data in China, which has a high point density and buildings of various shapes and sizes, and the next one is the NYU ALS dataset released by the center for urban science and progress of the New York University [76]. The last widely adopted benchmark dataset, obtained from ISPRS Test Project on Urban Classification and 3D Building Reconstruction [16], is located in the city of Vaihingen, German.
The Guangdong dataset was obtained in 2016 using the Trimble Harrier 68i with an average height of 800 m. It is located in a rural region covering an area of approximately 340 × 360 m2 and includes 83 buildings with 257 planes in various shapes and sizes. The point density is approximately 13 points/m2, but has some missing areas as the occlusion, which can easily be prone to failures using the current 3D reconstruction methods. Moreover, the NYU dataset is a high-density ALS data for urban areas and contains a complex set of roof types such as multi-layered and flat. The point density is approximately 123 points/m2, while the ISPRS benchmark datasets in Area 1–3 were obtained by a Leica ALS50 system in 2008 with a point density of 4–7 points/m2. There are 37 historic buildings with complex structures and irregular boundaries in Area 1, while Area 2 is characterized by high-rise residential buildings. The roof boundaries are very complex, and the gaps between adjacent roofs have large height differences. Area 3 is a purely residential area, including 56 buildings with many small roof structures. Moreover, the modeling results derived from the Vaihingen benchmark dataset can be evaluated by ISPRS and can be compared with other methods using a unified standard [16]. As the assessment by ISPRS have terminated, we will illustrate the evaluation on Area 1 and 3, and the other three datasets will be assessed using the same geometric errors.

4.2. Results of Model Reconstruction

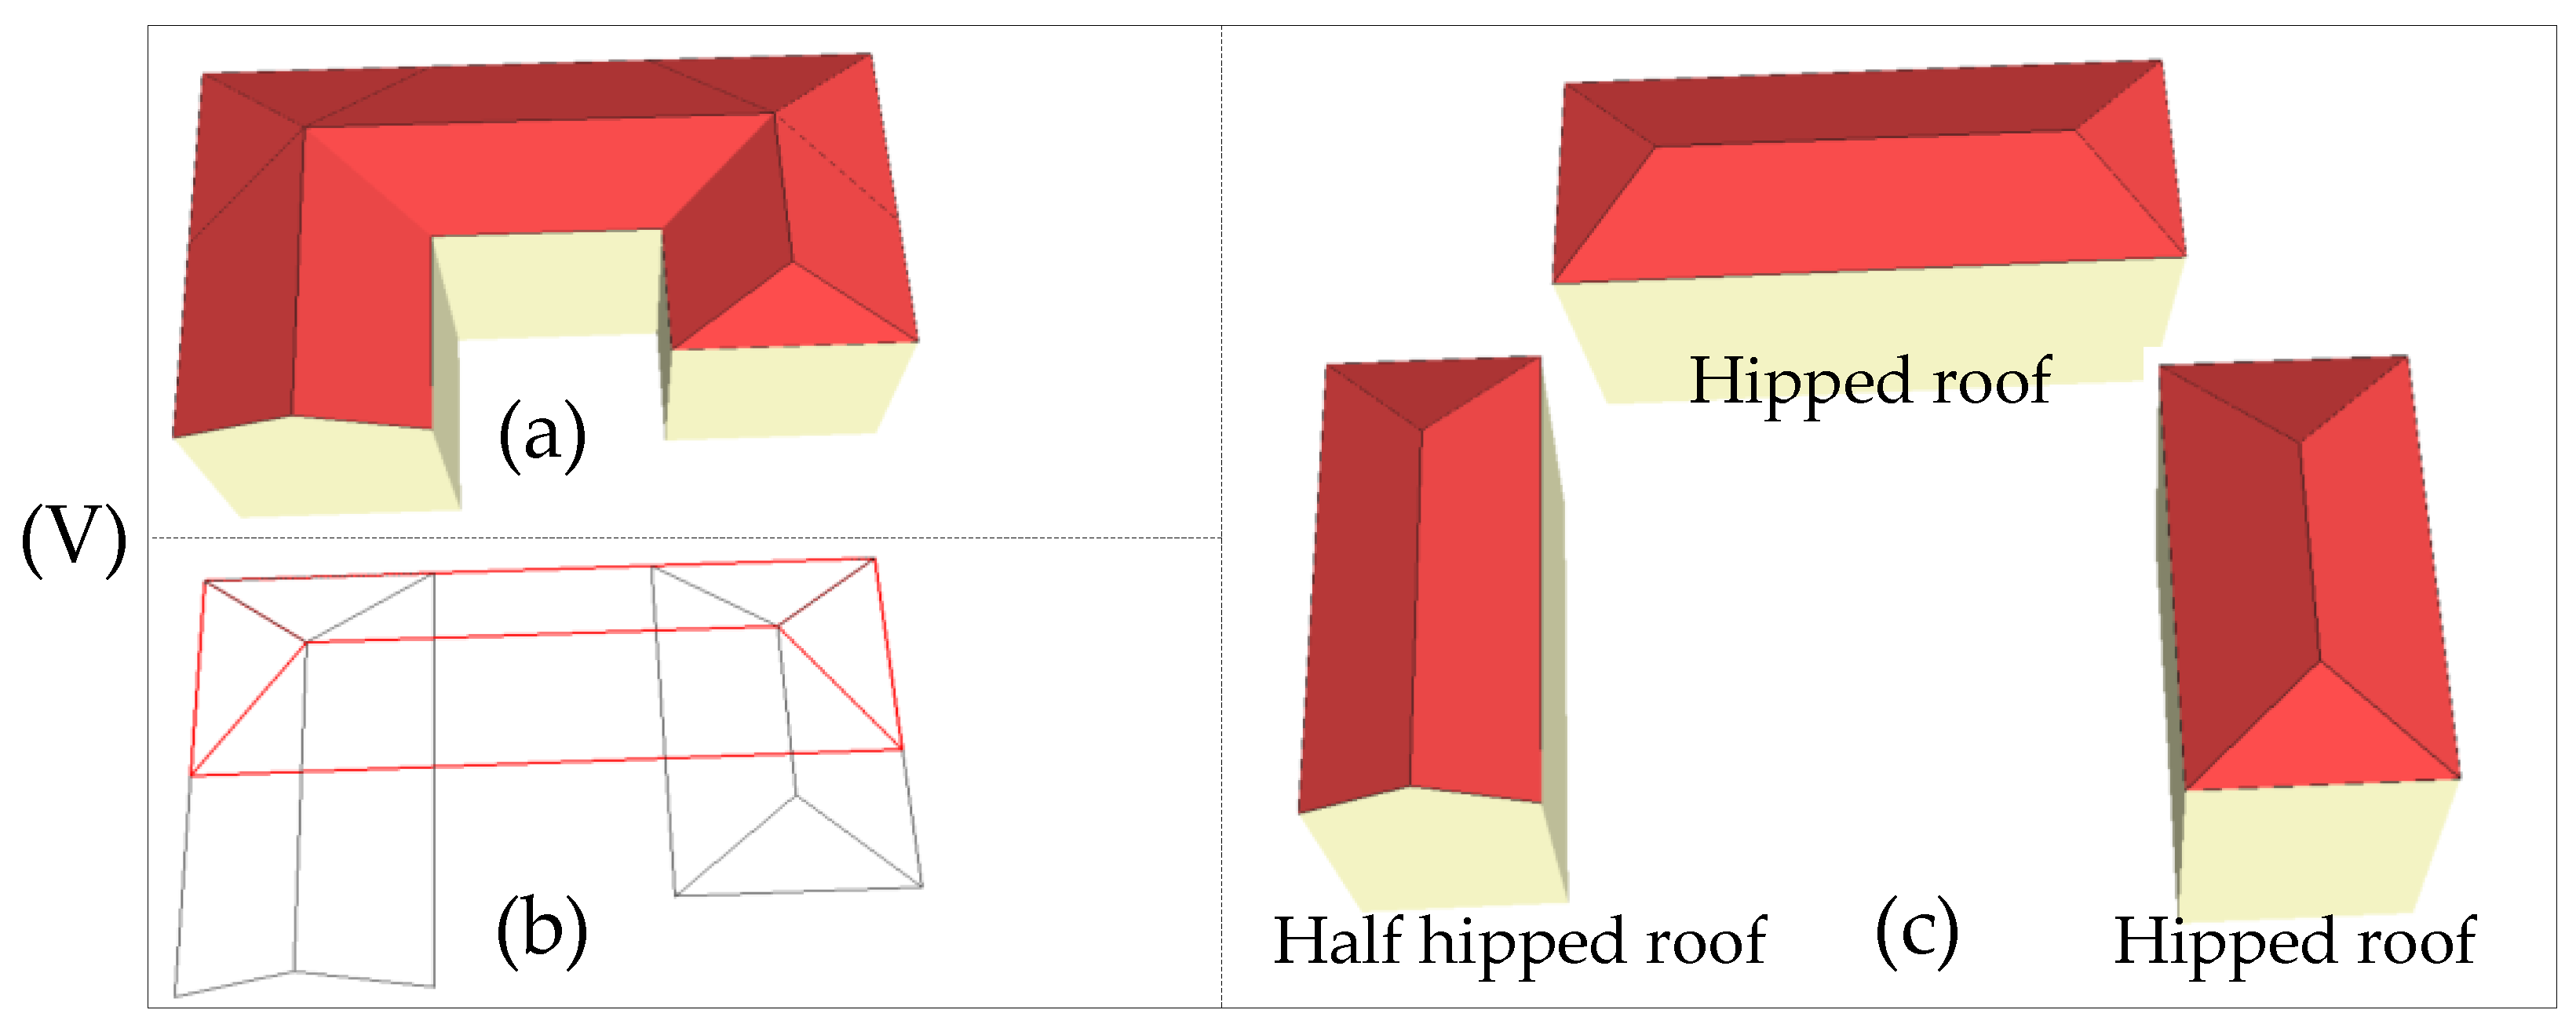
In the aforementioned datasets, a series of representative buildings are selected to validate the proposed approach. These compound buildings illustrated in Figure 8 are reconstructed by a set of basic building subparts, which are a combination of planar primitives.
It can be seen from Figure 8 that the generated compound buildings in part (a) are assembled by semantic building units in part (c), including hipped roof, dormer, etc. In part (b), the 3D wireframe of each reconstructed building generated is a hierarchical topology tree, which is organized by reconstructed building subparts in part (c). These generated building subparts with an explicit topology can be further used to enrich the building model library or construct public training data for supervised learning. The proposed approach aims to correctly and automatically reconstruct building subparts, and the additional semantics are to be inferred by the dominant semantics of the grouped planes. It is beyond the scope of this paper to accurately interpret the semantics data for various styles. In addition, the final 3D models are illustrated in Figure 9.
Different from the ISPRS benchmark data (Area 1 and Area 3), the Guangdong data is a private testing data and public NYU is a non-standard dataset, thus, the various standard internal consistency metrics cannot be assessed by the ISPRS. In addition, the assessment on ISPRS Area 2 is missed as the ISPRS evaluation is stopped. Therefore, the evaluations of the three datasets are performed by a simple internal quality and a visual judgment. Results of visual judgment are shown in Figure 9a–c, while the internal quality are the reconstructed geometric reconstructed error and the rate of fully reconstructed buildings. The geometric reconstructed errors, a distance from a point to a reconstructed plane (average), are approximately 0.033 m (Guangdong), 0.021 m (NYU), and 0.2 m (ISPRS Area 2). In addition, a total of 77 buildings (252 roof planes) were successfully reconstructed, achieving a fully reconstructed 92.7% of the original 83 buildings for Guangdong data. These buildings are fully reconstructed in the public NYU and ISPRS Area 2 datasets, and the complex roof types in urban areas, like overhanging roof, multi-layer roofs, and flat roofs, are successfully modelled. The overhanging roof is usually a single plane in the constructed roof connection graph and can be easily grouped. While the complex multi-layer roofs can be reconstructed as a variety of different roof structures, and flat roofs with different height are fully modelled as different parts in the testing Areas. The facades in the NYU dataset are ignored in the current scheme.
Furthermore, for the ISPRS benchmark datasets of Vaihingen (Area 1 and 3), it allows us to use external reference data and assess the result according to unified criteria against other modeling methods [16]. The results are listed in Table 1.
It can be seen from Table 1 that the proposed method for building roof reconstruction has achieved 201 correctly reconstructed out of 202 in Area 1 (99.5% correctly reconstructed). While for Area 3, the number of correctly reconstructed planes is 130, reaching 97.7%. The most common reason for the false reconstructions (FP) is the lack of insufficient points.

5. Discussion

5.1. Visual Analysis of the Decomposition Results

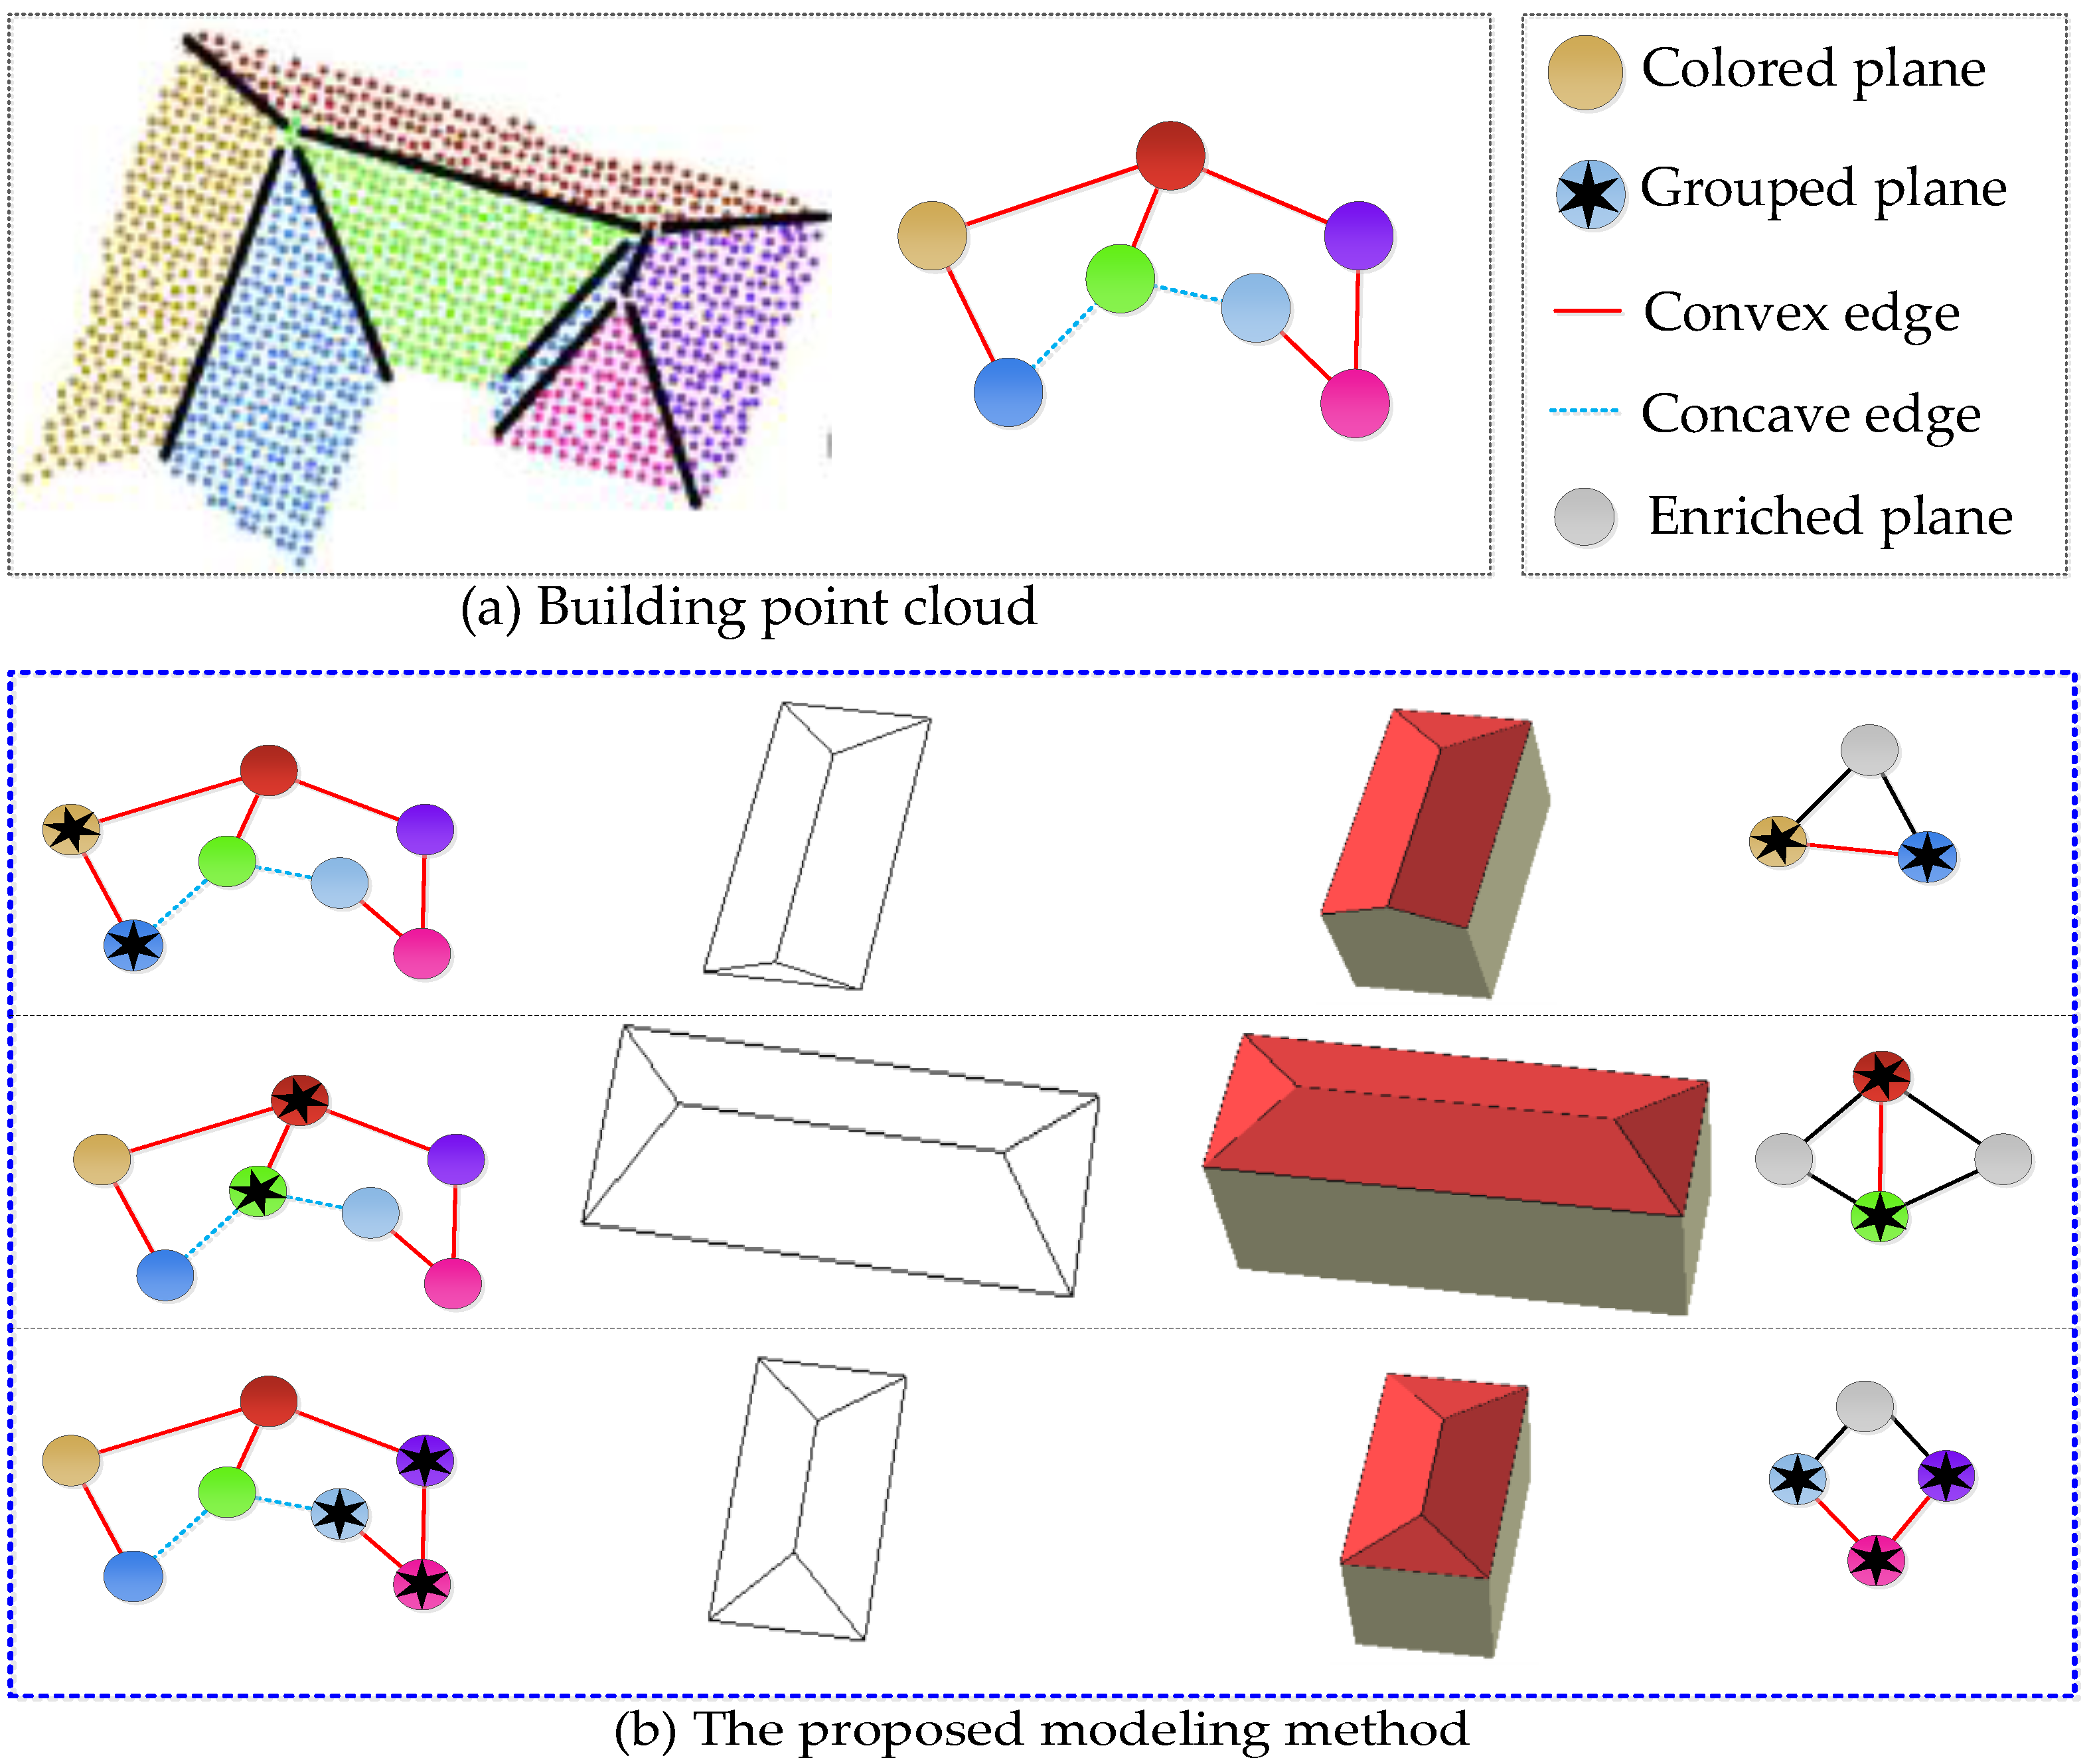
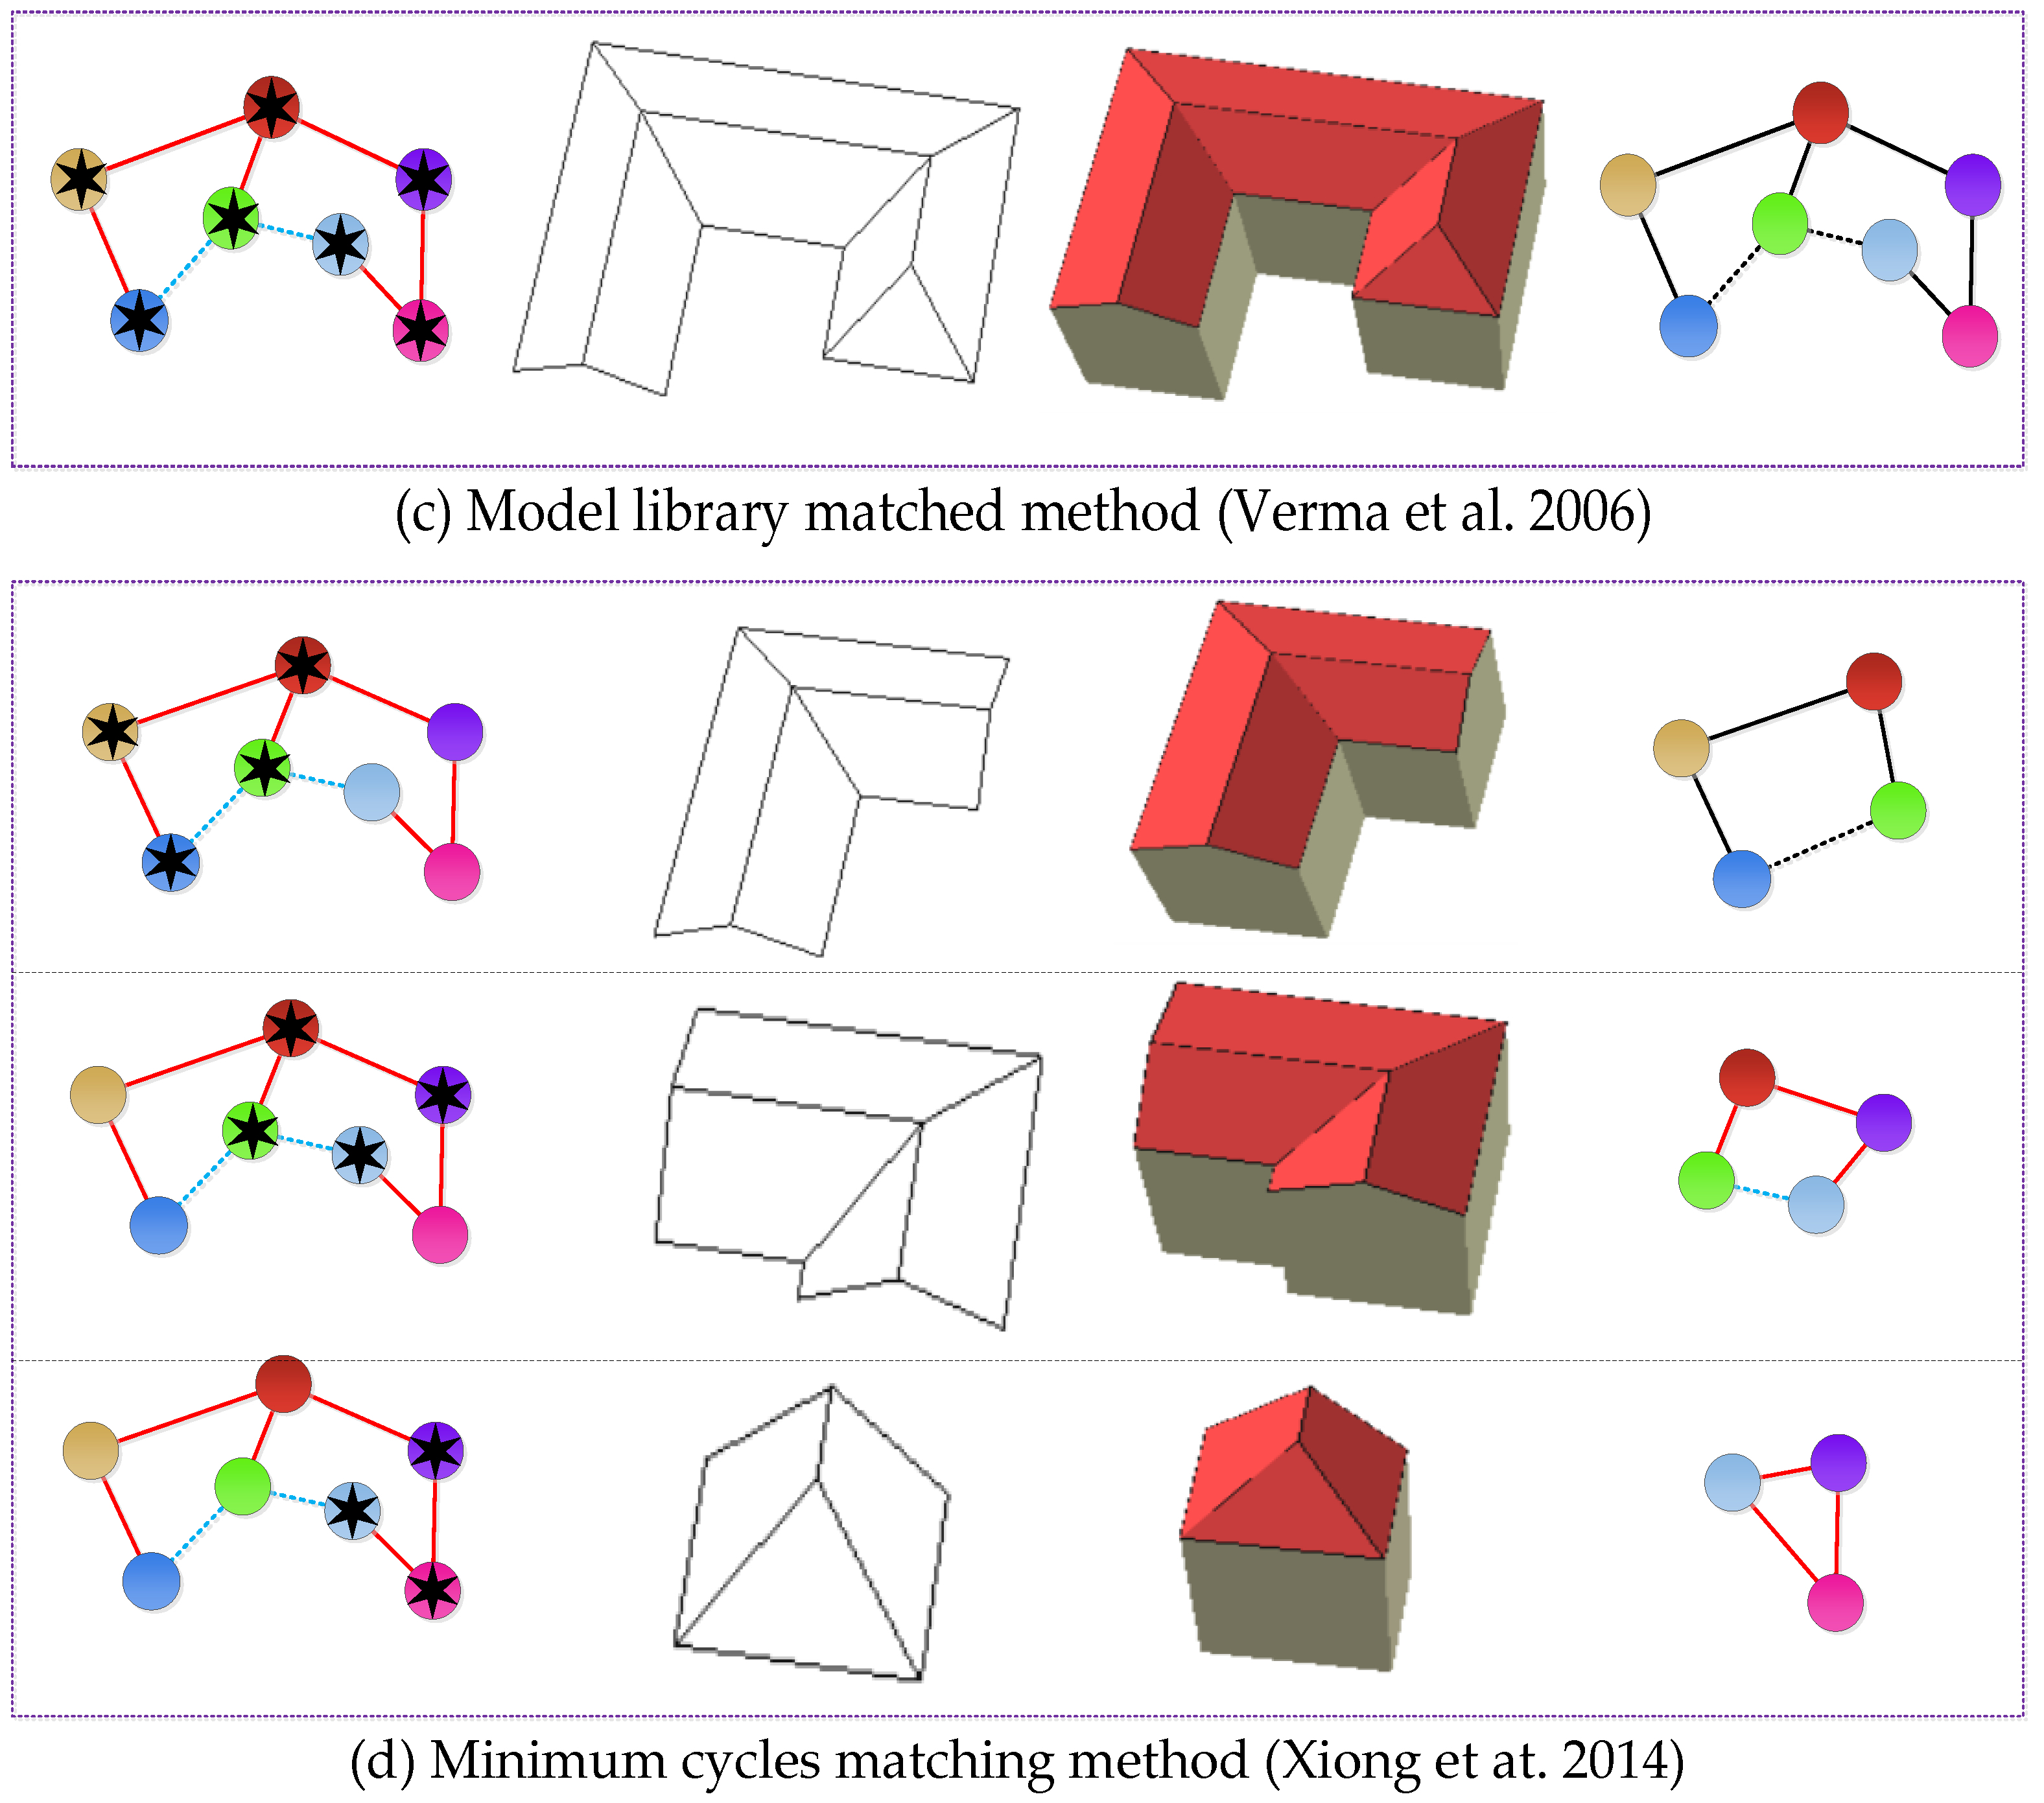
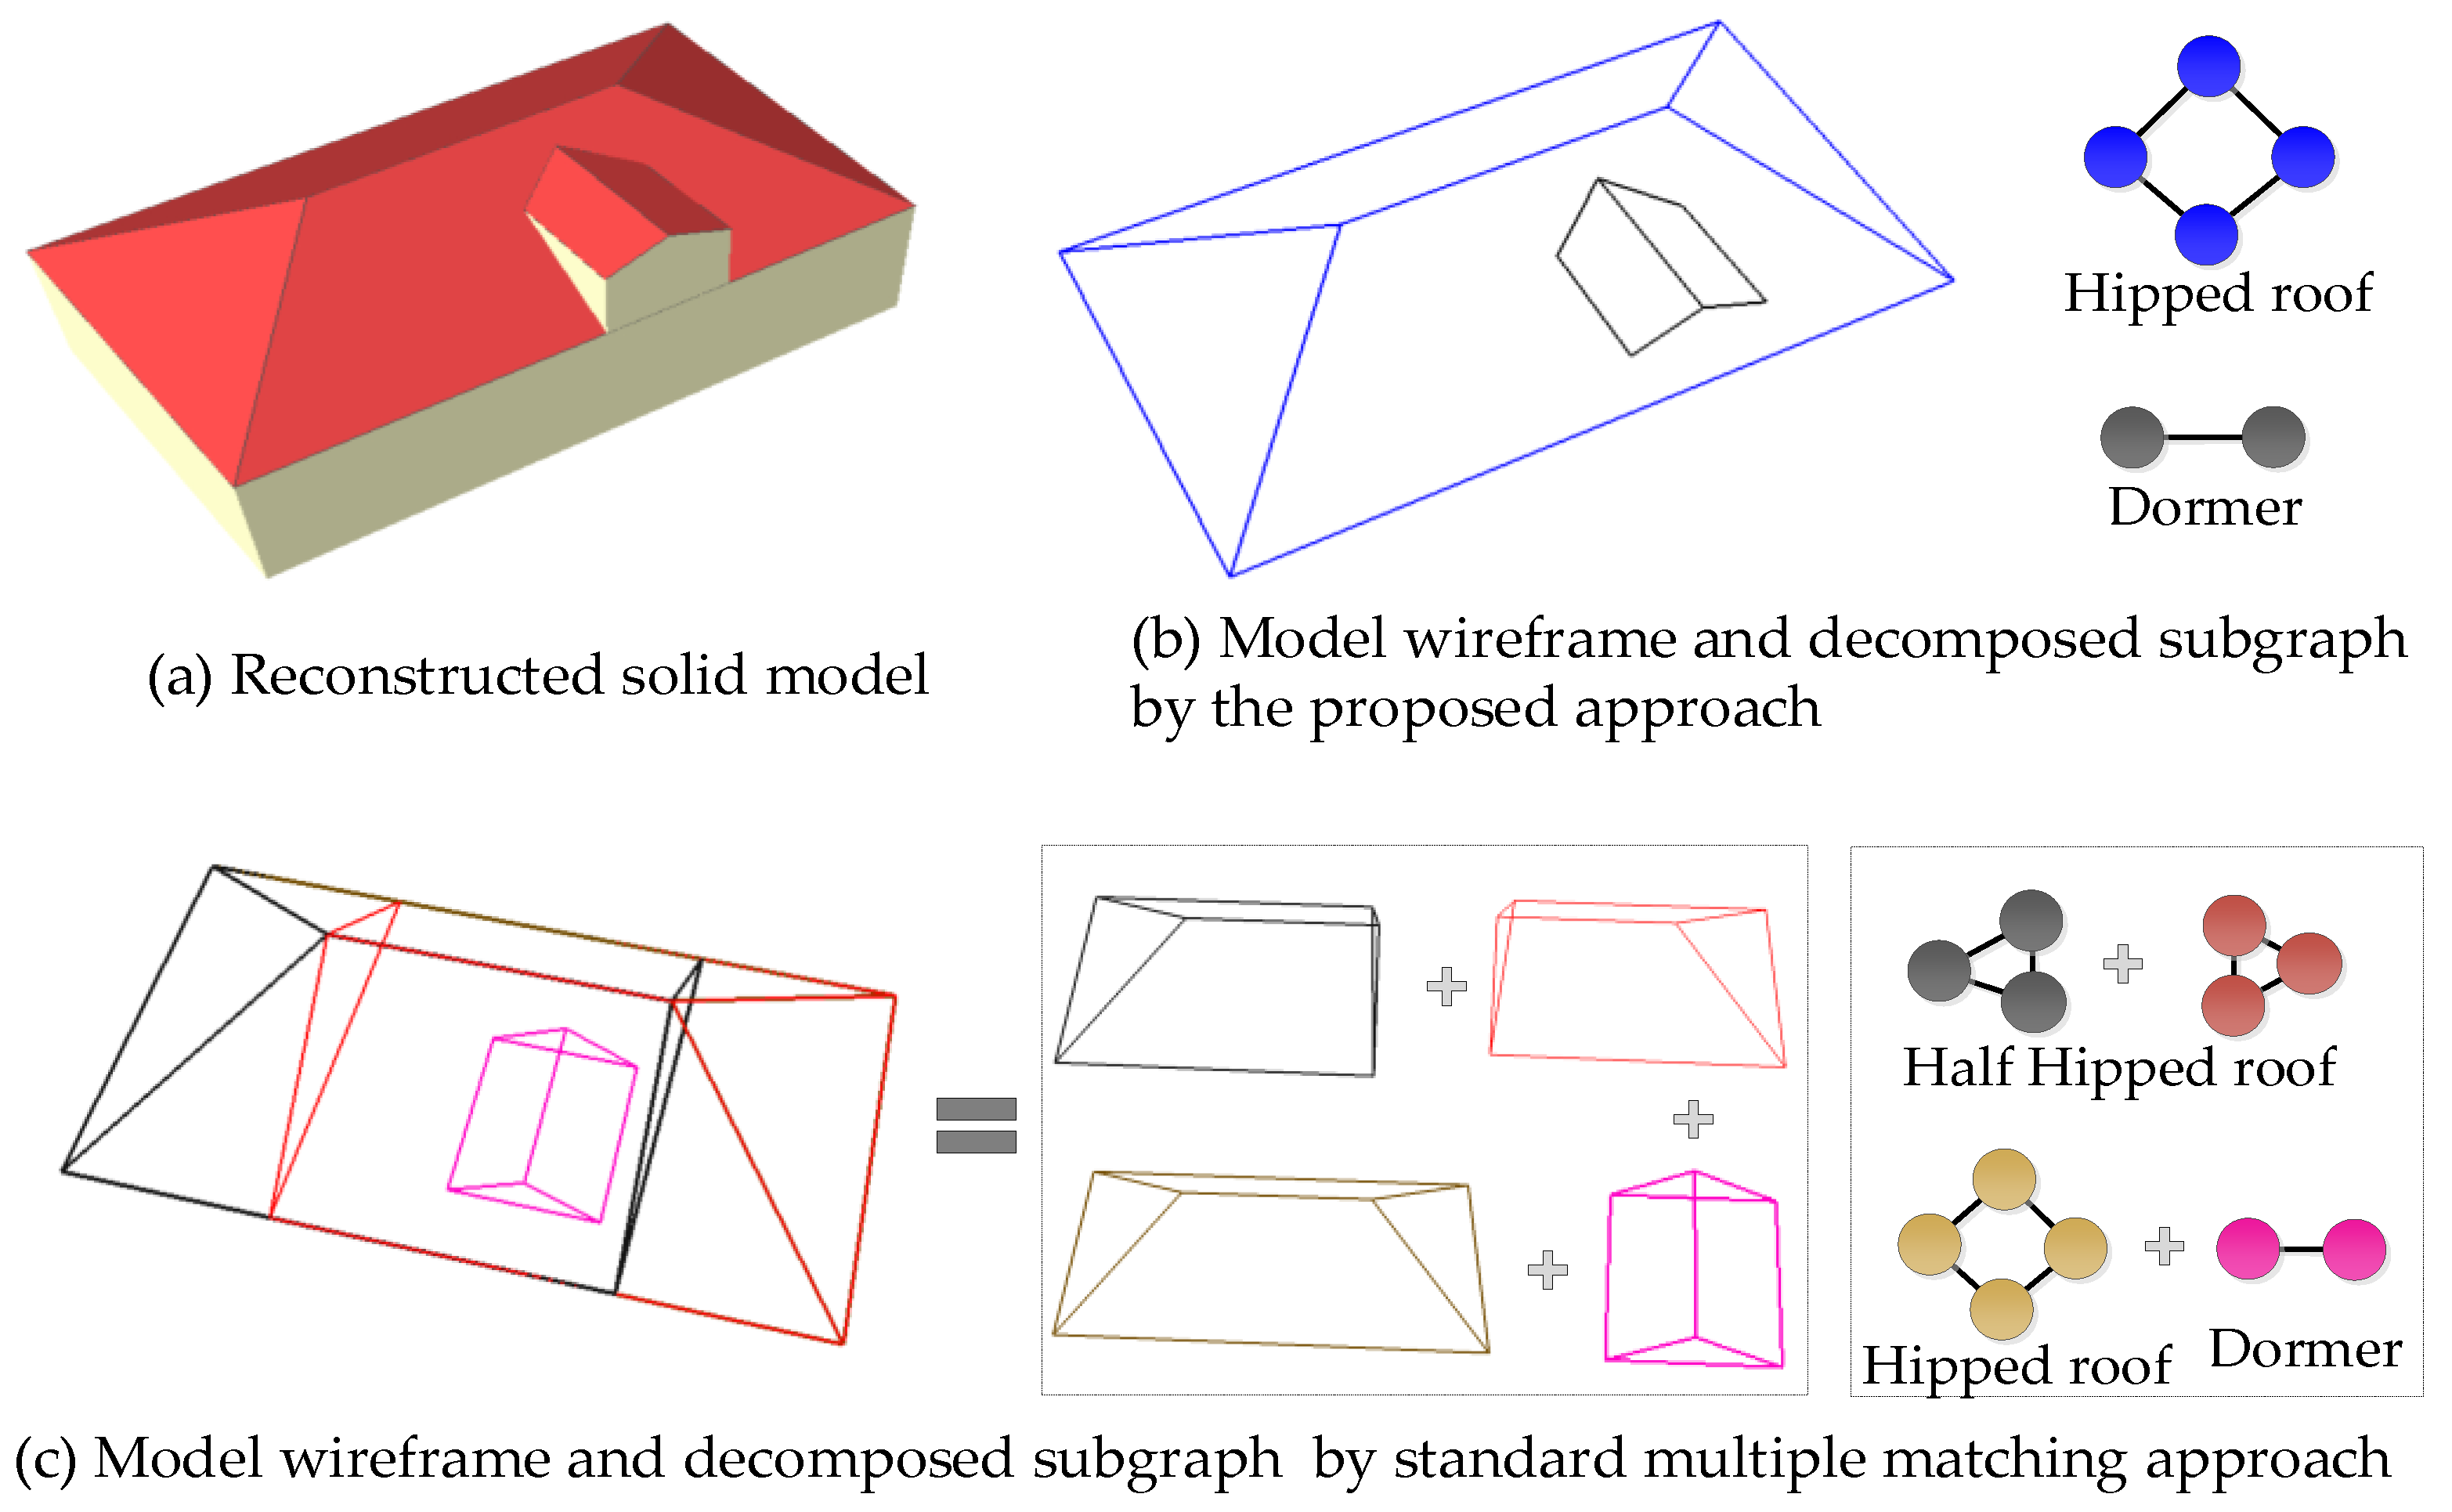
In this section, the decomposed building subparts by the proposed approach, as shown in Figure 10, are compared with the commonly used building reconstruction methods. These different 3D models generated from the same compound building proves our novelty.
It can be seen from part (b) of Figure 10 that the proposed approach can achieve more unambiguous and meaningful building subparts. Verma et al. [51] used an exhaustive search to fit the point clouds to the best matched predefined simple GU, GL, and GI models, as shown in part (c). The final matched model is limited to a simple polygon model and cannot be used flexibly because it requires a more complex building library to be defined in advance. Xiong et al. [5] defined an improved roof topology graph to reconstruct 3D building models and, achieved the inner and outer corners from the concurrent planes or boundary points, thereby forming a combined building model linked to all inner and outer corners, as shown in part (d). It turns out to be more adaptive than similar work [77]. However, it is difficult to obtain the topological relationship of different corners and connected lines. The generated geometric models by minimum cycle analysis need to be checked because a corner may not be expressed or matched by the predefined minimum cycles. In addition, the semantics of the matched roof components are always omitted. Differing from the aforementioned approaches, the proposed automatic 3D modeling approach can reconstruct building semantic subparts, which can be easily interpreted as building structures. The decomposition results in Figure 10b are different hipped roofs, which can be easily inferred by the human being. Each roof subpart is a combination of parametric planar primitives and can be further used to assemble a hierarchy-tree of a building.
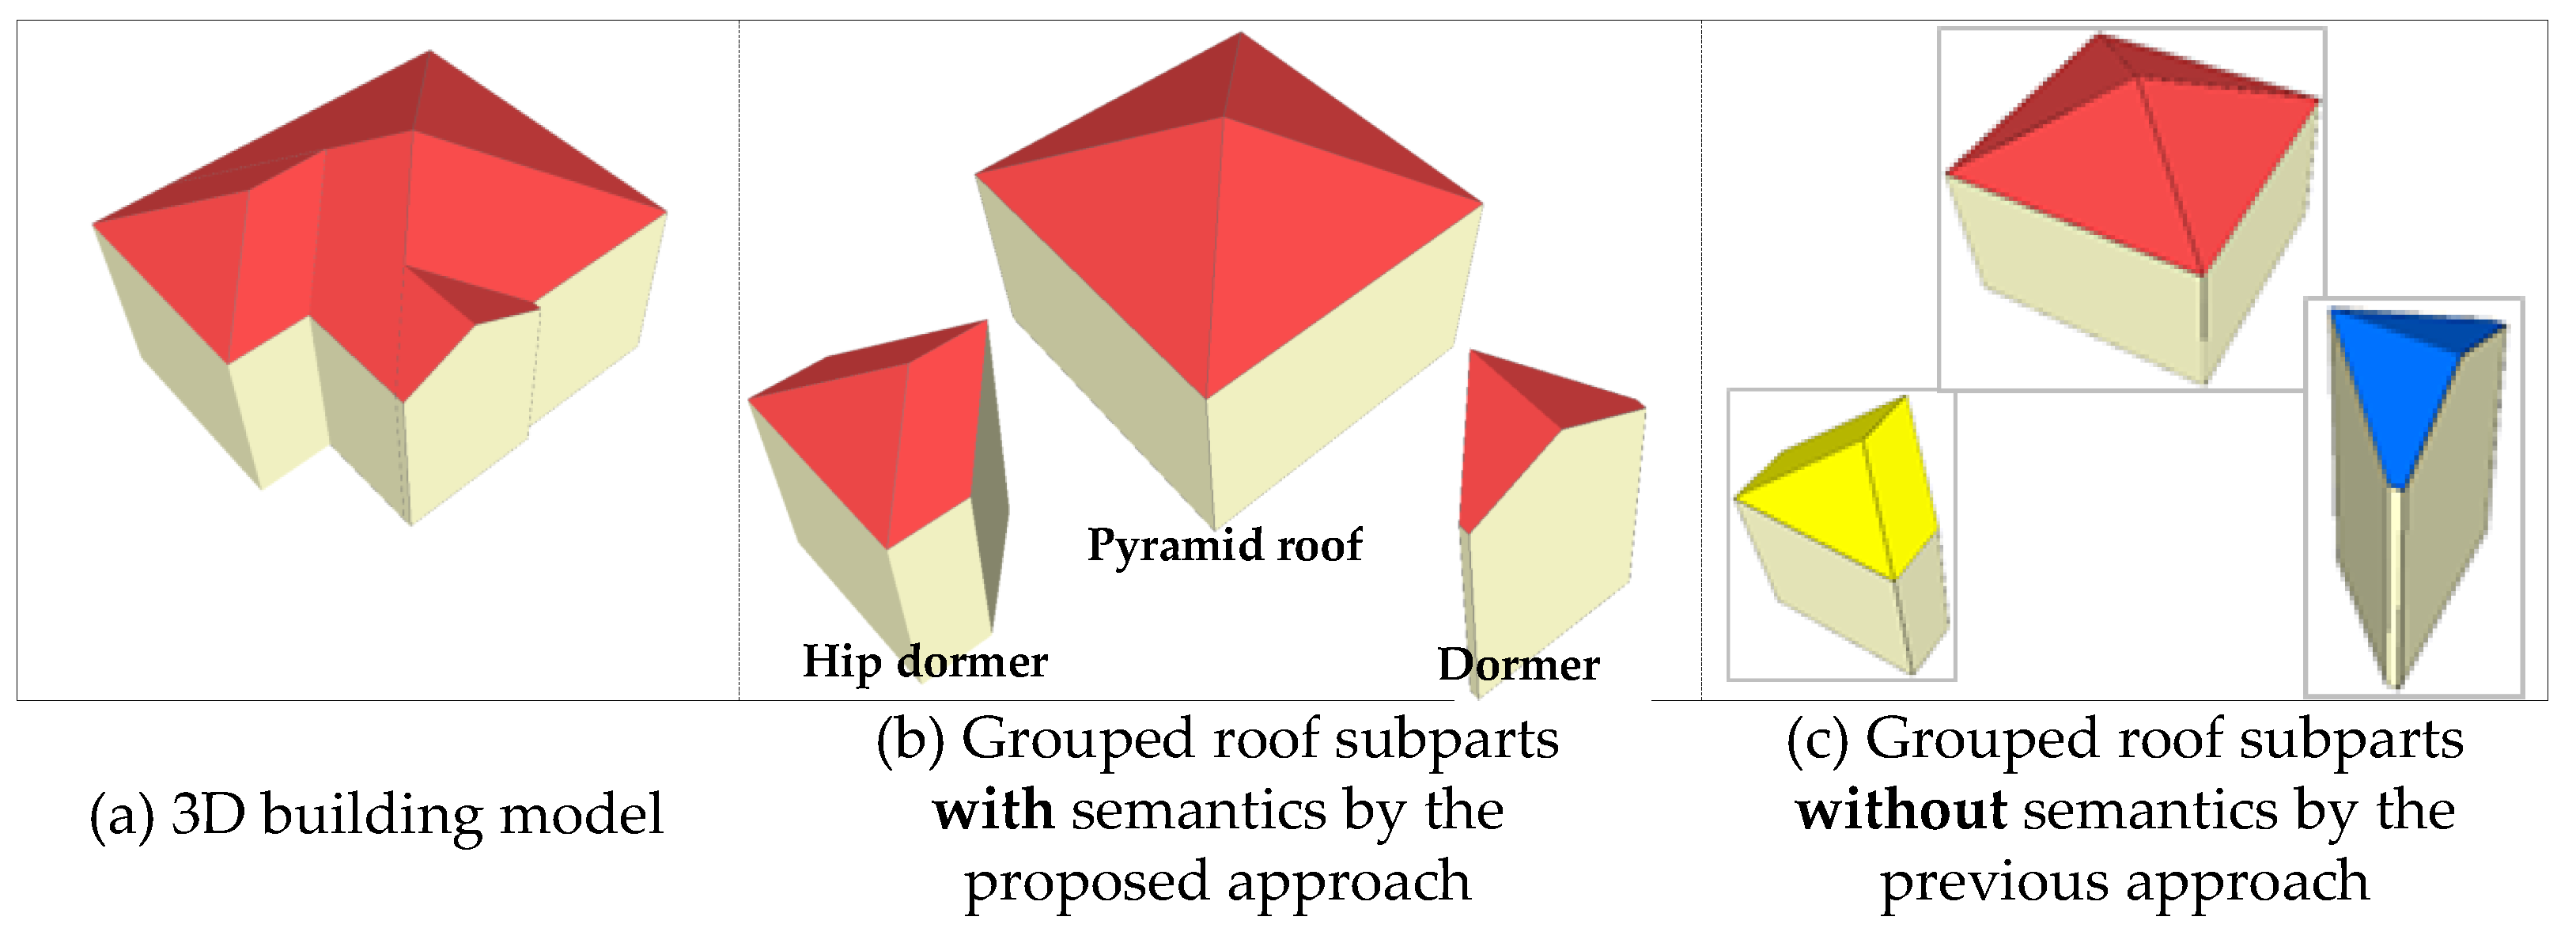
Different from the previous approach [48], we have made improvements in the current status to generate structural building models with the introduced semantics. The plane semantics are added for the roof connection graph, semantic decomposition, and roof subparts refinement to generate 3D building models; it is more helpful to reconstruct structural building subparts. The decomposed results can be interpreted as different semantic structures, where the semantics can be inferred from the largest number of semantic planes. By introducing the semantics into the iterative decomposition and grouping algorithm, it can be easily extended to house modeling from a multi-source point cloud, e.g., the ground-based point cloud can provide more details of building façades, thus, we can reconstruct more refined house models in LOD3, LOD4 by combining these different points cloud. A visual comparison on the proposed and the previous approach is shown in Figure 11, and the difference and improvement are that whether they can interpret the grouped roof subparts as different semantic structures.
Furthermore, the decomposed roof subparts we proposed are basic building units without overlapping elements in the reconstruction process and can produce more unambiguous 3D models, as presented in Figure 12.
It can be seen from Figure 12b that the generated 3D building subparts by the proposed approach can avoid multiple matching of the same building element. For these standard matched methods [5,77], the roof topology graph defined by different forms is searched from the predefined library and decomposed into elementary graphs. These automatically recognized subgraphs enable us to assign semantics to all extracted building planar primitives and assemble them into an appropriate 3D model. However, there will inevitably be a problem, that is, the standard-matching reconstruction methods rebuild the same roof elements repeatedly, resulting in overlapping roof primitives, as shown in the mid of Figure 12c.

5.2. Performance Analysis of Multi-Label Energy Optimization

To further investigate the effects of the global energy-based optimization procedure, we have calculated the iterations and runtimes, as shown in Table 2.
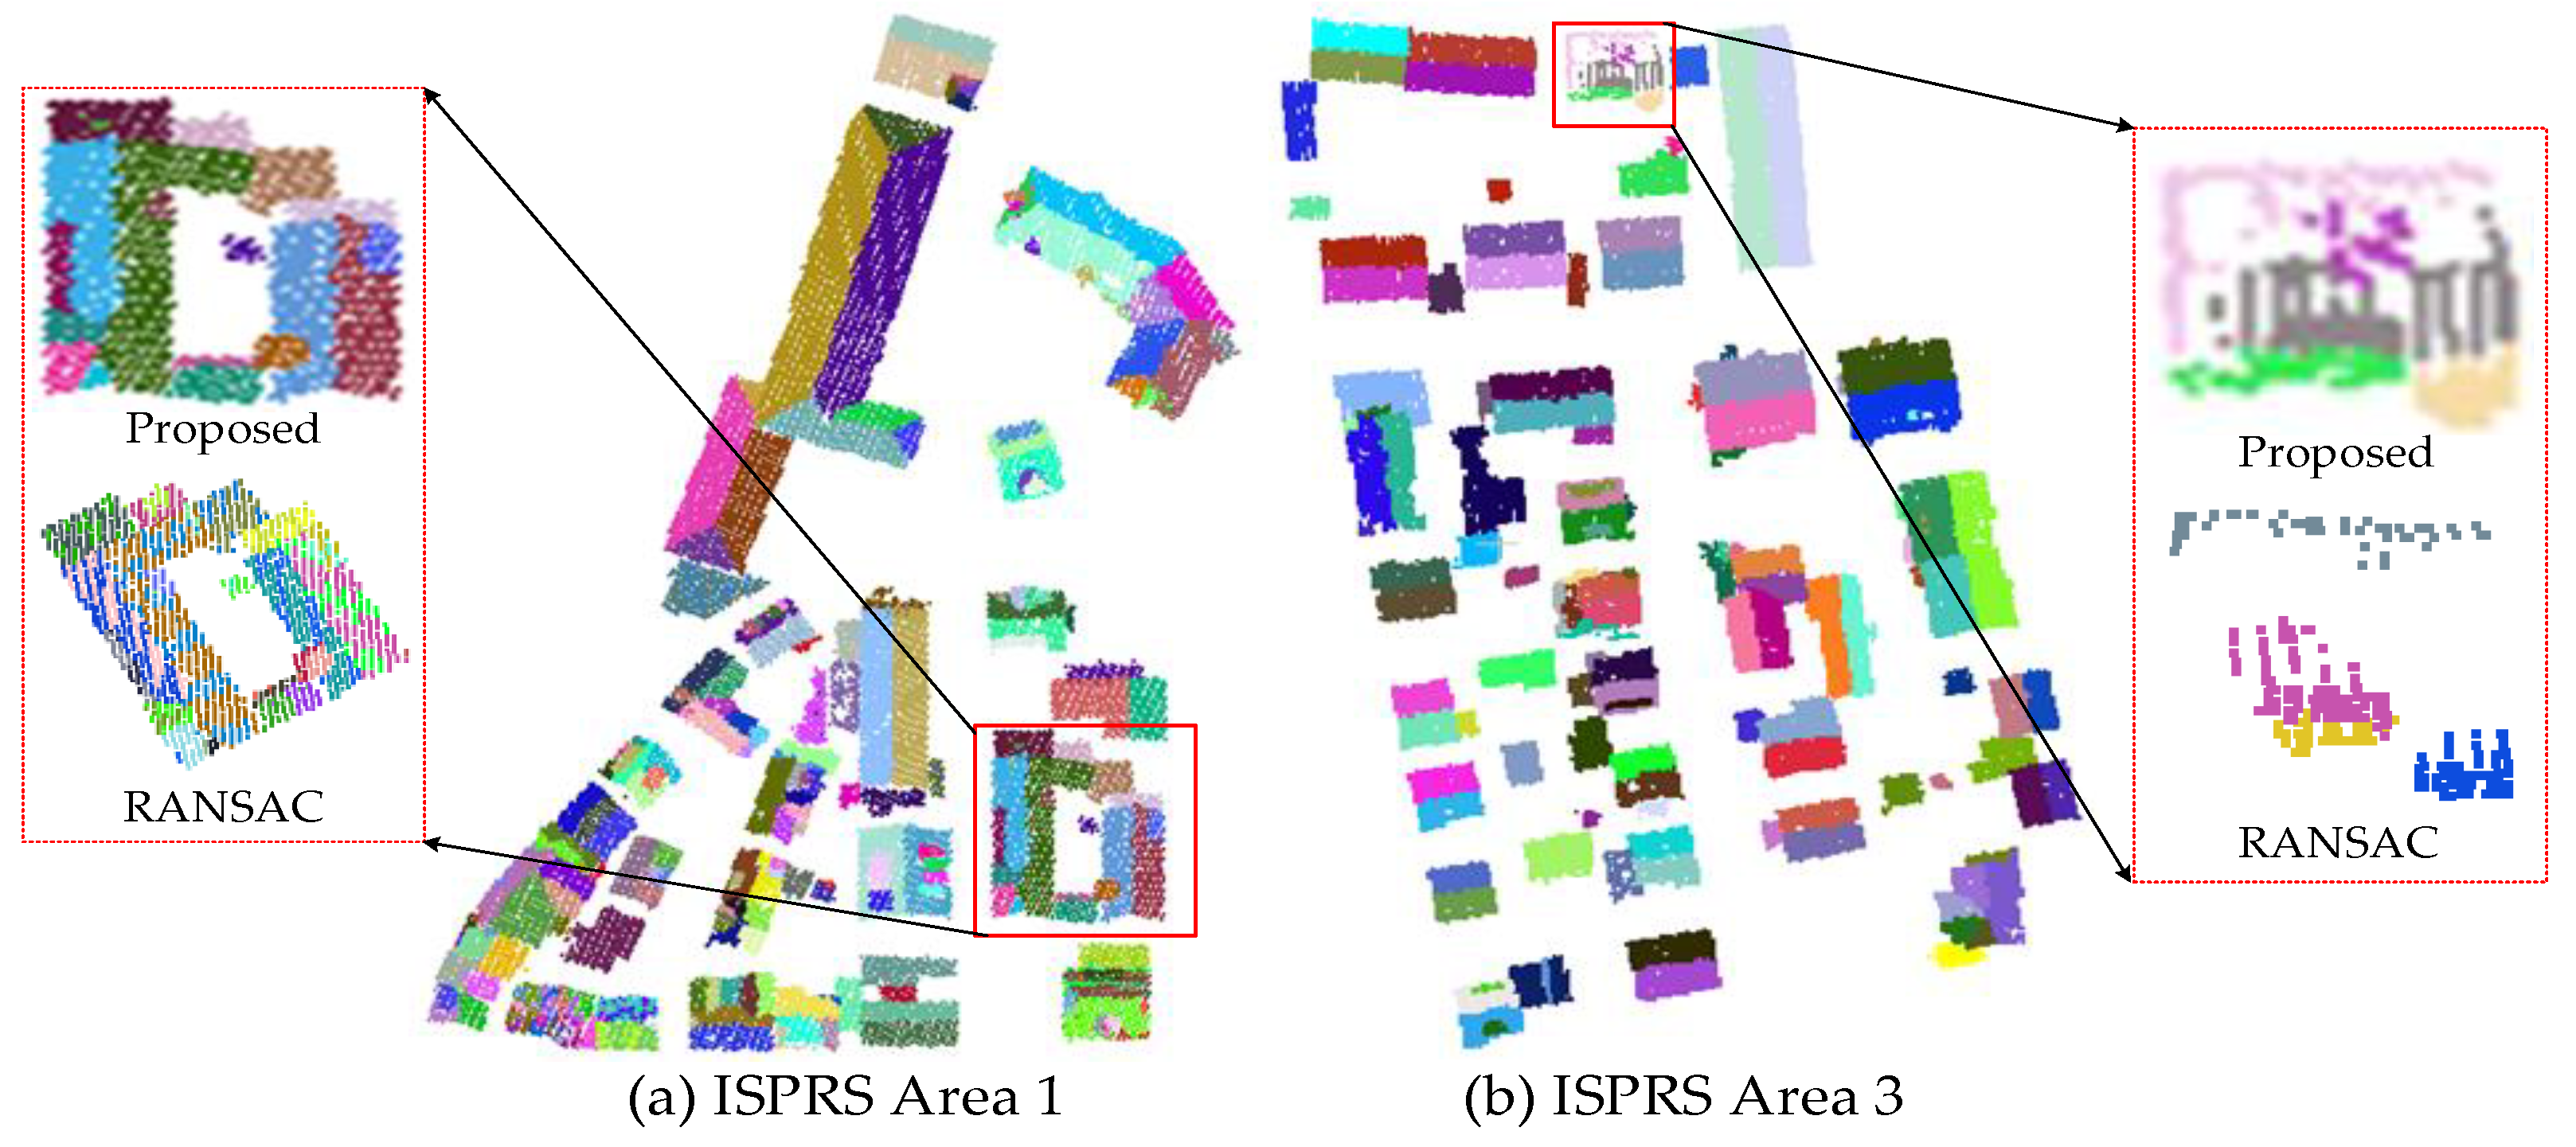
It can be found from Table 2 that the number of iterations is located in a lower range, which means that the designed cost functions are stable and balanced. Along with the iteration, the energy will be sharply dropped, leading to a quick convergence. Compared with the RANSAC plane fitting, the running time is relatively long as the optimization is performed on each point. One possible improvement is to change the assignment issue from “point-to-plane” to “supervoxel-to-plane”. Moreover, the results of roof plane extraction in Area 1 and Area 3 are compared to a traditional multi-model fitting method like RANSAC, as shown in Figure 13.
It can be seen from the Figure 13 that the global energy-optimized approach can be effective to extract roof planes. Compared with a traditional multi-model fitting method like RANSAC, the proposed approach can overcome inconsistencies such as noise and missing data in plane transitions and is more beneficial to construct the adjacent relationship between roof planes.

5.3. Accuracy Assessments on ISPRS Benchmark Dataset

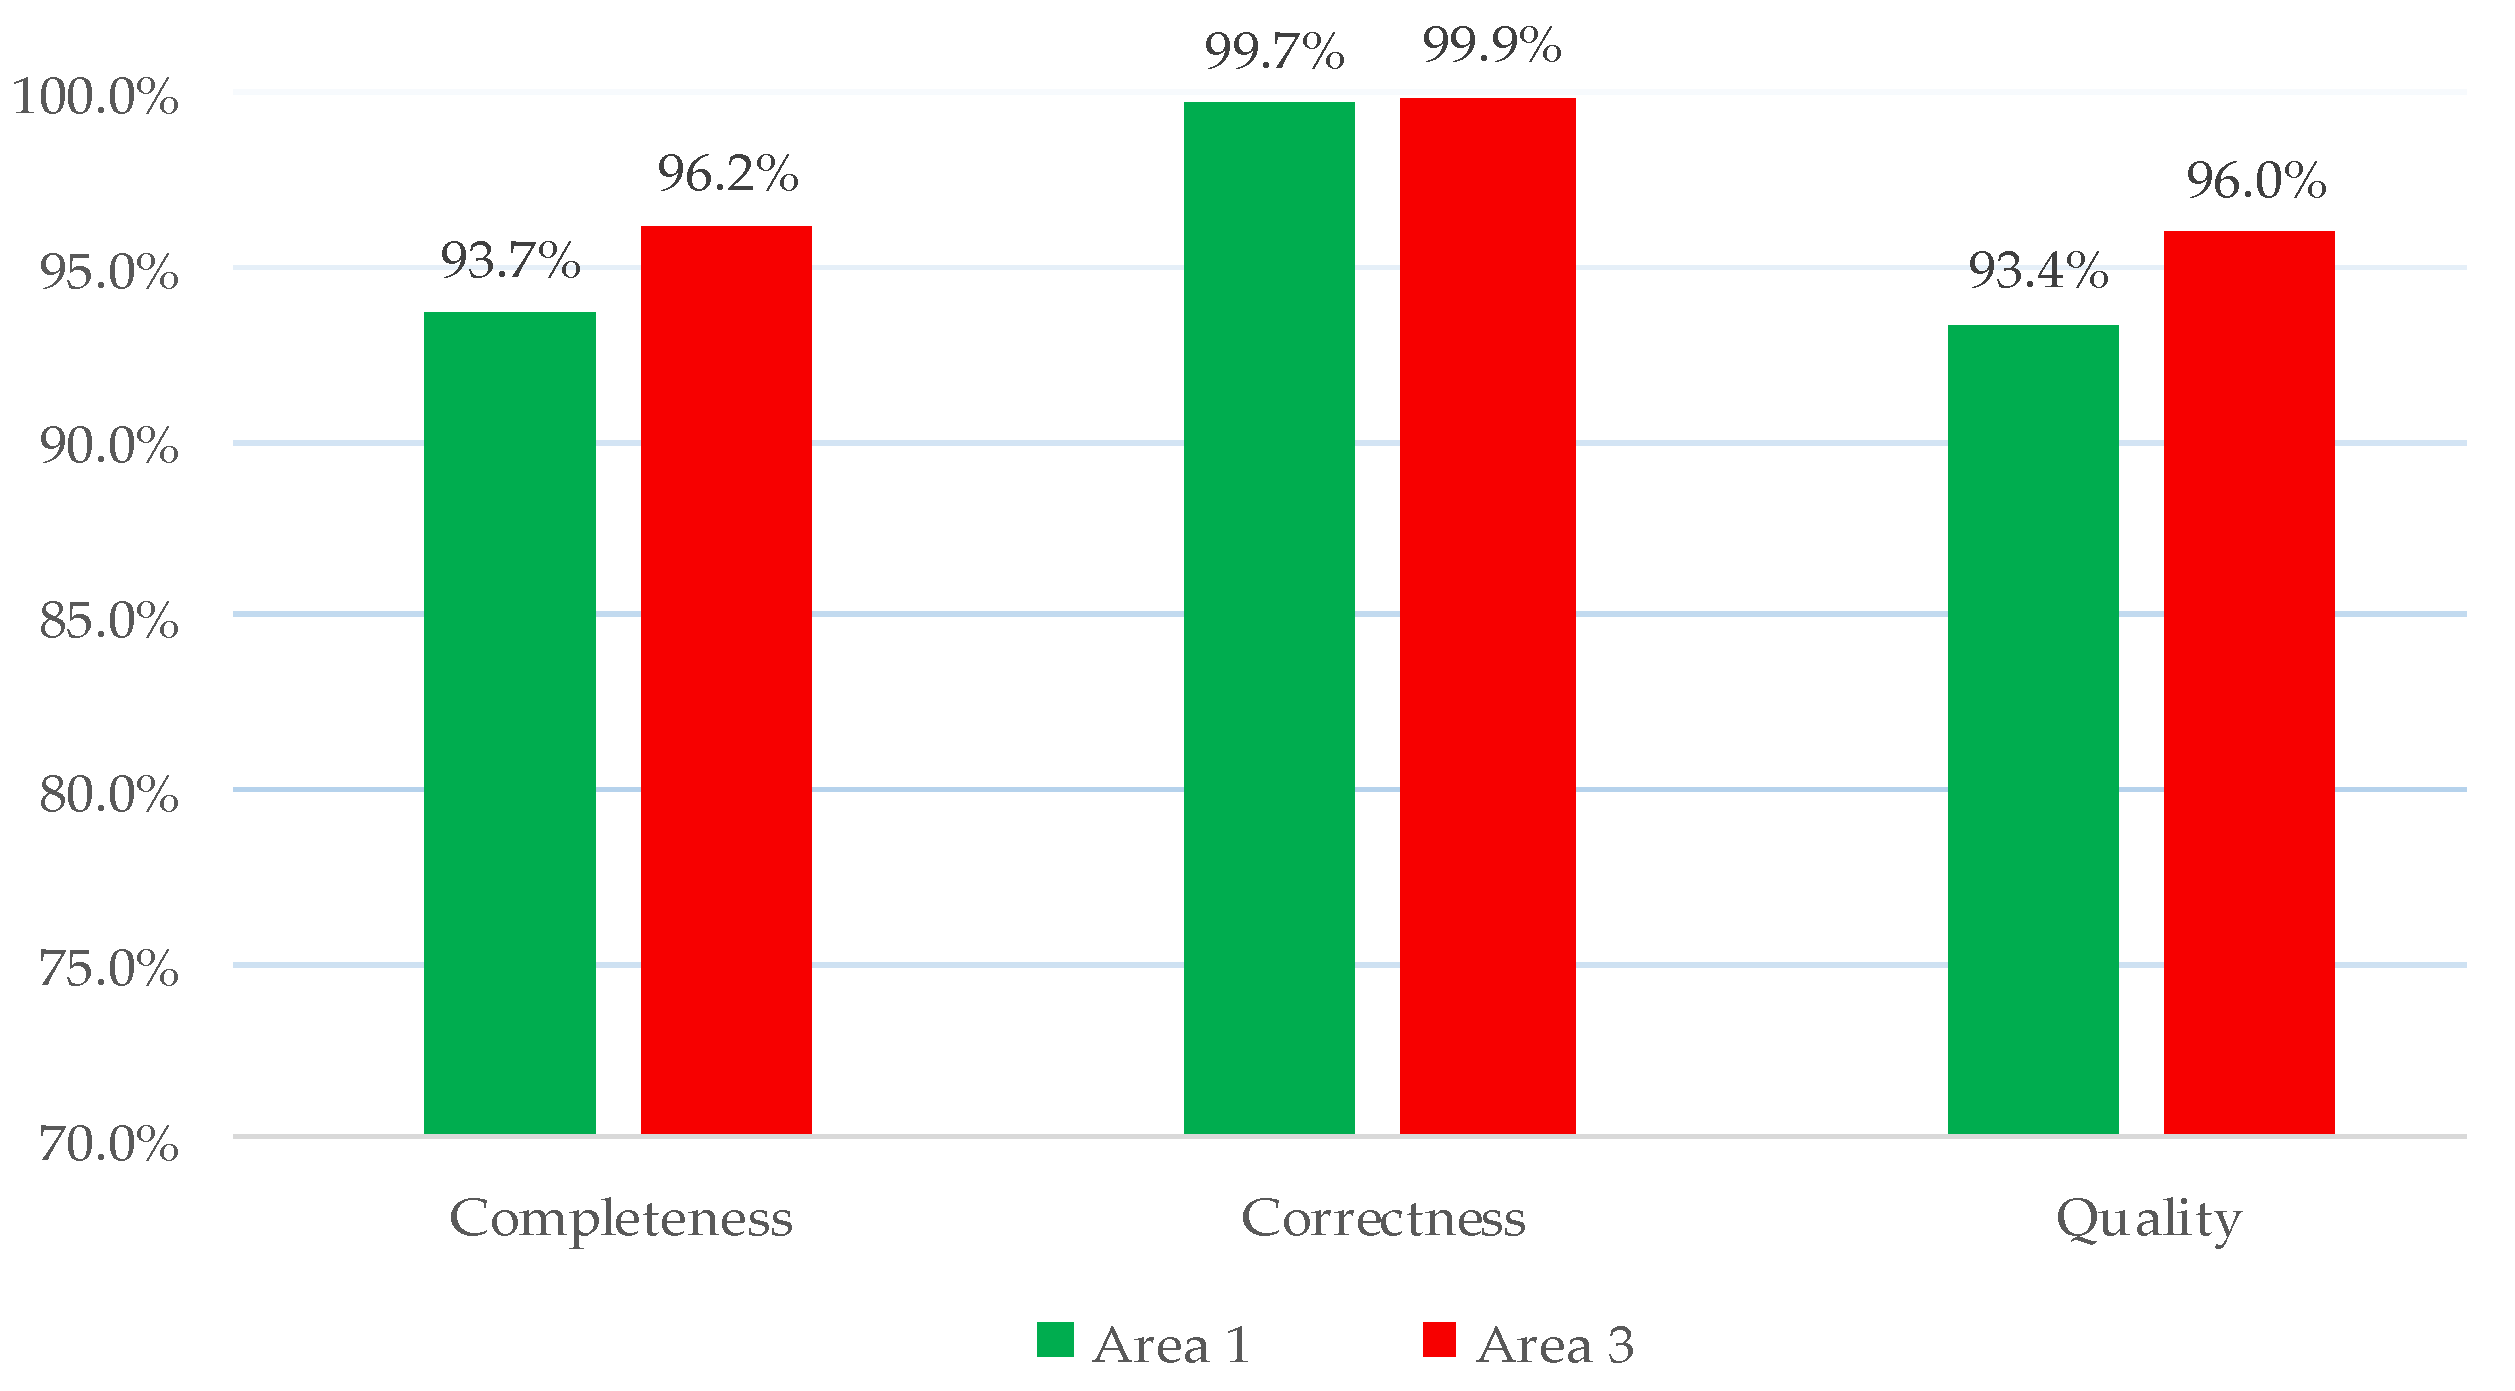
The geometric accuracy of the reconstructed 3D models derived from the benchmark data of Vaihingen in Areas 1 and 3 are evaluated by ISPRS using the standardized validation methods. The metrics of completeness, correctness, and quality, defined by Rutzinger et al. [78] are evaluated based on the mutual overlapping with reference data. The quality results are shown in Figure 14.
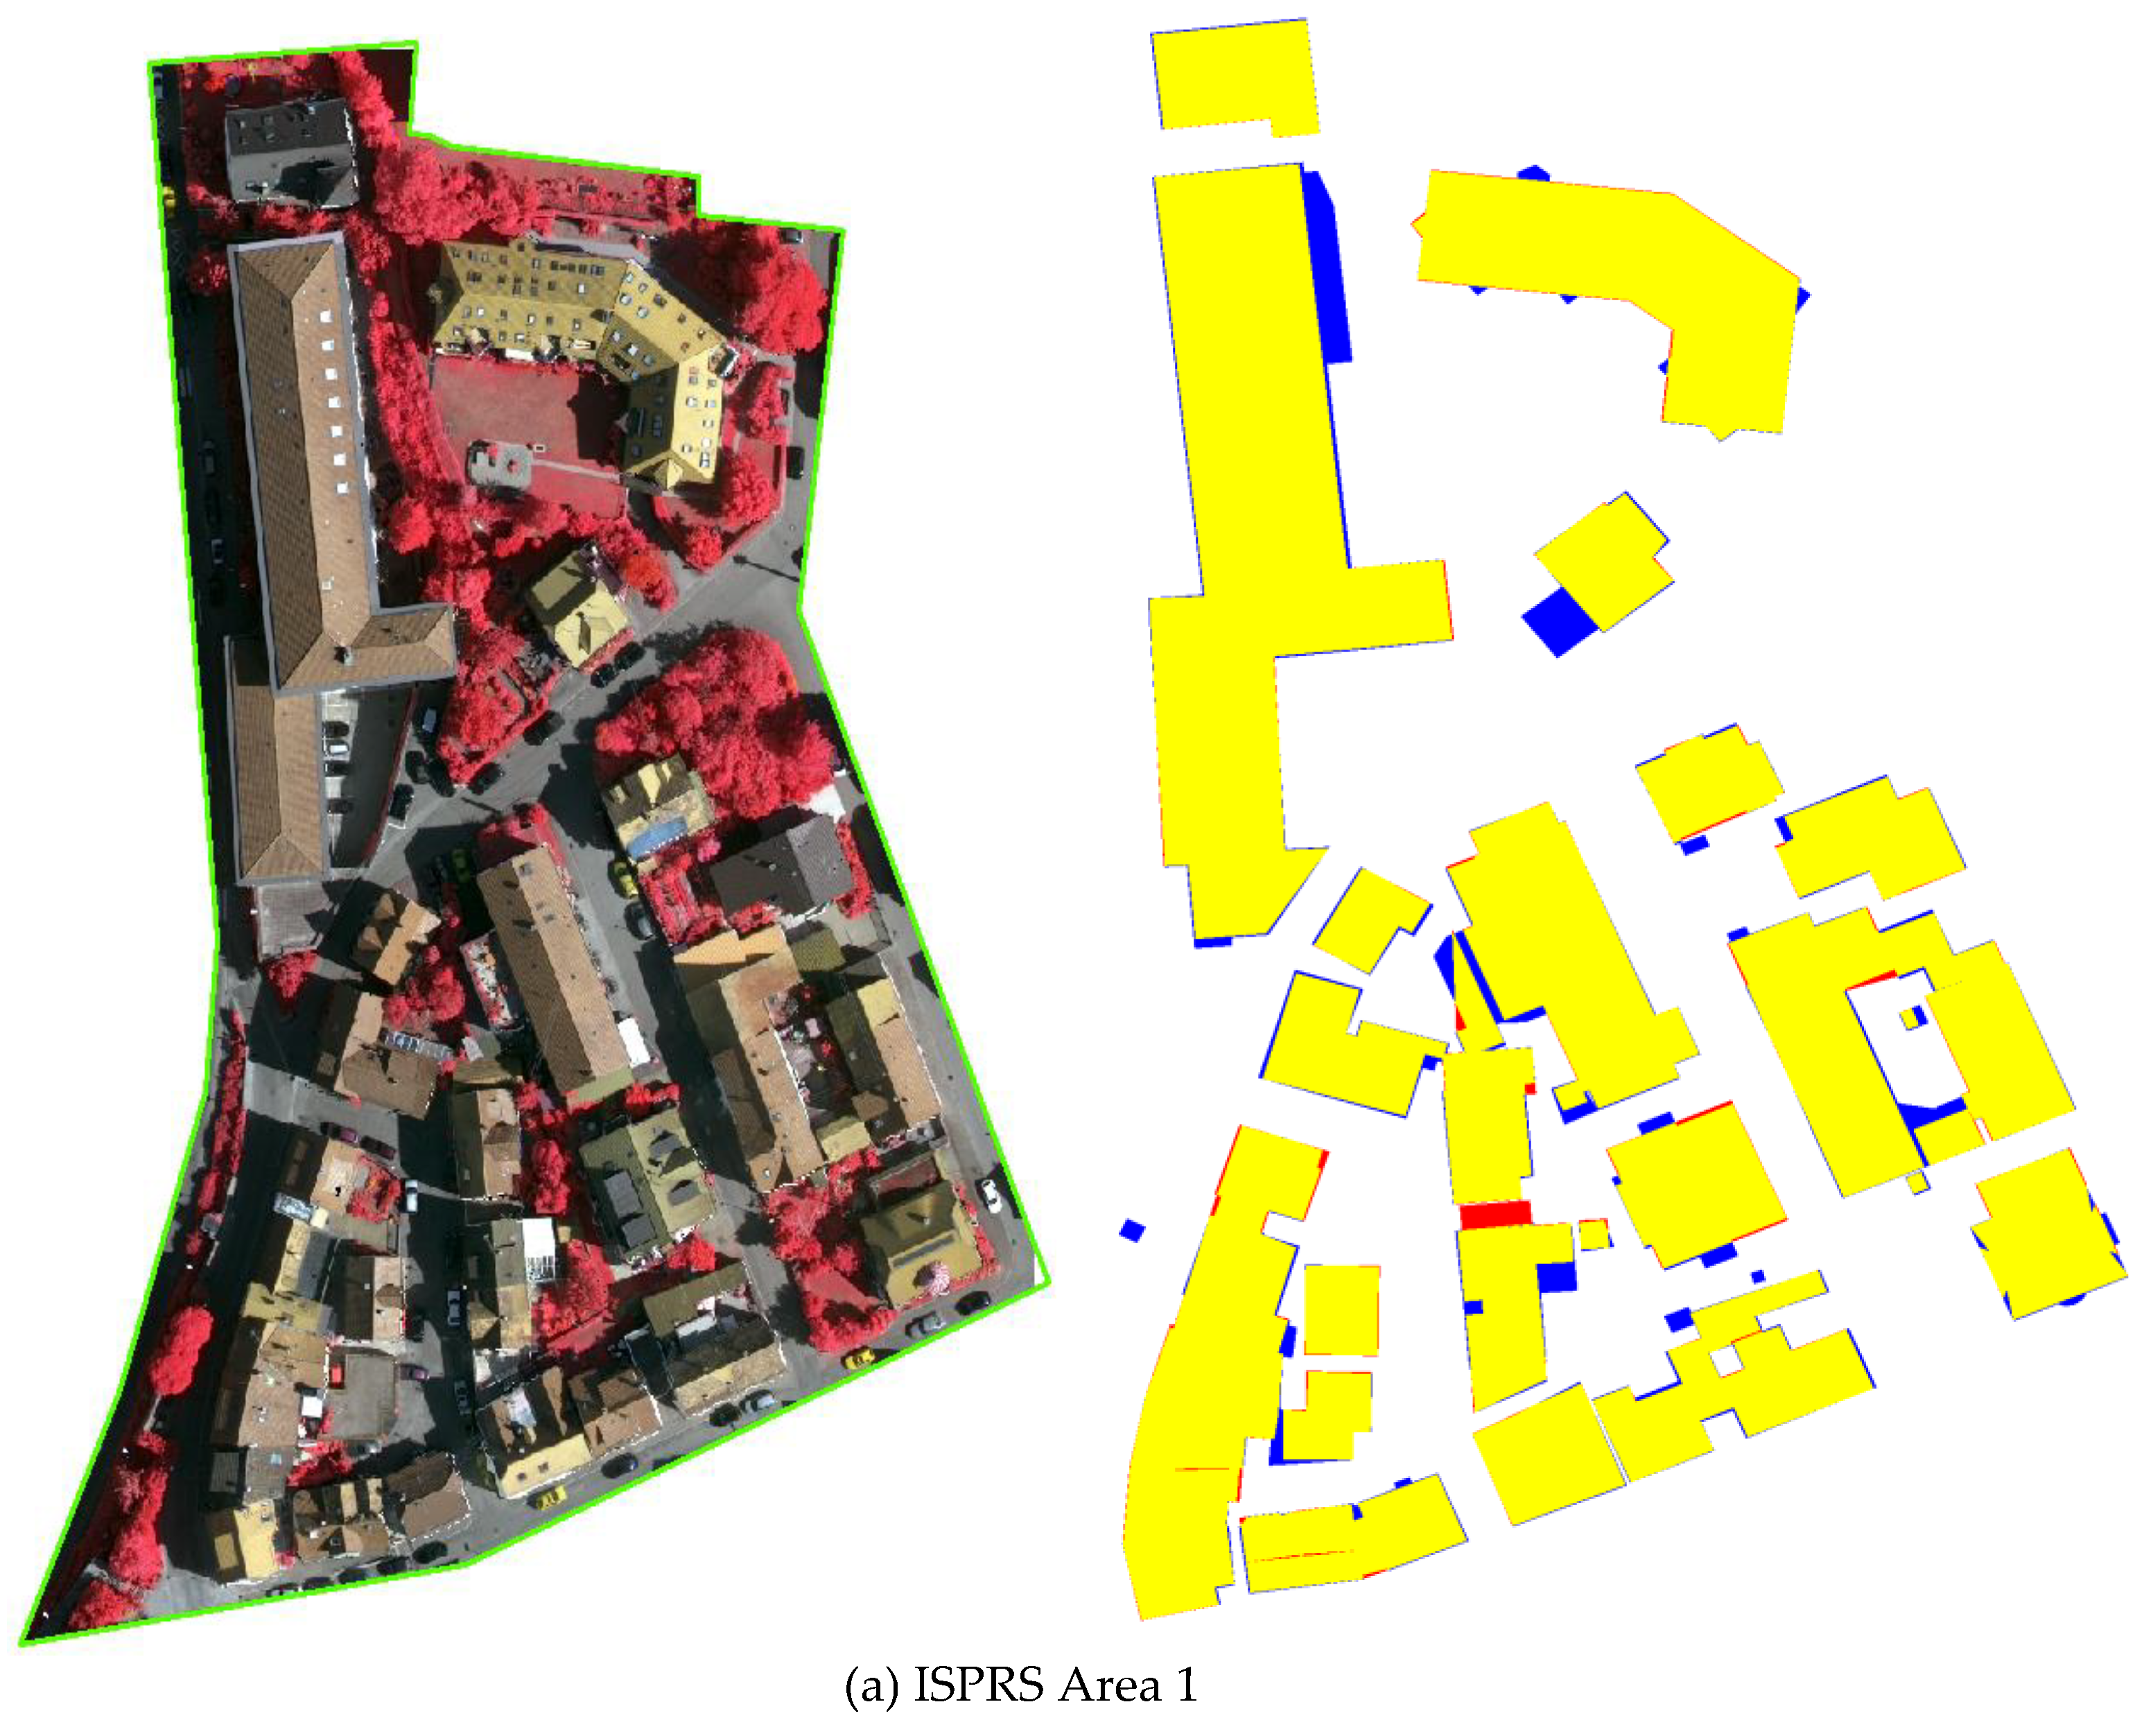
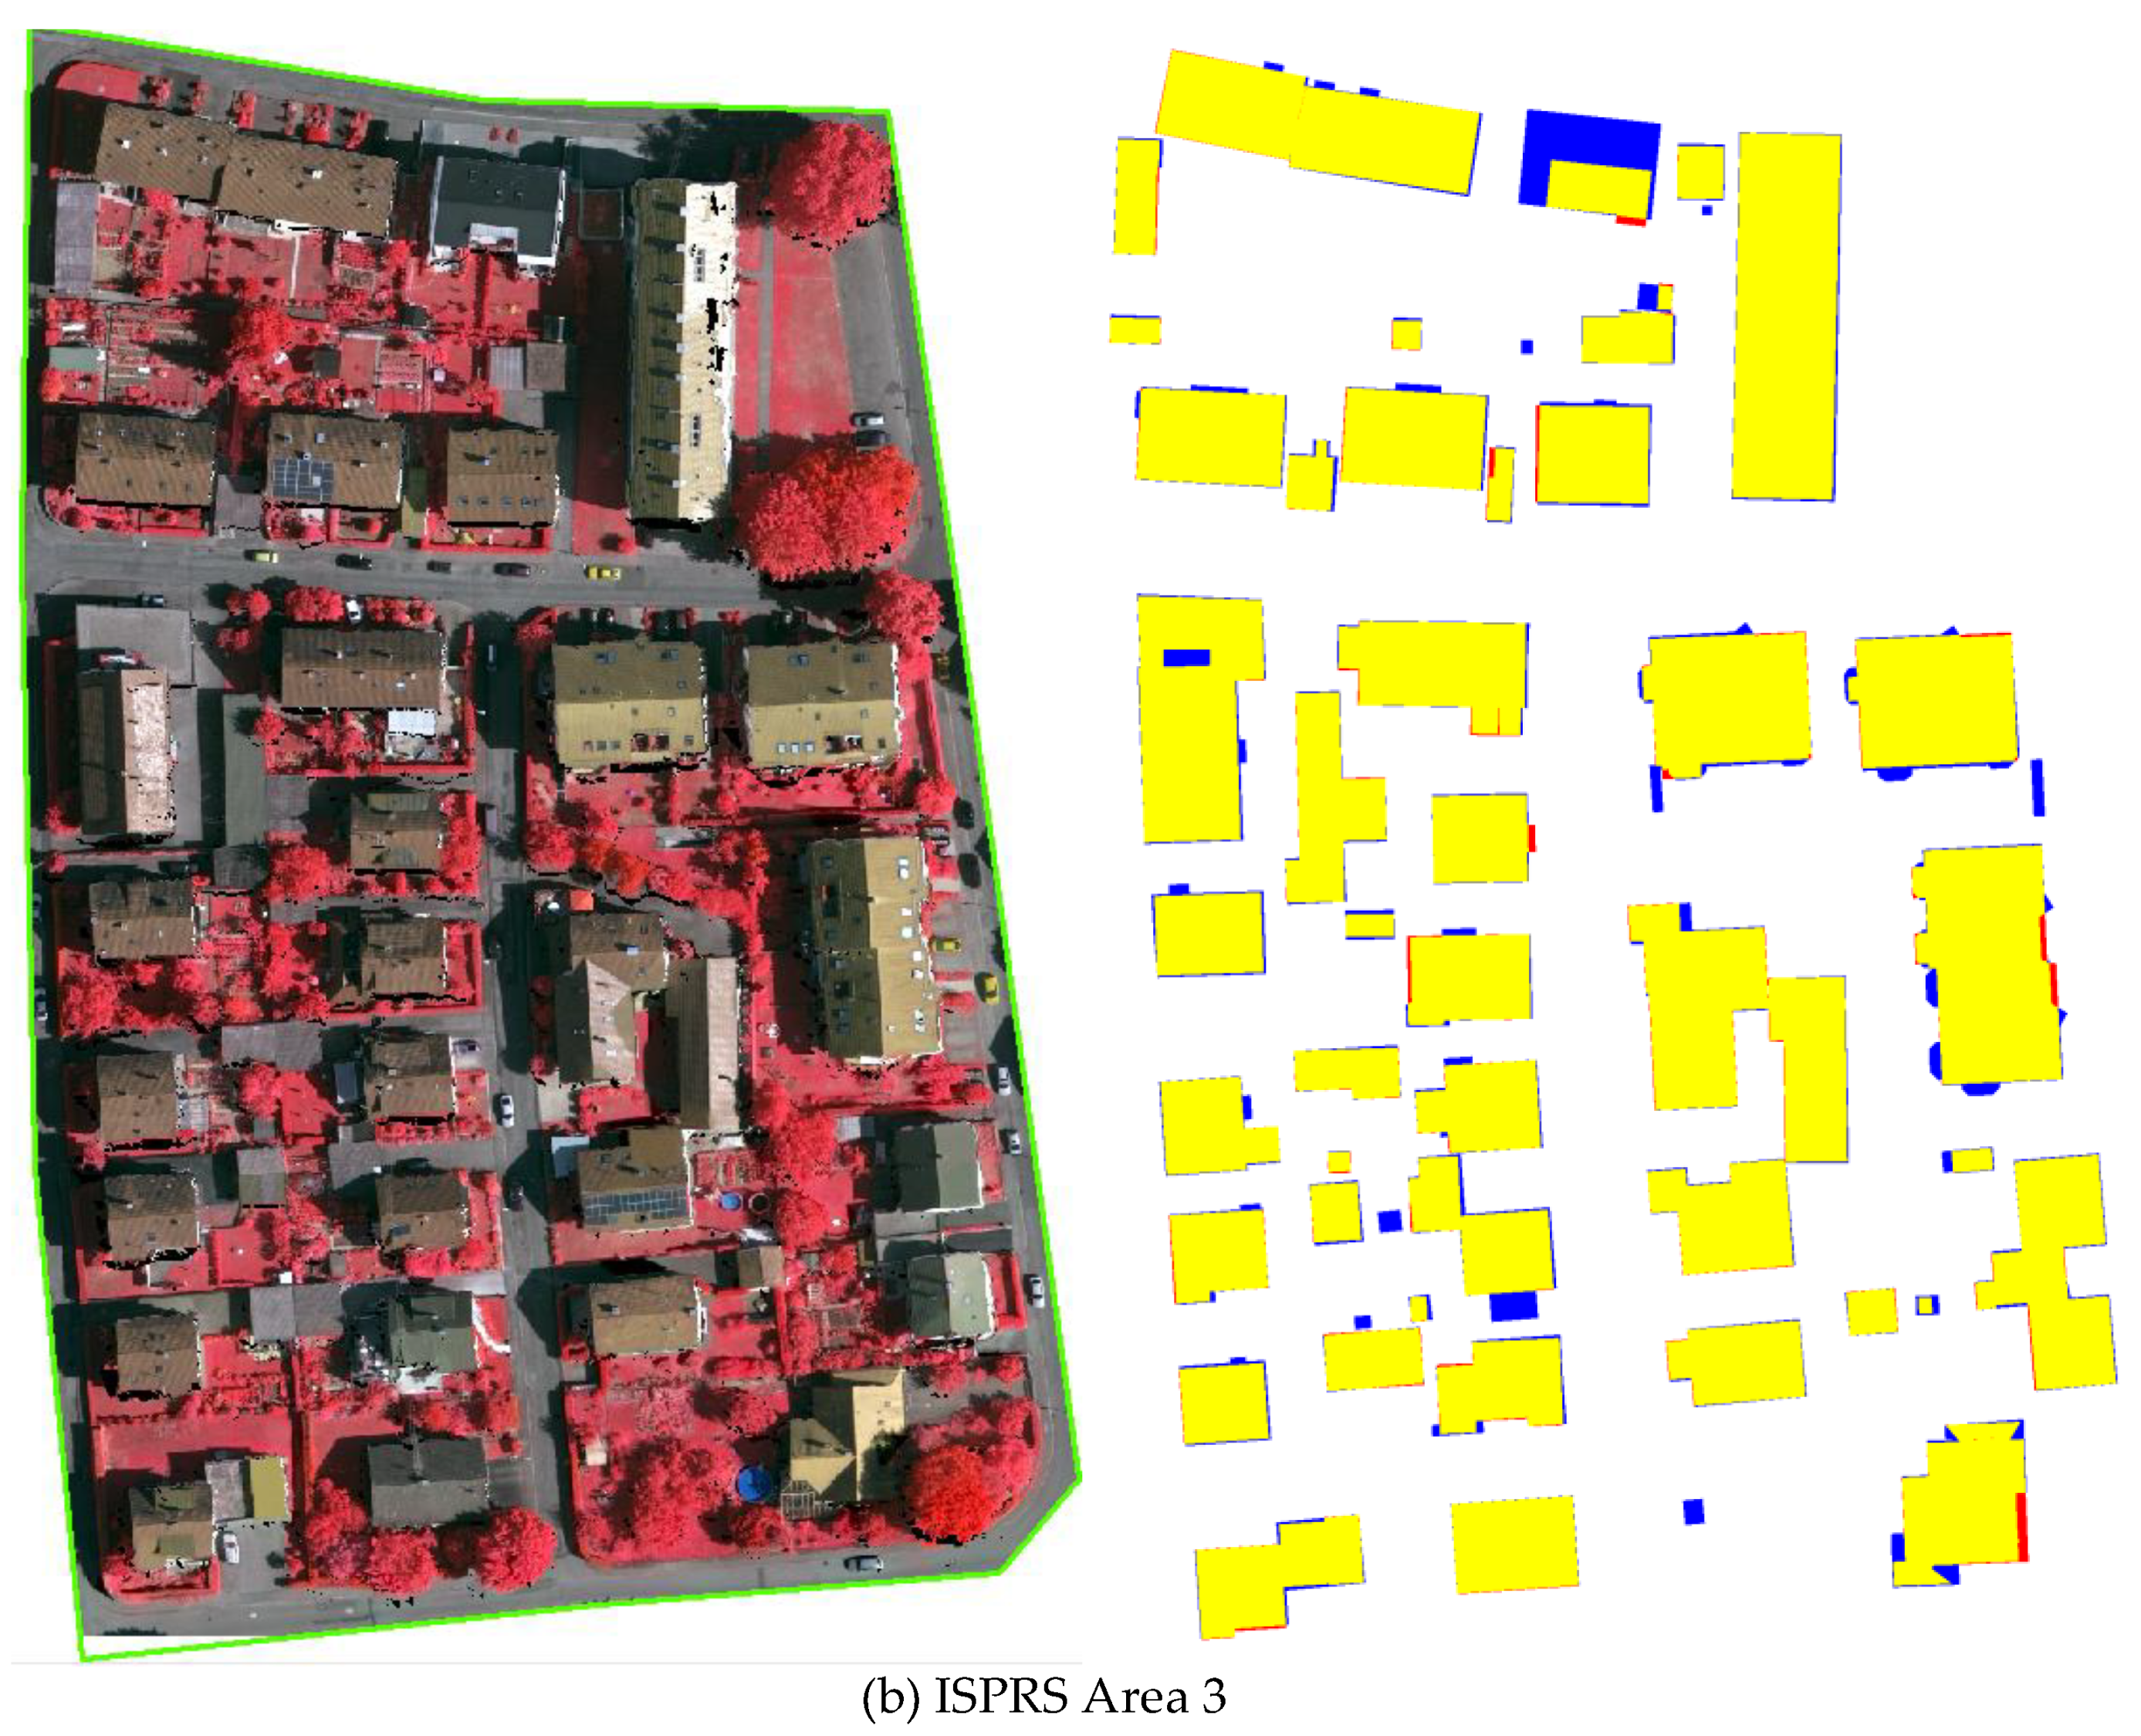
The quality of per-area level for Area 3 reaches 96.0%, while Area 1 large than 93.4%. These high precision results can be benefited from the proposed global optimization, which can preserve the correct segmentation at plane transition regions with sparse points. In addition, the comparison of the reconstructed planes with the reference information is illustrated in Figure 15, where the 3D information has been converted to a label image by ISPRS.
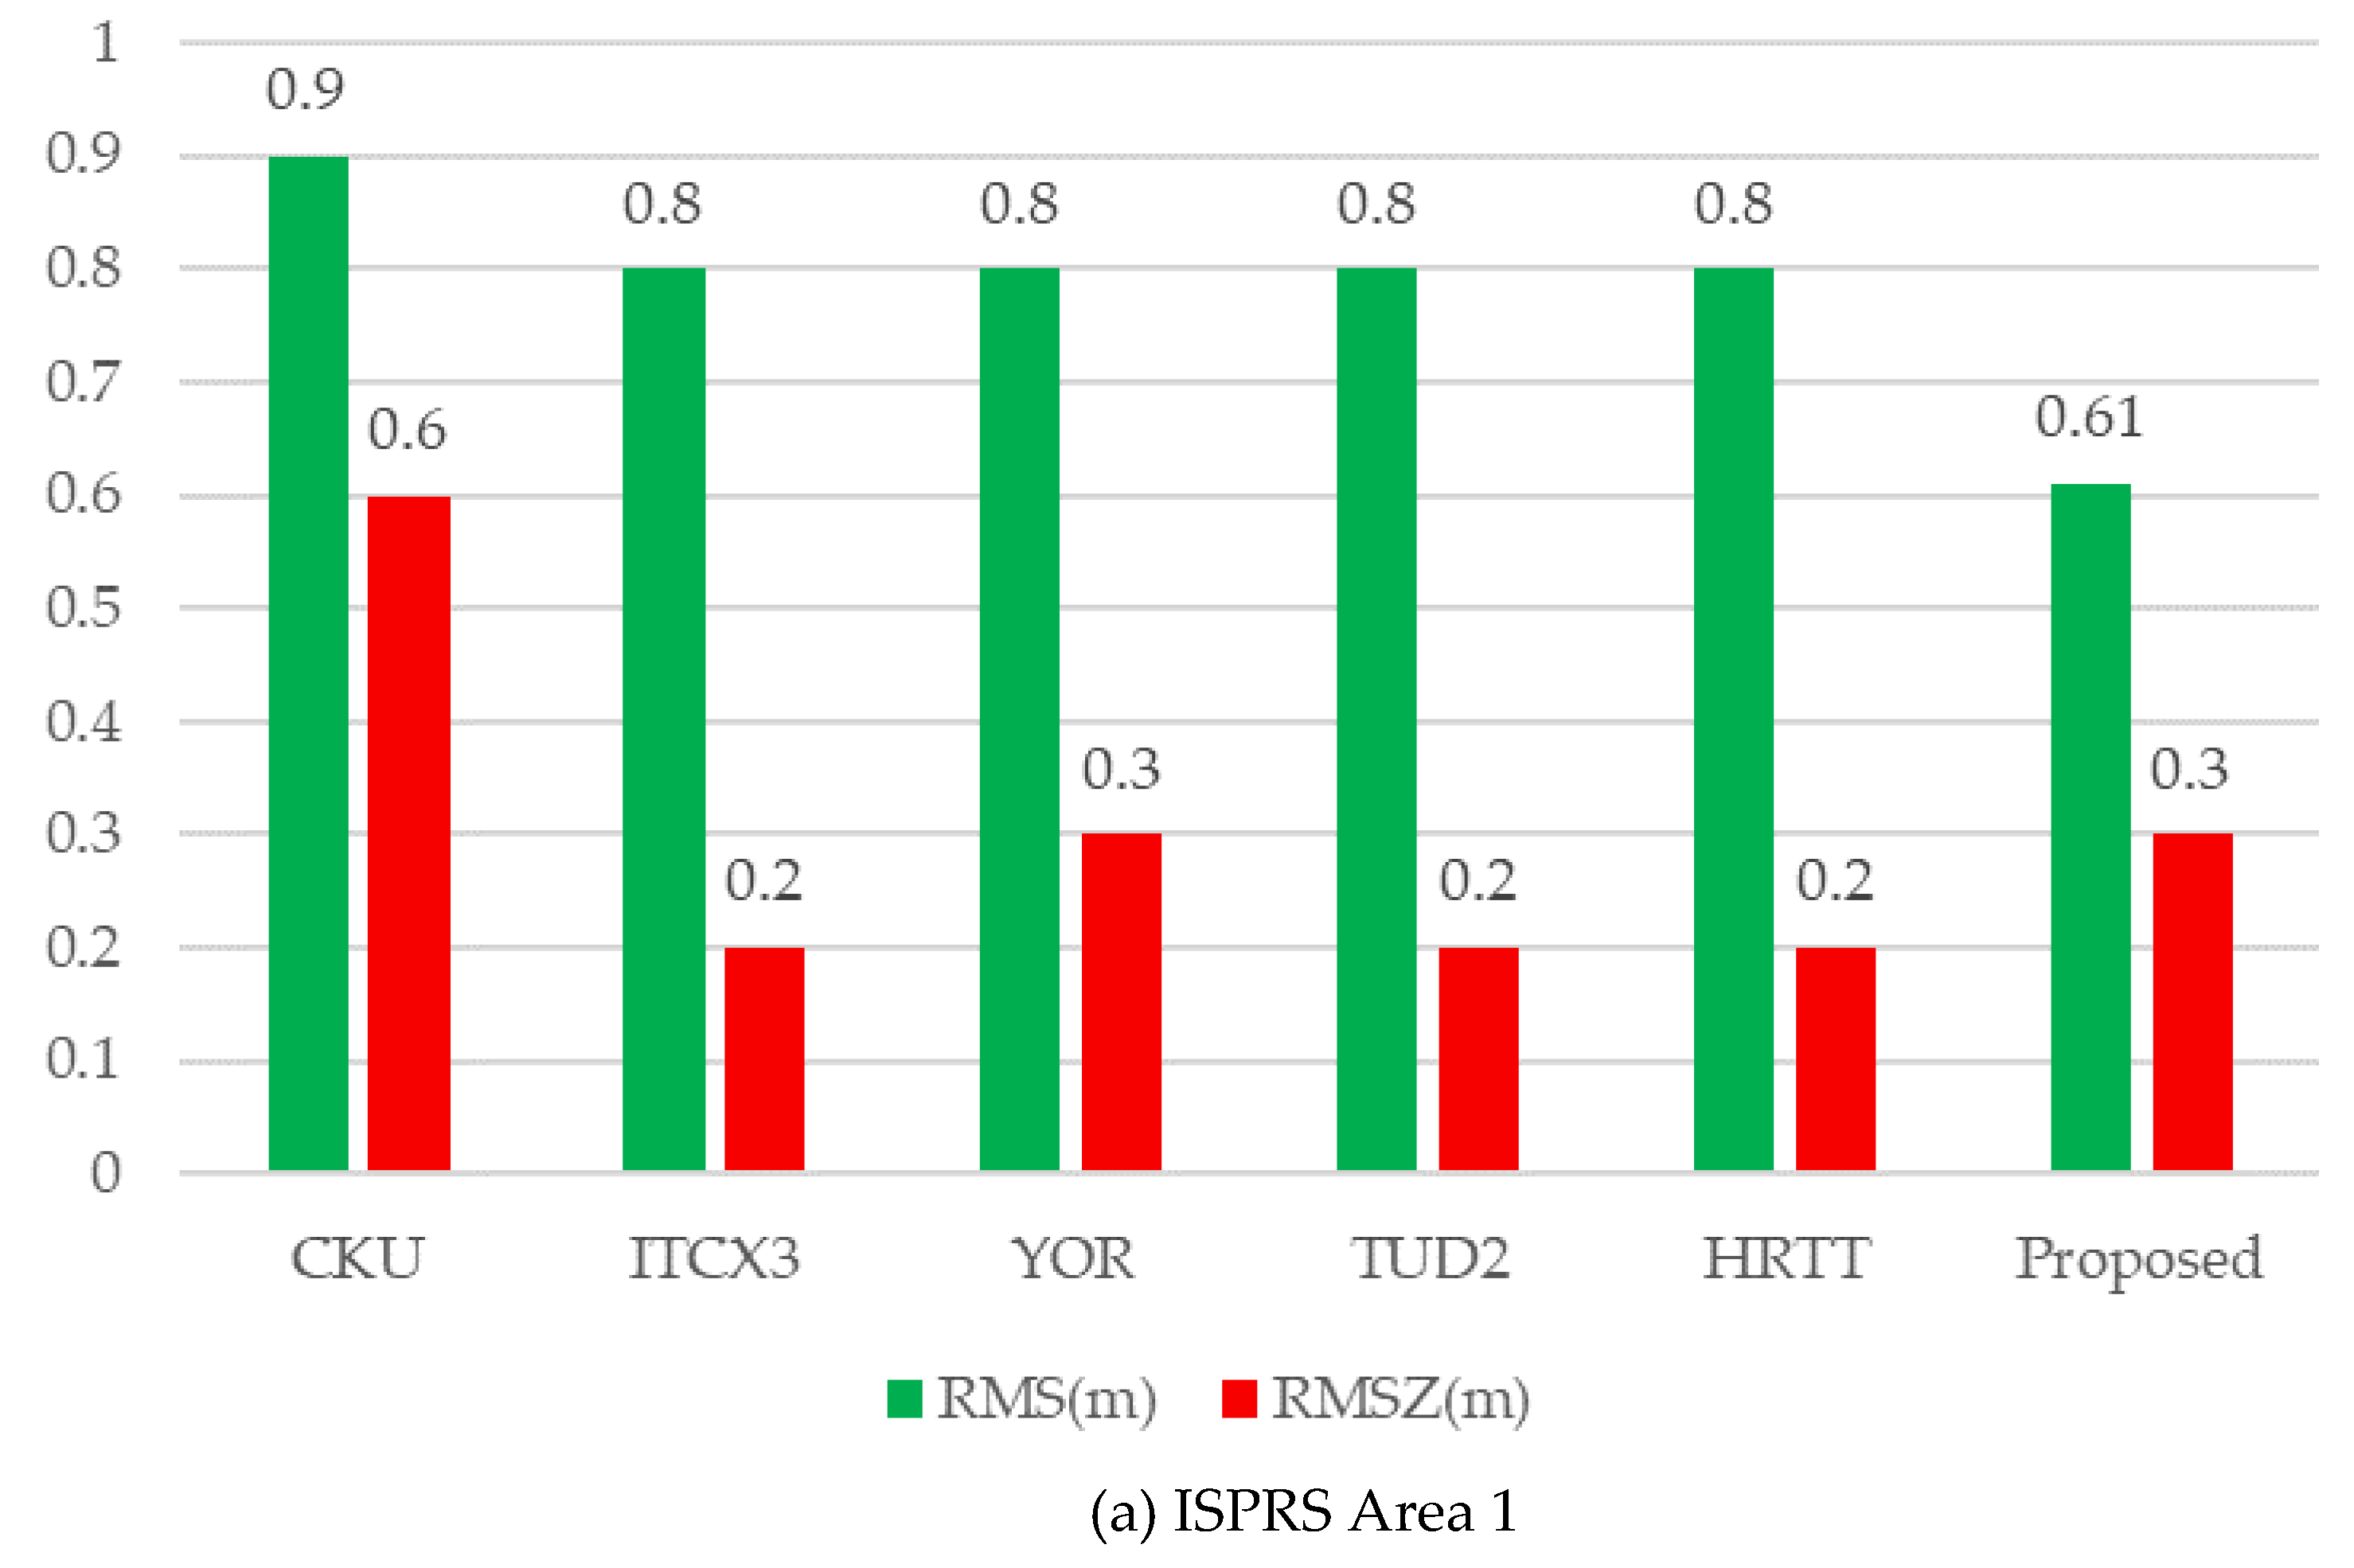
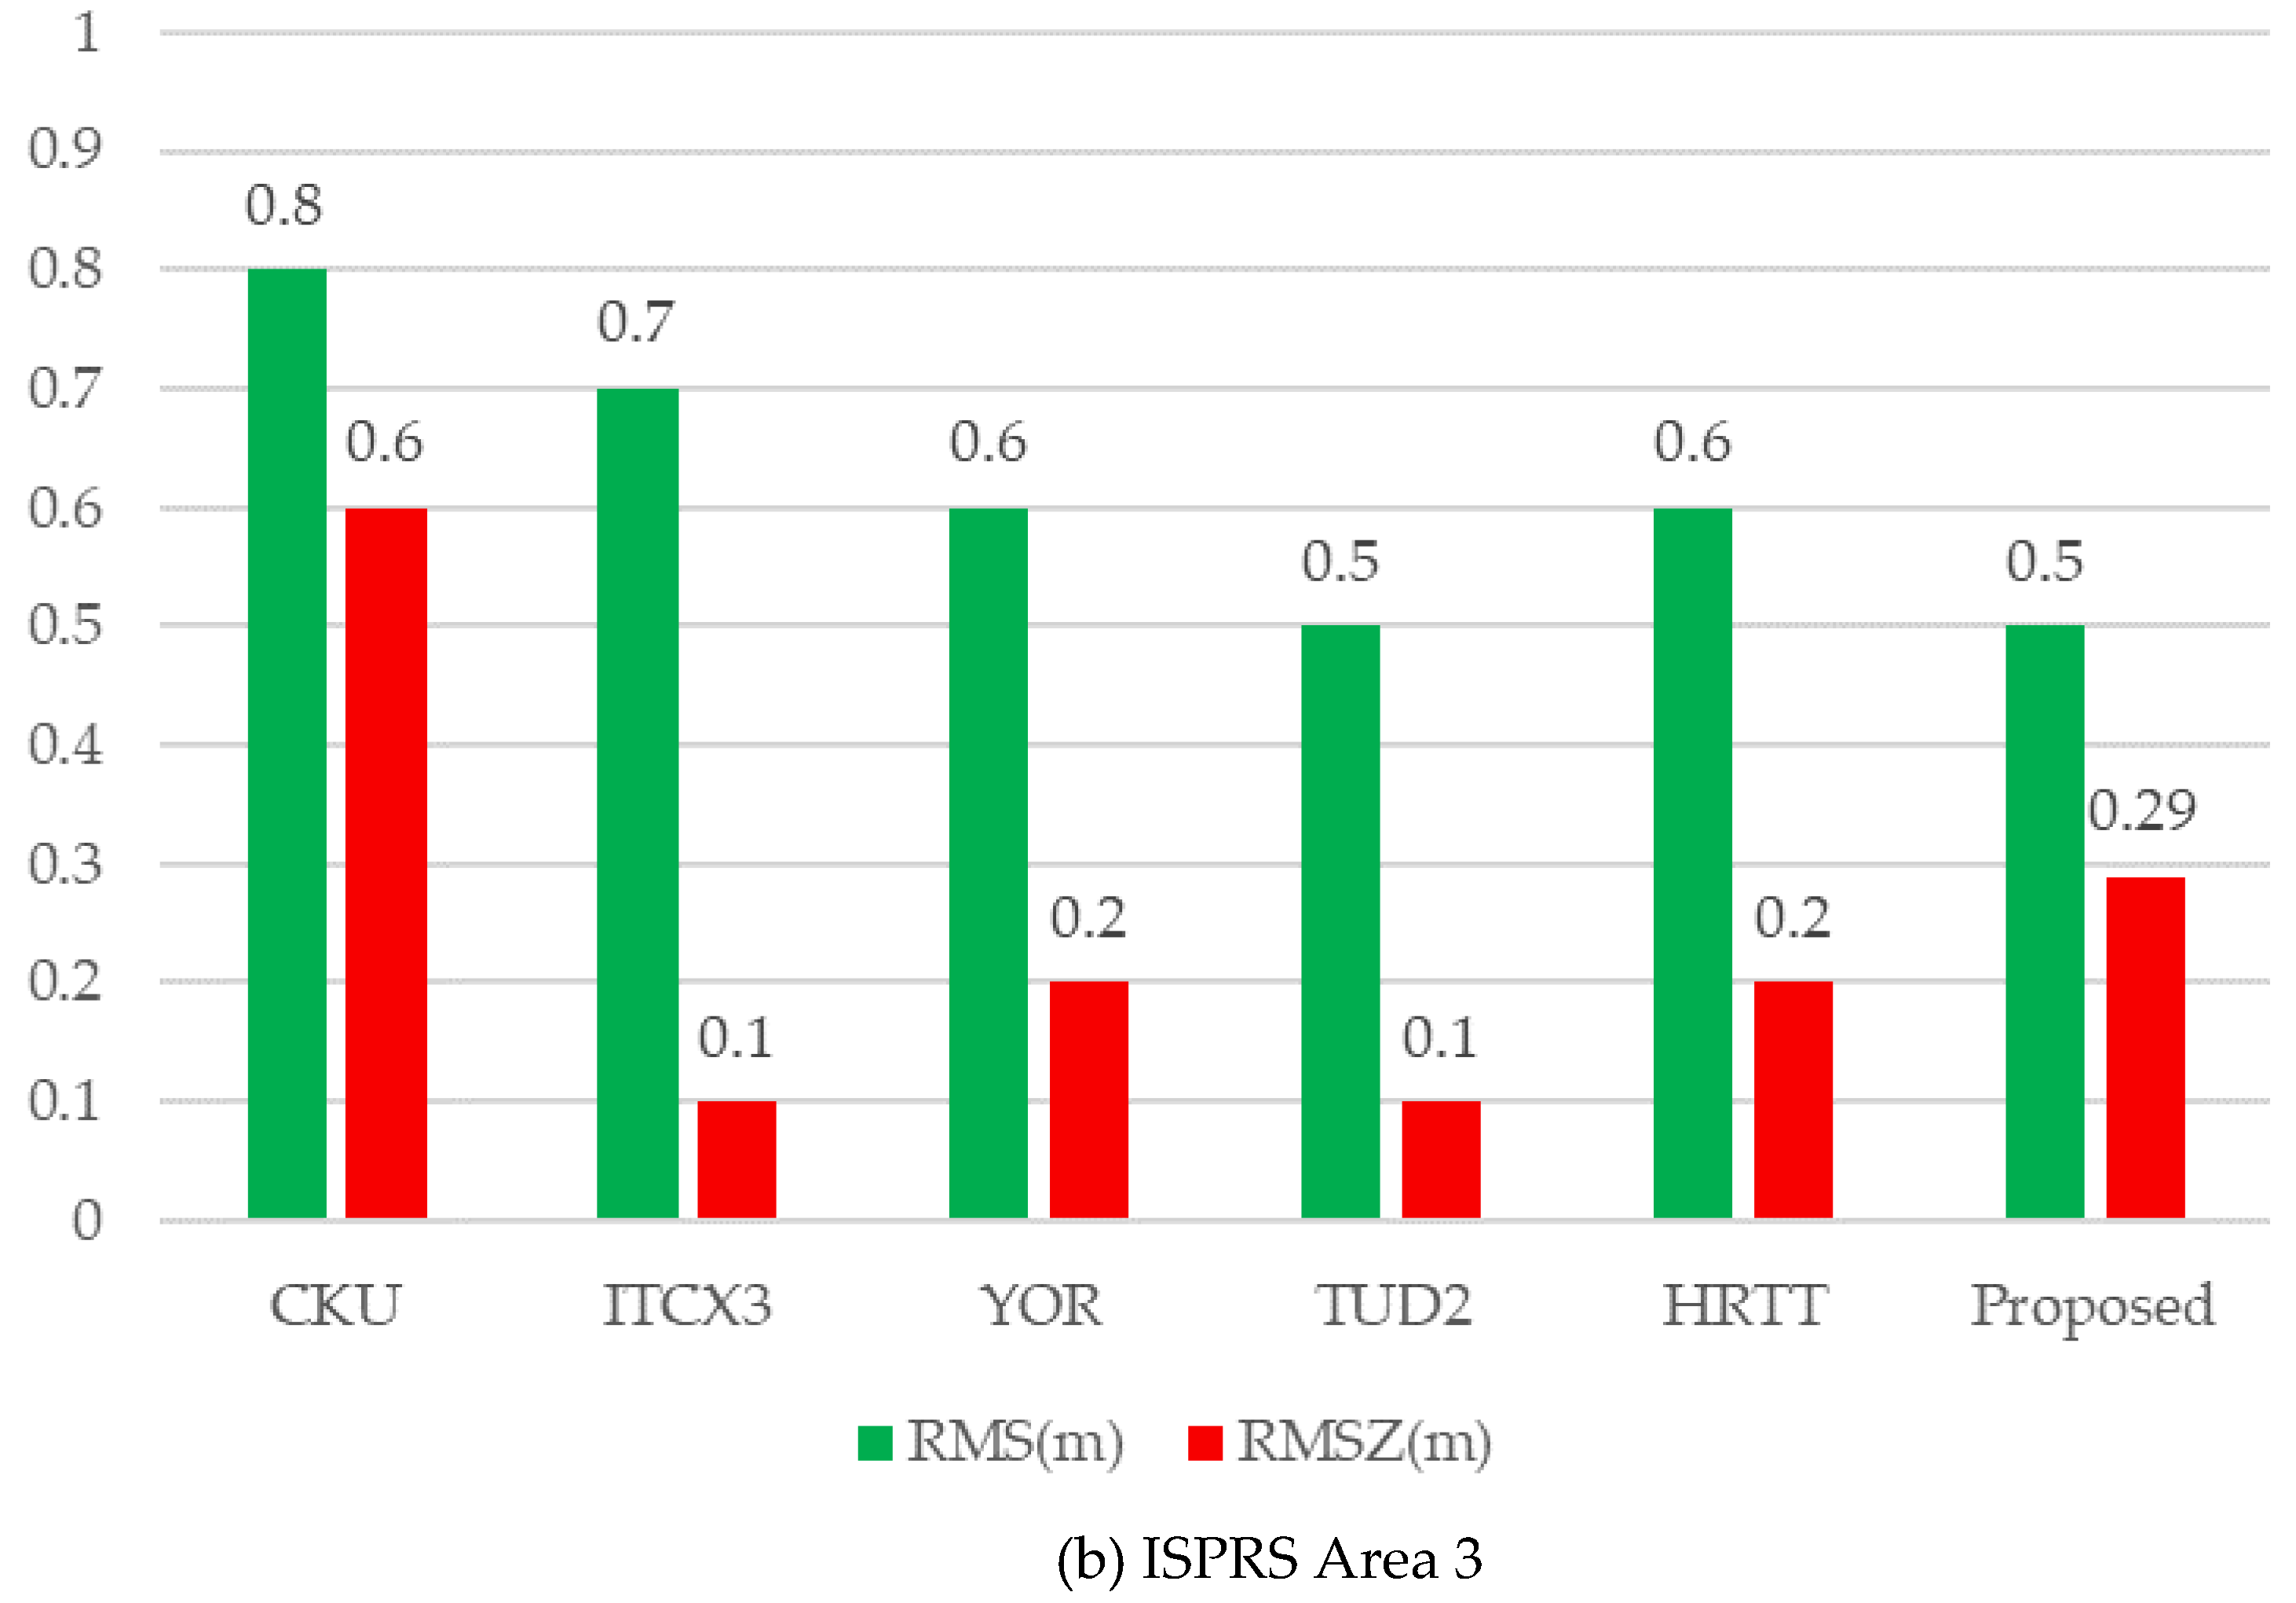
The comparative verification (Figure 15) indicates that 3D building components are successfully achieved during the reconstruction process. Buildings that are not correctly reconstructed are one and three for Area 1 and 3, respectively. These failures, assessed as False Positive (FP), are filled within the buildings that undetected in the preprocessing process of point cloud classification, because houses are surrounded by trees, which makes it difficult to extract building point cloud. Moreover, the geometrical accuracy of state-of-the-art methods described on the ISPRS website is selected for comparison, as presented in Figure 16.
The accuracy of the final generated models may be affected by a variety of factors, such as building detection and segmentation, the strategy of reconstruction. Additionally, an excellent reconstruction algorithm is to find a balance to generate building models. From most of the evaluation methods presented in Figure 16, one of the two indicators (RMS and RMSZ) exceeds the median value, while the other is obviously reduced. In terms of quantitative results, none of the methods is significantly better than others. For the proposed reconstructed approach, the average horizontal error is 0.8 m (Area 1) and 0.6 m (Area 3), while the vertical error is 0.3 m (Area 1) and 0.29 m (Area 3). Even though the two metrics of the proposed method are not optimal, they are similar to the median value, which means that we have achieved a balance between the reconstructed RMS and RMSZ. The main reason for achieving the balance depends on the global optimization of roof plane extraction, and more importantly, it is easy to obtain an unambiguous principal direction of regularization from each decomposed building subpart.

6. Conclusions

In this paper, we present a novel method for complex building reconstruction from 3D point clouds using the local geometric constraints. The output of the reconstruction is a combination of unambiguous unit blocks with no overlapping elements, which are assembled in a hierarchical topology tree. By first constructing a roof connection graph using the extracted roof planar primitives, we developed semantic-specific reconstruction strategies with local geometric constraints to obtain visually attractive building models. The key aim is to decompose a compound building model into semantic subparts with fixed planar parameters and topological relationships, through a progressive hierarchical grouping operation.
The performed reconstruction experiments indicate that the proposed approach can simplify the reconstruction process and generate a combination of gabled or hipped roofs with precisely reconstructed geometric features. Moreover, these generated building subparts can be further used to enrich the building of a model library or construct public training data for supervised reconstruction. However, the proposed modeling scheme for building reconstruction has some limitations, leading to the failure of the generated 3D models. These limitations include the lack of adjacent roof segments, sparse points for the local symmetry processing, and the reconstruction of free-from objects. For future work, there are some possible improvements. For example, higher density and quality points obtained from the ubiquitous digital cameras and active 3D sensing devices can be used to avoid the former two issues, while new reconstruction strategies for free-from objects and building structural elements identification need to be developed.

Author Contributions

Conceptualization, P.H. Methodology, P.H.; software, P.H. and Y.M.; formal analysis, P.H.; writing—original draft preparation, P.H. and Y.M.; writing—review and editing, P.H.; visualization, P.H., M.H., and Y.M.; project administration, P.H.; funding acquisition, P.H. All authors have read and agreed to the published version of the manuscript.

Funding

This work is jointly supported by the National Natural Science Foundation of China (No. 41901405), China Postdoctoral Science Foundation (No. 2020M680323), Beijing Advanced Innovation Center for Future Urban Design, Beijing University of Civil Engineering and Architecture (No. UDC2020020124), and The Fundamental Research Funds for Beijing University of Civil Engineering and Architecture (No. X20045).

Acknowledgments

We would first like to thank the anonymous reviewers for their valuable feedback. The Vaihingen data set was provided by the German Society for Photogrammetry, Remote Sensing, and Geoinformation (DGPF), and The NYU ALS point cloud is released by released by New York University, the center for urban science and progress. The authors wish to thank Markus Gerke, Uwe Breitkopf, and the ISPRS Commission III/4 for the evaluation of the results.

Conflicts of Interest

The authors declare no conflict of interest.

References

  1. Fuxun, L.; Bisheng, Y.; Ronggang, H.; Zhen, D.; Jianping, L. Facade Solar Potential Analysis Using Multisource Point Cloud. Acta Geod. Cartogr. Sin. 2018, 47, 225–233. (In Chinese) [Google Scholar]
  2. Döllner, J.; Baumann, K.; Buchholz, H. Virtual 3D City Models as Foundation of Complex Urban Information Spaces. In Proceedings of the 11th International Conference on Urban Planning and Spatial Development in the Information Society, Vienna, Austria, 13–16 February 2006. [Google Scholar]
  3. Qing, Z.; Haowei, Z.; Yulin, D.; Xiao, X.; Fei, L.; Liguo, Z.; Haifeng, L.; Han, H.; Junxiao, Z.; Li, C.; et al. A review of major potential landslide hazards analysis. Acta Geod. Cartogr. Sin. 2019, 48, 1551–1561. (In Chinese) [Google Scholar]
  4. Nan, L.; Sharf, A.; Zhang, H.; Cohen-Or, D.; Chen, B. SmartBoxes for interactive urban reconstruction. ACM Trans. Graph. 2010, 29, 1–10. [Google Scholar] [CrossRef]
  5. Xiong, B.; Oude Elberink, S.; Vosselman, G. A graph edit dictionary for correcting errors in roof topology graphs reconstructed from point clouds. ISPRS J. Photogramm. Remote Sens. 2014, 93, 227–242. [Google Scholar] [CrossRef]
  6. Lafarge, F.; Mallet, C. Building large urban environments from unstructured point data. In Proceedings of the 2011 International Conference on Computer Vision, Barcelona, Spain, 6–13 November 2011; pp. 1068–1075. [Google Scholar]
  7. Bulatov, D.; Häufel, G.; Meidow, J.; Pohl, M.; Solbrig, P.; Wernerus, P. Context-based automatic reconstruction and texturing of 3D urban terrain for quick-response tasks. ISPRS J. Photogramm. Remote Sens. 2014, 93, 157–170. [Google Scholar] [CrossRef]
  8. Zhu, Z.; Stamatopoulos, C.; Fraser, C.S. Accurate and occlusion-robust multi-view stereo. ISPRS J. Photogramm. Remote Sens. 2015, 109, 47–61. [Google Scholar] [CrossRef]
  9. Toschi, I.; Nocerino, E.; Remondino, F.; Revolti, A.; Soria, G.; Piffer, S. Geospatial Data Processing for 3d City Model Generation, Management and Visualization. Int. Arch. Photogramm. Remote Sens. Spatial Inf. Sci. 2017, XLII-1/W1, 527–534. [Google Scholar] [CrossRef] [Green Version]
  10. Rychard, M.; Borkowski, A. 3D building reconstruction from ALS data using unambiguous decomposition into elementary structures. ISPRS J. Photogramm. Remote Sens. 2016, 118, 1–12. [Google Scholar] [CrossRef]
  11. Aringer, K.; Roschlaub, R. Bavarian 3D Building Model and Update Concept Based on LiDAR, Image Matching and Cadastre Information. In Innovations in 3D Geo-Information Sciences; Isikdag, U., Ed.; Springer International Publishing: Cham, Switzerland, 2014; pp. 143–157. [Google Scholar] [CrossRef]
  12. Jarząbek-Rychard, M.; Maas, H.-G. Geometric Refinement of ALS-Data Derived Building Models Using Monoscopic Aerial Images. Remote Sens. 2017, 9, 282. [Google Scholar] [CrossRef] [Green Version]
  13. Lin, H.; Gao, J.; Zhou, Y.; Lu, G.; Ye, M.; Zhang, C.; Liu, L.; Yang, R. Semantic Decomposition and Reconstruction of Residential Scenes from LiDAR Data. ACM Trans. Graph. 2013, 32, 1–10. [Google Scholar] [CrossRef]
  14. Verdie, Y.; Lafarge, F.; Alliez, P. LOD Generation for Urban Scenes. ACM Trans. Graph. 2015, 34, 1–14. [Google Scholar] [CrossRef] [Green Version]
  15. Oesau, S.; Lafarge, F.; Alliez, P. Planar Shape Detection and Regularization in Tandem. Comput. Graph. Forum 2016, 35, 203–215. [Google Scholar] [CrossRef] [Green Version]
  16. Rottensteiner, F.; Sohn, G.; Gerke, M.; Wegner, J.D.; Breitkopf, U.; Jung, J. Results of the ISPRS benchmark on urban object detection and 3D building reconstruction. ISPRS J. Photogramm. Remote Sens. 2014, 93, 256–271. [Google Scholar] [CrossRef]
  17. Musialski, P.; Wonka, P.; Aliaga, D.G.; Wimmer, M.; Van Gool, L.; Purgathofer, W. A survey of urban reconstruction. Comput. Graph. Forum 2013, 32, 146–177. [Google Scholar] [CrossRef]
  18. Haala, N.; Kada, M. An update on automatic 3D building reconstruction. ISPRS J. Photogramm. Remote Sens. 2010, 65, 570–580. [Google Scholar] [CrossRef]
  19. Wang, R.; Peethambaran, J.; Chen, D. LiDAR Point Clouds to 3D Urban Models: A Review. IEEE J. Sel. Top. Appl. Earth Obs. Remote Sens. 2018, 11, 606–627. [Google Scholar] [CrossRef]
  20. Yang, B.; Dong, Z. A shape-based segmentation method for mobile laser scanning point clouds. ISPRS J. Photogramm. Remote Sens. 2013, 81, 19–30. [Google Scholar] [CrossRef]
  21. Vo, A.-V.; Truong-Hong, L.; Laefer, D.F.; Bertolotto, M. Octree-based region growing for point cloud segmentation. ISPRS J. Photogramm. Remote Sens. 2015, 104, 88–100. [Google Scholar] [CrossRef]
  22. Zhou, G.; Cao, S.; Zhou, J. Planar Segmentation Using Range Images From Terrestrial Laser Scanning. IEEE Geosci. Remote Sens. Lett. 2016, 13, 257–261. [Google Scholar] [CrossRef]
  23. Kim, C.; Habib, A.; Pyeon, M.; Kwon, G.-R.; Jung, J.; Heo, J. Segmentation of Planar Surfaces from Laser Scanning Data Using the Magnitude of Normal Position Vector for Adaptive Neighborhoods. Sensors 2016, 16, 140. [Google Scholar] [CrossRef] [Green Version]
  24. Vosselman, G.; Gorte, B.G.; Sithole, G.; Rabbani, T. Recognising structure in laser scanner point clouds. Int. Arch. Photogramm. Remote Sens. Spat. Inf. Sci. 2004, 46, 33–38. [Google Scholar]
  25. Schnabel, R.; Wahl, R.; Klein, R. Efficient RANSAC for point-cloud shape detection. Comput. Graph. Forum 2007, 26, 214–226. [Google Scholar] [CrossRef]
  26. Yan, J.; Shan, J.; Jiang, W. A global optimization approach to roof segmentation from airborne lidar point clouds. ISPRS J. Photogramm. Remote Sens. 2014, 94, 183–193. [Google Scholar] [CrossRef]
  27. Dong, Z.; Yang, B.; Hu, P.; Scherer, S. An efficient global energy optimization approach for robust 3D plane segmentation of point clouds. ISPRS J. Photogramm. Remote Sens. 2018, 137, 112–133. [Google Scholar] [CrossRef]
  28. Pham, T.T.; Eich, M.; Reid, I.; Wyeth, G. Geometrically consistent plane extraction for dense indoor 3D maps segmentation. In Proceedings of the 2016 IEEE/RSJ International Conference on Intelligent Robots and Systems (IROS), Daejeon, Korea, 9–14 October 2016; pp. 4199–4204. [Google Scholar]
  29. Chen, D.; Zhang, L.; Mathiopoulos, P.T.; Huang, X. A Methodology for Automated Segmentation and Reconstruction of Urban 3-D Buildings from ALS Point Clouds. IEEE J. Sel. Top. Appl. Earth Obs. Remote Sens. 2014, 7, 4199–4217. [Google Scholar] [CrossRef]
  30. Chen, J.; Chen, B. Architectural Modeling from Sparsely Scanned Range Data. Int. J. Comput. Vis. 2008, 78, 223–236. [Google Scholar] [CrossRef]
  31. Sampath, A.; Shan, J. Segmentation and Reconstruction of Polyhedral Building Roofs From Aerial Lidar Point Clouds. IEEE Trans. Geosci. Remote Sens. 2010, 48, 1554–1567. [Google Scholar] [CrossRef]
  32. Zhou, Q.; Neumann, U. 2.5D building modeling by discovering global regularities. In Proceedings of the 2012 IEEE Conference on Computer Vision and Pattern Recognition, Providence, RI, USA, 16–21 June 2012; pp. 326–333. [Google Scholar]
  33. Poullis, C. A Framework for Automatic Modeling from Point Cloud Data. IEEE Trans. Pattern Anal. Mach. Intell. 2013, 35, 2563–2575. [Google Scholar] [CrossRef] [PubMed]
  34. Dehbi, Y.; Henn, A.; Gröger, G.; Stroh, V.; Plümer, L. Robust and fast reconstruction of complex roofs with active sampling from 3D point clouds. Trans. GIS 2020, 25, 112–133. [Google Scholar] [CrossRef]
  35. Karantzalos, K.; Paragios, N. Large-Scale Building Reconstruction Through Information Fusion and 3-D Priors. IEEE Trans. Geosci. Remote Sens. 2010, 48, 2283–2296. [Google Scholar] [CrossRef] [Green Version]
  36. Huang, X. Building reconstruction from airborne laser scanning data. Geo-Spat. Inf. Sci. 2013, 16, 35–44. [Google Scholar] [CrossRef] [Green Version]
  37. Henn, A.; Gröger, G.; Stroh, V.; Plümer, L. Model driven reconstruction of roofs from sparse LIDAR point clouds. ISPRS J. Photogramm. Remote Sens. 2013, 76, 17–29. [Google Scholar] [CrossRef]
  38. Tseng, Y.-H.; Wang, S. Semi-automated Building Extraction Based on CSG Model-Image Fitting. Photogramm. Eng. Remote Sens. 2003, 69, 171–180. [Google Scholar] [CrossRef] [Green Version]
  39. Fayez, T.-K.; Tania, L.; Pierre, G. Extended RANSAC algorithm for automatic detection of building roof planes from LiDAR data. Photogramm. J. Finl. 2008, 21, 97–109. Available online: https://halshs.archives-ouvertes.fr/halshs-00278397 (accessed on 2 May 2021).
  40. Kada, M.; McKinley, L. 3D building reconstruction from LiDAR based on a cell decomposition approach. Int. Arch. Photogramm. Remote Sens. Spat. Inf. Sci. 2009, 38, W4. [Google Scholar]
  41. Lafarge, F.; Descombes, X.; Zerubia, J.; Pierrot-Deseilligny, M. Automatic building extraction from DEMs using an object approach and application to the 3D-city modeling. ISPRS J. Photogramm. Remote Sens. 2008, 63, 365–381. [Google Scholar] [CrossRef] [Green Version]
  42. Poullis, C.; You, S. Automatic reconstruction of cities from remote sensor data. In Proceedings of the 2009 IEEE Conference on Computer Vision and Pattern Recognition, Miami, FL, USA, 20–25 June 2009; pp. 2775–2782. [Google Scholar]
  43. Brenner, C. Modelling 3d Objects Using Weak Csg Primitives. Int. Arch. Photogramm. Remote Sens. Spat. Inf. Sci. 2004, 35, 1085–1090. [Google Scholar]
  44. Vosselman, G.; Dijkman, S. 3D building model reconstruction from point clouds and ground plans. Int. Arch. Photogramm. Remote Sens. Spat. Inf. Sci. 2001, 34, 37–44. [Google Scholar]
  45. Kada, M.; Wichmann, A. Feature-Driven 3D Building Modeling using Planar Halfspaces. ISPRS Ann. Photogramm. Remote Sens. Spat. Inf. Sci. 2013, II-3/W3, 37–42. [Google Scholar] [CrossRef] [Green Version]
  46. Wang, H.; Zhang, W.; Chen, Y.; Chen, M.; Yan, K. Semantic Decomposition and Reconstruction of Compound Buildings with Symmetric Roofs from LiDAR Data and Aerial Imagery. Remote Sens. 2015, 7, 13945–13974. [Google Scholar] [CrossRef] [Green Version]
  47. Suveg, I.; Vosselman, G. Reconstruction of 3D building models from aerial images and maps. ISPRS J. Photogramm. Remote Sens. 2004, 58, 202–224. [Google Scholar] [CrossRef] [Green Version]
  48. Hu, P.; Yang, B.; Dong, Z.; Yuan, P.; Huang, R.; Fan, H.; Sun, X. Towards Reconstructing 3D Buildings from ALS Data Based on Gestalt Laws. Remote Sens. 2018, 10, 1127. [Google Scholar] [CrossRef] [Green Version]
  49. Bauchet, J.P.; Lafarge, F. City Reconstruction from Airborne Lidar: A Computational Geometry Approach. ISPRS Ann. Photogramm. Remote Sens. Spat. Inf. Sci. 2019, IV-4/W8, 19–26. [Google Scholar] [CrossRef]
  50. Perera, G.S.N.; Maas, H.-G. Cycle graph analysis for 3D roof structure modelling: Concepts and performance. ISPRS J. Photogramm. Remote Sens. 2014, 93, 213–226. [Google Scholar] [CrossRef]
  51. Verma, V.; Kumar, R.; Hsu, S. 3D Building Detection and Modeling from Aerial LIDAR Data. In Proceedings of the IEEE Computer Society Conference on Computer Vision and Pattern Recognition, New York, NY, USA, 17–22 June 2006; pp. 2213–2220. [Google Scholar]
  52. Elberink, S.O.; Vosselman, G. Quality analysis on 3D building models reconstructed from airborne laser scanning data. ISPRS J. Photogramm. Remote Sens. 2011, 66, 157–165. [Google Scholar] [CrossRef]
  53. Xiong, B.; Jancosek, M.; Oude Elberink, S.; Vosselman, G. Flexible building primitives for 3D building modeling. ISPRS J. Photogramm. Remote Sens. 2015, 101, 275–290. [Google Scholar] [CrossRef]
  54. Xu, B.; Jiang, W.; Li, L. HRTT: A Hierarchical Roof Topology Structure for Robust Building Roof Reconstruction from Point Clouds. Remote Sens. 2017, 9, 354. [Google Scholar] [CrossRef] [Green Version]
  55. Bassier, M.; Vergauwen, M.; Van Genechten, B. Automated classification of heritage buildings for as-built BIM using machine learning techniques. ISPRS Ann. Photogramm. Remote Sens. Spat. Inf. Sci. 2017, 4, 25–30. [Google Scholar] [CrossRef] [Green Version]
  56. Ma, L.; Sacks, R.; Kattel, U.; Bloch, T. 3D object classification using geometric features and pairwise relationships. Comput. Aided Civ. Infrastruct. Eng. 2018, 33, 152–164. [Google Scholar] [CrossRef]
  57. Wichmann, A.; Agoub, A.; Kada, M. RoofN3D: Deep Learning Training Data for 3D Building Reconstruction. Int. Arch. Photogramm. Remote Sens. Spat. Inf. Sci. 2018, 42, 1191–1198. [Google Scholar] [CrossRef] [Green Version]
  58. Axelsson, M.; Soderman, U.; Berg, A.; Lithen, T. Roof Type Classification Using Deep Convolutional Neural Networks on Low Resolution Photogrammetric Point Clouds From Aerial Imagery. In Proceedings of the 2018 IEEE International Conference on Acoustics, Speech and Signal Processing (ICASSP), Calgary, AB, Canada, 15–20 April 2018; pp. 1293–1297. [Google Scholar]
  59. Zhang, L.; Zhang, L. Deep Learning-Based Classification and Reconstruction of Residential Scenes From Large-Scale Point Clouds. IEEE Trans. Geosci. Remote Sens. 2018, 56, 1887–1897. [Google Scholar] [CrossRef]
  60. Yu, D.; Ji, S.; Liu, J.; Wei, S. Automatic 3D building reconstruction from multi-view aerial images with deep learning. ISPRS J. Photogramm. Remote Sens. 2021, 171, 155–170. [Google Scholar] [CrossRef]
  61. Axelsson, P. DEM Generation from Laser Scanner Data Using adaptive TIN Models. Int. Arch. Photogramm. Remote Sens. 2006, 60, 71–80. [Google Scholar] [CrossRef]
  62. Zhang, W.; Qi, J.; Wan, P.; Wang, H.; Xie, D.; Wang, X.; Yan, G. An Easy-to-Use Airborne LiDAR Data Filtering Method Based on Cloth Simulation. Remote Sens. 2016, 8, 501. [Google Scholar] [CrossRef]
  63. Yang, B.; Huang, R.; Dong, Z.; Zang, Y.; Li, J. Two-step adaptive extraction method for ground points and breaklines from lidar point clouds. ISPRS J. Photogramm. Remote Sens. 2016, 119, 373–389. [Google Scholar] [CrossRef]
  64. Huang, R.; Yang, B.; Liang, F.; Dai, W.; Li, J.; Tian, M.; Xu, W. A top-down strategy for buildings extraction from complex urban scenes using airborne LiDAR point clouds. Infrared Phys. Technol. 2018, 92, 203–218. [Google Scholar] [CrossRef]
  65. Boykov, Y.; Kolmogorov, V. An Experimental Comparison of Min-Cut/Max-Flow Algorithms for Energy Minimization in Vision. IEEE Trans. Pattern Anal. Mach. Intell. 2004, 26, 1124–1137. [Google Scholar] [CrossRef] [Green Version]
  66. Rusu, R.B.; Cousins, S. 3D is here: Point Cloud Library (PCL). In Proceedings of the 2011 IEEE International Conference on Robotics and Automation, Shanghai, China, 9–13 May 2011; pp. 1–4. [Google Scholar]
  67. Delong, A.; Osokin, A.; Isack, H.N.; Boykov, Y. Fast Approximate Energy Minimization with Label Costs. Int. J. Comput. Vis. 2012, 96, 1–27. [Google Scholar] [CrossRef]
  68. Isack, H.; Boykov, Y. Energy-Based Geometric Multi-model Fitting. Int. J. Comput. Vis. 2012, 97, 123–147. [Google Scholar] [CrossRef] [Green Version]
  69. Pu, S.; Vosselman, G. Knowledge based reconstruction of building models from terrestrial laser scanning data. ISPRS J. Photogramm. Remote Sens. 2009, 64, 575–584. [Google Scholar] [CrossRef]
  70. Vosselman, G.; Coenen, M.; Rottensteiner, F. Contextual segment-based classification of airborne laser scanner data. ISPRS J. Photogramm. Remote Sens. 2017, 128, 354–371. [Google Scholar] [CrossRef]
  71. Desolneux, A.; Moisan, L.; Morel, J.-M. Gestalt theory and computer vision. In Seeing, Thinking and Knowing; Springer: Berlin/Heidelberg, Germany, 2004; pp. 71–101. [Google Scholar]
  72. Nan, L.; Sharf, A.; Xie, K.; Wong, T.-T.; Deussen, O.; Cohen-Or, D.; Chen, B. Conjoining Gestalt rules for abstraction of architectural drawings. ACM Trans. Graph. 2011, 30, 1–10. [Google Scholar] [CrossRef]
  73. Lun, Z.; Zou, C.; Huang, H.; Kalogerakis, E.; Tan, P.; Cani, M.-P.; Zhang, H. Learning to group discrete graphical patterns. ACM Trans. Graph. (TOG) 2017, 36, 1–11. [Google Scholar] [CrossRef] [Green Version]
  74. Yang, B.; Huang, R.; Li, J.; Tian, M.; Dai, W.; Zhong, R. Automated Reconstruction of Building LoDs from Airborne LiDAR Point Clouds Using an Improved Morphological Scale Space. Remote Sens. 2017, 9, 14. [Google Scholar] [CrossRef] [Green Version]
  75. People, C. The Computational Geometry Algorithms Library (CGAL). Available online: https://www.cgal.org/ (accessed on 4 May 2021).
  76. Laefer, D.F.; Abuwarda, S.; Vo, A.-V.; Truong-Hong, L.; Gharibi, H. 2015 Dublin LiDAR and NYU Research Data. Available online: https://geo.nyu.edu/ (accessed on 8 May 2021).
  77. Elberink, S.O.; Vosselman, G. Building Reconstruction by Target Based Graph Matching on Incomplete Laser Data: Analysis and Limitations. Sensors 2009, 9, 6101–6118. [Google Scholar] [CrossRef] [PubMed]
  78. Rutzinger, M.; Rottensteiner, F.; Pfeifer, N. A Comparison of Evaluation Techniques for Building Extraction From Airborne Laser Scanning. IEEE J. Sel. Top. Appl. Earth Obs. Remote Sens. 2009, 2, 11–20. [Google Scholar] [CrossRef]
  79. Rau, J.Y. A line-based 3d roof model reconstruction algorithm: Tin-merging and reshaping (tmr). ISPRS Ann. Photogramm. Remote Sens. Spat. Inf. Sci. 2012, I-3, 287–292. [Google Scholar] [CrossRef] [Green Version]
  80. Sohn, G.; Jwa, Y.; Jung, J.; Kim, H. An implicit regularization for 3D building rooftop modeling using airborne lidar data. ISPRS Ann. Photogramm. Remote Sens. Spat. Inf. Sci. 2012, 1, 305–310. [Google Scholar] [CrossRef] [Green Version]
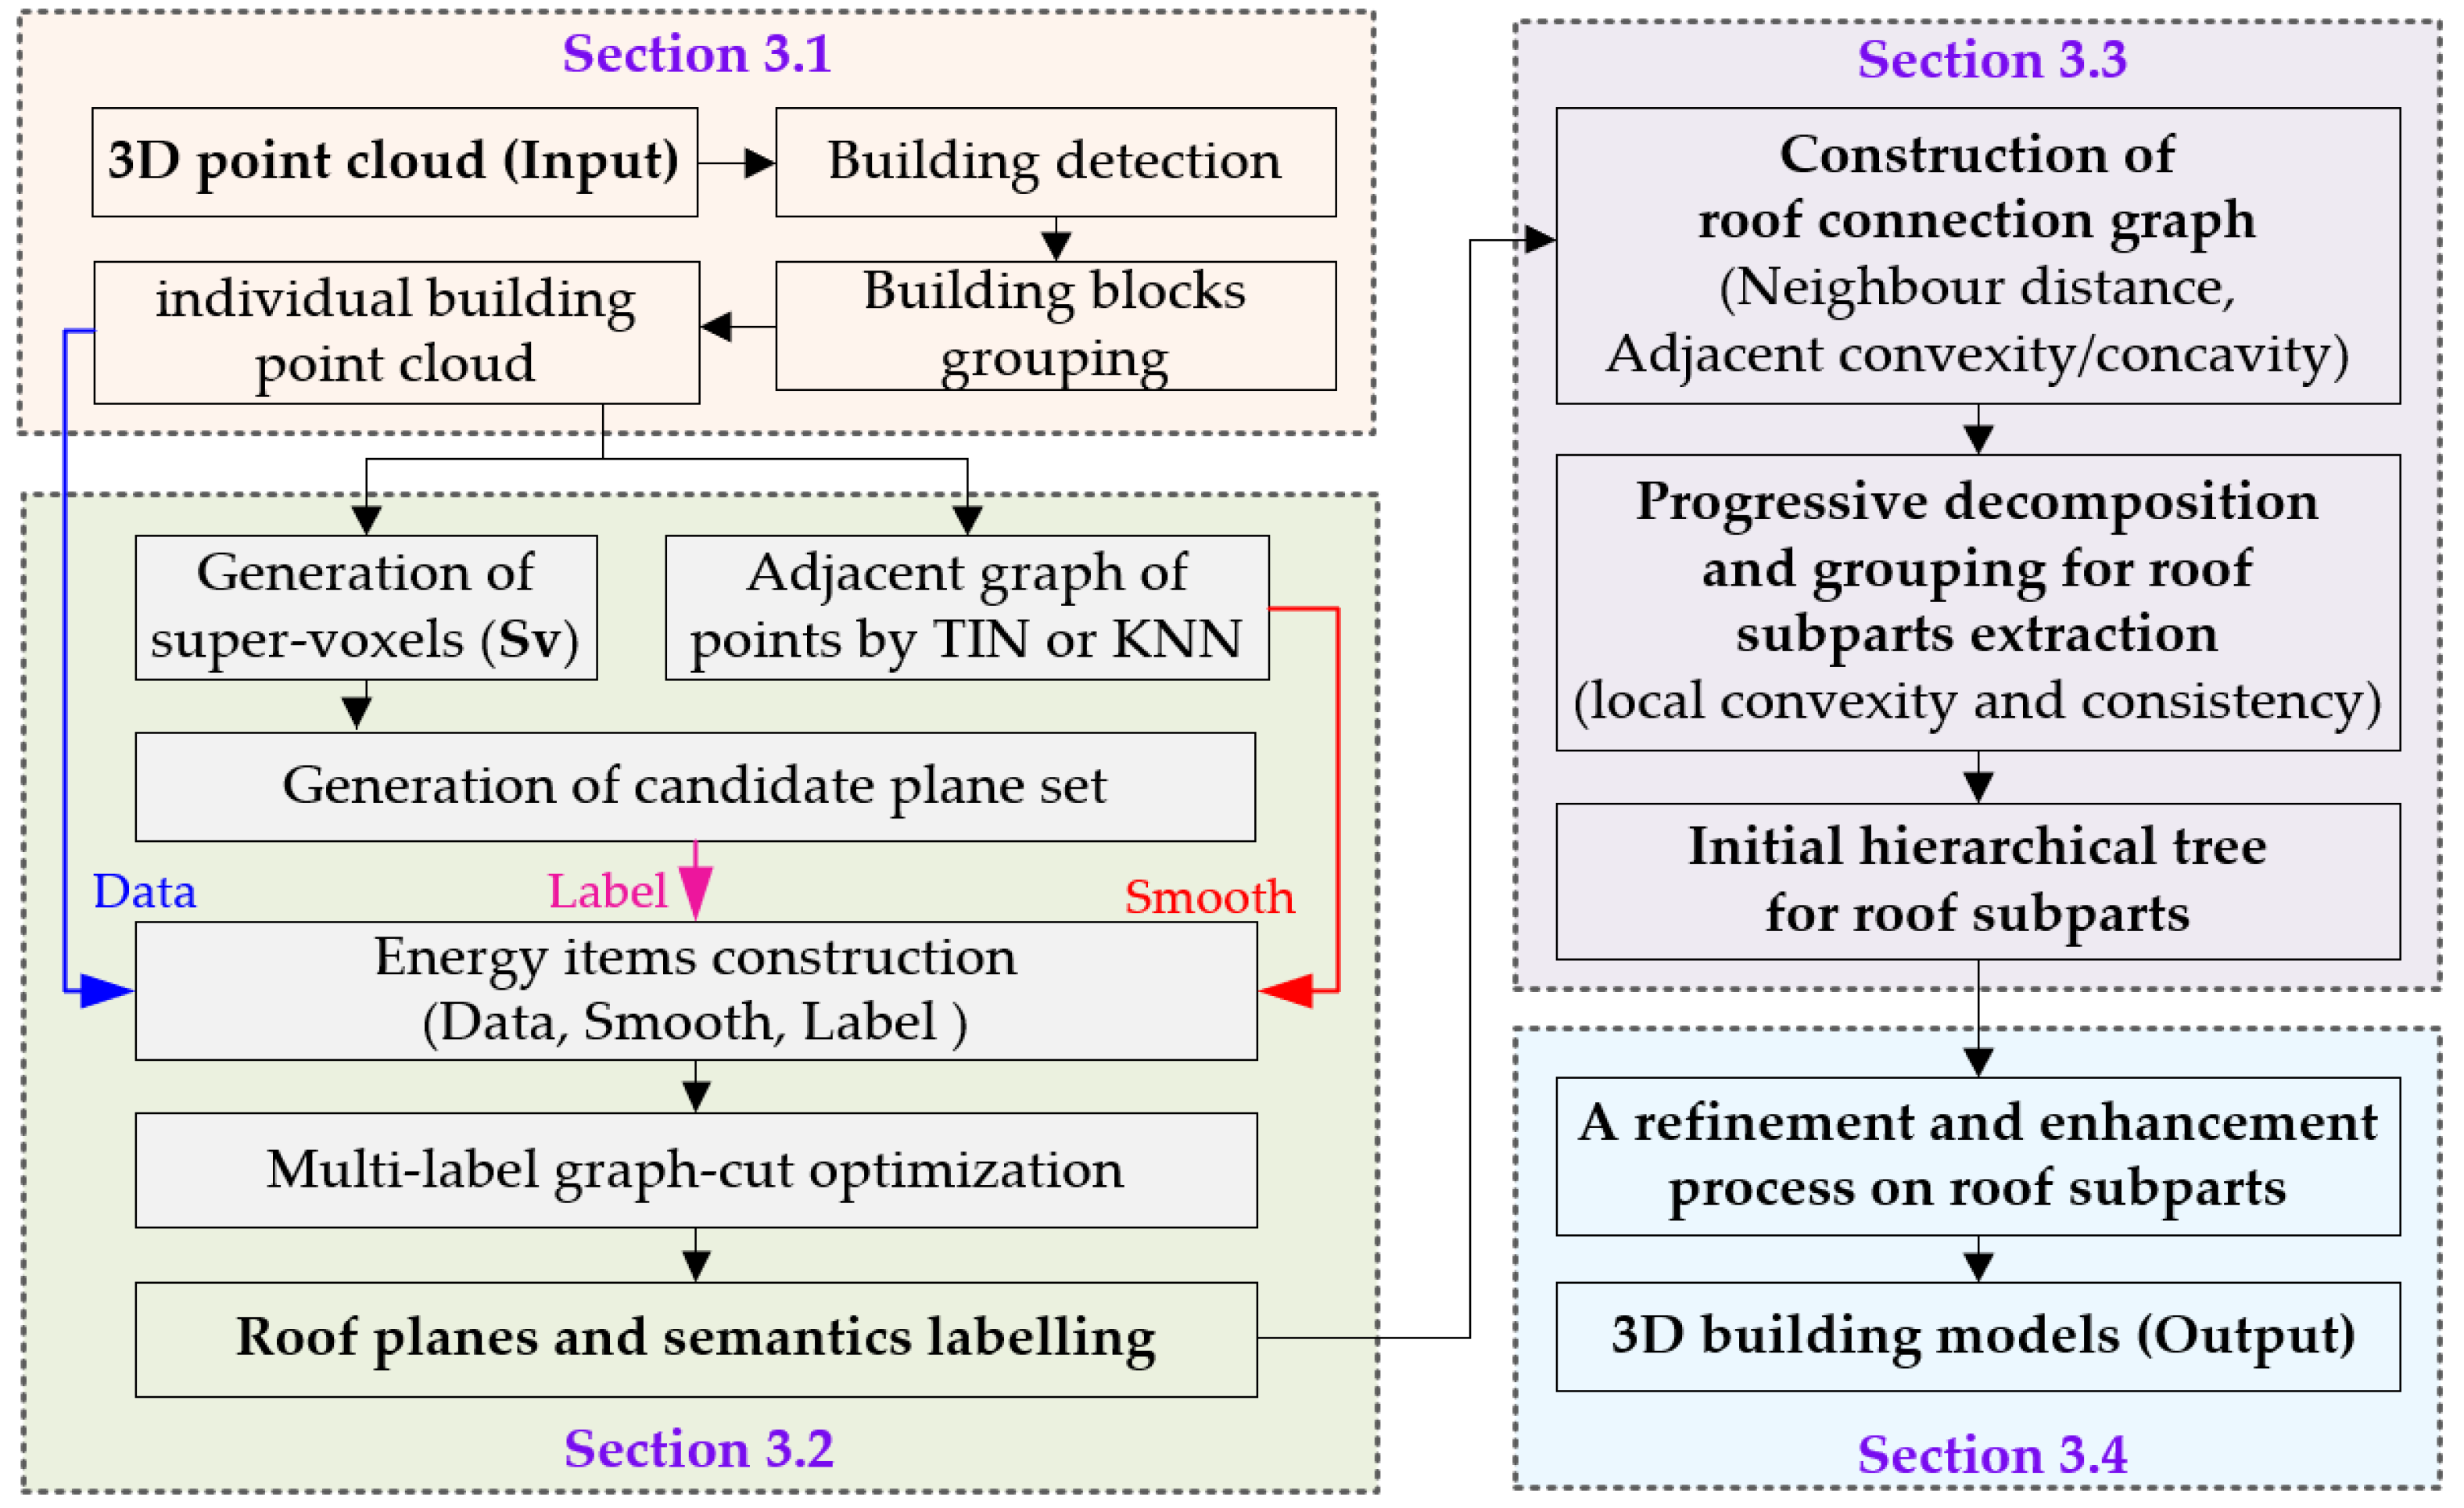
Figure 1. Methodological framework of the complete building reconstruction.
Remotesensing 13 01946 g001
Figure 2. The hierarchical tree representation of a building.
Remotesensing 13 01946 g002
Figure 3. Illustration of the convexity/concave criterion.
Remotesensing 13 01946 g003
Figure 4. Illustration of consistency constraint to group plane A and B. The FCon-AS and FCon-BS are 3D concave/convex relationships (similarity constraint) for adjacent planes.
Remotesensing 13 01946 g004
Figure 5. The detailed iteration of progressive decomposition.
Remotesensing 13 01946 g005
Figure 6. The local symmetry of adjacent planes.
Remotesensing 13 01946 g006
Figure 7. An overview of the tested datasets.
Remotesensing 13 01946 g007
Figure 8. Experimental results of some representative complex buildings. (a) The decomposition and reconstruction 3D models, (b) the 3D geometric vector boundary, and (c) the generated building subparts.
Remotesensing 13 01946 g008aRemotesensing 13 01946 g008b
Figure 9. Reconstruction 3D models of the tested datasets.
Remotesensing 13 01946 g009aRemotesensing 13 01946 g009b
Figure 10. Decomposition results by different 3D building methods. (a) The original input point cloud and roof connection graph. (b) The results from the proposed approach. (c) A whole model by Verma et al. [51]. (d) Decomposition results by Xiong et al. [5]. The first to fourth columns of each row are grouped planes in the original roof connection graph, 3D wireframe, 3D model, and the final enriched subgraph of a grouped unit.
Remotesensing 13 01946 g010aRemotesensing 13 01946 g010b
Figure 11. Comparison of experimental results (with vs. without semantic structures).
Remotesensing 13 01946 g011
Figure 12. Comparison between standard matching approach (b) and the proposed unambiguous decomposition (c) for the same building (a).
Remotesensing 13 01946 g012
Figure 13. Results of roof plane extraction in comparison.
Remotesensing 13 01946 g013
Figure 14. The quality metrics of the ISPRS benchmark dataset.
Remotesensing 13 01946 g014
Figure 15. Evaluation results of the reconstructed roof plane. Blue: false-negative pixels (FN), yellow: true-positive pixels (TP), red: false-positive pixels (FP).
Remotesensing 13 01946 g015aRemotesensing 13 01946 g015b
Figure 16. Geometrical accuracy comparison of the reconstructed models. The CKU [79], ITCX3 [5], YOR [80], TUD2 [50], and HRTT [54] are shorts for participant.
Remotesensing 13 01946 g016aRemotesensing 13 01946 g016b
Table 1. Quantitative assessment of plane extraction.
ItemsArea 1Area 3
Reconstructed planes202133
True Positive (TP)201130
False Positive (FP)13
False Negative (FN)2234
Table 2. Statistics of experiments on energy optimization.
ItemBuilding PointsIterationsRun Times (min)
from the Proposed
Run Times (min)
from the RANSAC
ISPRS Area 124,97141.70.9
ISPRS Area 234,36432.21.1
ISPRS Area 339,93842.61.2
Guangdong76,82454.32.1
NYU111,28935.73.9
Publisher’s Note: MDPI stays neutral with regard to jurisdictional claims in published maps and institutional affiliations.