Abstract
Tillage of arable fields, using for instance a smoothing harrow, may increase the magnitude of albedo of such soil surfaces depending on the location, the sun’s illumination and atmospheric components. As these soil surfaces absorb less shortwave radiation compared to plowed soils, the result is an atmospheric cooling and a positive effect on the Earth’s climate. This paper is the follow-on of a previous study aimed at quantifying the seasonal dynamics of net shortwave radiation reflected by bare air-dried arable land areas located in contrasting environments, i.e. Poland and Israel. Soil tillage includes a plow, a disk harrow, and a smoothing harrow. Previous work concentrated on the estimate of net shortwave radiation under clear-sky theoretical scenarios, whereas the present study deals with a realistic atmosphere throughout the year 2014. This latter is characterized by the observations of the Spinning Enhanced Visible and Infrared Imager (SEVIRI) instrument on board the Meteosat Second Generation (MSG). The variations of the net shortwave radiation for the selected bare arable land areas were assessed in combining observations from Landsat 8 images and digital maps of land use and soil, plus model equations that calculate the diurnal variations of the broadband blue-sky albedo with roughness inclusive. The daily amount of net shortwave radiation for air-dried bare arable land in Poland and Israel for the time their spatial coverage is the largest was found to be about 40–50% and 10% lower, respectively, in cloudy-sky conditions compared to clear-sky conditions.
1. Introduction
The broadband albedo of the Earth’s surface is a key parameter for modeling shortwave radiation exchanges with the atmosphere [1]. Models that predict climate change on a global scale require the use of albedo values with their accuracy better than ±2% [2]. Estimation of the albedo values of bare arable land at coarse scale are based on satellite observations as they are the only means to obtain routine observations in a coherent manner [3]. However, observations over land occur under clear-sky conditions and at a given time of the day for LEO (Low Earth Observation) satellites. GEO (Geostationary) satellites provide hourly radiation observations but with a footprint that exceeds the kilometer resolution. As the albedo changes with the solar zenith angle throughout the day, the daily average albedo is more representative than instantaneous albedo of the surface energy budget [4,5,6]. In clear-sky conditions, the albedo shows a U-shape curve, reaching its minimum at the local noon and its maximum when the sun rises and sets [7,8,9]. Note that a similar shape curve is sometimes observable for the case of reference of sparse vegetation canopy laying over a bright soil. Sometimes the albedo variations on both sides of solar noon can be different due to various surface attributes: the presence of dew for vegetation [10] and wetness for soils. This may significantly reduce the magnitude of the surface albedo. The lowest soil albedo values are obtained when the moisture of a soil surface reaches the state of field capacity [11,12,13].
The albedo of a bare soil mainly depends on intrinsic properties such as the content of soil organic carbon (SOC) [14], carbonates (CaCO3), and iron oxides [15]. CaCO3 facilitates the formation of soil aggregates, which reduces the soil reflectance despite the high reflectivity of this white substance. Białousz [16] noticed that the soil reflectance increases when CaCO3 content is above 20%. Non-directional irregularities of bare soil surfaces resulting from the presence of soil particles, aggregates, clods, stones, as well as specific linear micro-relief shaped by agricultural tools, strongly influence the spectral reflectance and also the albedo of arable land [17,18]. Their reflectance increases with the size of these irregularities [19]. A deep smoothing of a plowed field increases its albedo by about 25% [19,20]. After heavy rains, the soil surface reaches the air-dry state, and the albedo can be raised by about 20–30% [21,22]. With the alternation of wet and dry periods for heavy soils, a thin crust often forms at the top, thereby increasing the spectral reflectance by about 10–40% [23,24,25].
The roughness of soils is currently measured using laser scanners or performed by a photogrammetric technique using a digital camera observing a test soil surface from multiple directions. Such methods are able to describe the irregularities of the soil surfaces with a horizontal and vertical spatial resolution of about 1 mm [26,27,28,29]. The irregularities can be directly illuminated according to the sun’s position, which is the major cause of the diurnal cycle of albedo. In the case of bare arable land, micro-scale topography not only affects the albedo intensity but also influences its steepness from solar noon to solar zenith angle until direct radiation dominates, typically up to 75°. In [20,21,22], it was reported that albedo values of soil surfaces with a high roughness, such as for example deeply plowed fields, are more isotropic than smoothed soils that show an albedo increase in this range as the sun moves away from its highest position.
More radiation anisotropy occurs for plowed fields due to strong shadowing effects but such gradients are rather invariant with the sun’s position, which explains low directionality for albedo after integration. On the other hand, a smooth soil shows specular effects that are closely dependent on the sun position. It was shown that the diurnal variations of albedo for rough soils can be predicted under clear-sky conditions with satisfactory accuracy using a set of equations, using as inputs roughness indexes, SOC and CaCO3 contents [20,30]. The equations using soil reflectance data transformed into its second derivative for a specific wavelength served to estimate the annual variations of shortwave radiation reflected from bare arable land in Israel [21,31]. The theoretical tools assumed that the selected land areas were shaped with appropriate farming tools and that their surfaces were always illuminated by direct incoming radiation, whereas most natural conditions correspond to diffuse irradiance due to frequent cloudiness, which lessens the impact of the solar geometry [10].
The purpose of the current paper is to compare the annual dynamic of net shortwave radiation of air-dried bare arable land starting from a theoretical point of view [30,31] to realistic conditions where cloudiness is reported from the Spinning Enhanced Visible and Infrared Imager (SEVIRI) instrument aboard Meteosat Second Generation (MSG). This comparison applies to those areas located in contrasting environmental conditions, namely, Poland and Israel, where the frequency and type of cloud cover are clearly different, and the number of hours of sunshine for these countries is 1700 and 3300, respectively (https://weather-and-climate.com/ accessed date 25 March 2021). Note that the radiometry of bare arable land areas arises from Landsat 8. The estimation of radiation of these lands throughout the year was based on the daily average albedo calculated using data stored in soil databases.
2. Materials and Methods
The annual variations of the albedo of arable land in Poland were investigated on two sample areas based on two Landsat 8 scenes: 187/24 and 190/24 for eastern (ES) and western (WS), respectively (Figure 1a) These scenes, covering 24% of Poland’s territory, are representative of the country’s arable lands [30]. For Israel, three Landsat 8 scenes, 174/37, 174/38 and 174/39, were analyzed (Figure 1b), which cover almost 100% of this country [31].
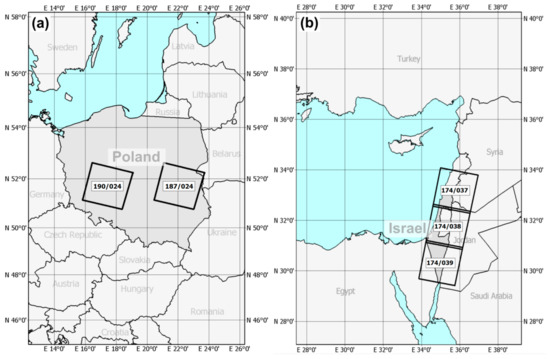
Figure 1.
Location of Landsat scenes for (a) Poland and (b) Israel.
The data are Level-1 Standard Data Products images recorded by the Operational Land Imager (OLI) instrument from the beginning of this satellite mission until October 2014 for Poland and December 2015 for Israel. A total of 33 and 30 Landsat 8 images were used to extract bare soils in the analyzed scenes in Poland and Israel, respectively. They were obtained from the US Geological Survey using the EarthExplorer application (http://earthexplorer.usgs.gov accessed date 25 March 2021) in selecting images with less than 15% cloud cover. They were radiometrically calibrated to the top-of-the atmosphere (TOA) reflectance and normalized from different illumination conditions and atmospheres using the PCI Geomatica software package from the Atmospheric/Topographic Correction (ATCOR) algorithm [32]. It should be outlined that OLI has a narrow field-of-view (FOV) of 15 degrees and therefore the impact of directional effects on the results is low.
It is worth emphasizing that ATCOR correction takes into account the normalization of variable solar illumination between images from different dates. The main soil units have different reflectance spectra in both studied countries. Therefore, OLI spectral bands (RB) were found useful and different criteria that combine them were used to identify the bare soil areas in these countries: R2 < R3 < R4 < R5 < R6, R6 > R7, R5/R3 > 1.8 and R6−R5 > 0 in Poland, and R3 < R4 < R5 < R6, R6 > R7, R6–R5 < 1 in Israel. Only bare soils corresponding to arable land (Ad) were ultimately retained based on the Coordination of Information on the Environment (CORINE) land-cover data of 2012 obtained from the Copernicus Land Monitoring Service (http://land.copernicus.eu/pan-european/corine-land-cover/clc-2012 accessed date 25 March 2021) for Poland soils and OpenStreetMap data, updated in September 2014 for the soils in Israel.
The areas presenting bare soils in both countries were presented in the form of binary maps with a spatial resolution of 30 m for each of the analyzed images. Such maps were used to determine the areas of bare soil against arable land in Poland and Israel. Figure 2 and Figure 3 show examples of bare soil contours in the periods when their share is high. These contours are shown at the spatial resolution of 30 m, which is the pixel size of Landsat 8 images. All these images were processed and their statistics were obtained using scripts written in SML language in the programming environment included in the TNTmips software package.
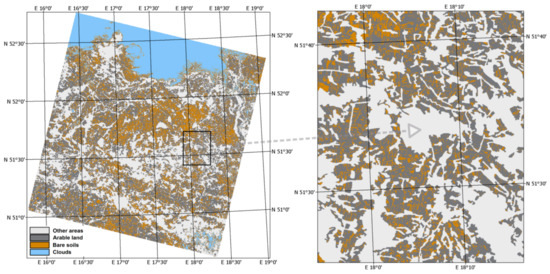
Figure 2.
Bare soil areas extracted from Landsat 8 image in 190/24 scene, recorded on 1 March 2014 within arable land contours in Poland.
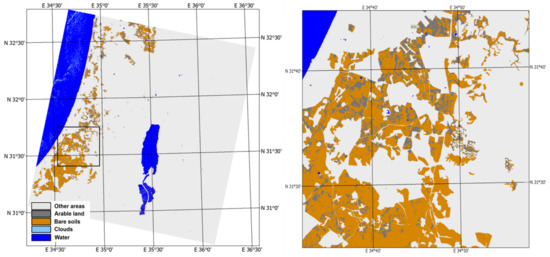
Figure 3.
Bare soil areas extracted from Landsat 8 image in 174/38 scene, recorded on 23 August 2014 within arable land contours in Israel.
The annual variation of the area of bare arable land in Poland, expressed in the previous paper [30] as a percentage share in the total areas of two scenes (ES and WS), was first averaged for the whole country. Then, these variations were converted to absolute values in thousands of square kilometers for Israel, as shown previously [31].
To determine the soil units for arable land, digital soil maps were superimposed on the binary maps for each analyzed image. These are the product of classification issued by the World Reference Base for soil resources (WRB) (http://esdac.jrc.ec.europa.eu/content/google-earth-files accessed date 25 March 2021) [33] for Poland and a soil map product for Israel [34] originally classified according to the Israeli nomenclature system and then converted to the U.S. soil taxonomy system [35]. The average SOC and CaCO3 contents of the soil samples located within the arable land contours in the analyzed images in Poland were used to characterize the WRB soil units in Poland. These soil samples were obtained from the Land Use/Cover Area Frame Survey (LUCAS) [36], which is a soil database including the properties of arable land in Poland [37] (http://ztg.amu.edu.pl/soil/test25/Spectral%20Properties%20of%20Polish%20Soils.htm accessed date 25 March 2021) issued from the Department of Soil Science and Remote Sensing of Soils. These values of SOC and CaCO3 (expressed as a percentage) enabled calculation of the soil albedo α0 for a given roughness at solar zenith angle θs = 0°, using the formula [20,30]:
where T3D represents the surface roughness defined as the ratio of the real surface area within its basic unit to its flat horizontal area [36]. The averaged reflectance features of soil samples located within the contours of Israel arable lands in the analyzed satellite images were used to characterize the soil units in Israel. The soil samples were from the Israeli Soil Library (https://www.modelfarm-aro.org/subject-areas/the-national-soil-spectral-library-of-israel/?lang=en accessed date 25 March 2021). The albedo for these soils (α45) was calculated with the equation [21,31]:
where xl together with its associated number (l) stands for soil reflectance data transformed to its second derivative for a specified wavelength (l): 474, 705, 952 and 1650 nm.
The appropriateness of the Equations (1) and (2), expressed by the coefficient of determination and the root mean square error, was estimated at 0.90 and 0.03 for arable land in Poland and 0.89 and 0.03 for the land in Israel, respectively, [11,20].
The half-diurnal soil albedo variation in Poland and Israel in the angular range 0° < θs < 75° was calculated as:
where expresses the slope of the albedo α increase within this range of θs variations by the formulas:
for the soils in Poland [30]
and for the soils in Israel [31].
HSD is a roughness index representing the standard deviation of the height of a surface area within its basic unit [38].
Finally, the half-diurnal α distributions of the soils in the full θs range up to 90° were computed in Poland [30] and Israel [31] using the following formulas:
respectively, where a, b, c, and d are fitting parameters. Equation (7) is fitted to the soil units with roughness created by a plow (Pd), a disk harrow (Hd), and a smoothing harrow (Hs) using TableCurve 2Dv5.01 (SYSTAT Software Inc.). Their roughness was described by the following values of the roughness indices for the surfaces shaped by Pd, Hd, and Hs: 25, 10, and 5 mm (expressed by HSD) and 1.5, 1.15, and 1.05 (described by T3D), respectively, as in the previous paper [39]. The soils treated by a Pd are covered with large clods up to several dozen cm in diameter. Most soil aggregates having a size of a few cm create surfaces formed by a Hd, and soils shaped by a Hs, i.e., aggregates smaller than 1 cm.
For the sake of simplicity, the representing the bare soils distributions in both countries were fitted for each day of the year from local noon to sunset under the assumption that the soils were located in the centers of the two Landsat scenes for Poland (51°45’29”N, 22°06’20”°E and 51°39’24”N, 17°28’34”E) and where the largest land concentration for Israel is found (31°45’15”N, 34°49’50”E). To calculate the average values of the diurnal albedo of these soils (αd) treated by the above-mentioned tools, these distributions were transformed to the function of local solar time (LST). The above data were finally recorded in pixels with a spatial resolution of 250 m.
Three locations were retained to analyze the downward surface shortwave radiation reaching the investigated soil surfaces at 30-minute intervals for each day in 2014. This flux, so-called (Rir) and expressed in TJkm−2day−1 was derived from the three channels (VIS0.6 at 0.6 µm, VIS08 at 0.8 µm, VIS16 at 1.6 µm) of the satellite instrument called "Spinning Enhanced Visible and Infrared Imager" (SEVIRI) on board of Meteosat Second Generation (MSG). It encompasses all situations, from pure clear-sky conditions to full cloud coverage. These amounts were calculated by a modified method implemented in the Satellite Application Facility on Land Surface Analysis (Land-SAF) project based on [40,41]. The true shortwave irradiation flux Rir was analyzed by comparison with theoretical clear-sky shortwave radiation (Ric). These latter were calculated in previously published papers [30,32] using the formulas provided in [42]. To reduce the impact of atmospheric effects, which are highly variable and may infer saw-like patterns, the daily Rir values were averaged over the year (Ris) by a least-square fitting scaled cosine equation:
where: and Ris max and Ris min denote maximum and minimum diurnal irradiance during a year.
Finally, the daily reflected shortwave radiation from all arable land in Poland and Israel (Rrr) was determined by multiplying the daily observed Rir values reaching the investigated bare soils by their respective surface area, Ad, and their αd values corresponding to the effect of shaping by tillage, issued from different Pd, Hd, and Hs.
3. Results
3.1. Annual Variation of Bare Arable Land Area in Poland and Israel
In Poland, the annual variation of daily Ad shows two peaks and a minimum value close to zero (Figure 4a). A first peak about 82,000 km2 occurs during springtime before the start of the growing season (DOY 80, 21 March). A second one about 81,500 km2 is conspicuous in the late summertime after the cereal was harvested near the (DOY 260, 17 September). A minimum of Ad, about 2100 km2, is predicted to occur at the beginning of summertime near the DOY 185 (4 July). In Israel, the curve describing the annual Ad distribution shows its highest values comprised between 2000 km2 and 2150 km2 at the turn of summertime and early fall between the DOY 195 and 290 (from 14 July to 17 October). The minimum of the bare arable land area, about 500 km2, is predicted in winter between the DOY 30 and 60 (30 January and 1 March, respectively).
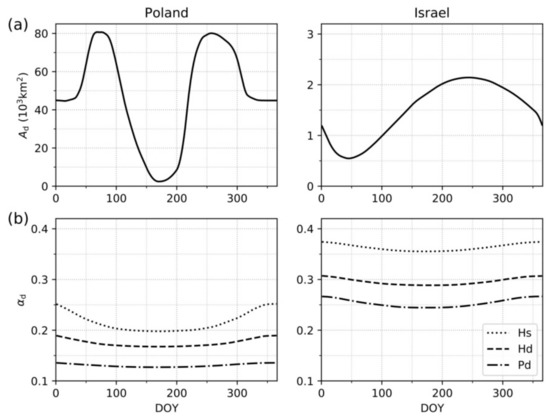
Figure 4.
Annual variations in Poland and Israel: (a) Daily bare arable land area (Ad); (b) Average daily albedo (αd) of the bare soils within arable land, formed by a plow (Pd), a disk harrow (Hd), and a smooth harrow (Hs). The values of Ad and αd in Poland are averaged for the whole of Poland from the values specified for the ES and WS Landsat images (scene numbers 187/024 and 190/024) in the previous paper [31]. For Israel, this concerns Landsat scenes 174/037, 174/038 and 174/039.
3.2. Bare Soils in Arable Land in Poland and Israel
The analysis of the two Landsat 8 scenes for Poland led to the conclusion that 90% of WRB soil units listed the arable land. Notably, this includes 12 items [30] that were defined at subgroup level, belonging to nine of the following major groups: Albeluvisols, Arenosols, Cambisols, Fluvisols, Gleysols, Histosols, Leptosols, Luvisols, and Podzols. With regard to their coverage, about 70% of them developed from sandy loam and silt loam materials against 20% only from loamy sand materials. To predict the diurnal α distributions of these units, 293 soil samples were used. The SOC content of arable land falls in the range 0.8–0.9% and 0.9–1.1% within ES and WS, respectively, while the CaCO3 content in both scenes does not exceed 0.5%.
The spectral properties of bare arable land in Israel were determined based on 28 soil samples obtained from the Israeli Soil Library and 3 soil samples for which their diurnal α variations were directly measured in the field [31]. The soils cultivated as arable lands include 11 soil units classified at the level of great groups according to the U.S. soil taxonomy system. They belong to the six following orders: Alfisols, Aridisols, Entisols, Inceptisols, Mollisols, and Vertisols. The soils belonging to these first three groups occupy 52% of the total area of bare arable land in the country. Their high CaCO3 content, of 15–30%, is the main reason why their spectra show the highest reflectance. The soils belonging to the categories of Inceptisols, Mollisols, and Vertisols in regard to their high SOC content— comprised between 1.1% and 3.3%—show significantly lower spectra in a general manner.
Darker bare air-dried soil surfaces in Poland, with brightness values in the range of 4–5, were characterized by a lower spectral reflectance than the clearly lighter soils that were dominant soil in terms of acreage in Israel and characterized by a high level of brightness with values above 6 [22]. As a consequence, the annual distribution of αd corresponding to the average bare and air-dried soil surfaces in Poland [30] runs at a clearly lower level than the analogous distribution describing soil surfaces in Israel [31] (Figure 4b). It was found that the αd values for soil representing the whole Poland, according to parameters Pd, Hd, and Hs, fall in the ranges 0.13–0.14, 0.17–0.19, and 0.20–0.26, respectively, to be compared to 0.24–0.27, 0.28–0.31, and 0.35–0.37 for Israel. These lowest and the highest αd values in the ranges are predicted for the 173rd and 356th DOYs (22 June and 22 December) describing the beginning of the astronomical summer and the beginning of the astronomical winter, respectively.
In Poland, around the 80th DOY and the 260th DOY, bare soils occupy the largest areas, and the αd values reach 0.13, 0.17, and 0.20 for the soil surfaces formed by Pd, Hd, and Hs, respectively (Figure 4b). Meanwhile, the climatic conditions of Israel and the various practices considered for dominant crops make that the maximum area of bare land was estimated around the 240th DOY. Much brighter soils in Israel than in Poland was the main reason for why their αd values reached 0.24, 0.28, and 0.36 for their surface formed by Pd, Hd, and Hs, respectively.
3.3. Shortwave Incoming Radiation for Poland and Israel under Changing Cloudiness
The diurnal course of the shortwave incoming radiation (Rir) is examined for all scenes observed throughout the year with different cloudiness. At high time frequency, the signal Rir shows swath-like patterns due to changing atmosphere whereas a sharp signal Ris is conspicuous at low frequency or seasonal basis from fit (Figure 5a). Actually, very similar shapes were found for the ES and WS scenes in Poland, only separated in latitude by 300 km. The observations from SEVIRI were all located below the theoretical curve corresponding to clear-sky conditions and without atmosphere (Ric). The deviations of the Rir from their Ric counterparts (Drc-r), expressed as a percentage of the Ric values, were plotted for each DOY (Figure 5b). They reveal changes from 2% to 88% almost independently of the season, with an average of 45%. Moreover, it was found that differences between Drc-r values for these two scenes on the same DOYs ranged from −33% to 28% of the Ric, and that their standard deviation was only 8% (Figure 5c). Determining the distribution of the averaged values of Rir using the smoothing function (Ris) makes easier the interpretation of the yearly trend (Figure 5a). For both ES and WS, this was described by the minimum diurnal amount of shortwave irradiation, which at the beginning of the astronomical winter (the 256th DOY) reached the real equivalent of about 1.5 TJkm−2day−1, and its maximum amount 20 TJkm−2day−1 at the beginning of the astronomical summer (the 173rd DOY) (Figure 6a). These mean values of Ris measurements in Poland are 5 TJkm−2day−1 at the 256th DOY and go beyond 31 TJkm−2day−1 at the 173rd DOY, and were lower by about 30% and 35%, respectively, compared to their corresponding theoretical Ric values. These two quantities for the same DOYs in Israel were lower only by 3% and 25% than their Ric counterparts.
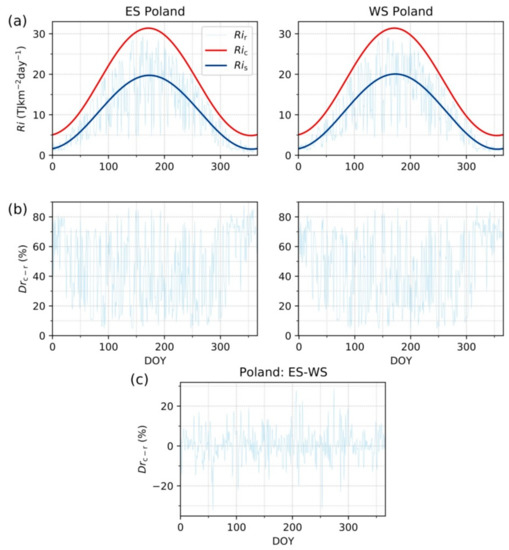
Figure 5.
Annual variations for the ES and WS Landsat images (scene numbers 187/024 and 190/024) in Poland in 2014 in: (a) real daily amount of shortwave radiation (Rir) and averaged (smoothed by Equation (5)) real amount of shortwave radiation (Ris) reaching the centers of the scenes against the background of corresponding value calculated for perfectly clear-sky conditions (Ric); (b) deviation of the Rir value from its Ric counterpart (Drc-r), expressed as a percentage of the Ric value; (c) difference between the Drc-r values calculated for the two scenes.
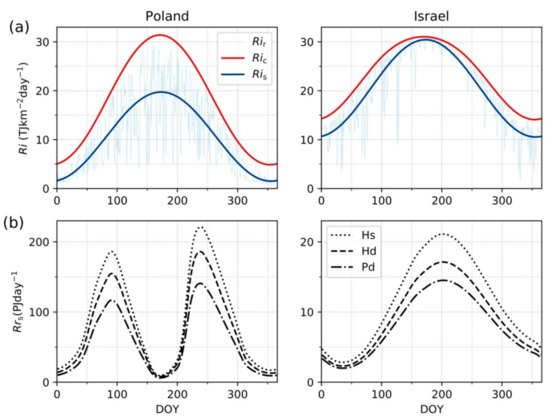
Figure 6.
Annual variations in 2014 in: (a) real daily amount of shortwave radiation (Rir) and averaged (smoothed by Equation (5)) real amount of shortwave radiation (Ris) reaching Poland and Israel against the background of corresponding value calculated for perfectly clear-sky conditions (Ric); (b) smoothed real daily amount of shortwave radiation reflected from bare arable land (Rrs) in Poland and Israel, formed by a plow (Pd), a disk harrow (Hd), and a smooth harrow (Hs). Landsat scene numbers are 187/024 and 190/024 for Poland. Landsat scene numbers are 174/037 and 174/038 and 174/039 for Israel.
3.4. Shortwave Radiation of Bare Arable Land under various Cloudiness Compared to Clear Sky
The close similarity between the Rir and Ris distributions for the ES and WS scenes is harnessed to characterize the annual dynamics of net shortwave radiation reflected from air-dried bare arable land of the whole Poland in changing cloud cover conditions using only one of these distributions (in respect to the WS scene).
In Poland during spring 2014, when the area of bare arable land reached its first peak (around the 95th DOY), the average daily amounts of Rrs for soil surfaces formed by Pd, Hd, and Hs were estimated around 120, 155, and 180 PJday−1, respectively Figure 6b. In late summer (around the 240th DOY), when this second Ad peak occurred, high Rrs values for these surfaces, shaped by the tools mentioned above, were estimated around 135, 180, and 225 PJday−1, respectively. In summer (around the 185th DOY), when the lowest Ad value was predicted, the minimum Rrs values were estimated at about 5, 7, and 8 PJday−1. These highest Rrr values occurring in both peaks of Ad in Poland, when they are compared to the corresponding theoretical values Rrc under clear-sky conditions (e.g., [43]) were lower by about 40% and 45% for soil surfaces formed by Pd and Hs, respectively. However, when the Ad values reached their minimum, the lowest Rrs values compared to the Rrc values were even lower by about 45% and 50% for the surfaces shaped by Pd and Hs, respectively.
In Israel for summertime 2014 (around the 205th DOY), when Ad reached its maximum, the Rrs values of bare arable land formed by Pd, Hd, and Hs were estimated at about 14.5, 17, and 21 PJday−1, respectively. Around the 45th DOY, when the Ad values reached their minimum value, the analogous Rrs values were only about 2, 2.5, and 3 PJday−1. These highest Rrr values were lower by approximately 5% and 10% for the surfaces formed by Pd and 35% for the surfaces shaped by Hs compared to the corresponding Rrc values, respectively.
4. Discussion
Decreasing the roughness of deeply plowed soils using agricultural tools such as a harrow increases their albedo and consequently reduces the amount of shortwave radiation absorbed by the surface. Owing to less absorption, such soil surfaces become cooler and emit less long-wave radiation [1,44,45], which also happens for wet soil, due to reduced albedo value [46]. The extension of such agricultural operations at coarse scale would have a tremendous impact on the Earth’s climate. This forms a good complement to the strategies developed for obtaining negative radiative forcing based on biogeochemical effects like carbon storage in the soil. Polish soils can turn dark due to wetness and in this case tilling is mandatory to enhance the soil albedo. In Israel, most soils are naturally bright, thus tilling has a less relative effect compared to soils in Poland. But the land surfaces in Israel receive more incoming radiation throughout the year compared to Poland, and tilling has still a non-negligible effect.
The seasonal variations of shortwave radiation reflected from arable land in Europe previously estimated using SEVIRI measurements find an extension here in assessing how many low values of shortwave radiation reflected from air-dried arable lands at three different roughness stages match true atmospheric conditions compared to theoretical cases. The study was carried out on two contrasting environments, i.e., Poland and Israel, in order to reach meaningful conclusions, as cloud coverage and solar irradiance differ significantly. Such daily radiation amounts, even for air-dried soil surfaces, are usually lower in bare ground compared to vegetation. It is believed that bare soil surfaces, although appearing for relatively short periods of time within arable land, may affect at least the regional climate due to their large total areas, this depending on the level of roughness as investigated in the present paper.
5. Conclusions
The results of this study demonstrate that the measured daily shortwave radiation under changing cloud cover conditions over the year 2014 for both Poland and Israel was notably less than the theoretical estimates derived from ideal clear-sky conditions, i.e., without any atmosphere compounds. The seasonal shortwave courses derived from SEVIRI data differ substantially from the theory, which outlines the sensitivity to the atmospheric compounds in determining shortwave radiation budget at surface level for arable land of the two investigated countries. In average, the highest and lowest fitted values occurring at the beginning of the astronomical summer and at the beginning of the astronomical winter are found lower in Poland by about 30% and 35%, respectively, compared to the corresponding theoretical values. In Israel such values are found to be by 3% and 25% lower, respectively, which confirms the regional effect due to geographic location and environment. As the consequence of such specifically lower values compared to the counterparts in Poland and Israel, also compared to the averaged values of the real shortwave radiation reflected from air-dried bare arable land, daily estimates of reflected radiation in these countries were lower. During spring 2014 and late summer 2014, when the size of bare arable land in Poland reached its two peaks, the highest real daily reflected radiation relative to theoretical one for ideal clear-sky conditions were lower by about 40% and 45% for soil surfaces formed by Pd and Hs, respectively. In Israel, these same surfaces were lower by about 5% and 10%.
Author Contributions
Conceptualization, J.C.; Methodology, J.C., S.K. and J.J.; Formal Analysis, J.-L.R., J.J. and S.K.; Data Curation, J.C. and J.-L.R.; Writing—original draft preparation and review and editing, J.C. and J.-L.R.; Visualisation: J.J. and S.K. All authors have read and agreed to the published version of the manuscript.
Funding
This work was supported by the Polish National Science Center within the framework of project no. 2014/13/B/ST10/02111. The cost of open access was covered thanks to the financial support received by the Authors from the Initiative of Excellence - Research University (05/IDUB/2019/94) at Adam Mickiewicz University, Poznań, Poland.
Institutional Review Board Statement
Not applicable.
Informed Consent Statement
Not applicable.
Data Availability Statement
Not applicable.
Conflicts of Interest
The authors declare no conflict of interest.
Abbreviations
| a0 | soil albedo |
| SOC | soil organic carbon |
| CaCO3 | soil organic carbonates |
| θs | solar zenith angle |
| T3D | surface roughness |
| xl | spectral reflectance (l: wavelength) |
| half-diurnal soil albedo | |
| HSD | roughness index |
| slope of the directional increase of a | |
| a, b, c, d | fitting parameters |
| Pd | roughness from plow |
| Hd | roughness from disk arrow |
| Hs | roughness from smoothing arrow |
| Rir | real shortwave radiation flux |
| Ric | theoretical clear-sky shortwave radiation flux |
| Ris | Ric averaged over the year |
| Drc-r | deviation between Rir and Ric |
| DOI | day of year |
| Ad | surface area |
| ad | albedo of the surface area |
| WRB | World Reference Base |
References
- Farmer, T.G.; Cook, J. Climate Change Science: A Modern Synthesis. In Volume 1—The Physical Climate; Springer: Dordrecht, The Netherlands, 2013. [Google Scholar]
- Sellers, P.J.; Meeson, B.W.; Hall, F.G.; Asrar, G.; Murphy, R.E.; Schiffer, R.A.; Bretherton, F.P.; Dickinson, R.E.; Ellingson, R.G.; Field, C.B.; et al. Remote sensing of the land surface for studies of global change: Models—algorithms—Experiments. Remote Sens. Environ. 1995, 51, 3–26. [Google Scholar] [CrossRef]
- GCOS-154. Systematic Observation Requirements for Satellite-Based Products for Climate Supplemental Details to the Satellite-Based Component of the Implementation Plan for the Global Observing System for Climate in Support of the UNFCCC-2016 Update; WMO: Geneva, Switzerland, 2016. [Google Scholar]
- Grant, I.F.; Prata, A.J.; Cechet, R.P. The impact of the diurnal variation of albedo on the remote sensing of the daily mean albedo of grassland. J. Appl. Meteor. 2000, 39, 231–244. [Google Scholar] [CrossRef]
- Cierniewski, J.; Karnieli, A.; Kusnierek, K.; Goldberg, A.; Herrmann, I. Approximating the Average Daily Surface Albedo with respect to Soil Roughness and Latitude. Int. J. Remote Sens. 2013, 34, 3416–3424. [Google Scholar] [CrossRef]
- Cierniewski, J.; Kaźmierowski, C.; Królewicz, S.; Piekarczyk, J. Effects of soil roughness on the optimal time of cultivated soils observation by satellites for the soils average diurnal albedo approximation. IEEE J. Sel. Top. Appl. Earth Obs. Remote Sens. 2013, 6, 1194–1198. [Google Scholar] [CrossRef]
- Monteith, J.L.; Szeicz, G. The radiation balance of bare soil and vegetation. Q. J. R. Meteorol. Soc. 1961, 87, 159–170. [Google Scholar] [CrossRef]
- Wang, K.; Wang, P.; Liu, J.; Sparrow, M.; Haginoya, S.; Zhou, X. Variation of surface albedo and soil thermal parameters with soil moisture content at a semi-desert site on the western Tibetan Plateau. Boundary-Layer Meteorol. 2005, 116, 117–129. [Google Scholar] [CrossRef]
- Oguntunde, P.G.; Ajayi, A.E.; van de Giesen, N. Tillage and surface moisture effects on bare-soil albedo of a tropical loamy sand. Soil Tillage Res. 2006, 85, 107–114. [Google Scholar] [CrossRef]
- Frasner, R.S. Interaction Mechanisms–Within the Atmosphere (Chapter 5), Manual of Remote Sensing; American Society of Photogrammetry: Falls Church, VA, USA, 1975; pp. 181–233. [Google Scholar]
- Baumgardner, M.; Silva, L.; Biehl, L.; Stoner, E. Reflectance properties of soils. Adv. Agron. 1986, 38, 1–44. [Google Scholar]
- Weidong, L.; Baret, F.; Xingfa, G.; Qingxi, T.; Lanfen, Z.; Bing, Z. Relating soil surface moisture to reflectance. Remote Sens. Environ. 2002, 81, 238–246. [Google Scholar] [CrossRef]
- Idso, S.B.; Jackson, R.D.; Reginato, R.J.; Kimball, B.A.; Nakayama, F.S. The dependence of bare soil albedo on soil water content. J. Appl. Meteorol. 1975, 14, 109–113. [Google Scholar] [CrossRef]
- Obukhov, A.I.; Orlov, D.S. Spektralnaja otrazatelnaja sposobnost glavneysych tipov pochv i vozmoznost ispolzovaniya diffuznogo otrazenija pri pochvennych issledovanijach. Pochvoved 1964, 28, 83–94. [Google Scholar]
- Mikhaylova, N.A.; Orlov, D.S. Opticheskie Svoystva Pochv i Pochvennych Komponentov; Akademya Nauk SSSR; Rozanov, B.G., Ed.; Nauka: Moskva, Russia, 1986; pp. 3–115. [Google Scholar]
- Białousz, S. Zastosowanie Fotointerpretacji do wykonywania map stosunków wodnych gleb. PTG Pr. Kom. Nauk. 1978, 35, 1–143. [Google Scholar]
- Cierniewski, J. Geometrical Modeling of Soil Bi-Directional Reflectance in the Optical Domain; Bogucki, Ed.; Bogucki Scientific Publishers: Poznań, Poland, 1999; pp. 1–148. [Google Scholar]
- Cierniewski, J. The Bidirectional Reflectance Model from Cultivated Soils Taking into Account Soil Aggregates and Micro-Relief; Bogucki, Ed.; Bogucki Scientific Publishers: Poznań, Poland, 2001; pp. 1–150. (In Polish) [Google Scholar]
- Matthias, A.D.; Fimbres, A.; Sano, E.E.; Post, D.F.; Accioly, L.; Batchily, A.K.; Ferreira, L.G. Surface roughness effects on soil albedo. Soil. Sci. Soc. Am. J. 2000, 64, 1035–1041. [Google Scholar] [CrossRef]
- Cierniewski, J.; Karnieli, A.; Kaźmierowski, C.; Królewicz, S.; Piekarczyk, J.; Lewińska, K.; Goldberg, A.; Wesołowski, R.; Orzechowski, M. Effects of soil surface irregularities on the diurnal soil broadband blue-sky albedo variation. IEEE J. Sel. Topics Appl. Earth Obs. Remote Sens. 2015, 28, 493–502. [Google Scholar] [CrossRef]
- Cierniewski, J.; Ceglarek, J.; Karnieli, A.; Krolewicz, S.; Kaźmierowski, C.; Zagajewski, B. Predicting the diurnal blue-sky albedo of soils using their laboratory reflectance spectra and roughness indices. J. Guant Spectrosc. Radiat. Transfer 2017, 200, 25–31. [Google Scholar] [CrossRef]
- Cierniewski, J.; Ceglarek, J.; Kaźmierowski, C. Estimating the diurnal blue-sky albedo of soils with given roughness using their laboratory reflectance spectra. J. Guant Spectrosc. Radiat. Transfer 2018, 217, 213–223. [Google Scholar] [CrossRef]
- Ben-Dor, E.; Goldlshleger, N.; Benyamini, Y.; Agassi, M.R.; Blumberg, D.G. The spectral reflectance properties of soil structural crusts in the 1.2 to 2.5 μm spectral region. Soil Sci. Soc. Amer J. 2003, 67, 289–299. [Google Scholar] [CrossRef]
- Eshel, G.; Levy, G.J.; Singer, M.J. Spectral reflectance properties of crusted soils under solar illumination. Soil Sci. Soc. Am. J. 2004, 68, 1982–1991. [Google Scholar] [CrossRef]
- Goldshleger, N.; Ben-Dor, E.; Benyamini, Y.; Agassi, M. Soil reflectance as a tool for assessing physical crust arrangement of four typical soils in Israel. Soil. Sci. 2004, 169, 677–687. [Google Scholar] [CrossRef]
- Thomsen, L.M.; Baartman, J.E.M.; Barneveld, R.J.; Starkloff, T.; Stolte, J. Soil surface roughness: Comparing old and new measuring methods and application in a soil erosion model. Soil 2015, 1, 399–410. [Google Scholar] [CrossRef]
- Heng, B.C.P.; Chandler, J.H.; Armstrong, A. Applying close range digital photogrammetry in soil erosion studies. Photogramm Rec. 2010, 25, 240–265. [Google Scholar] [CrossRef]
- Gilliot, J.M.; Vaudour, E.; Michelin, J. Soil surface roughness measurement: A new fully automatic photogrammetric approach applied to agricultural bare fields. Comput. Electron. Agric. 2017, 134, 63–78. [Google Scholar] [CrossRef]
- Arzahn, P.; Rieke-Zapp, D.; Ludwig, R. Assessment of soil surface roughness statistics for microwave remote sensing applications using a simple photogrammetric acquisition system. ISPRS J. Photogramm. Remote Sens. 2012, 72, 80–89. [Google Scholar] [CrossRef]
- Cierniewski, J.; Królewicz, S.; Kaźmierowski, C. Annual dynamics of shortwave radiation as consequence of smoothing of previously plowed and harrowed soils in Poland. J. Appl. Meteorol. Climatol. 2017, 56, 735–743. [Google Scholar] [CrossRef]
- Cierniewski, J.; Ceglarek, J.; Karnieli, A.; Ben-Dor, E.; Królewicz, S.; Kaźmierowski, C. Shortwave radiation affected by agricultural practices. Remote Sens. 2018, 10, 419. [Google Scholar] [CrossRef]
- Richter, R. Atmospheric/Topographic Correction for Satellite Imagery–ATCOR2/3 User Guide; DLR-German Aerospace Center: Cologne, Germany, 2010; pp. 1–165. [Google Scholar]
- International Union of Soil Sciences Working Group World Reference Base. World Reference Base for Soil Resources 2014. World Soil Resource Rep. 106, 192p. Available online: http://www.fao.org/3/i3794en/I3794en.pdf (accessed on 11 May 2021).
- Ravikovitch, S. Guidebook and Map of Israel Soils; Hebrew University Magnes Press: Jerusalem, Israel, 1969. [Google Scholar]
- Burt, R. Soil Survey Field and Laboratory Methods Manual; Soil Survey Investigations Report No. 51, Version 2.0; Soil Survey Staff, Ed.; U.S. Department of Agriculture, Natural Resources Conservation Service: Lincoln, NE, USA, 2014; p. 457. [Google Scholar]
- Tóth, G.; Jones, A.; Montanarella, L. The LUCAS topsoil database and derived information on the regional variability of cropland topsoil properties in the European Union. Environ. Monitor. Assess. 2013, 185, 7409–7425. [Google Scholar] [CrossRef]
- Terelak, H.; Stuczynski, T.; Motowicka-Terelak, T.; Maliszewska-Kordybach, B.; Pietruch, C. Monitoring of chemistry of arable soils in Poland in 2005–2007; Inspection of Environmental Protection: Warsaw, Poland, 2008; p. 135. (In Polish) [Google Scholar]
- Taconet, O.V.; Ciarletti, V. Estimating soil roughness indices on a ridge and-furrow surface using stereo photogrammetry. Soil Tillage Res. 2007, 93, 64–76. [Google Scholar] [CrossRef]
- Cierniewski, J.; Królewicz, S.; Kaźmierowski, C.; Ceglarek, J. A tool for predicting diurnal soil albedo variation in Poland and Israel. Special Issue: 34th EARSeL Symposium, University of Warsow, Poland. EARSeL eProceedings 2014, 13, 36–40. [Google Scholar]
- Gautier, C.; Diak, G.; Masse, S. A Simple Physical Model to Estimate Incident Solar Radiation at the Surface from GOES Satellite Data. J. Appl. Meteorol. 1980, 19, 1005–1012. [Google Scholar] [CrossRef]
- Frouin, R.; Lingner, D.W.; Gautier, C.; Baker, K.S.; Smith, R.C. A Simple Analytical Formula to Compute Clear Sky Total and Photosynthetically Available Solar Irradiance at the Ocean Surface. J. Geophys. Res. 1989, 94, 9731. [Google Scholar] [CrossRef]
- Allen, R.G.; Rick, G.; Food and Agriculture Organization of the United Nations. Crop Evapotranspiration: Guidelines for Computing Crop Water Requirements; Food and Agriculture Organization of the United Nations: Rome, Italy, 1998; ISBN 9251042195. [Google Scholar]
- Cierniewski, J. Spectral Reflectance of Soils; Springer Series in Light Scattering; Springer Nature Switzerland: Cham, Switzerland, 2020; pp. 135–192. [Google Scholar]
- Schneider, S.H.; Dickinson, R.E. Climate modeling. Rev. Geophys. 1974, 12, 447–493. [Google Scholar] [CrossRef]
- Desjardins, R.L. The Impact of Agriculture on Climate Change. In Proceedings of the North American Biotechnology Conference (NABC 21 symposium Adapting Agriculture to Climate Change, Saskatoon, Saskatchewan, Canada, 24–26 June 2009. [Google Scholar]
- Liu, S.; Roujean, J.L.; Tchuenté, A.K.; Calvet, J.C.; Ceamanos, X. A parameterization of SEVIRI and MODIS daily surface albedo with soil moisture: Calibration and validation over southwestern France. Remote Sens. Environ. 2014, 144, 137–151. [Google Scholar] [CrossRef]


Publisher’s Note: MDPI stays neutral with regard to jurisdictional claims in published maps and institutional affiliations. |
© 2021 by the authors. Licensee MDPI, Basel, Switzerland. This article is an open access article distributed under the terms and conditions of the Creative Commons Attribution (CC BY) license (https://creativecommons.org/licenses/by/4.0/).