Article

A Hybrid Approach of Combining Random Forest with Texture Analysis and VDVI for Desert Vegetation Mapping Based on UAV RGB Data

1
College of Forestry, Shanxi Agricultural University, Taigu 030801, China
2
Research Institute of Forest Resource Information Techniques, Chinese Academy of Forestry, Beijing 100091, China
3
Institute of Forestry, Tribhuwan University, Kathmandu 44600, Nepal
*
Author to whom correspondence should be addressed.
Remote Sens. 2021, 13(10), 1891; https://doi.org/10.3390/rs13101891
Submission received: 12 April 2021 / Revised: 29 April 2021 / Accepted: 6 May 2021 / Published: 12 May 2021
(This article belongs to the Section Forest Remote Sensing)

Abstract

:
Desert vegetation is an important part of arid and semi-arid areas, which plays an important role in preventing wind and fixing sand, conserving water and soil, maintaining the balanced ecosystem. Therefore, mapping the vegetation accurately is necessary to conserve rare desert plants in the fragile ecosystems that are easily damaged and slow to recover. In mapping desert vegetation, there are some weaknesses by using traditional digital classification algorithms from high resolution data. The traditional approach is to use spectral features alone, without spatial information. With the rapid development of drones, cost-effective visible light data is easily available, and the data would be non-spectral but with spatial information. In this study, a method of mapping the desert rare vegetation was developed based on the pixel classifiers and use of Random Forest (RF) algorithm with the feature of VDVI and texture. The results indicated the accuracy of mapping the desert rare vegetation were different with different methods and the accuracy of the method proposed was higher than the traditional method. The most commonly used decision rule in the traditional method, named Maximum Likelihood classifier, produced overall accuracy (76.69%). The inclusion of texture and VDVI features with RGB (Red Green Blue) data could increase the separability, thus improved the precision. The overall accuracy could be up to 84.19%, and the Kappa index with 79.96%. From the perspective of features, VDVI is less important than texture features. The texture features appeared more important than spectral features in desert vegetation mapping. The RF method with the RGB+VDVI+TEXTURE would be better method for desert vegetation mapping compared with the common method. This study is the first attempt of classifying the desert vegetation based on the RGB data, which will help to inform management and conservation of Ulan Buh desert vegetation.

1. Introduction

Desertification is a global environmental problem [1], which affects 14% of the world's land area and nearly 1 billion people, and it continues to expand at a rate of 57,000 km2 per year. China is one of the most affected countries by desertification in the world [2]. Nearly 1.7 million km2 of desert, Gobi and desertified land in China, of which nearly 400,000 km2 is desertified land, posing a serious threat to the ecological environment and sustainable social and economic development in northern China [3].
The monitoring and evaluation of desertification has always been a hot topic in the world and also it is an important way to prevent and control desertification effectively [4]. Desertification study has become a hot issue in multi-disciplinary study, and rapid and accurate acquisition of desert vegetation information is the foundation and key link of desertification study. Remote sensing has been widely used in the monitoring and evaluation of land desertification due to its advantages of wide observation range, large amount of information, fast updating of data, and high accuracy.
At present, many traditional sensor data (such as MODIS and Landsat data, etc.) have been applied to desertification monitoring, but they can only capture the integrated vegetation cover information within the pixel [5], are unable to provide more specific information about desertification. The development of unmanned aerial vehicles (UAVs) can solve this problem. Compared with satellite remote sensing, UAVs with the high resolution image have rich geometric texture information [5] and have the ability to capture detailed information. UAV with high resolution is rarely reported in desert vegetation mapping at home and abroad, especially at home.
Unmanned aerial vehicle (UAV) acts as a powered, controllable, low-altitude flight platform capable of carrying a variety of equipment and performing a variety of missions [6]. Its combination with remote sensing technology has incomparable advantages over traditional satellite remote sensing technologies, such as low cost, simple operation, fast image acquisition and high spatial resolution [7]. It has been widely used in land monitoring and urban management, urban vegetation mapping [8,9] geological disasters, environmental monitoring, emergency support and other important fields [10,11,12,13,14]. However, it is rarely used in field of mapping the desert vegetation. The two main characteristics of the desert vegetation are vegetation index and texture.
Vegetation index is a simple and effective measurement for the status of surface vegetation, which can effectively reflect the vegetation vitality and vegetation information, and becomes an important technical means for remote sensing inversion of biophysical and biochemical parameters as chlorophyll content, FVC (fractional vegetation coverage), LAI (leaf area index), biomass, net primary productivity, and photosynthetic effective radiation absorption [15].
The reflection spectrum of healthy green vegetation in visible band is characterized by strong absorption of blue and red, strong reflection of green, and strong reflection in near-infrared band [16]. Based on the reflection spectral characteristics of green vegetation, a large number of vegetation indices based on visible-infrared band calculation have been proposed in the field of vegetation remote sensing. Common vegetation indexes based on multi-spectral bands include ratio vegetation index (RVI) [17], differential vegetation index (DVI) [18], normalized difference vegetation index (NDVI) [19] and soil regulatory vegetation index (SAVI) [20], etc. The operational bands are mainly based on visible and near-infrared spectral bands. The acquisition of near-infrared spectrum information requires the use of high-altitude remote sensing technology. However, due to its difficulties in acquisition and poor timeliness, the calculation of vegetation index based on the obtained remote sensing data cannot distinguish vegetation in a small range, which leads to the large errors and lag defects in the extracted vegetation information. UAV images are characterized by high resolution, rich texture features and easy access, and contain visible band data. Visible light vegetation index can be established based on visible light channels, and vegetation coverage can be estimated after vegetation information is extracted. In the visible band, the reflectance of green vegetation is high in the green light channel, but low in the red and blue light channels. Therefore, the calculation between the green light channel and the red and blue light channels can enhance the difference between vegetation and the surrounding ground objects, so as to facilitate the later extraction of target information more accurately. While there are many vegetation indexes based only on visible bands. Such as EXG (excess green), NGRDI (normalized green-red difference index), NGBDI (normalized green-blue difference index), and RGRI (red-green ratio index), MSAVI (modified soil-adjusted vegetation index) [20], EGRBDI (excess green-red-blue difference index) [21]. However, the spectral curve of desert vegetation usually does not have typical characteristics of healthy vegetation, and there is no obvious strong absorption valley and reflection peak, and the spectral information of vegetation detected on remote sensing image is relatively weak [22]. VDVI (visible light difference vegetation index) will play a better role and have better applicability in the extraction of vegetation information of UAV image in visible band only [16]. Therefore, visible light difference vegetation index (VDVI) is used in this study to estimate desert vegetation coverage rate.
Vegetation index can accurately distinguish vegetation and non-vegetation, but the vegetation index of shrub and herb is similar, so vegetation index cannot be used to distinguish vegetation [23]. It is difficult to distinguish the phenomena of “same object different spectrum” and “same spectrum foreign body” in the image base on the pixels [24]. Moreover, the accuracy is low with the high-resolution remote sensing, and the single-scale object-oriented segmentation classification is prone to “over-segmentation” and “under-segmentation” problems. The experience is needed for the researches to determine an optimal scale level to segment objects. To solve this problem, there have been several geospatial techniques to improve the classification accuracy, as an alternative to spectral-based traditional classifiers. Such as the GLCM (gray level co-occurrence matrix [25]); fractal analysis [26]; spatial auto-correlation and wavelet transforms [27]. In the study, the GLCM is adopted due to it is a widely used texture statistical analysis method and texture measurement technology.
And which method shall be used for desert mapping? With the rapid development of remote sensing technology, pixel-based image classification and object-based image analysis (OBIA) are widely used in classifying high resolution remote sensing images [28,29,30,31]. The important point of OBIA is to combine numerous textural, spectral and spatial features into the classification process, and which was based on multi-scale image segmentation, therefore, it could improve the accuracy. but there are challenges with the OBIA process, the suitable features for image classification and find out the optimal scale value for image segmentation [32]. The accuracy of OBIA depends on experience of the researchers and a priori knowledge. Deep learning is also widely used in many remote sensing related applications [33,34,35], including image registration, classification, object detection, land-use classification, but it takes large amount of training data, but would have poor interpretability. In this study, a robust classifier random forest [36] was adopted instead of OBIA, because of its simplicity and high performance [37].
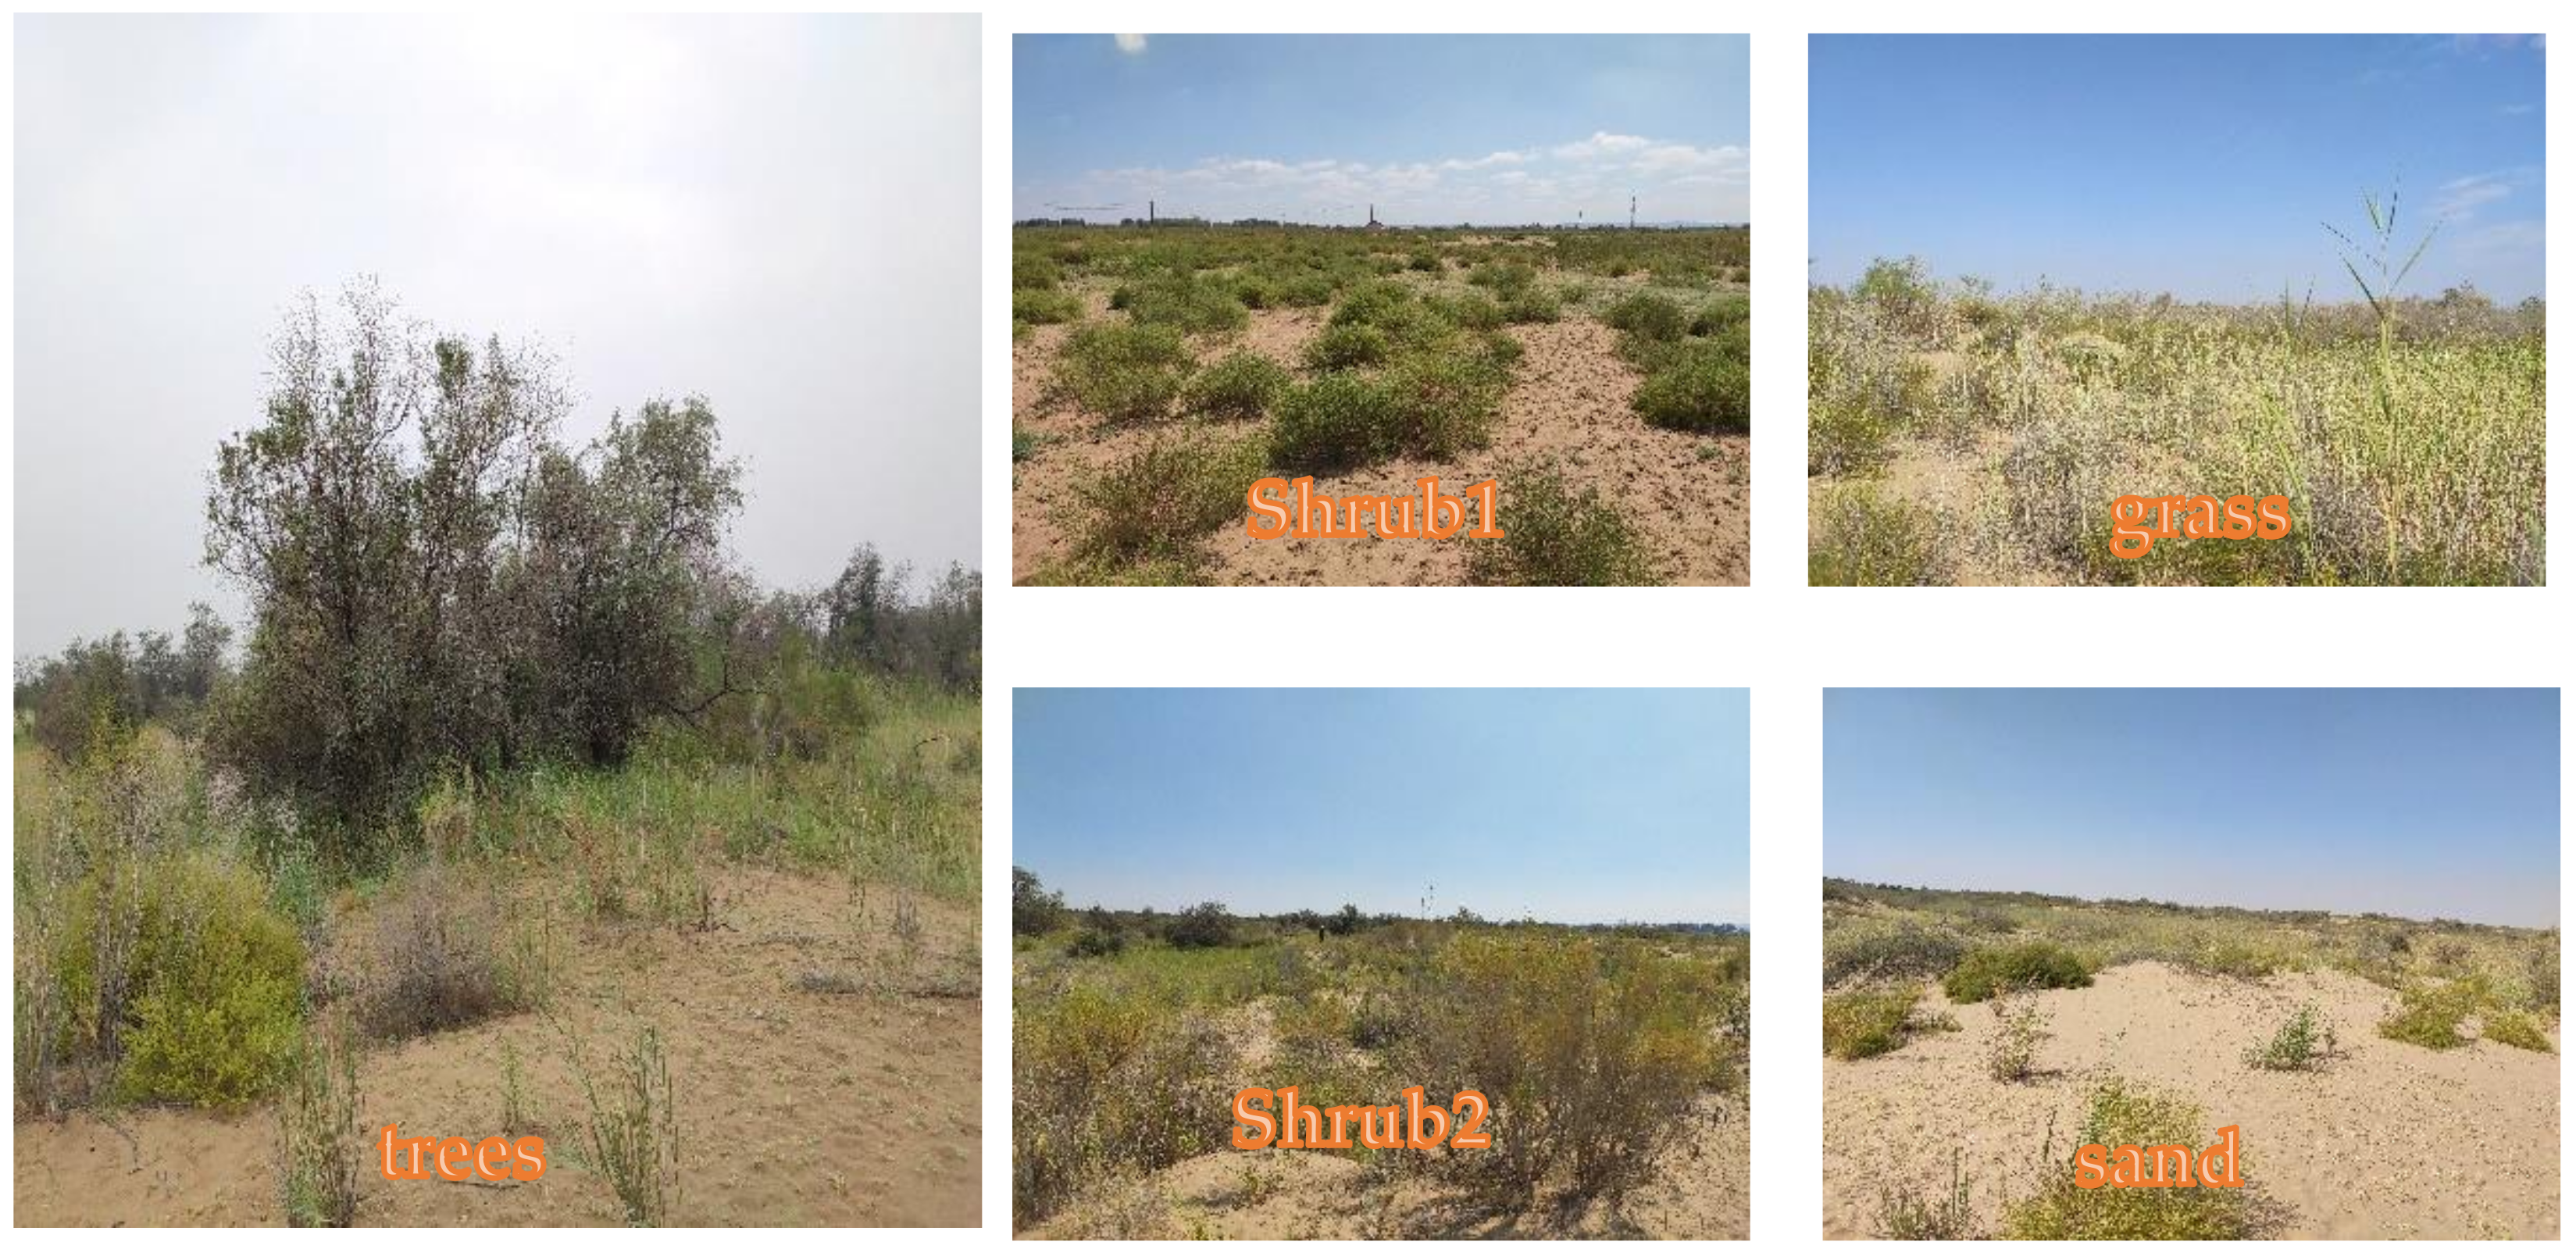
Therefore, in this study, based on the UAV RGB high resolution data including texture and VDVI features, the Random Forest classifier was used to map the desert vegetation. The desert vegetation were classified into five typical types, which include trees, shrub1(Artemisia desertorum Spreng), shrub2(Haloxylon ammodendron (C. A. Mey.) Bunge), grass and sand. The aims of the study: (1) to determine whether Random Forest classifier shows good performance in desert vegetation mapping; (2) to test if the inclusion of VDVI and texture features improve classification accuracy in heterogeneous desert vegetation; and (3) to compare the proposed method with the traditional Maximum Likelihood to verify the performance.
In a whole, the main aim is to measure desert vegetation as well as create accurate desert land cover maps (>80%), for future use in ecological modeling of desert landscapes. In the study, a hybrid classification approach was used for a subset of these cover types based on the pixel approaches to accurately reflect spatial heterogeneity on the small scale in ecology.

2. Materials and Methods

2.1. Study Area

The study area is one of the ecological distinct sites in Ulan Buh desert; the desert is located in the northern of Inner Mongolia province, 106°38′42″ E–106°57′00″ E, 40°17′24″ N–40°28′36″ N (Figure 1); the area covered approximately 14,905.13 km2; it is the plot area for desertification control in forestry. The climate is the transition from semi-arid to arid. The mean annual precipitation is 1474 mm, mean annual evaporation is 2458.4 mm, mean annual relatively humid is 47.3%, mean annual temperature is 7.4 °C. In the distribution of desert vegetation in China, the eastern edge of the Ulan Buh desert is the very important dividing line between desert and the grassland in the central Asian.
Control point layout and high precision GPS positioning measurement were carried out in the study area. The receiver of Zenith 15 Pro RTK (Real-time kinematic) was used, and the horizontal measurement error was 1 cm, the vertical measurement error was 2 cm. The vegetation at this study site was characterized by the main trees Elaeagnus angustifolia, Corethrodendron scoparium, shrubs include Artemisia ordosica, Nitraria tangutorum, Haloxylon ammodendron, and so on; the grasses contain Eragrostis minor, Bassia dasyphylla, and Salsola ruthenica.

2.2. Data Acquisition and Preparing

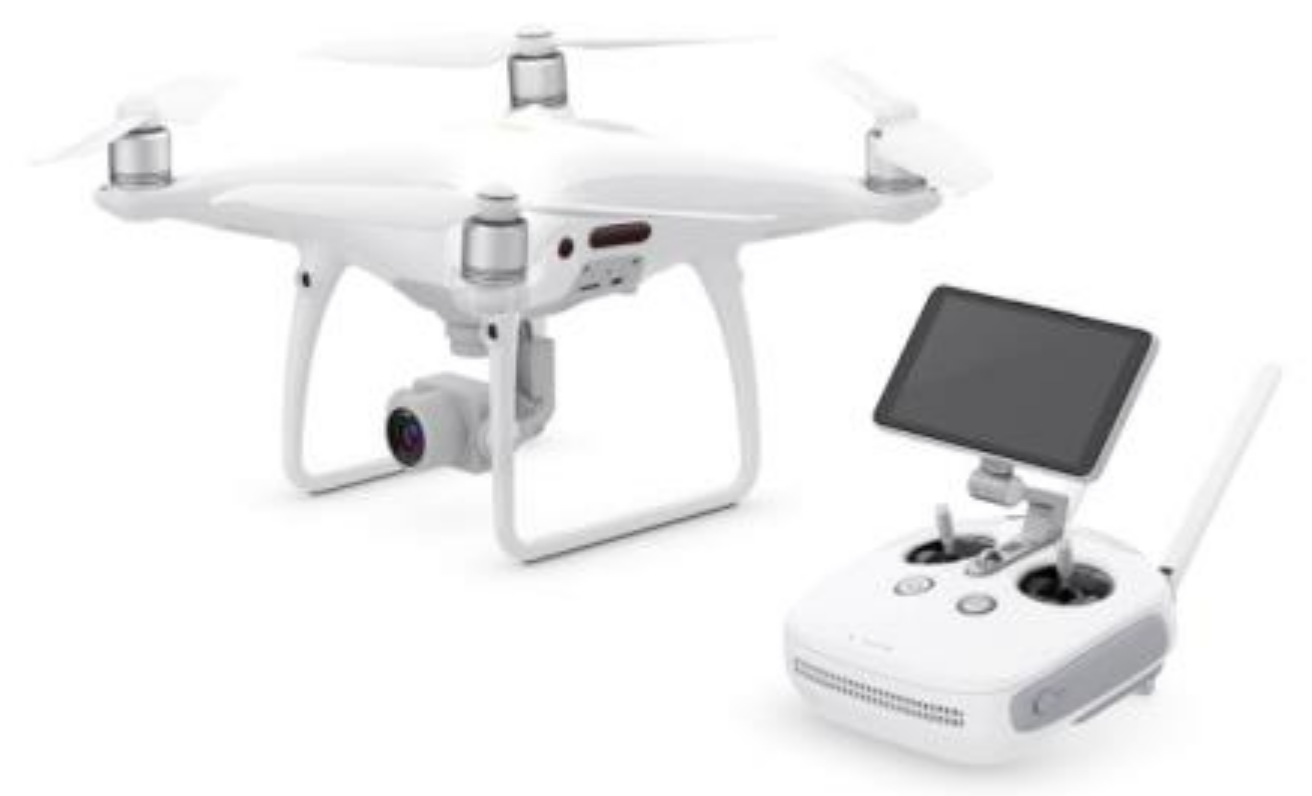
The weather was clear (<10% cloud cover) when the images were taken, and the data were collected within 1 hour of solar noon to avoid large shadows associated with a low sun angle. Meanwhile, when the winds exceed 6 m/s, the flying will be stopped. Therefore, the UAV images obtained were less affected by weather and other factors. The imagery was acquired with a mini-UAV called DJI Phantom 4 RTK (Figure 2). The UAV system consists of sensor payload, auto pilot, GPS/INS and ground station. Due to its low payload capacity, the DJI Phantom 4 RTK UAV only carries a lightweight off-the-shelf digital camera onboard which acquires RGB images. The flight altitude was 70 m resulting in a resolution of 2 cm per-pixel. To satisfy the requirement of aerial photography, the forward and side overlap were set to be 80% and 70% during mission planning, respectively. The study area is 100 m2, contains 5137 × 5137 pixels (Table 1.).
Since the content of this study does not involve the position and range of the central wavelength of each band, the acquired UAV images do not need to be subjected to strict radiometric correction.
According to the distribution of features in the study area, with the area of 20 × 20 m covering typical features in the study area were set in each sample area on 26 August 2019. The quadrate records included the GPS coordinates of the center point, the type of features and the canopy width of shrubs.

2.2.1. Image Data Preprocessing

The pose of the digital camera becomes the key factor that affects the overlapping degree of the shot image [38]. Considering the drone itself, the load capacity and wind speed in the experimental area have little influence. In this experiment, there is no additional device to stabilize the camera, but to pose the camera as much as possible fixed. In addition, due to the large amount of data in digital photos, the ability of real-time transmission is not yet achieved. The image data is stored in the large-capacity storage card in the camera.
The acquired UAV images are processed through quality check and screening, image enhancement, feature point extraction and matching, regional network adjustment, and optimization. Image processing mainly includes color leveling and edge cutting, aerial triangulation, orthophoto generation, and precision inspection, etc.
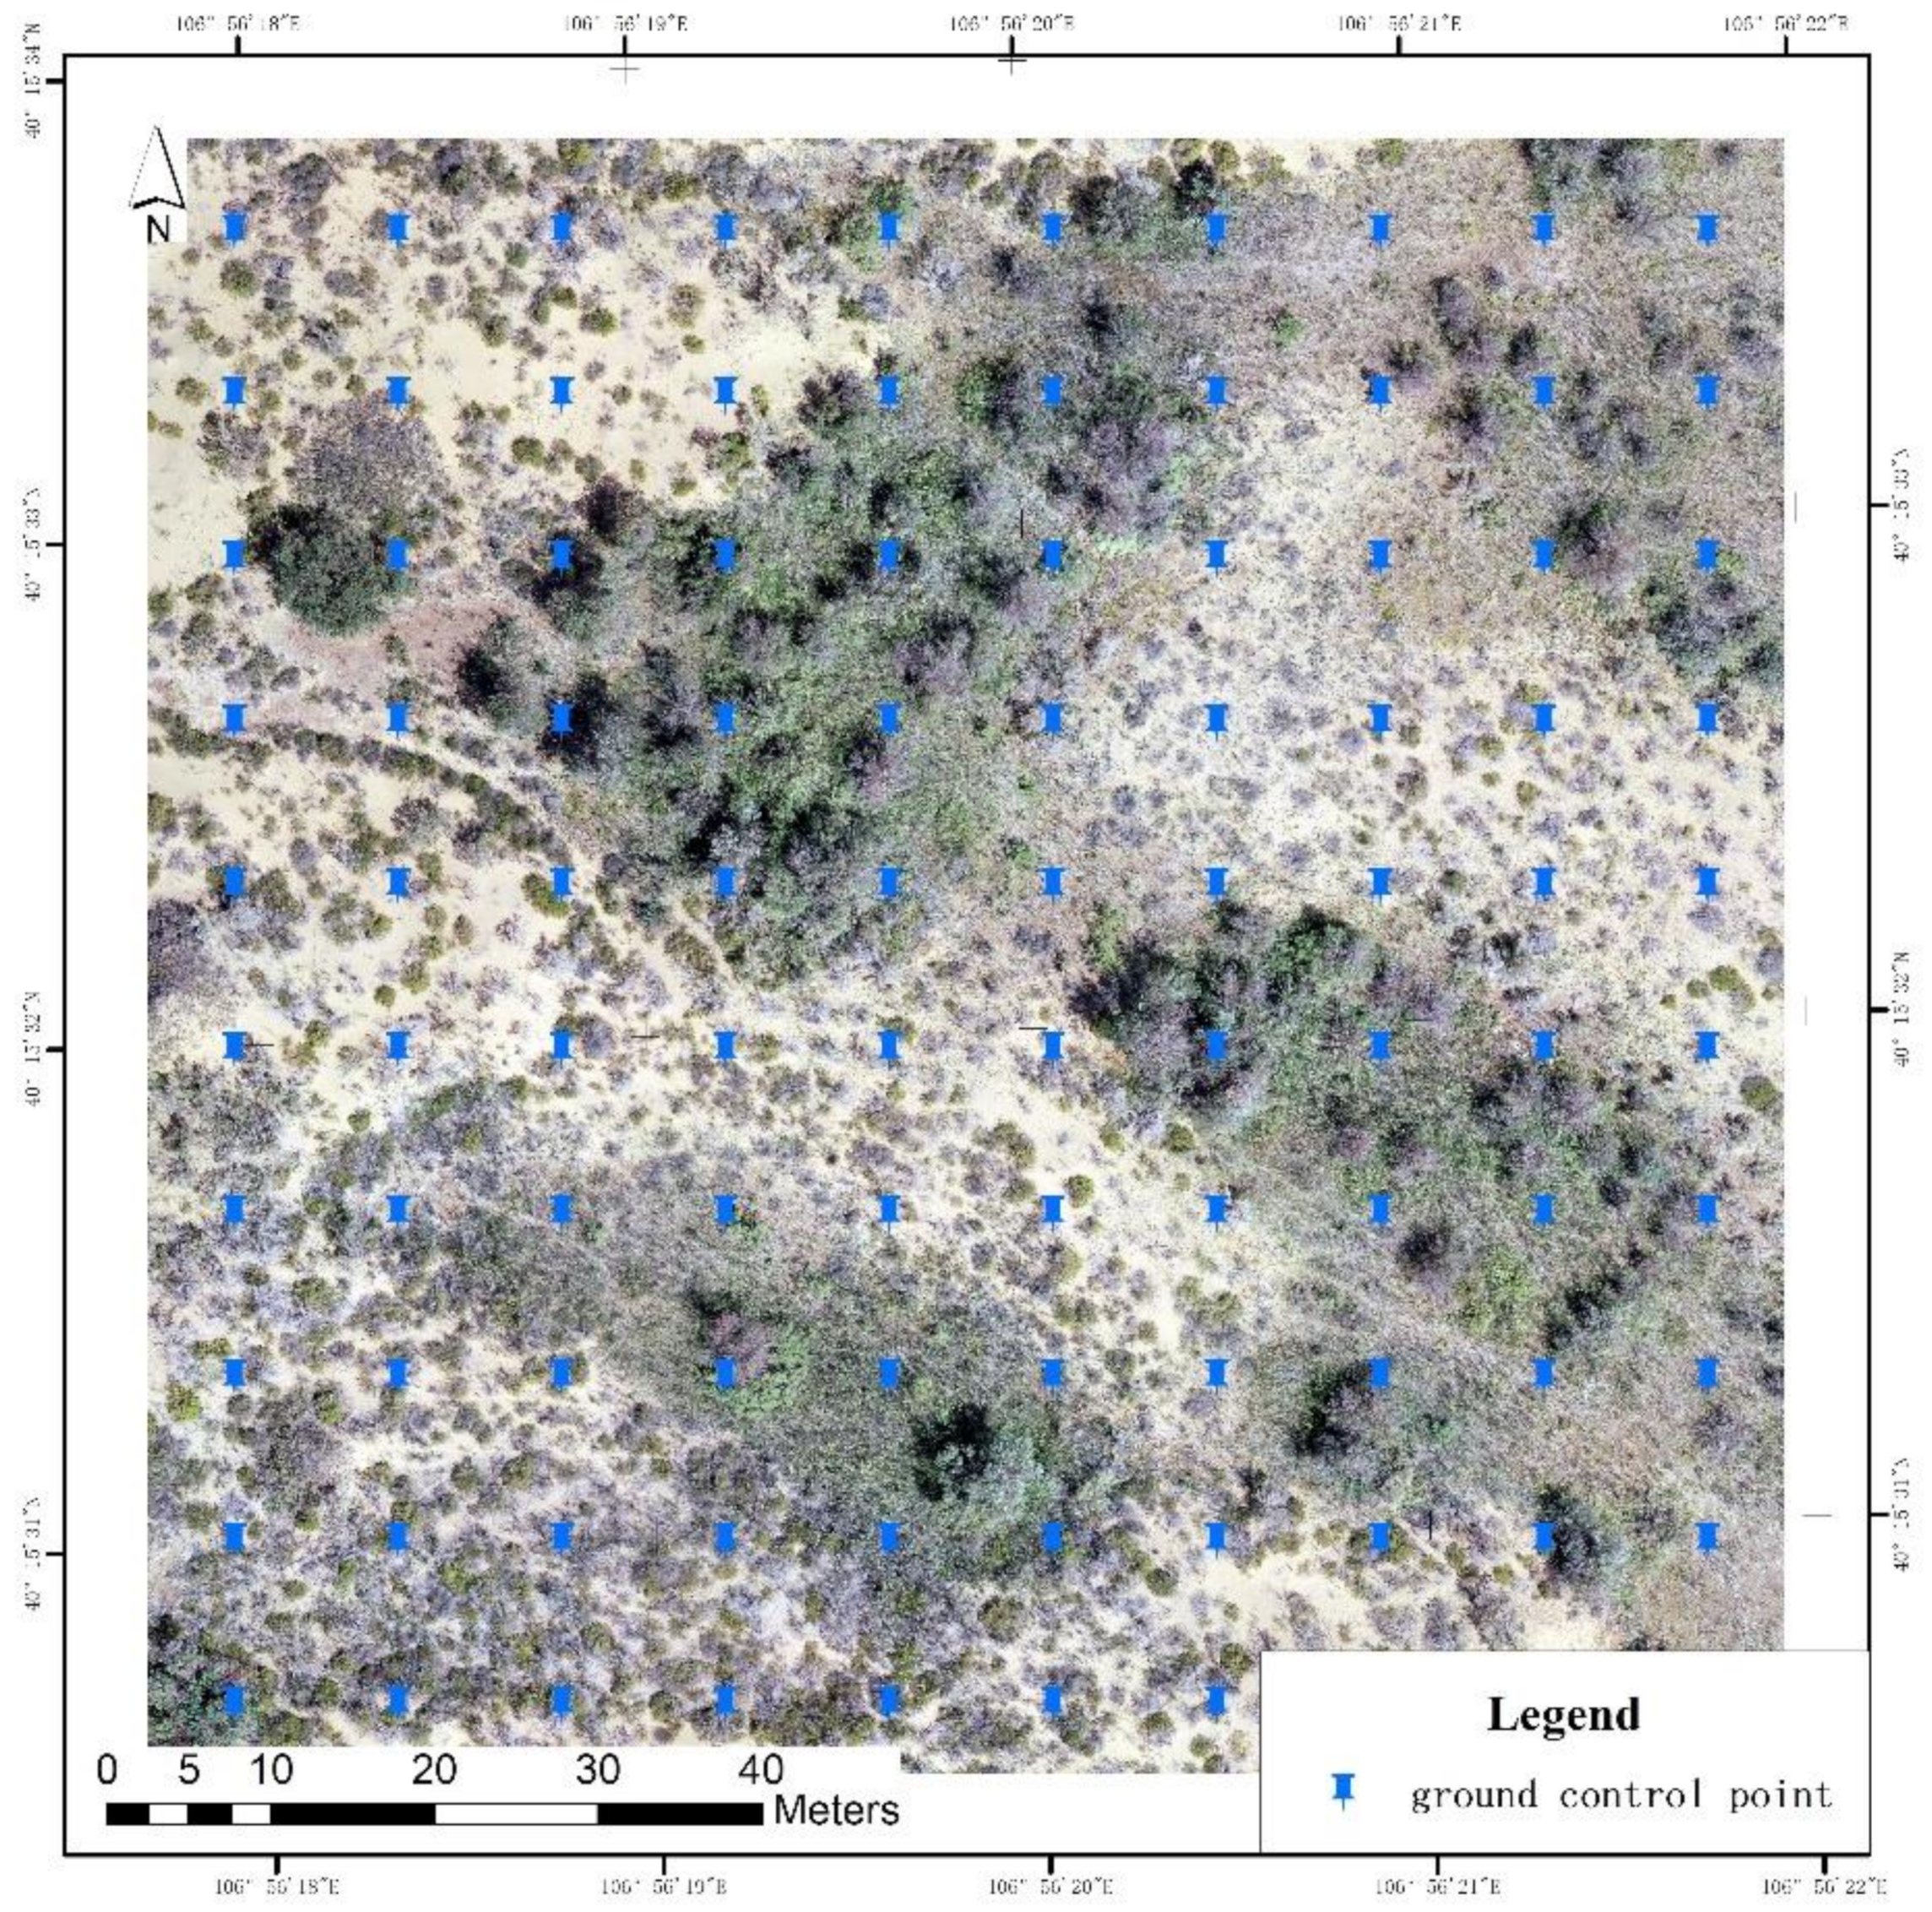
In August 2019, when the experimental images were taken, 100 ground control points were measured synchronously with GPS (Figure 3), and the plane and elevation accuracy were able to meet the requirements. In order to verify the accuracy of the generated orthophoto image, 10 ground control points are randomly selected and measured on the screen. It was found that the median error of the plane position residual error of the ground control point was about 0.025 m after inspection (Table 2), indicating that the accuracy of the generated orthophoto image was relatively ideal, which could meet the requirements of subsequent applications.

2.2.2. Classification and Sample Collection

The following principles are adopted for the sample of different types of ground: (1) For each type of ground, select homogeneous areas with appropriate area and a certain distance from the boundary; (2) Each type of surface features selected should cover various brightness areas, including low, medium and high brightness areas, to maximize the dynamic range of different brightness, and ensure the analysis of the relationship between objects in various places within a wide brightness value range; (3) The number of selected sample areas for each type of ground features should be balanced as far as possible, and the number of selected sample areas for some ground features with great differences in color and brightness can be increased moderately. Obtain ROIs (region of interesting) from RGB color images to create an area of interest. To evaluate the ROIs, the separate tools was used to calculate the Jeffreys–Matusita distance [39] and Transformed Divergence. The size of the two parameters determines the rationality of training sample selection. (I.e., When the parameter value is 1.9–2.0, there is good separability between samples, that is, qualified samples; ii. When the parameter value is 1.0–1.8, the sample must be selected again; and iii. When the parameter is 0.1–1.0, the difference between the two types of samples is very small, and the samples are merged into one [40]). Make sure both parameter values of each combination are bigger than 1.9.
Follow the principles, five land cover classes were selected (Figure 4). 64 representative sample areas were manually random sketched through software ENVI5.3, in the way of human-computer interaction and conducted field investigation and inspection. The mean value is used as the evaluation index for the overall difference of pixel values of various ground objects in visible bands, and the fluctuation range of pixel values of various ground objects in various bands is evaluated with standard deviation (Table 3). Moreover, the information among different classes was evaluated with the range of one standard deviation.

2.2.3. VDVI

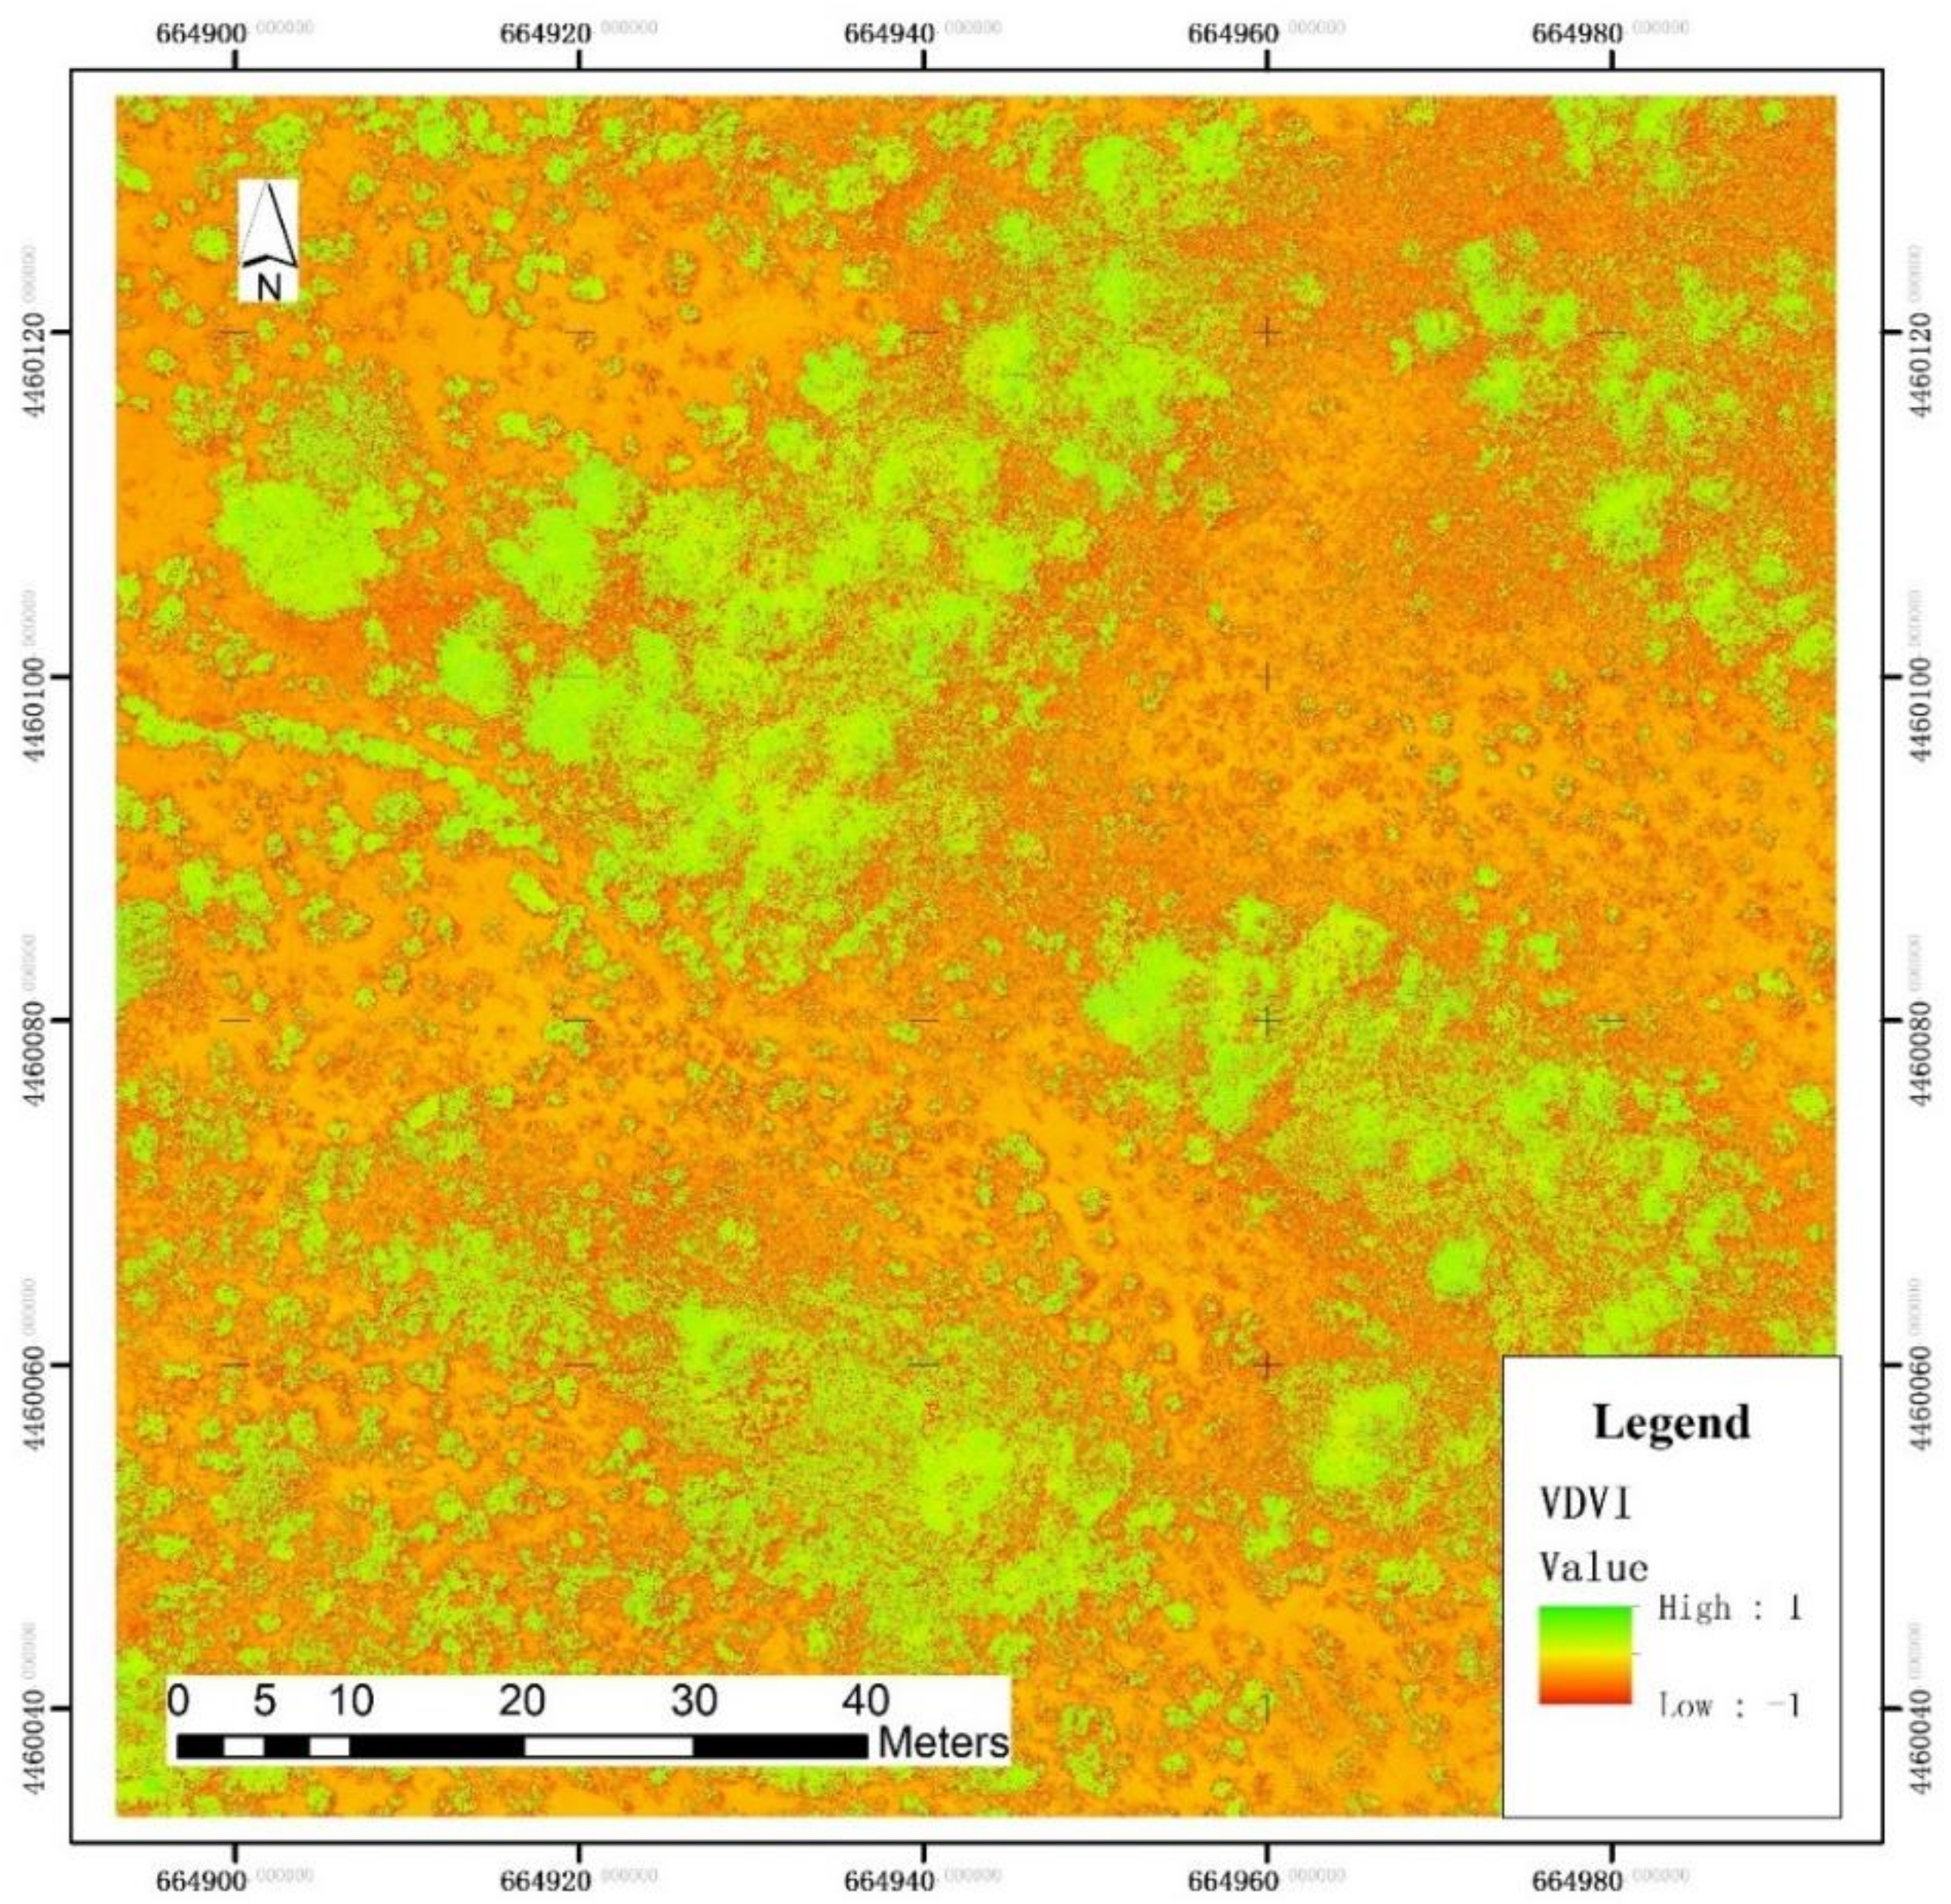
The construction of the visible light difference vegetation index (VDVI) is based on the normalized difference vegetation index (NDVI), which is widely used at present. Fully sensitive to the reflection and absorption of light by vegetation, the band of G(ρG) replaces the near-infrared band(ρNIR) and combines with the band of red(ρR) and blue(ρB) (ρR + ρB) to replace the red band of red(ρR), and multiplies the green band by 2 to make it numerally equivalent to ρR + ρB [41]. The VDVI index has a high degree of separation between vegetation and non-vegetation, and its values are almost not intersected. Therefore, it is suitable for the extraction of vegetation photographed by UAV [42]. The index of VDVI (Figure 5) calculated by the software of ENVI 5.3. was shown in Table 3.
V D V I = 2 × ρ G ρ R + ρ B 2 × ρ G + ρ R + ρ B

2.2.4. Texture Features

Texture refers to the visual effect caused by spatial variation in tonal quantity over relatively small areas [43]. Haralick first proposed gray level co-existence matrix (GLCM) in 1973 [44]. It is superior to gray level run-length method and spectral method. The GLCM provides the spatial relationship between the pixels and the overall image in the image as well as between the pixels and the pixels, using the union of the pixels at two locations. Texture analysis has been widely used in high resolution image processing. According to previous studies [30,31,45,46], The inclusion of texture can improve classification accuracy. In this paper, the most commonly used eight texture parameters are selected (Table 4) [47].

2.3. Processing Workflow

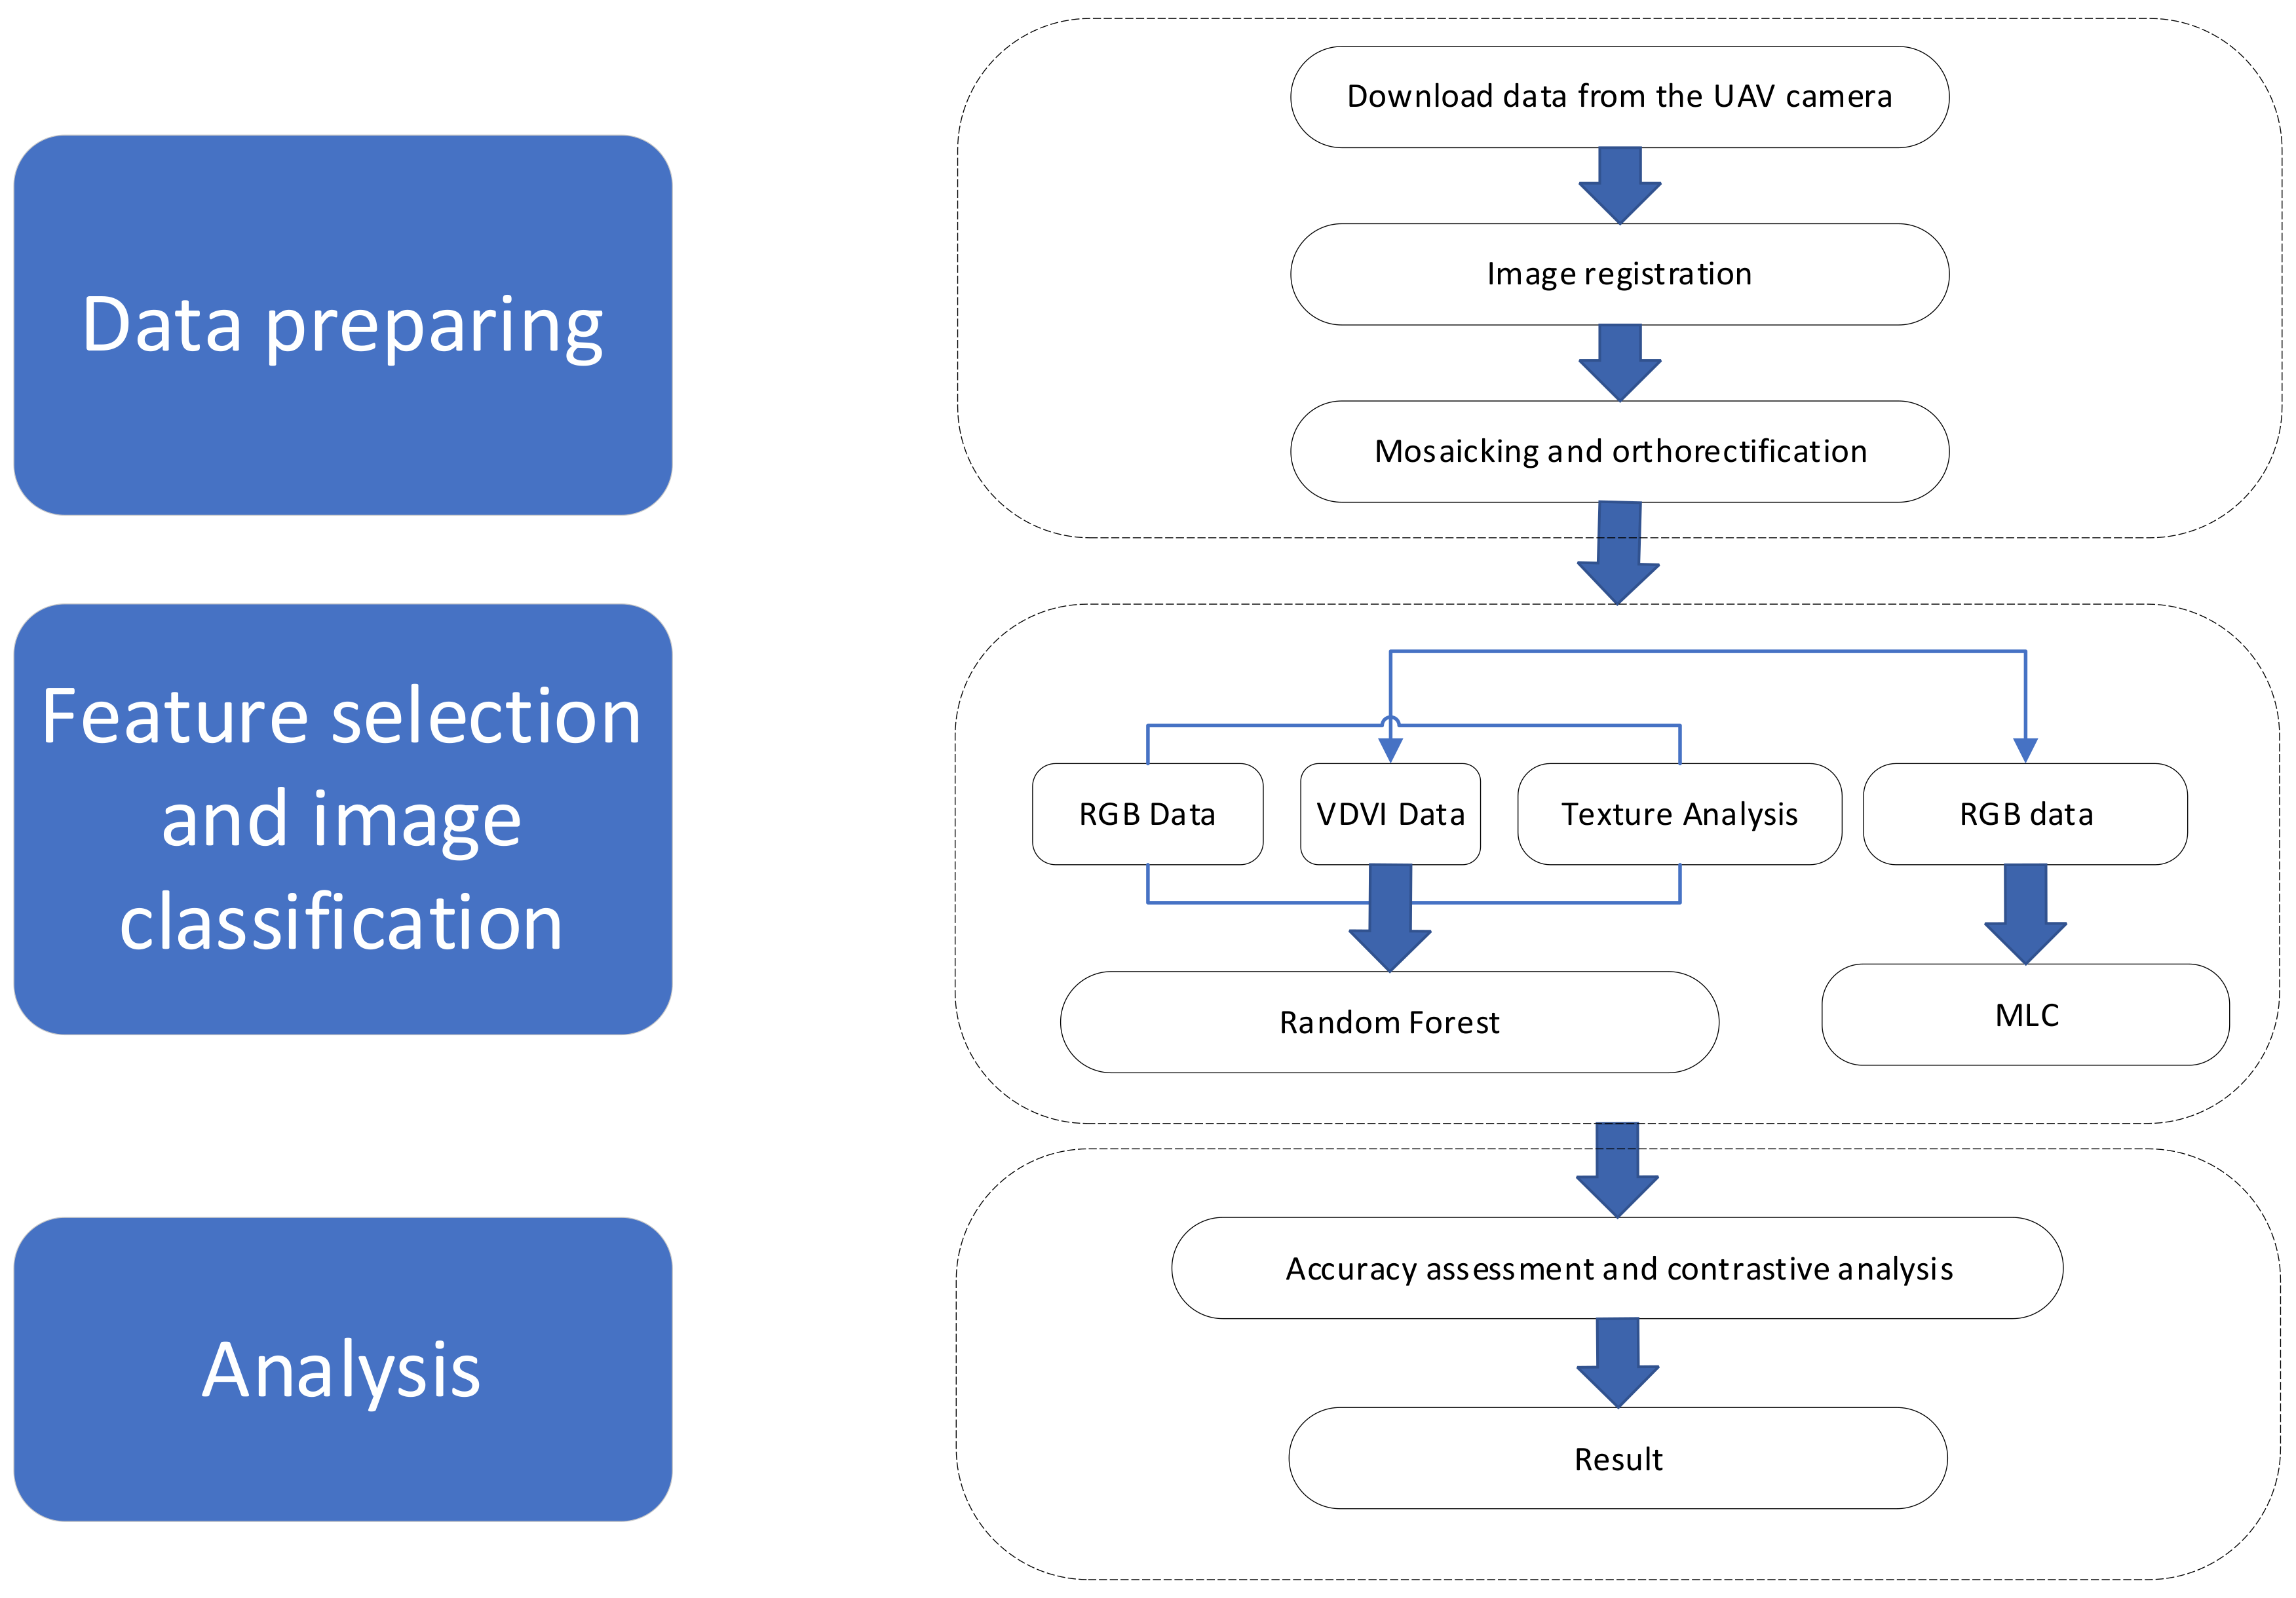
The whole processing workflow of this study is shown in Figure 6, which contains three parts: (1) Data preparing (2) Feature selection and image classification (3) Accuracy assessment and analysis. Data preparing involves download data from the UAV camera, image registration, auto-mosaicking, and orthorectification. Feature selection was based on the RGB image, and the image classification was based on two different machine learning method, Random Forest, and MLC, training samples contains both RGB digital number, VDVI index and texture measures at different scales were picked to train the classifier. Accuracy assessment was done based on confusion matrix.

2.4. Machine Learning

2.4.1. Random Forest

The RF method is an extension of classification and regression trees (CART; [48]. The function RF can take a formula or, in two separate arguments, a data frame with the predictor variables, and a vector with the response. If the response variable is a factor (categorical), RF will do classification, otherwise it will do regression. In remote sensing fields, RF has been widely used for image classification. In the model, a bootstrap strategy to randomly select 20% of the training samples to build decision tree, the remaining 80% of the samples are used for inner cross-validation to evaluate the classification accuracy, and the predictor variables are selected to split the decision tree by Gini index.
  • Suppose there is a data set D = {xi1, xi2, …, xin, yi} (i∈ [1, m]) with a feature number N, and sampling with replacement can generate a sampling space (m × n) m × n.
  • Build a basic learner (decision tree): dj = {xi1, xi2, …, xin, yi} (i∈ [1, m]) generate a decision tree for each sample (where K << M), and record the results of each decision tree hj(x).
  • Training times to T H(x) = max t = 1 T ф h j x = y , which ф(x) is an algorithm (absolute majority voting, the majority voting, weighted voting method and the like).
RF requires two parameters: (1) mtry, the number of predictor variables performing the data partitioning at each node; (2) ntree, the total number of trees to be grown in the model run. In the study, the ntree (Number of trees to grow) was set to 500 because 500 is recommended as an acceptable ntree value [49], and mtry to 5 after some initial tuning experiments based on earlier experiences and recommendations from literature [50].

2.4.2. Maximum Likelihood Classification

Maximum likelihood classification (MLC) is a kind of image classification method which uses statistical method to establish a set of nonlinear discriminant functions according to maximum likelihood ratio Bayesian decision criterion among two or more kinds of judgments.
The classification method based on Bayes criterion is a kind of nonlinear classification with the lowest error probability. It is also a widely used and mature algorithm at present. By assuming that the data of each band of remote sensing image is normally distributed, each type of ground object data constitutes a specific point group in space, and each one-dimensional data of each type is normally distributed on its own number line. Classification process first determines all kinds of training samples, and then calculates various statistical characteristic values according to the training sample, in order to establish classification discriminant function, the last scanning images pixel each point by point, and substitute pixel characteristic vector generation into the discriminant function, get the probability of different pixels belongs to, will be to determine pixel belongs to maximum discriminant function of a group [51]. There were 64 optimal training samples area all of which were greater than 64 in this study. Moreover, the pixel counts of the training samples is shown in Table 5.
Its discriminant function is:
M i n = p i n p n = p n i p
where p (n|i) is the pixel probability with eigenvector n in class i; P (i) is the prior probability of class i. By assuming that the spectral features of ground objects obey normal distribution, the above Bayesian discrimination criterion can be expressed as:
M i n = p n i p i = p i c 1 / 2 2 π K / 2 e ( n u ) r c 1 n u / 2
The K-dimensional maximum likelihood discrimination function of class i is obtained by taking the form of logarithm and removing the redundant terms
M i n = ln p i 1 2 ln c 1 2 ( n u ) T C 1 n u
The maximum likelihood discrimination function of different classes is calculated. For different ground object classes i and j, if there is Mj (n)Mi (n), then the pixels are assigned to class i.

2.5. Accuracy Assessment

The accuracy assessment was conducted based on the confusion matrices. The confusion matrix calculates and compares and the position and classification of each measured pixel with the corresponding position and classified pixel in the reference image. Each column of the obfuscating matrix represents a prediction category, and the total number of columns represents the number of data predicted for that category. Each row represents the actual category to which the data belongs, and the total number of rows represents the number of data instances in that class. The values in each column represent the number of classes into which the real data is classified. Confusion matrix using ground truth region of interests. First, the mean overall accuracy with different tuning parameters was calculated to optimize the algorithms. Secondly, based on the overall accuracy, the parameters with the highest mean overall accuracy for each classifier were chosen and compared, the kappa coefficient, and the user’s and producer’s accuracies with the training and validation data. The detailed are given in Equations (5) to (8).
Kappa coefficient, by putting all real reference pixels (N) multiplied by the total confusion matrix and diagonal, then subtract one kind of true reference pixels, and the class to be classified as pixel of the total product, divided by the square of the total number of pixels, minus one in real reference in the total number of pixels, and the classification of the products of the total number of pixels, the summation of all categories. Kappa coefficient calculation results generally range from 0 to 1, and can be divided into five groups to represent different levels of consistency: 0.0 to 0.20 very low agreement, 0.21 to 0.40 similar agreement, 0.41 to 0.60 moderate agreement, 0.61 to 0.80 high agreement, and 0.8 to 1 almost complete agreement [52].
kappa = N i = 1 r X i i i = 1 r X i + X + i N 2 i = 1 r X i + X + i
OA   =   1 N i = 1 r X i j
PA   ( producer s   accuracy )   =   X i j X i +
UA   ( user s   accuracy )   =   X i j X + i
where N is the number of observations, r is the number of rows in the matrix, xij is the number of observations in row i and column j (the diagonal elements), and x+i and xi+ are the marginal totals of row r and column i, respectively [53].
In this study, with the model of RF, the confusion matrix was based on the jack-knife method [54], A nonparametric estimation method. Training data is 80%, while the test data is 20%. With the model of MLC, the confusion matrix was based on the ground truth data.

3. Results

3.1. Classification Results

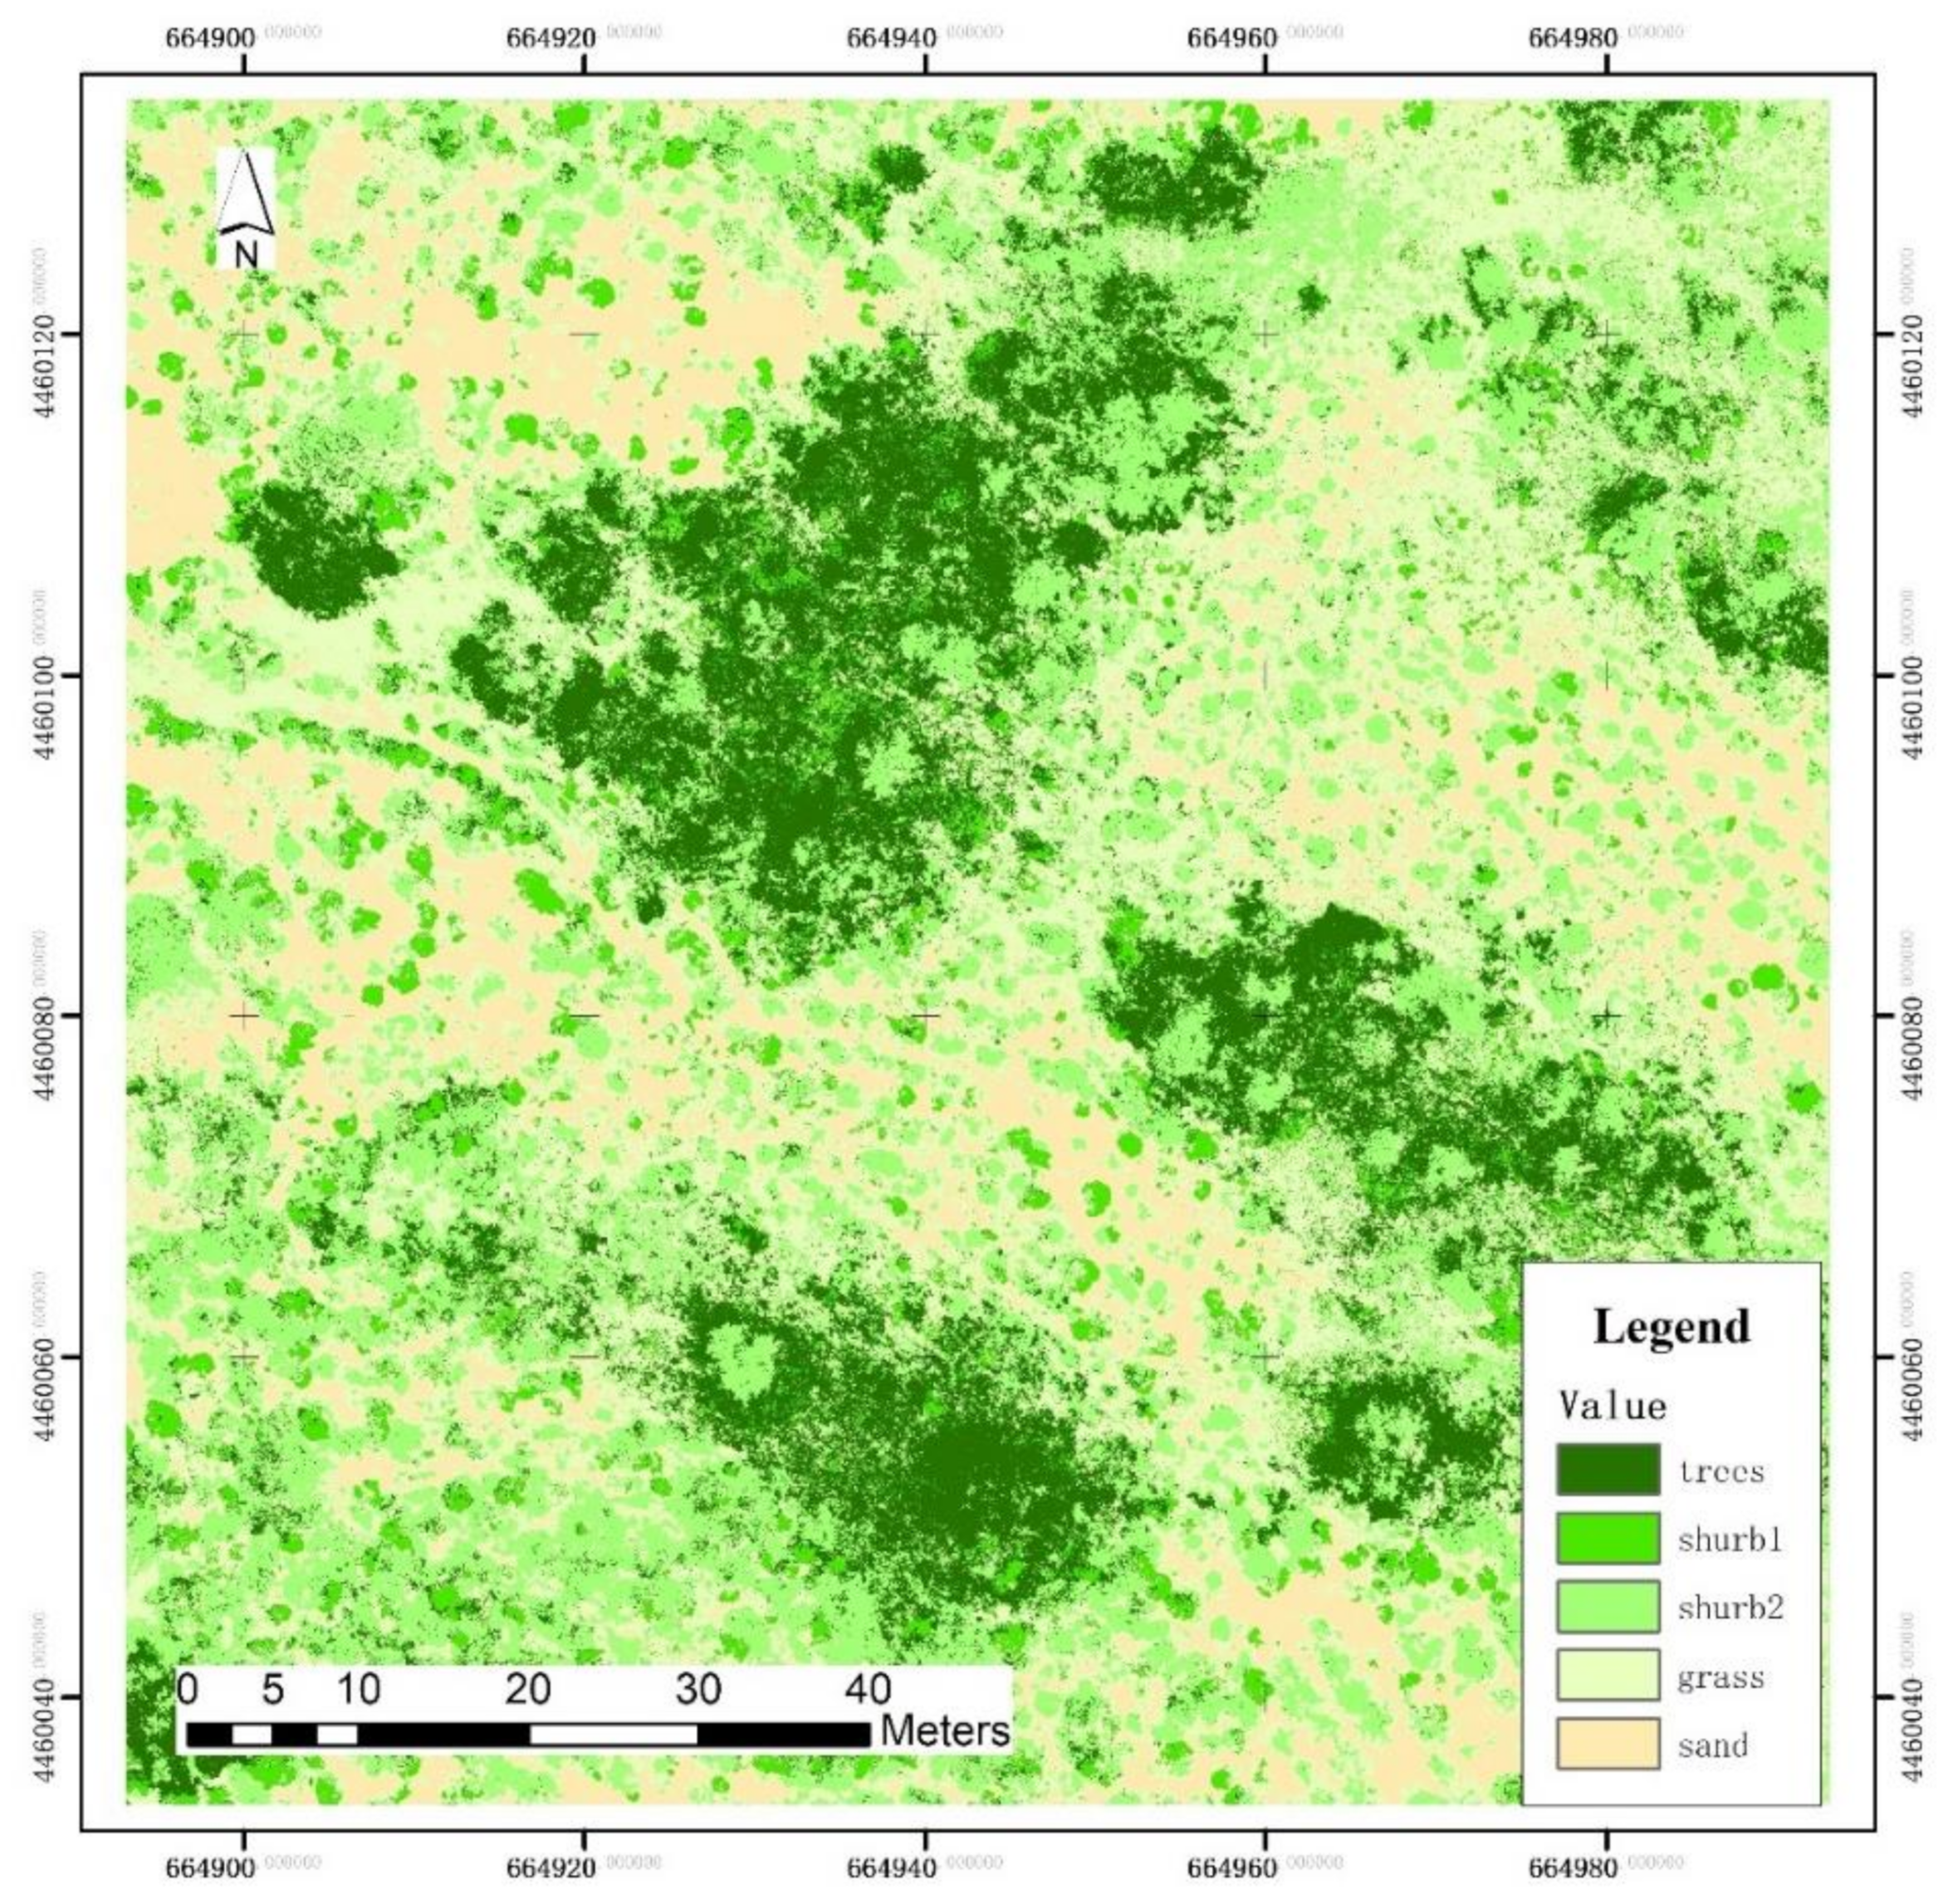
The area occupancy ratio with different classifier is different, with the method of Random Forest (include RGB, RGB+VDVI, RGB+TEXTUER, RGB+TEXTURE+VDVI), the area occupancy ratio are nearly the same in the range of 3% (Figure 7). The area of trees occupied 22.12% to 25.70%, shrub1 occupied 11.23% to 13.89%, shrub2 occupied 12.30% to 15.33%, grass occupied 32.13% to 32.41%, sand occupied 16.50% to 18.35%. When compared with the method of MLC, the area occupancy is different, the trees area is 16.76%, shrub2 occupied 8.54%, shrub2 occupied 26.05%, grass occupied 33.89%, and sand occupied 14.77%. The result of area occupancy with the classifier of RGB+TEXTURE+VDVI is the most closet to the field survey.
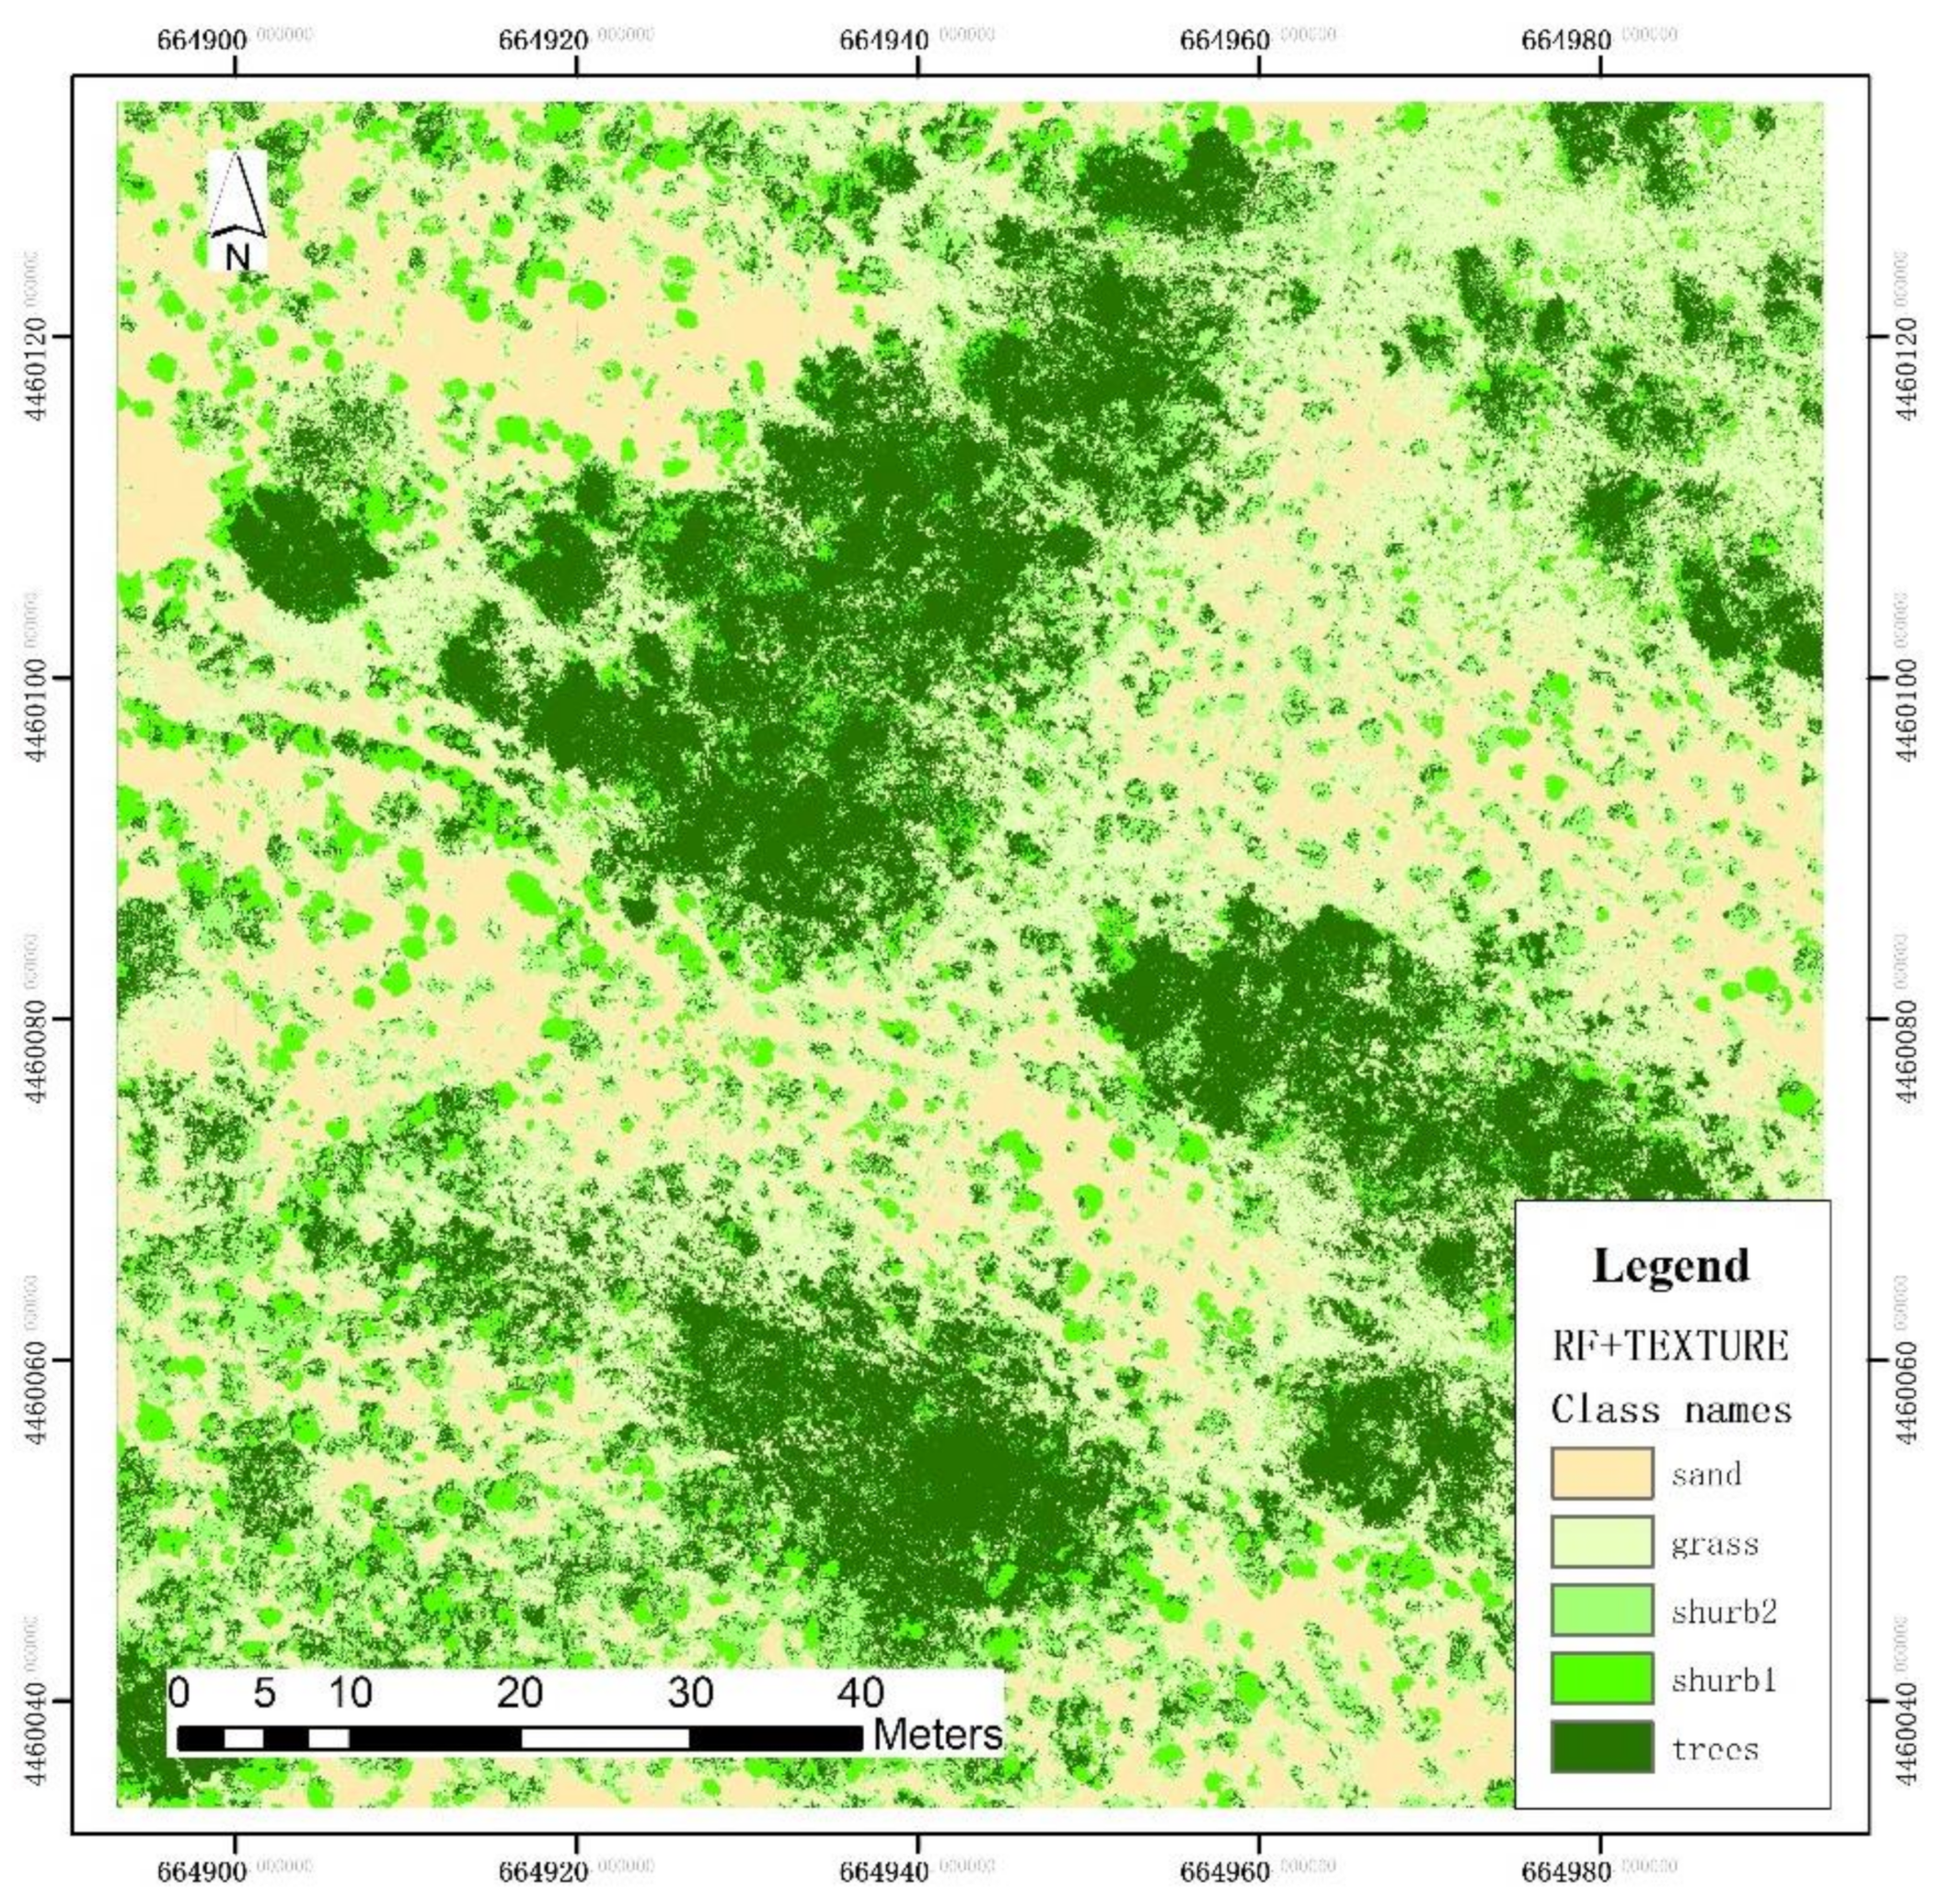
The result of different methods indicate that trees mainly distribute in three parts of the plot, as shown in Figure 8, Figure 9 and Figure 10, and the map of desert vegetation shows with more details and accuracy than the MLC method. Which mainly reflected in the shrub1. When comparing with the field survey, RF method with the RGB+VDVI+TEXTURE will be the good approach for desert vegetation mapping.
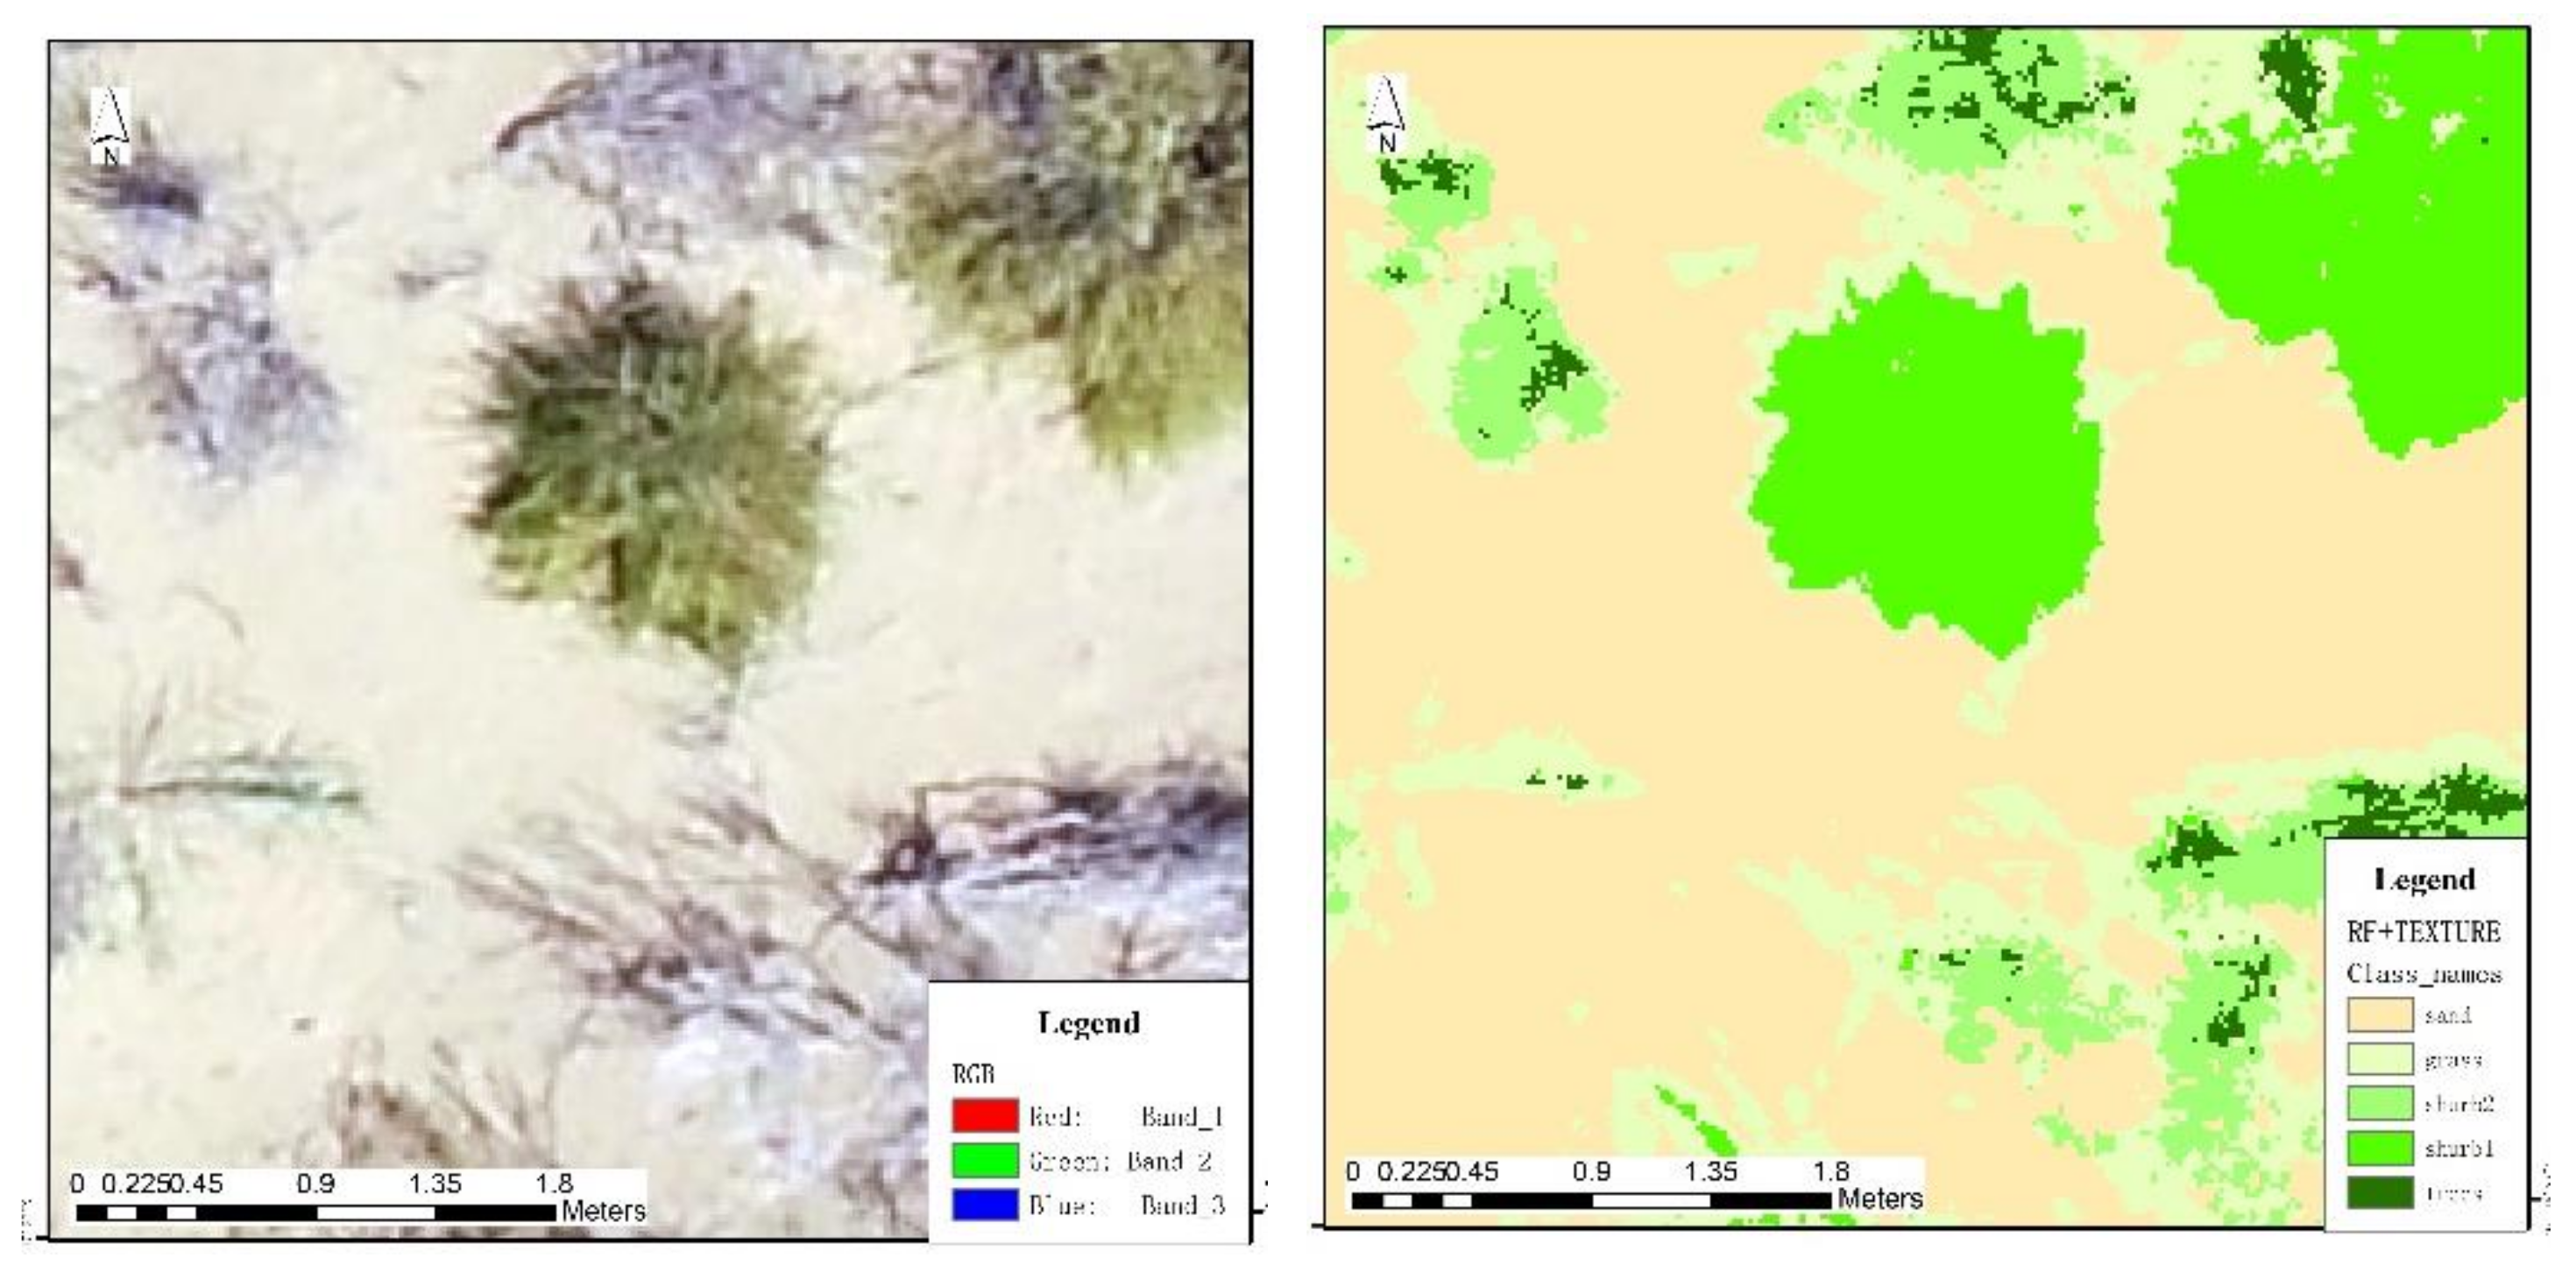
Let us take the resulting texture metrics map of shrub1 as an example, homogeneity is a measure of pixel similarity of texture images, which is used to describe the overall smoothness and continuity of the image. When the elements in the GLCM are concentrated near the main diagonal, the homogeneity value is large and the continuity is strong. On the contrary, when the distribution of each element in the GLCM is relatively dispersed, the homogeneity value is small and the continuity is poor. Contrast is used to describe the correlation or local changes of the image, which reflects the clarity of the image. The homogeneity and the contrast values of Shrub1 is relatively high, and the result is easy to classify (Figure 11).

3.2. The Comparisons of the Classification Accuracies

Maximum Likelihood classifier was used as a benchmark to verify the performance of Random Forest in desert vegetation mapping. In order to quantify the difference between classification accuracy before and after the inclusion of VDVI index, texture features, confusion matrix derived from more than 3000 samples per class were calculated for RGB only, RGB+VDVI, RGB+VDVI, RGB+TEXTURE, RGB+VDVI+TEXTURE images, as shown in from Table 5, Table 6, Table 7, Table 8 and Table 9. Producer accuracy (PA) and user accuracy (UA) for each land cover category together with Kappa index and overall accuracy (OA) are shown in Table 5, Table 6, Table 7, Table 8 and Table 9.

3.2.1. Random Forest

Accuracy assessment level of random forest is high agreement based on the RGB data. OA for image RGB is 76.75%, and the Kappa index is 70.60%. Meanwhile, PA for each land cover category in image RGB ranges from 51.35% to 98.44%, UA for each land cover category in image RGB ranges from 49.23% to 98.76%, the land cover of sand has the highest PA value. In addition, when classifying RGB image, the errors mainly occurred among the classification of trees, shrub2 and grass.
OA for image RGB and image RGB+ VDVI increased from 76.75% to 77.17%, the increment of 0.42% was observed to verify that the inclusion of VDVI features could improve classification accuracy, but not so obviously. Meanwhile, PA and UA for each land cover category in image RGB and image RGB+VDVI were improved after the combination of VDVI, for the different classification, increased range is from 0% to 1.09%. slightly improved.
The assessment level will be improved with more features. OA for image RGB and image RGB+VDVI+TEXTURE, increased from 76.75% to 84.17%, the significant increment of 7.42% was observed to verify that the inclusion of texture and VDVI features can greatly improve classification accuracy. Meanwhile, PA and UA for each land cover category in image RGB and image RGB+TEXTURE+VDVI were improved after the combination of both texture and VDVI, especially PA for the class of grass, increased from 51.35% to 70.72% with 19.37% improvement.

3.2.2. Maximum Likelihood Classification

While using of RGB data, in comparing with the common classifier method MLC, RF has the nearly the same OA, UA and Kappa index, but has different land cover classification accuracy. For the land cover of trees, RF with a PA value of 66%, but the PA of MLC is zero. For the land cover of shrub1 and grass, the PA value of RF and MLC is not so significant differently, for the land of shrub2, the PA of RF is lower than MLC. The range is 25.26%, this indicates that the method of MLC is more suitable than RF for classifying the shrub2 in desert mapping, and the ability of desert land cover classification of RF % MLC nearly the same (Table 10).

3.3. Variable Importance Assessment for RF

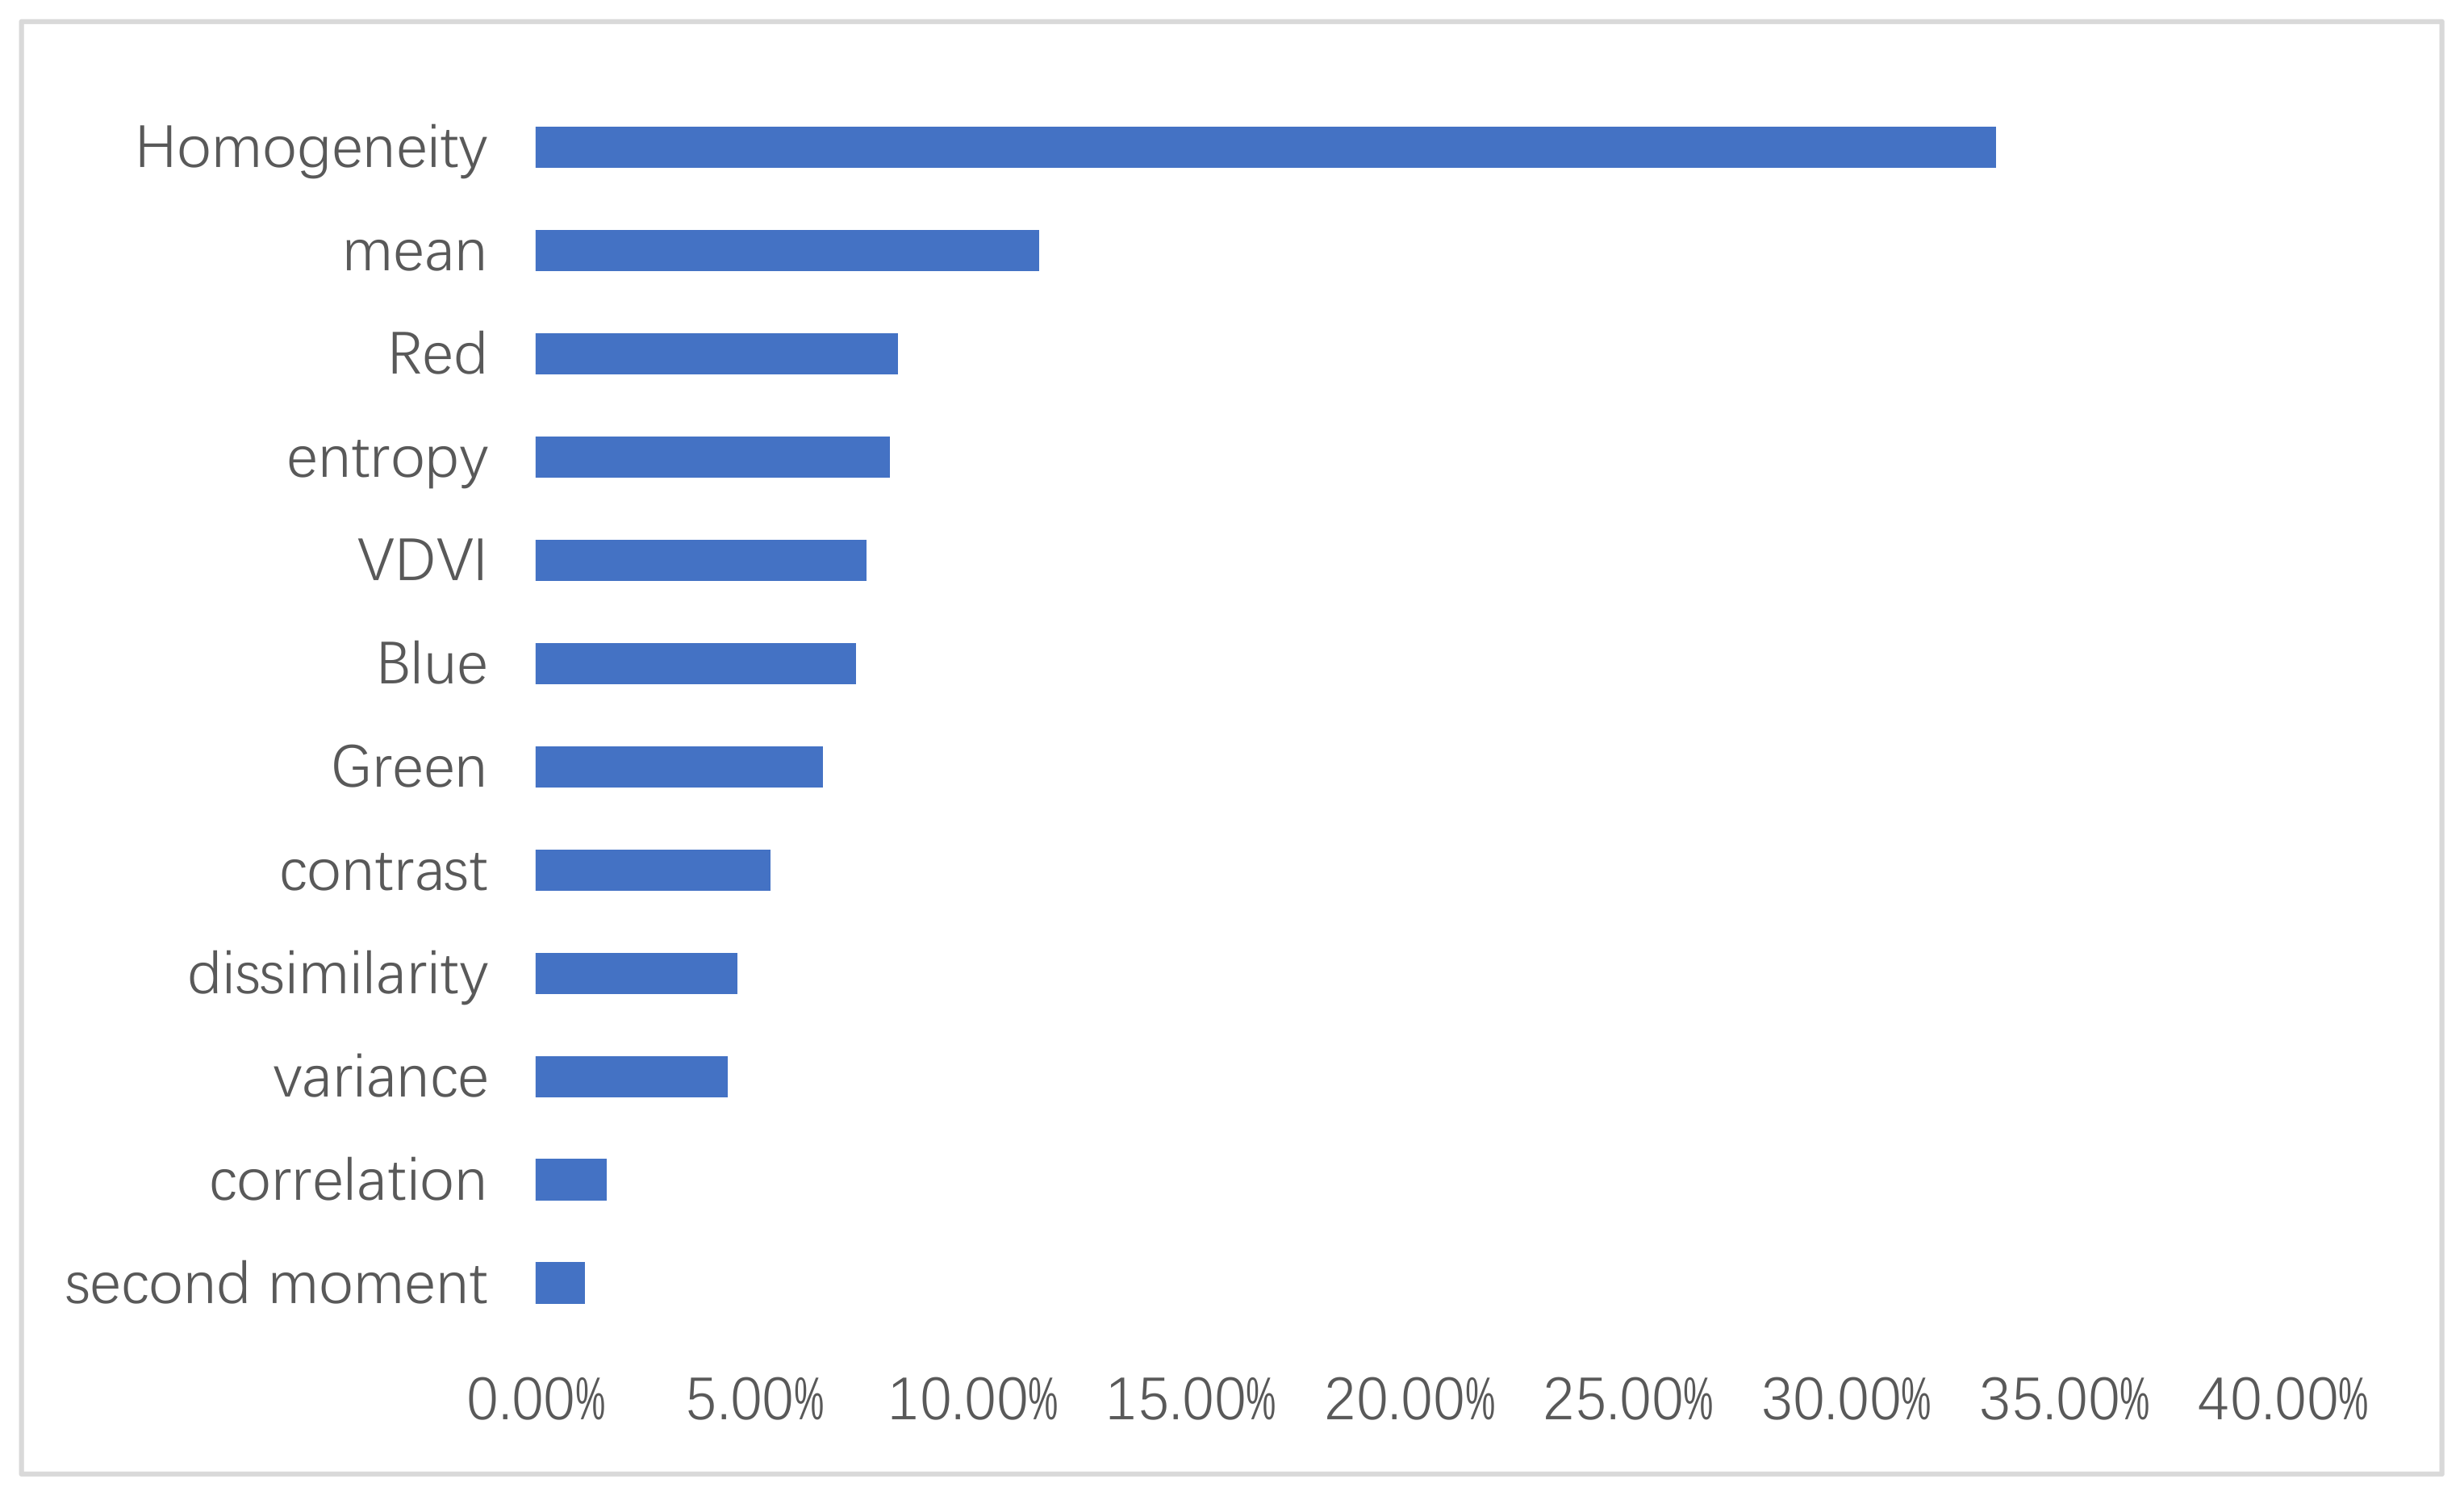
The importance of input variables which was given by Random Forest can be used to measure their contribution to classification accuracy, as shown in Figure 12.
From the texture perspective, it can be seen from Figure 1 that the most important variables is Homogeneity since it is the measure of the local gray level uniformity of the image, mean value rank the second, owning to decrease the random error and the entropy lines the third among texture features due to its capability capturing the spatial distribution characteristics of different desert cover.
From the aspect of RGB data, the importance of the order is: Red band, Blue band, and Green band. The Green band has a lowest importance than the other two bands, which is mainly because trees, shrubs, grass manifest the similar green color.
From the index perspective, the VDVI has the importance order of fifth, it is in the front middle of the importance rank, and it is more important than the blue and green band; therefore, it is useful for mapping the desert vegetation.
In words, homogeneity is the most important texture features than the RGB bands for increase classification precision of Random Forest classifier, which indicates that the texture features is more important than spectral features in desert vegetation mapping. VDVI index is not so important feature for mapping the desert vegetation.

4. Discussion

4.1. Accuracy Improvement

The former studies assumed that individual pixels are independent and they are treated without considering any spatial association with neighboring pixels. However, single pixels no longer capture the characteristics of classification targets in high resolution images [55], and a “salt and pepper” effect is always obviously shown in the classification results.
The inclusion of texture increased the separability, and it thus increases the precision, which is consistent with previous study results on urban vegetation mapping [56]. In addition, the inclusion of VDVI can also increase the separability and improve the precision, yet appear less important than texture features in mapping the desert vegetation. Because green vegetation usually exhibits a large spectral difference between the RED and NIR bands, thus making the vegetation index more important than a single band [57]. In addition, the high reflectivity of bare sand land in desert areas usually hides the spectral responses of patches of scarce woodland covers, especially in classification with the grass. These characteristics result in the difficulty of vegetation identification in desert–oasis area, which affects the overall accuracy of classification [58], and our results shows the same as that of the former study.
MLC is a parametric algorithm and assumes that input variables are normally distributed [59]. However, this assumption is always violated when dealing with real data, which results in the limitation of MLC. Unlike MLC, RF does not need this assumption. There are many spectrally similar land-cover classes within the desert vegetation, and therefore, the accuracy of the MLC approach is low. The accuracy of data acquired by sensors in UAV low altitude remote sensing system directly affects the estimation of various ecological indexes. The dynamic range of a digital camera is limited, and when there are objects with a high light ratio, the camera's sensor cannot record all the details. There are a lot of spectral information overlapping in the visible part, which makes it difficult to extract the characteristic spectrum of the object.
Meanwhile, the former studies revealed that the classification accuracy followed an inverted U relationship with texture window size in the urban vegetation mapping study [56]. In the study, the texture window size was 3*3, and the impact of texture window size on classification accuracy was not analyzed, the next step, more work shall be done in the future.

4.2. Sample Selection with Different Features

In this study, the feature of the sample contains texture and vegetation index, and the study was based on the pixel. A lot of human involvement is required. The accuracy of identification is limited; how to use object-oriented method to identify characteristic of the object, including the plane and three-dimensional morphological features, spectral features, phenological habits and other characteristic; how to optimize the automatic identification algorithm of UAV, and achieve accurate automatic identification of species, is the challenge faced by UAV in low-altitude remote sensing at the species scale [60]. It is a main problem to establish the morphological, phenological and spectral characteristics database of canopy species, which directly affects the application of UAV low-altitude remote sensing in plant community and ecosystem. In the process of classification, the selection of optimal segmentation scale and the setting of extraction rules need manual participation, which requires higher requirements for classifiers [61].
At present, each method has limitations in classification, and no method is absolutely optimal. Therefore, these methods including object-oriented or pixel-based methods must be used rationally. Classification algorithms are selected according to spectral features, texture features, and required accuracy of remote sensing images. On the premise of ensuring accuracy, the efficiency of classification should be improved as much as possible.
The mixed pixels could be out of consideration. The comparison between the proposed method and the smoothed version of pure RGB classification results should be conducted. Finally, uncertainty analysis of the proposed method should also be considered.

4.3. Multi-Source and Multi-Scale Remote Sensing Data Fusion

It is pointed out that scale effect is very important for desertification monitoring and evaluation [62]. How to fuse multi-scale multiple sources of remote sensing data, and it is the same kind of question for comprehensive analysis the species, population, community, ecosystem, and landscape ecology and regional scale, which is still the challenge of low altitude remote sensing need. At present, small scale simulation and accuracy verification are mainly carried out, and regional and global scale conversion is still to be studied.
In the future, the low altitude remote sensing system of light and small unmanned aerial vehicles will become an important to bridge the micro-scale and macro-scale ecological study. It is possible to use multi-source and multi-scale remote sensing data and survey data to discuss the ecological mechanism. With the development of UAV platform technology, sensor technology and data transmission and processing technology, UAV ecology based on UAV low-altitude remote sensing technology will also usher in the opportunity and dawn of development.
Although researchers have done a lot of exploration on the quantitative extraction of desertification information by remote sensing, no universally accepted computer has been established for automatic interpretation method system.

5. Conclusions

This paper proposed a precise hybrid method via combining Random Forest and texture analysis and VDVI for desert vegetation mapping in heterogeneous desert landscapes based on UAV remote sensing. The ultra-high resolution images (2 cm) acquired by UAV provide sufficient details for desert vegetation extraction. Eight least correlated GLCM texture features were calculated and added to the original RGB image to construct a multi-dimensional spectral-texture feature space. A Random Forest consisting of 500 trees was used to classify five selected UAV orthophotos in typical desert vegetation. Experimental results showed that overall accuracy for Image-RGB increased from 76.75% to 83.81% after the inclusion of texture features, respectively, which indicated that texture plays a significant role in improving classification accuracy. especially the Homogeneity is the most important texture feature for the classifier, overall accuracy for Image-RGB increased from 76.75% to 77.17% after the inclusion of VDVI, that indicated that VDVI plays a relatively important role in improving classification accuracy. When using Random Forest instead of Maximum Likelihood, overall accuracy increased by about 0.06% indicating that RF is likely with ML based on RGB data. When in use of RF with the ultra-high resolution images to map the desert vegetation, it is better to consider the features including texture and VDVI.
This paper demonstrates that UAV is an outstanding platform for desert vegetation monitoring. These methods can be used by ecologist to understand vegetation composition within the Ulan Buh desert. However, cameras incorporating a NIR band should be used for data acquisition in future study and validation of the proposed method should be extended to images from different time of the year and different areas.

Author Contributions

Conceptualization, H.Z.; methodology, Y.L.; software, L.F.; validation, J.G., R.P.S., and H.Z.; formal analysis, J.G.; investigation, R.P.S.; resources, J.G.; data curation, J.G.; writing—original draft preparation, H.Z.; writing—review and editing, R.P.S.; visualization L.F.; supervision L.F.; project administration, J.G.; funding acquisition, L.F.; All authors have read and agreed to the published version of the manuscript.

Funding

This research was funded by the Central Public-interest Scientific Institution Basal Research Fund (Grant No. CAFYBB2019QD003).

Data Availability Statement

Data used in this study are available from the Chinese Forestry Science Data Center (http://www.cfsdc.org accessed on 12 April 2021).

Acknowledgments

We are thankful to three anonymous reviewers for the insightful comments and suggestions that helped improve the article.

Conflicts of Interest

The authors declare no conflict of interest.

References

  1. Rogan, J.; Chen, D. Remote sensing technology for mapping and monitoring land-cover and land-use change. Prog. Plan. 2004, 61, 301–325. [Google Scholar] [CrossRef]
  2. Wang, T.; Zhu, Z. Studies on the sandy desertification in China. Chin. J. Eco. Agric. 2001, 9, 7–12. [Google Scholar]
  3. Kang, W.; Liu, S. A review of remote sensing monitoring and quantitative assessment of aeolian desertificatoin. J. Desert Res. 2014, 34, 1222–1229. [Google Scholar]
  4. Milllennium Ecosystem Assessment. Ecosystems and Humanwell-Being: Desertificationi Synthesis; World Resources Institute: Washington, DC, USA, 2005. [Google Scholar]
  5. Zhou, L.; Lu, A. Investigating natural drivers of vegetation coverage variation using MODIS imagery in Qinghai, China. J. Arid Land 2016, 8, 109–124. [Google Scholar] [CrossRef] [Green Version]
  6. Watts, A.C.; Ambrosia, V.G.; Hinkley, E.A. Unmanned Aircraft Systems in Remote Sensing and Scientific Research: Classification and Considerations of Use. Remote Sens. 2012, 4, 1671–1692. [Google Scholar] [CrossRef] [Green Version]
  7. Hassanein, M.; Lari, Z.; El-Sheimy, N. A New Vegetation Segmentation Approach for Cropped Fields Based on Threshold Detection from Hue Histograms. Sensors 2018, 18, 1253. [Google Scholar] [CrossRef] [Green Version]
  8. Myint, S.W.; Gober, P.; Brazel, A.; Grossman-Clarke, S.; Weng, Q. Per-pixel vs. object-based classification of urban land cover extraction using high spatial resolution imagery. Remote Sens. Environ. 2011, 115, 1145–1161. [Google Scholar] [CrossRef]
  9. Alonzo, M.; Bookhagen, B.; Roberts, D.A. Urban tree species mapping using hyperspectral and lidar data fusion. Remote Sens. Environ. 2014, 148, 70–83. [Google Scholar] [CrossRef]
  10. Langhammer, J. UAV Monitoring of Stream Restorations. Hydrology 2019, 6, 29. [Google Scholar] [CrossRef] [Green Version]
  11. Hart, A.; Chai, P.R.; Griswold, M.K.; Lai, J.T.; Boyer, E.W.; Broach, J. Acceptability and perceived utility of drone technology among emergency medical service responders and incident commanders for mass casualty incident management. Am. J. Disaster Med. 2017, 12, 261–265. [Google Scholar] [CrossRef]
  12. Song, X.Y.; Huang, Y.H.; Dong, D.L. Urban Land Use Classification from UAV Remote Sensing Images Based on Digital Surface Model. J. Geo. Inf. Sci. 2018, 20, 703–711. [Google Scholar]
  13. Reid, A.; Ramos, F.; Sukkarieh, S. Multi-class classification of vegetation in natural environments using an Unmanned Aerial system. In Proceedings of the 2011 IEEE International Conference on Robotics and Automation, Shanghai, China, 9–13 May 2011; pp. 2953–2959. [Google Scholar]
  14. Berni, J.A.J.; Zarco-Tejada, P.J.; Suarez, L.; Fereres, E. Thermal and Narrowband Multispectral Remote Sensing for Vegetation Monitoring from an Unmanned Aerial Vehicle. IEEE Trans. Geosci. Remote Sens. 2009, 47, 722–738. [Google Scholar] [CrossRef] [Green Version]
  15. Cruzan, M.B.; Weinstein, B.G.; Grasty, M.R.; Kohrn, B.F.; Hendrickson, E.C.; Arredondo, T.M.; Thompson, P.G. Small unmanned aerial vehicles (micro-UAVs, drones) in plant ecology. Appl. Plant Sci. 2016, 4, 1600041. [Google Scholar] [CrossRef]
  16. Wang, X.; Wang, M.; Wang, S.; Wu, Y. Extraction of vegetation information from visible unmanned aerial vehicle images. Trans. Chin. Soc. Agric. Eng. 2015, 31, 152–159. [Google Scholar]
  17. Wu, T.; Zhao, D.; Kang, J.; Zhang, F.; Cheng, L. Suaeda salsa dynamic remote monitoring and biomass remote sensing inversion in Shuangtaizi River estuary. Ecol. Environ. Sci. 2011, 20, 24–29. [Google Scholar]
  18. Li, X.; Ji, G.; Yang, J. Estimating cyanophyta biomass standing crops in Meiliang gulf of lake Taihu by satelite remote sensing. Remote Sens. Land Resour. 1995, 24, 23–28. [Google Scholar]
  19. Gao, M.; Zhao, W.; Gong, Z.; He, X. The study of vegetation biomass inversion based on the HJ satellite data in Yellow River wetland. Acta Ecol. Sin. 2013, 33, 542–553. [Google Scholar]
  20. Huete, A. A soil-adjusted vegetation index (SAVI). Remote Sens. Environ. 1988, 25, 295–309. [Google Scholar] [CrossRef]
  21. Gao, Y.; Lin, Y.; Wen, X.; Jian, W.; Gong, Y. Vegetation information recognition in visible band based on UAV images. Trans. Chin. Soc. Agric. Eng. 2020, 36, 178–189. [Google Scholar]
  22. Guli, J.-P.; Chen, X.; Bao, A.-M. Coverage extraction and up-scaling of sparse desert vegetation in arid area. J. Appl. Ecol. 2009, 20, 2925–2934. [Google Scholar]
  23. Zhang, X.; Zhang, F.; Qi, Y.; Deng, L.; Wang, X.; Yang, S. Information Extraction of Desert Surface Types Based on UAV Image. Arid Zone Res. 2019, 36, 771–780. [Google Scholar]
  24. Zhou, C.H.; Luo, J.C. The Geocomputation of the High Resolution Satellite Image; Science Press: Beijing, China, 2009. [Google Scholar]
  25. Franklin, S.E.; Hall, R.J.; Moskal, L.M.; Maudie, A.J.; Lavigne, M.B. Incorporating texture into classification of forest species composition from airborne multispectral images. Int. J. Remote Sens. 2000, 21, 61–79. [Google Scholar] [CrossRef]
  26. Lam, N.S.-N.; Quattrochi, D.A. On the Issues of Scale, Resolution, and Fractal Analysis in the Mapping Sciences. Prof. Geogr. 1992, 44, 88–98. [Google Scholar] [CrossRef]
  27. Purkis, S.J.; Myint, S.W.; Riegl, B.M. Enhanced detection of the coral Acropora cervicornis from satellite imagery using a textural operator. Remote Sens. Environ. 2006, 101, 82–94. [Google Scholar] [CrossRef]
  28. Haralick, R.M.; Shanmugam, K.; Dinstein, I.H. Textural Features for Image Classification. IEEE Trans. Syst. Man Cybern. 1973, 6, 610–621. [Google Scholar] [CrossRef] [Green Version]
  29. Johansen, K.; Coops, N.C.; Gergel, S.E.; Stange, Y. Application of high spatial resolution satellite imagery for riparian and forest ecosystem classification. Remote Sens. Environ. 2007, 110, 29–44. [Google Scholar] [CrossRef]
  30. Laliberte, A.S.; Rango, A. Texture and Scale in Object-Based Analysis of Subdecimeter Resolution Unmanned Aerial Vehicle (UAV) Imagery. IEEE Trans. Geosci. Remote Sens. 2009, 47, 761–770. [Google Scholar] [CrossRef] [Green Version]
  31. Pearlstine, S.L. Analyzing fine-scale wetland composition using high resolution imagery and texture features. Int. J. Appl. Earth Obs. Geoinf. 2013, 23, 204–212. [Google Scholar]
  32. Li, X.; Shao, G. Object-based urban vegetation mapping with high-resolution aerial photography as a single data source. Int. J. Remote Sens. 2012, 34, 771–789. [Google Scholar] [CrossRef]
  33. Espejo-Garcia, B.; Lopez-Pellicer, F.J.; Lacasta, J.; Moreno, R.P.; Zarazaga-Soria, F.J. End-to-end sequence labeling via deep learning for automatic extraction of agricultural regulations. Comput. Electron. Agric. 2019, 162, 106–111. [Google Scholar] [CrossRef]
  34. Wu, J.; Yang, G.; Yang, H.; Zhu, Y.; Li, Z.; Lei, L.; Zhao, C. Extracting apple tree crown information from remote imagery using deep learning. Comput. Electron. Agric. 2020, 174, 105504. [Google Scholar] [CrossRef]
  35. Chen, J.; Tang, P.; Rakstad, T.; Patrick, M.; Zhou, X. Augmenting a deep-learning algorithm with canal inspection knowledge for reliable water leak detection from multispectral satellite images. Adv. Eng. Inform. 2020, 46, 101161. [Google Scholar] [CrossRef]
  36. Breiman, L. Random forest. Mach. Learn. 2001, 45, 5–32. [Google Scholar] [CrossRef] [Green Version]
  37. Bankert, A.R.; Strasser, E.H.; Burch, C.G.; Correll, M.D. An open-source approach to characterizing Chihuahuan Desert vegetation communities using object-based image analysis. J. Arid. Environ. 2021, 188, 104383. [Google Scholar] [CrossRef]
  38. Lu, H.; Li, Y.S.; He, J.; Ren, Z.M. Capture and processing of low altitude remote sensing images by UAV. Eng. Surv. Mapp. 2011, 20, 52–53. [Google Scholar]
  39. Matusita, K. Decision rule, based on the distance, for the classification problem. Ann. Inst. Stat. Math. 1956, 8, 67–77. [Google Scholar] [CrossRef]
  40. Deng, S. Remote Sensing Image Processing Method; Higher Education Press: Beijing, China, 2014. [Google Scholar]
  41. Zhou, Z.M.; Yang, Y.M.; Chen, B.Q. Study on the extraction of exotic species Spartina alterniflora from UAV visible images. J. Subtrop. Resour. Environ. 2017, 12, 90–95. [Google Scholar]
  42. Gao, Y.-P.; Kang, M.-D.; He, M.-Z.; Sun, Y.; Xu, H. Extraction of desert vegetation coverage based on visible light band information of unmanned aerial vehicle: A case study of Shapotou region. J. Lanzhou Univ. Nat. Sci. 2018, 54, 773–774. [Google Scholar]
  43. Anys, H.; He, D.C. Evaluation of textural and multipolarization radar features for crop classification. Geosci. Remote Sens. 1995, 33, 1170–1181. [Google Scholar] [CrossRef]
  44. Haralick, R.M. Statistical and structural approaches to texture. Proc. IEEE 1979, 67, 786–804. [Google Scholar] [CrossRef]
  45. Cleve, C.; Kelly, M.; Kearns, F.R.; Moritz, M. Classification of the wildland–urban interface: A comparison of pixel- and object-based classifications using high-resolution aerial photography. Comput. Environ. Urban Syst. 2008, 32, 317–326. [Google Scholar] [CrossRef]
  46. Agüera, F.; Aguilar, F.J.; Aguilar, M.A. Using texture analysis to improve per-pixel classification of very high resolution images for mapping plastic greenhouses. ISPRS J. Photogramm. Remote Sens. 2008, 63, 635–646. [Google Scholar] [CrossRef]
  47. Linfei, C.A.; Dasheng, W.U.; Luming, F.A.; Xinyu, Z.H. Tree species identification using XGBoost based on GF-2 images. For. Resour. Manag. 2019, 5, 44–50. [Google Scholar]
  48. Breiman, L.; Friedman, J.H.; Olshen, R.A.; Stone, C.J. Classification and Regression Trees; Apple Academic Press: Cambridge, MA, USA, 2017. [Google Scholar]
  49. Belgiu, M.; Drăguţ, L. Random forest in remote sensing: A review of applications and future directions. ISPRS J. Photogramm. Remote Sens. 2016, 114, 24–31. [Google Scholar] [CrossRef]
  50. Gislason, P.O.; Benediktsson, J.A.; Sveinsson, J.R. Random Forests for land cover classification. Pattern Recognit. Lett. 2006, 27, 294–300. [Google Scholar] [CrossRef]
  51. Wu, Z.; Shen, D.; Huang, L.; Xu, Q. Study on the Effect of the Number of training Samples on the Accuracy of Maximum Likelihood Supervision Classification. For. Explor. Design 2018, 2, 115–117. [Google Scholar]
  52. Tang, W.; Hu, J.; Zhang, H.; Wu, P.; He, H. Kappa coefficient: A popular measure of rater agreement. Shanghai Arch. Psychiatry 2015, 27, 62–67. [Google Scholar]
  53. Congalton, R.G. A review of assessing the accuracy of classifications of remotely sensed data. Remote Sens. Environ. 1991, 37, 35–46. [Google Scholar] [CrossRef]
  54. Quenouille, R.B.M.; Wallis, W.A.; Roberts, H.V. Statistics: A New Approach by. Econometrica 1958, 26, 181–182. [Google Scholar] [CrossRef]
  55. Yu, Q.; Gong, P.; Clinton, N.; Biging, G.; Kelly, M.; Schirokauer, D. Object-based Detailed Vegetation Classification with Airborne High Spatial Resolution Remote Sensing Imagery. Photogramm. Eng. Remote Sens. 2006, 72, 799–811. [Google Scholar] [CrossRef] [Green Version]
  56. Feng, Q.; Liu, J.; Gong, J. UAV Remote Sensing for Urban Vegetation Mapping Using Random Forest and Texture Analysis. Remote Sens. 2015, 7, 1074–1094. [Google Scholar] [CrossRef] [Green Version]
  57. Schnell, J.A. Monitoring the Vernal Advancement and Retrogradation (Greenwave Effect) of Natural Vegetation; NASA/GSFCT Type Final Report; Goddard Space Flight Center: Greenbelt, MA, USA, 1974.
  58. Ge, G.; Shi, Z.; Zhu, Y.; Yang, X.; Hao, Y. Land use/cover classification in an arid desert-oasis mosaic landscape of China using remote sensed imagery: Performance assessment of four machine learning algorithms. Glob. Ecol. Conserv. 2020, 22, e00971. [Google Scholar] [CrossRef]
  59. Amini, J. A method for generating floodplain maps using IKONOS images and DEMs. Int. J. Remote Sens. 2010, 31, 2441–2456. [Google Scholar] [CrossRef]
  60. Sun, Z.-Y.; Chen, Y.-Q.; Yang, L. Small unmanned arial vehicles for low-altitude remote sensing and its application process in ecology. Chin. J. Appl. Ecol. 2017, 28, 528–536. [Google Scholar]
  61. He, S.; Xu, J.; Zhang, S. Land use classification of object—Oriented multi—Scale by UAV image. Remote Sens. Land Resour. 2013, 25, 107–112. [Google Scholar]
  62. Xu, D.; Kang, X.; Zhuang, D.; Pan, J. Multi-scale quantitative assessment of the relative roles of climate change and human activities in desertification—A case study of the Ordos Plateau, China. J. Arid Environ. 2010, 74, 498–507. [Google Scholar] [CrossRef]
Figure 1. Study area.
Remotesensing 13 01891 g001
Figure 2. UAV (DJI Phantom 4 RTK).
Remotesensing 13 01891 g002
Figure 3. Positions of reference points.
Remotesensing 13 01891 g003
Figure 4. Different classes in the plot.
Remotesensing 13 01891 g004
Figure 5. Distribution of VDVI.
Remotesensing 13 01891 g005
Figure 6. Processing workflow of this study.
Remotesensing 13 01891 g006
Figure 7. Area occupancy ratio with different classifier.
Remotesensing 13 01891 g007
Figure 8. Result of MLC processing.
Remotesensing 13 01891 g008
Figure 9. Result of RF processing.
Remotesensing 13 01891 g009
Figure 10. Result of RF+TEXTURE processing.
Remotesensing 13 01891 g010
Figure 11. Texture metrics map of shrub1.
Remotesensing 13 01891 g011
Figure 12. Importance of input variables.
Remotesensing 13 01891 g012
Table 1. Main parameters of data sources.
Flying Date Flying Height (m)Camera TypeImage Size/PixelSpatial Resolution(m)Area(m/m)
August 2019701 inch CMOS5137 × 51370.02100 × 100
Table 2. The referencing error of 10 random selected ground control points.
Control PointX Accuracy (m)Y Accuracy (m)Vertical Accuracy (m)RMS
10.0060.0050.0130.016
20.0060.0050.0130.015
30.0060.0050.0130.015
40.0060.0050.0140.016
50.0060.0050.0140.016
60.0060.0050.0140.016
70.0060.0050.0130.015
80.0060.0050.0130.015
90.0060.0050.0130.015
100.0050.0050.0110.014
Table 3. VDVI eigenvalue of vegetation indices distribution.
TypesTreesShrub1Shrub2GrassSand
Mean0.5366790.4779450.4806930.3167020.252484
Standard deviation0.0399870.3738820.3452340.3711780.320356
Table 4. Gray level co-occurrence matrix texture measuring table.
NumberTexture MeasuringFormula
1Homogeneity i = 0 , j = 0 N 1 P i j × i 1 + ( i j ) 2
2Entropy i = 0 , j = 0 N 1 i × P i j ln P i j
3Dissimilarity i = 0 , j = 0 N 1 i × P i j i j
4Mean i = 0 , j = 0 N 1 i × P i j
5Contrast i = 0 , j = 0 N 1 i × P i j ( i j ) 2
6Correlation i = 0 , j = 0 N 1 i × P i j i M E × j M E V A i × V A j
7Second moment i = 0 , j = 0 N 1 i × P i j 2
8Variance i = 0 , j = 0 N 1 i × P i j ( i M E ) 2
Note: “i, j” represents row number and column number in the matrix P, “N” represents row number or column number in P, “Pij” represents cell I, normalized value in J, “ME” represents mean value, and “VA” represents variance.
Table 5. Pixel counts of training samples.
ROIs SummaryPixel Counts
Trees31,859
Shrub134,724
Shrub229,978
Grass19,166
Sand38,185
Total153,912
Table 6. Accuracy assessment of random forest (RGB).
ClassTreesShrub1Shrub2GrassSandUA
trees39842931438497064.00%
shrub12925649396521185.04%
shrub21197384057488370.15%
grass573762433181310249.23%
sand011081730798.76%
PA66.00%83.65%67.99%51.35%98.44%
OA76.75% KAPPA70.60%
Table 7. Accuracy assessment of random forest (RGB+TEXTURE).
ClassTreesShrub1Shrub2GrassSandUA
trees4935121914242079.00%
shrub121460724352191.40%
shrub21122194309329474.51%
grass72847822122322460.60%
sand00038736199.49%
PA71.00%90.76%79.09%69.90%99.61%
OA83.81% KAPPA79.50%
Table 8. Accuracy assessment of random forest (RGB+VDVI).
ClassTreesShrub1Shrub2GrassSandUA
trees40212871412492065.00%
shrub12825690336261285.65%
shrub21205334068474370.34%
grass582722435184310150.04%
sand06180731298.82%
PA66.00%84.45%68.38%52.43%98.44%
OA77.17% KAPPA71.12%
Table 9. Accuracy assessment of random forest (RGB+VDVI+TEXTURE).
ClassTreesShrub1Shrub2GrassSandUA
trees4858120991243078.00%
shrub121060499374191.06%
shrub21008114474287377.36%
grass67444626622732461.72%
sand00037736299.50%
PA72.00%91.29%77.94%70.72%99.62%
OA84.17% KAPPA79.96%
Table 10. Accuracy assessment of MLC (RGB).
ClassTreesShrub1Shrub2GrassSandUA
trees15,0981405908160100.00%
shrub192928,272122248089.86%
shrub214,78460427,9535689057.01%
grass104844101102926474055.93%
sand026336437,44598.96%
PA0.00%81.44%93.25%48.34%98.06%
OA76.69% KAPPA70.56%
Publisher’s Note: MDPI stays neutral with regard to jurisdictional claims in published maps and institutional affiliations.