Article

Understanding Urban Expansion on the Tibetan Plateau over the Past Half Century Based on Remote Sensing: The Case of Xining City, China

1
Center for Human-Environment System Sustainability (CHESS), State Key Laboratory of Earth Surface Processes and Resource Ecology (ESPRE), Beijing Normal University, Beijing 100875, China
2
School of Natural Resources, Faculty of Geographical Science, Beijing Normal University, Beijing 100875, China
3
Institute of Geographic Sciences and Natural Resources Research, Chinese Academy of Sciences, Beijing 100101, China
4
MOE Key Laboratory of Tibetan Plateau Land Surface Processes and Ecological Conservation, Qinghai Normal University, Xining 810008, China
5
Key Laboratory of Qinghai Province Physical Geography and Environmental Process, Qinghai Normal University, Xining 810008, China
*
Author to whom correspondence should be addressed.
Remote Sens. 2021, 13(1), 46; https://doi.org/10.3390/rs13010046
Submission received: 8 December 2020 / Revised: 20 December 2020 / Accepted: 22 December 2020 / Published: 24 December 2020

Abstract

:
The Tibetan Plateau (TP) is an important area that affects global sustainable development. Quantifying spatiotemporal patterns of urbanization is crucial for maintaining the sustainability on the TP. This study took Xining City, the largest city on the TP, as an example to understand the urban expansion in this region in the past 50 years. We combined the high-resolution spy satellite data and China’s long-term urban land dataset (CULD) to quantify the urban expansion of Xining City. The object-oriented random forest classification was performed to extract urban land from spy satellite data in 1969, and the inter-annual correction was used to combine urban land information from 1969 to 2017. We found that the proposed approach can accurately quantify the urban expansion of Xining City over the past half century with an overall accuracy of 91% and a kappa coefficient of 0.86. Such high accuracy benefits from the fine resolution of spy satellite data and the consistency of CULD. We also found that Xining City experienced accelerated and fragmented urban sprawl to higher altitude areas, as a result of socioeconomic development and topographical limitations. The acceleration of urban expansion was more obvious, and the urban landscape fragmentation was more serious at high altitude areas. Such urban expansion encroached on cropland and grassland, and caused increased risks of landslides and other geological disasters. Therefore, Xining City urgently needs to promote the development of compact cities to control urban sprawl at higher altitude areas and provide a reference for improving urban sustainability across the TP. In this study, we analyzed the urban expansion of Xining city from 1969 to 2017, and provided a reliable way to understand the long-term spatiotemporal urbanization based on remote sensing, which has the potential for wide applications. In addition, the extracted urban information can help to improve the urban sustainability of Xining City and the entire TP.

1. Introduction

The Tibetan Plateau (TP), also known as the “Roof of the World”, “Water Tower of Asia” and “Third Pole”, is perceived as an important ecological security barrier, a strategic resource reserve base and a protected place for Tibetan cultural heritage [1,2], which is also an important area that influence global sustainable development [3]. Driven by China’s “Belt and Road Initiative”, “New-type Urbanization” and “Western Development Program”, the TP is experiencing a rapid urbanization [4]. Despite regional socio-economic development, this process has led to a series of ecological and environmental issues (e.g., loss of natural habitats, decline in biodiversity, air pollution and deterioration of water quality), putting pressure on regional sustainability [5]. Understanding the characteristics of urban expansion (UE) on the TP is the basis for optimizing the spatiotemporal pattern of urban land, which is important for promoting sustainable development on the TP.
Xining, with its low altitude and favorable climate, is considered the most livable city on the TP [6]. With the rapid socioeconomic development, Xining City has become the city with the largest population, the highest gross domestic product (GDP) and the largest urban land area on the TP [7]. Whilst the area of Xining City only accounts for 0.3% of the area of the TP, its urban population is about 22.7% of the total urban population of the entire TP, its GDP accounts for 26.9% of the TP’s GDP [8], and its urban land area accounts for 19.3% of the total urban land area on the TP [9]. Since Xining City represents a typical city on the TP, quantifying the spatiotemporal pattern of UE in Xining City may provide a scientific basis to promote its healthy development and understand the characteristics of UE on the TP.
Previous studies have investigated some aspects of the UE of Xining City. For example, Fu et al. [10] analyzed the changes of urban land area in Xining City from 1999 to 2005. Meng and Chen [11] examined the characteristics of urban land changes in Xining City from 1996 to 2004. Feng et al. [12] analyzed the UE and its driving mechanism of Xining City from 1977 to 2007. Gao et al. [7] analyzed the UE of Xining City from 1990 to 2015 and its impacts on the environment. Whilst these studies have laid a good foundation for understanding the UE in Xining, in-depth analysis of the characteristics of the UE is limited. Firstly, existing studies mainly analyzed the change of urban land area, ignoring the multi-scale analysis of spatial patterns of the urban landscape and the spatial differentiation of UE at different altitudes. Secondly, they mostly analyzed the UE over a short time period, and therefore lacked a complete understanding of the long-term UE in Xining City.
Historical high-resolution remote sensing data and the recently released China medium- and high-resolution long-term urban land dataset (CULD) provide new data sources for characterizing the UE of Xining City in the past 50 years. Briefly, the historical high-resolution remote sensing data were collected by the military Keyhole series satellites launched by the United States. The imaging time of the archived data was from August 1960 to May 1972. They were panchromatic images with a spatial resolution of 1.8 to 12.2 m [13]. These data were released and made accessible to the public in February 1995 [14]. These data can clearly portray the texture characteristics of ground objects and provide a reliable data source for obtaining urban land information in historical periods. Using these data, Brinkmann et al. [15] successfully extracted the land use/cover information of four urban areas in West Africa in the 1960s, Hepcan et al. [16] extracted the land use/cover information of Izmir, Turkey in 1963, Saleem et al. [17] successfully extracted the land use/cover information of Iraqi Kurdistan in 1969, and Rendenieks et al. [18] analyzed the rates and determinants of forest cover change along the Latvian–Russian border in 1967–2015. In addition, Gong et al. [9] produced a high-precision urban land area dataset with a spatial resolution of 30 m over the period 1978–2017 based on the Google Earth Engine platform, and its overall accuracy exceeds 90%. By combining these two types of data, we can accurately quantify the UE of Xining City in the past 50 years.
This study aimed to quantify the spatiotemporal pattern of UE in Xining City from 1969 to 2017. To achieve this goal, we first combined the high-resolution spy satellite data and CULD to obtain the urban land information of Xining City from 1969 to 2017. Then, we examined the driving mechanism of the UE from both socio-economic development factors and location factors, and quantified the occupation of other land use/cover types in the UE of Xining City. Finally, we discussed the reliability of combining these two types of data, summarized the basic characteristics of Xining’s UE in the past 50 years, and put forward corresponding policy recommendations. This study can be used to understand the UE of Xining city since 1969, reveal the main characteristics and driving forces of urban land use change in Xining city in a long time series, and provide a scientific basis for the future urban planning of Xining city. This study can also assist understanding the characteristics of UE on the TP.

2. Materials and Methods

2.1. Study Area

Xining City (Latitude: 100°54′E–101°56′E, Longitude: 36°13′N–37°23′N, average elevation: 2295 m) belongs to the TP and Loess Plateau crisscrossed area, the Yellow River Basin and the agro-pastoral transitional zone of northern China, and is a typical plateau valley city (Figure 1) [19,20]. The mean annual temperature is 6.1℃, and the annual precipitation is about 400mm [21]. In 2017, the main land use/cover types in Xining City were grassland (53.0% of total area) and cropland (23.2% of total area) [22]. Its total population was 2.4 million.
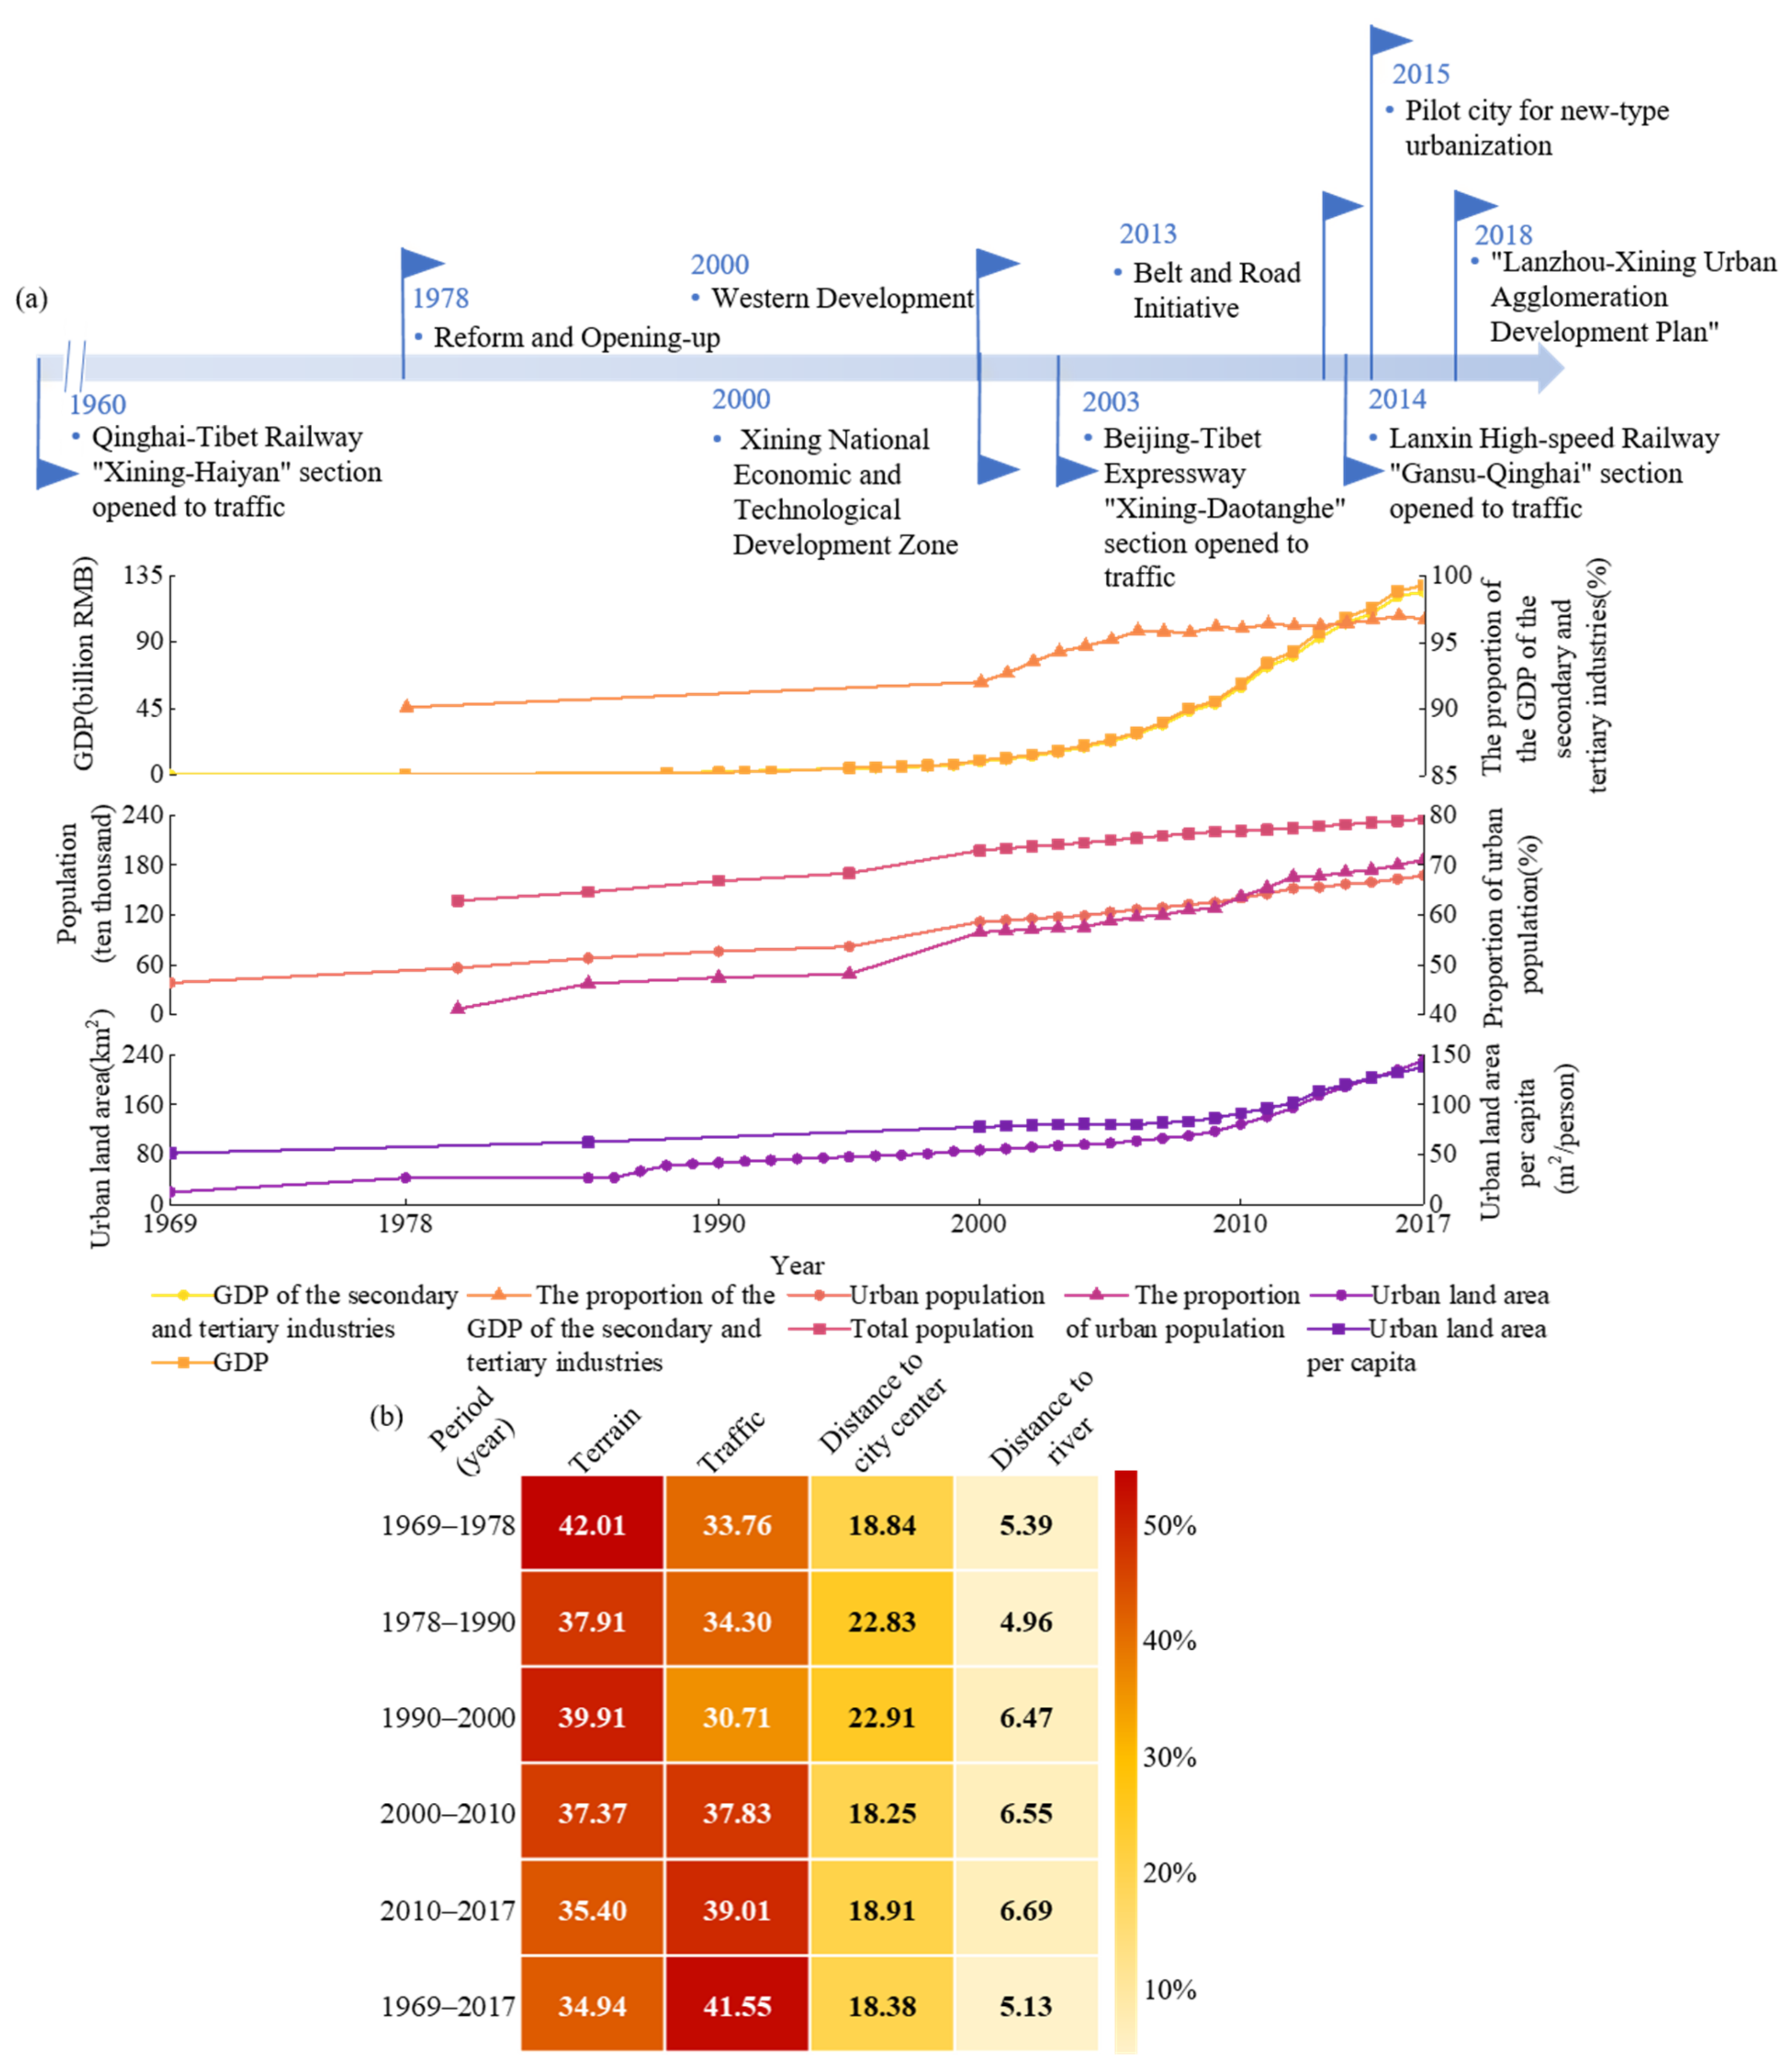
During the period of 2000–2017, the urban population of Xining City increased from 1.1 million to 1.7 million (or an increase of 49.6%). The proportion of urban population has increased from 56.6% to 71.6% (or an increase of 15.0%). The GDP of the secondary and tertiary industries has increased from 9.4 billion yuan to 124.3 billion yuan (or an increase of 12.3 times). The proportion of GDP of the secondary and tertiary industries has increased from 92.0% to 96.7%, an increase of 4.7% [23]. The urban land has increased from 86.7 km2 to 231.0 km2, an increase of 1.7 times [9]. In November 2015, Xining City was approved as the second batch of national pilot cities for new-type urbanization. In March 2018, the State Council issued the “Lanzhou-Xining Urban Agglomeration Development Plan”. Thus, Xining City is expected to experience a more rapid development in the future.

2.2. Data Sources

The remote sensing data used to extract the urban land area of Xining on May 17, 1969 were from the panchromatic remote sensing image of Xining taken by the Keyhole satellite, with a spatial resolution of 2.7 m. Geometric correction and orthorectification were performed by Beijing Lanyu Fangyuan Information Technology Co., Ltd. (http://www.kosmos-image.com/). The urban land data (period: 1978–2017; spatial resolution: 30 m; accuracy: >90%) were obtained from the CULD [9] (http://data.ess.tsinghua.edu.cn/). The Digital Elevation Model (DEM) data used here (spatial resolution: 30 m) were downloaded from the Geospatial Data Cloud Platform (http://www.gscloud.cn).
The socio-economic data were gathered from the Xining Statistical Yearbook [23]. The data include the GDP, urban population, saving deposits of urban residents, etc. The basic geographic information data (e.g., highways, railways, national roads and rivers) and the administrative boundaries were obtained from the National Basic Geographic Information Center (http://ngcc.sbsm.gov.cn).

2.3. Methods

2.3.1. Extracting Urban Land

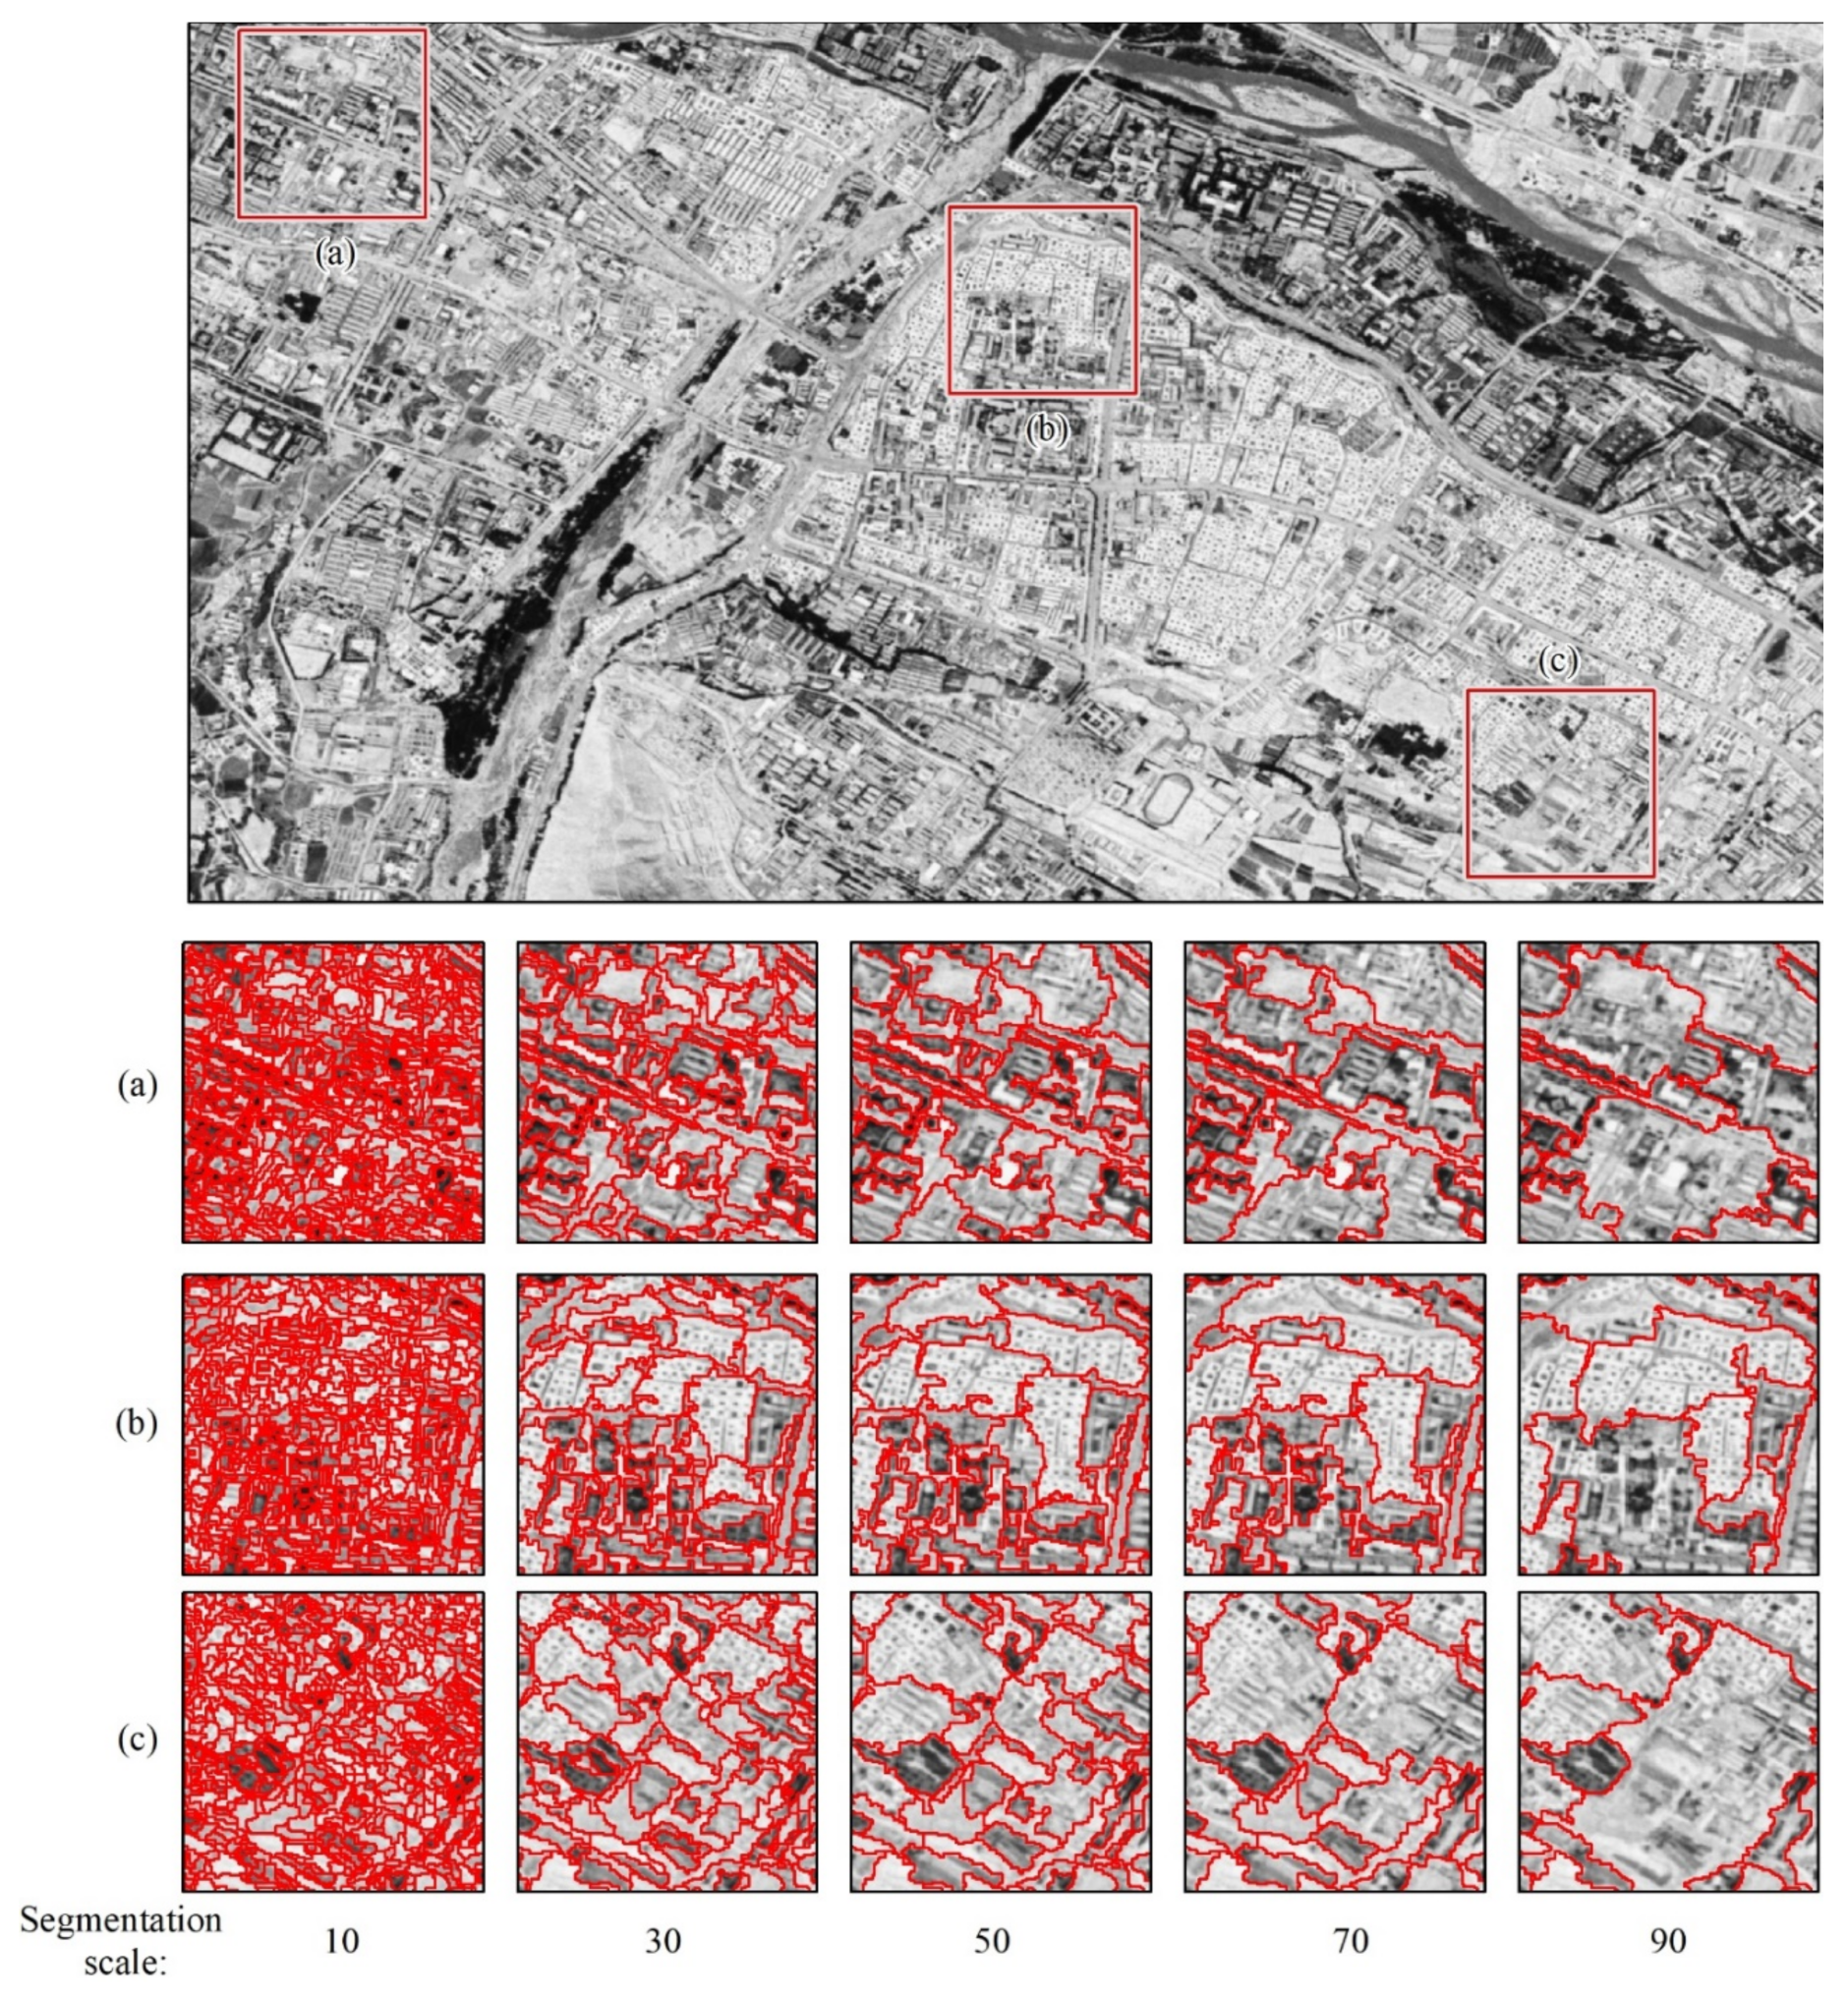
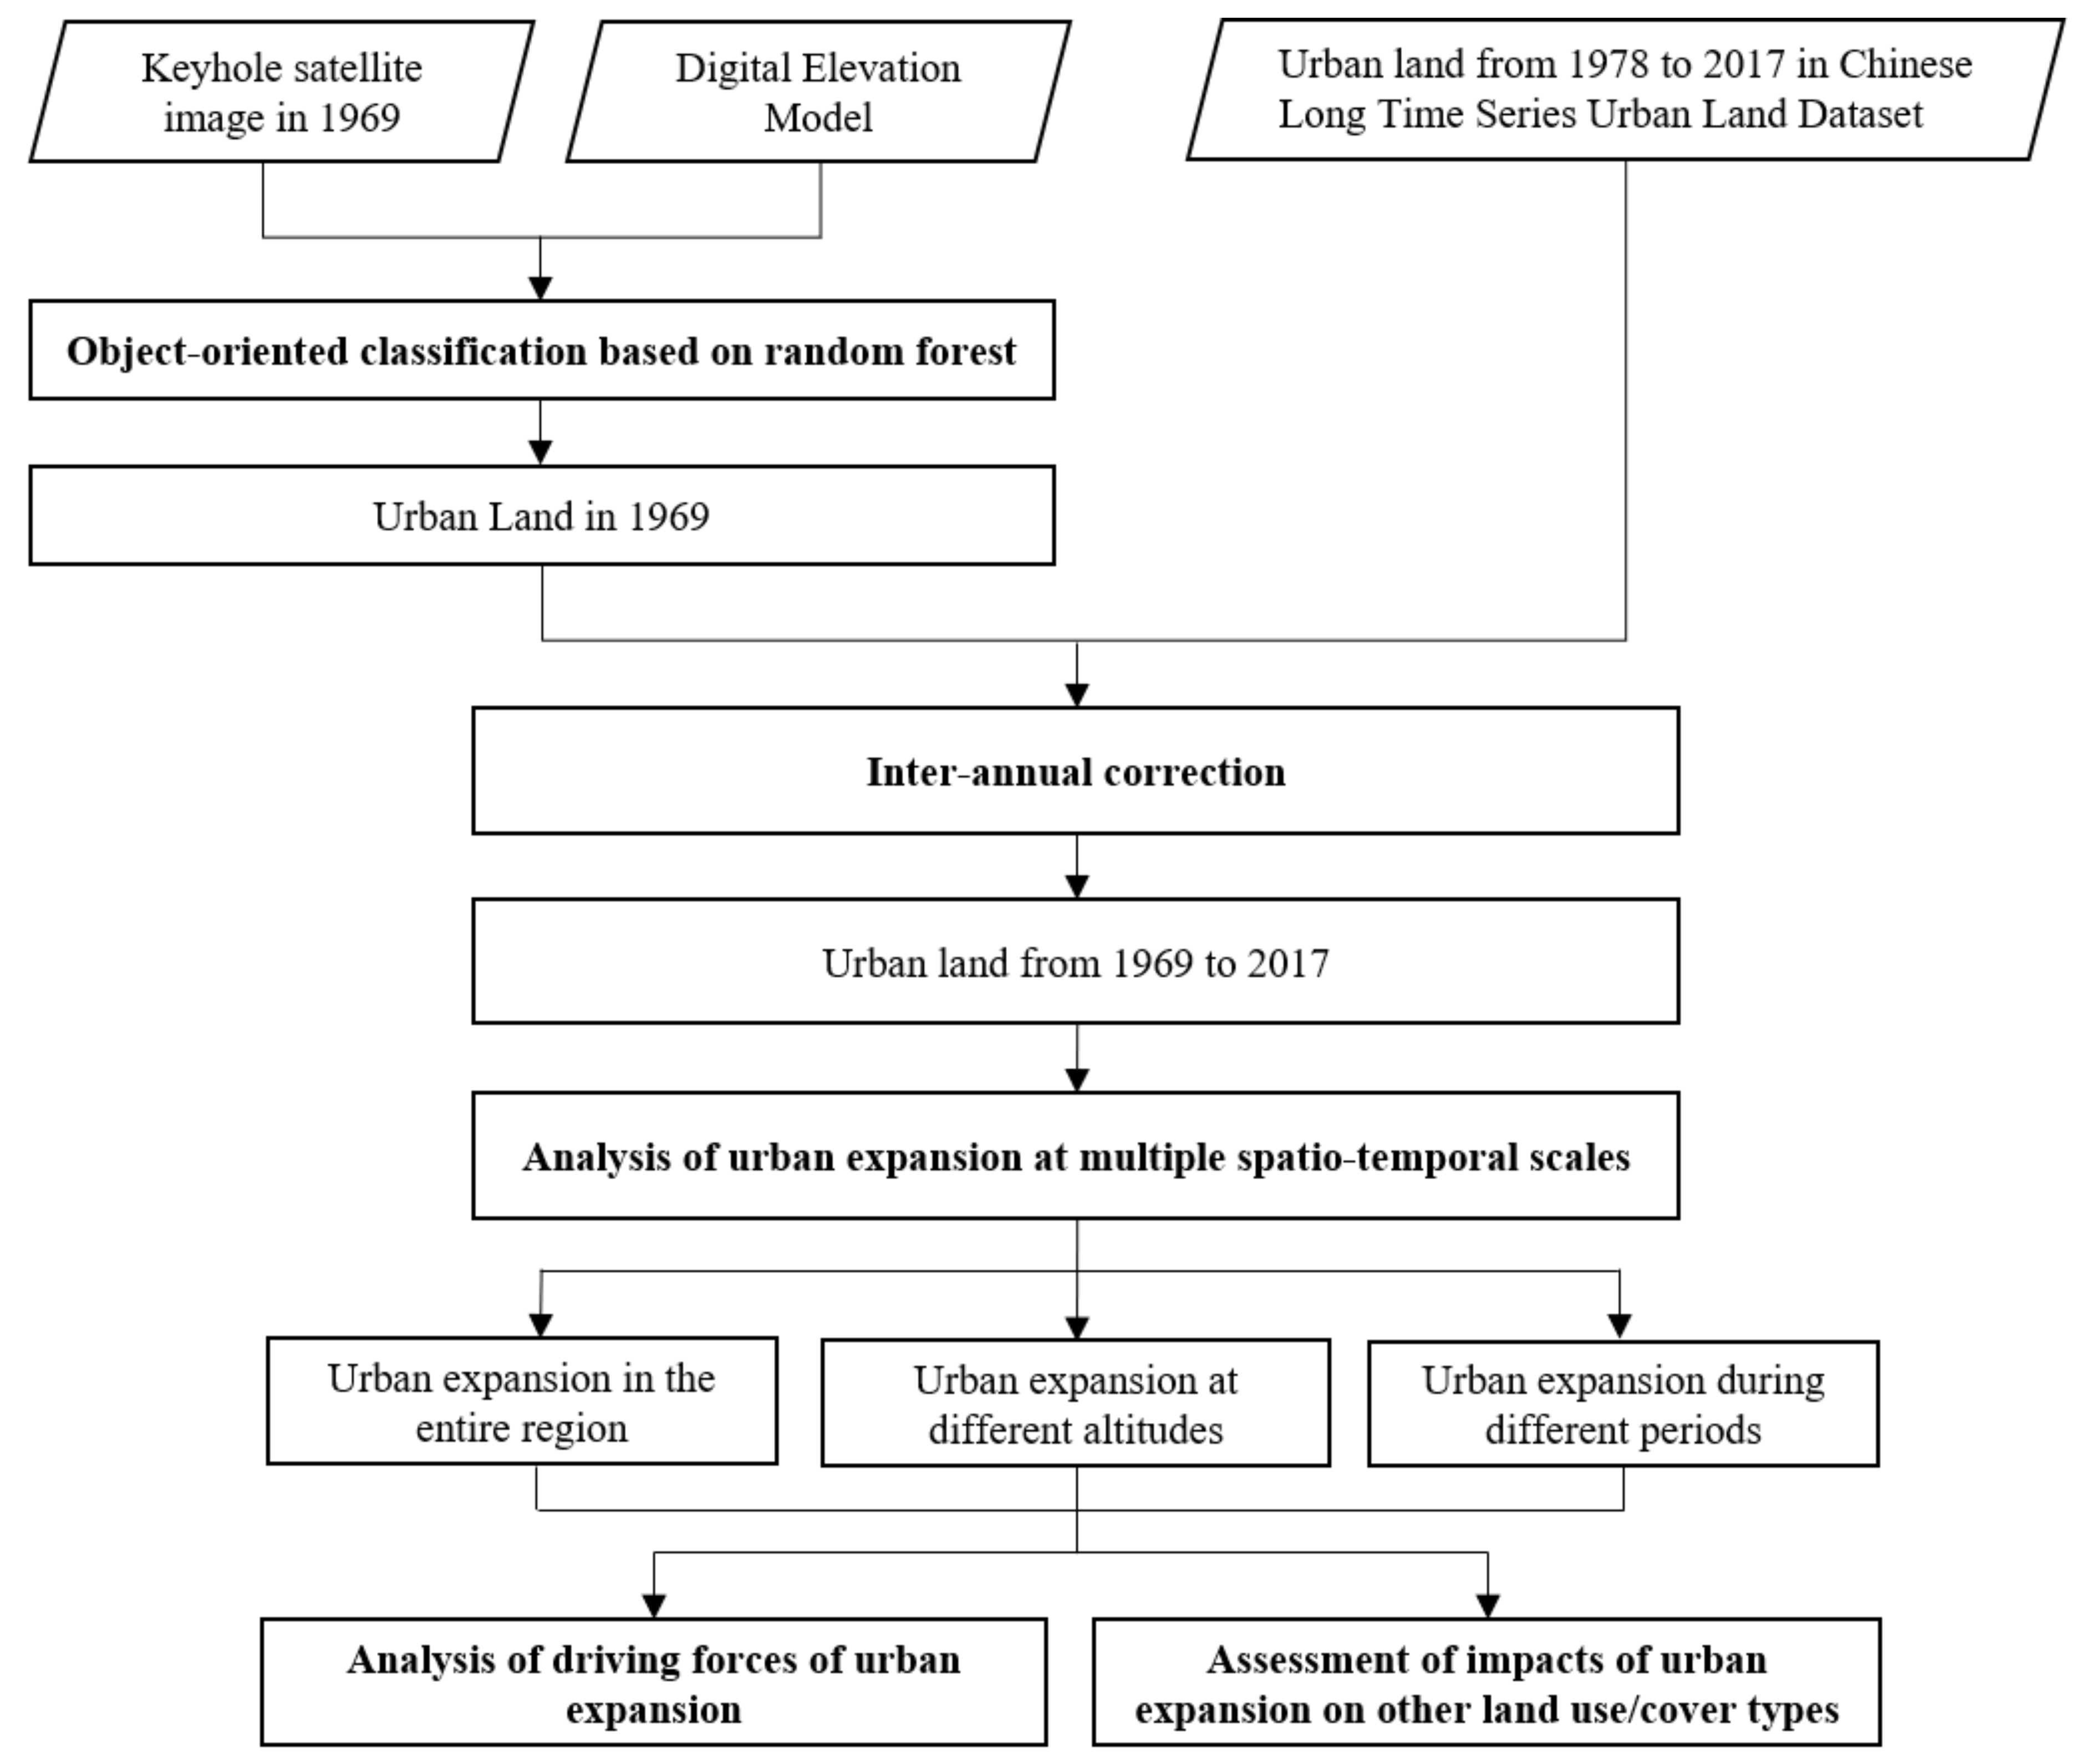
Based on the historical Keyhole satellite images, we extract the urban land of Xining City in 1969 using the object-oriented random forest classification method (Figure 2). Since topography has significant influence on the spatial distribution pattern of urban land in Xining City, we follow Shruthi et al. [24] and Dronova [25] and combine remote sensing images and DEM data to perform classification. We use the Ecognition software’s multi-scale segmentation module to set different segmentation scales to segment the combined data. By comparing the multiple segmentation results, we select the segmentation scale with the best performance for segmentation, and adopt the segmentation results for classification (see Appendix A). Based on topography conditions, colors, shadows, sizes, shapes, textures, patterns, positions and combinations of features in remote sensing images, we select 100 urban objects and 100 non-urban objects as training samples [26] (Appendix B). Based on the training samples, we apply the random forest classification method to classify the image according to the spectral features, shape features and texture features of the image. Then, we revise the classification results by visual interpretation. After that, we resample the extracted urban land data in 1969 to a resolution of 30 m using the maximum-value resampling approach, to ensure that the urban land data from 1969 to 2017 share the same spatial resolution.
Following He et al. [27], we combine the urban land information from 1978 to 2017, and correct the time series of urban land data (Figure 2). The basic assumption of the inter-annual correction is that the urban land grows continuously, and urban land that appeared in one period will not disappear in the next period. The dynamic information of the urban land from 1969 to 2017 can be obtained from the correction. The specific formula is expressed as:
U L ( n , i ) = 0 U L ( n + 1 , i ) = 0 1 U L ( n + 1 , i ) = 1 & U L ( n 1 , i ) = 1 U L ( n , i )   otherwise   ,
where U L n , i , U L n + 1 , i and U L n 1 , i represent whether the i-th pixel is urban land in year n, n + 1 and n − 1, respectively. A value of 1 means urban, and 0 means non-urban. Based on the corrected data, we can obtain the dynamic information of Xining City’s UE from 1969 to 2017.

2.3.2. Quantifying UE

Following Liu et al. [28], we select five landscape metrics, i.e., the percentage of area (PLAND), patch density (PD), landscape shape index (LSI), mean patch size (MPS) and landscape expansion index (LEI), to characterize the urban land area, urban fragmentation degree, urban patch shape, urban patch size and UE mode, respectively. Among these landscape metrics, the calculation formula of PLAND [29] is:
PLAND = j = 1 n a i j A × 100 % ,
where a i j represents the area of the corresponding urban patch, and A represents the total landscape area. The calculation formula of PD is:
PD = N / A ,
where N represents the total number of urban patches in the landscape. The calculation formula of the LSI is:
LSI = 0.25 E / A ,
where E represents the total length of the urban patch boundary in the landscape. The calculation formula of the MPS is:
MPS = j = 1 n x i j n i ,
where n represents the number of urban patches, and   x i j represents the area of the corresponding urban patches. The calculation formula of the LEI is:
LEI = A o A o + A v × 100 % ,
where A 0 represents the area where the buffer area of newly added urban land intersects with existing urban land and A v represents the area where the buffer area intersects with non-urban land. Based on different LEI values, the UE mode can be categorized into three modes: leapfrog (LEI = 0), edge expansion (LEI between 0 and 50) and infilling (LEI ≥ 50) [30].
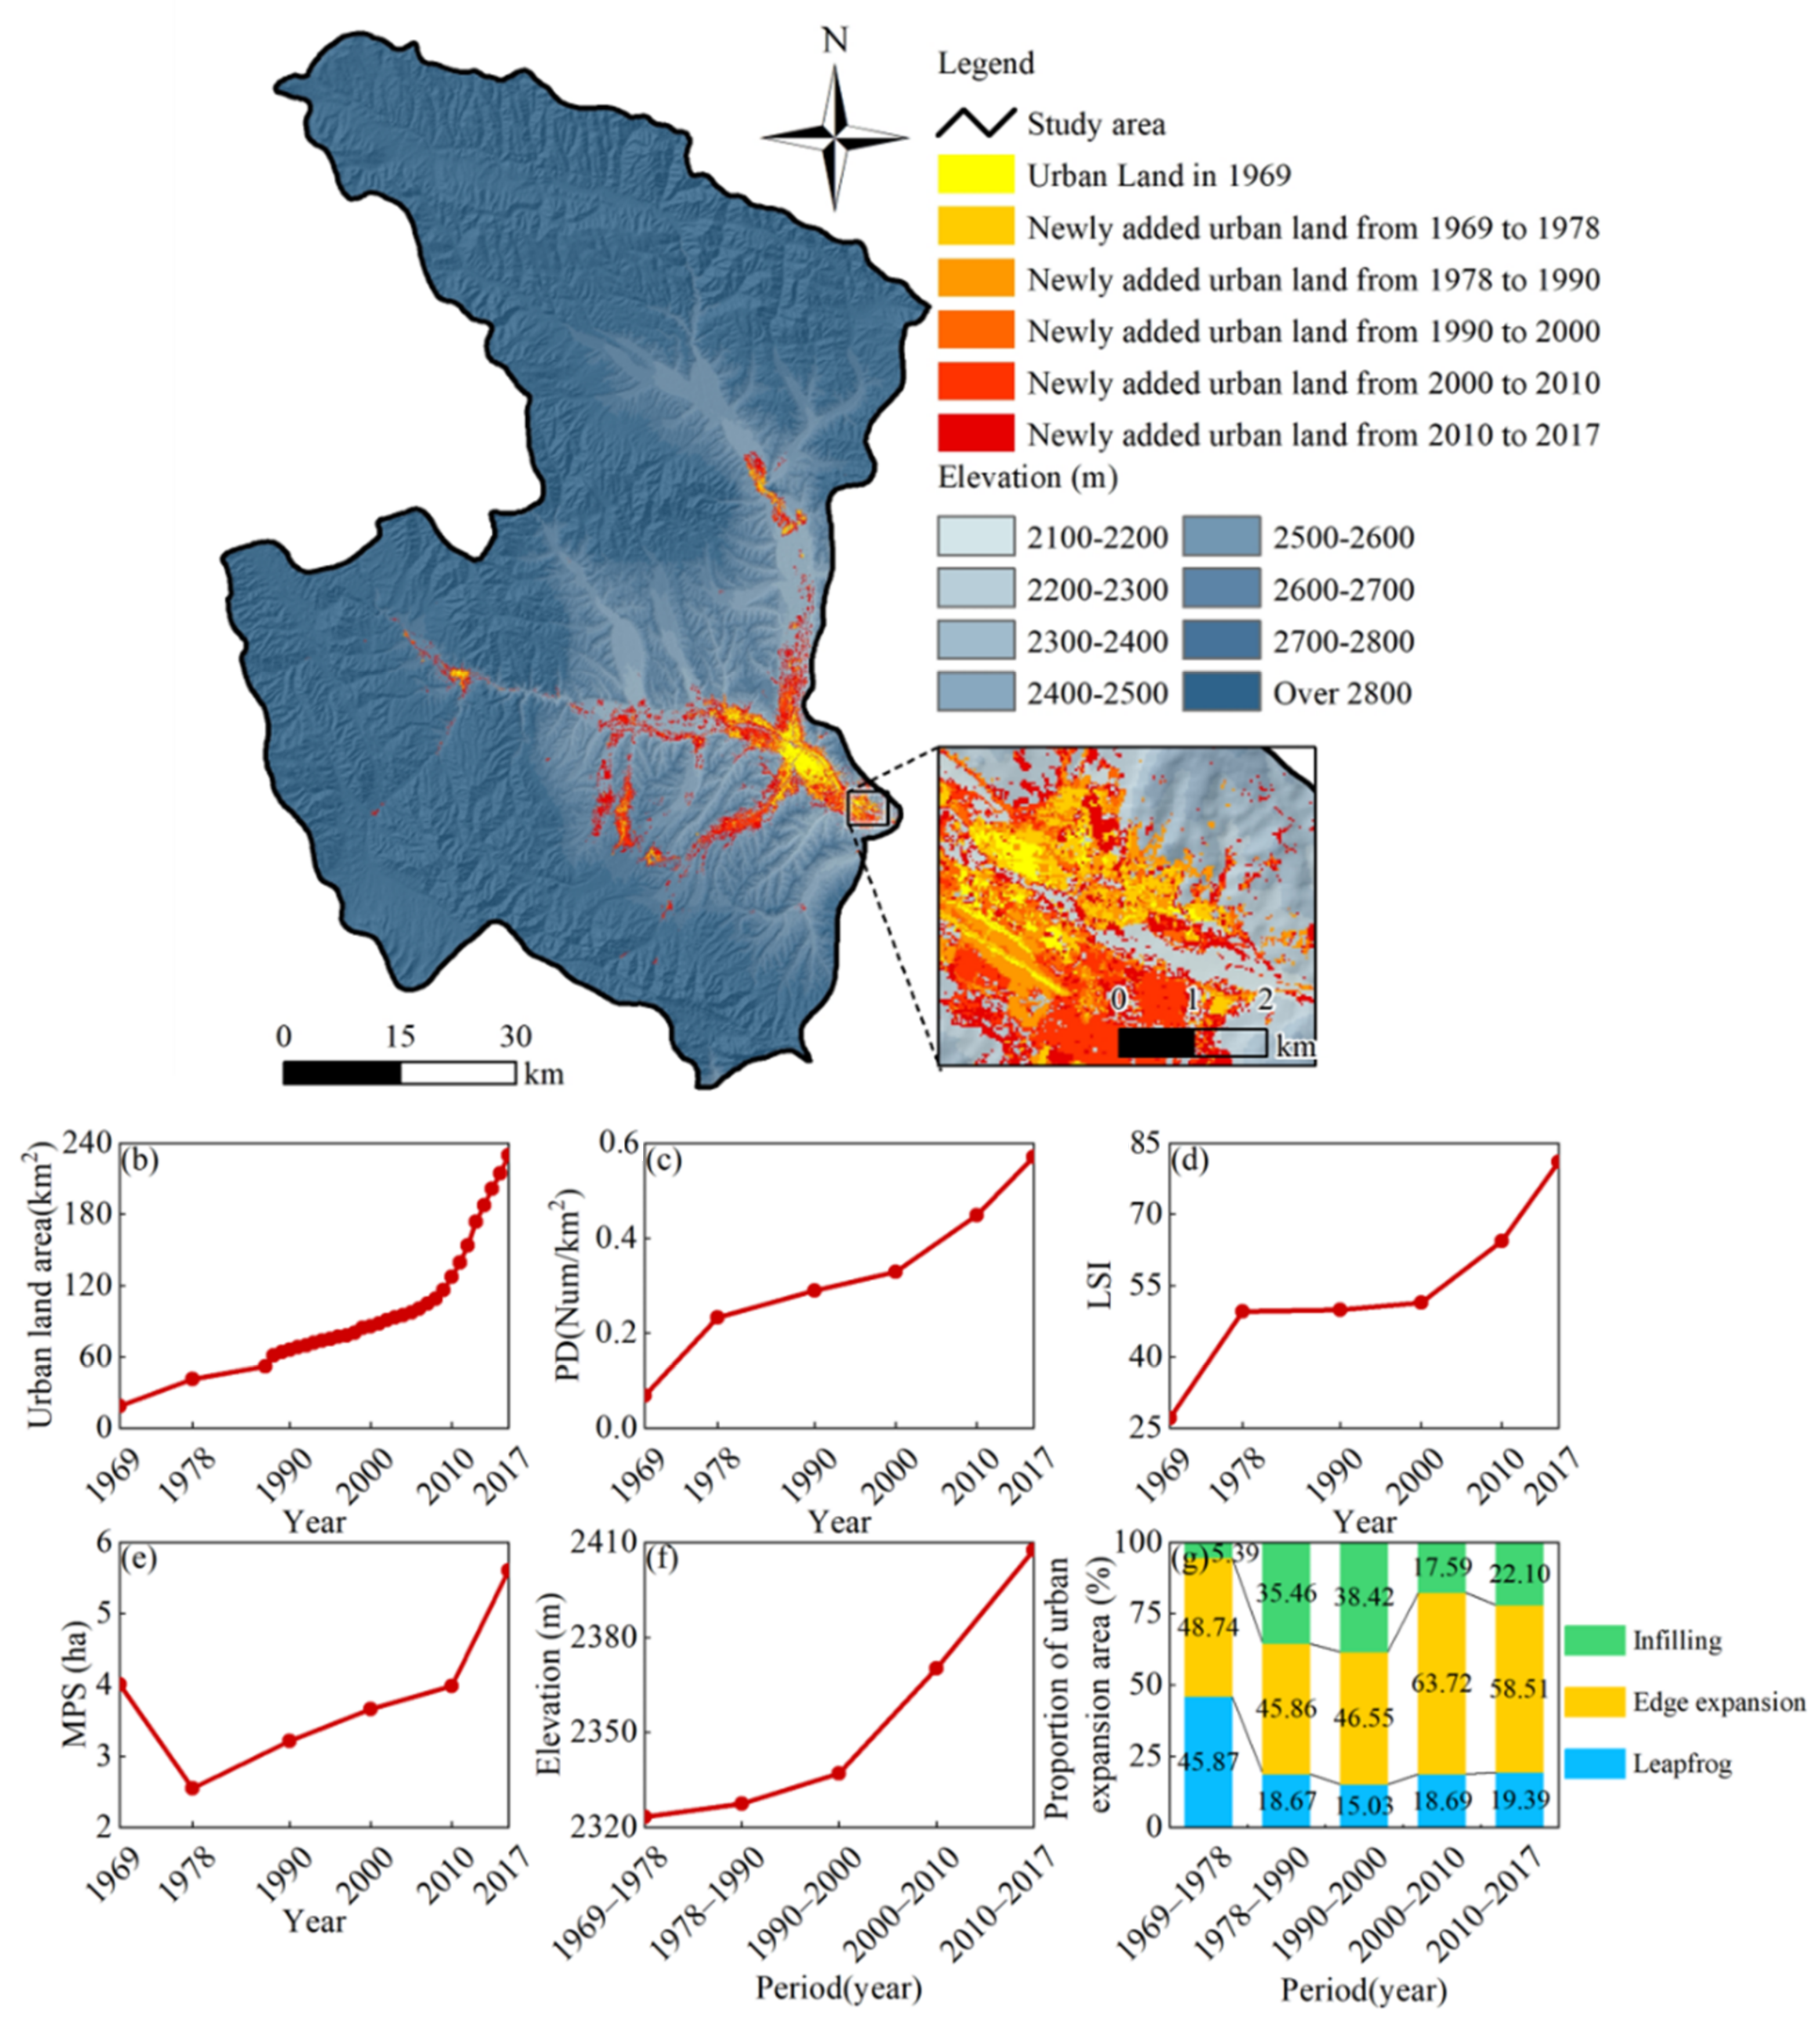
Using the above indicators, we first analyze the UE of the whole city in the past 50 years, and then explore it in different altitude areas and time periods. Since the newly added urban land in this region from 1969 to 2017 was mainly distributed below 2800 m (the area of newly added urban land within the area of 2100–2800 m accounted for 99.6% of the total area of new urban land in this region), we follow Liao and Sun [31] and Zhao et al. [32], and divide the area of 2100–2800 m above sea level into seven parts at intervals of 100m. From there, we analyze the UE at different altitudes. On the temporal scale, we split the data (1969–2017) into five periods (i.e., 1969–1978, 1978–1990, 1990–2000, 2000–2010, and 2010–2017) and investigate the UE each period (Figure 1).

2.3.3. Analyzing the Driving Forces of UE

We analyze the main drivers of Xining’s UE from two aspects, i.e., socio-economic factors and location factors. First, we collect and organize the socio-economic policies related to the UE of Xining at the national, regional and local scales, and qualitatively examine the impacts of these policies on the UE of Xining. Secondly, we follow Huang et al. [33] and use regression analysis to quantify the impacts of socio-economic factors on the UE. Based on the Xining Statistical Yearbook data, with the area of urban land as the dependent variable, 18 indicators in four categories (economy, population, fixed asset investment, and people’s living standards) are selected as the independent variables for regression analysis. Among them, the economic indicators include GDP, GDP of secondary industry, GDP of industry, GDP of construction industry, GDP of tertiary industry, and per capita GDP. The population indicators involve total population, urban population, and registered urban population. The fixed asset investment indicators consist of fixed asset investment, urban fixed asset investment, and real estate development investment. The people’s living standard indicators cover total urban household income, per capita disposable income of urban households, per capita consumption level of urban residents, per capita residential area in the urban area, saving deposits, and saving deposits of urban residents.
Similar to Kamusoko and Gamba [34] and Zhang et al. [35], we adopt the random forest approach to quantify the influences of location factors on UE. According to related research Huang [33] and available data, eight location factors that affect the process of regional UE are selected from four aspects, i.e., transportation, topography, city center and river. The transportation factors comprise distance to national road, distance to railway and distance to highway. The topographic factors include elevation, slope and aspect. The city center factor is the distance to the city center. The river factor is the distance to the river. The impact analysis of location factors based on random forest mainly includes the following four steps. First, 66% of the location factor data are randomly selected as the sample dataset, while the remaining data (34%) are used as out-of-bag data (i.e., test data). Second, we construct 100 decision trees and train them using the sample dataset, and use the out-of-bag data to evaluate the accuracy of the trees. In this study, when the out-of-bag score exceeds 0.85, the accuracy satisfies the requirements. Third, we use the out-of-bag data and each decision tree to calculate the error (e1). We randomly change the order of a certain factor j in the out-of-bag data to obtain new out-of-bag data, and calculate the error again (e2). Fourth, the importance of factor j can be obtained by standardizing the difference between e1 and e2 of each decision tree. In this study, the importance score of a factor is used as an indicator to determine the degree of influence of a certain factor on the UE. The higher the score, the greater the influence of the factor on the UE.

2.3.4. Assessing the Impacts of the UE on other Land Use/Cover Types

Following previous studies [36,37,38], we generate a transition matrix between urban land and other land use/cover types, and quantify the occupation of other land use/cover types by urban land. First, we establish the interpretation standard using the color, shadow, size, shape, texture, pattern, position and combination of the features in the Keyhole satellite remote sensing image [26] (Appendix B). Then, according to the interpretation standard, we extract the cropland, grassland, rural construction land, rivers, shrubland, forest, bareland and lake in 1969. We apply the maximum-value resampling approach to resample the extracted land use/cover information to a resolution of 30 m. Finally, we spatially overlay the urban land data of different periods and different UE modes with the land use/cover information in 1969. In this way, we analyze the impacts of UE in different periods and different UE modes on other land use/cover types.

3. Results

3.1. The overall UE of Xining City

Xining City experienced rapid UE from 1969 to 2017 (Figure 3, Table 1). The urban land area has increased exponentially from 19.9 km2 to 231.1 km2 with a mean annual growth (MAG) rate of 5.3% (Figure 3b, Table 1). With the expansion of Xining City, the degree of urban fragmentation has intensified, and urban PD has experienced growth from 0.07 Num/km2 to 0.57 Num/km2 (Figure 3c). The shape of urban patches was more irregular, and urban LSI has increased from 27.1 to 81.0 (Figure 3d). The average area of urban patches gradually increased, and urban MPS increased from 4.0 ha to 5.6 ha (Figure 3e). Xining City gradually expanded to high-altitude areas. From 1969–1978 to 2010–2017, the average altitude of newly added urban land has changed from 2323.3 m to 2407.6 m (or an increase of 84.3 m; Figure 3f). The UE model of Xining City has shifted from leapfrog UE to edge expansion. From 1969–1978 to 2010–2017, the proportion of leapfrog UE in the total UE area dropped from 45.9% to 19.4%, while the proportion of edge UE area in the total UE area increased from 48.7% to 58.5% (Figure 3g, Table 1).

3.2. The UE at Different Altitudes

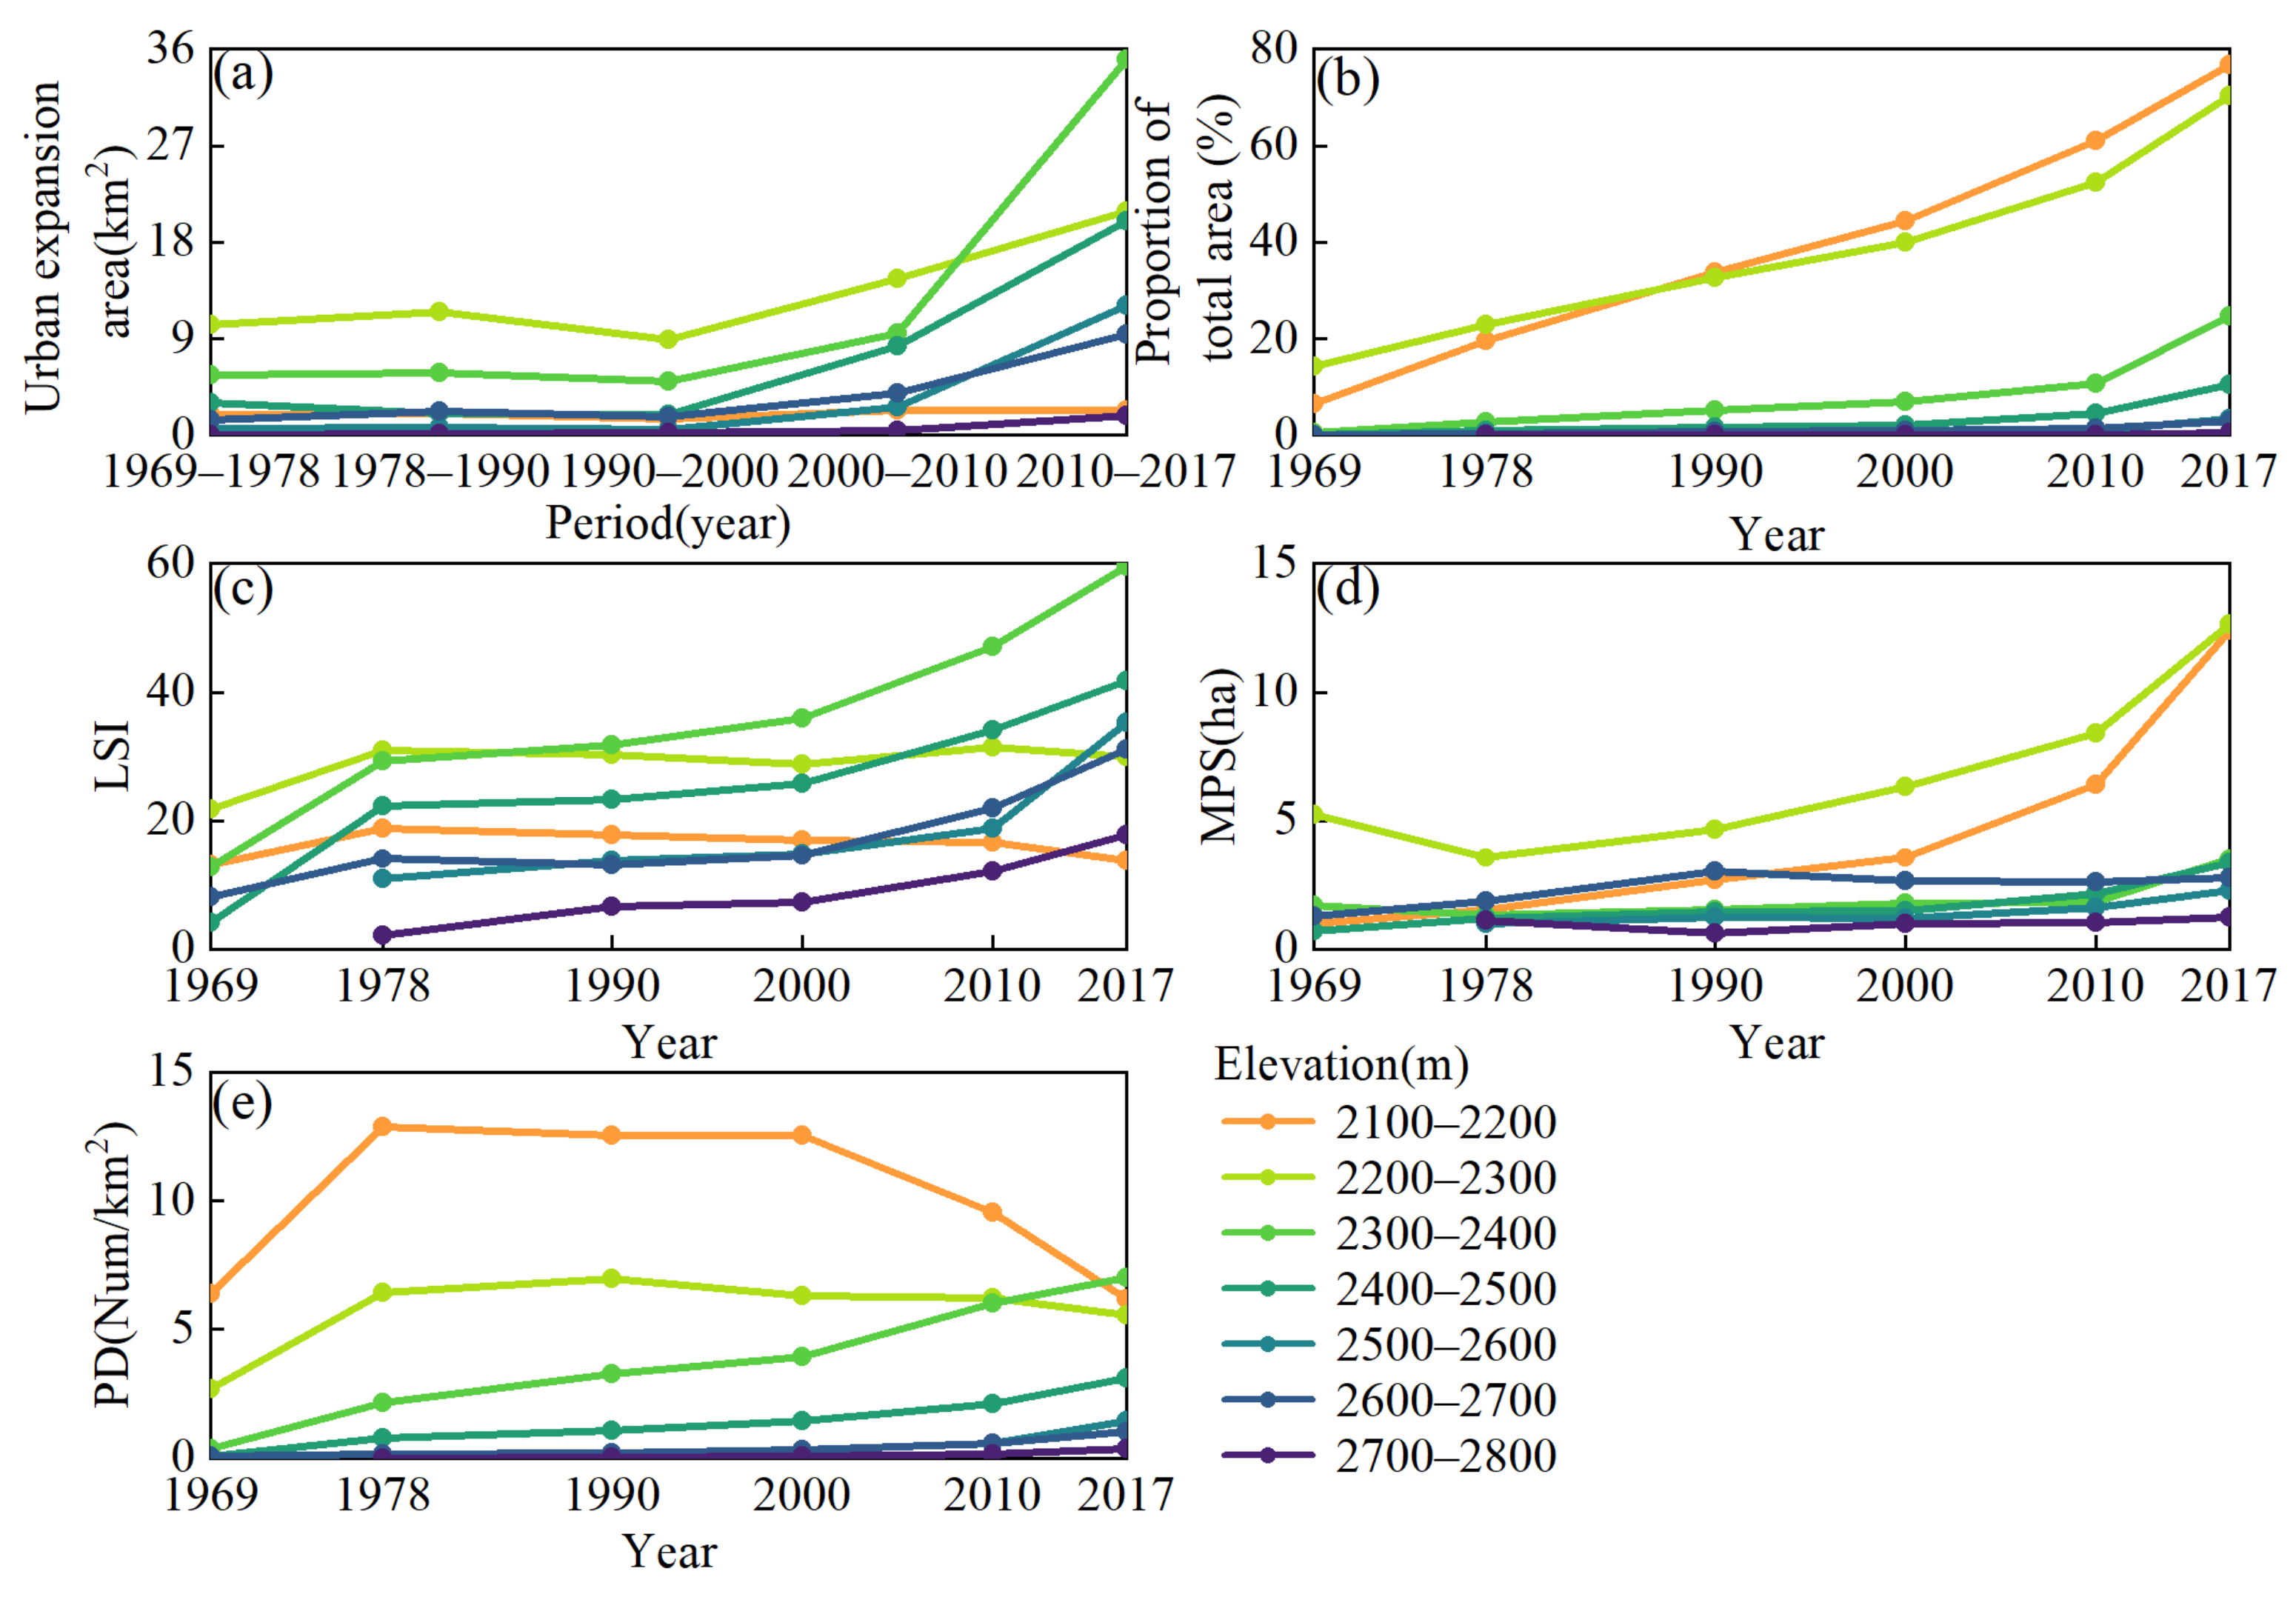
There were obvious differences in the UE of Xining City at different altitudes (Figure 4, Table 2). First of all, the urban land area of the lower altitude area was growing at a uniform rate, and the urban land area in the higher altitude area was growing at an accelerated rate (Figure 4a,b). At 2100–2200 m, from 1969 to 1978, the urban land area increased by 1.9 km2 (with a MAG of 0.21 km2); the proportion of urban land area increased by 13.2% (with a MAG rate of 1.5%). From 2010 to 2017, the urban land area increased by 2.3 km2 (with a MAG of 0.33 km2); the proportion of urban land increased by 15.9% (with a MAG rate of 2.3%). The urban land area and the proportion of the urban land area in the two time periods barely changed, and the city expanded at a uniform speed (Figure 4a,b). At 2300–2400 m, from 1969 to 1978, the area of urban land increased by 5.6 km2 (with a MAG of 0.62 km2); the proportion of urban land increased by 2.2% (with a MAG rate of 0.2%). From 2010 to 2017, the area of urban land increased by 35.0 km2 (with a MAG of 5.0 km2); the proportion of urban land increased by 13.9% (with a MAG rate of 2.0%). The area of urban land and the proportion of urban land increased significantly in the two time periods (i.e., 1969–1978 and 2010–2017), and the UE speed was significantly accelerated (Figure 4a,b).
Second, the degree of urban fragmentation and irregularity increased first and then decreased in areas with lower altitudes, while it continued to increase in areas with higher altitudes (Figure 4). For example, the urban LSI and PD at 2100–2200 m have increased from 13.1 and 6.4 Num/km2 (in 1969) to 18.8 and 12.9 Num/km2 (in 1978), and then declined to 13.1 and 6.2 Num/km2 (in 2017). By contrast, the urban LSI and PD at 2300–2400 m have escalated from 12.8 and 0.4 Num/km2 (in 1969) to 59.5 and 7.0 Num/km2 (in 2017) (Figure 4c,e).
Third, for areas with lower altitudes, the proportion of infilling UE area was higher. For areas with higher altitudes, the leapfrog UE area accounted for a higher proportion (Figure 5 and Table 2). Taking 2010–2017 as an example, at 2100–2200 m, the infilling UE area accounted for 66.1%, while the leapfrog UE area accounted for 3.3%. At 2700–2800 m, the infilling UE area accounted for 11.3%, while the leapfrog UE area accounted for 36.8% (Figure 5).

3.3. Driving Forces of UE

Since the establishment of the People’s Republic of China, Xining’s urban space has always followed the spatial organization model of “internal life and external production”, with the idea of building Xining’s living and service functions around the city center at the intersection of the four river valleys. Various industrial facilities were constructed at a certain distance from the living space. Before 1978, the western region mainly implemented the “top-down” urbanization system led by the central government, and industrialization was the key driving force for Xining’s urbanization. Multiple programs at different periods (e.g., reform and opening-up, western development, and pilot areas for new-type urbanization) have supported the development of Xining City. The construction of some major infrastructure and important development zones (including the Qinghai–Tibet Railway, Beijing–Tibet Expressway, Lanxin High-speed Railway, Xining National Economic and Technological Development Zone, and the Lanzhou–Xining Urban Agglomeration Development Plan) have directly contributed to the increase in urban land in Xining (Figure 6a).
Our quantitative analysis of socio-economic factors reveals that the urban land area is significantly correlated with socio-economic indicators (Table 3), and all correlation analysis results have passed the 0.001 level of significance test. Among the four types of factors, the correlation coefficients between the urban land area and the indicators of population, economy, and people’s living standards are relatively high (all >0.9). The correlation coefficient between urban land area and fixed asset investment indicators is relatively low (0.8–0.9). Among the economic indicators, the correlation between urban land area and GDP of industry is the highest (at 0.98). Among the population indicators, the urban land area has the highest correlation with the urban population (at 0.99). Among the fixed asset investment indicators, the urban land area has the highest correlation with real estate development investment (at 0.89). Among the indicators of people’s living standards, the urban land area has the highest correlation with saving deposits of urban residents (at 0.99) (see details in Table 3).
Transportation and topography are the main factors affecting the spatial pattern of UE in Xining. Based on random forest approach, our results indicate that the most important location factor from 1969 to 2017 was transportation (with an importance of 41.6%), followed by topography (with an importance of 34.9%). On different temporal scales, the importance of topography influencing factors has decreased, and the importance of transportation influencing factors has increased. From 1969 to 1978, the importance of transportation influencing factors was 33.8%, while the importance of topography influencing factors was 42.0%. From 2010 to 2017, the importance of transportation influencing factors was 39.0%, and the importance of topography influencing factors was 35.4% (Table 4, Figure 6b).

3.4. Impacts of UE on Other Land Use/Cover Types

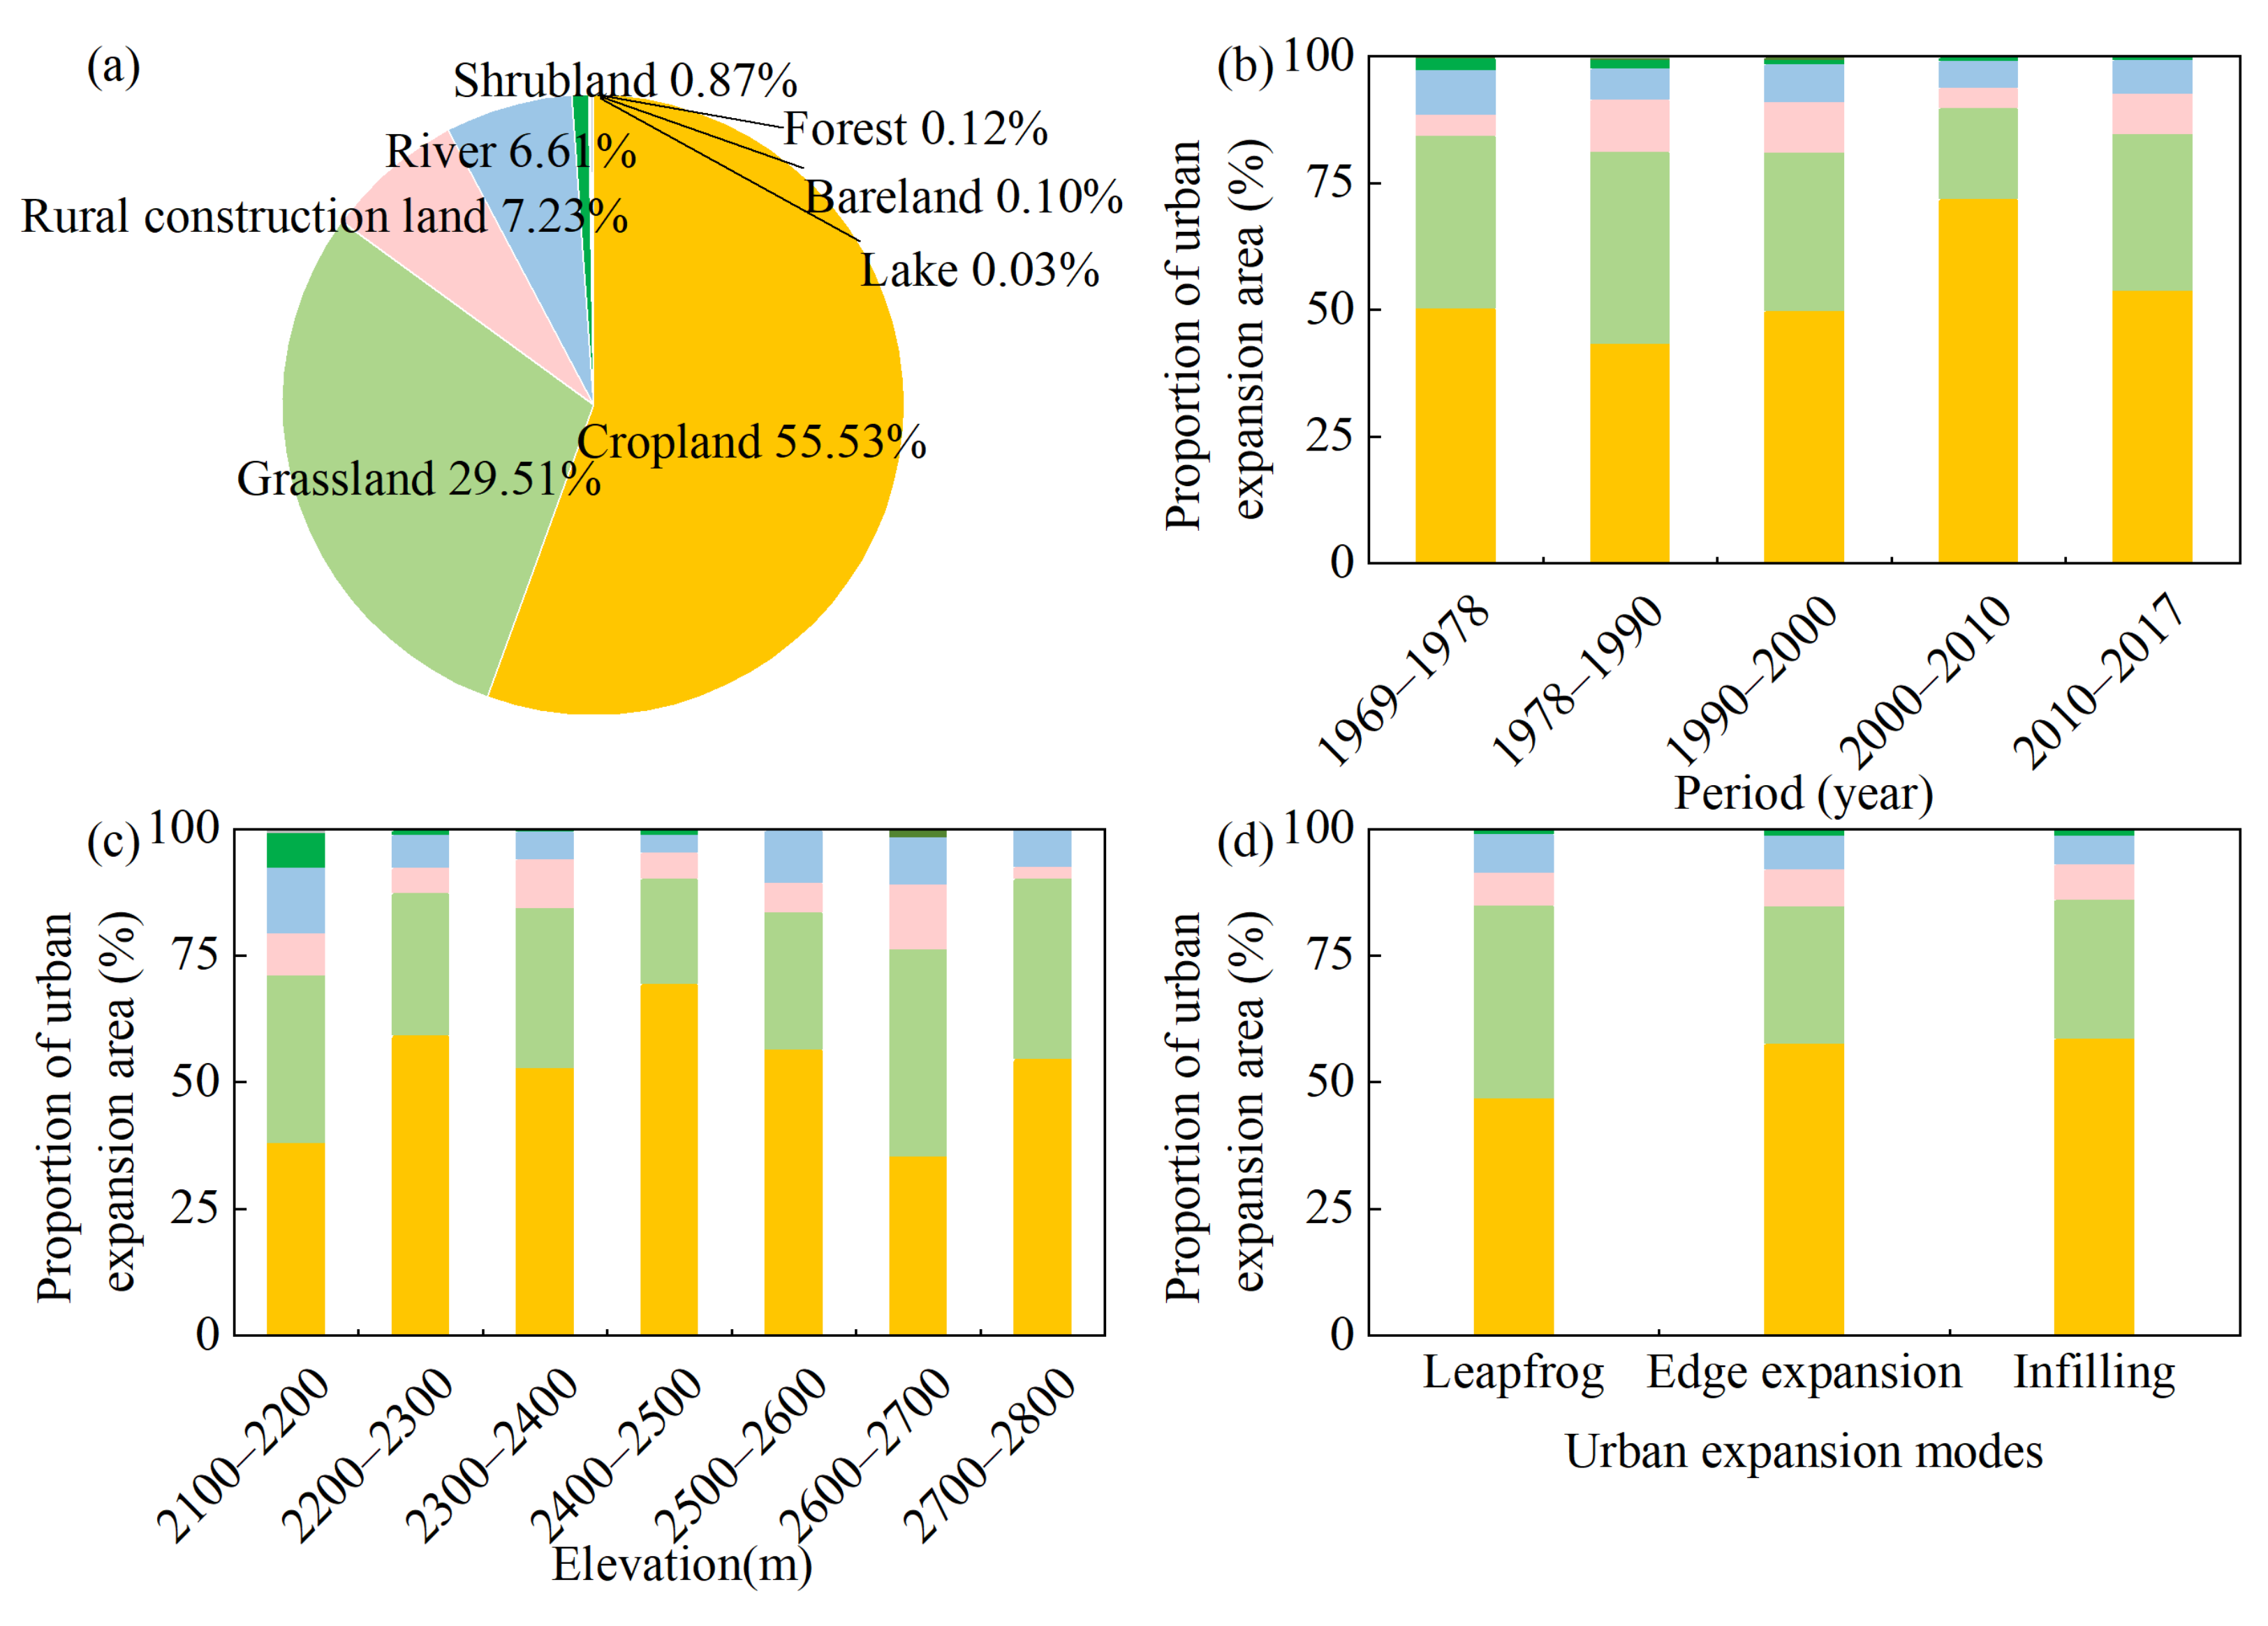
From 1969 to 2017, the UE of Xining City mainly encroached on cropland and grassland (Figure 7a). The area of cropland took over by UE in the entire region was 117.3 km2, accounting for 55.5% of the total area of UE. The UE in the whole region encroached on 62.3 km2 of grassland, accounting for 29.5% of the total UE area (Figure 7a). In different time periods and at different altitudes, the UE of Xining City was dominated by the occupation of cropland and grassland (Figure 7b,c). In 1969–1978, 1978–1990, 1990–2000, 2000–2010, and 2010–2017, the cropland occupied by UE of Xining City accounted for 50.4%, 43.4%, 49.9%, 72.0% and 53.9% of the total area of UE, respectively. The grassland occupied by the UE constituted 33.9%, 37.9%, 31.2%, 18.0% and 30.9% of the total UE area, respectively. From 1969 to 2017, at 2100–2200 m, 2200–2300 m, 2300–2400 m, 2400–2500 m, 2500–2600 m, 2600–2700 m, and 2700–2800 m, the cropland occupied by the UE were 38.1%, 59.4%, 52.9%, 69.5%, 56.5%, 35.5% and 54.7% of the total area of UE, respectively; and the grassland occupied by the UE made up 33.1%, 28.1%, 31.5%, 20.7%, 27.1%, 40.8% and 35.7% of the total area of UE, respectively.
Different UE modes of Xining City had different impacts on other land use/cover types. In general, leapfrog UE occupied more grassland, while edge and infilling UE occupied more cropland (Figure 7d). From 1969 to 2017, the leapfrog UE in Xining City occupied 17.4 km2 of grassland (approximately 38.0% of the total area of leapfrog UE) and 21.4 km2 of cropland (about 46.9% of the total area of leapfrog UE). Edge UE invaded 32.0 km2 of grassland (about 27.1% of the total edge UE) and 68.0 km2 of cropland (roughly 57.6% of the total edge UE). The infilling UE invaded 13.0 km2 of grassland (~27.4% of the total infilling UE area) and 27.8 km2 of cropland (accounting for 58.7% of the total infilling UE area) (Figure 7d). Overall, the proportion of grassland encroached by leapfrog UE was greater than that of edge and infilling UE, and the proportion of cropland encroached by leapfrog UE was smaller than that of edge and infilling UE.

4. Discussion

4.1. UE Quantification Using Historical Keyhole Satellite Data and CULD

The historical Keyhole satellite images have a high spatial resolution of 2.7 m, which can clearly display the texture characteristics of ground objects [13,39]. Therefore, using this data can accurately identify urban land [17]. The CULD, which used the “Exclusion/Inclusion” algorithm and the Google Earth Engine platform, can also provide urban land information with high accuracy [9].
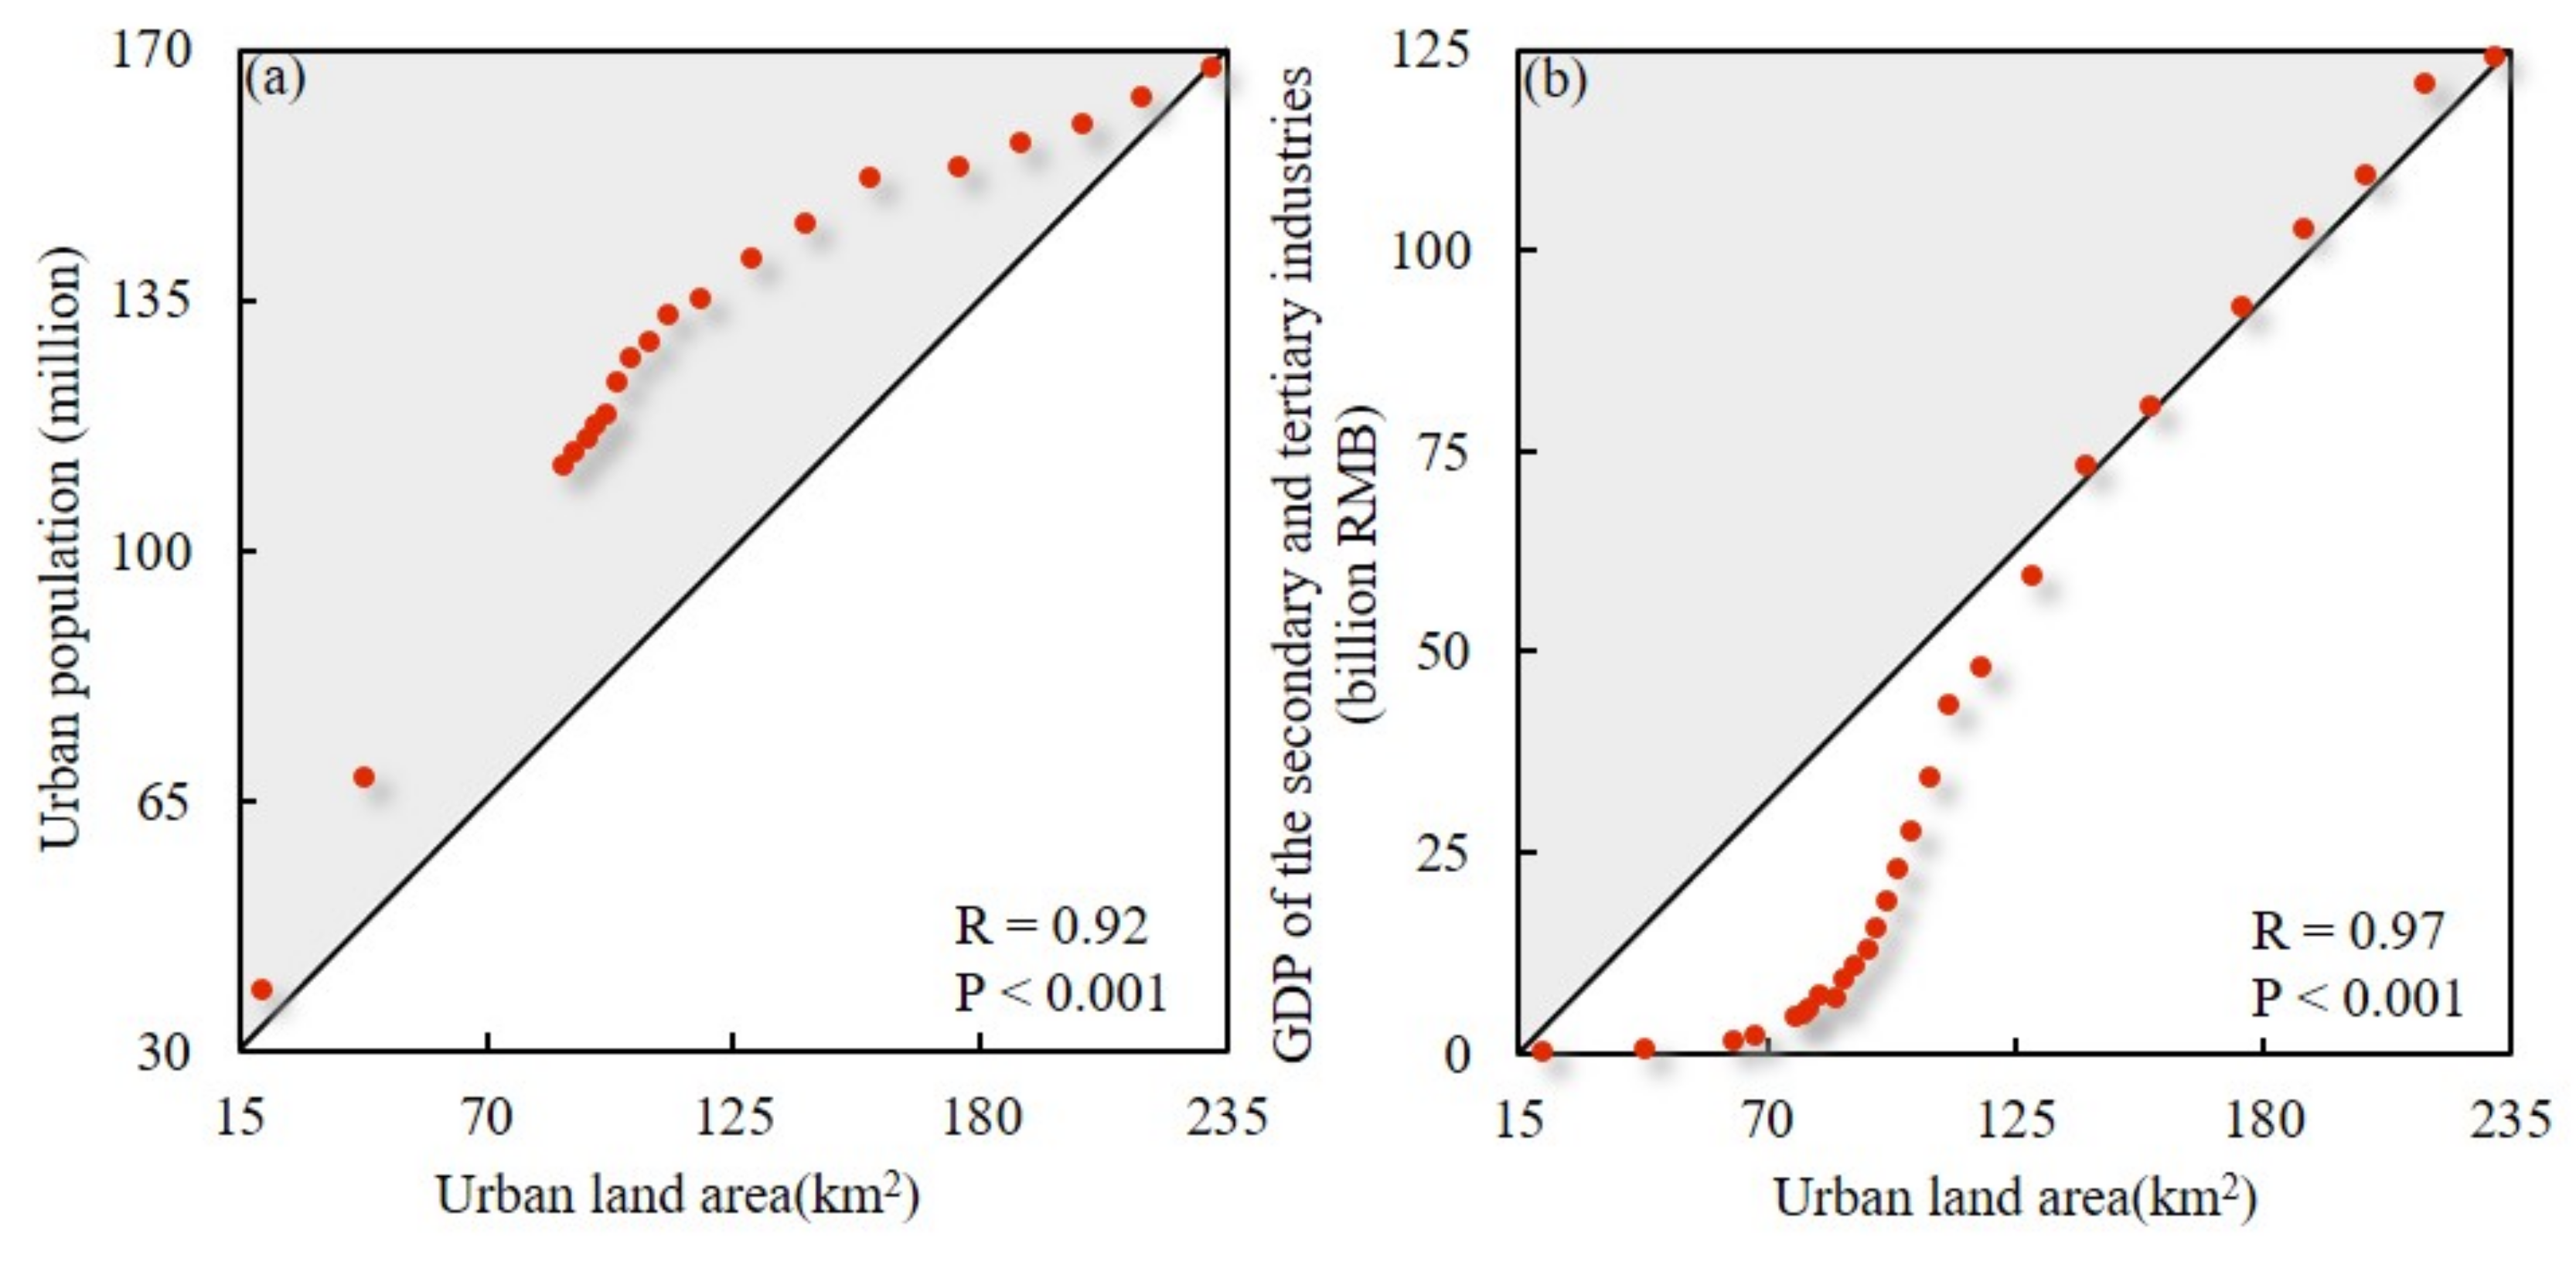
By combining these data (above), we evaluate the accuracy and continuity of the Xining urban land information in the past 50 years. Similar to earlier studies [40], we use the socio-economic data and high-resolution remote sensing data to examine the accuracy of Xining’s expansion from 1969 to 2017. First, we analyze the relationships between urban land area and urban population, and the relationships between urban land area and the GDP of the secondary and tertiary industries. Our results show that the correlation coefficient between urban population and urban land area is 0.92 (Figure 8a), and the correlation coefficient between the GDP of the secondary and tertiary industries and urban land area is 0.97 (Figure 8b).
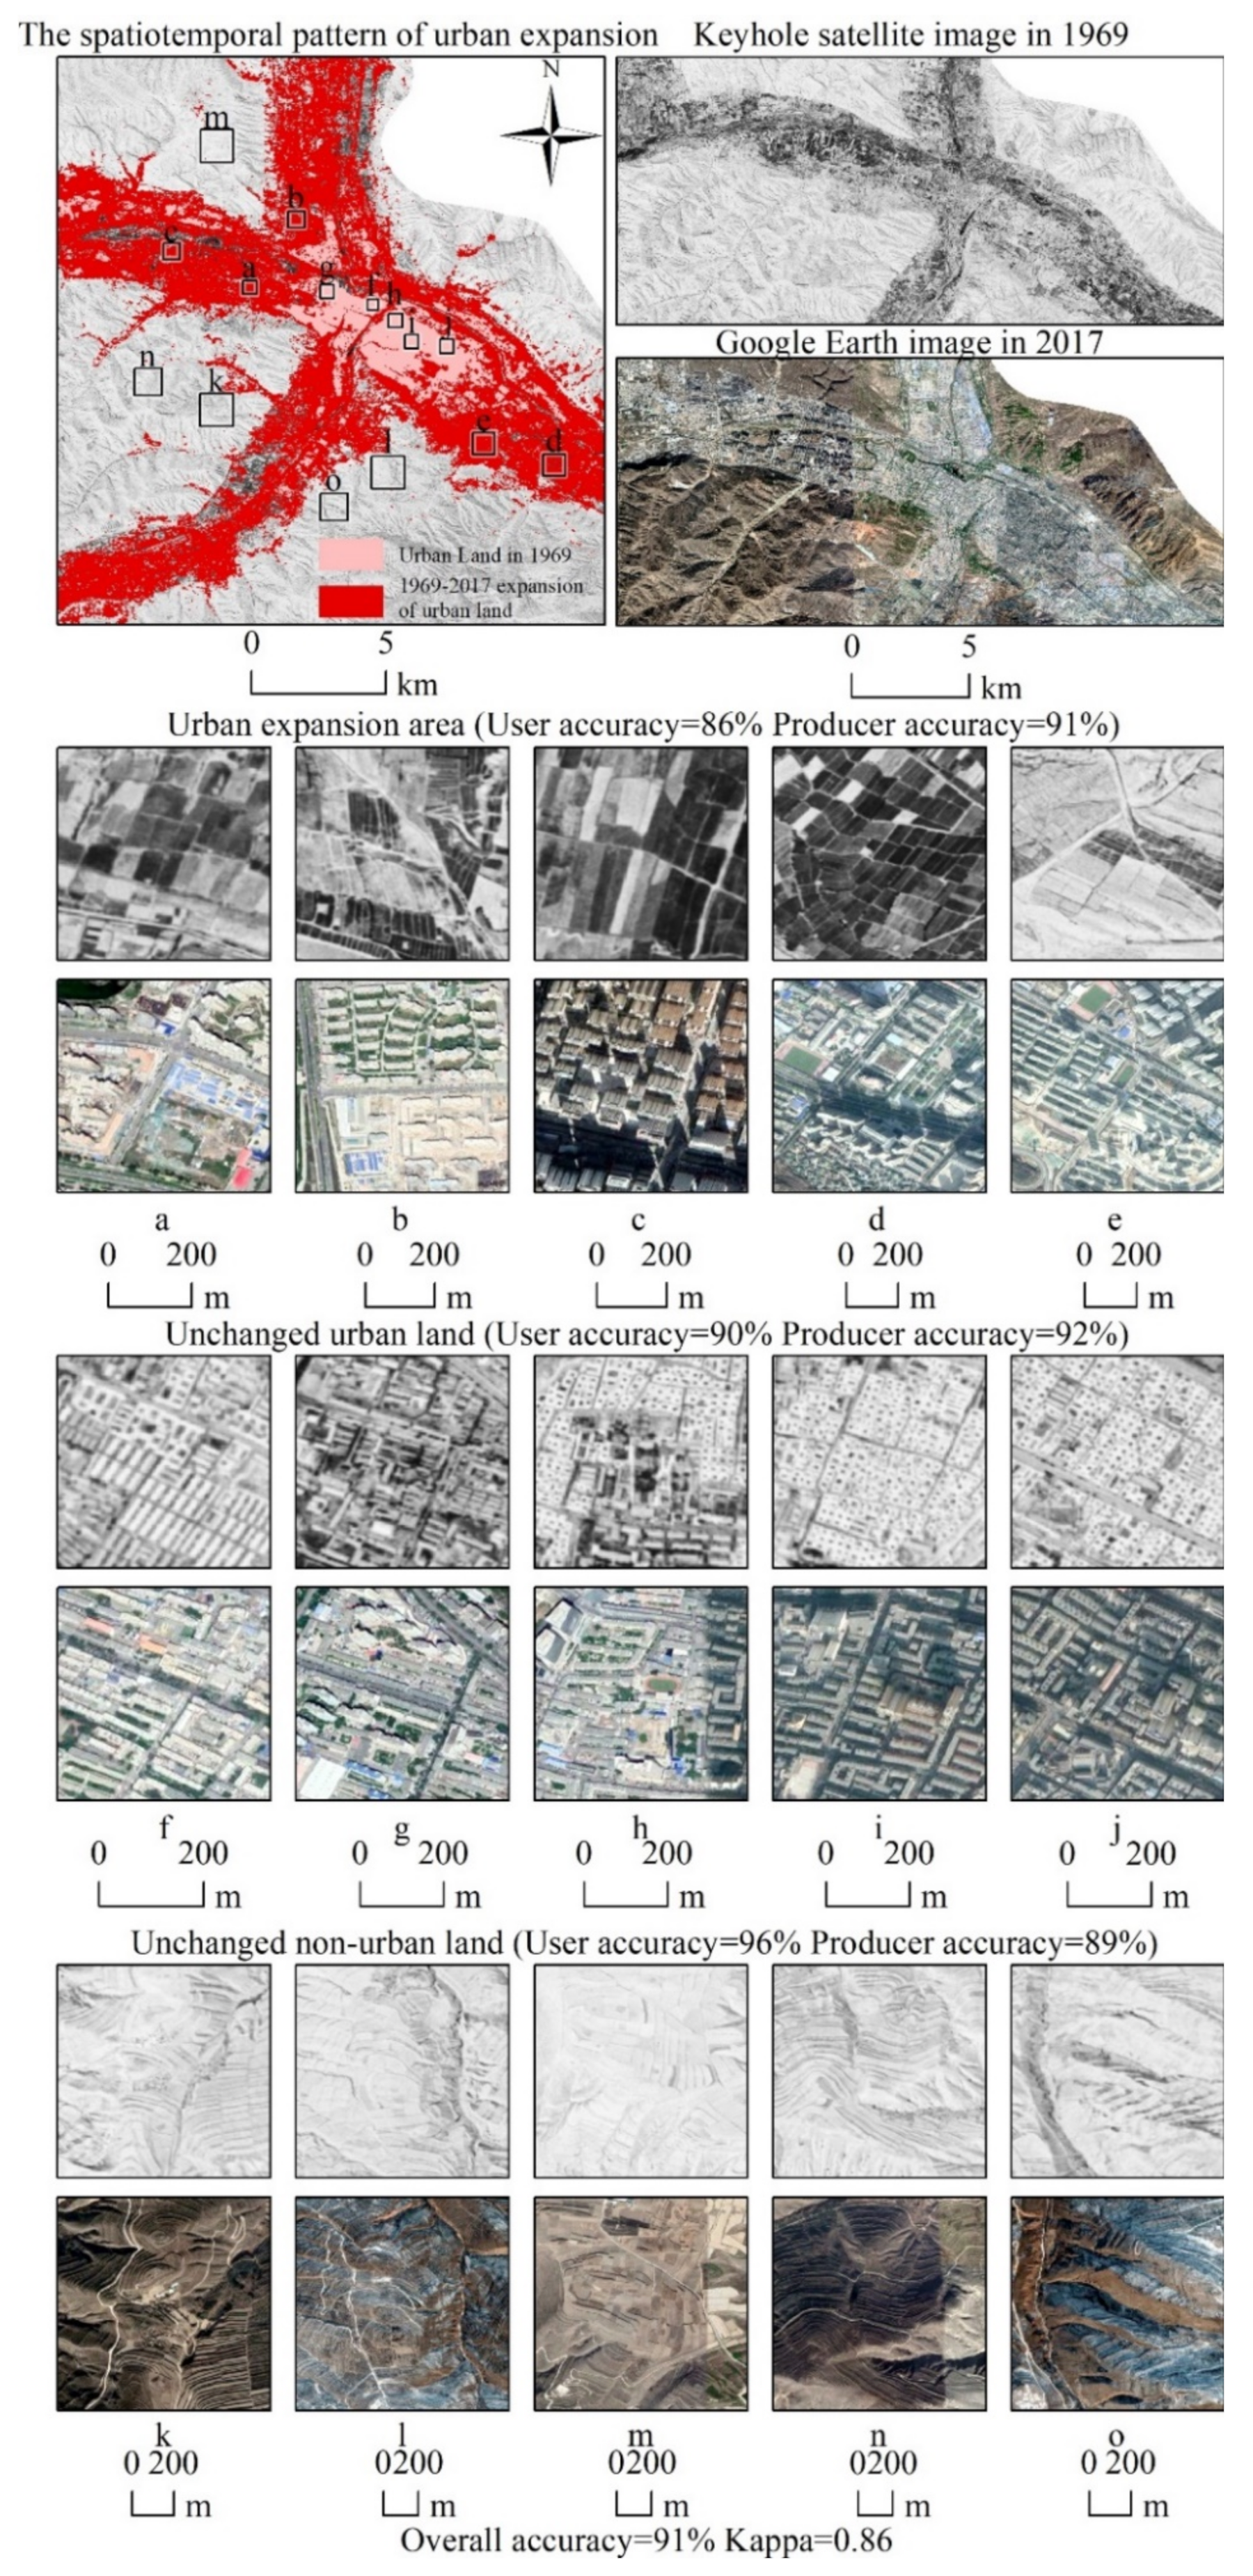
Following Li et al. [41] and Yao et al. [42], we select 50 samples for each of the unchanged urban land, unchanged non-urban land and UE area of Xining City from 1969 to 2017. We apply the high-resolution data in 2017 from Google Earth for accuracy assessment. Our assessment suggests that the user accuracy (UA) and producer accuracy (PA) for UE areas are 86% and 91%, respectively, the UA and PA for unchanged urban land are 90% and 92%, respectively, and the UA and PA for unchanged non-urban land are 96% and 89%, respectively. The overall accuracy is 91%, and the kappa coefficient is 0.86 (Figure 9). In general, our integrated urban land data have high accuracy and reliable continuity. In this sense, these two datasets can provide support for in-depth understanding of the UE of Xining City in the past 50 years. In addition, they should be useful for quantifying the historical UE of other regions in China.

4.2. Policy Implications

The UE of Xining City in the past 50 years mainly exhibited the following characteristics (see Figure 10). First, the area of urban land has experienced an accelerated growth trend. The average annual UE area has accelerated from 2.55 km2 (in 1969–1978) to 14.61 km2 (in 2010–2017), an increase of nearly five times. The per capita urban land area has exceeded the national standard of 100 m2/person in 2012 [43], and reached 138.0 m2/person in 2017. Secondly, the urban land area was almost saturated at the lower-altitude river valley area and the extension of urbanization to higher-altitude areas was inevitable. The average altitude of the UE area has increased from 2323.3 m (in 1969–1978) to 2407.6 m (in 2010–2017), an increase of nearly 100 m. Such accelerated expansion was at the expense of a large amount of cropland and grassland. This has threatened the regional food security and environment, and increased the vulnerability of urban residents living in higher-altitude areas to landslides and other geological disasters.
Consistent with previous studies, our results indicate that Xining City is undergoing a rapid UE process, posing a serious threat to the environment. For example, the research of Zhang et al. [44] reported that Xining City entered a stage of rapid development after 2000, and, especially after 2010, the rate of UE increased further. The study by Gao et al. [6] suggested that Xining is an important transportation hub on the TP and an important node of the Qinghai–Tibet Highway, Qinghai–Tibet Railway and Beijing–Tibet Expressway. In a sense, transportation construction has promoted the rapid development of Xining City. Feng et al. [12] also showed that the UE of Xining City was at the expense of a large amount of cropland, and that the reduction in cropland might threaten food production [45]. At the same time, large-scale occupation of grassland can lead to degradation of habitat quality and biodiversity, and aggravate ecological and environmental risks. In addition, the Huangshui River Basin where Xining City is located has soft soil and sparse vegetation. The disorderly expansion at higher altitude areas might cause Xining City to encounter natural disasters, such as landslides and mountain torrents [46].
Effective measures are needed to curb the disorderly spread of urban land in Xining City, to reduce the occupation of cropland and ecological land by construction land, and to reduce the risk of natural disasters. First, we need to promote the development of compact cities, strictly control the scale of urban land in accordance with the per capita urban land area indicators in national and regional planning, and establish bottom-line thinking that is in accordance with the requirements of national landscape planning. Second, we should adjust the spatial patterns of urban land in accordance with the ecological function zoning and characteristics of urban land at different altitudes, and strictly maintain the three control lines of ecological protection red line, permanent primary farmland protection red line, and urban growth boundary [47]. Third, it is important to promote the development of urban agriculture, and alleviate the contradiction between food supply and demand and the imbalance between urban and rural development [48]. Finally, we should consider optimizing the transportation layout to guide the orderly development of the city, while promoting the construction of resilient cities and green cities, so that the risks of natural disasters and environmental degradation caused by UE could be reduced [49,50,51].

4.3. Future Perspectives

This research analyzed the spatiotemporal pattern of UE in Xining City in the past 50 years, and the innovations are mainly reflected in the following two aspects. First, by combining high-resolution Keyhole satellite data with CULD, a long-term analysis of nearly 50 years has been achieved. Second, the characteristics of the UE in different altitude regions were investigated, which can better reveal the regional differentiation law of UE.
Nevertheless, the current study contains some shortcomings. Firstly, the discrepancies of the spatial resolution between Keyhole satellite images (2.7 m) and CULD (30 m) used in this study may bring some uncertainties. In addition, the current study only evaluated the direct occupancy of other land use/cover types by UE. Some in-depth analyses on the deterioration of water quality, land degradation, air pollution, and degradation of habitat quality caused by changes in land use/cover types were not covered here.
In a future study, the latest high-resolution remote sensing images can be used to more accurately analyze the UE. Furthermore, we will use mathematical statistics, spatial analysis and model-based simulation methods to evaluate the comprehensive impacts of UE on the social economy and ecological environment. In addition, based on the UE simulation model, the future urban land change trend and optimization research will be performed, and the urban growth boundary will be delineated. These would provide science-based recommendations for coordinating the UE and ecological protection of the TP.

5. Conclusions

Combining high-resolution historical Keyhole satellite imagery and CULD can accurately reveal the UE of Xining City in the past 50 years. The urban land area of Xining City from 1969 to 2017 obtained by combining the above two datasets is significantly correlated with socio-economic data, and the accuracy of the spatial pattern of UE is high (>85%). The current demonstration indicates that this data combination method can offer an effective way to analyze the spatiotemporal pattern of long-term UE in other regions of China with various socioeconomic contexts.
Under the comprehensive influence of social and economic development and location factors (e.g., transportation and topography), Xining City has experienced large-scale UE in 1969–2017. The UE during this period revealed the following characteristics. First, the urban land area and per capita urban land area of the entire region showed an accelerated growth trend. The per capita urban land area exceeded the nationally prescribed 100 m2/person in 2012, and the fragmentation of the urban landscape has increased. Second, Xining City has expanded to higher altitudes, and the UE has obvious differentiation laws at different altitudes. At higher altitude areas, the urban land has expanded faster, and the leapfrog UE area was higher than that at lower altitude areas, and the degree of urban landscape fragmentation was more serious.
The rapid urbanization in Xining City has exacerbated the contradiction between food supply and demand, natural disaster risks and ecological risks, and could pose a threat to regional sustainable development. Therefore, we believe that Xining City urgently needs to promote the construction of compact cities, resilient cities and green cities, optimize the transportation network, adjust the urban layout, and encourage urban agriculture, to provide references for urban planning and promote sustainable development across the TP.

Author Contributions

X.P. drafted the manuscript. Z.L. conceived and guided this study. Y.W., C.H., H.L. and Z.C. gave important advice on methodology and provided suggestions on the revision of the manuscript. All authors have read and agreed to the published version of the manuscript.

Funding

This work was supported by the Second Tibetan Plateau Scientific Expedition and Research Program (Grant No.2019QZKK0405) and the National Natural Science Foundation of China (Grant No. 41871185 & 41971270). It was also supported by the project from the State Key Laboratory of Earth Surface Processes and Resource Ecology, China.

Institutional Review Board Statement

Not Applicable.

Informed Consent Statement

Not Applicable.

Data Availability Statement

Not Applicable.

Acknowledgments

We want to express our respect and gratitude to Yanmin Yang, Shixiong Song, Benxin Chen and Yu Nie for their help.

Conflicts of Interest

The authors declare no conflict of interest.

Appendix A

Figure A1. Segmentation results at different spatial scales. (ac) are three sub-regions listed in the top figure.
Remotesensing 13 00046 g0a1

Appendix B

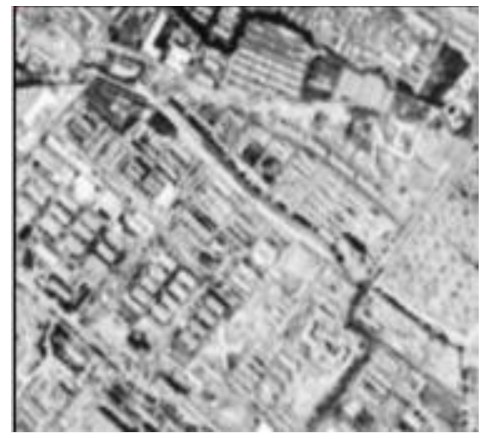
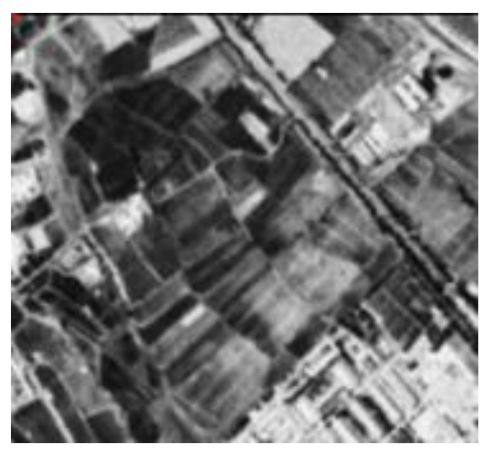
Table A1. Interpretation standards for Keyhole satellite imagery.
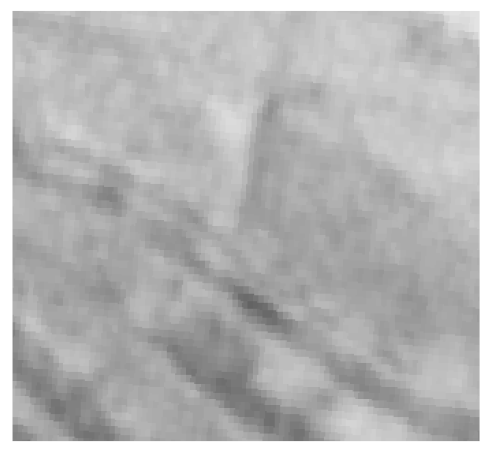
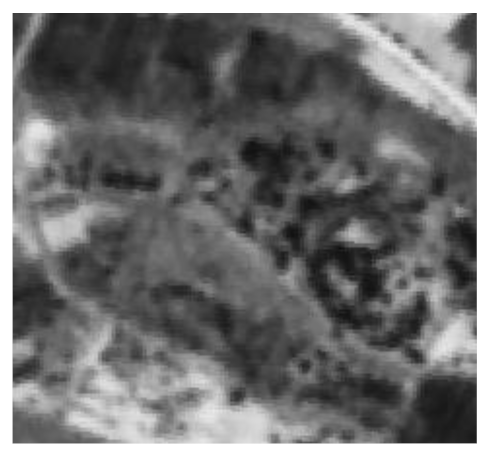
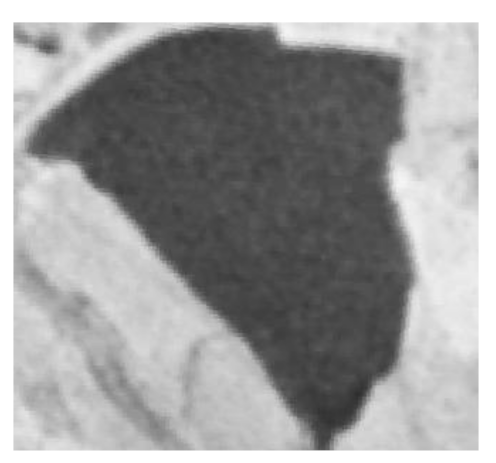
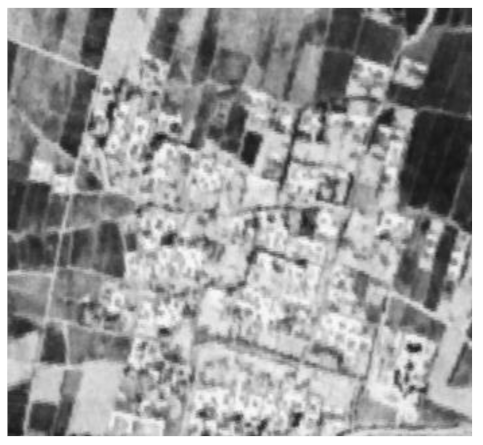
Land Use/Cover TypePanchromatic ImageColorShape and Texture Distribution
Urban land Remotesensing 13 00046 i001Light gray or whiteRectangle, uniform texture, spaced apartValleys on both sides of the river
Cropland Remotesensing 13 00046 i002Black or dark grayRectangle, uniform texture, no space between each otherFlat land around both sides of the river and rural construction land
Forest Remotesensing 13 00046 i003BlackIrregular and rough textureMountain
Grassland Remotesensing 13 00046 i004GrayIrregular shapes and uneven textureWidely distributed throughout the region
Shrubland Remotesensing 13 00046 i005Black or dark grayIrregular and rough textureAround cropland and rivers
Lake Remotesensing 13 00046 i006BlackIrregular shapes anduniform textureAround rivers
River Remotesensing 13 00046 i007Dark grayRibbon, uniform textureValley
Rural construction land Remotesensing 13 00046 i008GrayIrregular shapes and rough textureAround cropland
Bareland Remotesensing 13 00046 i009GrayIrregular shapes and rough textureAround rivers

References

  1. Mou, X.; Zhao, X.; Rao, S.; Huang, Q.; Chai, H. Changes of Ecosystem Structure in Qinghai-Tibet Plateau Ecological Barrier Area during Recent Ten Years. Acta Sci. Nat. Univ. Pekin. 2016, 52, 279–286. [Google Scholar]
  2. Bao, C.; Liu, R. Spatiotemporal Evolution of the Urban System in the Tibetan Plateau. J. Geo Inf. Sci. 2019, 21, 1330–1340. [Google Scholar]
  3. Zhang, Y.; Liu, L.; Wang, Z.; Bai, W.; Ding, M.; Wang, X.; Wang, X.; Xu, E.; Wu, X.; Zhang, B.; et al. Spatial and temporal characteristics of land use and cover changes in the Tibetan Plateau. Chin. Sci. Bull. Chin. 2019, 64, 2865–2875. [Google Scholar]
  4. Chen, T.; Lang, W.; Chan, E.; Philipp, C.H. Lhasa: Urbanising China in the frontier regions. Cities 2018, 74, 343–353. [Google Scholar] [CrossRef]
  5. Sun, S.; Ren, Y.; Zhang, Q. A Multi-scale Perspective on Water Scarcity Assessment in the Tibetan Plateau. J. Geo-Inf. Sci. 2019, 21, 1308–1317. [Google Scholar]
  6. Gao, X.; Cao, X.; Li, T.; Lv, M. Evolution of accessibility spatial pattern of the Qinghai-Tibet Plateau in 1976-2016. Acta Geogr. Sin. 2019, 74, 1190–1204. [Google Scholar]
  7. Gao, Z.; Zhang, H.; Yang, X.; Song, Z. Assessing the impacts of ecological-living-productive land changes on eco-environmental quality in Xining City on Qinghai-Tibet Plateau, China. Sci. Cold Arid Reg. 2019, 11, 194–207. [Google Scholar]
  8. Qinghai Provincial Bureau of Statistics & Qinghai Survey Team of the National Bureau of Statistics. Qinghai Statistical Yearbook; China Statistics Press: Beijing, China, 2018. [Google Scholar]
  9. Gong, P.; Li, X.; Zhang, W. 40-Year (1978–2017) human settlement changes in China reflected by impervious surfaces from satellite remote sensing. Sci. Bull. 2019, 64, 756–763. [Google Scholar] [CrossRef] [Green Version]
  10. Fu, Y.; Xiao, J.; Xiao, R.; Sa, W.; Li, X. Analysis and simulation prediction on LUCC of Xining city based on RS and GIS. Trans. Chin. Soc. Agric. Eng. 2009, 25, 211. [Google Scholar]
  11. Meng, X.Q.; Chen, Y.J. The Analysis and Evaluation of Land Cover Change in Xining City Based on CA-Markov Model. In Sustainable Development of Urban Infrastructure, Pts 1–3; Meng, X.Q., Chen, Y.J., Eds.; Trans Tech Publications Ltd: Stafa-Zurich, Switzerland, 2013; Volume 253–255, pp. 207–210. [Google Scholar]
  12. Feng, S.; Gao, X.; Kang, J.; Wu, G.; Zou, C.; Yang, J. Research on Land Use/cover Change and Urban Expansion in Xining City in Recent 30 Years. Arid Zone Res. 2012, 29, 129–136. [Google Scholar]
  13. Leachtenauer, J.; Daniel, K.; Vogl, T. Digitizing satellite imagery: Quality and cost considerations. Photogramm. Eng. Remote Sens. 1998, 64, 29–34. [Google Scholar]
  14. McDonald, R.A. Opening the Cold-war Sky to the Public:Declassifying Satellite Reconnaissance Imagery. Photogramm. Eng. Remote Sens. 1995, 61, 385–390. [Google Scholar]
  15. Brinkmann, K.; Schumacher, J.; Dittrich, A.; Kadaore, I.; Buerkert, A. Analysis of landscape transformation processes in and around four West African cities over the last 50 years. Landsc. Urban. Plan. 2012, 105, 94–105. [Google Scholar] [CrossRef]
  16. Hepcan, S.; Hepcan, C.C.; Kilicaslan, C.; Ozkan, M.B.; Kocan, N. Analyzing Landscape Change and Urban Sprawl in a Mediterranean Coastal Landscape: A Case Study from Izmir, Turkey. J. Coast. Res. 2013, 29, 301–310. [Google Scholar]
  17. Saleem, A.; Corner, R.; Awange, J. On the possibility of using CORONA and Landsat data for evaluating and mapping long-term LULC: Case study of Iraqi Kurdistan. Appl. Geogr. 2018, 90, 145–154. [Google Scholar] [CrossRef]
  18. Rendenieks, Z.; Nita, M.D.; Nikodemus, O.; Radeloff, V.C. Half a century of forest cover change along the Latvian-Russian border captured by object-based image analysis of Corona and Landsat TM/OLI data. Remote Sens. Environ. 2020, 249, 112010. [Google Scholar] [CrossRef]
  19. Jia, W.; Gao, X. Analysis of Urban Heat Island Environment in a Valley City for Policy Formulation: A Case Study of Xining City in Qinghai Province of China. J. Geo-Inf. Sci. 2014, 16, 592–601. [Google Scholar]
  20. Liu, Z.; Ding, M.; He, C.; Li, J.; Wu, J. The impairment of environmental sustainability due to rapid urbanization in the dryland region of northern China. Landsc. Urban Plan. 2019, 187, 165–180. [Google Scholar] [CrossRef]
  21. Gao, Y.; Xie, M.; Fu, M.; Cao, Y. Pattern dynamics of vegetation coverage of Plateau Valley-City in the Western China: A case study in Xining. Acta Ecol. Sin. 2014, 34, 1094–1104. [Google Scholar]
  22. Gong, P.; Liu, H.; Zhang, M.; Li, C.; Wang, J.; Huang, H.; Clinton, N.; Ji, L.; Li, W.; Bai, Y.; et al. Stable classification with limited sample: Transferring a 30-m resolution sample set collected in 2015 to mapping 10-m resolution global land cover in 2017. Sci. Bull. 2019, 64, 370–373. [Google Scholar] [CrossRef] [Green Version]
  23. Xining City Bureau of Statistics & Xining Survey Team of the National Bureau of Statistics; Xining Statistical Yearbook; China Statistics Press: Beijing, China, 1998.
  24. Shruthi, R.B.V.; Kerle, N.; Jetten, V.; Stein, A. Object-based gully system prediction from medium resolution imagery using Random Forests. Geomorphology 2014, 216, 283–294. [Google Scholar] [CrossRef]
  25. Dronova, I. Object-Based Image Analysis in Wetland Research: A Review. Remote Sens. 2015, 7, 6380–6413. [Google Scholar] [CrossRef] [Green Version]
  26. Zhao, Y. Principles and Methods of Remote Sensing Application Analysis; Science Press: Beijing, China, 2013. [Google Scholar]
  27. He, C.; Liu, Z.; Tian, J.; Ma, Q. Urban expansion dynamics and natural habitat loss in China: A multi-scale landscape perspective. Glob. Change Biol. 2014, 20, 2886–2902. [Google Scholar] [CrossRef] [PubMed]
  28. Liu, Z.; He, C.; Wu, J. General Spatiotemporal Patterns of Urbanization: An Examination of 16 World Cities. Sustainability 2016, 8, 41. [Google Scholar] [CrossRef] [Green Version]
  29. Mcgarigal, K.S.; Cushman, S.; Neel, M.; Ene, E. Fragstats: Spatial Pattern Analysis Program for Categorical Maps, 3.1st ed.; University of Massachusetts: Amherst, MA, USA, 2002. [Google Scholar]
  30. Liu, X.; Li, X.; Chen, Y.; Tan, Z.; Li, S.; Ai, B. A new landscape index for quantifying urban expansion using multi-temporal remotely sensed data. Landsc. Ecol. 2010, 25, 671–682. [Google Scholar] [CrossRef]
  31. Liao, S.; Sun, J. Quantitative analysis of relationship between population distribuiton and environmental factors in qinghai-tibet plateau. China Popul. Resour. Environ. 2003, 13, 62–67. [Google Scholar]
  32. Zhao, T.; Song, B.; Chen, Y.; Yan, H.; Xu, Z. Analysis of Population Distribution and Its Spatial Relationship with Terrain Elements in the Yarlung Zangbo River, Nyangqu River and Lhasa River Region, Tibet. J. Geo-Inf. Sci. 2017, 19, 225–237. [Google Scholar]
  33. Huang, Q.; He, C.; Shi, P.; Zhao, Y.; Yang, Y.; Liu, H. Understanding Multi- Scale Urban Expansion Driving Forces: In the Case Study of Beijing. Econ. Geogr. 2009, 29, 714–721. [Google Scholar]
  34. Kamusoko, C.; Gamba, J. Simulating Urban Growth Using a Random Forest-Cellular Automata (RF-CA) Model. ISPRS Int. Geo-Inf. 2015, 4, 447–470. [Google Scholar] [CrossRef]
  35. Zhang, D.; Liu, X.; Wu, X.; Yao, Y.; Wu, X.; Chen, Y. Multiple intra-urban land use simulations and driving factors analysis: A case study in Huicheng, China. GISci. Remote Sens. 2019, 56, 282–308. [Google Scholar] [CrossRef]
  36. Lambin, E.F.; Turner, B.L.; Geist, H.J.; Agbola, S.B.; Angelsen, A.; Bruce, J.W.; Coomes, O.T.; Dirzo, R.; Fischer, G.; Folke, C.; et al. The causes of land-use and land-cover change: Moving beyond the myths. Glob. Environ. Chang. Hum. Policy Dimens. 2001, 11, 261–269. [Google Scholar] [CrossRef]
  37. Zhu, H.; Li, X. Discussion on the Index Method of Regional Land Use Change. Acta Geogr. Sin. 2003, 58, 643–650. [Google Scholar]
  38. Liu, R.; Zhu, D. Methods for Detecting Land Use Changes Based on the Land Use Transition Matrix. Resour. Sci. 2010, 32, 1544–1550. [Google Scholar]
  39. Chen, J.; Zhang, H. Remote Sensing Image Analysis at Image Object Level; Science Press: Beijing, China, 2016. [Google Scholar]
  40. Liu, Z.; He, C.; Zhang, Q.; Huang, Q.; Yang, Y. Extracting the dynamics of urban expansion in China using DMSP-OLS nighttime light data from 1992 to 2008. Landsc. Urban Plan. 2012, 106, 62–72. [Google Scholar] [CrossRef]
  41. Li, Y.; Pan, Y.; Zhu, X.; Li, Y.; Gu, J. Comparison analysis on land cover area estimators: Confusion matrix calibration and regression. Trans. Chin. Soc. Agric. Eng. 2013, 29, 115. [Google Scholar]
  42. Yao, Y.; Li, J.; Zhang, X.; Duan, P.; Li, S.; Xu, Q. Investigation on the Expansion of Urban Construction Land Use Based on the CART-CA Model. ISPRS Int. Geo-Inf. 2017, 6, 149. [Google Scholar] [CrossRef]
  43. State Council. National New-Type Urbanization Plan: 2014–2020; People’s Publishing House: Beijing, China, 2014. [Google Scholar]
  44. Zhang, Z.; Zhao, X.; Liu, F.; Xu, J.; Wen, Q.; Hu, S. An Atlas of Remote Sensing Monitoring of Urban. Expansion in China; Planet Map Press: Beijing, China, 2014. [Google Scholar]
  45. Huang, Q.; Liu, Z.; He, C.; Gou, S.; Bai, Y.; Wang, Y.; Shen, M. The occupation of cropland by global urban expansion from 1992 to 2016 and its implications. Environ. Res. Lett. 2020. [Google Scholar]
  46. Liu, F.; Zhang, H.; Chen, Q.; Zhang, Y.; Zhou, Q.; Li, C.; Cao, S. The Characteristics of Natural Hazard Regional Combination Law along the Q inghai-Tibet Railway. Sci. Geogr. Sin. 2010, 30, 384–390. [Google Scholar]
  47. Liu, Y.; Zhang, Y.; Zhang, Y.; Liu, Y.; Wang, H.; Liu, Y. Conflicts between three land management red lines in Wuhan City: Spatial patterns and driving factors. Prog. Geogr. 2018, 37, 1672–1681. [Google Scholar]
  48. Barthel, S.; Isendahl, C. Urban gardens, agriculture, and water management: Sources of resilience for long-term food security in cities. Ecol. Econ. 2013, 86, 224–234. [Google Scholar] [CrossRef]
  49. Anderies, J.M.; Folke, C.; Walker, B.; Ostrom, E. Aligning Key Concepts for Global Change Policy: Robustness, Resilience, and Sustainability. Ecol. Soc. 2013, 18, 16. [Google Scholar] [CrossRef] [Green Version]
  50. Amirgholy, M.; Shahabi, M.; Gao, H.O. Optimal design of sustainable transit systems in congested urban networks: A macroscopic approach. Transp. Res. Pt. E-Logist. Transp. Rev. 2017, 103, 261–285. [Google Scholar] [CrossRef]
  51. Brilhante, O.; Klaas, J. Green City Concept and a Method to Measure Green City Performance over Time Applied to Fifty Cities Globally: Influence of GDP, Population Size and Energy Efficiency. Sustainability 2018, 10, 23. [Google Scholar] [CrossRef] [Green Version]
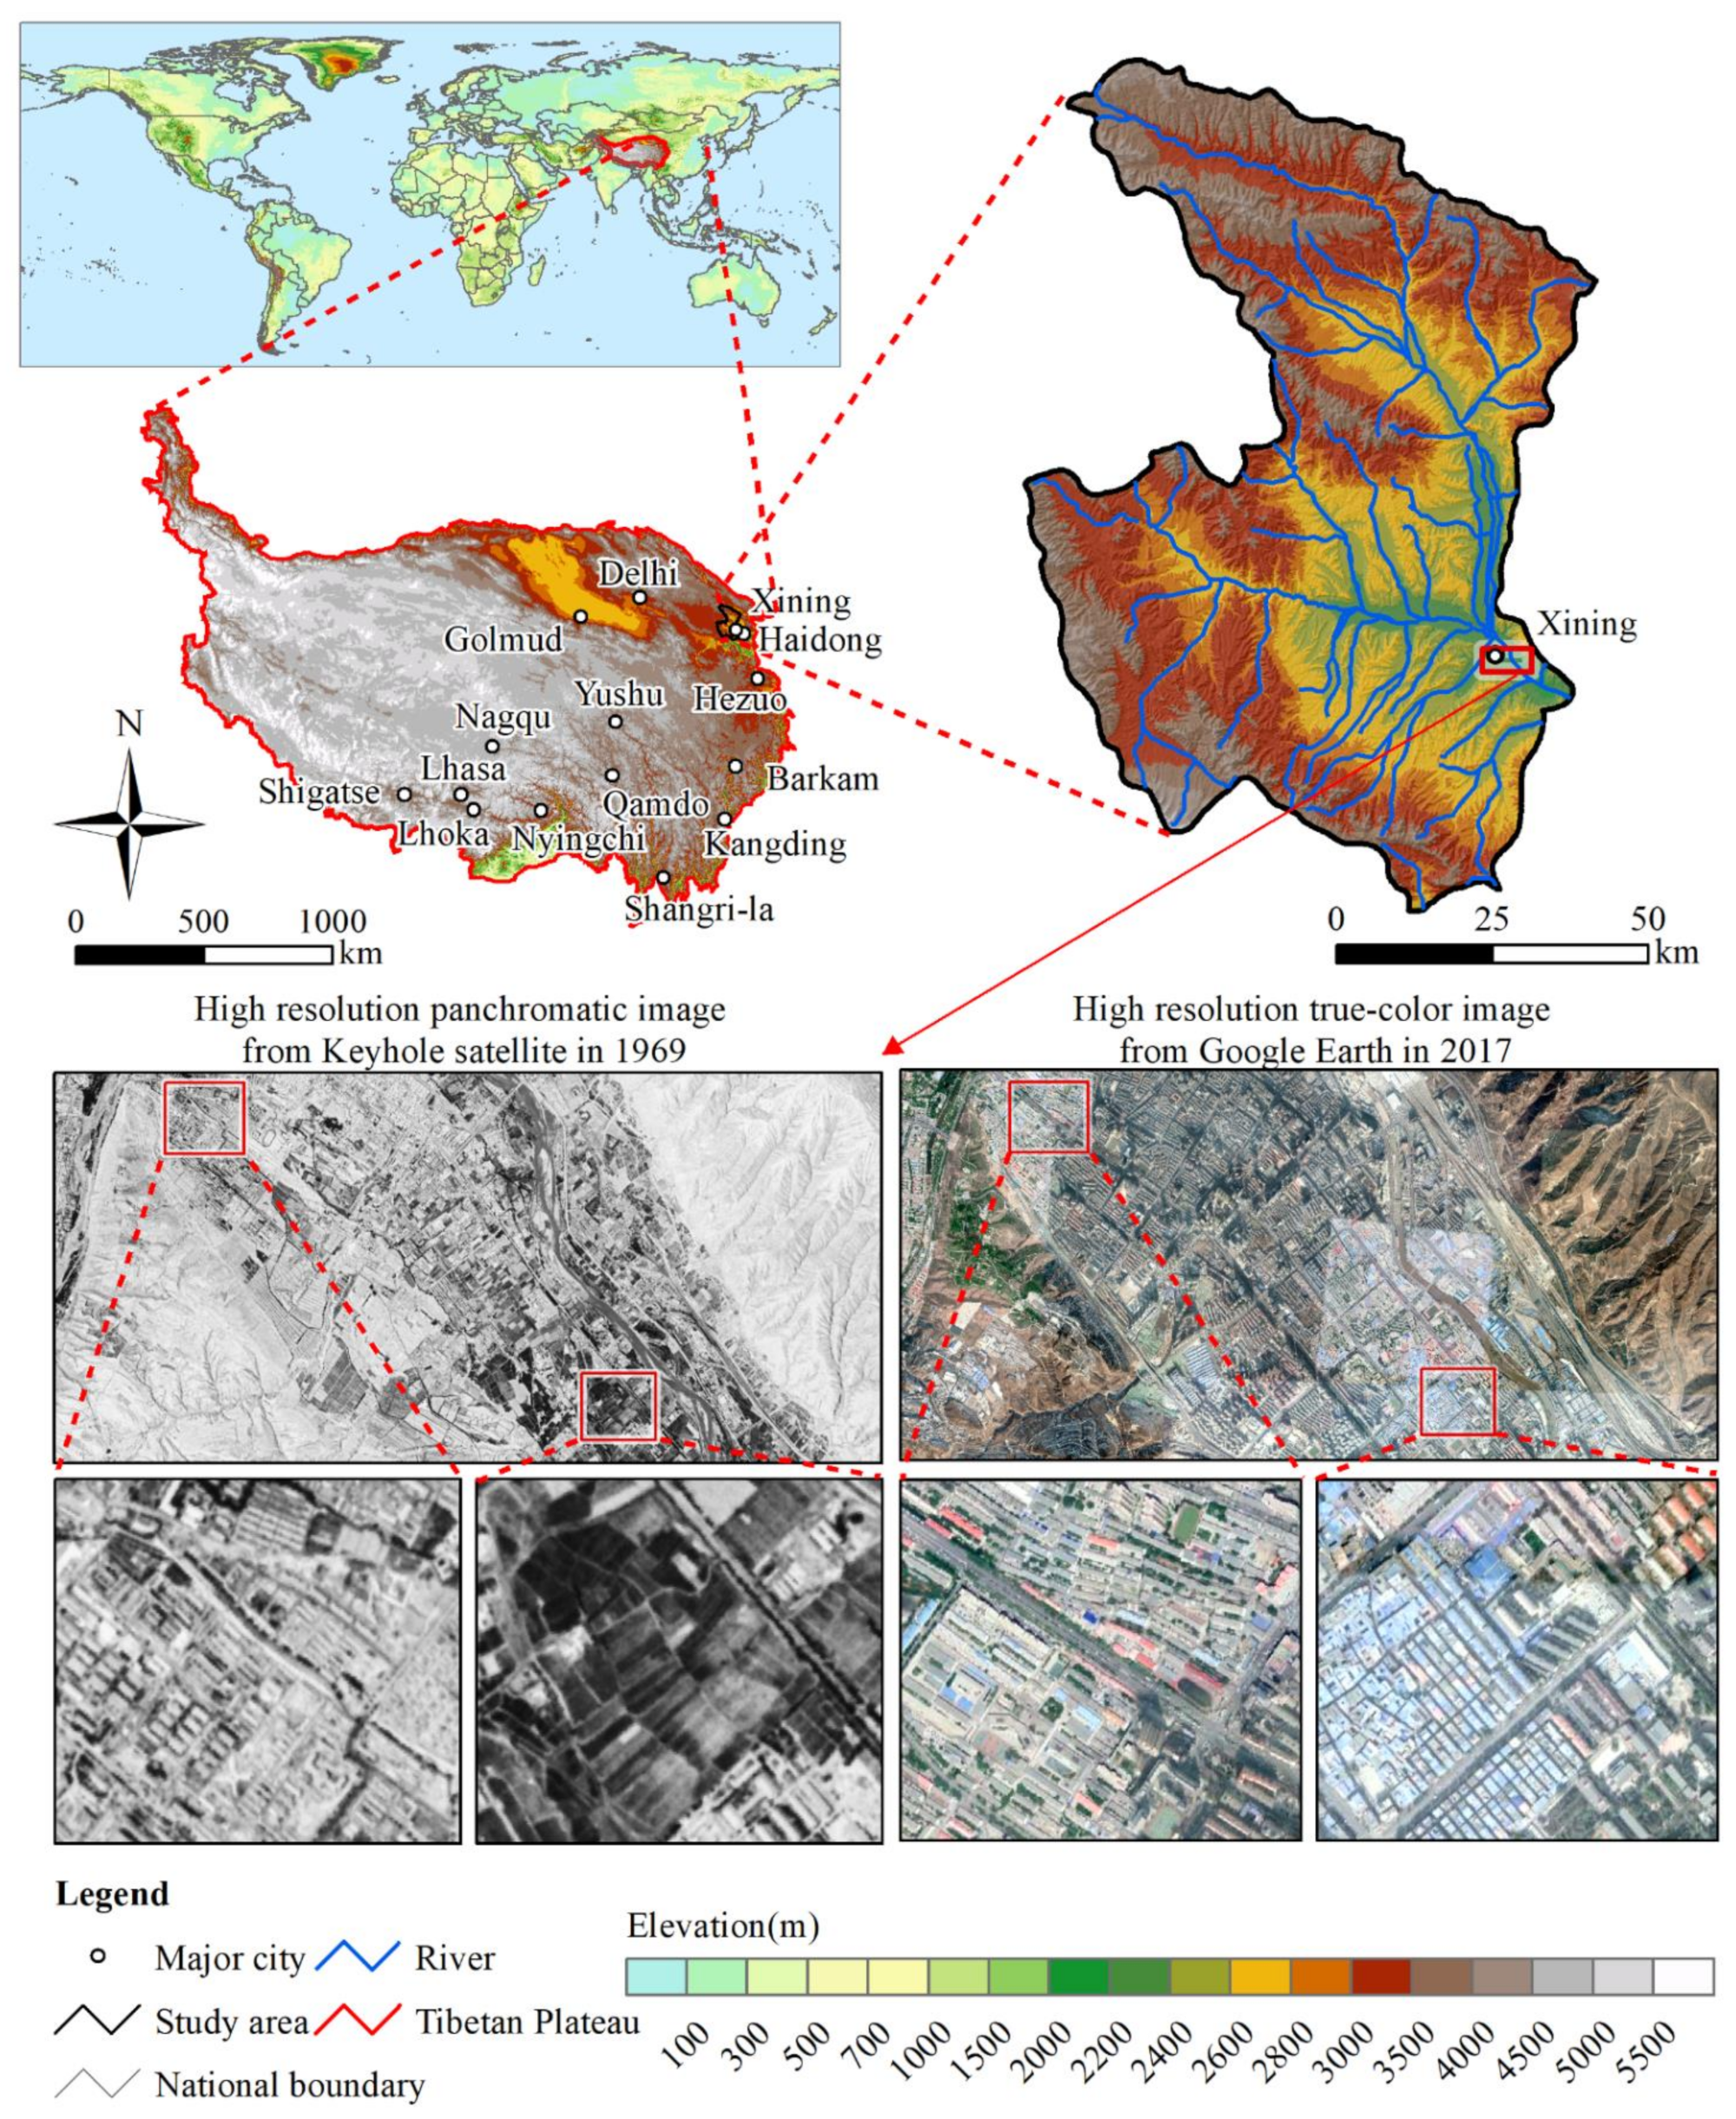
Figure 1. Study area.
Remotesensing 13 00046 g001
Figure 2. Flow chart.
Remotesensing 13 00046 g002
Figure 3. Urban expansion in Xining City. (a) spatial patterns of urban land; (b) changes in urban land area; (c) changes in patch density of urban land; (d) changes in the landscape shape index of urban land; (e) changes in the mean patch size of urban land; (f) changes in the mean altitude of the newly-added urban land; and (g) the urban expansion model.
Remotesensing 13 00046 g003
Figure 4. The characteristics of urban expansion at different altitudes. (a) urban expansion area; (b) changes in the proportion of urban land area; (c) changes in the urban landscape shape index; (d) changes in the average patch area of urban land; and (e) changes in the patch density of urban land.
Remotesensing 13 00046 g004
Figure 5. Urban expansion model at different altitudes. (a) 2100–2200 m; (b) 2200–2300 m; (c) 2300–2400 m; (d) 2400–2500 m; (e) 2500–2600 m; (f) 2600–2700 m; and (g) 2700–2800 m.
Remotesensing 13 00046 g005
Figure 6. Influencing factors of urban expansion in Xining City. (a) relevant policies and socio-economic factors; (b) the importance of location factors for urban expansion in different time periods.
Remotesensing 13 00046 g006
Figure 7. Different land use/cover types occupied during the urban expansion of Xining City. (a) in the entire region from 1969 to 2017; (b) in the entire region in different periods; (c) at different altitudes from 1969 to 2017; (d) under different urban expansion modes from 1969 to 2017.
Remotesensing 13 00046 g007
Figure 8. Accuracy assessment based on socio-economic data of Xining City. (a) the relationship between urban population and urban land area; and (b) the relationship between GDP and urban land area.
Remotesensing 13 00046 g008
Figure 9. Accuracy assessment based on high-resolution remote sensing data.
Remotesensing 13 00046 g009
Figure 10. The accelerated urban expansion to higher altitude areas in Xining City from 1969 to 2017.
Remotesensing 13 00046 g010
Table 1. The urban expansion area in Xining from 1969 to 2017.
Period (Year)Urban Expansion AreaUrban Expansion Model
Area
(km2)
Proportion in the Whole Period (%)Mean Annual Growth Rate (%)LeapfrogEdge-ExpansionInfilling
Area
(km2)
Percentage (%)Area
(km2)
Percentage (%)Area
(km2)
Percentage (%)
1969–197822.9310.868.9110.5245.8711.1848.741.245.39
1978–199024.3911.553.834.5518.6711.1945.868.6535.46
1990–200019.859.402.622.9815.039.2446.557.6338.42
2000–201041.8119.794.007.8118.6926.6463.727.3517.59
2010–2017102.2748.418.7119.8319.3959.8358.5122.6022.10
1969–2017211.25100.005.2545.7121.64118.0855.8947.4722.47
Table 2. The urban expansion area by altitude in Xining City from 1969 to 2017.
Elevation (m)Urban Expansion AreaUrban Expansion Model
Area
(km2)
Proportion in the Entire Region (%)Mean Annual Growth Rate (%)LeapfrogEdge-ExpansionInfilling
Area
(km2)
Percentage (%)Area
(km2)
Percentage (%)Area
(km2)
Percentage (%)
2100–220010.565.005.311.1010.445.5652.713.8936.85
2200–230066.5731.513.397.8511.7934.5051.8224.2236.39
2300–240060.5828.678.0614.5524.0236.6660.519.3715.46
2400–250034.9416.5412.489.7227.8120.3458.214.8913.99
2500–260016.617.868.766.5539.448.7352.581.327.98
2600–270018.618.817.984.4623.9410.6457.163.5218.89
2700–28002.591.2311.821.1644.611.1845.610.259.78
Entire region211.25100.005.2545.7121.64118.0855.8947.4722.47
Table 3. Correlation between urban land area and socio-economic driving factors.
Economics (X1)
X11X12X13X14X15X16
0.969 *** 0.977 *** 0.983 *** 0.915 *** 0.955 *** 0.973 ***
Population (X2)
X21X22X23
0.975 *** 0.985 *** 0.966 ***
Fixed asset investment (X3)
X31X32X33
0.892 *** 0.823 *** 0.894 ***
People’s living standards (X4)
X41X42X43X44X45X46
0.977 *** 0.944 *** 0.978 *** 0.956 *** 0.964 *** 0.993 ***
Note: ***indicates significant correlation at the 0.001 level. Bold font indicates the largest correlation coefficient in one category. X11 represents the gross domestic product (GDP), X12 represents the GDP of secondary industry, X13 represents the GDP of industry, X14 represents the GDP of construction industry, X15 represents the GDP of tertiary industry, X16 represents the per capita GDP, X21 represents total population, X22 represents urban population, X23 represents registered urban population, X31 represents fixed asset investment, X32 represents urban fixed asset investment, X33 represents real estate development investment, X41 represents total urban household income, X42 represents per capita disposable income of urban households, X43 represents per capita consumption level of urban residents, X44 represents the per capita residential area in the urban area, X45 represents saving deposits, and X46 represents saving deposits of urban residents.
Table 4. The importance of location influence factors of urban expansion of Xining City in different time periods.
Location Factor1969–19781978–19901990–20002000–20102010–20171969–2017
TopographyAspect0.991.321.541.051.311.10
Slope7.316.176.8210.517.787.58
Elevation33.7130.4231.5425.8126.3126.27
Sum42.0137.9139.9137.3735.4034.94
TransportationDistance to national road15.0613.4712.885.837.097.82
Distance to railway18.6920.8217.8314.4613.4712.73
Distance to highway0.000.000.0017.5418.4521.00
Sum33.7634.3030.7137.8339.0141.55
Distance to city center18.8422.8322.9118.2518.9118.38
Distance to river5.394.966.476.556.695.13
Publisher’s Note: MDPI stays neutral with regard to jurisdictional claims in published maps and institutional affiliations.