Damage Assessment of Rice Crop after Toluene Exposure Based on the Vegetation Index (VI) and UAV Multispectral Imagery
Abstract
1. Introduction
2. Materials and Methods
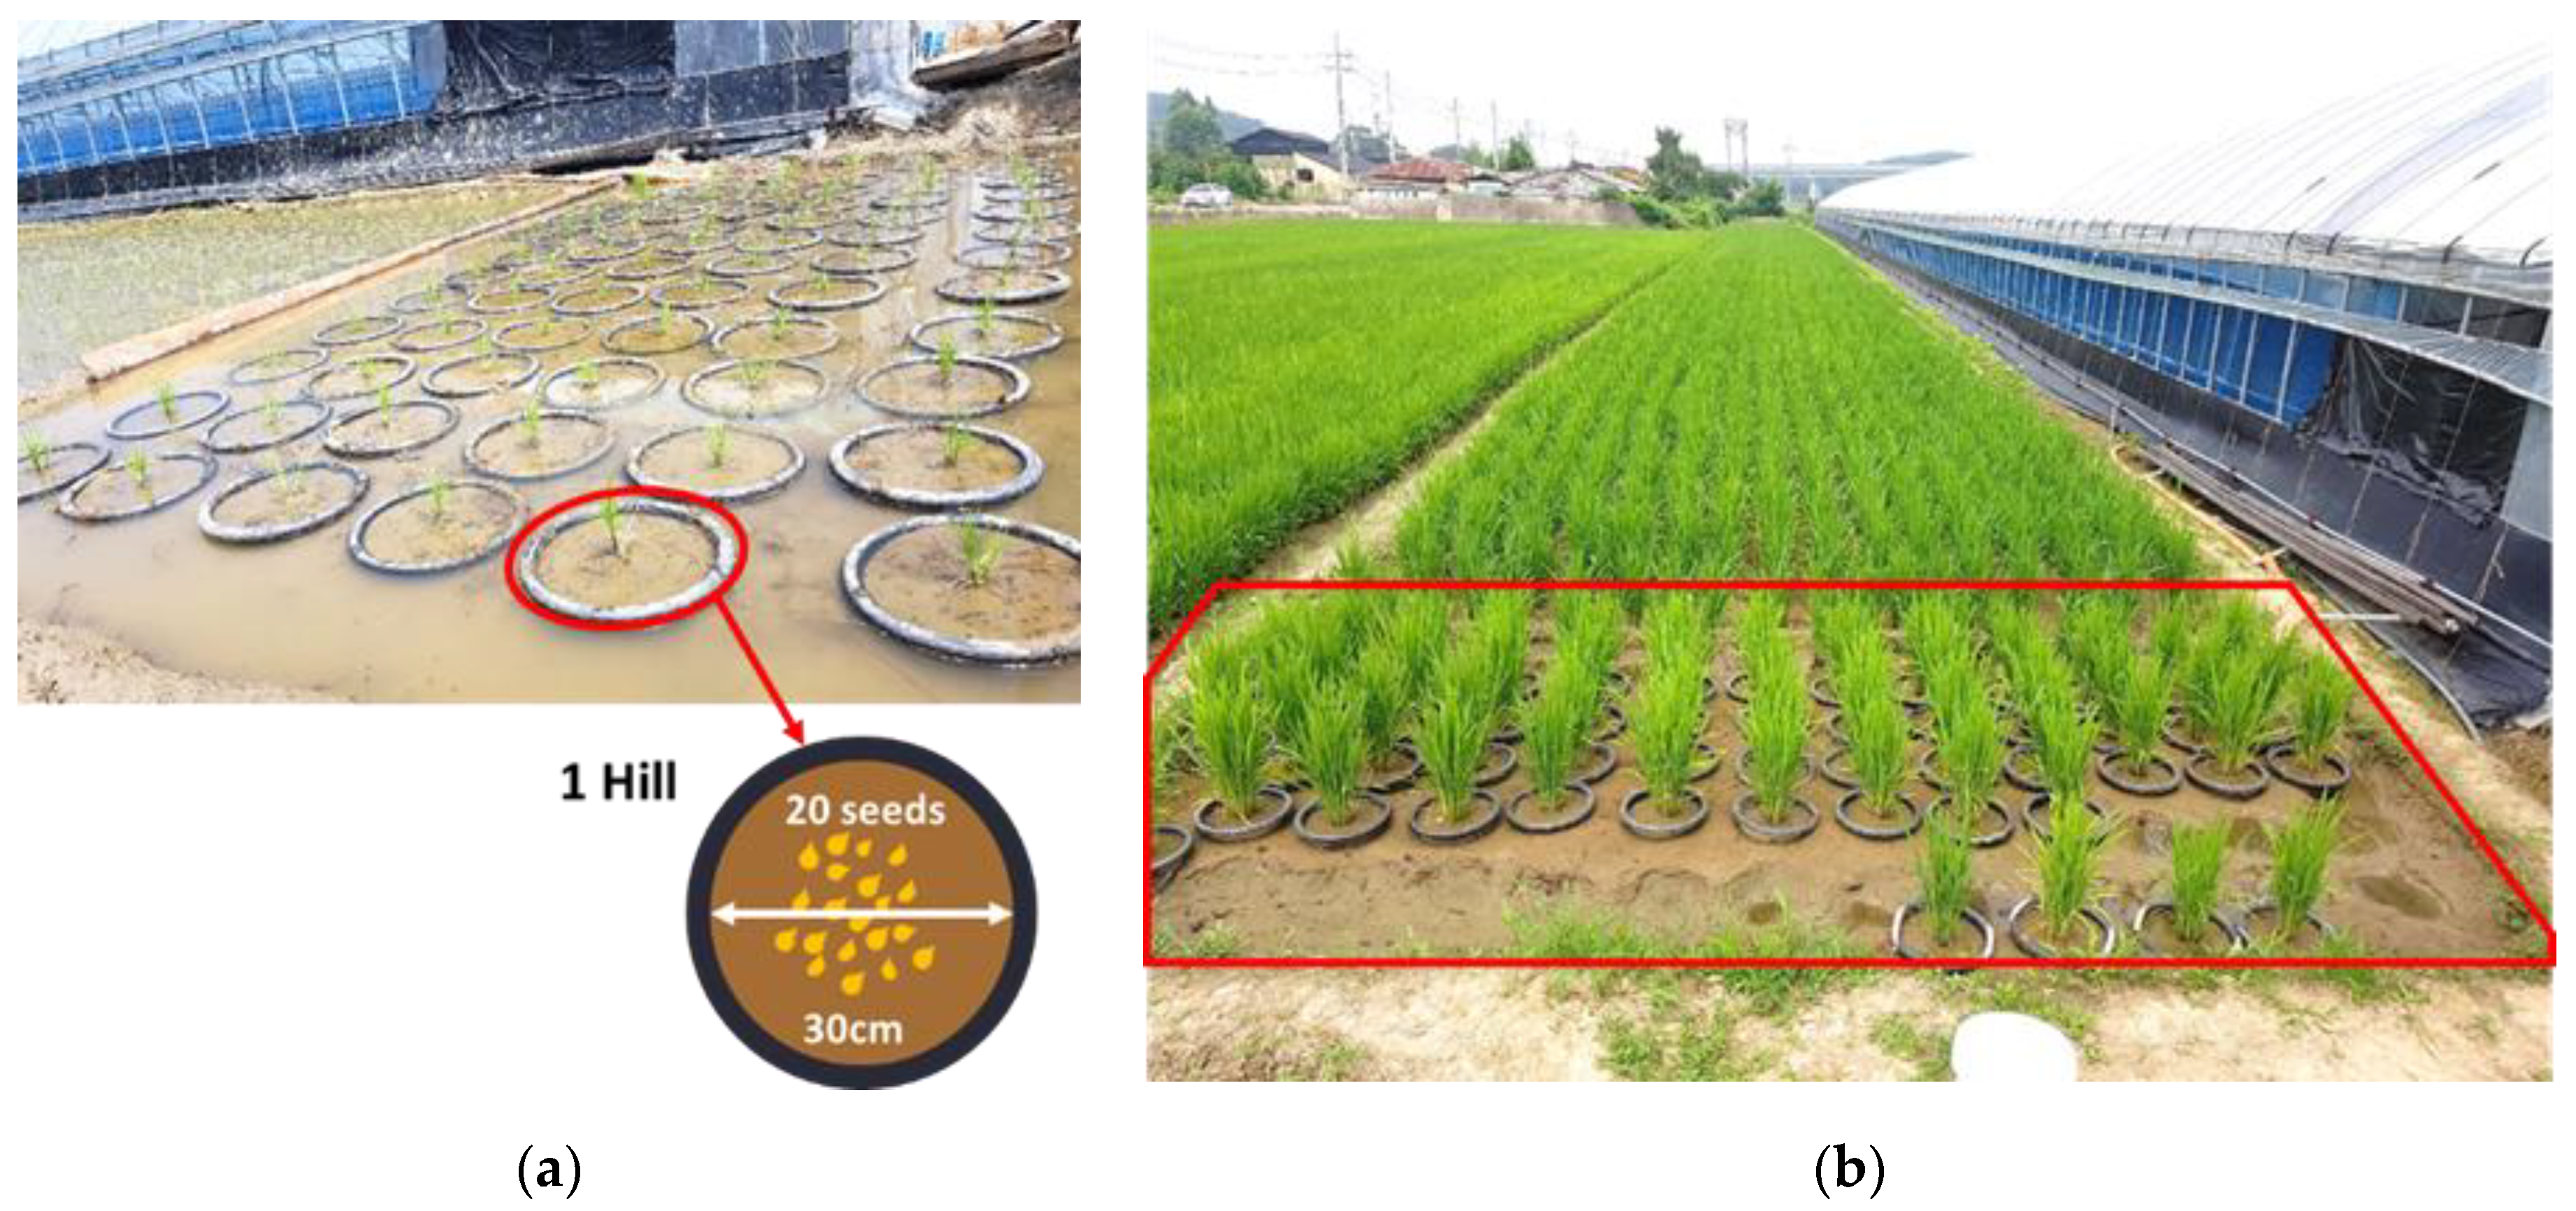
2.1. Study Site and Field Plot Description
2.2. Experimental Design
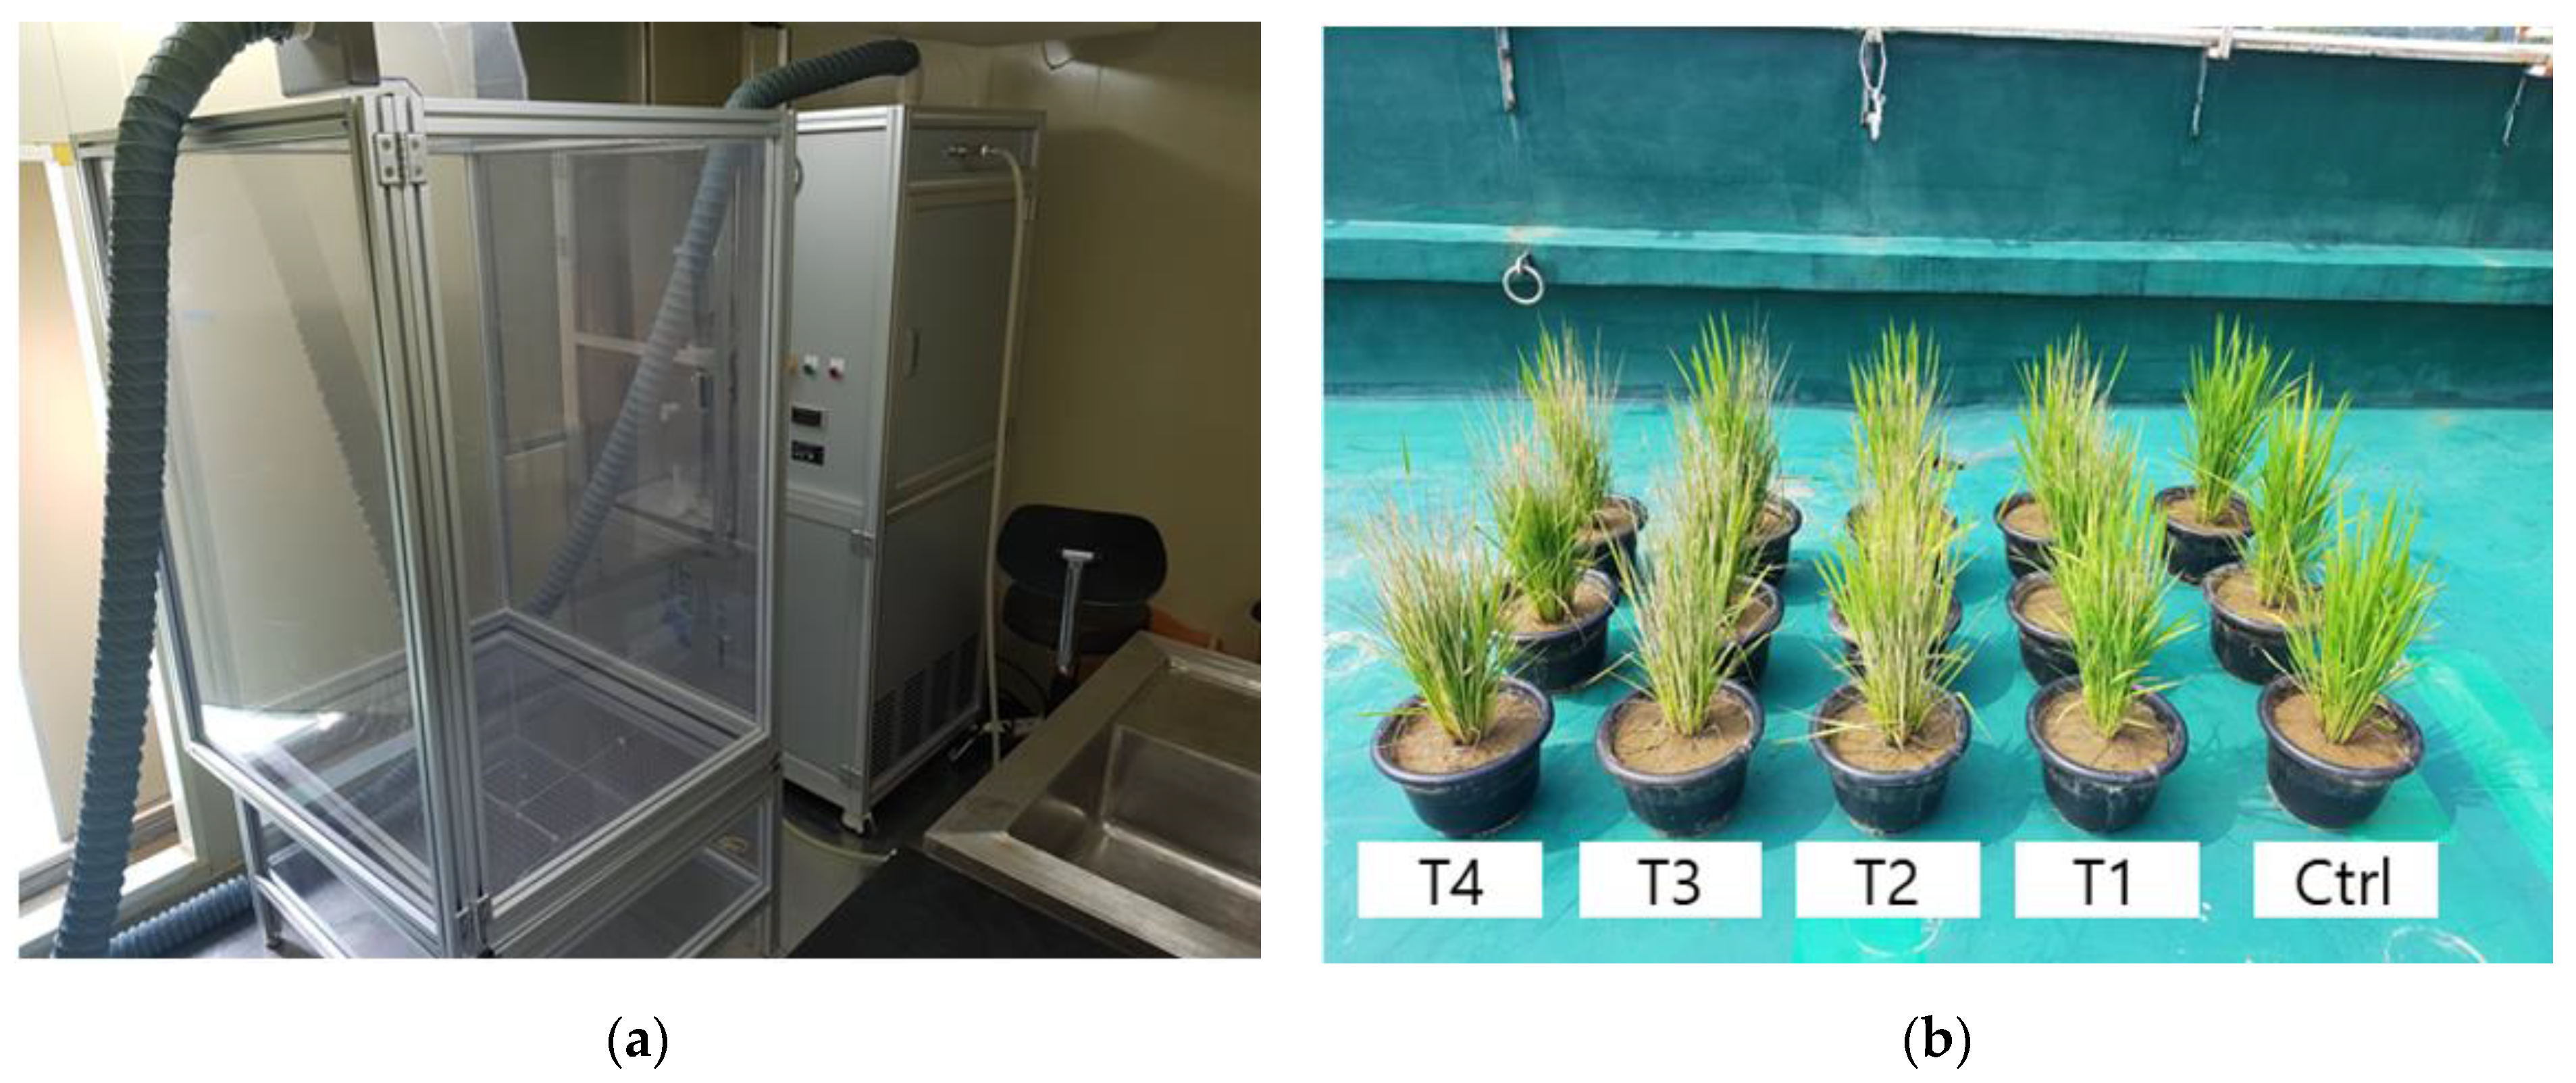
2.2.1. Toluene Exposure Simulation
2.2.2. Damage and Recovery Assessment after Toluene Exposure
2.3. UAV Multispectral Imagery Acquisition and Processing
2.3.1. Instrument Setup and Flight Mission
2.3.2. Image Processing and Analysis
2.4. Physiological Characteristic Data Collection
2.4.1. Leaf Chlorophyll Contents
2.4.2. Grain Yield and Yield Components
2.5. Data Analysis
3. Results
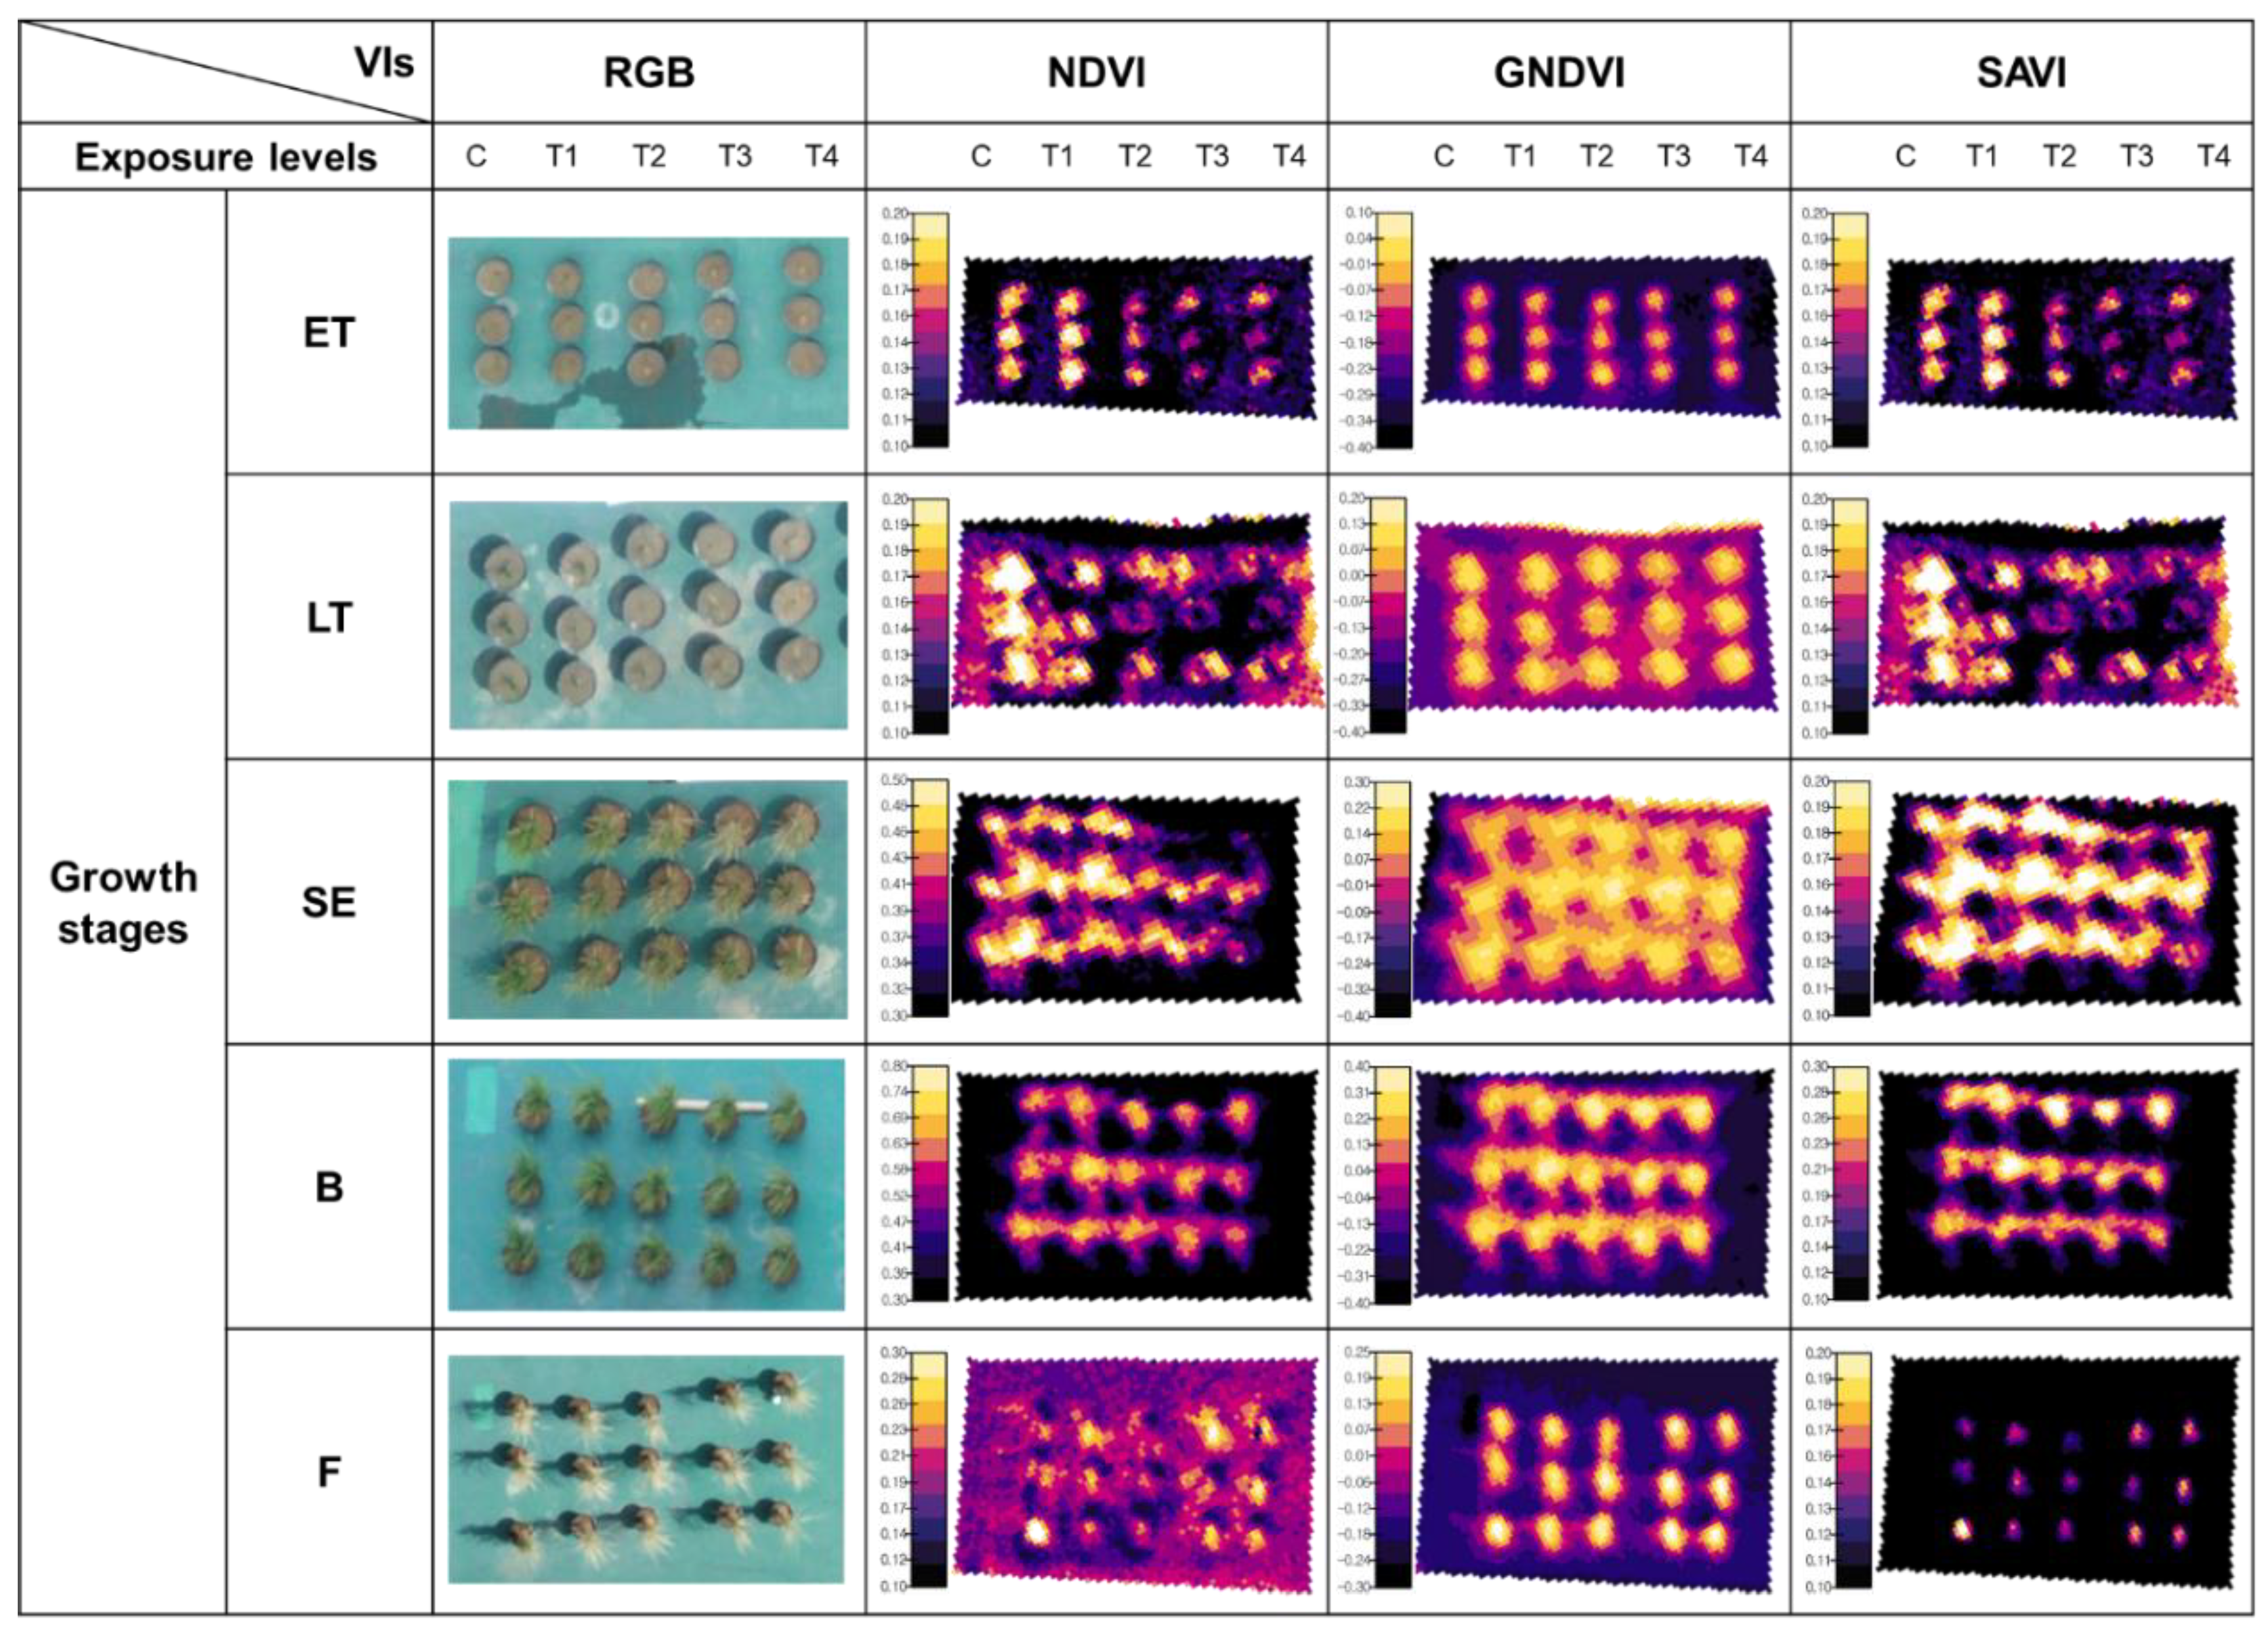
3.1. The Availability of UAV Multispectral Imagery to Crop Monitoring
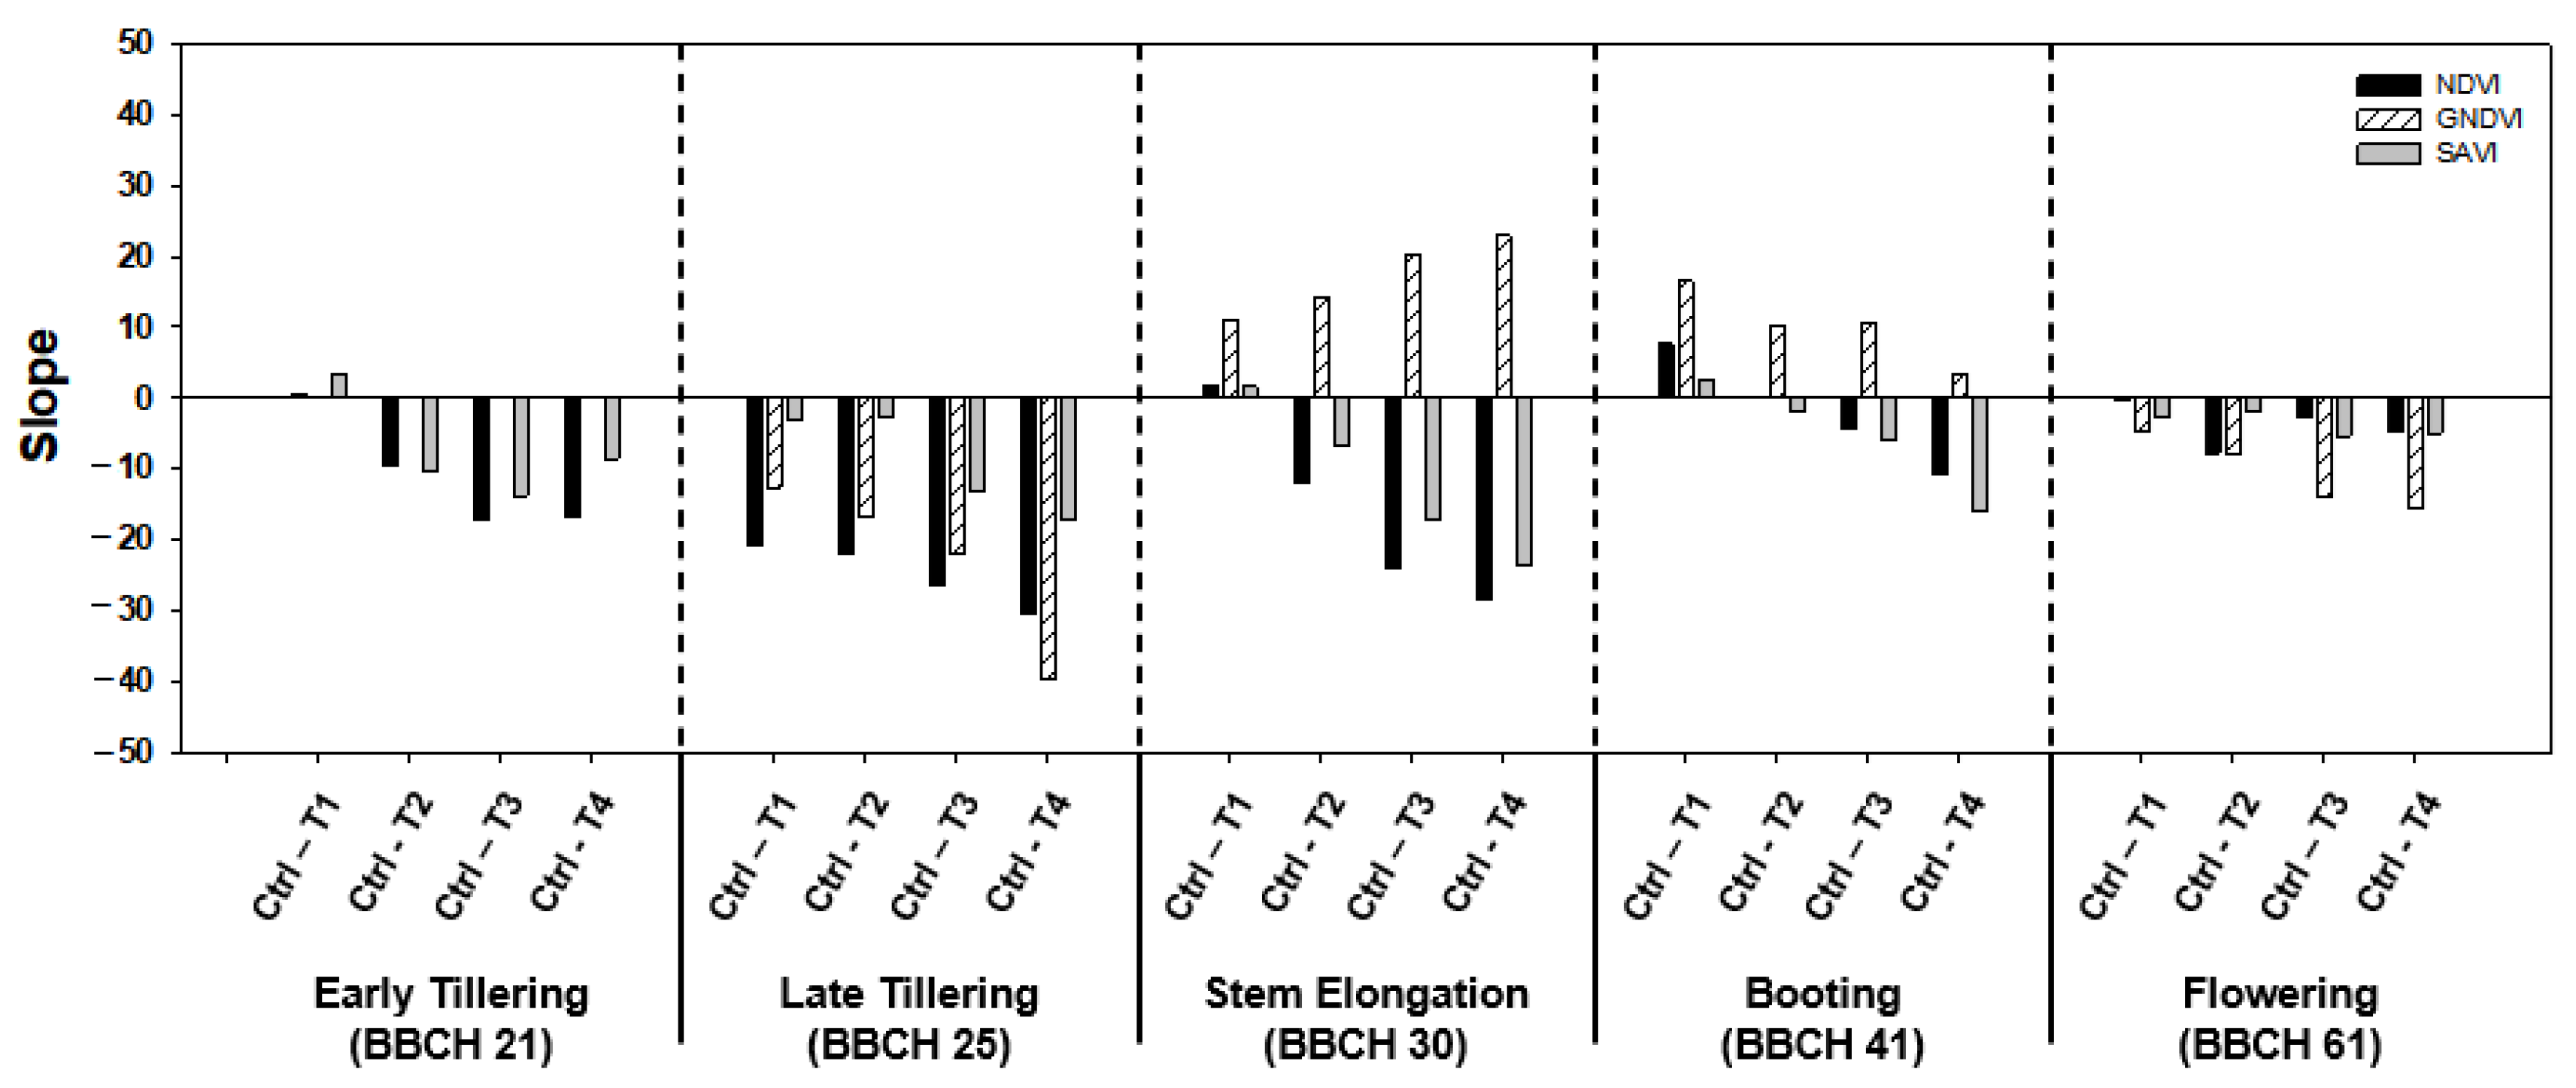
3.2. Sensitivity Analysis
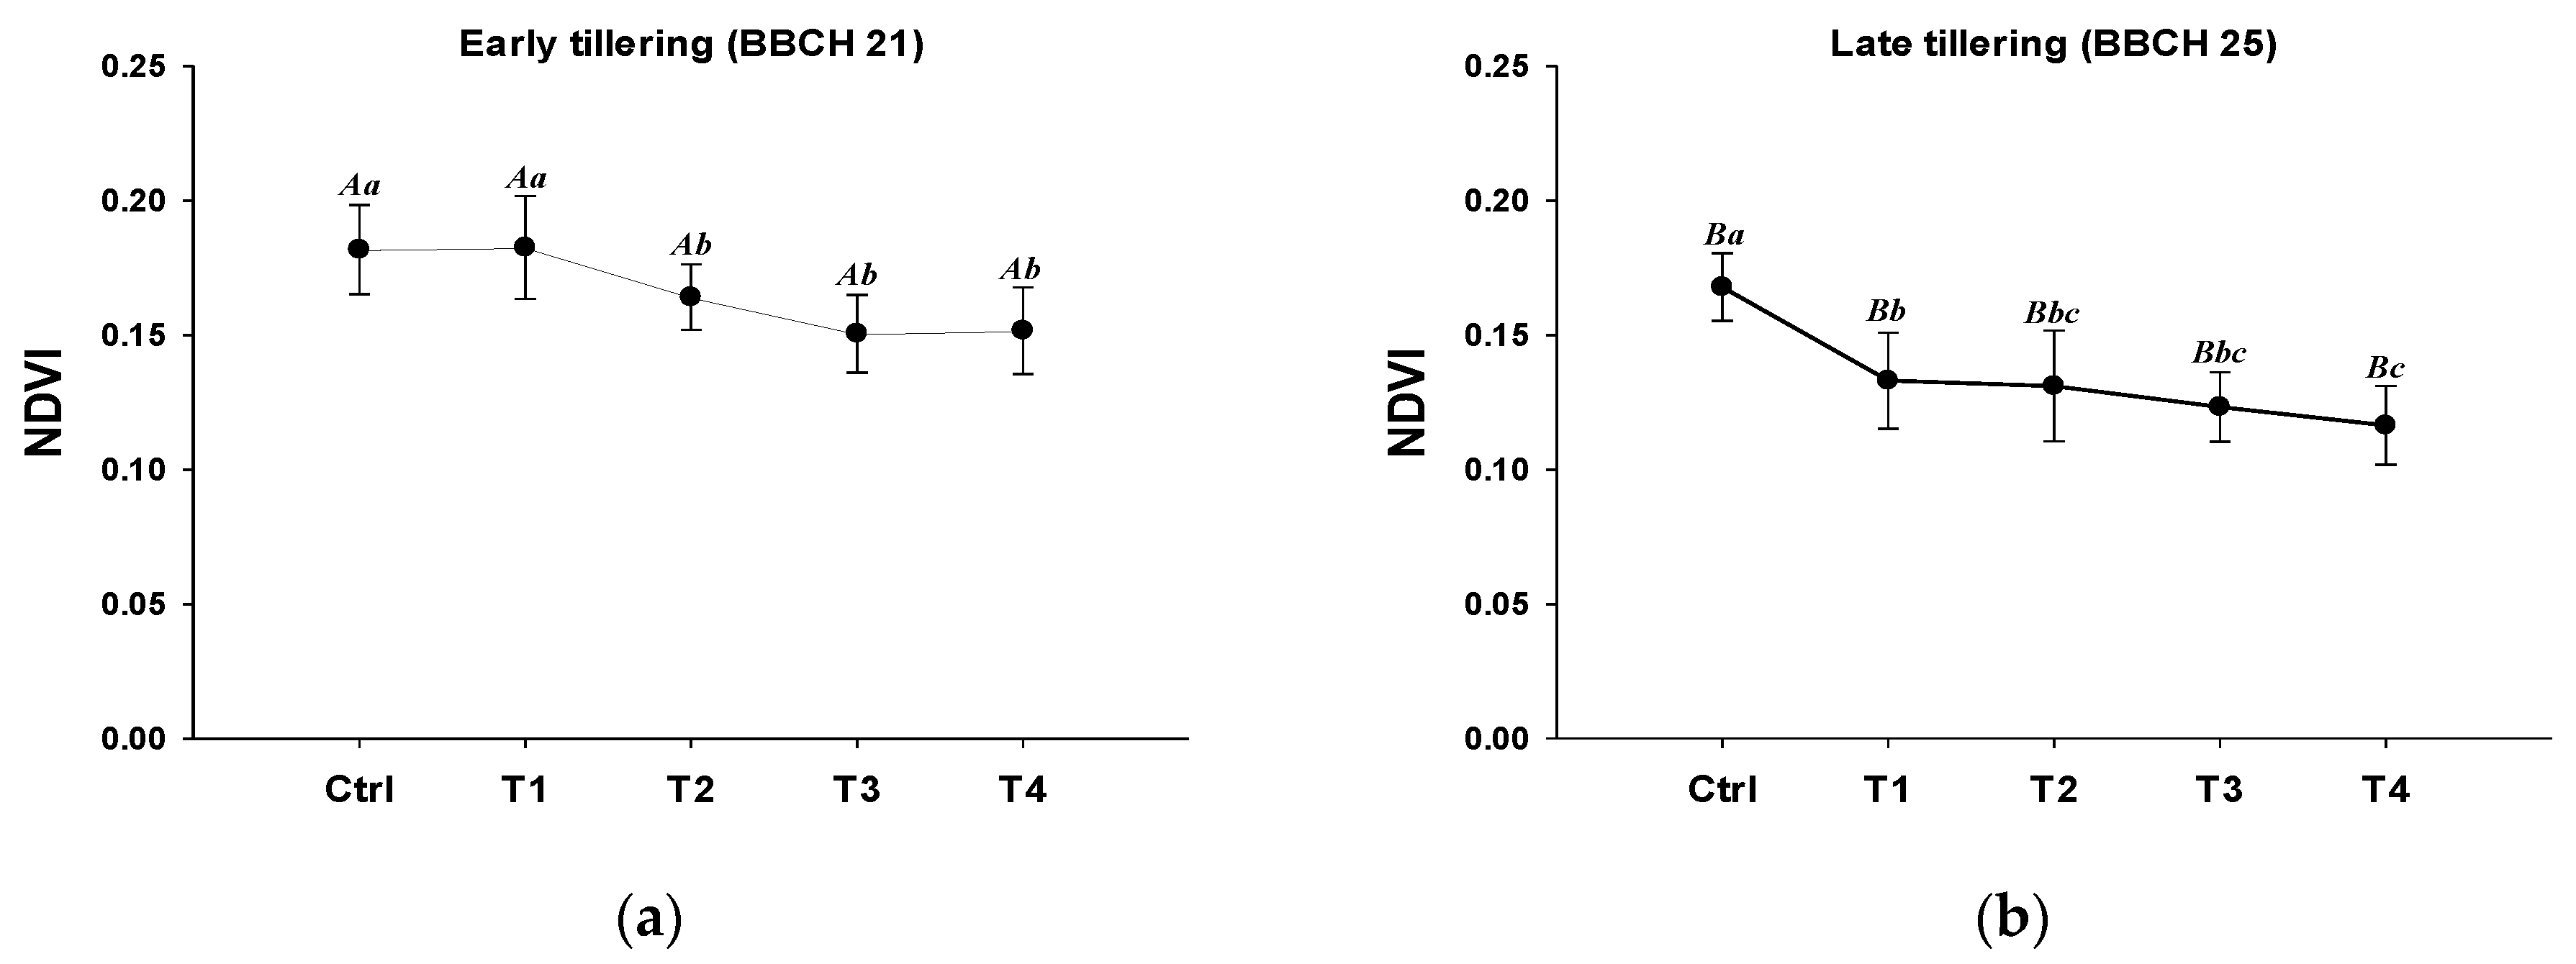
3.3. NDVI-Based Rice Damage and Recovery Assessment
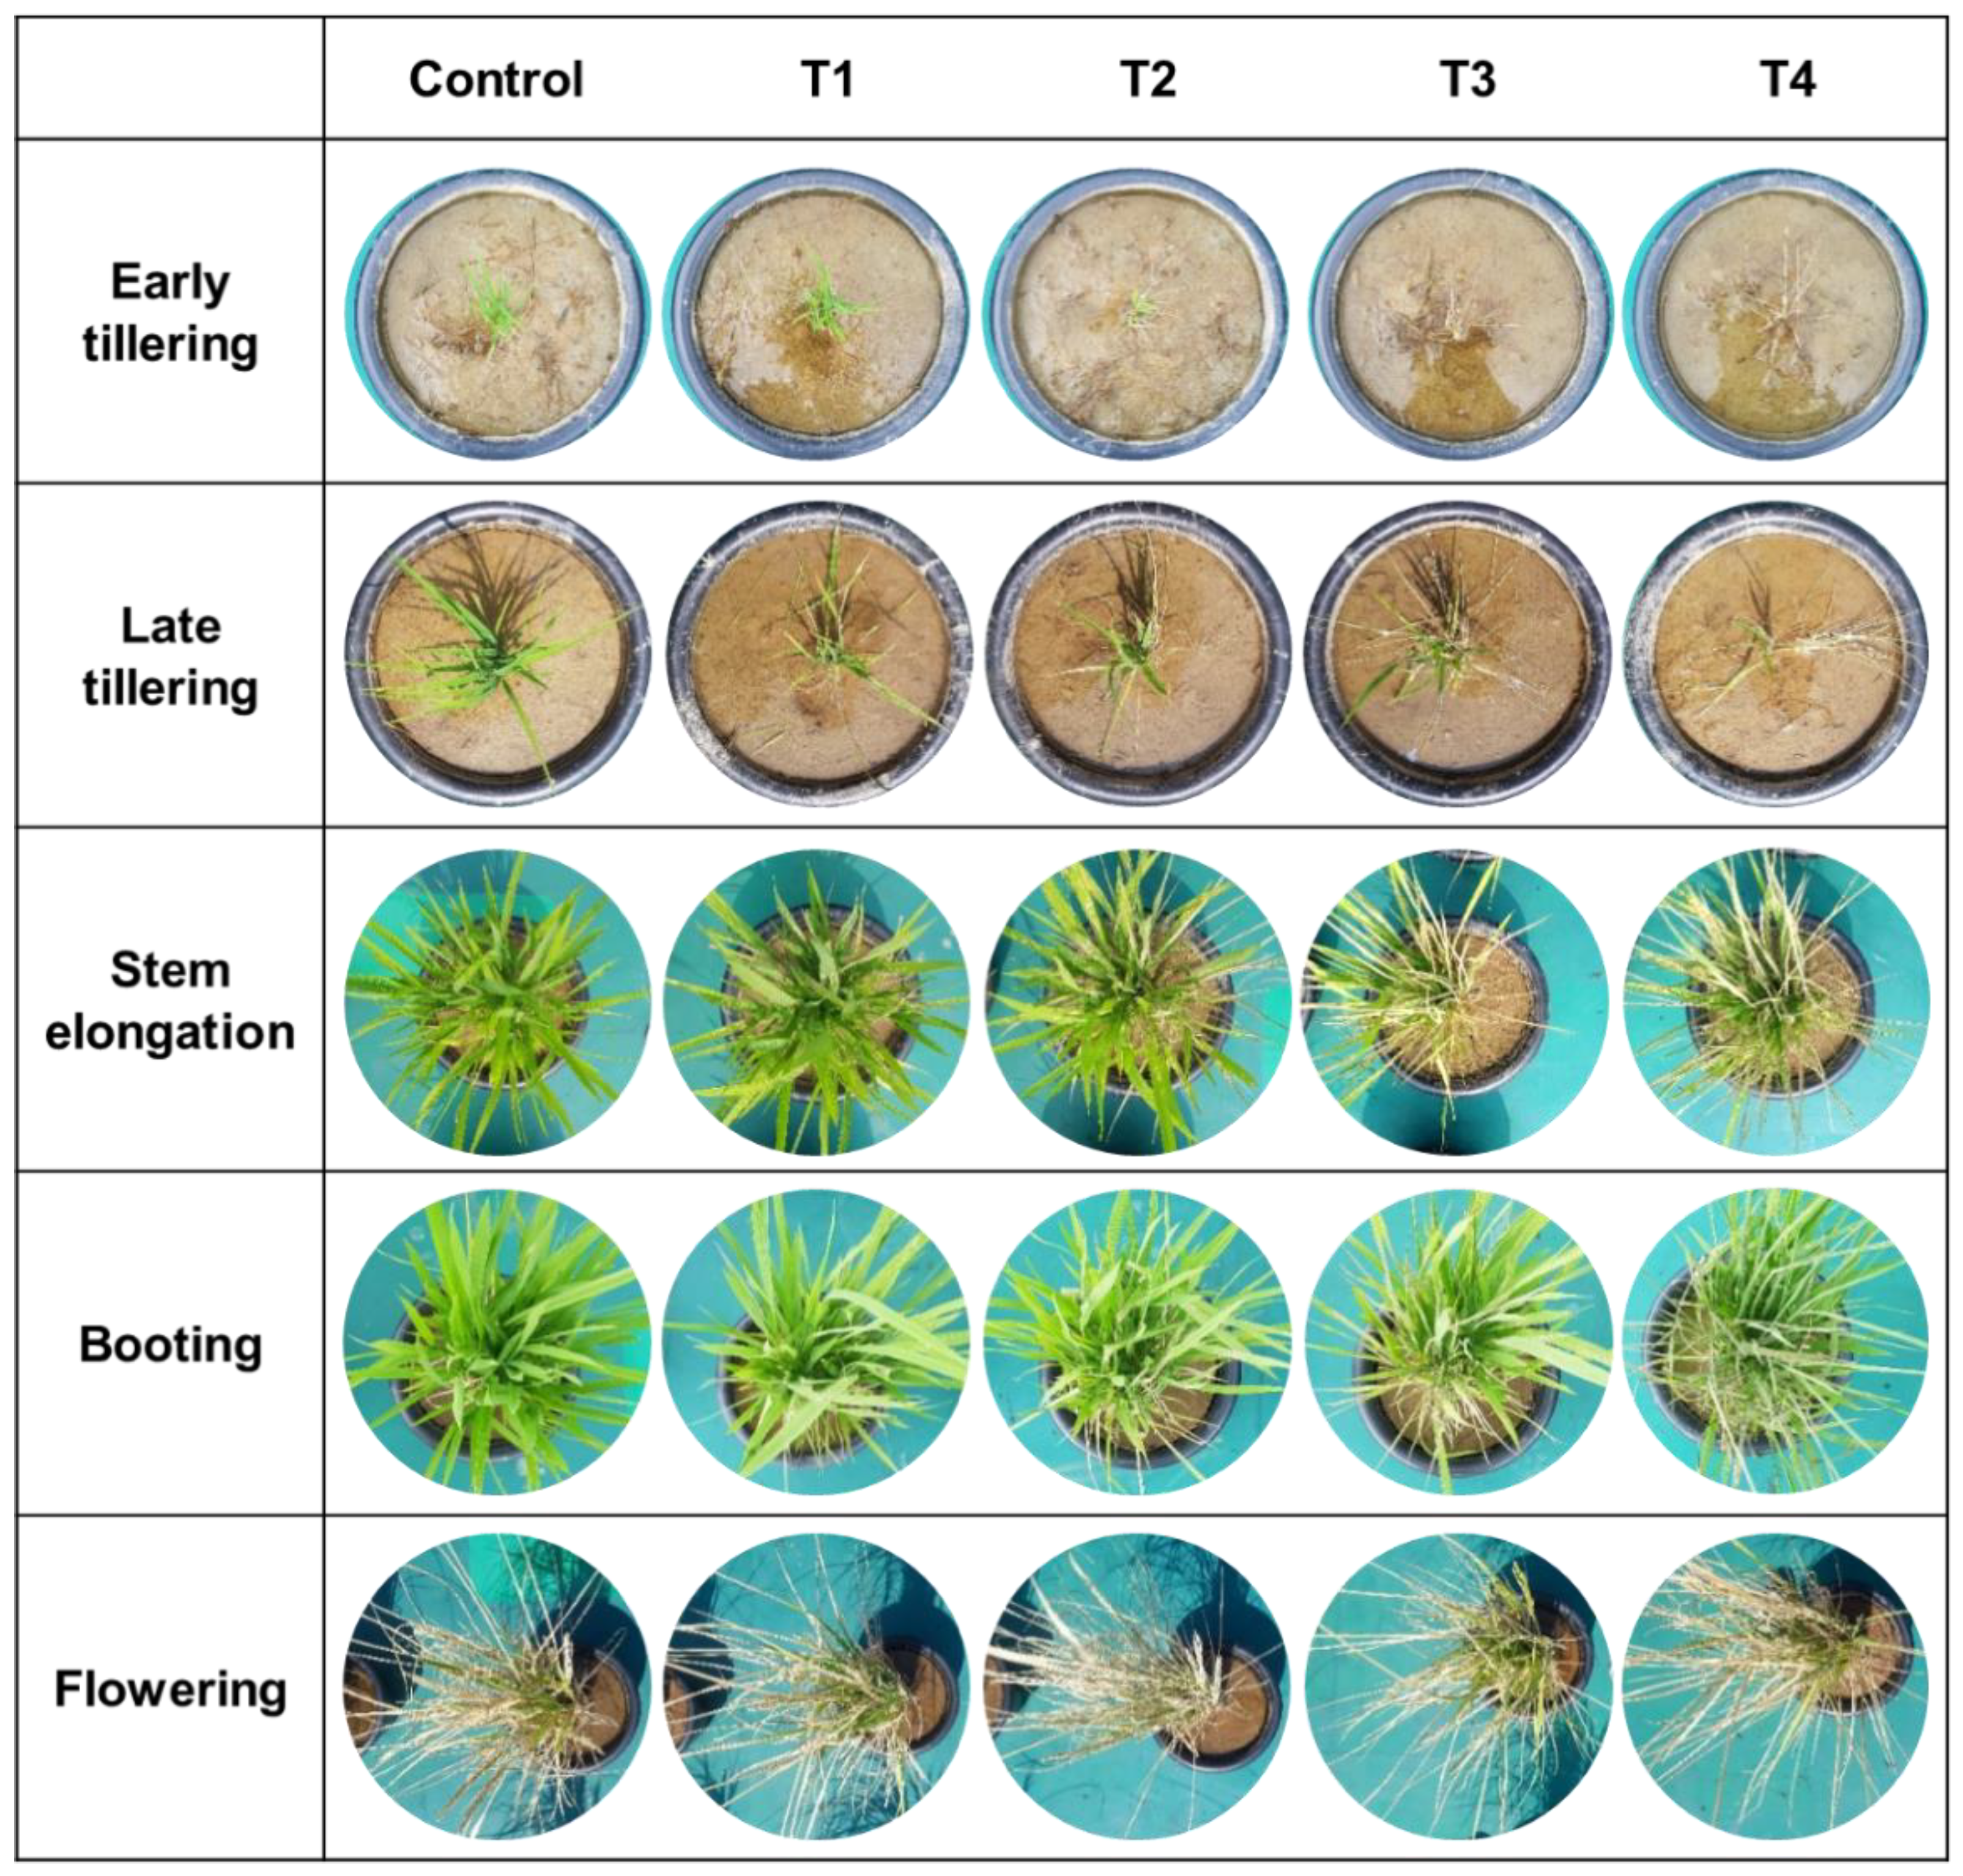
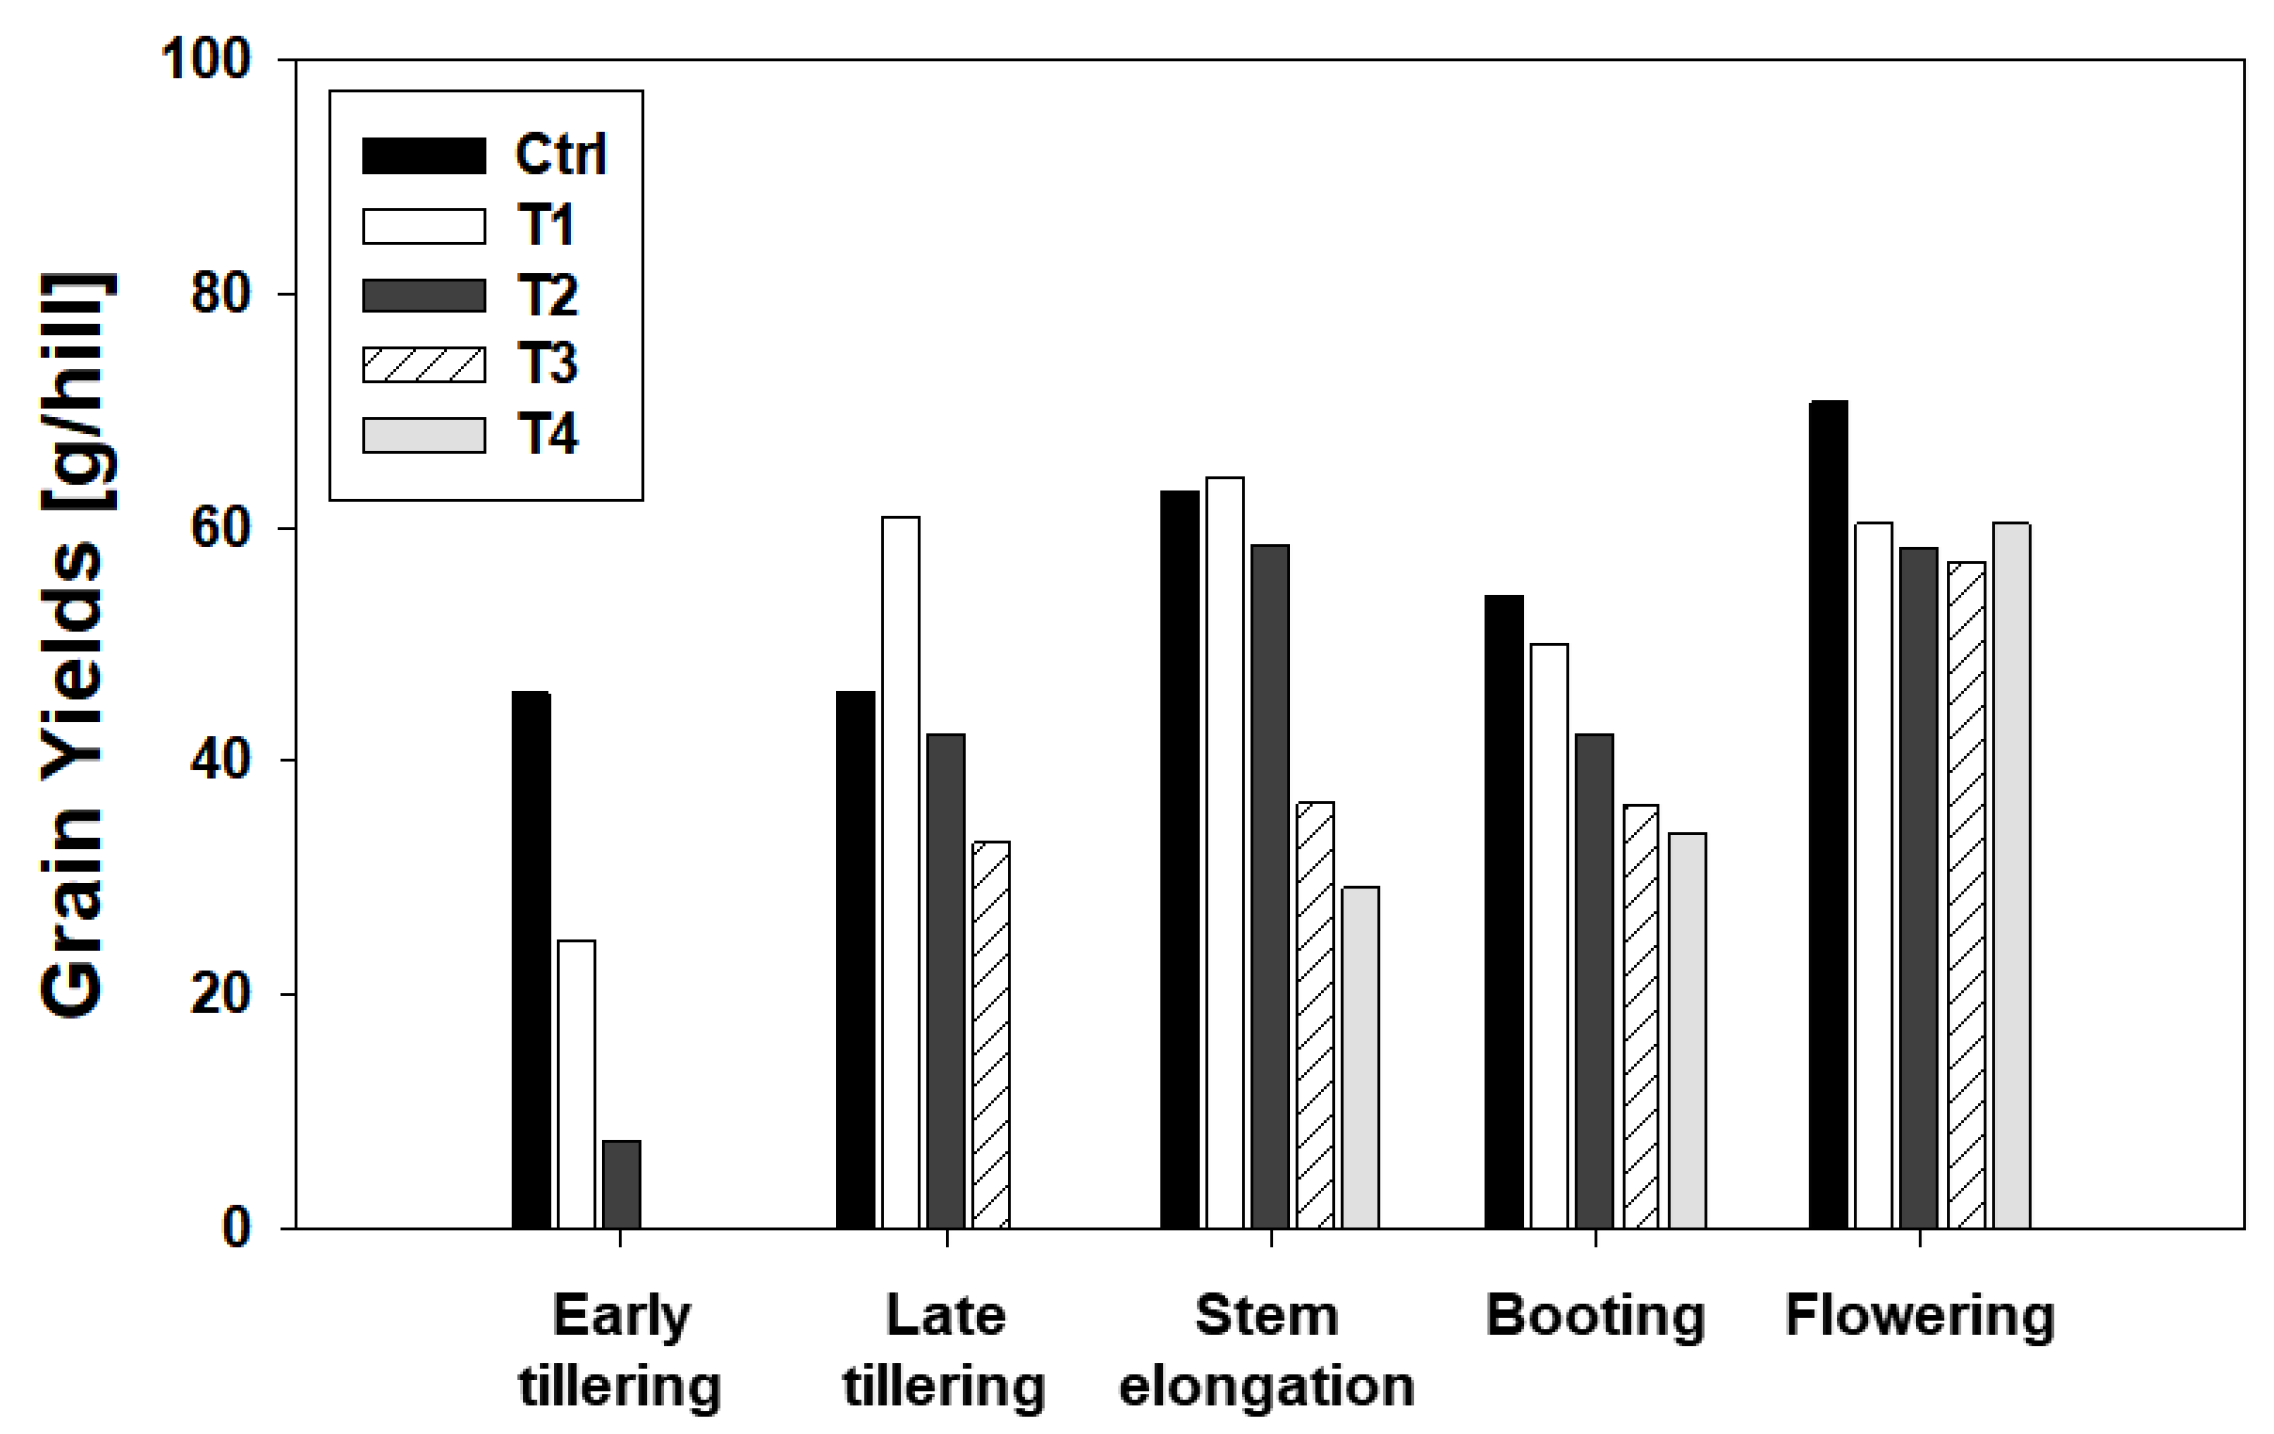
3.4. Physiological Characteristic-Based Damage Assessment
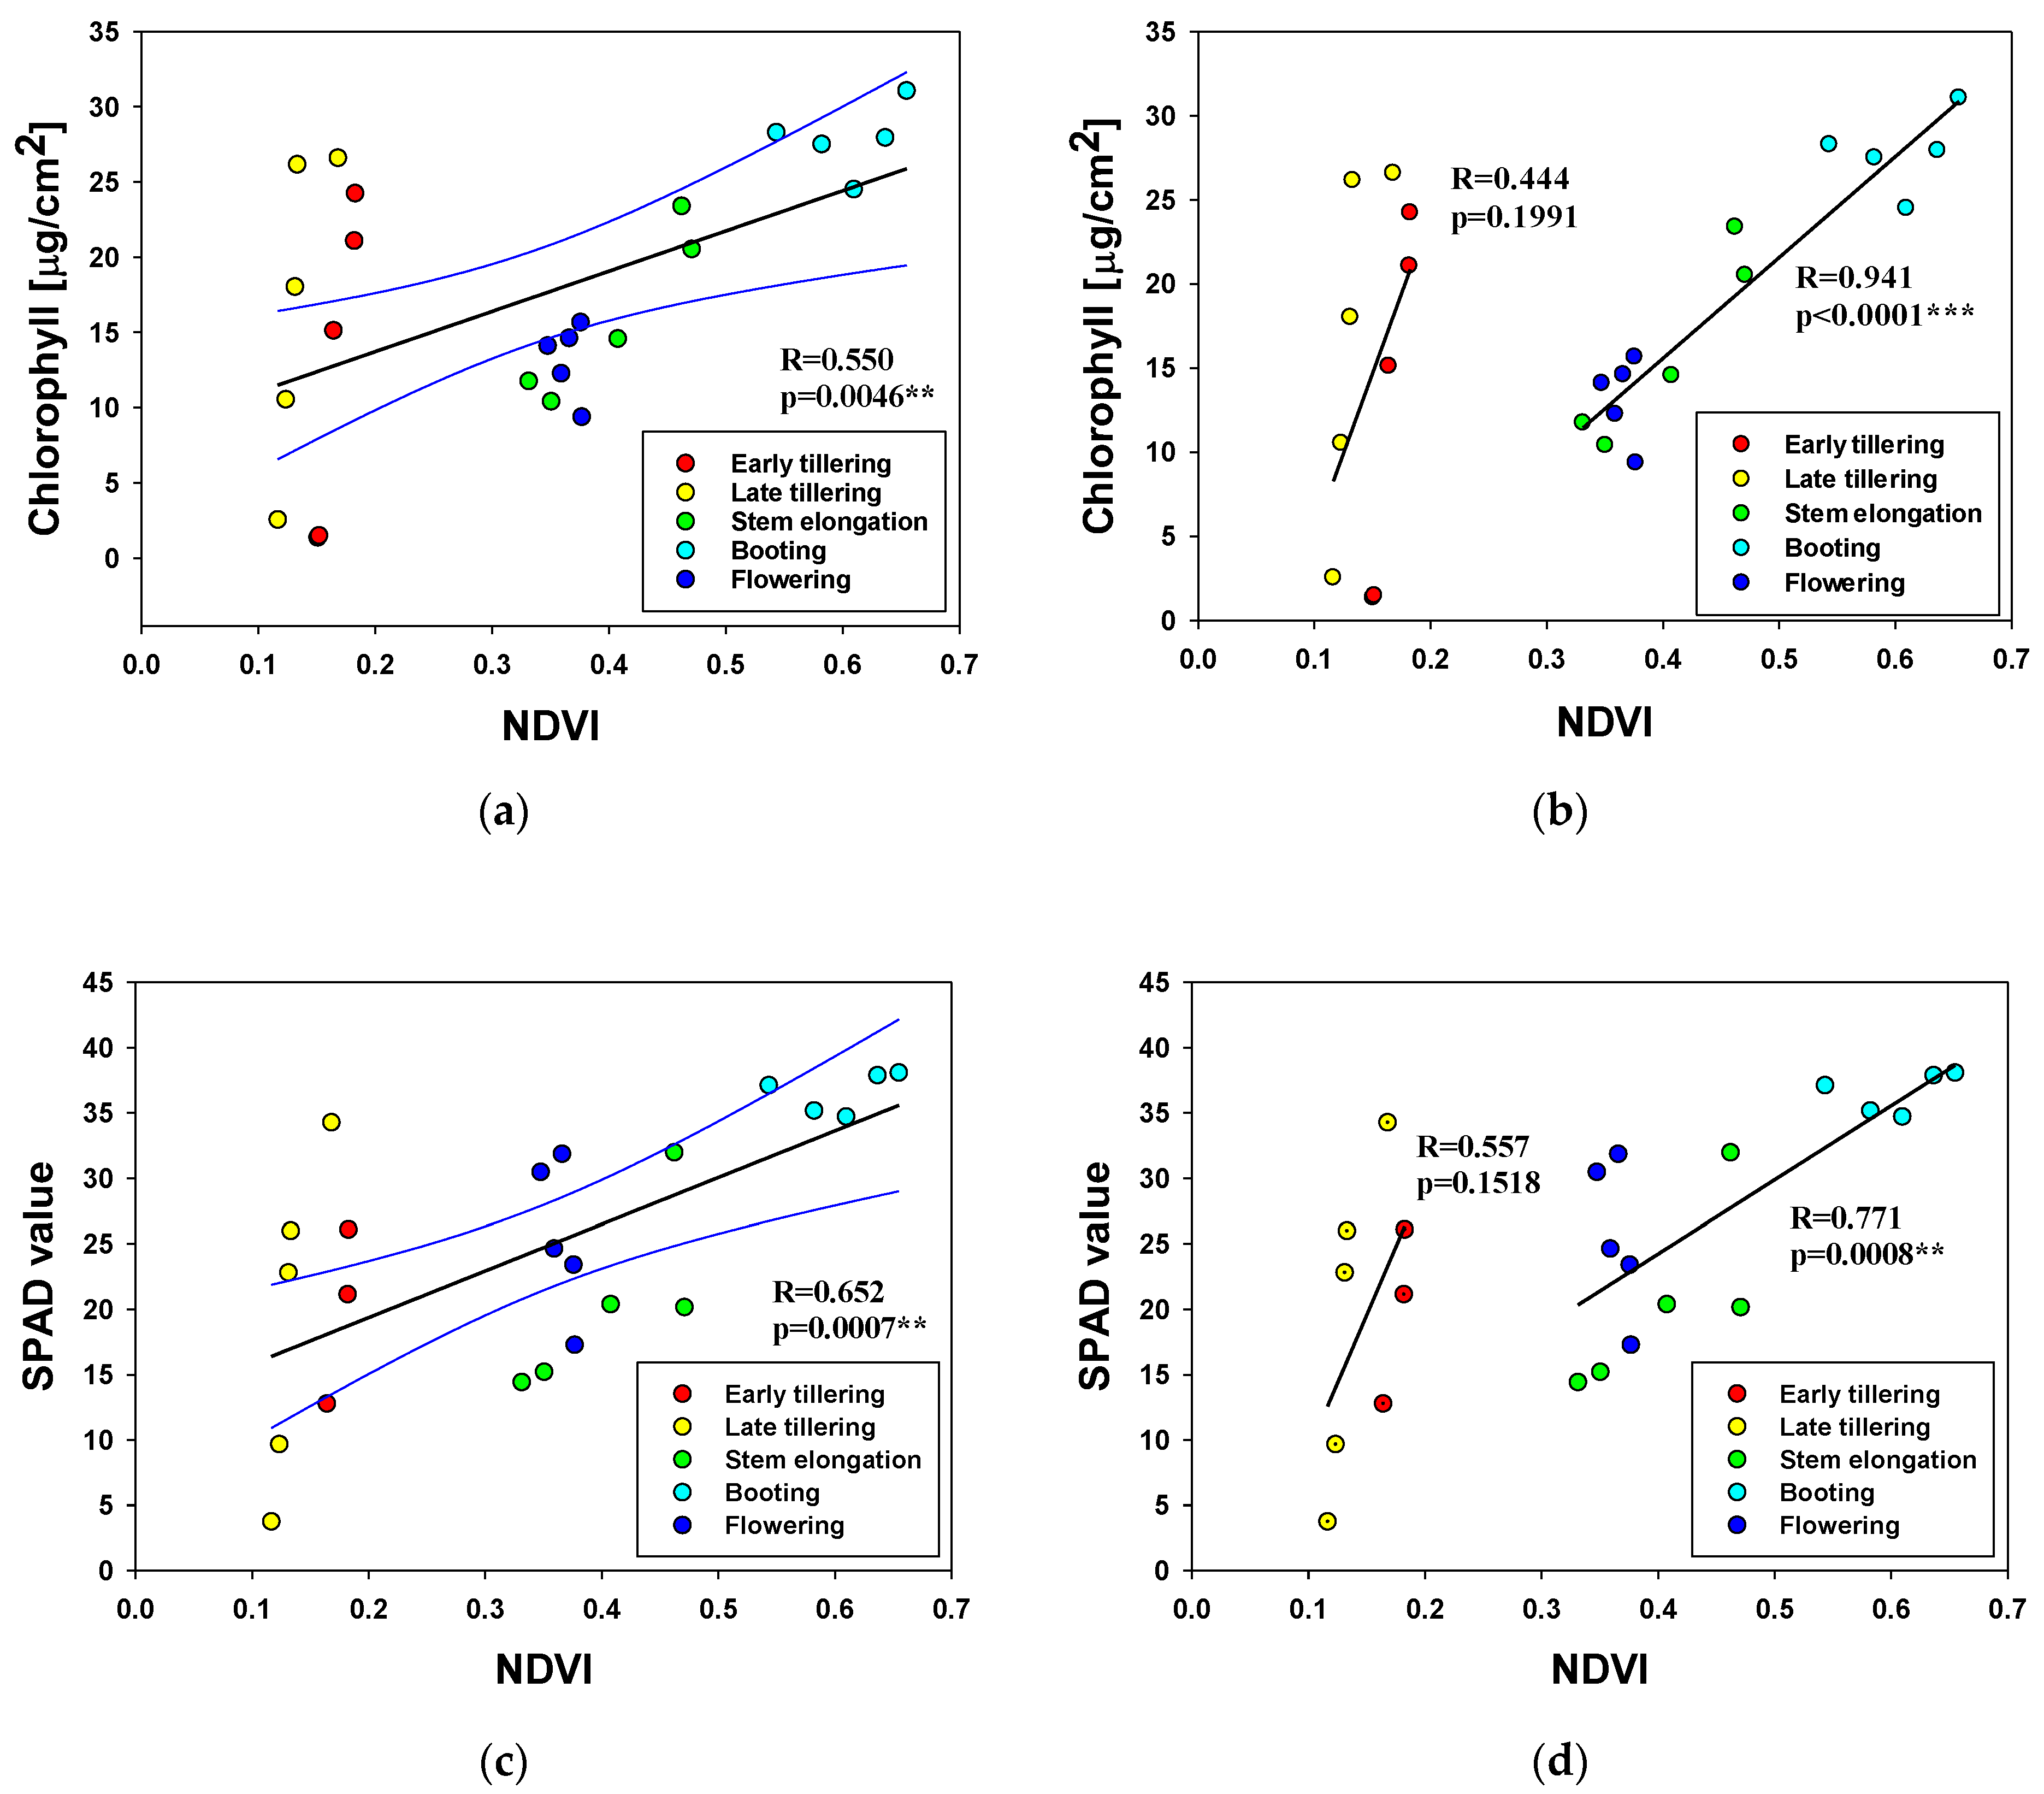
3.5. Relationship between the NDVI and Physiological Characteristics at Different Growth Stages
4. Discussion
5. Conclusions
Author Contributions
Funding
Data Availability Statement
Conflicts of Interest
Appendix A
| Treatments | Slope | ||||||||
|---|---|---|---|---|---|---|---|---|---|
| Early Tillering | Late Tillering | Stem Elongation | |||||||
| (BBCH 21) | (BBCH 25) | (BBCH 30) | |||||||
| NDVI | GNDVI | SAVI | NDVI | GNDVI | SAVI | NDVI | GNDVI | SAVI | |
| Control ~ T1 | 0.41 | 100.98 | 3.34 | −20.72 | −12.55 | −3.06 | 1.9 | 11.03 | 1.54 |
| Control ~ T2 | −9.72 | −301.95 | −10.4 | −21.89 | −16.84 | −2.78 | −11.81 | 14.26 | −6.85 |
| Control ~ T3 | −17.21 | −432.27 | −13.77 | −26.54 | −21.85 | −13.07 | −24.15 | 20.3 | −17.13 |
| Control ~ T4 | −16.59 | −347.18 | −8.53 | −30.61 | −39.81 | −17.14 | −28.31 | 22.92 | −23.74 |
| Booting | Flowering | ||||||||
| (BBCH 41) | (BBCH 61) | ||||||||
| NDVI | GNDVI | SAVI | NDVI | GNDVI | SAVI | ||||
| Control ~ T1 | 7.57 | 16.43 | 2.65 | −0.25 | −4.72 | −2.84 | |||
| Control ~ T2 | 0.13 | 10.33 | −1.87 | −7.73 | −7.84 | −1.82 | |||
| Control ~ T3 | −4.37 | 10.49 | −5.93 | −2.84 | −13.85 | −5.34 | |||
| Control ~ T4 | −10.75 | 3.31 | −15.87 | −4.69 | −15.46 | −4.96 | |||


References
- El Harbawi, M.; Mustapha, S.; Choong, T.S.Y.; Rashid, S.A.; Kadir, S.A.S.A.; Rashid, Z.A. Rapid analysis of risk assessment using developed simulation of chemical industrial accidents software package. Int. J. Environ. Sci. Technol. 2007, 5, 53–64. [Google Scholar] [CrossRef]
- Lee, K.; Kwon, H.-M.; Cho, S.; Kim, J.; Moon, I. Improvements of safety management system in Korean chemical industry after a large chemical accident. J. Loss Prev. Process. Ind. 2016, 42, 6–13. [Google Scholar] [CrossRef]
- Yoo, B.; Choi, S.D. Emergency Evacuation Plan for Hazardous Chemicals Leakage Accidents Using GIS-based Risk Analysis Techniques in South Korea. Int. J. Environ. Res. Public Health 2019, 16, 1948. [Google Scholar] [CrossRef] [PubMed]
- Suh, Y.W.; Park, J. Establishing a Post Impact Assessment System for Chemical Accidents; Korea Environment Institute: Yeongi-gun, Korea, 2015. [Google Scholar]
- Ahamed, T.; Tian, L.; Zhang, Y.; Ting, K. A review of remote sensing methods for biomass feedstock production. Biomass Bioenergy 2011, 35, 2455–2469. [Google Scholar] [CrossRef]
- Mulla, D.J. Twenty five years of remote sensing in precision agriculture: Key advances and remaining knowledge gaps. Biosyst. Eng. 2013, 114, 358–371. [Google Scholar] [CrossRef]
- Johansen, K.; Raharjo, T.; McCabe, M.F. Using Multi-Spectral UAV Imagery to Extract Tree Crop Structural Properties and Assess Pruning Effects. Remote Sens. 2018, 10, 854. [Google Scholar] [CrossRef]
- Jiménez-Brenes, F.M.; Granados, F.L.; De Castro, A.I.; Torres-Sánchez, J.; Serrano, N.; Peña, J.M. Quantifying pruning impacts on olive tree architecture and annual canopy growth by using UAV-based 3D modelling. Plant Methods 2017, 13, 1–15. [Google Scholar] [CrossRef]
- Maes, W.H.; Steppe, K. Perspectives for Remote Sensing with Unmanned Aerial Vehicles in Precision Agriculture. Trends Plant Sci. 2019, 24, 152–164. [Google Scholar] [CrossRef]
- Primicerio, J.; Di Gennaro, S.F.; Fiorillo, E.; Genesio, L.; Lugato, E.; Matese, A.; Vaccari, F.P. A flexible unmanned aerial vehicle for precision agriculture. Precis. Agric. 2012, 13, 517–523. [Google Scholar] [CrossRef]
- Gennaro, S.F.D.; Battiston, E.; Marco, S.; Facini, O.; Matese, A.; Nocentini, M.; Palliotti, A.; Mugnai, L. Unmanned Aerial Vehicle (UAV)-Based Remote Sensing to Monitor Grapevine Leaf Stripe Disease within a Vineyard Affected by Esca Complex. Phytopathol. Mediterr. 2016, 55, 262–275. [Google Scholar] [CrossRef]
- Xue, J.; Su, B. Significant Remote Sensing Vegetation Indices: A Review of Developments and Applications. J. Sens. 2017, 2017, 1–17. [Google Scholar] [CrossRef]
- Wu, C.; Niu, Z.; Tang, Q.; Huang, W. Estimating chlorophyll content from hyperspectral vegetation indices: Modeling and validation. Agric. For. Meteorol. 2008, 148, 1230–1241. [Google Scholar] [CrossRef]
- Guan, S.; Fukami, K.; Matsunaka, H.; Okami, M.; Tanaka, R.; Nakano, H.; Sakai, T.; Nakano, K.; Ohdan, H.; Takahashi, K. Assessing Correlation of High-Resolution NDVI with Fertilizer Application Level and Yield of Rice and Wheat Crops using Small UAVs. Remote Sens. 2019, 11, 112. [Google Scholar] [CrossRef]
- Zhou, J.; Pavek, M.J.; Shelton, S.C.; Holden, Z.J.; Sankaran, S. Aerial multispectral imaging for crop hail damage assessment in potato. Comput. Electron. Agric. 2016, 127, 406–412. [Google Scholar] [CrossRef]
- Meier, U. BBCH-Monograph: Growth Stages of Mono-and Dicotyledonous Plants. Fed. Biol. Res. Cent. Agric. For. 2001. [Google Scholar] [CrossRef]
- Center for Toxicology and Environmental Health, L.L.C. Baseline Risk Assessment Hookston Station Site; California Department of Health Services: Richmond, CA, USA, 2004.
- Turvey, C.G.; McLaurin, M.K. Applicability of the Normalized Difference Vegetation Index (NDVI) in Index-Based Crop Insurance Design. Weather Clim. Soc. 2012, 4, 271–284. [Google Scholar] [CrossRef]
- Rouse, J.W.; Haas, R.H.; Schell, J.A.; Deering, D.W. Monitoring the vernal advancement and retrogradation (green wave effect) of natural vegetation. Prog. Rep. RSC 1978, 1973, 112. [Google Scholar]
- Gitelson, A.A.; Kaufman, Y.J.; Merzlyak, M.N. Use of a green channel in remote sensing of global vegetation from EOS-MODIS. Remote Sens. Environ. 1996, 58, 289–298. [Google Scholar] [CrossRef]
- HUETE, A.R. A Soil-Adjusted Vegetation Index (SAVI). Remote Sens. Environ. 1988, 25, 259–309. [Google Scholar] [CrossRef]
- Ray, S.S.; Das, G.; Singh, J.P.; Panigrahy, S. Evaluation of hyperspectral indices for LAI estimation and discrimination of potato crop under different irrigation treatments. Int. J. Remote Sens. 2006, 27, 5373–5387. [Google Scholar] [CrossRef]
- Gitelson, A.A.; Kaufman, Y.J.; Stark, R.; Rundquist, D. Novel algorithms for remote estimation of vegetation fraction. Remote Sens. Environ. 2002, 80, 76–87. [Google Scholar] [CrossRef]
- Ling, Q.; Huang, W.; Jarvis, R.P. Use of a SPAD-502 meter to measure leaf chlorophyll concentration in Arabidopsis thaliana. Photosynth. Res. 2011, 107, 209–214. [Google Scholar] [CrossRef] [PubMed]
- Warren, C.R. Rapid Measurement of Chlorophylls with a Microplate Reader. J. Plant Nutr. 2008, 31, 1321–1332. [Google Scholar] [CrossRef]
- Yoshida, S.; Forno, D.A.; Cock, J.H.; Gomez, K.A. Laboratory Manual for Physiological Studies of Rice. Biology 1976, 2, 83. [Google Scholar]
- Adams, M.L.; Philpot, W.D.; Norvell, W.A. Yellowness index: An application of spectral second derivatives to estimate chlorosis of leaves in stressed vegetation. Int. J. Remote Sens. 1999, 20, 3663–3675. [Google Scholar] [CrossRef]
- Qi, J.; Chehbouni, A.; Huete, A.R.; Kerr, Y.H.; Sorooshian, S. A modified soil adjusted vegetation index. Remote Sens. Environ. 1994, 48, 119–126. [Google Scholar] [CrossRef]
- Wang, W.; Qu, J.J.; Hao, X.; Liu, Y.; Stanturf, J.A. Post-hurricane forest damage assessment using satellite remote sensing. Agric. For. Meteorol. 2010, 150, 122–132. [Google Scholar] [CrossRef]
- Shafian, S.; Rajan, N.; Schnell, R.; Bagavathiannan, M.; Valasek, J.; Shi, Y.; Olsenholler, J. Unmanned aerial systems-based remote sensing for monitoring sorghum growth and development. PLoS ONE 2018, 13, e0196605. [Google Scholar] [CrossRef]
- Makino, A. Photosynthesis, Grain Yield, and Nitrogen Utilization in Rice and Wheat. Plant Physiol. 2010, 155, 125–129. [Google Scholar] [CrossRef]
- Fan, L.; Gao, Y.; Brück, H.; Bernhofer, C. Investigating the relationship between NDVI and LAI in semi-arid grassland in Inner Mongolia using in-situ measurements. Theor. Appl. Clim. 2008, 95, 151–156. [Google Scholar] [CrossRef]
- Goswami, S.; Gamon, J.A.; Vargas, S.; Tweedie, C.E. Relationships of NDVI, Biomass, and Leaf Area Index (LAI) for Six Key Plant Species in Barrow, Alaska. PeerJ Prepr. 2015, e1127. [Google Scholar] [CrossRef]
- Jones, C.L.; Weckler, P.R.; Maness, N.O.; Jayasekara, R.; Stone, M.L.; Chrz, D. Remote Sensing to Estimate Chlorophyll Concentration in Spinach Using Multi-Spectral Plant Reflectance. Trans. ASABE 2007, 50, 2267–2273. [Google Scholar] [CrossRef]




| Exposure | Treatment Time | Imaging Time | |||||
|---|---|---|---|---|---|---|---|
| Number | 1 | 2 (Recovery) | |||||
| BBCH Scale | Growth Stage | DAP (Days) | DAP (Days) | DAD (Days) | DAP (Days) | DAD (Days) | |
| 1 | 21 | Early tillering | 4 | 10 | 6 | ||
| 2 | 25 | Late tillering | 15 | 20 | 5 | 67 | 52 |
| 3 | 30 | Stem elongation | 41 | 46 | 5 | 67 | 26 |
| 4 | 41 | Booting | 55 | 60 | 5 | 67 | 12 |
| 5 | 61 | Flowering | 75 | 80 | 5 | ||
| Instrument | Category | Details |
|---|---|---|
| UAV | Altitude | 40 m AGL |
| Multispectral sensor | Capturing gap | 5.6 m |
| Forward overlap | 85% | |
| Side overlap | 80% | |
| Acquisition spectral region | Green (550 nm BP 40) Red (660 nm BP 40) Red edge (735 nm BP 10) Near infrared (790 nm BP 40) |
| Growth Stage | Treatment | Grain Yield (g/hill) | No. of Panicles per Hill | Spikelet Number per Panicle (SNPP) | Filled Grain Percentage (%) | 1000-Grain Weight (g) | |
|---|---|---|---|---|---|---|---|
| Early tillering | Control | 45.879 | 27 | 71.370 | Aa | 81.318 | 29.278 |
| T1 | 24.682 | 26 | 51.846 | Ab | 65.727 | 27.858 | |
| T2 | 7.536 | 16 | 37.563 | Ab | 53.078 | 23.623 | |
| Late tillering | Control | 45.962 | 32 | 55.938 | Bb | 90.279 | 28.442 |
| T1 | 60.873 | 35 | 84.343 | Ba | 71.037 | 29.029 | |
| T2 | 42.386 | 35 | 64.400 | Bb | 73.070 | 25.735 | |
| T3 | 33.024 | 21 | 72.571 | Bab | 81.102 | 26.719 | |
| Stem elongation | Control | 63.202 | 33 | 81.273 | Ca | 81.283 | 28.992 |
| T1 | 64.355 | 31 | 76.774 | Ca | 91.513 | 29.548 | |
| T2 | 58.501 | 35 | 71.857 | Ca | 82.147 | 28.316 | |
| T3 | 36.417 | 30 | 49.633 | Cb | 87.911 | 27.820 | |
| T4 | 29.147 | 26 | 47.269 | Cb | 84.947 | 27.919 | |
| Booting | Control | 54.191 | 31 | 63.452 | Dab | 92.018 | 29.940 |
| T1 | 50.006 | 24 | 77.208 | Da | 88.883 | 30.362 | |
| T2 | 42.371 | 26 | 65.692 | Dab | 82.611 | 30.029 | |
| T3 | 36.251 | 26 | 57.385 | Db | 85.255 | 28.499 | |
| T4 | 33.916 | 24 | 57.750 | Db | 83.478 | 29.314 | |
| Flowering | Control | 70.731 | 30 | 83.700 | Ea | 93.588 | 30.098 |
| T1 | 60.320 | 26 | 86.423 | Ea | 90.877 | 29.539 | |
| T2 | 58.318 | 26 | 88.923 | Ea | 88.149 | 28.615 | |
| T3 | 57.160 | 29 | 81.862 | Ea | 87.279 | 27.587 | |
| T4 | 60.363 | 28 | 83.893 | Ea | 89.698 | 28.649 | |
| Physiological Characteristics | Growth Stages | Pearson Correlation Coefficient | |||
|---|---|---|---|---|---|
| n | R | p | |||
| Leaf chlorophyll content | E | 10 | 0.444 | 0.1991 | |
| L | 15 | 0.941 | <0.0001 | *** | |
| All | 25 | 0.550 | 0.0046 | ** | |
| SPAD value | E | 8 | 0.557 | 0.1518 | |
| L | 15 | 0.771 | 0.0008 | *** | |
| All | 23 | 0.652 | 0.0007 | *** | |
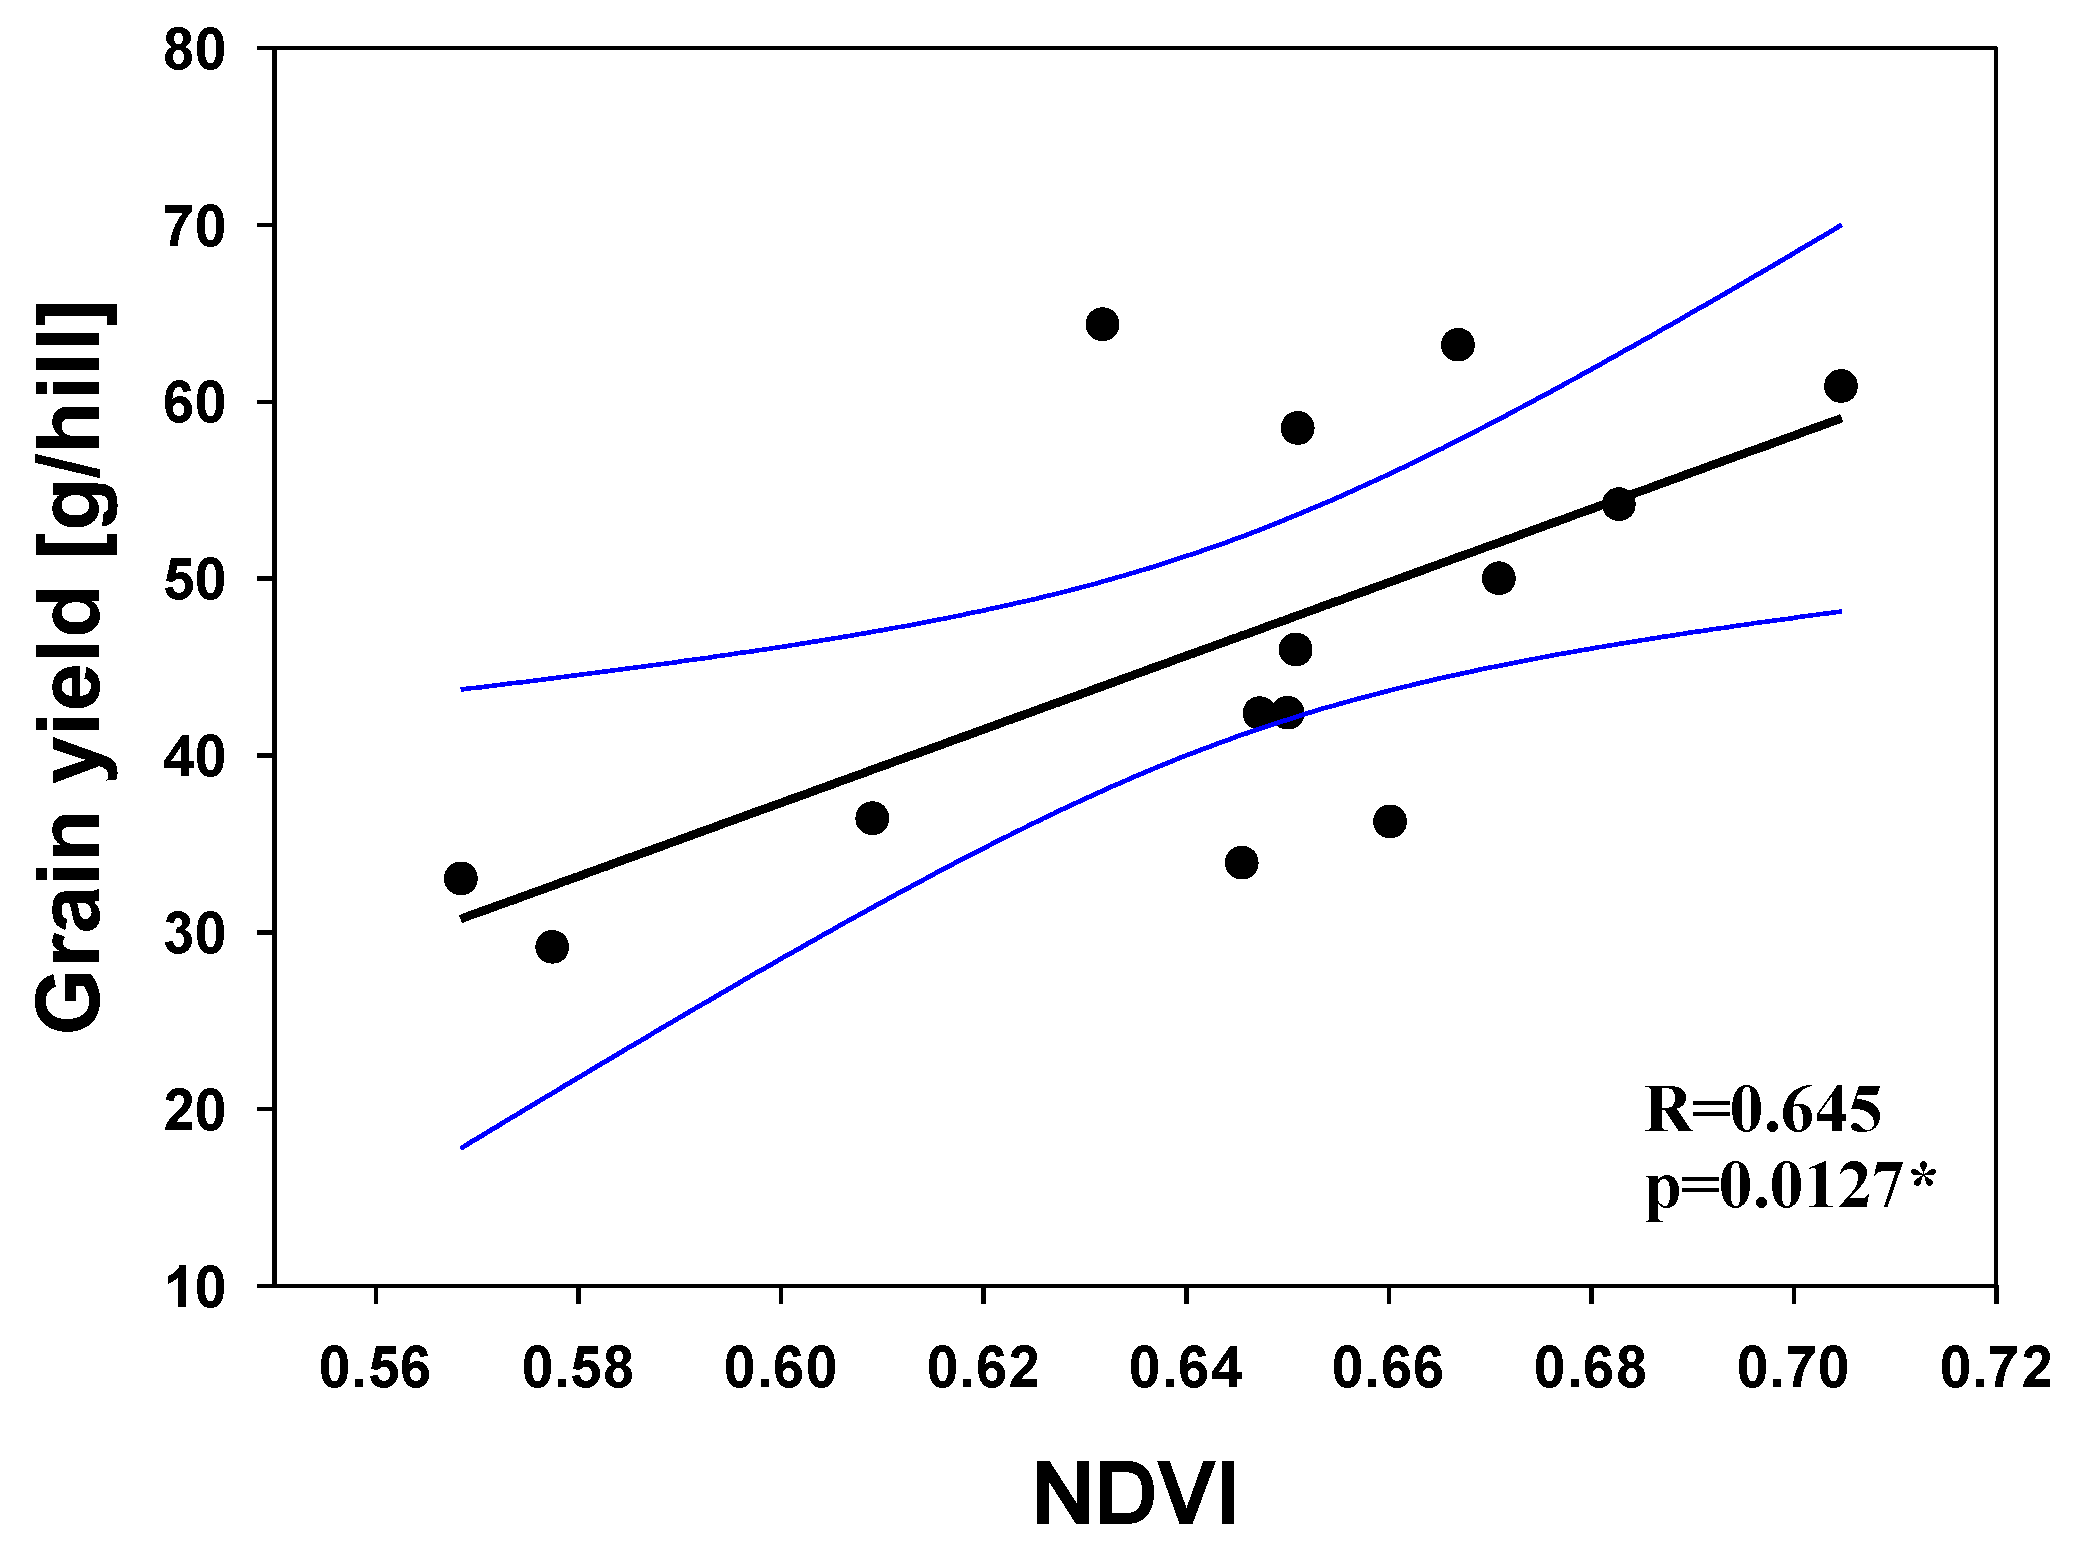
| Grain yield | All | 14 | 0.645 | 0.0127 | * |
| No. of panicles per hill | All | 14 | 0.517 | 0.0585 | |
| Spikelet number per panicle (SNPP) | All | 14 | 0.469 | 0.0907 | |
| Filled grain percentage | All | 14 | −0.163 | 0.5770 | |
| 1000-grain weight | All | 14 | 0.510 | 0.0624 | |
Publisher’s Note: MDPI stays neutral with regard to jurisdictional claims in published maps and institutional affiliations. |
© 2020 by the authors. Licensee MDPI, Basel, Switzerland. This article is an open access article distributed under the terms and conditions of the Creative Commons Attribution (CC BY) license (http://creativecommons.org/licenses/by/4.0/).
Share and Cite
Kim, H.; Kim, W.; Kim, S.D. Damage Assessment of Rice Crop after Toluene Exposure Based on the Vegetation Index (VI) and UAV Multispectral Imagery. Remote Sens. 2021, 13, 25. https://doi.org/10.3390/rs13010025
Kim H, Kim W, Kim SD. Damage Assessment of Rice Crop after Toluene Exposure Based on the Vegetation Index (VI) and UAV Multispectral Imagery. Remote Sensing. 2021; 13(1):25. https://doi.org/10.3390/rs13010025
Chicago/Turabian StyleKim, Hyewon, Woojung Kim, and Sang Don Kim. 2021. "Damage Assessment of Rice Crop after Toluene Exposure Based on the Vegetation Index (VI) and UAV Multispectral Imagery" Remote Sensing 13, no. 1: 25. https://doi.org/10.3390/rs13010025
APA StyleKim, H., Kim, W., & Kim, S. D. (2021). Damage Assessment of Rice Crop after Toluene Exposure Based on the Vegetation Index (VI) and UAV Multispectral Imagery. Remote Sensing, 13(1), 25. https://doi.org/10.3390/rs13010025


