Article

Potential of Hyperspectral Thermal Infrared Spaceborne Measurements to Retrieve Ice Cloud Physical Properties: Case Study of IASI and IASI-NG

by
Lucie Leonarski
1,
Laurent C.-Labonnote
1,*,
Mathieu Compiègne
2,
Jérôme Vidot
3,
Anthony J. Baran
4,5 and
Philippe Dubuisson
1
1
CNRS, UMR 8518—LOA—Laboratoire d’Optique Atmosphérique, University of Lille, F-59000 Lille, France
2
Hygeos, F-59000 Lille, France
3
CNRM, Université de Toulouse, Météo-France, CNRS, F-22300 Lannion, France
4
Met Office, Exeter EX1 3PB, UK
5
School of Physics, Astronomy and Mathematics, University of Hertfordshire, Hatfield AL10 9AB, UK
*
Author to whom correspondence should be addressed.
Remote Sens. 2021, 13(1), 116; https://doi.org/10.3390/rs13010116
Submission received: 26 November 2020 / Revised: 22 December 2020 / Accepted: 24 December 2020 / Published: 31 December 2020
(This article belongs to the Special Issue Scattering by Ice Crystals in the Earth's Atmosphere)

Abstract

:
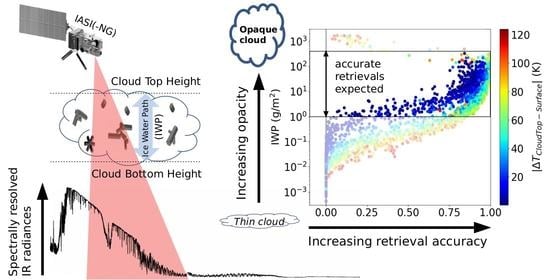
The present study aims to quantify the potential of hyperspectral thermal infrared sounders such as the Infrared Atmospheric Sounding Interferometer (IASI) and the future IASI next generation (IASI-NG) for retrieving the ice cloud layer altitude and thickness together with the ice water path. We employed the radiative transfer model Radiative Transfer for TOVS (RTTOV) to simulate cloudy radiances using parameterized ice cloud optical properties. The radiances have been computed from an ice cloud profile database coming from global operational short-range forecasts at the European Center for Medium-range Weather Forecasts (ECMWF) which encloses the normal conditions, typical variability, and extremes of the atmospheric properties over one year (Eresmaa and McNally (2014)). We performed an information content analysis based on Shannon’s formalism to determine the amount and spectral distribution of the information about ice cloud properties. Based on this analysis, a retrieval algorithm has been developed and tested on the profile database. We considered the signal-to-noise ratio of each specific instrument and the non-retrieved atmospheric and surface parameter errors. This study brings evidence that the observing system provides information on the ice water path ( I W P ) as well as on the layer altitude and thickness with a convergence rate up to 95% and expected errors that decrease with cloud opacity until the signal saturation is reached (satisfying retrievals are achieved for clouds whose I W P is between about 1 and 300 g / m 2 ).

Graphical Abstract

1. Introduction

Clouds are of major interest for the Earth’s radiation budget studies as further emphasized by the latest Intergovernmental Panel on Climate Change (IPCC) report [1]. In the shortwave part of the spectrum, clouds cool the Earth by reflecting the incoming solar radiation. In the longwave part of the spectrum, they act as a greenhouse component by absorbing the emission from the lower atmosphere and surface and re-emitting at their own temperature. The balance between those two antagonist effects depends on the nature and properties of clouds (e.g., layer altitude and thickness, layer temperature, condensed water concentration, particle size, shape, and roughness) and determines the net radiative impact of clouds in the global climate system. This is especially true for ice clouds, which can either be associated to a warming or cooling effect depending on their macro- and micro-physical properties [2].
Significant efforts have been made to retrieve information about cloud properties from a large number of instruments on different platforms such as on board satellites or ground based. Among these instruments, those that fall into the category of active instruments bring enough information to fully characterize the vertical structure of ice clouds [3,4,5]. Combining information from the Cloud-Aerosol Lidar and Infrared Pathfinder Satellite Observation (CALIPSO) and CloudSat, part of the A-Train, has for instance greatly helped to better understand the vertical distribution of ice cloud properties [3,6]. Furthermore, Hong and Liu (2015) [7] showed, using the instruments available on those platforms, that the global frequency of the ice clouds over a four-year sample is more than 50%, with a large majority being optically thin (76% of the sampled ice clouds have an optical depth in the visible lower than 2 or, equivalently, an integrated ice water path lower than 100 g / m 2 ). This high occurrence results in the fact that the net warming of those thin ice clouds is much stronger than the net cooling of optically thick ice clouds [8].The Moderate Resolution Imaging Spectroradiometer, MODIS/Aqua-Terra, instruments have also been widely used to infer cloud properties from space [9,10,11]. Used in synergy with the Infrared Imaging Radiometer, IIR/CALIPSO, this instrument has also shown the ability of broad visible and infrared channels to provide satisfactory retrieval of integrated ice water content, ice crystal effective radius, and layer optical depth in single and multilayer cases [12,13]. The advantage of using the combination of shortwave and thermal infrared channels is that one can obtain information on moderately thin as well as thicker ice cloud layers.
Originally developed for weather forecast applications, a large number of satellites carrying high spectral resolution instruments have been launched, making measurements with important spatial and temporal coverage. They have significantly improved the weather forecasts by providing accurate knowledge of the atmospheric humidity and temperature profiles [14,15,16]. The Infrared Atmospheric Sounding Interferometer (IASI) supported by the French Centre National d’Études Spatiales (CNES) and the European Organization for the Exploitation of Meteorological Satellites (EUMETSAT) is particularly important for the European Numerical Weather Prediction (NWP) community as it brings a major part of the information content for assimilation [17]. The high occurrence of clouds in the instrument fields of view initiated the development of techniques to use infrared sounder observations in cloudy conditions [16,18,19,20,21]. The extraction of atmospheric profiles from cloud contaminated radiances suitable for NWP models, by simultaneously inverting cloud properties, has been demonstrated [22,23,24,25,26,27] with a great potential to improve short-range forecasts [26]. Additionally, the hyperspectral instruments could be very useful to retrieve cloud properties as they could bring, by selecting the appropriate channels, information about the vertical distribution of the condensed water. The early 2000s have seen the emergence of the first methodologies to extract information about ice cloud properties from passive hyperspectral infrared measurements [28,29,30] and led to the use of simple cloud scheme retrievals to give operational cloud top phase and pressure as part of the IASI level 2 (L2) product [31]. Since those fundamental works, several studies have paved the way for ice cloud retrievals with increasing calculation speed, retrieval method efficiency, and cloud representation details [32,33,34,35]. More recently, Wu et al. (2017) [36] used an algorithm based on an optimal estimation inversion scheme and on a principal component-based radiative transfer model that provides a fast calculation of transformed radiances to infer cloud properties together with the atmospheric profiles from the IASI measurements. They have demonstrated the significant improvement of cloud retrieval accuracy achieved during the past 20 years by comparing it with products from active instruments such as the Cloud-Aerosol Lidar with Orthogonal Polarization, CALIOP/CALIPSO, and the Cloud Profiling Radar, CPR/CloudSat, collocated retrievals. However, measurements made in cloudy sky conditions are still poorly used even if they represent the major part of the measurement, being made [25] and, to this day, no robust operational algorithm provides cloud properties with satisfactory estimated uncertainties that are able to constrain the assimilation models.
In this study, we assess the information content in the hyperspectral infrared measurements of IASI and its next generation IASI-NG about ice cloud physical properties [17,37]. The aim is to understand and quantify the capabilities and limitations of these instruments together with a variational method to retrieve ice cloud properties by appropriately estimating the background error. We investigate the retrieval accuracy as a function of cloud properties in realistic single and multilayer cases.
The paper is organized as follows. The framework on which the study is based is presented in Section 2. The information content of the IASI and IASI-NG measurements about ice cloud properties is assessed and compared in Section 3. A channel selection scheme for both instruments is also shown in this section. Section 4 is dedicated to testing the performances of the retrieval algorithm over a synthetic measurement database. We finally present the summary in Section 5.

2. Framework

In this section, we first present the instrument being used to retrieve information about ice clouds together with the forward and microphysical models employed to simulate the signal from these clouds. We also introduce the retrieval method as well as the data we used to investigate the reliability of the retrieval.

2.1. IASI and IASI-NG Instruments

The Infrared Atmospheric Sounding Interferometer (IASI) is a Fourier transform spectrometer associated with an Integrated Imaging System (IIS). The instrument provides infrared spectra with a high spectral resolution (8461 spectral samples with an interval of 0.25 cm 1 and spectral resolution of 0.5 cm 1 after apodisation) between 645 cm 1 (15.5 μm) and 2760 cm 1 (3.62 μm). The primary goal of the IASI mission is to provide atmospheric emission spectra used to derive temperature and humidity profiles with high vertical resolution and accuracy (1 K for tropospheric temperature and 10% for humidity for a vertical resolution of 1 km [38]). IASI is one of the major instruments used for Numerical Weather Prediction [15,39] but it is also used to derive clouds, aerosols, as well as chemical properties of the atmospheric column [40]. IASI will soon be followed by a next generation instrument called IASI-NG, with a better spectral resolution (16,921 spectral samples with an interval of 0.125 cm 1 and spectral resolution of 0.25 cm 1 after apodisation) and signal to noise ratio twice that of IASI. Previous studies have shown that the infrared measurements are highly sensitive to the presence of ice clouds when the temperature difference between the cloud and underlying surface is large enough [34,41,42,43]. This high sensitivity combined with the high spectral resolution of IASI and IASI-NG leads to a high number of weighting functions and should allow one to obtain, by using the appropriate channels, information about the altitude as well as the geometrical thickness of the cloudy layer.

2.2. Microphysical Model

The main difficulty when working with ice clouds comes from their microphysics. Indeed, it is now well established that ice clouds are composed of very diverse particle shapes with a size that can vary by several orders of magnitude [44,45]. As the aim of this study is to show the potential of high spectral resolution measurements in the infrared to determine the cloud physical properties, the microphysical model used must be able to represent the optical properties of a volume of particles representative of the aforementioned diversity.
Important work has been achieved in the last decade to improve the ability of ice microphysical models to closely represent the observed particle diversity [46,47,48,49,50]. In this study, we make use of an original representation of bulk ice optical properties from the knowledge of ice water content ( I W C , which is the amount of ice per volume unit in g / m 3 ) and temperature [50,51]. The optical properties have been linked to the cloud temperature and ice water content by evaluating 20,662 in situ samples of these two variables. For each sample, a size distribution was first computed following the method of Field et al. (2007) [49], which makes use of the measured I W C and temperature to obtain a universal size distribution. The tropical normalization of the Field et al. (2007) [49] parameterization is chosen because it has been shown to better represent the shape of the particle size distribution [52,53]. The bulk ice optical properties have then been computed given the size distribution and by using the ensemble model of Baran and C.-Labonnote (2007) [54], which considers six different ice crystal shapes representative of the observed cloud ice particle shape complexity. The particle shape has been attributed depending on the particle size (simple shape for small particles to complex shape for large particles). The approach of Baran and C.-Labonnote (2007) [54] differs from other approaches as the six distributed ice crystal shapes across the particle size distribution attempts to, empirically and arbitrarily in construction of the idealized shapes, replicate the ice aggregation process. A parameterization of these optical properties has been developed afterwards as a function of I W C and temperature [51], allowing the ice bulk microphysical properties to be represented by these two variables only, with no requirement to choose a particle shape and size distribution/effective dimension.

2.3. Forward Model

In order to simulate the measured signal in a reasonable amount of time, we used the Radiative Transfer for the Tiros-N Operational Vertical Sounder (TOVS) (RTTOV) model [55,56]. This model is a fast radiative transfer model originally developed to simulate the Tiros-N Operational Vertical Sounder (TOVS) measurements in clear-sky conditions, for the assimilation of large spectral band radiances into Numerical Weather Prediction model analyses. RTTOV is also widely used in satellite retrieval, simulation of imagery, and data assimilation. The core of RTTOV is a fast parameterization of layer optical depths due to gas absorption. It has been extended to simulate a variety of different instruments from passive visible, infrared, and microwave downward-viewing satellite radiometers. Since 2005, to account for scattering effects in the infrared, a method based on Chou et al. (1999) [57] was introduced in RTTOV. The performance of the updated model has been assessed via comparison with a more accurate radiative transfer code, which treats the scattering contribution exactly and shows that RTTOV can now reproduce radiances with an error less than 0.2 K in the mid-infrared over ice cloud conditions [58]. The aforementioned microphysical parameterization has been integrated in the RTTOV model and allows one to compute radiances from atmospheric profiles such as temperature, water vapor, ice and liquid water content, and surface properties (emissivity and temperature). RTTOV can handle multilayer cloud configurations with any mixture between liquid and ice phases in the same layer. In addition to radiances, RTTOV also provides layer transmittance, Jacobian matrix (with respect to any atmospheric constituent and surface properties), and is therefore perfectly suited for use in a retrieval module.

2.4. Retrieval Method and State Vector

The method used in this study to retrieve the ice cloud information is based on an optimal estimation method described by Rodgers (2000) [59]. This method allows one to obtain the best estimate of a so-called state vector (composed of the retrieved variables) by minimizing a cost function, Equation (1), which represents the squared distance between the measurement and simulated signal weighted by an error matrix plus a term that can take into account any a priori knowledge of the state space. Let y = F ( x ) + ε be the measurement vector, with F the forward model, x the state vector, and ε the error on both the measurement and forward model. The measurement vector is described in Section 2.5. Using the bayesian theory that is behind the optimal estimation method, the best estimate of the state vector is one that minimizes the following cost function J ( x ) :
J ( x ) = [ y F ( x ) ] T S ε 1 [ y F ( x ) ] + [ x x a ] T S a 1 [ x x a ] ,
where x a is the a priori knowledge of the state vector, S a its covariance matrix, and S ε the covariance matrix of the measurement and forward model described in Section 3.1.
The main objective of this study is to retrieve useful information to characterize the total amount of ice in the cloudy column (called ice water path— I W P in g / m 2 ) together with the position and vertical extent of the cloud. Several studies have already shown the potential of infrared measurements to retrieve I W P and cloud top height [12,60,61,62], but, the vertical extent might be more challenging. The high spectral resolution measurements of IASI and IASI-NG can be used to address this need as they can bring information about the bottom layers of the cloud as we will see in the information content analysis in Section 3. The studied state vector is then composed of the ice water path ( I W P ), the cloud top height ( C T H ), and the cloud bottom height ( C B H ) as:
x = ln ( I W P ) ln ( C T H ) ln ( C B H ) .
The logarithmic base for I W P , C T H , and C B H has been chosen first because it facilitates the convergence [63], and also because those variables are better represented by log-normal probability density functions (pdfs). Indeed, it has been shown that the I W P is log-normally distributed [12]. Moreover, the log-normal distribution does not allow for non-physical negative values and helps in operating simultaneously with parameters that have different units and values varying over a wide range of magnitudes. In the following, the cloud is assumed to be a single layer of vertically homogeneous condensed water.

2.5. NWP Database and the Measurement Vector

To assess the information content of the IASI and IASI-NG measurements and test the retrieval algorithm against realistic case studies, the measurement vector is computed from a representative ensemble profile dataset from the global operational 137-level short-range forecasts of the European Center for Medium-range Weather Forecasts (ECMWF) (see https://www.nwpsaf.eu/site/software/atmospheric-profile-data/—last accessed on 15 December 2020). These profiles have been chosen to capture the normal conditions, variability, and extremes of the model behavior for different atmospheric properties over one year [64]. The selection process samples key atmospheric variables (temperature, humidity, ozone, cloud condensate, and precipitation) in a subset of profiles chosen among the 10 8 reanalysis profiles generated from 1 September 2013 to 31 August 2014. An iterative process ensures the variability of the sampled variable by comparing the squared distance between all the chosen profiles, a statistical procedure is used to ensure that the database accounts for a realistic amount of frequently-occurring atmospheric states and a filter is applied to prevent from non-physical profiles. The details of the selection procedure can be found in reference [64].
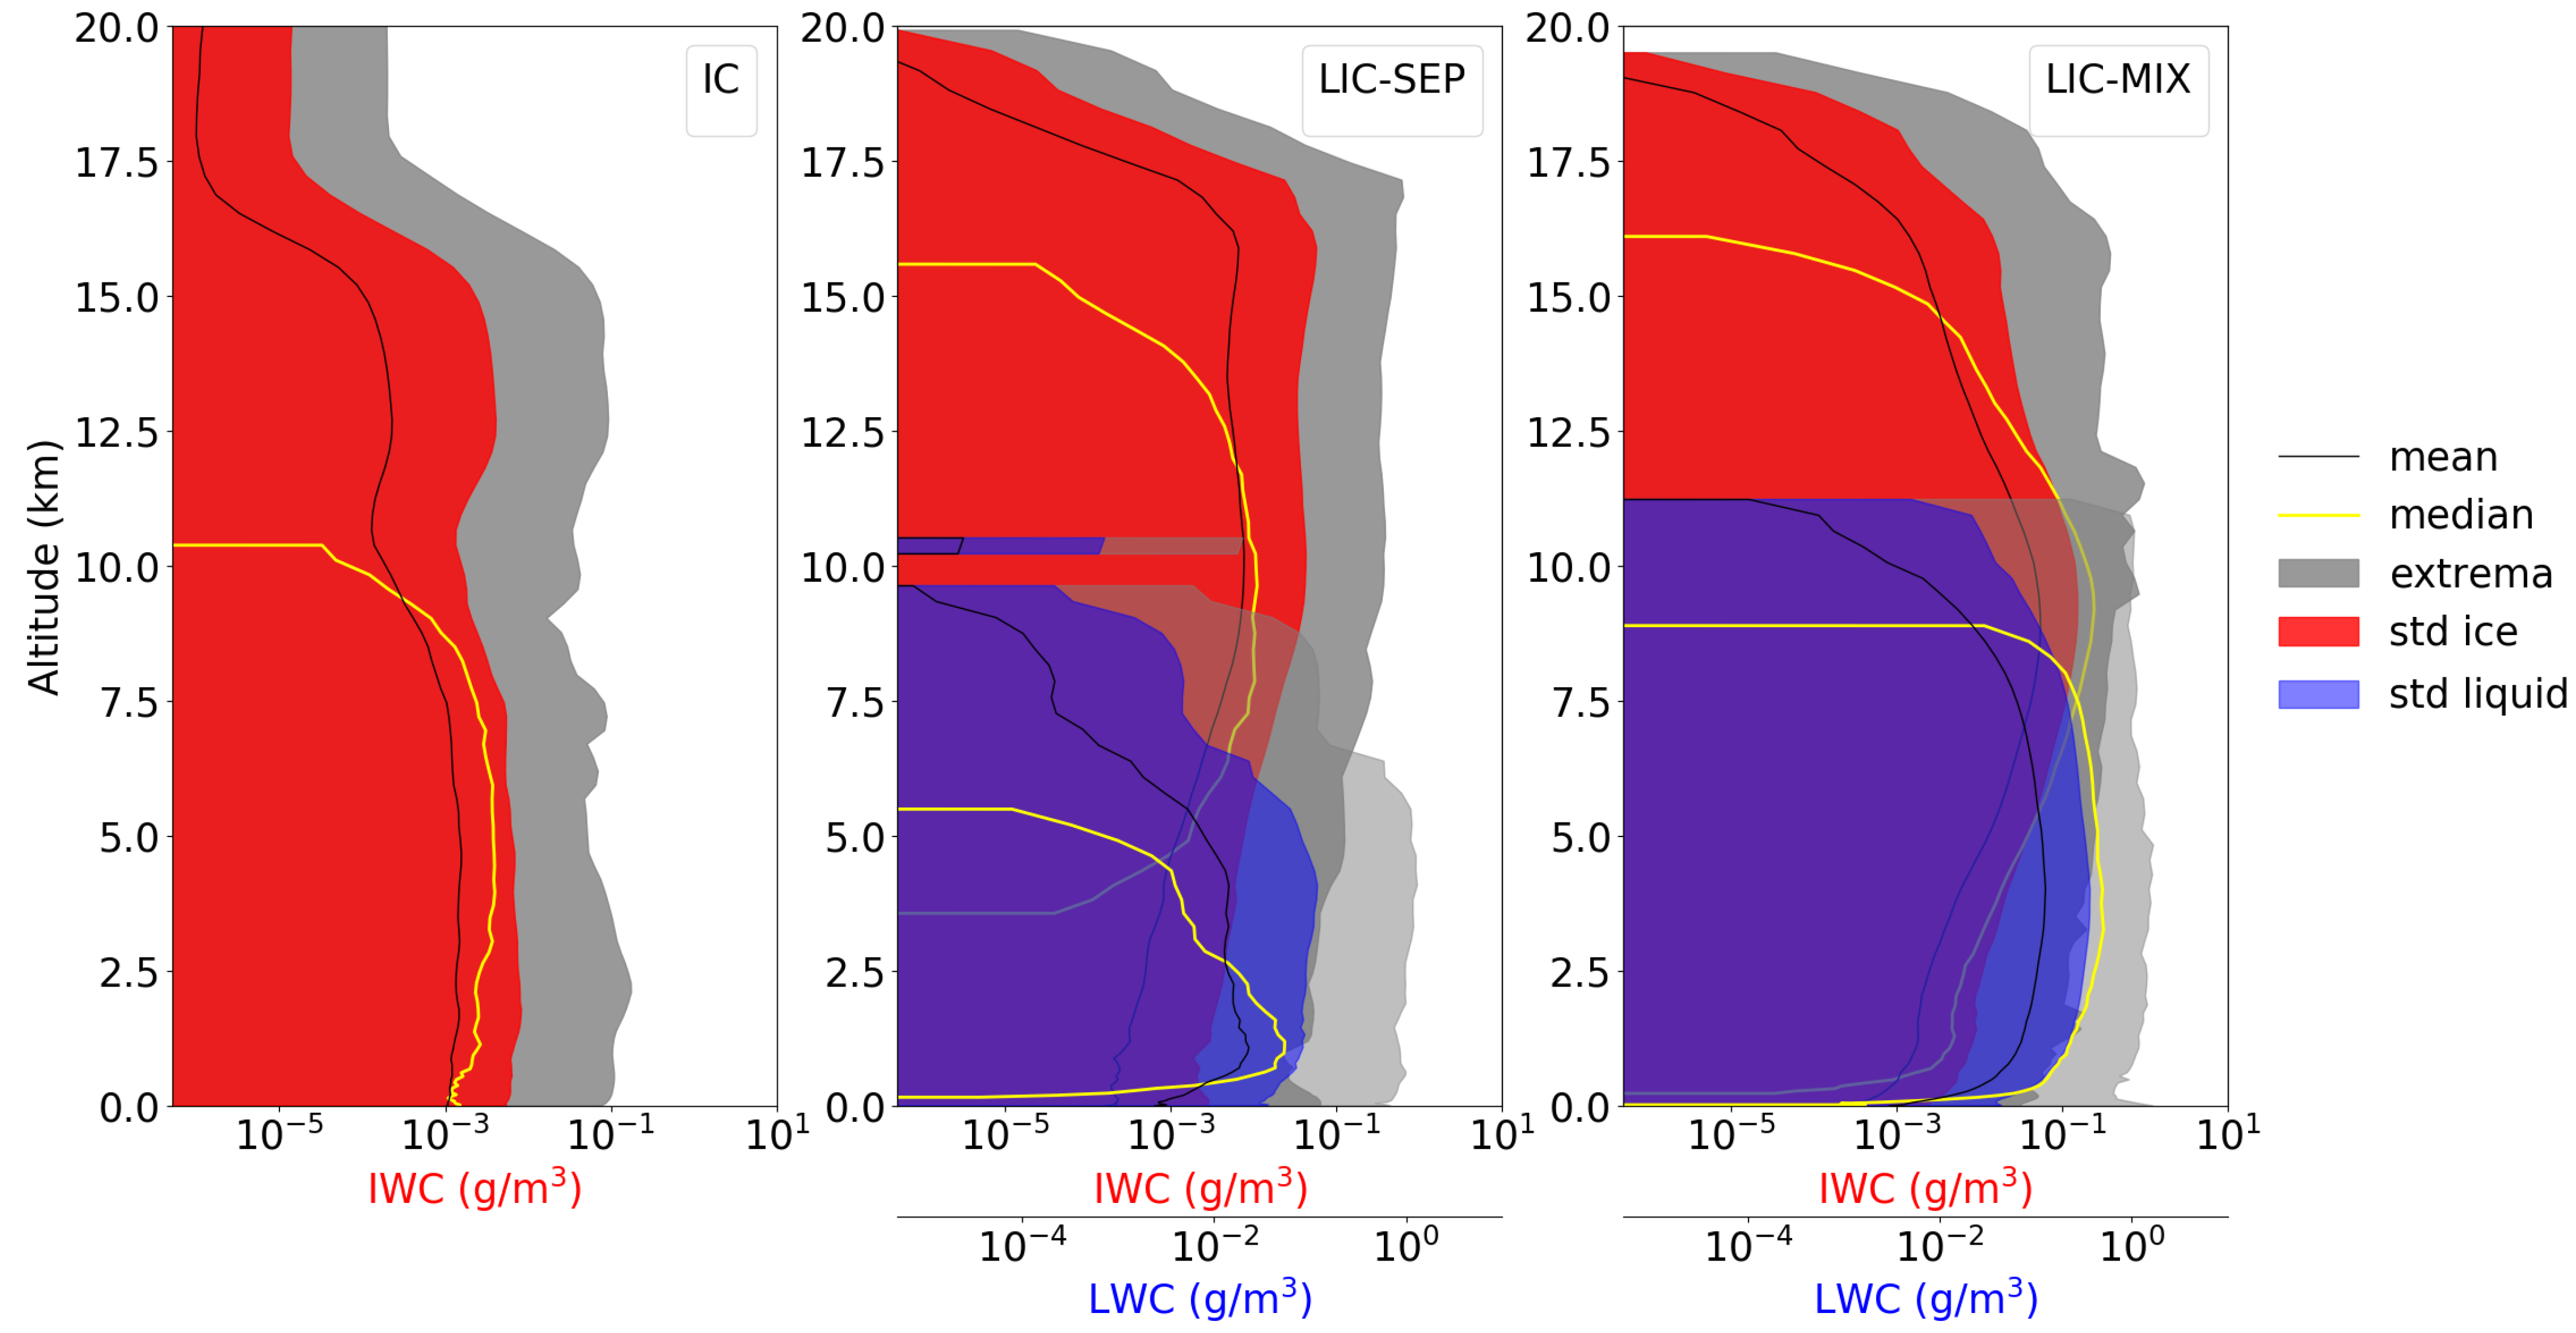
The geographical position of the profiles that make up the database is given in Figure 1. We have split them into three cloud scene categories depending on the cloud layer position and water thermodynamical phase. The first category (called IC in the following) is composed of 1424 atmospheric conditions corresponding to single-layer ice clouds. The second one, composed of 821 cases, corresponds to multi-layer cases (ice above liquid) with no mixture between layers (labeled as LIC-SEP in the following). The third category, the largest one with 2330 cases, corresponds to atmospheric columns with ice and liquid clouds that have some mixed layers (labeled as LIC-MIX). Figure 2 summarizes the characteristics of the cloud condensed water profiles for the three cloud configurations given by the database.
The measurement vector is built from those profiles. We used them as an input of the radiative transfer model and calculated the synthetic radiances as would be measured by IASI and IASI-NG at the top of the atmosphere by adding a random noise from the radiometric noise of each instrument [40].

3. Information Content Analysis

In this section, we use information theory to assess the information content of the IASI and IASI-NG measurements about ice cloud properties. We quantify the amount of information provided by the observing system (i.e., both the instrument and the retrieval process) about the state vector and its spectral distribution.

3.1. A Priori Error Departure

A figure of merit to characterize the observation system is the posterior covariance matrix S x [65]. From the retrieval theory [59], the best estimate of x has a Gaussian pdf with covariance S x given by:
S x = ( S a 1 + K T S ε 1 K ) 1 ,
where K is the Jacobian matrix (also known as a sensitivity matrix), S a is assumed to be the unity matrix corresponding to an a priori error of 100% on each parameter in logarithmic space, and S ε is the sum of the covariance matrices of the forward model S F and the measurement S y :
S ε = S F + S y ,
with
  • S F = K b S b K b T + S microphysics + S homogeneity ,
    Let b be the vector that contains all the non-retrieved parameters (i.e., water vapor, ozone, temperature and liquid water content profile, as well as surface temperature and emissivity). Their covariance matrix, S b , which is considered a diagonal matrix, has been built by assuming a 10% error for the gas concentration profile, 5% for surface emissivity, 50% for liquid cloud altitude, vertical extent and column water content, and 1K for both surface and atmospheric profile temperatures. Those values are chosen as the target performances or maximum error of the IASI L2 products and the emissivity atlases, and arbitrarily for ozone profile and liquid cloud properties. Finally, K b is the Jacobian matrix of the b vector;
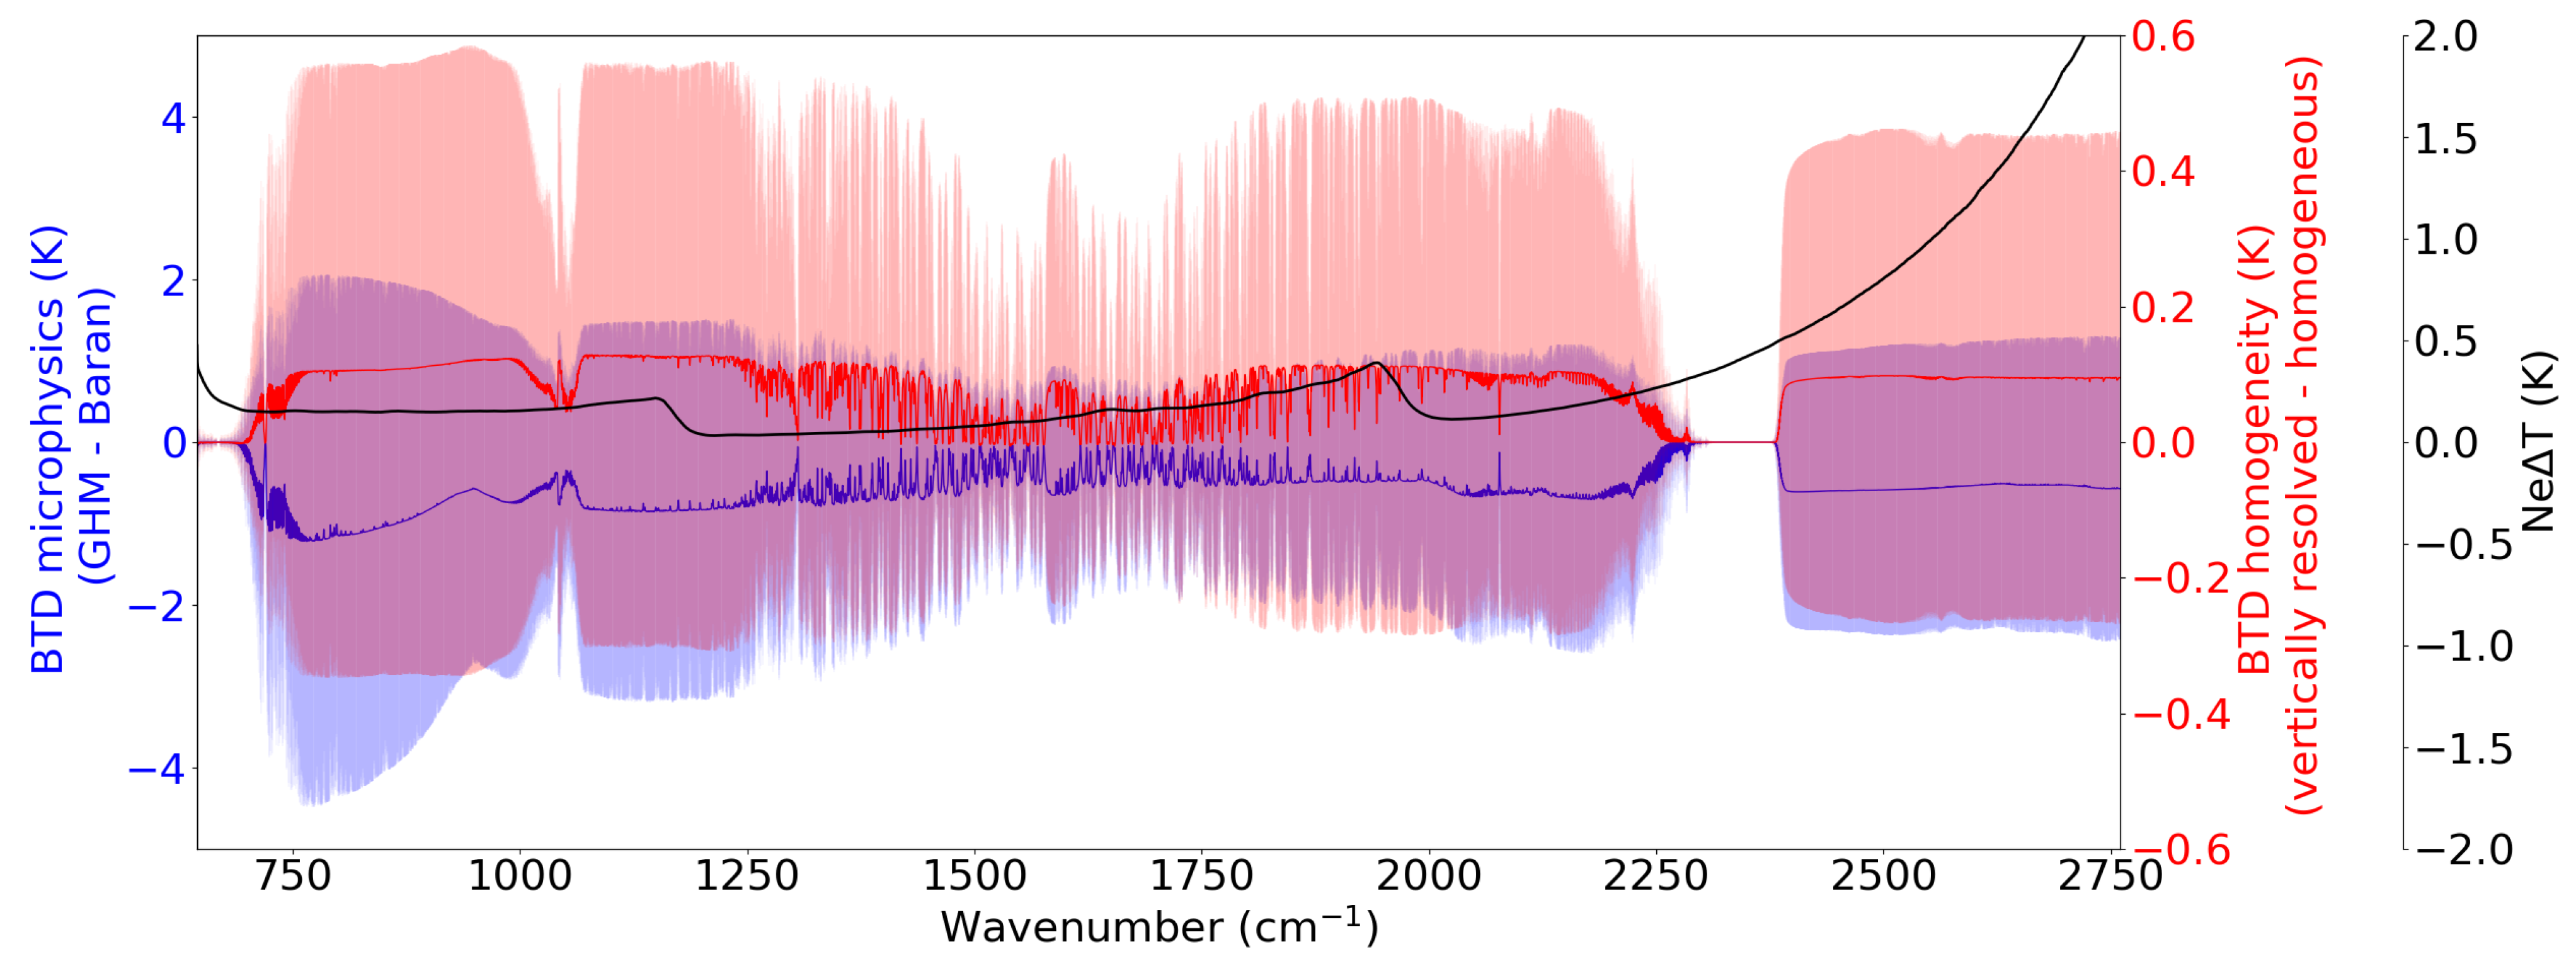
    S microphysics , which is considered a diagonal matrix, has been built from the standard deviation of the radiance calculated from two different microphysical models, namely the Baran et al. (2014) [50] model described in Section 2.2 and the General Habit Mixture (GHM) model of Baum et al. (2007) [48]. The Baum et al. (2007) [48] model depends on the effective diameter of the ice crystals. We inferred this quantity from I W C and cloud temperature using the Wyser (1998) parameterization [66,67]. This covariance matrix is introduced in order to take into account the error due to the microphysical diversity in the two models. Figure 3 illustrates the IASI Brightness Temperature Difference (BTD) calculated from the two models averaged over all the IC profiles. As one can see, this BTD is important compared to the radiometric noise of the instruments, particularly in the atmospheric window, showing the necessity of taking into account the error from the microphysics;
    S homogeneity , which is considered a diagonal matrix, has been built from the difference between the radiance calculated from the vertically inhomogeneous and homogeneous ice water content profiles. We have introduced this covariance matrix in order to take into account the error due to the simplest assumption of vertically homogeneous cloud made in the forward model for the retrieval. The top and bottom heights of the homogeneous clouds are set to the first layer that brings more than 7% of the I W P . This percentage has been found by minimizing the radiance difference between simulations with homogeneous and vertically resolved ice water content profiles. The I W P is then distributed over the layers enclosed by C T H and C B H . Figure 3 illustrates the corresponding IASI BTD averaged over all the IC profiles. This figure shows that the vertical homogeneity assumption is reasonable as the mean brightness temperature difference is below 0.2 K . Still, the error due to this simplification has to be accounted for as is of the same order of magnitude as the radiometric noise of the instruments;
  • S y has been generated from the radiometric noise of each instrument according to the value given in Clerbaux et al. (2009) [40] for IASI and halved for IASI-NG. Five off-diagonal terms due to the apodization are accounted for. Details on the IASI instrument noise specification can be found in Serio et al. (2020) [68]. The IASI radiometric noise converted to noise equivalent temperature difference ( N e Δ T ) for a reference temperature of 280 K is shown in Figure 3. As one can see, the radiometric noise is below 0.2 K from 650 to around 2200 cm 1 apart from the wavenumbers between 1800 and 2000 cm 1 where it reaches 0.3 K. For higher wavenumbers (above 2200 cm 1 ), due to the lower emission of the Earth, the radiometric noise increases to 3 K.
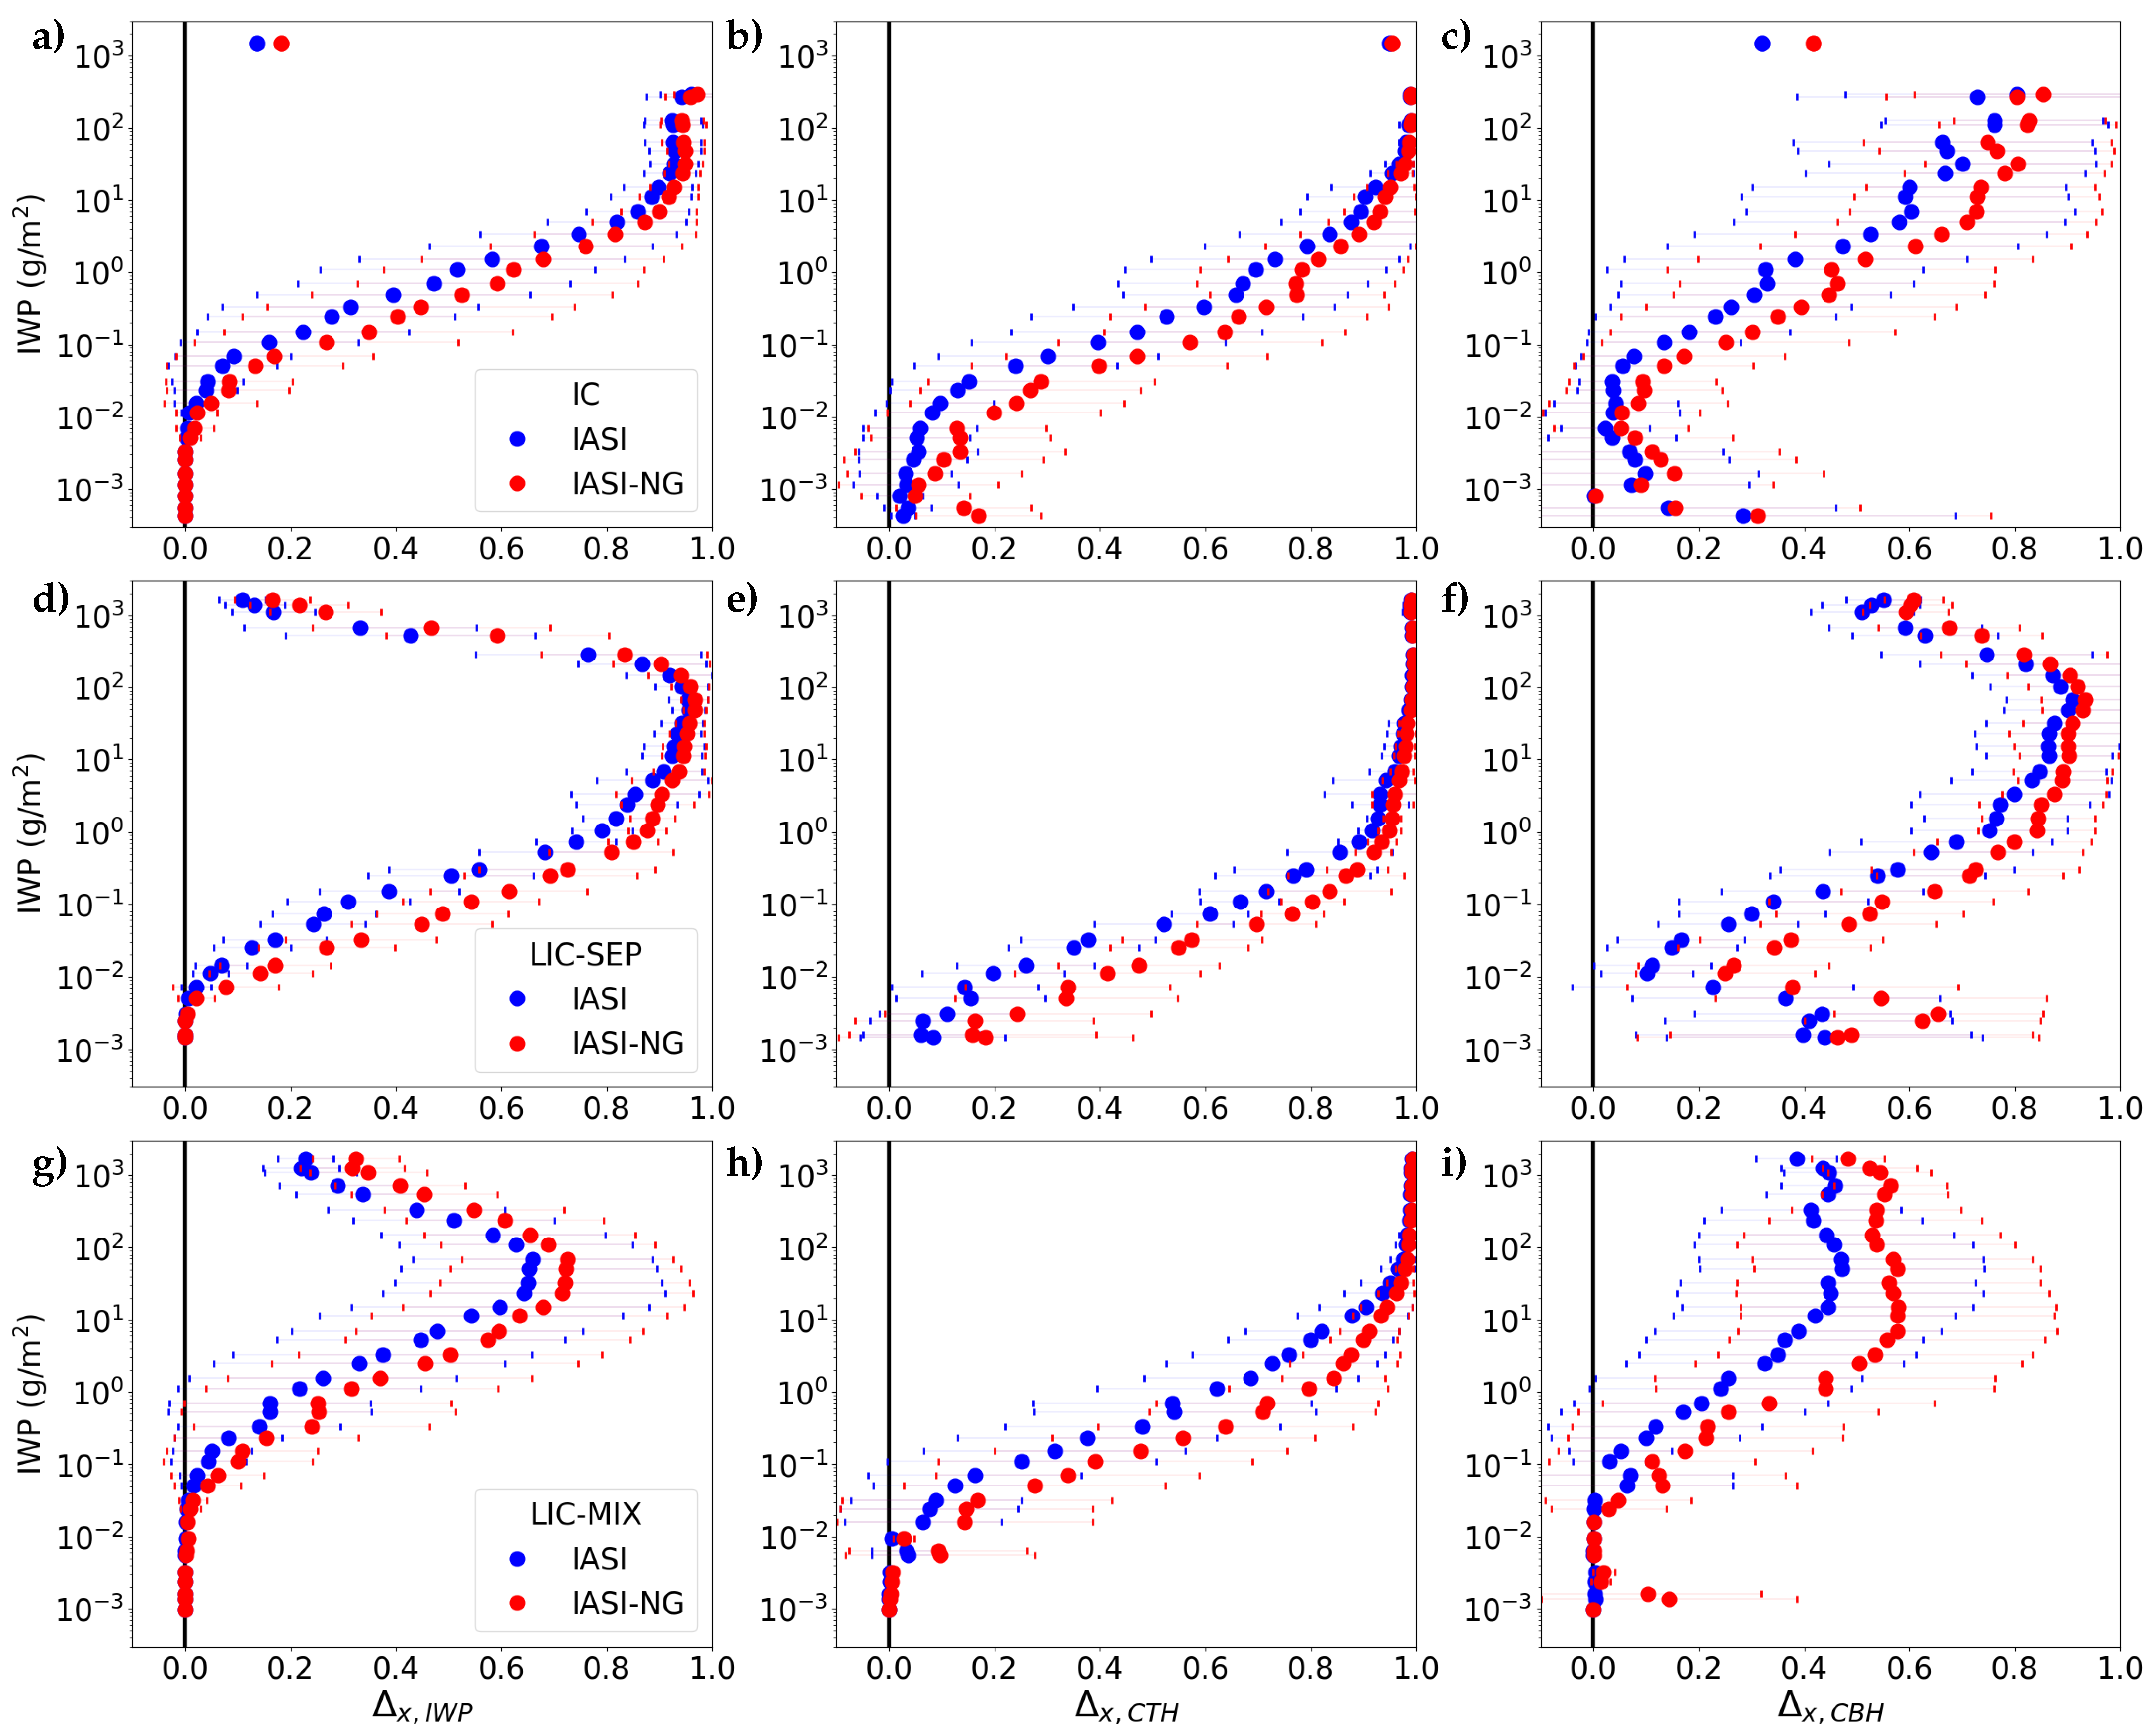
The square root of the diagonal elements of S x is the standard deviation σ x representing the expected error of the state vector elements given our a priori knowledge of the state specified by S a and the aforementioned S ε . Figure 4 shows the normalized error departure from the a priori, that is, given the information brought by the measurement, the improvement Δ x of the knowledge of the state vector x with respect to its a priori knowledge:
Δ x = σ a σ x σ a .
In this formulation, Δ x should vary between 0 and 1 and any improvement of the knowledge of x compared to its a priori knowledge will result in an increase of Δ x . We have computed Δ x for all the cloudy profiles of the database for both the IASI and IASI-NG instrumental configurations and averaged it by I W P bins (bins width of 0.77 in logarithmic space).
As seen in Figure 4, the improvement in our knowledge of the state vector increases with I W P , that is cloud opacity, until the signal saturation is reached meaning that the cloud is too thick to get information from the bottom part of the cloud layer. This saturation effect only affects the I W P and C B H parameters as one can see in the first columns of Figure 4a,d,g and third columns of Figure 4c,f,i. These clearly show that above an I W P of about 300 g / m 2 , Δ x , I W P and Δ x , C B H decrease ( Δ x lower than 0.75, for all categories) meaning that there is little or no information brought by the measurement on these parameters and the error reaches the prior error. This saturation effect does not appear on the C T H parameter as can be seen in Figure 4b,e,h because there is no need to get information from below the top level. The retrieval of C T H should be accurate for all cloud profile configurations as far as thick enough clouds are concerned with I W P greater than about 1 g / m 2 .
The information for the LIC-MIX cases (Figure 4g–i) is lower than for the two other categories (Figure 4a–f) with maximum a priori error improvement of about 65% for I W P and 45% for C B H parameters when considering the IASI characteristics. This figure shows a better expected retrieval quality using the IASI-NG measurements compared to the IASI ones thanks to a better spectral resolution and signal to noise ratio and, interestingly, a better accuracy reached for LIC-SEP (separated multi-layer, Figure 4d–f) cases than for IC (ice alone, Figure 4a–c) cases. This can be explained by the favorable surface and atmospheric conditions for the retrieval that lead to the formation of such a cloud configuration. The surface temperature as well as the temperature contrast between the cloud and surface are generally high with profiles mostly situated over the ocean. Finally, the retrieval of the cloud parameters should be accurate for cloud opacity extending from about 1 to 300 g / m 2 with both IASI and IASI-NG instruments. This range of I W P s represents about 80% of the ice cloud frequency according to Hong and Liu (2015) [7], the remaining 20% being equally distributed over thinner and thicker clouds.

3.2. Channel Selection

A selection of the IASI and IASI-NG channels that bring most information is required to get an affordable computational cost for the retrieval. The selection algorithm we considered is based on information theory from Shannon (1948) [69]. It defines the information H of a given channel by the reduction of entropy E after the measurement is made, and can be computed as follows [65]:
H = E ( P ( x ) ) E ( P ( x | y ) ) ,
where P ( x ) and P ( x | y ) are the prior and posterior pdf of the state vector, respectively. For a Gaussian distribution with covariance S , E ( P ) = 1 2 log 2 | S | , so that the information brought by the measurement is [65]:
H = 1 2 log 2 | S a S x 1 | ,
where S x is the covariance matrix defined in Section 3.1 considering the same model and measurement error.
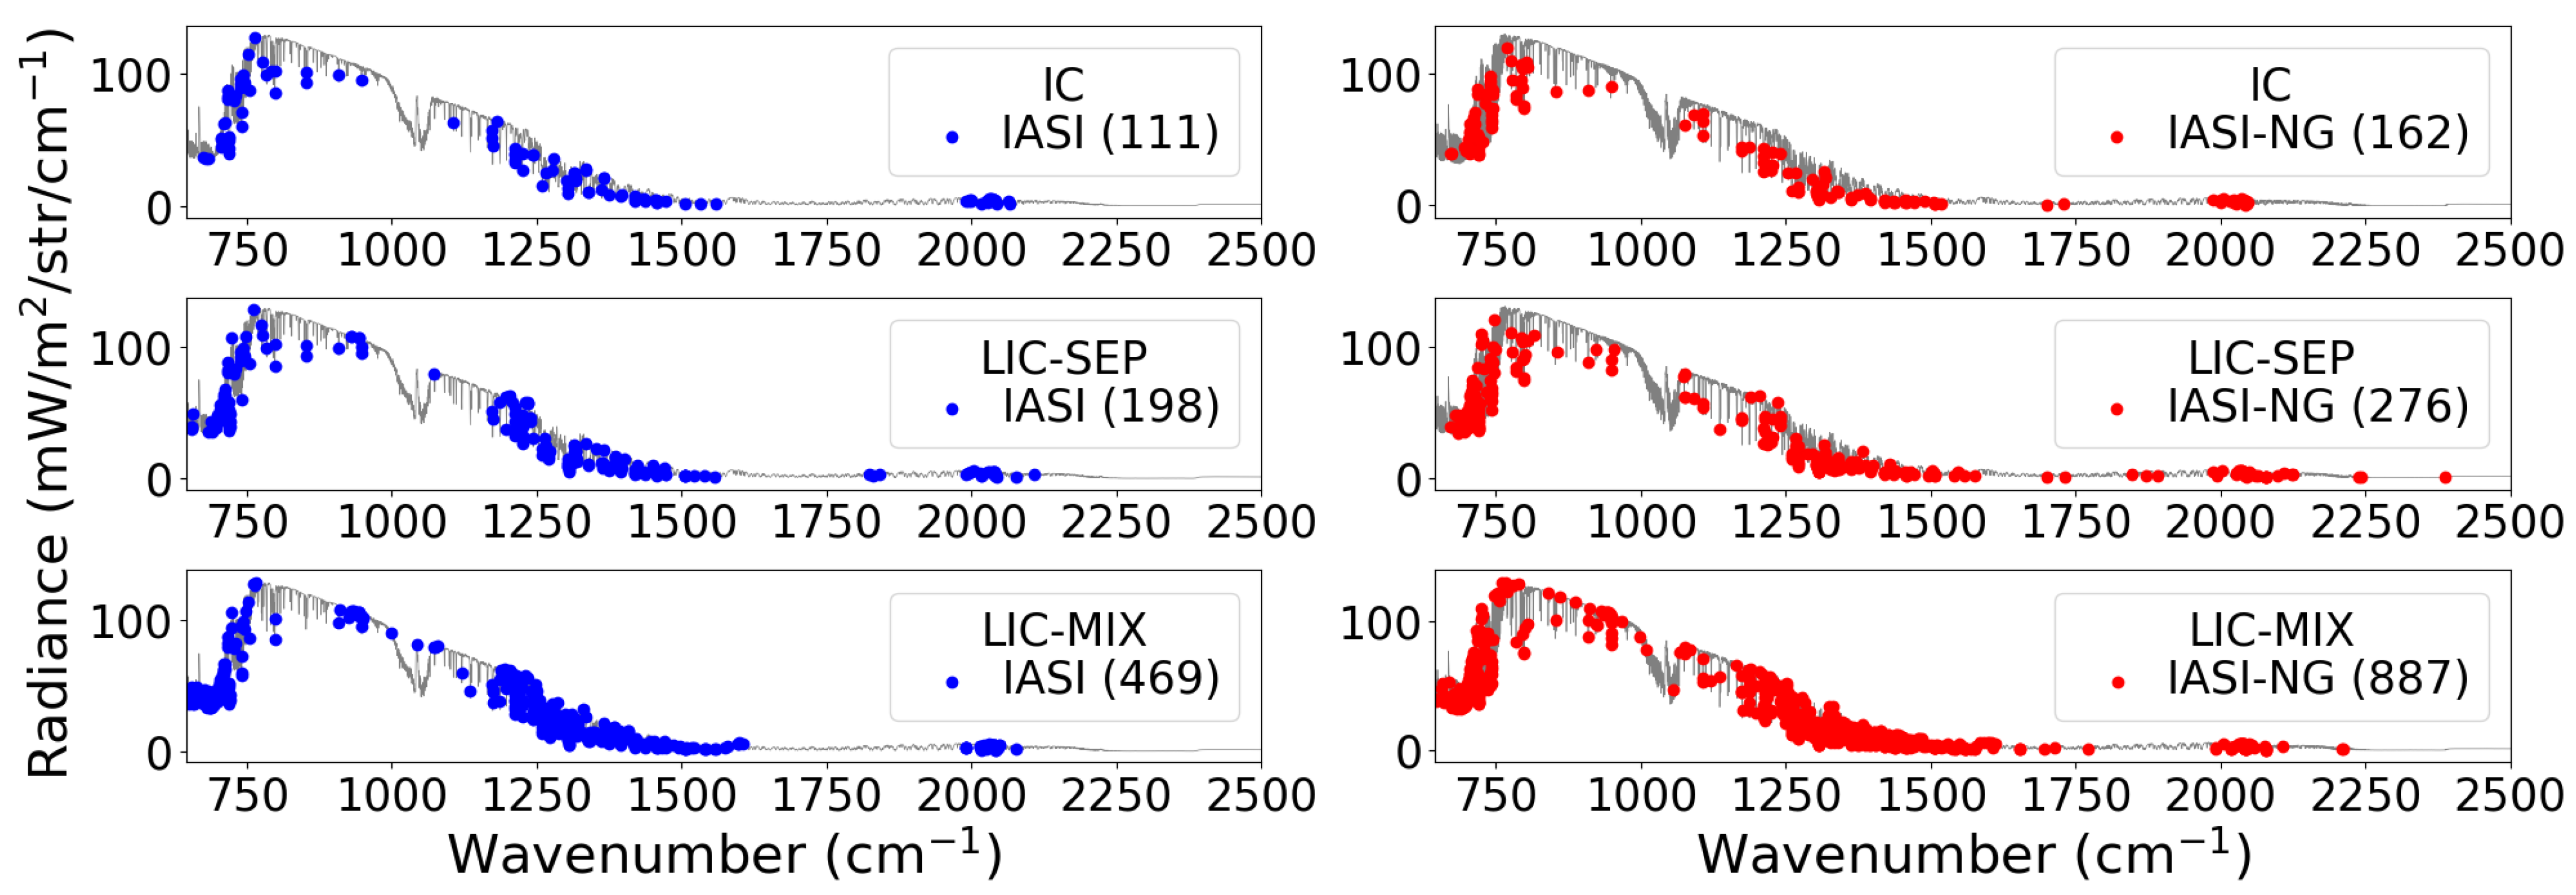
To find the subset of channels that provides the greatest amount of information, we used an algorithm fully explained by L’Ecuyer et al. (2006) [70]. It consists in creating an information spectrum with the information brought by each individual measurement j with respect to our prior knowledge of the retrieved state and to select the one which corresponds to the maximum. The covariance matrix is then modified to remove the redundant information already given by the previously selected channel on all the remaining channels. The process is repeated until the information brought by the chosen channel falls under the noise. We have applied this methodology to the whole subset of profiles corresponding to each category (i.e., IC, LIC-SEP, and LIC-MIX) and the selected channels are shown in Figure 5. The number of selected channels for each category are shown in brackets. The increasing number of selected channels in the LIC-MIX category is related to the number of different profiles compared to the other categories as each individual profile brings from 0 to 4 channels to the list before the information falls below the noise limit. The channels are mainly distributed on both sides of the atmospheric window in the CO2 and H2O absorption bands. Even if the highest sensitivity to ice cloud parameters is in the atmospheric window because of the smaller molecular absorption, it also corresponds to the highest sensitivity to the surface properties. The choice of those spectral regions represents a compromise between the sensitivities on cloud parameters and errors introduced by non-retrieved parameters missed-knowledge (e.g., surface temperature and emissivity). The chosen spectral regions are the same for IASI and IASI-NG, with a higher number of selected channels with IASI-NG as the selection process stops when the information is below the noise which is lower in the case of IASI-NG. This selection can be compared to the one of Martinet et al. (2014) [27] suited for cloud retrievals in Numerical Weather Prediction models. Both methodologies have chosen channels in the water vapor absorption band. However, there are more atmospheric window channels and less CO2 absorption band channels in Martinet et al. (2014) [27] selection than in ours. The main difference is that Martinet et al. (2014) [27] assumed the forward model error to be constant throughout the entire spectrum to select channels principally according to their sensitivity to cloud properties. By doing so, there is an increase in the number of window channels chosen by the algorithm.
We have then chosen a final subset of 150 channels for IASI and IASI-NG. This number has been chosen by studying the synthetic retrieval performances (optimal convergence rate and retrieval errors, see Section 4) with a variable number of channels randomly chosen from the initial list without differentiating the cloud categories (i.e., IC, LIC-SEP, and LIC-MIX). The list of the selected channels is available in Supplementary Materials.

4. Retrieval

The herein described optimal estimation retrieval algorithm (see Section 2.4) for ice cloud properties uses the Levenberg–Marcquardt method to find the minimum of the cost function (1). Following Rodgers (2000) [59], the Levenberg–Marquardt iteration applied to the optimal estimation retrieval is:
x i + 1 = x i + ( ( 1 + γ ) S a 1 + K i T S ε 1 K i ) 1 [ K i T S ε 1 ( y F ( x i ) ) S a 1 ( x i x a ) ] ,
where γ is a scale factor that allows to reduce the iteration step if the cost function increases instead of decreasing (that is, the i + 1 iterative estimate of the state vector is moving away from the solution). The Levenberg–Marcquardt minimization is required to deal with the non-linearity of the cost function due to the presence of clouds [59]. We took advantage of the information content analysis and ran the retrieval only using the selected channels presented in Section 3.2. The errors attributed to the non-retrieved parameters and the covariance matrices are identical to the ones presented in Section 3.1.

4.1. Climatological Constraint

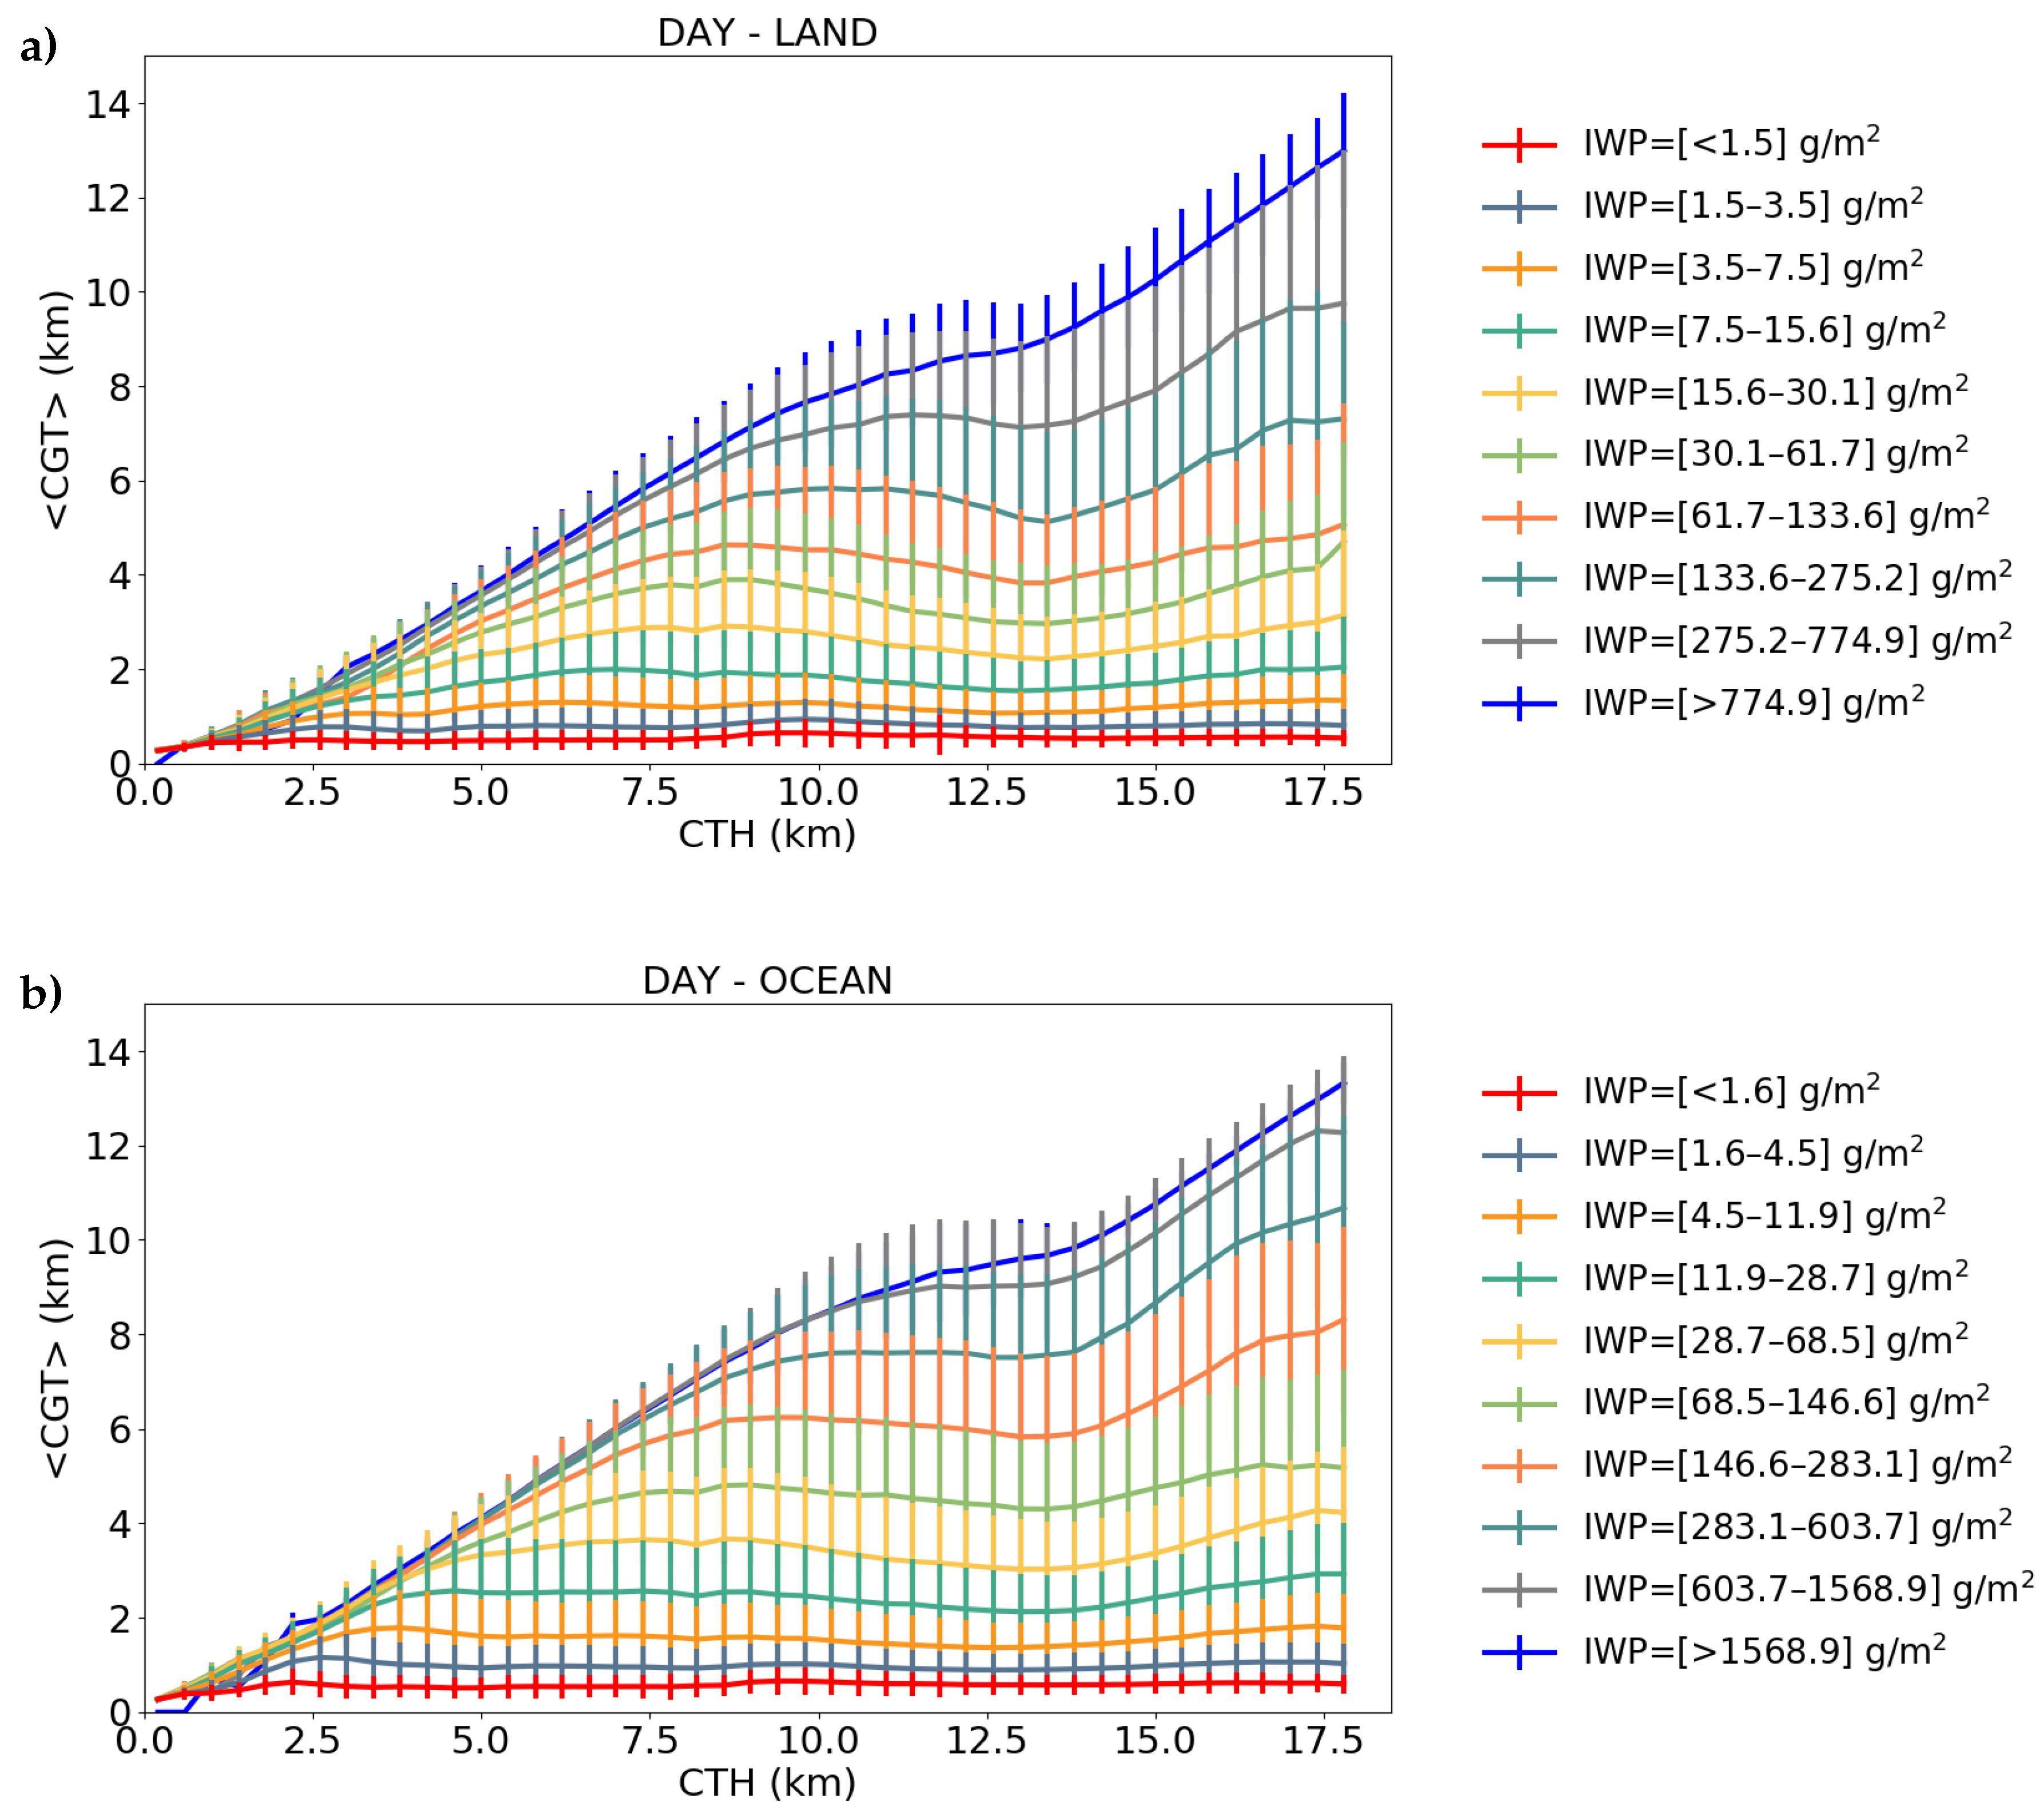
As highlighted by the information content analysis in Section 3.1, the retrieval of C B H might be challenging and the use of a climatology as a constraint in the retrieval algorithm would allow better convergence rates. To achieve this objective, we have chosen to use the information provided by the active instruments that make up the A-train. Indeed, the CALIOP/CALIPSO lidar [71] and the CPR/CloudSat radar [72] have been providing measurements of the vertical composition of clouds for more than 10 years. The combination of these two instruments has given rise to several algorithms for retrieving the solid water content profile [3,73,74,75]. We have used the products of the DARDAR (lidar radar) [3,76] algorithm, which makes use of the lidar, the radar and an infrared radiometer of the A-train, to develop a climatology that links the I W P , the C T H , and the cloud geometrical thickness ( C G T ) of ice clouds. This climatology, built from 6 years of measurements, allows one to express C G T as a function of C T H and I W P . We have built this climatology by differentiating lands and oceans as well as day and night. Examples of daytime climatologies are depicted in Figure 6. The C G T increases with I W P with a relatively small standard deviation for C T H which varies between about 2.5 and 18 km. We have compared the cloud geometric thickness ( C G T ) from the database with that obtained from the climatology. This comparison led us to apply a shift of 0.5 km to the climatology to compensate for the bias found in the profile database.
The previously defined climatology introduces some dependencies between C G T and the two others parameters we want to retrieve, that is C T H and I W P . If the optimal estimation method allows one to take into account any correlation between retrieved variables, this correlation has to be mathematically well known, which is not the case here. As the optimal estimation is based on Bayes theorem and normal pdfs, we have chosen to introduce a standardized variable u defined as:
u = C G T < C G T > σ C G T ,
which is assumed to follow a normal distribution with a mean value equal to 0 and a standard deviation of 1. In Equation (9), the average C G T ( < C G T > ) and its standard deviation ( σ C G T ) are given by the climatology for a given I W P and C T H . We have introduced this newly defined variable in the state vector which can now be defined as follows:
x = ln ( I W P ) ln ( C T H ) u .
This state vector formulation allows one to work with mathematically independent variables, the dependence being afterwards when computing the cloud geometrical extent from a given value of u, I W P , and C T H . In this formulation, the variable u can be seen as a correction factor of the climatology to best match the measured signal, knowing I W P and C T H .

4.2. Retrieval Results from Synthetic Radiances

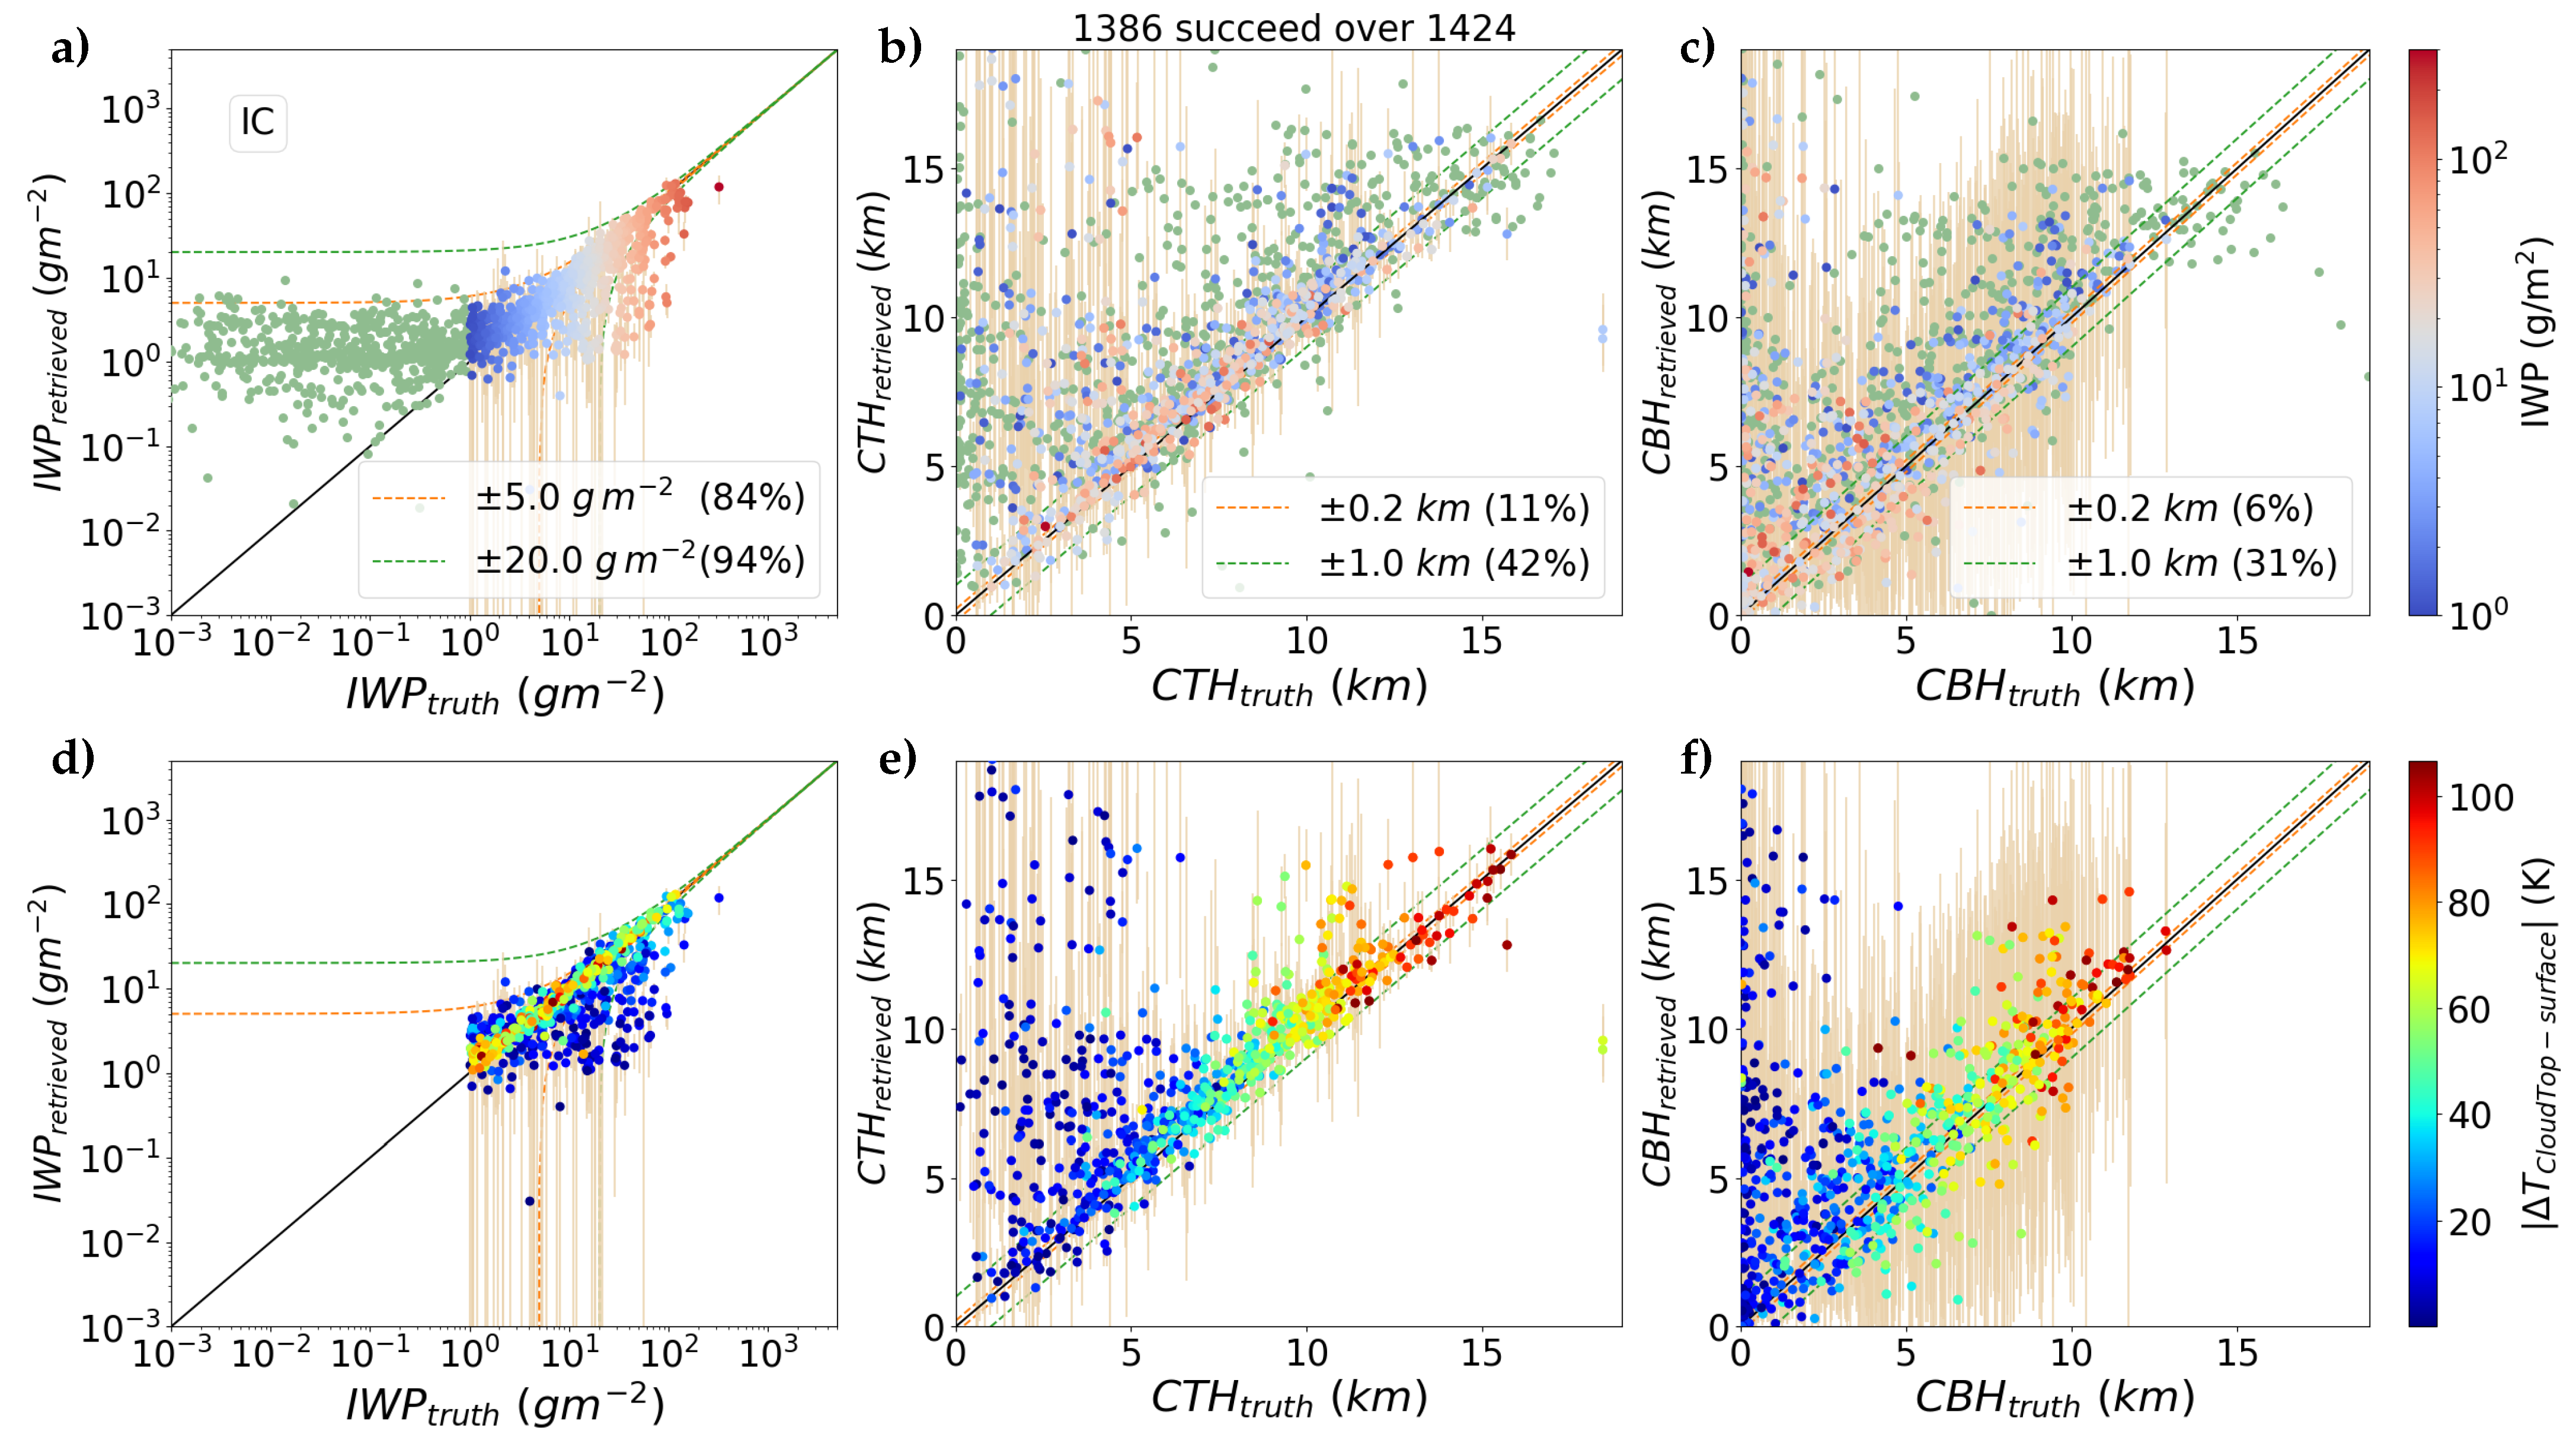
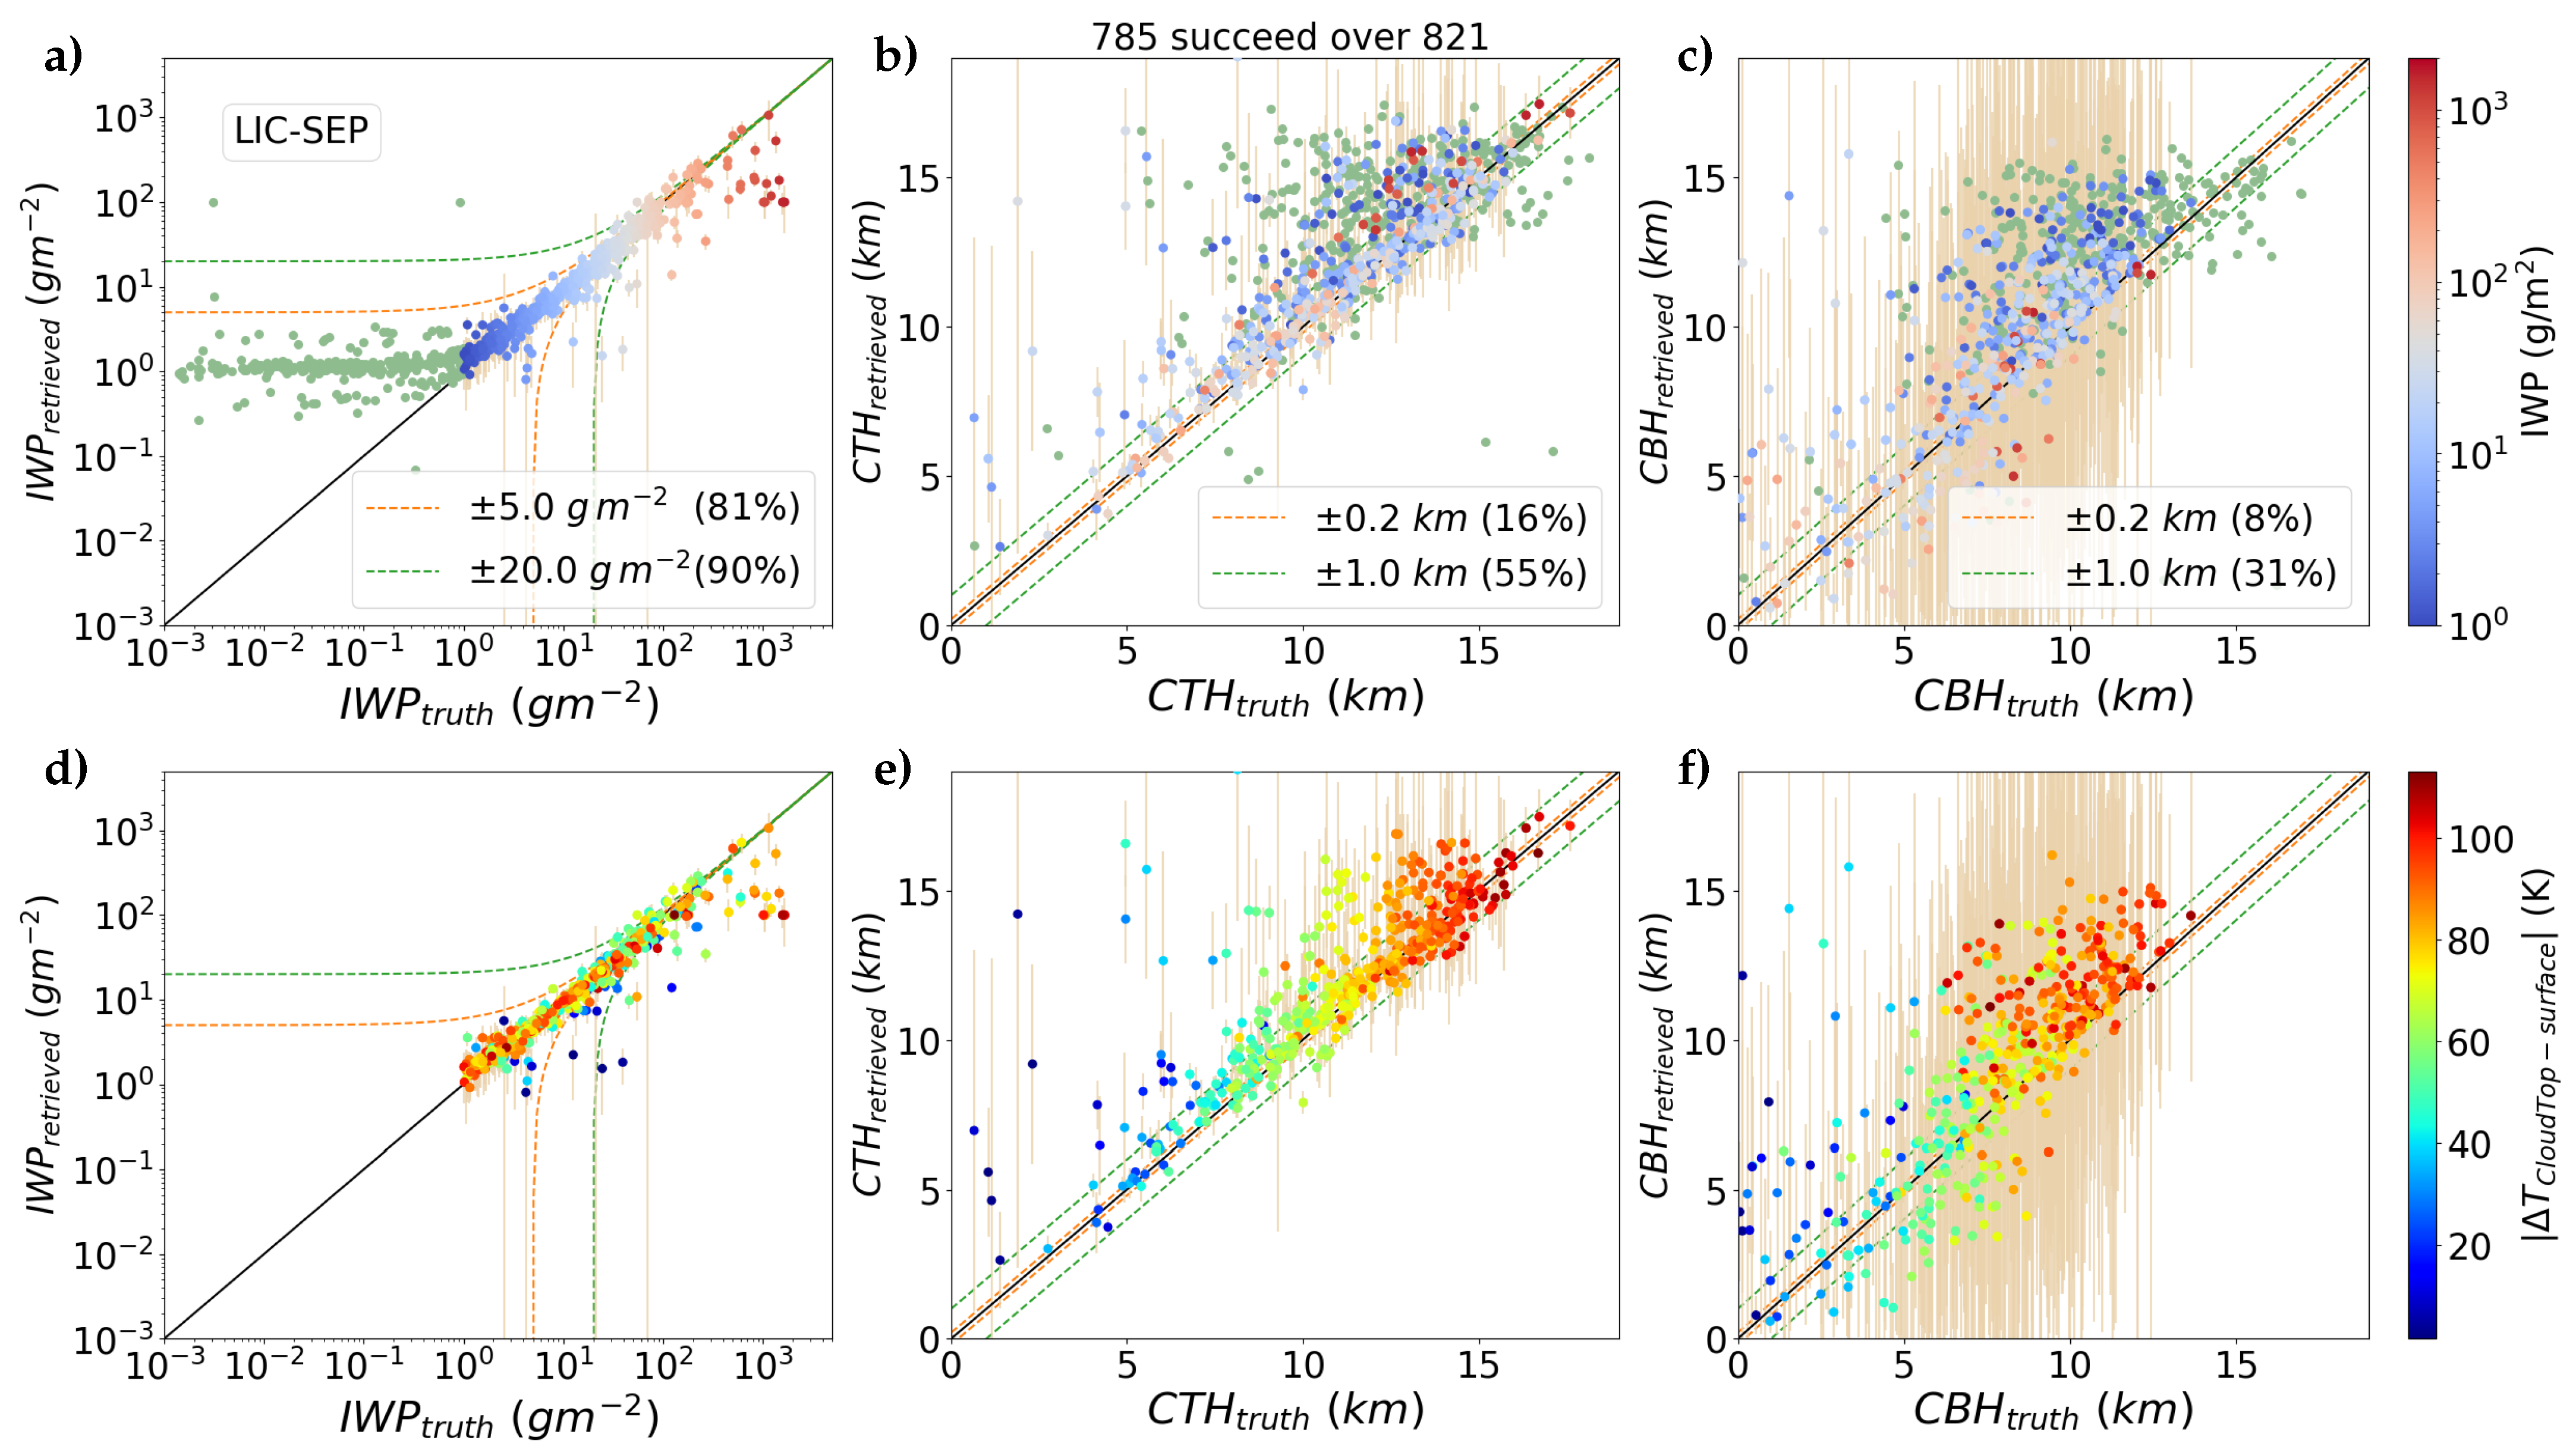
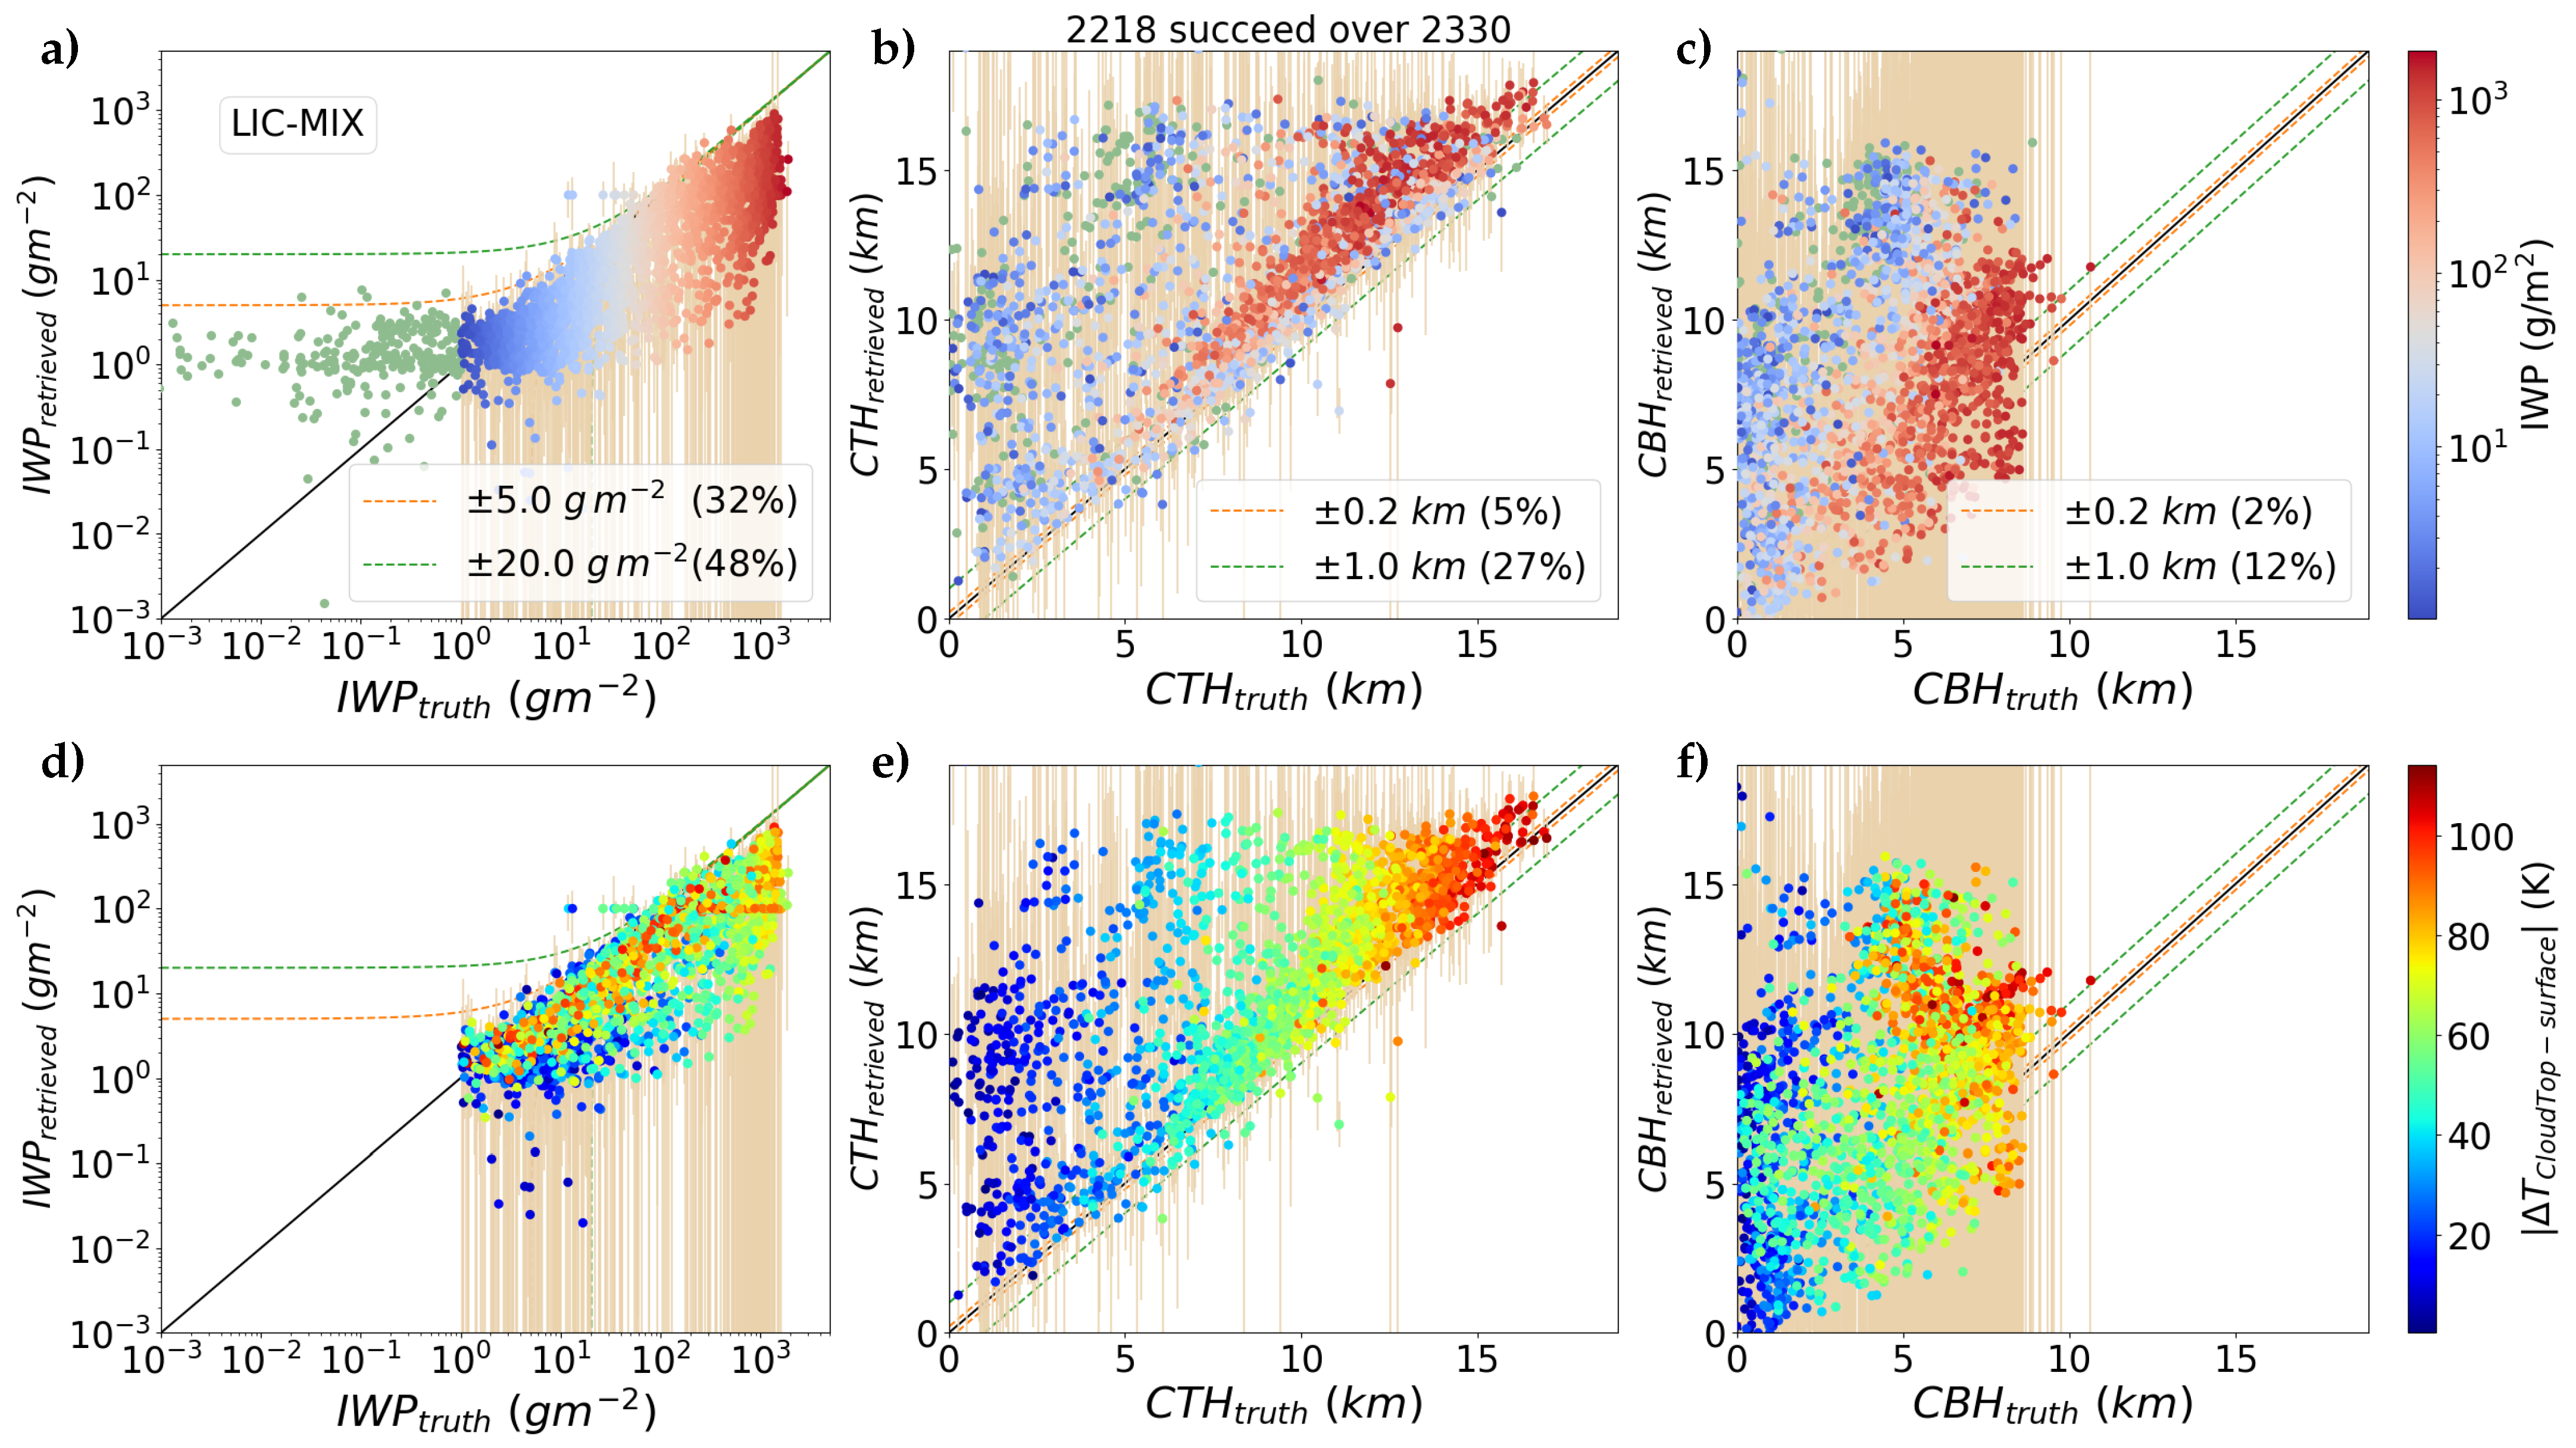
The performance of the retrieval algorithm is tested against IASI and IASI-NG synthetic measurements generated from the vertically inhomogeneous diverse profile database with a randomly added noise from the radiometric noise of each instrument [40]. The corresponding IASI and IASI-NG pixel is considered to be overcast (cloud fraction equal to 1). This assumption underestimates the model error accounted for in S F by ignoring the uncertainty due to the spatial inhomogeneity that would be encountered in a real retrieval. Indeed, the IASI field of view is quite large compared to cloud formations (from 12 km in diameter for nadir viewing to 39 km for maximum off-nadir field of view for a satellite altitude of 840 km). In this study, we did not introduce any bias between atmospheric profiles used to generate the synthetic observations and the one used in the retrieval process. Figure 7, Figure 8 and Figure 9 illustrate the distribution of the retrieved ice cloud properties with respect to the truth considering IASI characteristics. The convergence rate reached by the algorithm (the convergence is achieved when the normalized cost function falls below 1) is satisfactory with 1386 converged profiles over 1424 for IC (97%), 785 over 821 for LIC-SEP (95%), and 2218 over 2330 for LIC-MIX (95%). We have also added to these figures the goal and threshold requirements laid out by the Global Climate Observing System (GCOS) Implementation Plan and the Word Meteorological Organization (WMO) Observing Systems Capability Analysis and Review Tool (OSCAR, see https://www.wmo-sat.info/oscar/—last accessed on 15 December 2020). This database is an official repository of requirements for observations of physical variables in support of WMO programs. The “threshold” is the minimum requirement to be met to ensure that data are useful, and the “goal” is an ideal requirement above which further improvements are not necessary.
Concerning the I W P , not surprisingly, when the opacity of the cloud is very low (typically for sub-visible cirrus clouds with I W P < 1 g / m 2 or visible optical depth O D < 0.02 represented by green dots in Figure 7, Figure 8 and Figure 9a), the results are not very good and always converge to a value around 1 g / m 2 showing the limit of passive infrared observations to characterize very thin clouds. However, when the cloud is opaque enough (i.e., I W P between about 1 to 300 g / m 2 or O D between about 0.02 and 8 as indicated by the information content in Section 3), the estimated I W P is rather good. Some cases still show bad comparison and can generally be attributed to a small temperature contrast between the cloud and surface shown in Figure 7, Figure 8 and Figure 9d. It is interesting to point out that 94% of the estimated I W P lie in the OSCAR threshold in the IC (Figure 7a) and 90% in the LIC-SEP case (Figure 8a). This proportion decreases to 48% for the LIC-MIX category (Figure 9a). In terms of error on I W P , the OSCAR threshold is 20 g / m 2 .
When looking at the C T H parameter in Figure 7, Figure 8 and Figure 9b,e, the retrieval is close to the truth in most of the cases for all the categories with I W P greater than 1 g / m 2 . Again in general, a bad comparison with the truth is attributed to cases that present a small temperature contrast between the cloud and surface. For 27% of the retrievals, the gap between the truth and retrieved value is smaller than the OSCAR threshold for the LIC-MIX category (Figure 9b), 55% for LIC-SEP (Figure 8b), and 42% for IC (Figure 7b). In terms of error on C T H , the OSCAR threshold is 1 km. These results clearly show the good behavior of the algorithm for the IC and LIC-SEP categories.
Concerning the C B H parameter whose retrievals are represented in Figure 7, Figure 8 and Figure 9c,f, the introduction of the climatology improved the convergence rate (not shown) but results are however not as good as for the two previous parameters. In the IC (Figure 7c,f) and LIC-SEP cases (Figure 8c,f), the comparison with the truth is satisfactory especially when both the temperature contrast and cloud opacity are large enough. For those configurations, 31% of the retrievals lie in the OSCAR threshold. The presence of a mixed liquid cloud layer (Figure 9c,f) makes the retrieval of this parameter much more difficult (12% of the retrievals lie in the OSCAR threshold). For the C B H variable, the OSCAR threshold is 1 km.
Figure 7, Figure 8 and Figure 9 highlight the algorithm performances for each retrieved parameters and clearly show the type of clouds (given by their total amount of ice) and cloud column configuration (IC, LIC-SEP, or LIC-MIX) for which one can get satisfactory estimated cloud parameters. These results clearly confirm the good behavior of the algorithm for the IC and LIC-SEP categories (i.e., ice only or ice layer with a separated liquid cloud underneath). According to the ECMWF 137-levels dataset selected using the cloud condensate sample (i.e., representative of the total amount of condensed water in the atmospheric column), the LIC-MIX category, which is the one that leads to the poorer results, is the most frequent in the atmosphere (50% of the cloudy skies). The LIC-SEP and IC cases represent 17.5% and 4.5%, respectively. The retrieval of I W P and C T H are rather encouraging, whereas the retrieval of C B H appears to be more difficult especially when there is a mixed liquid cloud layer underneath. Those results are in good agreement with the information content analysis.
Again, as expected from the information content analysis, using IASI-NG instead of IASI slightly improves the retrieval accuracy but not the overall performance (not shown). For example, for the IC configuration and only for a cloud whose I W P is between 1 and 300 g / m 2 , the mean errors using IASI are 3.1 g / m 2 for I W P , 2.2 km for C T H , and 4.6 km for C B H whereas the error obtained with IASI-NG are 2.5 g / m 2 for I W P , 1.8 km for C T H , and 4.2 km for C B H . The convergence rate is similar to the one of IASI with 98% for IC configuration and 97% for both LIC-SEP and LIC-MIX configurations.

5. Discussion and Conclusions

In this paper, which deals with the capability of thermal hyperspectral measurements for the study of ice clouds, we have shown the potential of instruments like IASI and IASI-NG to retrieve parameters such as the integrated ice water content, layer position, and vertical extent of these clouds.
The use of information theory applied to a database that is representative of the diversity of the cloud column and an accurate description of the errors introduced by the forward model as well as the measurement, allowed us to obtain the limits of this type of observation to get accurate information on cloud parameters in terms of opacity (given by the total amount of ice or I W P ) of the observed cloudy layer. We were able to show that the I W P should be adequately retrieved for a range of I W P s between about 1 and 300 g / m 2 , and for a single-layer ice cloud with no liquid cloud beneath or when a clear separation exists between the ice cloud and water cloud. The information concerning the cloud top height ( C T H ) should be very good whatever the cloud column configuration and opacity for I W P above about 1 g / m 2 . The cloud bottom height ( C B H ) should on the contrary be more difficult to retrieve with estimated errors no better than 30% because of the lower sensitivity of the measurement to the bottom layers of the cloud. Using the IASI-NG measurements instead of the IASI ones allows better expected retrieval quality thanks to a better spectral resolution and signal to noise ratio.
As we want to develop a fast algorithm with reasonable computing times, and because each channel of a hyperspectral measurement does not provide independent information, we have used information theory to select a set of 150 channels that can provide enough information to get an accurate estimation of the cloud parameters previously defined.
Finally, a retrieval algorithm based on the optimal estimation theory has been developed and tested. Its originality lies in the use of a climatology to constrain the cloud bottom height. This climatology has been developed from the level 2 products provided by the DARDAR algorithm [3,76] which uses the synergy of the CALIOP/CALIPSO lidar, the CPR/CloudSat radar and the MODIS/Aqua instrument to retrieve an ice content profile, and allows one to relate, for different ice content classes ( I W P ), the vertical extent ( C G T ) of the cloudy layer to its top altitude ( C T H ). The aforementioned climatology has improved the performances of the algorithm, especially concerning the estimation of the vertical extent (not shown). The results of the retrieval algorithm are in agreement with those obtained by the information content study. In general, the results are better for a single-layered ice cloud or when a liquid water cloud is present underneath but well separated from the ice cloud (IC and LIC-SEP categories), with a high convergence rate (of the order of 95%). However, the performance of the algorithm is much poorer when the cloud is too thin or when the temperature contrast with the surface is low. In the IC and LIC-SEP categories, the total amount of ice in the column is generally well estimated for clouds with I W P ranging from about 1 to 300 g / m 2 , with about 90% of the cases whose estimate satisfies the threshold limits given by OSCAR. The cloud top height is also well estimated whatever the category and opacity of the observed ice cloud (if I W P is greater than 1 g / m 2 and the temperature contrast with the ground is significant) with between 40 and 50% of the cases (depending on the category) that satisfy the limits given by OSCAR. Results concerning the cloud bottom height are not as good as the ones of the two other parameters but are anyway acceptable for clouds with I W P between about 1 and 300 g / m 2 with approximately 30% of the cases that lie in the OSCAR threshold. Results obtained from LIC-MIX categories show less agreement with the truth as 48% of the retrieval lie in the OSCAR threshold for I W P , 27% for C T H , and 12% for C B H . Using the IASI-NG measurements instead of the IASI ones slightly improves the retrieval accuracy without changing the overall performances of the algorithm.
The objective is now to apply this algorithm to the real measurements of the IASI instruments (A, B, and C) in order to evaluate its overall performance by statistically comparing the results to the retrievals made from active measurements and in a punctual manner thanks to the numerous measurement campaigns that have taken place over the last decade.

Supplementary Materials

The following are available online at https://www.mdpi.com/2072-4292/13/1/116/s1. Table S1: List of the 150 selected channels and associated wavenumbers (v) for IASI and IASI-NG.

Author Contributions

Conceptualization, L.C.-L., J.V. and A.J.B.; methodology, L.C.-L., M.C., J.V. and A.J.B.; software, L.L., M.C.; validation, L.L., L.C.-L. and M.C.; formal analysis, L.L., L.C.-L. and M.C.; investigation, L.L., L.C.-L. and M.C.; data curation, L.C.-L., J.V.; writing–original draft preparation, L.L. and L.C.-L.; writing–review and editing, all; visualization, L.L., L.C.-L. and M.C.; supervision, L.C.-L. and P.D.; project administration, L.C.-L. and P.D.; funding acquisition, L.C.-L. and P.D. All authors have read and agreed to the published version of the manuscript.

Funding

The authors thank the Région Hauts-de-France, and the Ministère de l’Enseignement Supérieur et de la Recherche (CPER Climibio), and the European Fund for Regional Economic Development for their financial support.

Conflicts of Interest

The authors declare no conflict of interest.

References

  1. Stocker, T.F.; Qin, D.; Plattner, G.K.; Tignor, M.; Allen, S.K.; Boschung, J.; Nauelsand, A.; Xia, Y.; Bex, V.; Midgley, P.M.E. IPCC, 2013: Climate Change 2013: The Physical Science Basis. Contribution of Working Group I to the Fifth Assessment Report of the Intergovernmental Panel on Climate Change; Cambridge University Press: Cambridge, UK; New York, NY, USA, 2013; p. 1535. [Google Scholar]
  2. Zhang, Y.; Macke, A.; Albers, F. Effect of crystal size spectrum and crystal shape on stratiform cirrus radiative forcing. Atmos. Res. 1999, 52, 59–75. [Google Scholar] [CrossRef]
  3. Delanoë, J.; Hogan, R.J. A variational scheme for retrieving ice cloud properties from combined radar, lidar, and infrared radiometer. J. Geophys. Res. Atmos. 2008, 113. [Google Scholar] [CrossRef] [Green Version]
  4. Deng, M.; Mace, G.G.; Wang, Z.; Okamoto, H. Tropical Composition, Cloud and Climate Coupling Experiment validation for cirrus cloud profiling retrieval using CloudSat radar and CALIPSO lidar. J. Geophys. Res. Atmos. 2010, 115. [Google Scholar] [CrossRef] [Green Version]
  5. Deng, M.; Mace, G.G.; Wang, Z.; Lawson, R.P. Evaluation of several A-Train ice cloud retrieval products with in situ measurements collected during the SPARTICUS campaign. J. Appl. Meteorol. Climatol. 2013, 52, 1014–1030. [Google Scholar] [CrossRef] [Green Version]
  6. Sourdeval, O.; Gryspeerdt, E.; Krämer, M.; Goren, T.; Delanoë, J.; Afchine, A.; Hemmer, F.; Quaas, J. Ice crystal number concentration estimates from lidar–radar satellite remote sensing–Part 1: Method and evaluation. Atmos. Chem. Phys. 2018, 18, 14327–14350. [Google Scholar] [CrossRef] [Green Version]
  7. Hong, Y.; Liu, G. The characteristics of ice cloud properties derived from CloudSat and CALIPSO measurements. J. Clim. 2015, 28, 3880–3901. [Google Scholar] [CrossRef]
  8. Hong, Y.; Liu, G.; Li, J.L. Assessing the radiative effects of global ice clouds based on CloudSat and CALIPSO measurements. J. Clim. 2016, 29, 7651–7674. [Google Scholar] [CrossRef]
  9. Platnick, S.; Meyer, K.G.; King, M.D.; Wind, G.; Amarasinghe, N.; Marchant, B.; Arnold, G.T.; Zhang, Z.; Hubanks, P.A.; Holz, R.E.; et al. The MODIS cloud optical and microphysical products: Collection 6 updates and examples from Terra and Aqua. IEEE Trans. Geosci. Remote Sens. 2016, 55, 502–525. [Google Scholar] [CrossRef] [Green Version]
  10. Hong, G.; Yang, P.; Gao, B.C.; Baum, B.A.; Hu, Y.X.; King, M.D.; Platnick, S. High cloud properties from three years of MODIS Terra and Aqua collection-4 data over the tropics. J. Appl. Meteorol. Climatol. 2007, 46, 1840–1856. [Google Scholar] [CrossRef]
  11. Yang, P.; Zhang, L.; Hong, G.; Nasiri, S.L.; Baum, B.A.; Huang, H.L.; King, M.D.; Platnick, S. Differences between collection 4 and 5 MODIS ice cloud optical/microphysical products and their impact on radiative forcing simulations. IEEE Trans. Geosci. Remote Sens. 2007, 45, 2886–2899. [Google Scholar] [CrossRef]
  12. Sourdeval, O.; C.-Labonnote, L.; Baran, A.J.; Brogniez, G. A methodology for simultaneous retrieval of ice and liquid water cloud properties. Part I: Information content and case study. Q. J. R. Meteorol. Soc. 2015, 141, 870–882. [Google Scholar] [CrossRef]
  13. Sourdeval, O.; C.-Labonnote, L.; Baran, A.J.; Mülmenstädt, J.; Brogniez, G. A methodology for simultaneous retrieval of ice and liquid water cloud properties. Part 2: Near-global retrievals and evaluation against A-Train products. Q. J. R. Meteorol. Soc. 2016, 142, 3063–3081. [Google Scholar] [CrossRef] [Green Version]
  14. Kelly, G.; Thépaut, J.N. Evaluation of the impact of the space component of the Global Observing System through Observing System Experiments. ECMWF Newsl. 2007, 113, 16–28. [Google Scholar]
  15. Collard, A.D.; McNally, A.P. The assimilation of infrared atmospheric sounding interferometer radiances at ECMWF. Q. J. R. Meteorol. Soc. 2009, 135, 1044–1058. [Google Scholar] [CrossRef]
  16. Guidard, V.; Fourrié, N.; Brousseau, P.; Rabier, F. Impact of IASI assimilation at global and convective scales and challenges for the assimilation of cloudy scenes. Q. J. R. Meteorol. Soc. 2011, 137, 1975–1987. [Google Scholar] [CrossRef]
  17. Siméoni, D.; Singer, C.; Chalon, G. Infrared atmospheric sounding interferometer. Acta Astronaut. 1997, 40, 113–118. [Google Scholar] [CrossRef]
  18. McNally, A.P. A note on the occurrence of cloud in meteorologically sensitive areas and the implications for advanced infrared sounders. Q. J. R. Meteorol. Soc. 2002, 128, 2551–2556. [Google Scholar] [CrossRef]
  19. Pavelin, E.G.; English, S.J.; Eyre, J.R. The assimilation of cloud-affected infrared satellite radiances for numerical weather prediction. Q. J. R. Meteorol. Soc. 2008, 134, 737–749. [Google Scholar] [CrossRef]
  20. McNally, A.P. The direct assimilation of cloud-affected satellite infrared radiances in the ECMWF 4D-Var. Q. J. R. Meteorol. Soc. 2009, 135, 1214–1229. [Google Scholar] [CrossRef]
  21. Martinet, P.; Fourrié, N.; Guidard, V.; Rabier, F.; Montmerle, T.; Brunel, P. Towards the use of microphysical variables for the assimilation of cloud-affected infrared radiances. Q. J. R. Meteorol. Soc. 2013, 139, 1402–1416. [Google Scholar] [CrossRef]
  22. Zhou, D.K.; Smith, W.L., Sr.; Liu, X.; Larar, A.M.; Huang, H.L.A.; Li, J.; McGill, M.J.; Mango, S.A. Thermodynamic and cloud parameter retrieval using infrared spectral data. Geophys. Res. Lett. 2005, 32. [Google Scholar] [CrossRef] [Green Version]
  23. Zhou, D.K.; Smith, W.L., Sr.; Liu, X.; Larar, A.M.; Mango, S.A.; Huang, H.L. Physically retrieving cloud and thermodynamic parameters from ultraspectral IR measurements. J. Atmos. Sci. 2007, 64, 969–982. [Google Scholar] [CrossRef] [Green Version]
  24. Liu, X.; Zhou, D.K.; Larar, A.M.; Smith, W.L.; Schluessel, P.; Newman, S.M.; Taylor, J.P.; Wu, W. Retrieval of atmospheric profiles and cloud properties from IASI spectra using super-channels. Atmos. Chem. Phys. 2009, 9, 9121–9142. [Google Scholar] [CrossRef] [Green Version]
  25. Lavanant, L.; Fourrié, N.; Gambacorta, A.; Grieco, G.; Heilliette, S.; Hilton, F.I.; Kim, M.J.; McNally, A.P.; Nishihata, H.; Pavelin, E.G.; et al. Comparison of cloud products within IASI footprints for the assimilation of cloudy radiances. Q. J. R. Meteorol. Soc. 2011, 137, 1988–2003. [Google Scholar] [CrossRef]
  26. Martinet, P.; Fourrié, N.; Bouteloup, Y.; Bazile, E.; Rabier, F. Toward the improvement of short-range forecasts by the analysis of cloud variables from IASI radiances. Atmos. Sci. Lett. 2014, 15, 342–347. [Google Scholar] [CrossRef]
  27. Martinet, P.; Lavanant, L.; Fourrié, N.; Rabier, F.; Gambacorta, A. Evaluation of a revised IASI channel selection for cloudy retrievals with a focus on the Mediterranean basin. Q. J. R. Meteorol. Soc. 2014, 140, 1563–1577. [Google Scholar] [CrossRef]
  28. Stubenrauch, C.J.; Holz, R.; Chédin, A.; Mitchell, D.L.; Baran, A.J. Retrieval of cirrus ice crystal sizes from 8.3 and 11.1 m emissivities determined by the improved initialization inversion of TIROS-N Operational Vertical Sounder observations. J. Geophys. Res. Atmos. 1999, 104, 31793–31808. [Google Scholar] [CrossRef]
  29. Rädel, G.; Stubenrauch, C.J.; Holz, R.; Mitchell, D.L. Retrieval of effective ice crystal size in the infrared: Sensitivity study and global measurements from TIROS-N Operational Vertical Sounder. J. Geophys. Res. Atmos. 2003, 108. [Google Scholar] [CrossRef]
  30. Kahn, B.H.; Eldering, A.; Clough, S.A.; Fetzer, E.J.; Fishbein, E.; Gunson, M.R.; Lee, S.Y.; Lester, P.F.; Realmuto, V.J. Near micron-sized cirrus cloud particles in high-resolution infrared spectra: An orographic case study. Geophys. Res. Lett. 2003, 30. [Google Scholar] [CrossRef]
  31. August, T.; Klaes, D.; Schlüssel, P.; Hultberg, T.; Crapeau, M.; Arriaga, A.; O’Carroll, A.; Coppens, D.; Munro, R.; Calbet, X. IASI on Metop-A: Operational Level 2 retrievals after five years in orbit. J. Quant. Spectrosc. Radiat. Transf. 2012, 113, 1340–1371. [Google Scholar] [CrossRef]
  32. Huang, X.L.; Yung, Y.L.; Margolis, J.S. Use of high-resolution measurements for the retrieval of temperature and gas-concentration profiles from outgoing infrared spectra in the presence of cirrus clouds. Appl. Opt. 2003, 42, 2155–2165. [Google Scholar] [CrossRef] [PubMed] [Green Version]
  33. Huang, H.L.; Yang, P.; Wei, H.; Baum, B.A.; Hu, Y.; Antonelli, P.; Ackerman, S.A. Inference of ice cloud properties from high spectral resolution infrared observations. IEEE Trans. Geosci. Remote. Sens. 2004, 42, 842–853. [Google Scholar] [CrossRef] [Green Version]
  34. Wei, H.; Yang, P.; Li, J.; Baum, B.A.; Huang, H.L.; Platnick, S.; Hu, Y.; Strow, L. Retrieval of semitransparent ice cloud optical thickness from Atmospheric Infrared Sounder (AIRS) measurements. IEEE Trans. Geosci. Remote Sens. 2004, 42, 2254–2267. [Google Scholar] [CrossRef]
  35. Wang, C.; Yang, P.; Platnick, S.; Heidinger, A.K.; Baum, B.A.; Greenwald, T.; Zhang, Z.; Holz, R.E. Retrieval of ice cloud properties from AIRS and MODIS observations based on a fast high-spectral-resolution radiative transfer model. J. Appl. Meteorol. Climatol. 2013, 52, 710–726. [Google Scholar] [CrossRef]
  36. Wu, W.; Liu, X.; Zhou, D.K.; Larar, A.M.; Yang, Q.; Kizer, S.H.; Liu, Q. The application of PCRTM physical retrieval methodology for IASI cloudy scene analysis. IEEE Trans. Geosci. Remote Sens. 2017, 55, 5042–5056. [Google Scholar] [CrossRef]
  37. Crevoisier, C.; Clerbaux, C.; Guidard, V.; Phulpin, T.; Armante, R.; Barret, B.; Camy-Peyret, C.; Chaboureau, J.-P.; Coheur, P.-F.; Crépeau, L.; et al. Towards IASI-New Generation (IASI-NG): Impact of improved spectral resolution and radiometric noise on the retrieval of thermodynamic, chemistry and climate variables. Atmos. Meas. Tech. 2014, 7, 4367–4385. [Google Scholar] [CrossRef] [Green Version]
  38. Hilton, F.; Armante, R.; August, T.; Barnet, C.; Bouchard, A.; Camy-Peyret, C.; Capelle, V.; Clarisse, L.; Clerbaux, C.; Coheur, P.F.; et al. Hyperspectral Earth observation from IASI: Five years of accomplishments. Bull. Am. Meteorol. Soc. 2012, 93, 347–370. [Google Scholar] [CrossRef]
  39. Prunet, P.; Thépaut, J.N.; Cassé, V. The information content of clear sky IASI radiances and their potential for numerical weather prediction. Q. J. R. Meteorol. Soc. 1998, 124, 211–241. [Google Scholar] [CrossRef]
  40. Clerbaux, C.; Boynard, A.; Clarisse, L.; George, M.; Hadji-Lazaro, J.; Herbin, H.; Hurtmans, D.; Pommier, M.; Razavi, A.; Turquety, S.; et al. Monitoring of atmospheric composition using the thermal infrared IASI/MetOp sounder. Atmos. Chem. Phys. 2009, 9, 6041–6054. [Google Scholar] [CrossRef] [Green Version]
  41. Baran, A.J. The dependence of cirrus infrared radiative properties on ice crystal geometry and shape of the size-distribution function. Q. J. R. Meteorol. Soc. 2005, 131, 1129–1142. [Google Scholar] [CrossRef]
  42. Hong, G.; Yang, P.; Huang, H.L.; Baum, B.A.; Hu, Y.; Platnick, S. The sensitivity of ice cloud optical and microphysical passive satellite retrievals to cloud geometrical thickness. IEEE Trans. Geosci. Remote. Sens. 2007, 45, 1315–1323. [Google Scholar] [CrossRef]
  43. Dubuisson, P.; Giraud, V.; Pelon, J.; Cadet, B.; Yang, P. Sensitivity of thermal infrared radiation at the top of the atmosphere and the surface to ice cloud microphysics. J. Appl. Meteorol. Climatol. 2008, 47, 2545–2560. [Google Scholar] [CrossRef]
  44. Heymsfield, A.J.; Knollenberg, R.G. Properties of cirrus generating cells. J. Atmos. Sci. 1972, 29, 1358–1366. [Google Scholar] [CrossRef] [Green Version]
  45. Baran, A.J. A review of the light scattering properties of cirrus. J. Quant. Spectrosc. Radiat. Transf. 2009, 110, 1239–1260. [Google Scholar] [CrossRef]
  46. Heymsfield, A.J.; Platt, C.M.R. A parameterization of the particle size spectrum of ice clouds in terms of the ambient temperature and the ice water content. J. Atmos. Sci. 1984, 41, 846–855. [Google Scholar] [CrossRef] [Green Version]
  47. Baum, B.A.; Heymsfield, A.J.; Yang, P.; Bedka, S.T. Bulk scattering properties for the remote sensing of ice clouds. Part I: Microphysical data and models. J. Appl. Meteorol. Climatol. 2005, 44, 1885–1895. [Google Scholar] [CrossRef]
  48. Baum, B.A.; Yang, P.; Nasiri, S.; Heidinger, A.K.; Heymsfield, A.; Li, J. Bulk scattering properties for the remote sensing of ice clouds. Part III: High-resolution spectral models from 100 to 3250 cm-1. J. Appl. Meteorol. Climatol. 2007, 46, 423–434. [Google Scholar] [CrossRef]
  49. Field, P.R.; Heymsfield, A.J.; Bansemer, A. Snow size distribution parameterization for midlatitude and tropical ice clouds. J. Atmos. Sci. 2007, 64, 4346–4365. [Google Scholar] [CrossRef]
  50. Baran, A.J.; Cotton, R.; Furtado, K.; Havemann, S.; C.-Labonnote, L.; Marenco, F.; Smith, A.; Thelen, J.C. A self-consistent scattering model for cirrus. II: The high and low frequencies. Q. J. R. Meteorol. Soc. 2014, 140, 1039–1057. [Google Scholar] [CrossRef]
  51. Vidot, J.; Baran, A.J.; Brunel, P. A new ice cloud parameterization for infrared radiative transfer simulation of cloudy radiances: Evaluation and optimization with IIR observations and ice cloud profile retrieval products. J. Geophys. Res. Atmos. 2015, 120, 6937–6951. [Google Scholar] [CrossRef]
  52. Baran, A.J.; Connolly, P.J.; Heymsfield, A.J.; Bansemer, A. Using in situ estimates of ice water content, volume extinction coefficient, and the total solar optical depth obtained during the tropical ACTIVE campaign to test an ensemble model of cirrus ice crystals. Q. J. R. Meteorol. Soc. 2011, 137, 199–218. [Google Scholar] [CrossRef]
  53. Furtado, K.; Field, P.R.; Cotton, R.; Baran, A.J. The sensitivity of simulated high clouds to ice crystal fall speed, shape and size distribution. Q. J. R. Meteorol. Soc. 2015, 141, 1546–1559. [Google Scholar] [CrossRef]
  54. Baran, A.J.; C.-Labonnote, L. A self-consistent scattering model for cirrus. I: The solar region. Q. J. R. Meteorol. Soc. 2007, 133, 1899–1912. [Google Scholar] [CrossRef]
  55. Matricardi, M. An assessment of the accuracy of the RTTOV fast radiative transfer model using IASI data. Atmos. Chem. Phys. 2009, 9, 6899–6913. [Google Scholar] [CrossRef] [Green Version]
  56. Saunders, R.; Hocking, J.; Turner, E.; Rayer, P.; Rundle, D.; Brunel, P.; Vidot, J.; Roquet, P.; Matricardi, M.; Geer, A.; et al. An update on the RTTOV fast radiative transfer model (currently at version 12). Geosci. Model Dev. 2018, 11, 2717–2737. [Google Scholar] [CrossRef] [Green Version]
  57. Chou, M.D.; Lee, K.T.; Tsay, S.C.; Fu, Q. Parameterization for cloud longwave scattering for use in atmospheric models. J. Clim. 1999, 12, 159–169. [Google Scholar] [CrossRef]
  58. Vidot, J.; C.-Labonnote, L.; Baran, A.; Matricardi, M.; Brunel, P. Evaluation of the RTTOV scattering parameterization with LIDORT for hyperspectral IR cloudy brightness temperature and jacobians. Remote Sens. 2021. in preparation. [Google Scholar]
  59. Rodgers, C.D. Inverse Methods for Atmospheric Sounding: Theory and Practice, 2nd ed.; World Scientific Publishing Co. Pte. Ltd.: Singapore, 2000. [Google Scholar]
  60. Smith, W.L.; Frey, R. On cloud altitude determinations from high resolution interferometer sounder (HIS) observations. J. Appl. Meteorol. Climatol. 1990, 29, 658–662. [Google Scholar] [CrossRef] [Green Version]
  61. Cooper, S.J.; L’Ecuyer, T.S.; Gabriel, P.; Baran, A.J.; Stephens, G.L. Objective assessment of the information content of visible and infrared radiance measurements for cloud microphysical property retrievals over the global oceans. Part II: Ice clouds. J. Appl. Meteorol. Climatol. 2006, 45, 42–62. [Google Scholar] [CrossRef]
  62. Garnier, A.; Pelon, J.; Dubuisson, P.; Yang, P.; Faivre, M.; Chomette, O.; Pascal, N.; Lucker, P.; Murray, T. Retrieval of cloud properties using CALIPSO Imaging Infrared Radiometer. Part II: Effective diameter and ice water path. J. Appl. Meteorol. Climatol. 2013, 52, 2582–2599. [Google Scholar] [CrossRef]
  63. Dubovik, O.; King, M.D. A flexible inversion algorithm for retrieval of aerosol optical properties from Sun and sky radiance measurements. J. Geophys. Res. Atmos. 2000, 105, 20673–20696. [Google Scholar] [CrossRef] [Green Version]
  64. Eresmaa, R.; McNally, A.P. Diverse Profile Datasets from the ECMWF 137-Level Short-Range Forecasts; Document No. NWPSAF-EC-TR-017, Version 1.0; EUMETSAT Satellite Application Facility (NWP SAF): Darmstadt, Germany, 2014. [Google Scholar]
  65. Rodgers, C.D. Information Content and Optimisation of High Spectral Resolution Remote Measurements. Adv. Space Res. 1998, 21, 361–367. [Google Scholar] [CrossRef]
  66. Wyser, K. The effective radius in ice clouds. J. Clim. 1998, 11, 1793–1802. [Google Scholar] [CrossRef]
  67. Iacobellis, S.F.; McFarquhar, G.M.; Mitchell, D.L.; Somerville, R.C.J. The sensitivity of radiative fluxes to parameterized cloud microphysics. J. Clim. 2003, 16, 2979–2996. [Google Scholar] [CrossRef] [Green Version]
  68. Serio, C.; Masiello, G.; Mastro, P.; Tobin, D.C. Characterization of the Observational Covariance Matrix of Hyper-Spectral Infrared Satellite Sensors Directly from Measured Earth Views. Sensors 2020, 20, 1492. [Google Scholar] [CrossRef] [Green Version]
  69. Shannon, C.E. A mathematical theory of communication. Bell Syst. Tech. J. 1948, 27, 379–423. [Google Scholar] [CrossRef] [Green Version]
  70. L’Ecuyer, T.S.; Gabriel, P.; Leesman, K.; Cooper, S.J.; Stephens, G.L. Objective assessment of the information content of visible and infrared radiance measurements for cloud microphysical property retrievals over the global oceans. Part I: Liquid clouds. J. Appl. Meteorol. Climatol. 2006, 45, 20–41. [Google Scholar] [CrossRef] [Green Version]
  71. Winker, D.M.; Pelon, J.R.; McCormick, M.P. CALIPSO mission: Spaceborne lidar for observation of aerosols and clouds. In Lidar Remote Sensing for Industry and Environment Monitoring III; International Society for Optics and Photonics: Bellingham, Washington, 2003; Volume 4893, pp. 1–11. [Google Scholar] [CrossRef] [Green Version]
  72. Stephens, G.L.; Vane, D.G.; Boain, R.J.; Mace, G.G.; Sassen, K.; Wang, Z.; Illingworth, A.J.; O’connor, E.J.; Rossow, W.B.; Durden, S.L.; et al. The CloudSat mission and the A-Train: A new dimension of space-based observations of clouds and precipitation. Bull. Am. Meteorol. Soc. 2002, 83, 1771–1790. [Google Scholar] [CrossRef] [Green Version]
  73. Intrieri, J.M.; Stephens, G.L.; Eberhard, W.L.; Uttal, T. A method for determining cirrus cloud particle sizes using lidar and radar backscatter technique. J. Appl. Meteorol. Climatol. 1993, 32, 1074–1082. [Google Scholar] [CrossRef] [Green Version]
  74. Wang, Z.; Sassen, K. Cirrus cloud microphysical property retrieval using lidar and radar measurements. Part I: Algorithm description and comparison with in situ data. J. Appl. Meteorol. Climatol. 2002, 41, 218–229. [Google Scholar] [CrossRef]
  75. Tinel, C.; Testud, J.; Pelon, J.; Hogan, R.J.; Protat, A.; Delanoë, J.; Bouniol, D. The retrieval of ice-cloud properties from cloud radar and lidar synergy. J. Appl. Meteorol. Climatol. 2005, 44, 860–875. [Google Scholar] [CrossRef] [Green Version]
  76. Delanoë, J.; Hogan, R.J. Combined CloudSat-CALIPSO-MODIS retrievals of the properties of ice clouds. J. Geophys. Res. Atmos. 2010, 115. [Google Scholar] [CrossRef] [Green Version]
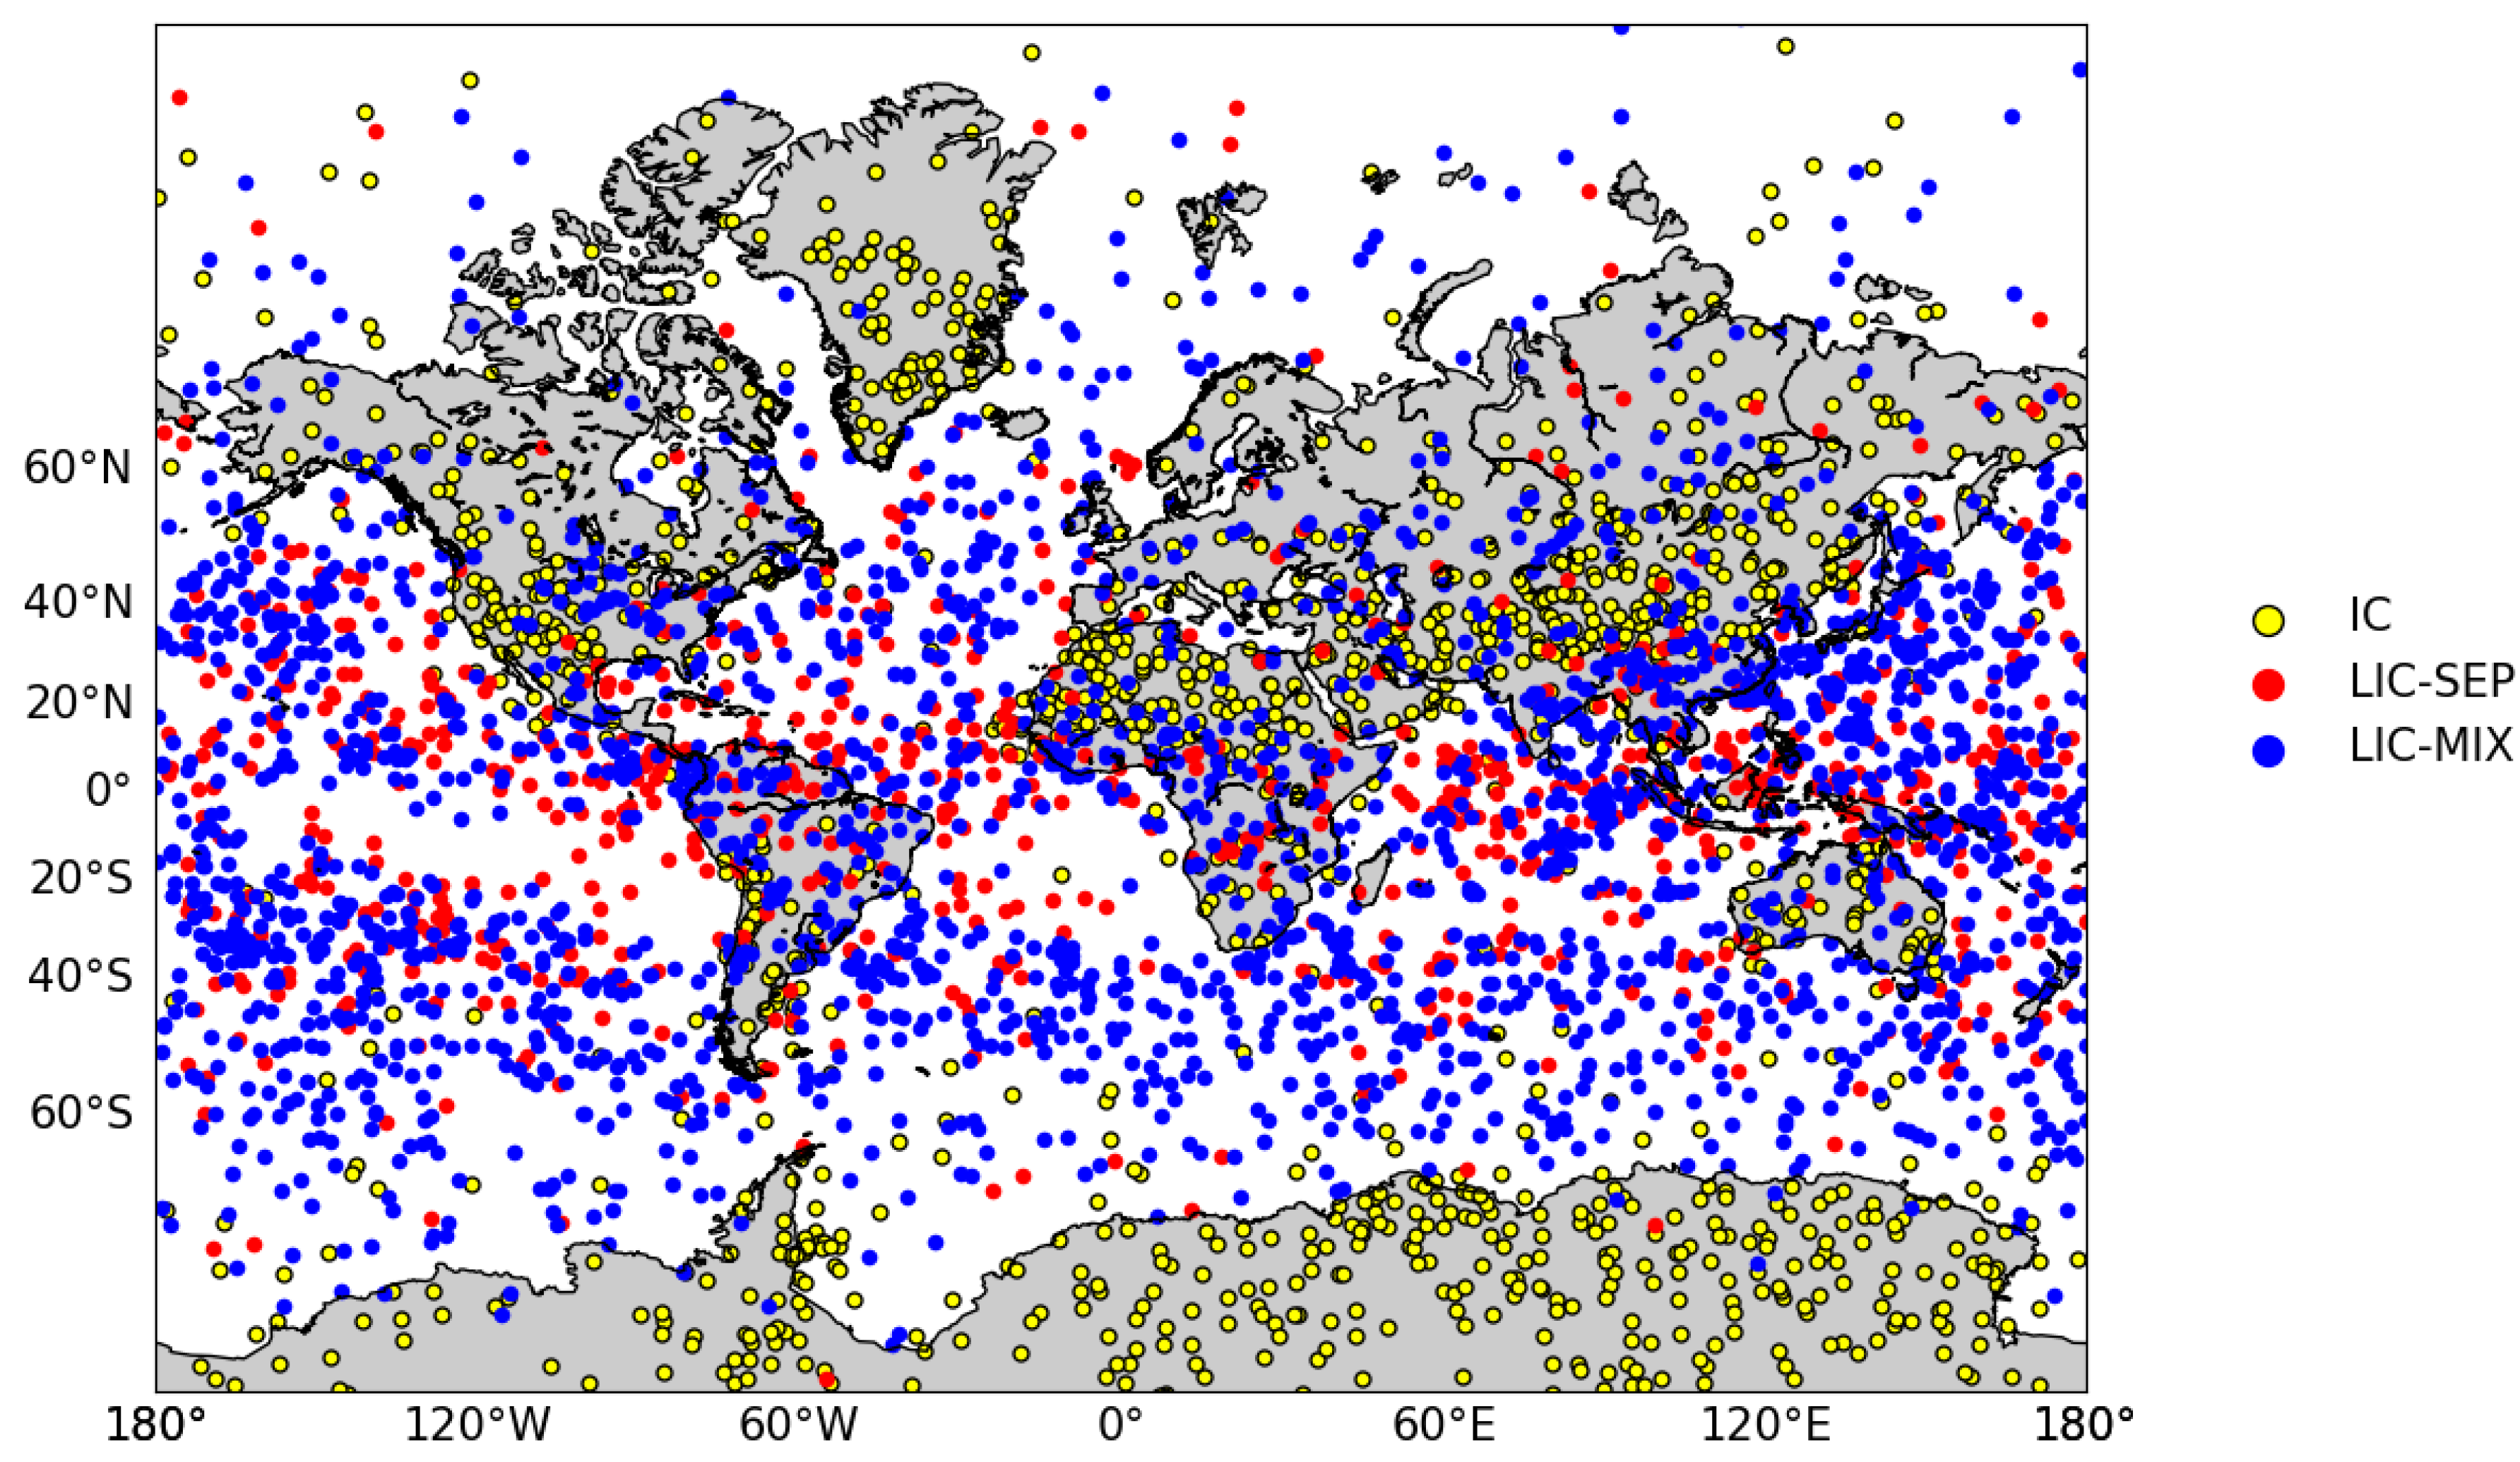
Figure 1. Geographical distribution of the 4575 profiles of the European Center for Medium-range Weather Forecasts (ECMWF) 137-levels database containing an ice cloud layer [64]. The profiles are separated into three categories: In yellow, 1424 ice-only cloud profiles (IC), in red, 821 liquid and ice cloud with separated layers profiles (LIC-SEP), and in blue, 2330 liquid and ice cloud with mixing or merging layers profiles (LIC-MIX).
Remotesensing 13 00116 g001
Figure 2. Distribution of ice water content ( I W C ) and liquid water content ( L W C ) in the ECMWF 137-levels database for the IC (left), LIC-SEP (center), and LIC-MIX (right) cloud configurations. Black lines stand for the mean value and yellow lines for the median value. Gray areas indicate the range delimited by minimum and maximum values. Red and blue areas indicate the range delimited by one standard deviation (std) around the mean for I W C and L W C , respectively.
Remotesensing 13 00116 g002
Figure 3. Brightness Temperature Difference (BTD) averaged over the 1424 ice-only cloud profiles (IC) (solid line) and standard deviation (colored area) simulated from different hypothesis in the forward model. The blue curve (left scale) corresponds to the BTD due to the use of different microphysical models, namely the Baran et al. (2014) [50] model and the General Habit Mixture (GHM) model of Baum et al. (2007) [48]. The red curve (right scale) corresponds to the BTD due to the use of the homogeneous profile instead of a vertically resolved ice water content profile. Noise equivalent temperature difference ( N e Δ T , black line, right scale) for a reference temperature of 280 K. All are given for the Infrared Atmospheric Sounding Interferometer (IASI) characteristics.
Remotesensing 13 00116 g003
Figure 4. Normalized a priori error departure (difference between the a priori and posterior error normalized by the a priori error) for I W P (left, a,d,g), C T H (center, b,e,h), and C B H (right, c,f,i) for the ice only layer, IC (upper, ac), separated liquid and ice layers, LIC-SEP (center, df), and mixing liquid and ice layers, LIC-MIX (lower, gi), cloud configurations. The dots stand for the error averaged over I W P bins for the IASI instrumental configuration (in blue) and for IASI-NG (next generation) (red). The x error bars correspond to the standard deviation of the error departure. A value close to 0 implies that the measurement cannot improve our prior knowledge of the parameter. A value close to 1 implies that the parameter can be characterized by the measurement.
Remotesensing 13 00116 g004
Figure 5. Selected channels for ice cloud properties retrievals for IASI (left, blue) and IASI-NG (right, red) for IC (upper), LIC-SEP (center), and LIC-MIX (lower) with the indicated number of channels. The gray curves represent typical IASI and IASI-NG spectra computed under clear-sky conditions.
Remotesensing 13 00116 g005
Figure 6. Mean C G T (solid line) and its standard deviation (vertical bars) obtained over 6 years of the level 2 products provided by the DARDAR (lidar radar) algorithm [3,76] for different classes of C T H (abscissa) and I W P (colored line) over land (a) and ocean (b) during daytime.
Remotesensing 13 00116 g006
Figure 7. Retrievals of I W P (left, a,d), C T H (center, b,e), and C B H (right, c,f) for IC cloud configuration from IASI synthetic radiances as a function of the true state over all the profile database. In the top pannel (ac), the clouds whose I W P is lower than 1 g / m 2 are depicted in green. The color code corresponds to the I W P of the clouds. In the bottom panel (df), the clouds whose I W P is lower than 1 g / m 2 have been removed. The color code is related to the temperature contrast between the cloud layer and surface. The error bars are plotted in beige. The dotted lines indicate the goal (orange) and threshold (green) given by the Word Meteorological Organization in order to reduce uncertainties in weather forecasts. The associated percentage corresponds to the proportion of cases that satisfy the OSCAR goal and threshold.
Remotesensing 13 00116 g007
Figure 8. Same as Figure 7 but for LIC-SEP cloud configuration.
Remotesensing 13 00116 g008
Figure 9. Same as Figure 7 but for LIC-MIX cloud configuration.
Remotesensing 13 00116 g009
Publisher’s Note: MDPI stays neutral with regard to jurisdictional claims in published maps and institutional affiliations.