Letter

A Global Analysis of Anthropogenic Development of Marine Turtle Nesting Beaches

by
Sarah J. Biddiscombe
1,
Elliott A. Smith
2,3 and
Lucy A. Hawkes
3,*
1
Department of Animal and Plant Sciences, University of Sheffield, Western Bank, Sheffield S10 2TN, UK
2
3/2 205 Cumbernauld Road, Glasgow G31 2TX, UK
3
Hatherly Laboratories, College of Life and Environmental Sciences, University of Exeter, Prince of Wales Road, Exeter EX4 4PS, UK
*
Author to whom correspondence should be addressed.
Remote Sens. 2020, 12(9), 1492; https://doi.org/10.3390/rs12091492
Submission received: 12 March 2020 / Revised: 29 April 2020 / Accepted: 5 May 2020 / Published: 8 May 2020
(This article belongs to the Special Issue Remote Sensing Applications for Sea Turtle Conservation)

Abstract

:
The Intergovernmental Panel on Climate Change predicts that sea levels will rise by up to 0.82 m in the next 100 years. In natural systems, coastlines would migrate landwards, but because most of the world’s human population occupies the coast, anthropogenic structures (such as sea walls or buildings) have been constructed to defend the shore and prevent loss of property. This can result in a net reduction in beach area, a phenomenon known as “coastal squeeze”, which will reduce beach availability for species such as marine turtles. As of yet, no global assessment of potential future coastal squeeze risk at marine turtle nesting beaches has been conducted. We used Google Earth satellite imagery to enumerate the proportion of beaches over the global nesting range of marine turtles that are backed by hard anthropogenic coastal development (HACD). Mediterranean and North American nesting beaches had the most HACD, while the Australian and African beaches had the least. Loggerhead and Kemp’s ridley turtle nesting beaches had the most HACD, and flatback and green turtles the least. Future management approaches should prioritise the conservation of beaches with low HACD to mitigate future coastal squeeze.

Graphical Abstract

1. Introduction

Coastal regions are dynamic and productive, and therefore have high biodiversity [1]. They also host human coastal populations at densities three times higher than the global average [2]. However, sea levels are predicted to increase by 0.23 to 0.82 m in the next 100 years with climate change (global mean sea level rise, medium confidence [3]) and therefore threaten coastal areas [4]. In natural systems, coastlines would migrate landwards with sea level rise, but highly developed areas (e.g., coastal towns or cities) at risk may invest in sea walls, groynes, and coastal armouring to protect property and to offset economic and social costs of land loss [5]. This can result in a net reduction in beach area, a phenomenon known as “coastal squeeze”. Coastal ecosystems are among the most modified and threatened globally [6]; for example, 14% of the coastline of the USA and as much as 50% of shorelines in coastal cities like Hong Kong and Sydney have been hardened with coastal armouring or shoreline protection, or urbanized with residential, business, and industrial structures [7]. Overall, 28% of global coastlines have been altered by human activities [8], and anthropogenic development is a major threat to coastal ecosystems and to the flora and fauna that depend on them [9,10]. Given expected human population increases (to 9.3 billion by 2050 [11]), coastal development is expected to grow further, increasing the likelihood of more fortification and thus further coastal squeeze. In addition, natural habitats provide billions of dollars’ worth of shoreline protection for human populations [12] and can be more cost effective against sea level rise, storms, and flooding than hard anthropogenic structures [4,13,14].

Coastal Squeeze and Marine Turtles

All seven species of marine turtles, which are of conservation concern, use tropical and temperate beaches of the world to lay their eggs. Over the last few thousand years, global sea levels have been dramatically different to those of the present [15], but natural coastal recession and accretion cycles have provided for suitable nesting beach habitat [15]. Studies that have measured beach slope and elevation at sea turtle nesting beaches have suggested that 30–50% of beaches could be lost under intermediate (0.5 to 0.9 m) sea level rise scenarios without coastline recession [10,16,17,18,19,20,21,22,23]. While these studies can accurately quantify coastal squeeze for individual beaches, they give no wider insight as to how coastal squeeze may vary between species and between regions that host marine turtle nesting beaches [16]. Global data on beach geomorphology, which could be used to model the extent of beach loss with sea level rise for individual sites, are not available at present [24], but marine turtles nest only on beaches with particular geomorphology—beaches both steep and wide enough to ensure eggs can remain dry above the high tide for incubation. Indeed, there is an adaptive trade-off between the energetic cost of searching for a nest site and the reproductive benefit of selecting a site that will produce large numbers of offspring [25]. It is therefore reasonable to assume that most marine turtle nesting beaches have a broadly similar geomorphology [25].
The present work provides the first synthetic overview of the extent of hard anthropogenic coastal development behind marine turtle nesting beaches worldwide. We highlight key differences between regions that host marine turtle nesting beaches and the differences between the seven species, which are all of conservation concern. The results are relevant for policy and practice of coastal management in the face of climate change.

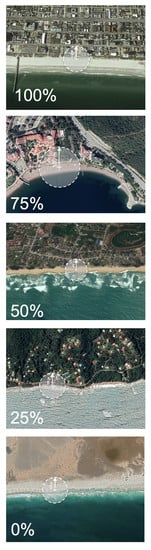
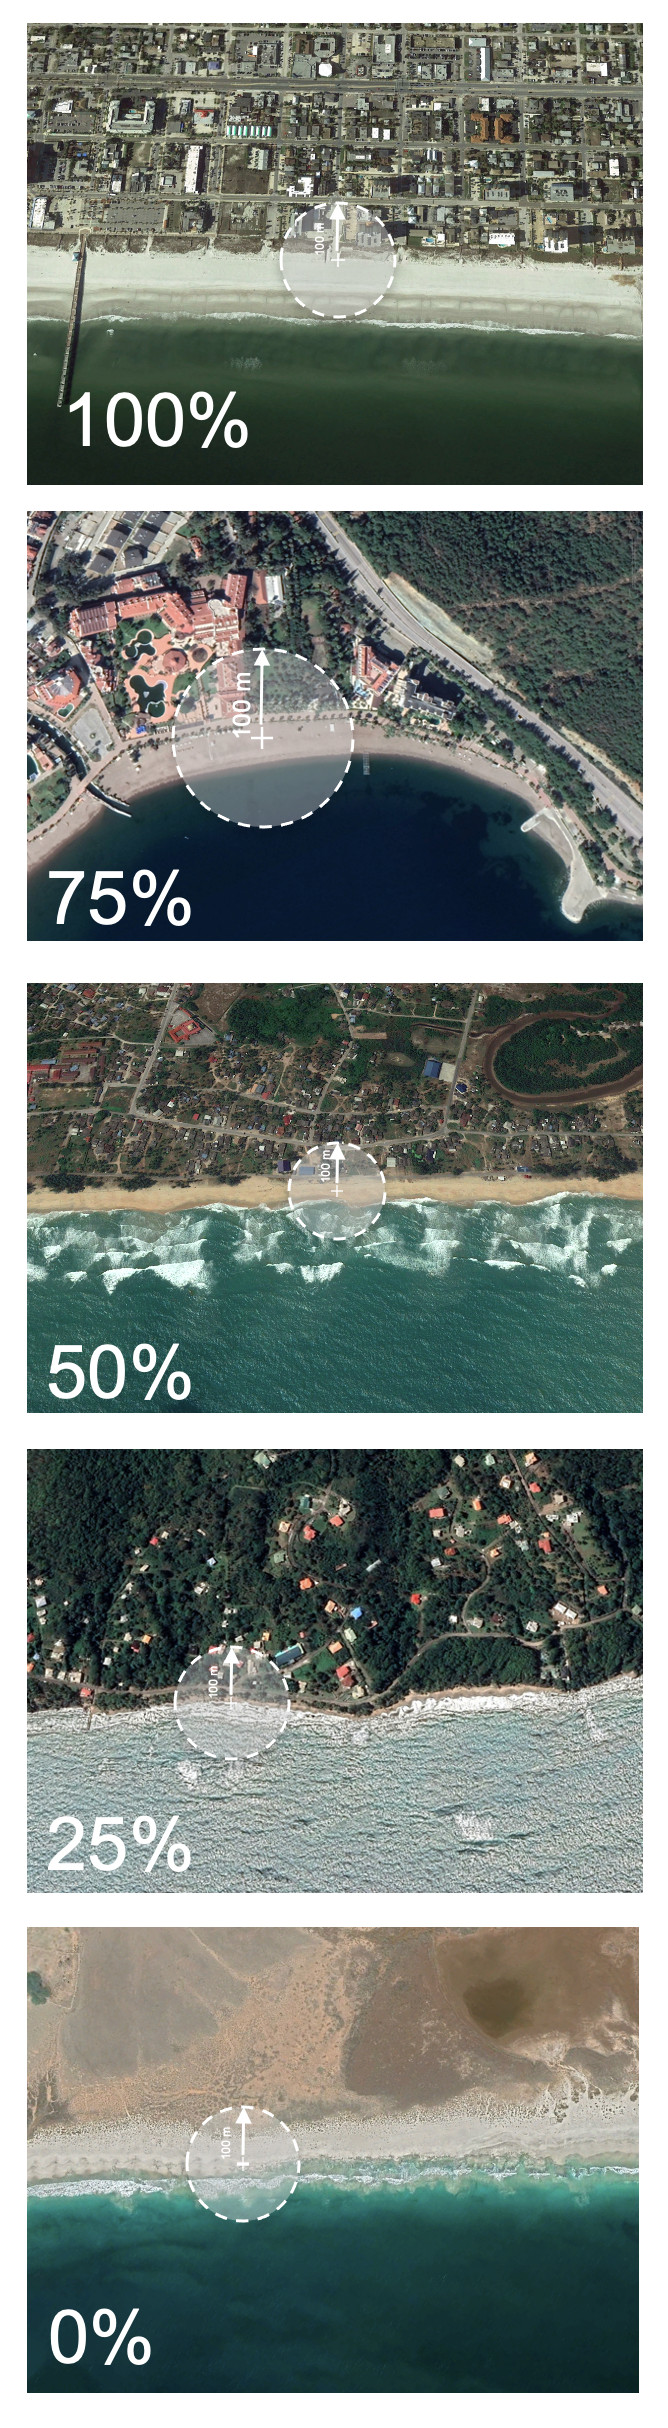
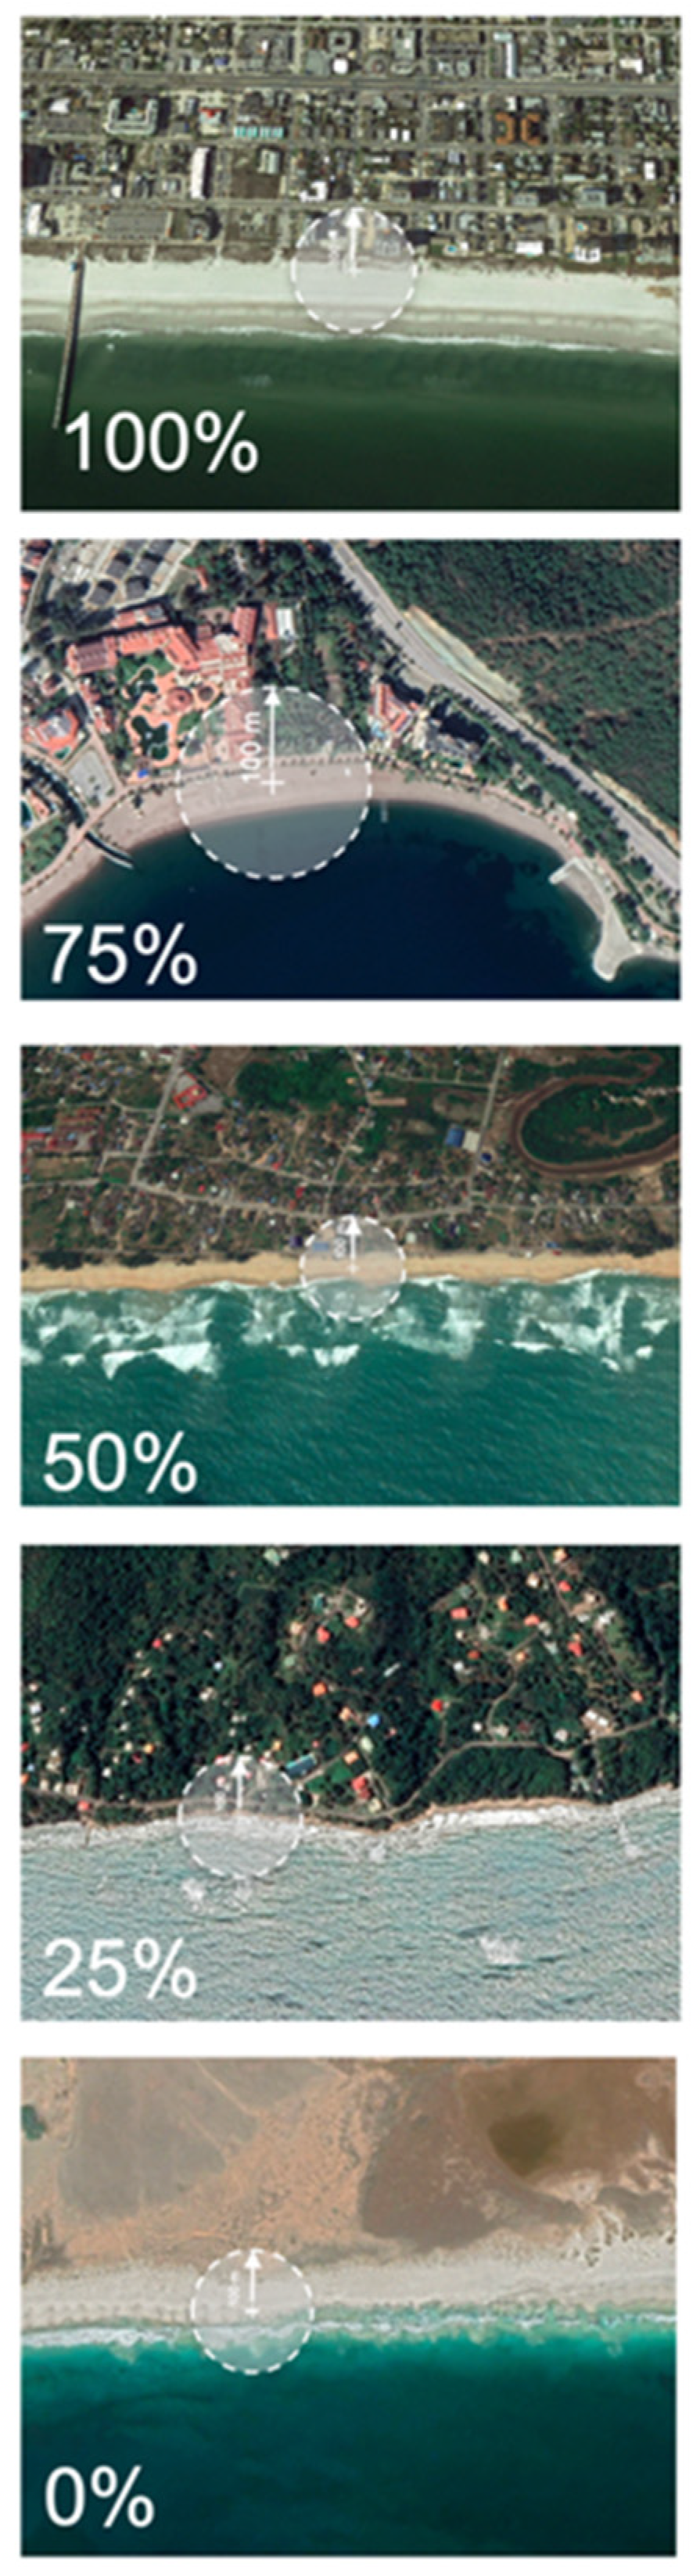
2. Materials and Methods

We used data from the State of the World’s Sea Turtles (SWOT; [26]), detailing all known nesting sites for all seven species of marine turtles, namely loggerhead (Caretta caretta), leatherback (Dermochelys coricacea), green (Chelonia mydas), hawksbill (Eretmochelys imbricata), flatback (Natator depressus), olive ridley (Lepidochelys olivacea), and Kemp’s ridley (Lepidochelys kempii), to determine the start and end of nesting ranges for marine turtles. SWOT data detail the abundance of nesting at each site as <25 nests per year, 25 to 100 nests per year, 100 to 500 nests per year, 500 to 1000 nests per year, and >1000 nests per year. Turtle nesting localities were categorised into 11 geographic regions: North America, Western Central America (including islands of the Caribbean), Central America, South America, the Mediterranean, Africa, Middle East, Indian Ocean, Southeast Asia, Australia, and Pacific Islands. To determine the spatial extent of nesting for each of these regions, the two furthest nesting populations acted as the start and end points of each transect.
Points were created at 10 km intervals along a high-resolution global coastline (polyline) shapefile that had been cropped to the extent of the global marine turtle nesting range using ArcMap (ESRI, Redlands, California) and imported as a .kml file into Google Earth. At each point, the finest resolution (smallest scale) imagery was viewed (range of latest imagery from 1998 to 2015), where it was possible to clearly distinguish between natural land cover (e.g., trees, fields, and sand dunes) and anthropogenic structures (e.g., buildings, car parks, and sea walls). We considered that hard anthropogenic coastal development (HACD) was any man-made hard structure that would prevent the landward retreat of beaches under future sea level rise scenarios. Natural barriers, such as embankments or vegetation, were not considered a barrier to beach recession as they would naturally recede over time, and roads were not counted as hard anthropogenic structures because they are usually flat and therefore do not strictly prevent marine turtles accessing the beach behind them. Importantly, there is no peer-reviewed evidence of marine turtles being able to cross roads that we are aware of; moreover, roads may have traffic barriers or guard rails that do prevent access, and management to maintain roads in situ may cause additional obstacles to marine turtles, particularly hatchlings. At each survey point (n = 16,009 points) the extent of coastal development was manually scored (see below), considering the area from the water to 100 m inland, as previous studies have shown that a 90 m set back of development prevented beach loss at the maximum Intergovernmental Panel on Climate Change (IPCC) sea level rise scenario [27]. Due to the complexity of inspecting and categorising development at each survey point, we did not use supervised automated classification of tasked satellite images, and instead we manually assessed and scored all 16,009 points. Scoring at each point was standardized by the main bulk of the categorising being conducted by one person (S.B.). However, when other members contributed, this was done under supervision of the main author to provide consistency. A random subset of 110 survey points (10 from each of the 11 regions surveyed) was further reviewed by another author for internal consistency. The work was carried out in 2015 using the most recent imagery, and we note that satellite images are continually updated and made available in Google Earth.
Coastal development was assigned to bins of 0% (no HACD behind the turtle nesting beach), 1% to 25% (approximately one quarter of the area behind the beach was covered by HACD), 26% to 50% (approximately half of the area behind the beach was covered by HACD), 51% to 75% (approximately three quarters of the area behind the beach was covered by HACD), and 76% to 100% (all the land behind the nesting beach was backed by HACD; Figure 1). Beaches with 50% or more of the land behind them covered in HACD were considered “highly developed” (and thus at high risk of coastal squeeze), and beaches with 25% were considered moderately developed.

Statistical Analysis

Proportions of development scores were calculated for each marine turtle species and for each of the 11 regions, and they were utilized for comparing the HACD using Kruskal-Wallis tests between species and regions. A Tukey contrast test was then used to compare pairwise differences in development between the different species, at a 95% confidence level.

3. Results

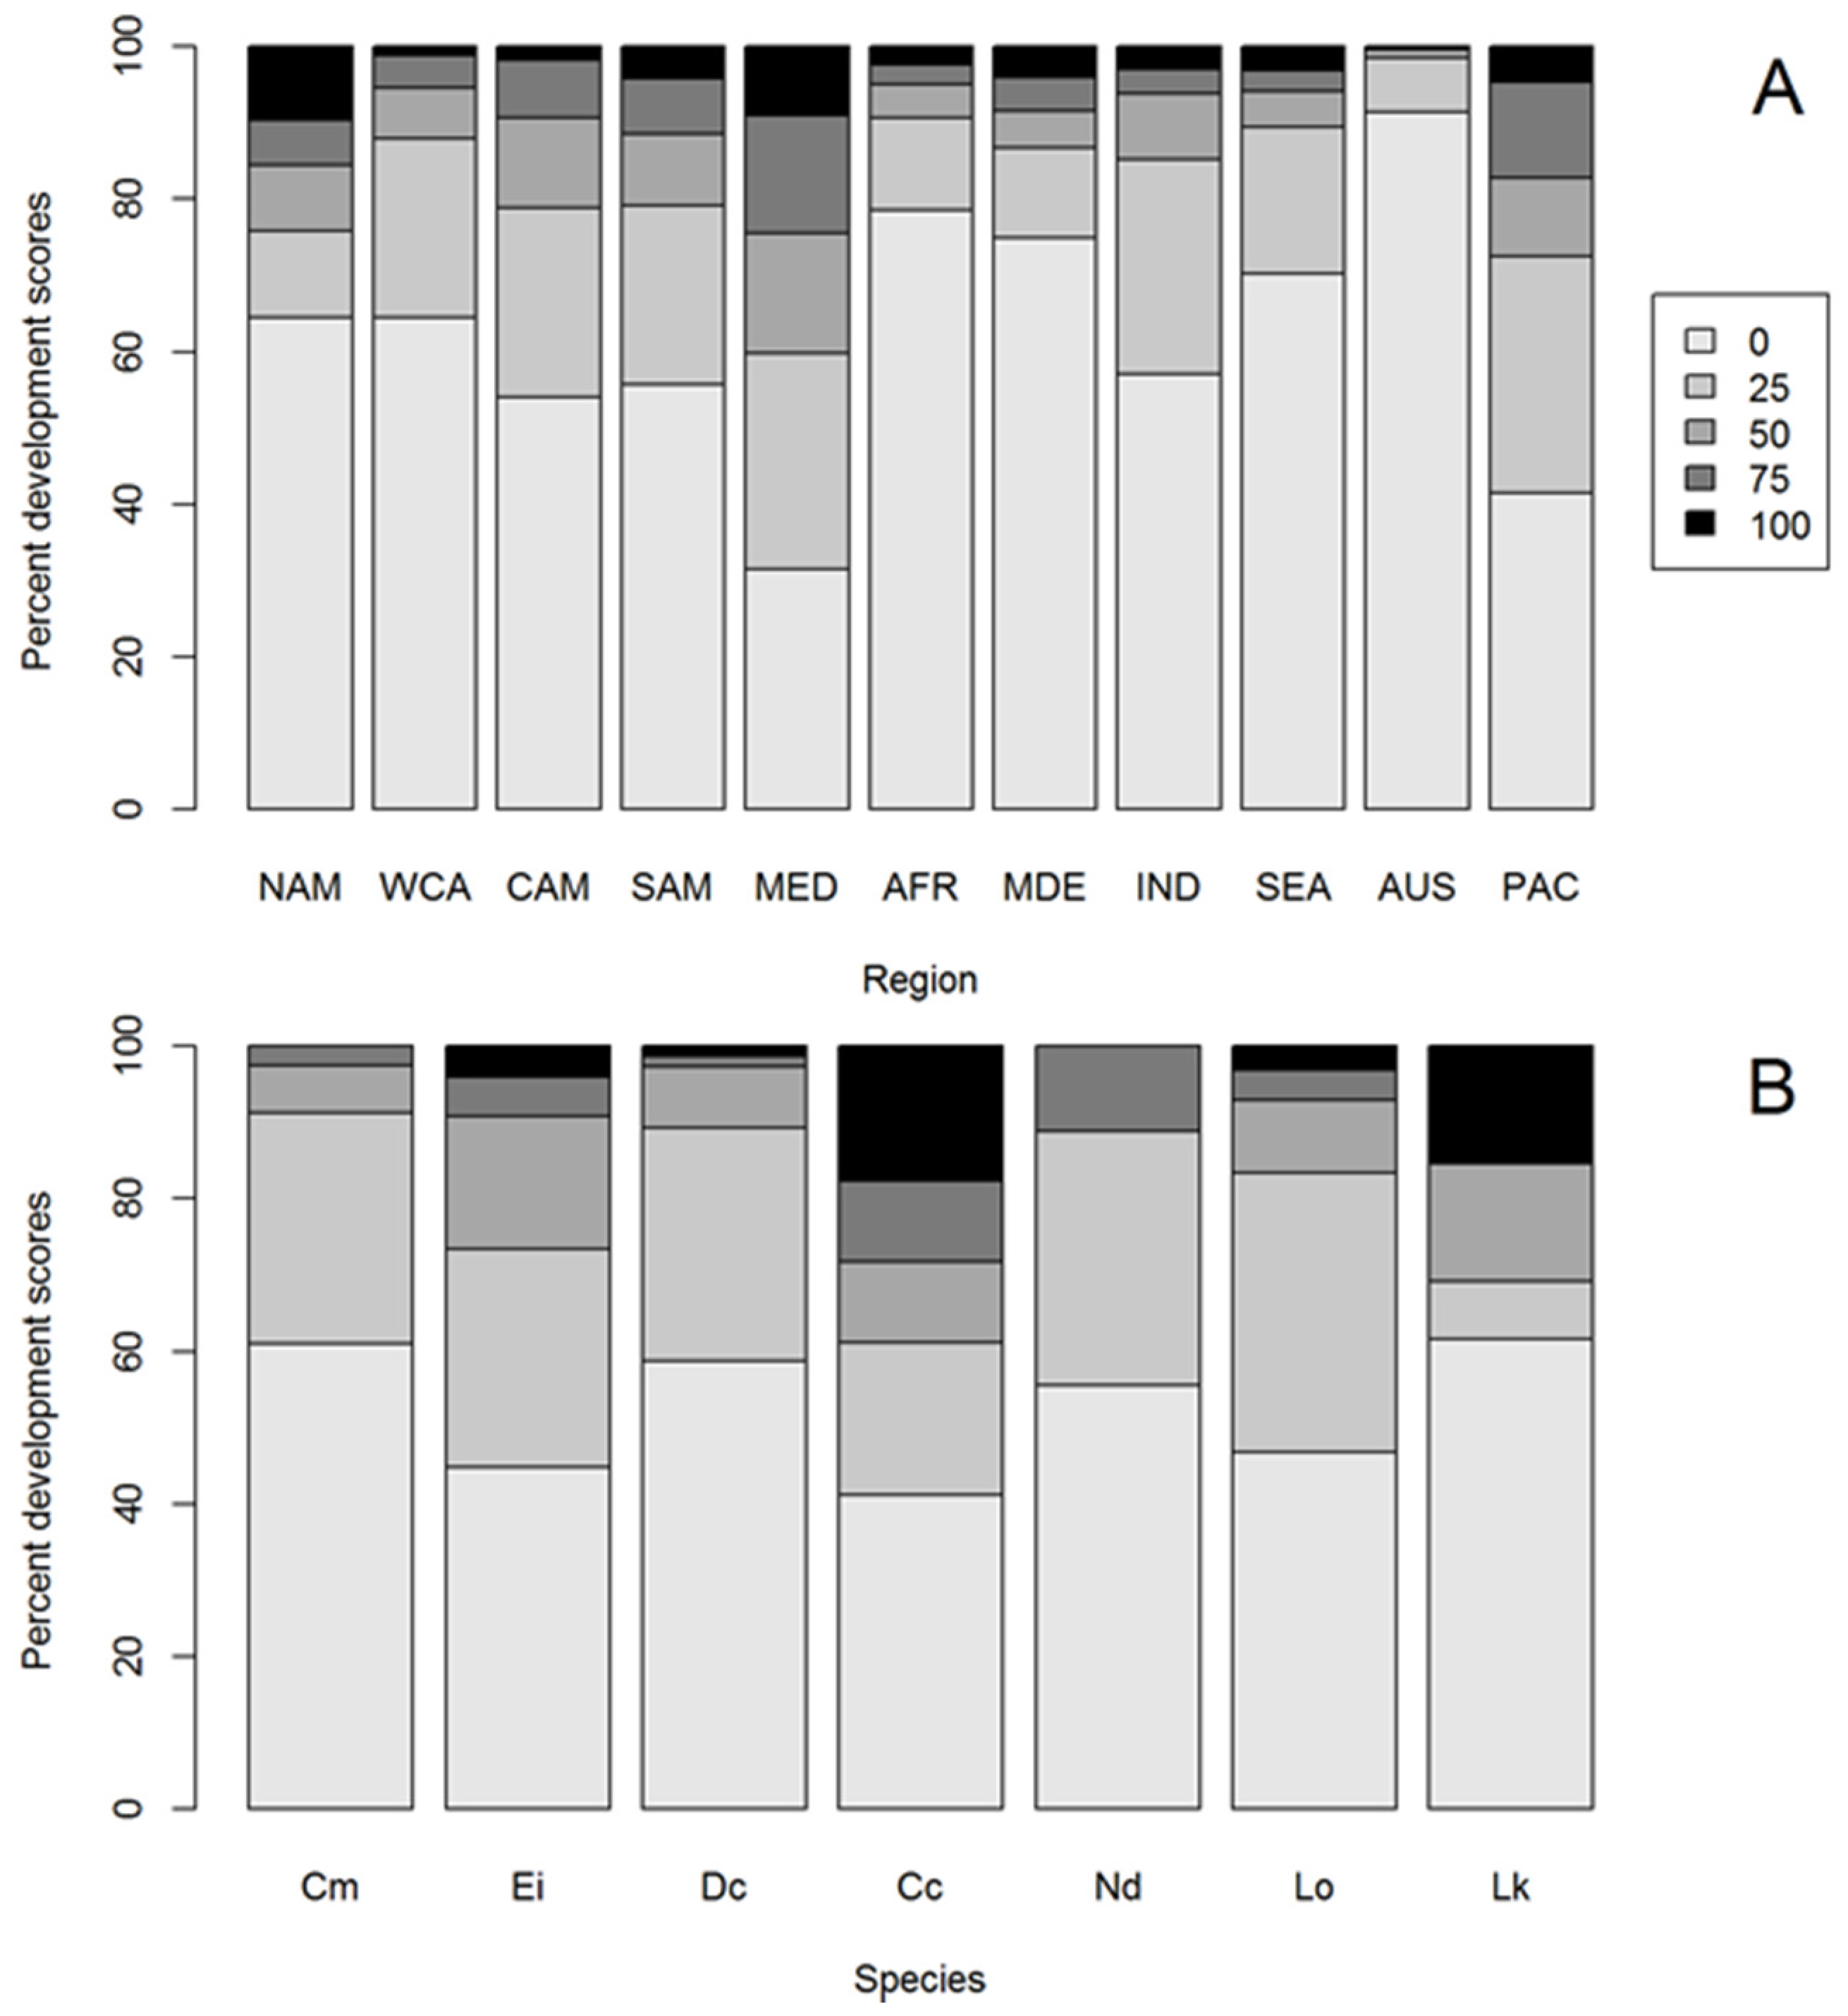
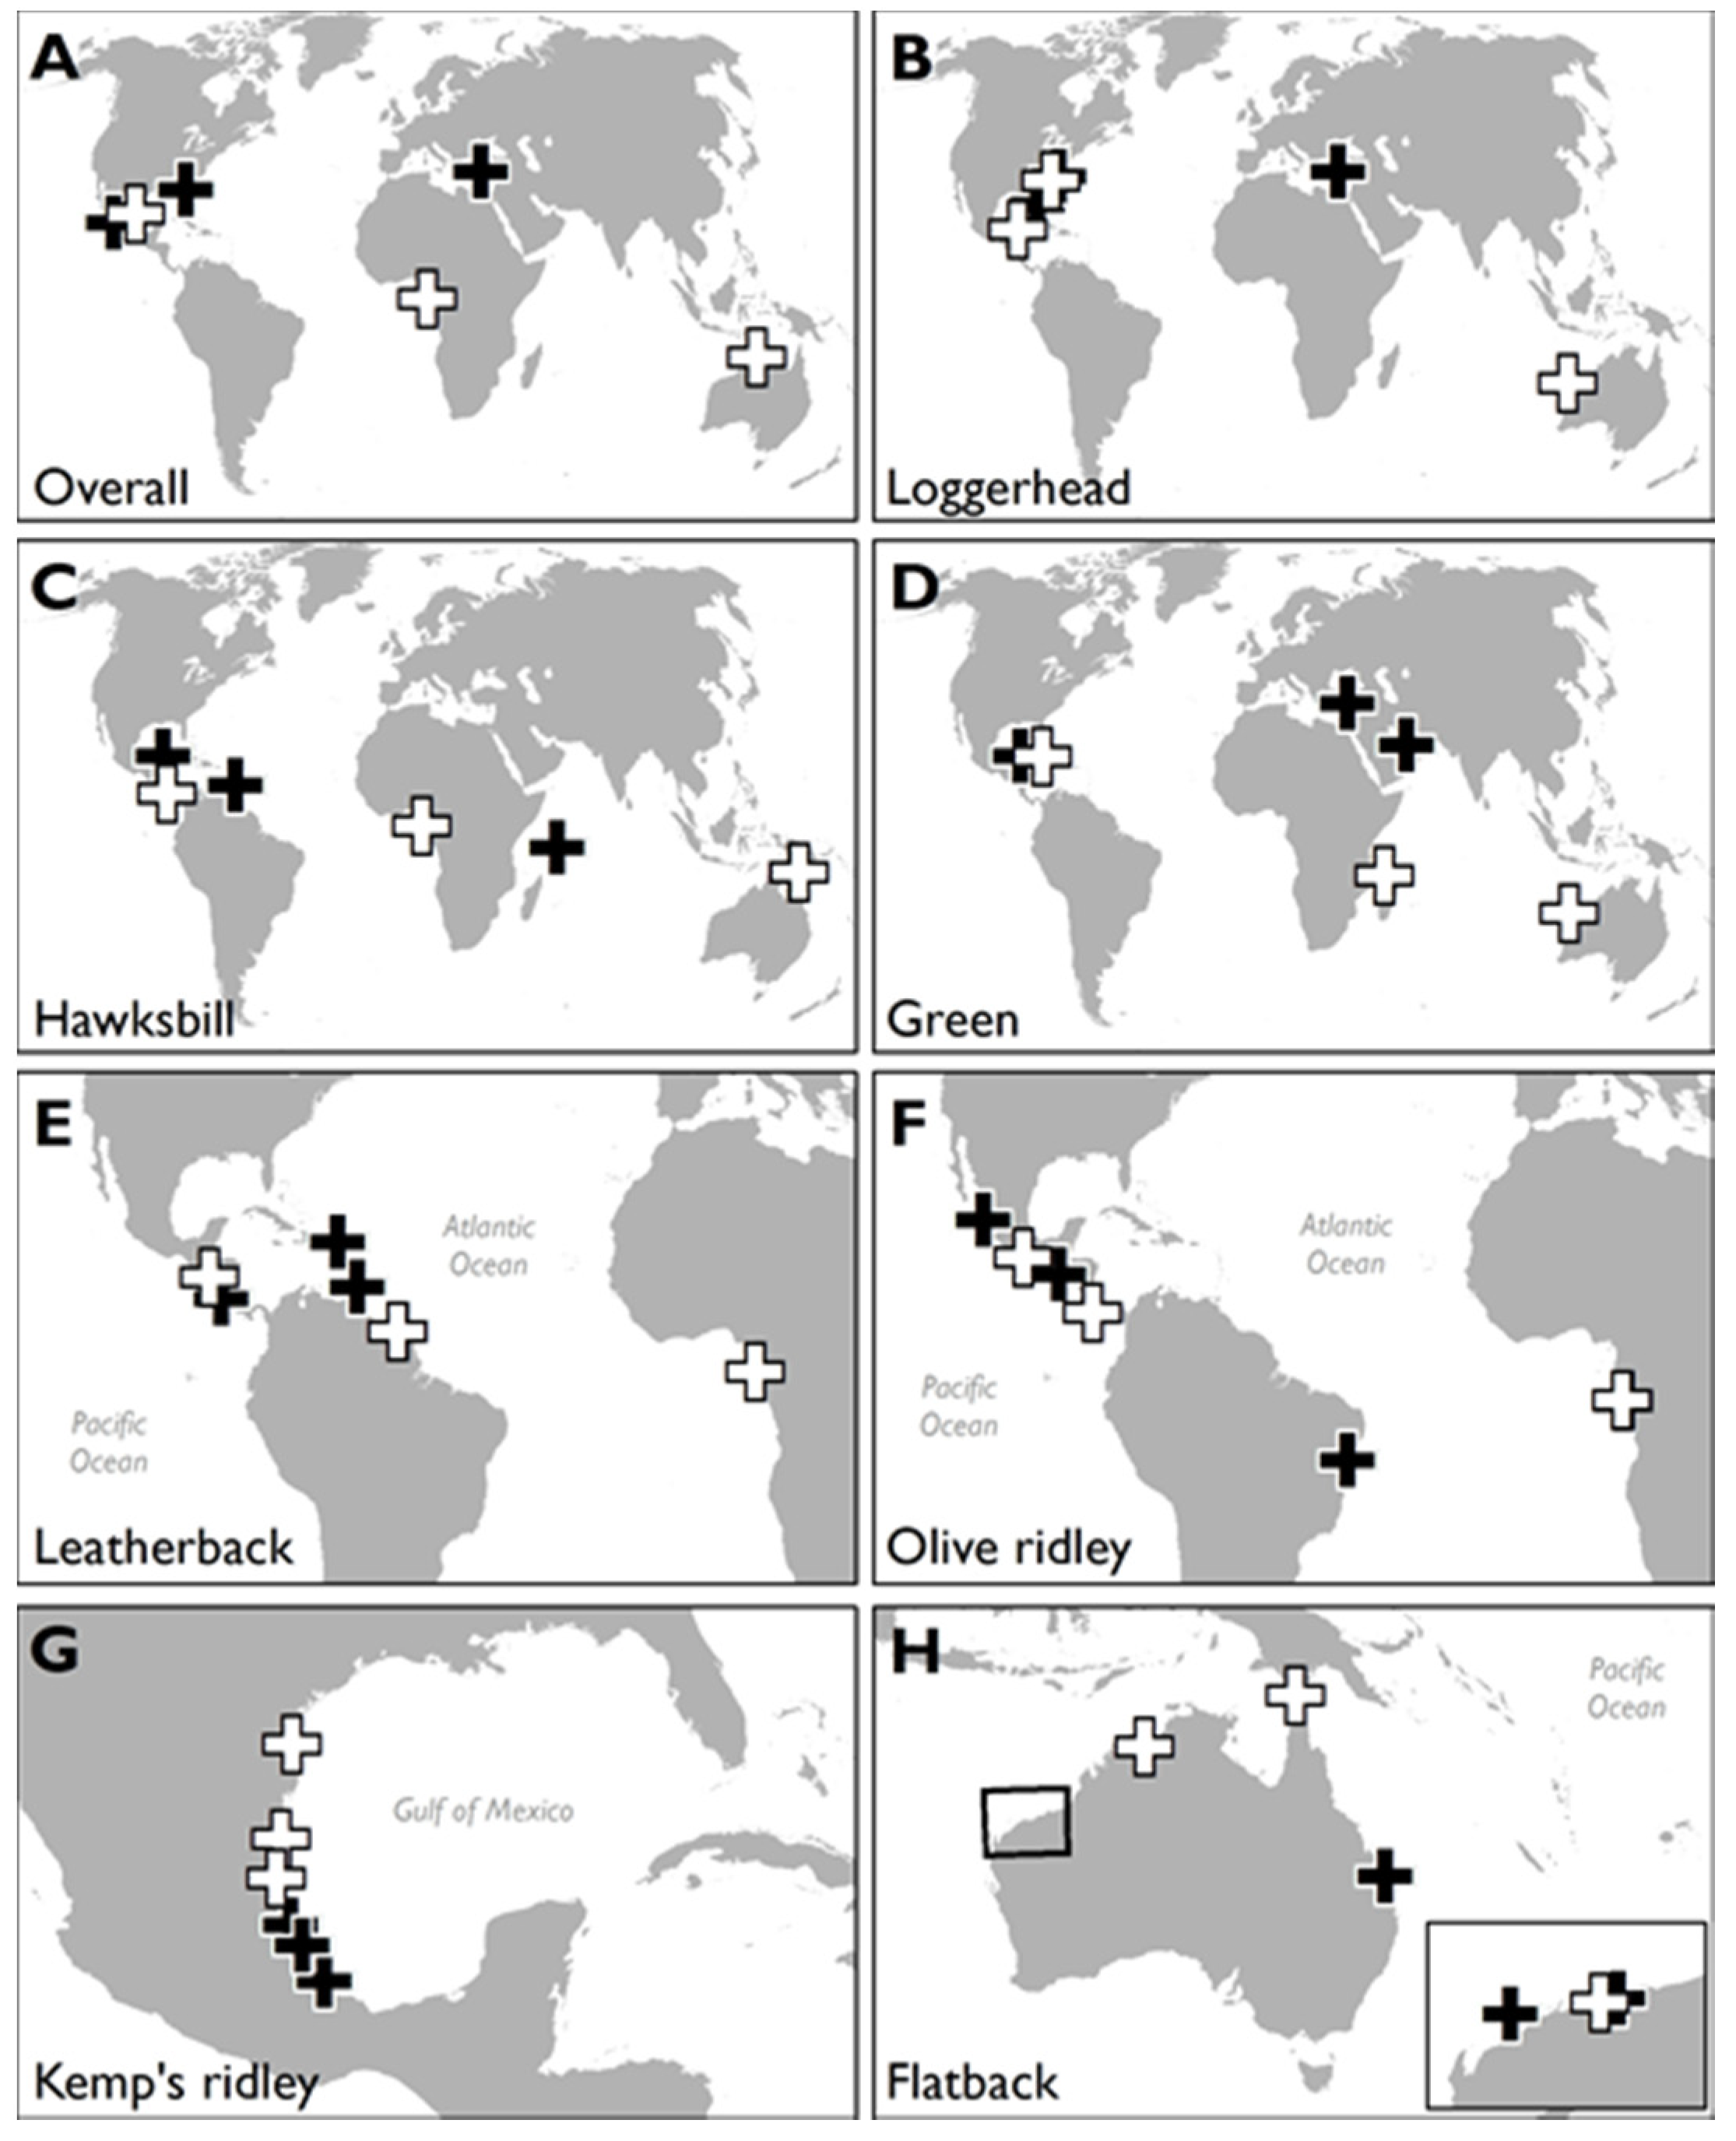
3.1. HACD by Regions

There was a significant difference in the distribution of HACD scores between global nesting regions (Kruskal-Wallis Χ1,10 = 1751.1, p < 0.01; Figure 2A, Figure S1, Table S1, Table S2), with the greatest in the Mediterranean (where 40% of survey points were highly developed) and the least in Australia (where 1.5% were highly developed). Australian sea turtle nesting beaches were significantly less developed than all other global regions, while Mediterranean beaches were more developed than all other regions (Table S2).

3.2. Most Developed Regions

In the Mediterranean, the greatest extent of HACD was in Southern Italy and Sicily, Central Northern Egypt, Turkey, and the coast of Lebanon (Figure 3). Other major highly developed regions included the Americas and Caribbean: In total, 24% of North American nesting beaches were highly developed, and in Florida 16% of beaches were backed by 100% development. Island nesting beaches in Central America and the Caribbean had significantly more HACD compared to mainland nesting beaches. In particular, Jamaica (where 57% of the land behind the beach was highly developed), the Cayman Islands (where the nesting beach was entirely backed by HACD), and much of the Lesser Antilles from the Dominican Republic to Grenada were highly developed. In South America, highly developed nesting beaches were found in Eastern Brazil and in Central Northern Venezuela. There were relatively few surveys points covering the Pacific Islands, but overall 28% of the beaches there were highly developed. Just over a quarter (28%) of the Pacific Island turtle nesting beaches were highly developed, in particular the Hawaiian island of Oahu (70%), Tahiti (90%), and Samoa (41% highly developed).

3.3. Least Developed Regions

By contrast, 91% of Australian nesting beaches had no coastal development behind them. African countries had the second lowest extent of HACD in the world, with 78% of the coastline free of coastal development. The most developed marine turtle nesting beaches in Africa were in Senegal (24%), Ghana, Togo, and Benin (41%), and the islands of Reunion (48%), Seychelles (50%), and Mauritius (58% highly developed). Three quarters of the Middle Eastern marine turtle nesting beaches had no coastal development behind them, but the western extent of the Middle East, namely Kuwait (41%), Saudi Arabia (27%), Qatar (18%), and Northern Oman (24%), hosted nesting beaches that were highly developed. In the Indian Ocean, HACD was low overall, but hot spots in Sri Lanka (22%) and at key coastal cities in India—Mumbai, Chennai, and Trivandrum—were highly developed. Only 10% of the Southeast Asian coastline was highly developed, but Japan and Thailand were notable exceptions (49% and 36% highly developed).

3.4. HACD by Species

There was a significant difference in the distribution of HACD scores between species with loggerhead and hawksbill turtles having significantly more HACD behind their nesting beaches than green turtles (loggerhead turtles z = 4.74, p < 0.01 and hawksbill turtles z = −3.14, p < 0.01; Figure 2B, Table S3), with loggerhead turtle nesting beaches having the greatest extent of HACD and flatback and green turtle nesting beaches the least (Figure 2B). Considering only the largest nesting rookeries (>1000 nests.yr−1), loggerhead turtle nesting beaches still had the greatest extent of HACD, and green, leatherback, and Kemp’s ridley turtle nesting beaches the least (Table S4).

3.5. Species with Most HACD

Overall, 38% of the global loggerhead turtle nesting range was backed by highly developed land. Most of this was located along the eastern seaboard of North America (where the second largest population of loggerheads nests [28]), the Eastern Mediterranean, and Southern Mexico. Nearly one fifth (18%) of the global loggerhead nesting range was completely backed by HACD (i.e., landward retreat of the nesting beach would be impossible), all of which was on the USA’s eastern seaboard. Compared to other species, Kemp’s ridley turtles have a restricted nesting range, only nesting in Mexico and the Southeastern USA [29]. Half of the Kemp’s ridley turtle nesting range in Central Mexico was highly developed, but there was no coastal development behind their nesting beaches in Northern Mexico and the Southern USA.

3.6. Species with Least HACD

In contrast, flatback turtles in Northern Australia had the least developed nesting range, followed by leatherback turtles nesting in Central Western Africa and green turtles nesting on the northeastern coast of Mexico. The median green turtle nesting beach had no HACD behind it, and only 9% of the green turtle’s nesting range was highly developed. The parts of the green turtle nesting range with the greatest extent of HACD were located in Southeastern Mexico, the Eastern Mediterranean basin, and the United Arab Emirates, and the least extent was found in Northwestern Australia, Central Eastern Africa, and Cuba. The hawksbill turtle’s nesting range also had, on average, no HACD behind it (for example in Northeastern Australia, Central Western Africa and Costa Rica), although a minority (27%) of the range was highly developed, mainly in Southeastern Barbados, the Seychelles, and Samoa. Most of the leatherback turtle’s nesting range also had no HACD behind it, but 11% of beaches were highly developed, mostly in Puerto Rico, Costa Rica, and Grenada. The leatherback turtle’s nesting range in Central Western Africa, Northern Brazil, and Northern Mexico had the least HACD. Finally, the majority of the olive ridley turtle’s nesting range had no HACD behind it, but 17% was highly developed, mainly in El Salvador, Pacific Northern Mexico, and Brazil. Beaches in their nesting range in Central Western Africa, Western Panama, and Southwestern Mexico had the least HACD.

4. Discussion

Overall, the results of the present study suggest that approximately one quarter of global coastlines that are used for nesting by marine turtles are backed by hotels, malls, car parks, sea walls, rock revetments, flood barriers, and other hard anthropogenic structures. Although the likelihood of nesting beach loss through coastal squeeze also depends on factors such as beach slope (see also [30]), these beaches certainly lack the capacity to retreat landwards. Key conservation action to mitigate nesting beach loss should be prioritised in the Mediterranean and Southeastern United States of America, and coastal squeeze should be considered most urgently for loggerhead turtles. Ultimately though, unless HACD is removed, marine turtles can only adapt by nesting elsewhere, and only if there are alternate nesting beaches that have not been lost to sea level rise. Paleontological records demonstrate that marine turtles have persisted through past climatic changes, when shorelines may have been radically different to those of the present day [15]. Some modern populations of marine turtles can also cope with strongly varying shorelines; for example in French Guyana, highly dynamic olive ridley and leatherback turtle nesting beaches may be completely eroded and accreted between years, but overall, cohorts of turtles still produce successful nests, indicating adaptive potential [31]. This is hopeful, but the rate and scale of shoreline change is likely to be unprecedented [32], and the coastal armouring of property is seen by property owners as desirable and appears likely to continue [33]. Increasing frequency and severity of coastal storms and wave surges may additionally lead to rates of coastal erosion at two orders of magnitude greater than the rate of sea level rise [30,34].
Marine turtle species will likely differ in their ability to cope with the loss of nesting beaches, due to nest site fidelity (the propensity of a species to return to the same site repeatedly to lay eggs) [35]. Although nest site fidelity may vary between species (e.g., loggerhead turtles may lay nests up to 109 km apart [36], while hawksbill turtles may nest within 100 m of previous nests [37]), it also likely varies within species and between populations bounded by differing geography. There is no clear consensus to date of what drives different levels of nest site fidelity in marine turtles, but such understanding will be critical to predicting their future response to nesting beach loss. In particular, the conservation status of different marine turtle populations will also have impact on their likely genetic resilience and population level plasticity (e.g., while some populations of Eastern Pacific green turtles and North Atlantic leatherback turtles are thought to be at low risk, other populations of olive ridley, hawksbill, loggerhead, and leatherback turtles are among the most endangered in the world [38]).
Future management approaches could prioritise the preservation of major nesting beaches that currently have little HACD (white crosses; Figure 3, see also [23]) using construction “set back” regulations to limit or prevent new construction within a certain distance from the shore [27]. This would ensure persistence of marine turtle nesting within extant ranges, as beaches would be able to retreat landwards. This type of proactive management may particularly benefit species with limited nesting range or high nest site fidelity, such as flatback or Kemp’s ridley turtles. It would also be instructive to quantify the proportion of such habitat that lies in existing or proposed protected areas [39]. Whether the conservation of marine turtles per se is more important than the socio-economic progress of developing nations is an important consideration, as developing countries typically had low levels of coastal HACD in the present study [40]. However, where the coast is already highly developed (black crosses; Figure 3), mitigation will need to be explored, although it is complex and usually expensive [41]. In extreme cases, the removal of hard structures may be the only means with which to ensure that turtles can successfully continue nesting. A major opportunity in the mitigation of coastal squeeze is that the integrity of coastal habitats is vital to their role in shoreline protection for human populations—intact coastal habitats can halve the number of vulnerable people and property exposed to coastal hazards [4,12]. For example, coral reef, mangrove, and seagrass ecosystems off the Florida coast provide approximately $4 billion worth of coastal protection for residential properties within one kilometre of the coast [12]. The question then becomes whether marine turtles, or other coastally dependent iconic species such as shorebirds [42,43], might serve as flagship species to foster public support to restore coastal ecosystems to their natural state, yielding synergistic benefits for wildlife and humans [14,44,45,46,47,48,49].

5. Conclusions

In the present study, coastal development was used as a qualitative proxy for coastal squeeze; however, the geomorphology of each nesting beach and spatial variation in predicted SLR will influence the vulnerability of specific beaches to coastal squeeze [10,22,50]. Future research should incorporate altimetric models into imagery analysis using elevation, slope, and other elements of beach geomorphology to more robustly and quantitatively assess the expected reduction of marine turtle nesting beaches with the expected global mean SLR over the next 100 years. Such analyses could also be coupled with supervised semiautomatic classification of satellite imagery to monitor the change in coastal anthropogenic development, such as HACD. Studies using satellite altimetry have shown that sea levels are not rising uniformly, and certain areas are at disproportionately greater risk from SLR, such as the islands of Southeast Asia [51]. The present study adds to this by suggesting that HACD is disproportionately more present at Mediterranean and North American turtle nesting beaches, threatening loggerhead and Kemp’s ridley turtles more than other regions and species.

Supplementary Materials

Author Contributions

Conceptualization, S.J.B. and L.A.H.; methodology, S.J.B. and L.A.H.; investigation, S.J.B. and E.A.S.; writing—original draft preparation, S.J.B.; writing—review and editing, S.J.B., E.A.S., and L.A.H.; supervision, L.A.H. All authors have read and agreed to the published version of the manuscript.

Funding

This research received no external funding.

Acknowledgments

This work was completed as part of S.J.B.’s Masters dissertation at the University of Exeter, UK. The authors thank the State of the World’s Turtles (SWOT) report, OBIS-SEAMAP, and Duke University for the global marine turtle nesting data. The manuscript benefitted from the review and statistical advice from M. J. Witt (University of Exeter). We also thank J. Goodfellow (University of Exeter). S.J.B. was supported by a travel grant from C. and A. Trevorrow. The manuscript benefitted from the constructive comments of three anonymous reviewers to whom we are very grateful.

Conflicts of Interest

The authors declare no conflict of interest.

References

  1. Tittensor, D.P.; Mora, C.; Jetz, W.; Lotze, H.K.; Ricard, D.; Berghe, E.V.; Worm, B. Global patterns and predictors of marine biodiversity across taxa. Nature 2010, 466, 1098–1101. [Google Scholar] [CrossRef]
  2. Small, C.; Nicholls, R. A global analysis of human settlement in coastal zones. J. Coast. Res. 2003, 3, 584–599. [Google Scholar]
  3. IPCC. Climate Change 2014 Synthesis report. In Summary for Policymakers. Contribution of Working Groups I, II and III to the Fifth Assessment Report of the Intergovernmental Panel on Climate Change; IPCC: Geneva, Switzerland, 2014. [Google Scholar]
  4. Currin, C.A. Living Shorelines for Coastal Resilience. In Coastal Wetlands: An Integrated and Ecosystem Approach, 2nd ed.; Perillo, G.M.E., Wolanski, E., Cahoon, D.R., Hopkinson, C.S., Eds.; Elsevier: Amsterdam, The Netherlands, 2019; pp. 1023–1053. [Google Scholar]
  5. Firth, L.B.; Thompson, R.C.; Bohn, K.; Abbiati, M.; Airoldi, L.; Bouma, T.; Bozzeda, F.; Ceccherelli, V.; Colangelo, M.; Evans, A.; et al. Between a rock and a hard place: Environmental and engineering considerations when designing coastal defence structures. Coast. Eng. 2014, 87, 122–135. [Google Scholar] [CrossRef] [Green Version]
  6. Adger, W.N.; Hughes, T.P.; Folke, C.; Carpenter, S.R.; Rockström, J. Social-Ecological Resilience to Coastal Disasters. Science 2005, 309, 1036–1039. [Google Scholar] [CrossRef] [PubMed] [Green Version]
  7. Gittman, R.K.; Fodrie, F.J.; Popowich, A.M.; Keller, D.; Bruno, J.F.; Currin, C.; Peterson, C.H.; Piehler, M.F. Engineering away our natural defenses: An analysis of shoreline hardening in the US. Front. Ecol. Environ. 2015, 13, 301–307. [Google Scholar] [CrossRef]
  8. Martínez, M.L.; Intralawan, A.; Vazquez, G.; Pérez-Maqueo, O.; Sutton, P.; Landgrave, R. The coasts of our world: Ecological, economic and social importance. Ecol. Econ. 2007, 63, 254–272. [Google Scholar] [CrossRef]
  9. Chu, M.L.; Muñoz-Carpena, R.; Kiker, G.; Emanuelsson, A.; Linkov, I. Exploring vulnerability of coastal habitats to sea level rise through global sensitivity and uncertainty analyses. Environ. Model. Softw. 2011, 26, 593–604. [Google Scholar]
  10. Von Holle, B.; Irish, J.L.; Spivy, A.; Weishampel, J.F.; Meylan, A.; Godfrey, M.H.; Dodd, M.; Schweitzer, S.H.; Keyes, T.; Sanders, F.; et al. Effects of future sea level rise on coastal habitat. J. Wildl. Manag. 2019, 83, 694–704. [Google Scholar] [CrossRef]
  11. Merino, G.; Barange, M.; Blanchard, J.L.; Harle, J.; Holmes, R.; Allen, I.; Allison, E.; Badjeck, M.-C.; Dulvy, N.K.; Holt, J.; et al. Can marine fisheries and aquaculture meet fish demand from a growing human population in a changing climate? Glob. Environ. Chang. 2012, 22, 795–806. [Google Scholar] [CrossRef]
  12. Arkema, K.K.; Guannel, G.; Verutes, G.; Wood, S.A.; Guerry, A.; Ruckelshaus, M.; Kareiva, P.; Lacayo, M.; Silver, J.M.; Lacayo-Emery, M. Coastal habitats shield people and property from sea-level rise and storms. Nat. Clim. Chang. 2013, 3, 913–918. [Google Scholar] [CrossRef]
  13. Narayan, S.; Beck, M.W.; Reguero, B.G.; Losada, I.J.; Van Wesenbeeck, B.; Pontee, N.; Sanchirico, J.N.; Ingram, J.C.; Lange, G.-M.; Burks-Copes, K.A. The Effectiveness, Costs and Coastal Protection Benefits of Natural and Nature-Based Defences. PLoS ONE 2016, 11, e0154735. [Google Scholar] [CrossRef] [PubMed] [Green Version]
  14. Temmerman, S.; Meire, P.; Bouma, T.J.; Herman, P.M.J.; Ysebaert, T.; De Vriend, H.J. Ecosystem-based coastal defence in the face of global change. Nature 2013, 504, 79–83. [Google Scholar] [CrossRef]
  15. Dutton, A.; Carlson, A.E.; Long, A.J.; Milne, G.A.; Clark, P.U.; DeConto, R.; Horton, B.P.; Rahmstorf, S.; Raymo, M.E. Sea-level rise due to polar ice-sheet mass loss during past warm periods. Science 2015, 349, aaa4019. [Google Scholar] [CrossRef] [PubMed] [Green Version]
  16. Mazaris, A.D.; Matsinos, G.; Pantis, J.D. Evaluating the impacts of coastal squeeze on sea turtle nesting. Ocean Coast. Manag. 2009, 52, 139–145. [Google Scholar] [CrossRef]
  17. Fish, M.R.; Côté, I.M.; Gill, J.A.; Jones, A.P.; Renshoff, S.; Watkinson, A.R. Predicting the Impact of Sea-Level Rise on Caribbean Sea Turtle Nesting Habitat. Conserv. Biol. 2005, 19, 482–491. [Google Scholar] [CrossRef]
  18. Katselidis, K.; Schofield, G.; Stamou, G.; Dimopoulos, P.; Pantis, J.D. Employing sea-level rise scenarios to strategically select sea turtle nesting habitat important for long-term management at a temperate breeding area. J. Exp. Mar. Biol. Ecol. 2014, 450, 47–54. [Google Scholar] [CrossRef]
  19. Fuentes, M.M.P.B.; Fish, M.R.; Maynard, J.A. Management strategies to mitigate the impacts of climate change on sea turtle’s terrestrial reproductive phase. Mitig. Adapt. Strat. Glob. Chang. 2011, 17, 51–63. [Google Scholar] [CrossRef]
  20. Fuentes, M.M.P.B.; Limpus, C.; Hamann, M. Vulnerability of sea turtle nesting grounds to climate change. Glob. Chang. Biol. 2010, 17, 140–153. [Google Scholar] [CrossRef]
  21. Fuentes, M.; Limpus, C.; Hamann, M.; Dawson, J.; Fuentes, M.M.P.B. Potential impacts of projected sea-level rise on sea turtle rookeries. Aquat. Conserv. Mar. Freshw. Ecosyst. 2010, 20, 132–139. [Google Scholar] [CrossRef]
  22. Varela, M.R.; Patrício, A.R.; Anderson, K.; Broderick, A.C.; Debell, L.; Hawkes, L.A.; Tilley, D.; Snape, R.T.E.; Westoby, M.; Godley, B.J. Assessing climate change associated sea-level rise impacts on sea turtle nesting beaches using drones, photogrammetry and a novel GPS system. Glob. Chang. Biol. 2018, 25, 753–762. [Google Scholar] [CrossRef]
  23. Butt, N.; Whiting, S.; Dethmers, K. Identifying future sea turtle conservation areas under climate change. Biol. Conserv. 2016, 204, 189–196. [Google Scholar] [CrossRef] [Green Version]
  24. Hinkel, J.; Nicholls, R.J.; Tol, R.S.; Wang, Z.-B.; Hamilton, J.M.; Boot, G.; Vafeidis, A.T.; McFadden, L.; Ganopolski, A.; Klein, R.J. A global analysis of erosion of sandy beaches and sea-level rise: An application of DIVA. Glob. Planet. Chang. 2013, 111, 150–158. [Google Scholar] [CrossRef]
  25. Yamamoto, K.H.; Powell, R.L.; Anderson, S.; Sutton, P. Using LiDAR to quantify topographic and bathymetric details for sea turtle nesting beaches in Florida. Remote. Sens. Environ. 2012, 125, 125–133. [Google Scholar] [CrossRef]
  26. The State of the World’s Sea Turtles Online Database: Data provided by the SWOT Team and hosted on OBIS-SEAMAP [Internet]. Oceanic Society, Conservation International, IUCN Marine Turtle Specialist Group (MTSG), and Marine Geospatial Ecology Lab, Duke University. 2015. Available online: http://seamap.env.duke.edu/swot (accessed on 1 January 2020).
  27. Fish, M.; Côte, I.; Horrocks, J.; Mulligan, B.; Watkinson, A.; Jones, A. Construction setback regulations and sea-level rise: Mitigating sea turtle nesting beach loss. Ocean Coast. Manag. 2008, 51, 330–341. [Google Scholar] [CrossRef]
  28. Ehrhart, L.M.; Bagley, D.A.; Redfoot, W.E. Loggerhead turtles in the Atlantic Ocean: Geographic distribution, abundance, and population status. In Loggerhead Sea Turtles; Bolten, A.B., Witherington, B.E., Eds.; Smithsonian: Washington, DC, USA, 2003; pp. 157–174. [Google Scholar]
  29. Plotkin, P.T. Biology and Conservation of Ridley Sea Turtles; John Hopkins University Press: Baltimore, MA, USA, 2007. [Google Scholar]
  30. Fitzgerald, D.M.; Fenster, M.S.; Argow, B.A.; Buynevich, I. Coastal Impacts Due to Sea-Level Rise. Annu. Rev. Earth Planet. Sci. 2008, 36, 601–647. [Google Scholar] [CrossRef] [Green Version]
  31. Plaziat, J.C.; Augustinius, P.G.E.F. Evolution of progradation/erosion along the French Guiana magrove coast: A comparison of mapped shorelines since the 18th century with Holocene data. Mar. Geol. 2004, 208, 127–143. [Google Scholar] [CrossRef] [Green Version]
  32. Chen, X.; Zhang, X.; ChurchiD, J.A.; Watson, C.S.; King, M.; Monselesan, D.; Legresy, B.; Harig, C. The increasing rate of global mean sea-level rise during 1993–2014. Nat. Clim. Chang. 2017, 7, 492–495. [Google Scholar] [CrossRef]
  33. Hill, M.K.; Monroe, M.C.; Ankersen, T.T.; Carthy, R.R.; Kay, T.A. Coastal Armoring and Sea Turtles: Beachfront Homeowners’ Opinions and Intent. Coast. Manag. 2019, 47, 594–610. [Google Scholar] [CrossRef]
  34. Zhang, K.; Douglas, B.C.; Leatherman, S.P. Global Warming and Coastal Erosion. Clim. Chang. 2004, 64, 41–58. [Google Scholar] [CrossRef]
  35. Kamel, S.J.; Mrosovsky, N. Repeatability of nesting preferences in the hawksbill sea turtle, Eretmochelys imbricata, and their fitness consequences. Anim. Behav. 2005, 70, 819–828. [Google Scholar] [CrossRef]
  36. Tucker, A. Nest site fidelity and clutch frequency of loggerhead turtles are better elucidated by satellite telemetry than by nocturnal tagging efforts: Implications for stock estimation. J. Exp. Mar. Biol. Ecol. 2010, 383, 48–55. [Google Scholar] [CrossRef]
  37. Walcott, J.; Eckert, K.; Horrocks, J.A. Tracking hawksbill sea turtles (Eretmochelys imbricata) during inter-nesting intervals around Barbados. Mar. Biol. 2012, 159, 927–938. [Google Scholar] [CrossRef]
  38. Wallace, B.P.; DiMatteo, A.D.; Bolten, A.; Chaloupka, M.Y.; Hutchinson, B.J.; Abreu-Grobois, F.A.; Mortimer, J.A.; Seminoff, J.A.; Amorocho, D.; Bjorndal, K.A.; et al. Global Conservation Priorities for Marine Turtles. PLoS ONE 2011, 6, e24510. [Google Scholar] [CrossRef]
  39. Boonzaier, L.; Pauly, D. Marine protection targets: An updated assessment of global progress. Oryx 2015, 50, 27–35. [Google Scholar] [CrossRef] [Green Version]
  40. Visbeck, M.; Kronfeld-Goharani, U.; Neumann, B.; Rickels, W.; Schmidt, J.O.; Van Doorn, E.; Matz-Lück, N.; Ott, K.; Quaas, M.F. Securing blue wealth: The need for a special sustainable development goal for the ocean and coasts. Mar. Policy 2014, 48, 184–191. [Google Scholar] [CrossRef] [Green Version]
  41. Pike, D.A. The benefits of nest relocation extend far beyond recruitment: A rejoinder to Mrosovsky. Environ. Manag. 2007, 41, 461–464. [Google Scholar] [CrossRef] [PubMed]
  42. Studds, C.E.; Kendall, B.E.; Murray, N.J.; Wilson, H.B.; Rogers, D.I.; Clemens, R.S.; Gosbell, K.; Hassell, C.J.; Jessop, R.; Melville, D.S.; et al. Rapid population decline in migratory shorebirds relying on Yellow Sea tidal mudflats as stopover sites. Nat. Commun. 2017, 8, 14895. [Google Scholar] [CrossRef]
  43. Piersma, T.; Lindström, Å. Migrating shorebirds as integrative sentinels of global environmental change. Ibis 2004, 146, 61–69. [Google Scholar] [CrossRef]
  44. Temmerman, S.; De Vries, M.B.; Bouma, T.J. Coastal marsh die-off and reduced attenuation of coastal floods: A model analysis. Glob. Planet. Chang. 2012, 92, 267–274. [Google Scholar] [CrossRef]
  45. Wamsley, T.V.; Cialone, M.A.; Smith, J.M.; Atkinson, J.H.; Rosati, J.D. The potential of wetlands in reducing storm surge. Ocean Eng. 2010, 37, 59–68. [Google Scholar] [CrossRef]
  46. Shepard, C.C.; Crain, C.M.; Beck, M.W. The Protective Role of Coastal Marshes: A Systematic Review and Meta-analysis. PLoS ONE 2011, 6, e27374. [Google Scholar] [CrossRef] [PubMed]
  47. Gedan, K.B.; Kirwan, M.L.; Wolanski, E.; Barbier, E.; Silliman, B. The present and future role of coastal wetland vegetation in protecting shorelines: Answering recent challenges to the paradigm. Clim. Chang. 2010, 106, 7–29. [Google Scholar] [CrossRef]
  48. Barbier, E.; Koch, E.W.; Silliman, B.; Hacker, S.D.; Wolanski, E.; Primavera, J.; Granek, E.F.; Polasky, S.; Aswani, S.; Cramer, L.A.; et al. Coastal Ecosystem-Based Management with Nonlinear Ecological Functions and Values. Science 2008, 319, 321–323. [Google Scholar] [CrossRef] [PubMed]
  49. Zhang, K.; Liu, H.; Li, Y.; Xu, H.; Shen, J.; Rhome, J.; Smith, T.J. The role of mangroves in attenuating storm surges. Estuar. Coast. Shelf Sci. 2012, 102, 11–23. [Google Scholar] [CrossRef]
  50. Schlacher, T.A.; Dugan, J.; Schoeman, D.; Lastra, M.; Jones, A.; Scapini, F.; McLachlan, A.; Defeo, O. Sandy beaches at the brink. Divers. Distrib. 2007, 13, 556–560. [Google Scholar] [CrossRef] [Green Version]
  51. Nicholls, R.J.; Cazenave, A. Sea-Level Rise and Its Impact on Coastal Zones. Science 2010, 328, 1517–1520. [Google Scholar] [CrossRef]
Figure 1. Google Earth imagery demonstrating the extent of hard anthropogenic coastal development (HACD), forming barriers to the landward retreat of beaches scored as 0%, 25%, 50%, 75%, and 100%, and higher resolution examples of HACD. White circles indicate schematic representation of scoring, where HACD within 100 m of the survey point was enumerated.
Remotesensing 12 01492 g001
Figure 2. Stacked bar plots displaying the proportion of hard anthropogenic coastal development (HACD) scores for (A) turtle nesting regions ordered by longitude (NAM—North America, WCA—Western Central America, CAM—Central America, SAM—South America, MED—Mediterranean, AFR—Africa, MDE—Middle East, IND—Indian Ocean, SEA—South East Asia, AUS—Australia, PAC—Pacific Islands) and (B) marine turtle species (Cm—green, Ei—hawksbill, Dc—leatherback, Cc—loggerhead, Nd—flatback, Lo—olive ridley, Lk—Kemp’s ridley) where 0 = no HACD behind the nesting beach and 100 = all land behind the nesting beach was backed by HACD.
Remotesensing 12 01492 g002
Figure 3. Maps showing the locations of marine turtle rookeries with the most (n = 3 numbered black crosses per map, where numbers indicate rank position) and least (n = 3 numbered white crosses per map) HACD: for (A) all turtles, (B) loggerhead turtles, (C) hawksbill turtles, (D) green turtles, (E) leatherback turtles, (F) olive ridley turtles, (G) Kemp’s ridley turtles, and (H) flatback turtles. Maps shown to different scales.
Remotesensing 12 01492 g003

